Embed Size (px)
Citation preview
Electronic copy available at: http://ssrn.com/abstract=1757740
Evaluating the Performance of Global Emerging
Markets Equity Exchange-Traded Funds
David Blitz and Joop Huij*
Abstract
We examine the performance of passively managed exchange-traded funds
(ETFs) that provide exposure to global emerging markets equities. We find that
the tracking errors of these funds are substantially higher than previously
reported levels for developed markets ETFs. ETFs that use statistical index
replication techniques turn out to be especially prone to high tracking errors, and
particularly so during periods of high cross-sectional dispersion in stock returns.
At the same time, we find no convincing evidence that these funds earn higher
returns than ETFs that rely on full-replication techniques.
* Blitz (corresponding author) is the Head of Quantitative Equity Research at Robeco, Coolsingel 120, 3011 AG, Rotterdam, The Netherlands, phone +31 (0)10-2242079, e-mail [email protected]. Huij is Senior Researcher at Robeco and Associate Professor of Finance at the Erasmus University Rotterdam School of Management, Burg. Oudlaan 50, 3000 DR, Rotterdam, The Netherlands, phone +31 (0)10-4081276, e-mail [email protected].
Electronic copy available at: http://ssrn.com/abstract=1757740
1
Evaluating the Performance of Global Emerging
Markets Equity Exchange-Traded Funds
Abstract
We examine the performance of passively managed exchange-traded funds
(ETFs) that provide exposure to global emerging markets equities. We find that
the tracking errors of these funds are substantially higher than previously
reported levels for developed markets ETFs. ETFs that use statistical index
replication techniques turn out to be especially prone to high tracking errors, and
particularly so during periods of high cross-sectional dispersion in stock returns.
At the same time, we find no convincing evidence that these funds earn higher
returns than ETFs that rely on full-replication techniques.
2
1. Introduction
A large number of studies have investigated the performance of actively
managed equity mutual funds. The main conclusions of these studies are that the
average active fund underperforms the market portfolio by the magnitude of its
expenses, and that only a relatively small number of active funds show persistent
outperformance (see, e.g., Hendricks, Patel and Zeckhauser, 1993; Elton, Gruber
and Blake, 1996; Carhart, 1997; and Bollen and Busse, 2005). These findings
have had significant implications for developments in the investment
management industry. Perhaps most importantly, it has contributed to the
increasing popularity of investing in passively managed funds, which aim to
replicate broad market indexes at minimal costs. Because passive funds typically
have lower costs than active funds, one might expect passive funds to
outperform active funds on average. This proposition seems to appeal to a large
group of investors.
Exchange-traded funds (henceforth, ETFs) are passive investment
vehicles which have become increasingly popular in a relatively short period of
time. An important difference with conventional index funds is that, similar to
individual stocks, ETFs can be bought and sold throughout the trading day. For
more detailed information on the origin and characteristics of ETFs we refer to
Haslem (2003). Over the past two decades the number of ETFs has grown from
zero to over 2,000 funds, with aggregate assets under management in excess of
$1,000 billion (Blackrock, 2010). Studies that have examined the performance of
ETFs that track U.S. equity indexes conclude that ETF performance is
3
predictable to a high degree of accuracy: ETFs generally manage to stay close to
their benchmark indexes with low levels of tracking error, and there seems to be
a one-to-one negative relation between fund returns and their expenses (see,
e.g., Elton, Gruber and Busse, 2004; Poterba and Shoven, 2002; Gastineau,
2004; and Agapova, 2011). The latter result is extended by Blitz, Huij and
Swinkels (2011), who show that passive equity funds which invest outside their
country of incorporation suffer from an additional drag on performance from
missed dividend income, as a result of withholding taxes imposed by foreign tax
authorities. For their sample of passive funds listed in Europe they find that the
explanatory power of dividend withholding taxes as a determinant of
underperformance is at least on par with fund expenses. Svetina and Wahal
(2008) also investigate the performance of ETFs that track international equity
indexes and find that the tracking error levels of these funds are more than
double those of ETFs that track domestic U.S. equity indexes.
The focus of the existing literature is on the performance of ETFs designed
to mimic indexes for the U.S. or other developed equity markets. To the best of
our knowledge, no study has specifically investigated the performance of ETFs
that aim to mimic global emerging markets (GEM) equity indexes.1 Global
emerging markets comprise countries such as South Korea, China, India, Brazil,
South Africa and Russia, which have become increasingly important to investors
due to their fast growing economies. This trend is also reflected in the
1 The literature on the performance of actively managed emerging market equity funds is also
scarce. Studies that investiagted this subject include Abel and Fletcher (2004), Gottesman and
Morey (2007), Huij and Post (2011), and Hayat and Kraeussl (2011).
4
composition of the MSCI All Countries index, in which the weight of emerging
markets has grown from roughly 1 percent in 1988 to around 14 percent today.
Klapper, Sulla and Vittas (2004) also document an explosive growth of emerging
market funds since the 1990s. Not surprisingly, GEM ETFs have become
increasingly popular as a result of these developments. A comprehensive
analysis of the performance of GEM ETFs is relevant because it is unclear if
results found in the academic literature for U.S. and European equity ETFs carry
over directly to GEM ETFs.
The first objective of this paper is to evaluate the overall performance of
GEM ETFs. A priori, there are good reasons to expect that it is more complicated
to closely track benchmark indexes in emerging than developed markets. An
example of a complicating factor with which GEM ETFs need to cope is that
many of the underlying markets are geographically located in time zones which
are different from the ones in which the ETFs trade. For example, many Asian
markets are closed during NYSE opening hours. Johnson (2009) examines the
tracking performance of U.S.-listed ETFs on individual foreign countries and finds
significantly higher tracking errors when the opening hours of the foreign markets
do not overlap with the stock exchanges on which the ETFs are traded. Another
complicating factor is foreign exchange-rate volatility. Shin and Soydemir (2010)
find that a higher exchange-rate volatility is generally accompanied by a higher
tracking error for U.S.-listed ETFs on individual foreign countries.
Moreover, even without the complications arising from time zone
differences and exchange-rate volatility, we argue that tracking errors of GEM

5
ETFs are likely to be higher than for their developed market counterparts. The
reason is that, as we will show in this paper, the cross-sectional dispersion in
stock returns is structurally larger in emerging markets than in developed
markets. As a consequence, similar-sized deviations between portfolio and index
weights typically result in larger return deviations for a GEM ETF than for a
developed markets ETF.
Another issue that arises with emerging markets is that stocks in these
markets are less liquid and have higher trading costs than stocks in developed
markets. For example, Domowitz, Glen and Madhavan (2001) estimate that
transaction costs for stocks in emerging markets are twice as high as transaction
costs for U.S. stocks, and argue that this is even more than one would expect
based on the smaller average market capitalization and higher average volatility
of stocks in emerging markets. Bekaert, Harvey and Lumsdaine (2002) and
Chiyachantana, Jain, Jiang and Wood (2004) also report significant price
pressure effects in emerging markets.
The second objective of this paper is to investigate the implications of the
higher trading costs and lower liquidity of emerging markets stocks on the
techniques that ETFs have at their disposal to track their benchmark indexes.
Generally speaking, passive funds apply two techniques to track their benchmark
indexes: full replication, where a fund holds all stocks in the index (or uses
derivatives such as swaps to mirror the index), and statistical replication, where a
fund intentionally holds only a subset of the index constituents. The latter
approach typically involves the use of a statistical optimizer to construct a
6
portfolio that is based on a trade-off between estimates of trading costs and ex
ante tracking-errors. For a comprehensive overview and technical details of
statistical replication tracking techniques we refer to Beasley, Meade and Chang
(2003), Beasley and Canakgoz (2009) and Coriellia and Marcellino (2006).
Because investors in emerging markets are confronted with lower liquidity,
tracking portfolios that are constructed using statistical replication techniques
may incur lower trading costs than portfolios that are constructed using full
replication techniques.2 At the same time, however, excluding stocks may cause
high levels of tracking error in emerging markets because of the larger cross-
sectional dispersion in stock returns. It is currently unclear how both tracking
techniques fare in emerging markets. This study intends to fill this gap in the
literature.
Our results indicate that GEM ETFs exhibit substantially higher levels of
tracking error than their developed markets counterparts. In fact, we find that half
of the GEM ETFs in our sample have such high levels of tracking error that it is
arguable if these funds should actually be classified as passive funds. We also
find that funds that use statistical replication techniques to track their benchmark
indexes are particularly prone to high tracking errors during periods of high cross-
sectional dispersion in stock returns. At the same time, we do not find convincing
evidence that these funds earn higher returns than ETFs that rely on full-
replication techniques to track their benchmark indexes. Similar to developed
2 Frino, Gallagher and Oetomo (2006) argue that liquidity is an even more important issue for
passively managed index funds than for actively managed funds, since these funds typically have
a high demand for trading immediacy.
7
markets ETFs, the average underperformance of GEM ETFs comes close to the
level one would expect based on expenses and dividend taxation.
2. Data
BlackRock (2010) provides a comprehensive overview of ETFs available to
investors in various markets. The two main markets for ETFs are the U.S. and
Europe, which together account for around 90 percent of global ETF market
capitalization. Our sample consists of all ETFs listed in these markets that track a
conventional broad emerging markets index and have a live track-record of at
least one year.3 An overview of the funds in our sample is given in Table 1. The
table shows that the aggregate assets under management of the funds in our
sample amount to $67 billion. Two funds, the iShare (U.S. listing) and the
Vanguard fund, account for the vast majority (over 85 percent) of these assets.
[INSERT TABLE 1 ABOUT HERE]
We use Thomson Financial Datastream to gather the time series of monthly U.S.
dollar total returns from inception through December 2010 for each ETF in our
sample. These returns are based on closing prices at which the funds were
actually traded. In addition, we collected return series based on net asset value
(NAV) histories from the websites of the asset managers that provide this
3 Based on the one year data requirement we exclude the MSCI Emerging Markets Source ETF
(launched in April 2010), the Schwab Emerging Markets Equity ETF (launched in January 2010)
and the GlobalShares FTSE Emerging Markets Fund (launched in December 2009 but closed
within a year in October 2010) from the long list of GEM ETFs in Blackrock (2010).
8
information, specifically iShares (both listings) and Vanguard.4 The oldest fund in
the sample is the iShare (U.S. listing), with data starting in April 2003, while the
youngest fund in the sample is DB x-trackers, with data starting in July 2007.
Table 1 also shows that roughly half of the funds in our sample use full-
replication techniques to track their indexes, while the other half uses statistical
replication techniques. For full replication we can make a further distinction
between funds that buy all the stocks in an index (for example, the Vanguard
ETF) and funds that use swaps to obtain full exposure in a synthetic manner (for
example, DB x-trackers and Lyxor ETF).
3. Results
This section presents our empirical results. We begin with examining GEM ETF
tracking-error levels, first over the full history of the funds, and next conditional on
whether cross-sectional return dispersion in emerging equity markets is high or
low. This is followed by an evaluation of GEM ETF performance.
3.1 GEM ETF tracking-error levels
In our first empirical analysis we investigate how close the GEM ETFs in our
sample manage to stay to their benchmark indexes. We measure this ability by
means of the tracking errors of the funds against their benchmark indexes, i.e.,
the time-series standard deviation of the return differences between the funds
4 NAV-based total return series are not available through Thomson Financial Datastream, and,
unfortunately, not all asset managers provide this information on their websites.
9
and their benchmark indexes.5 Because bid-ask effects, stale prices and time
zone differences can give rise to temporary return deviations in the short run,
tracking errors based on short-term data may overestimate the tracking error
experienced by investors over longer holding periods. In addition to tracking
errors based on monthly data we therefore also calculate tracking errors based
on (overlapping) quarterly and annual returns. As short-term noise factors do not
affect the NAV of a fund, we additionally show tracking error levels computed
using NAV returns for the funds that report this information. The results of this
analysis are shown in Table 2.
[INSERT TABLE 2 ABOUT HERE]
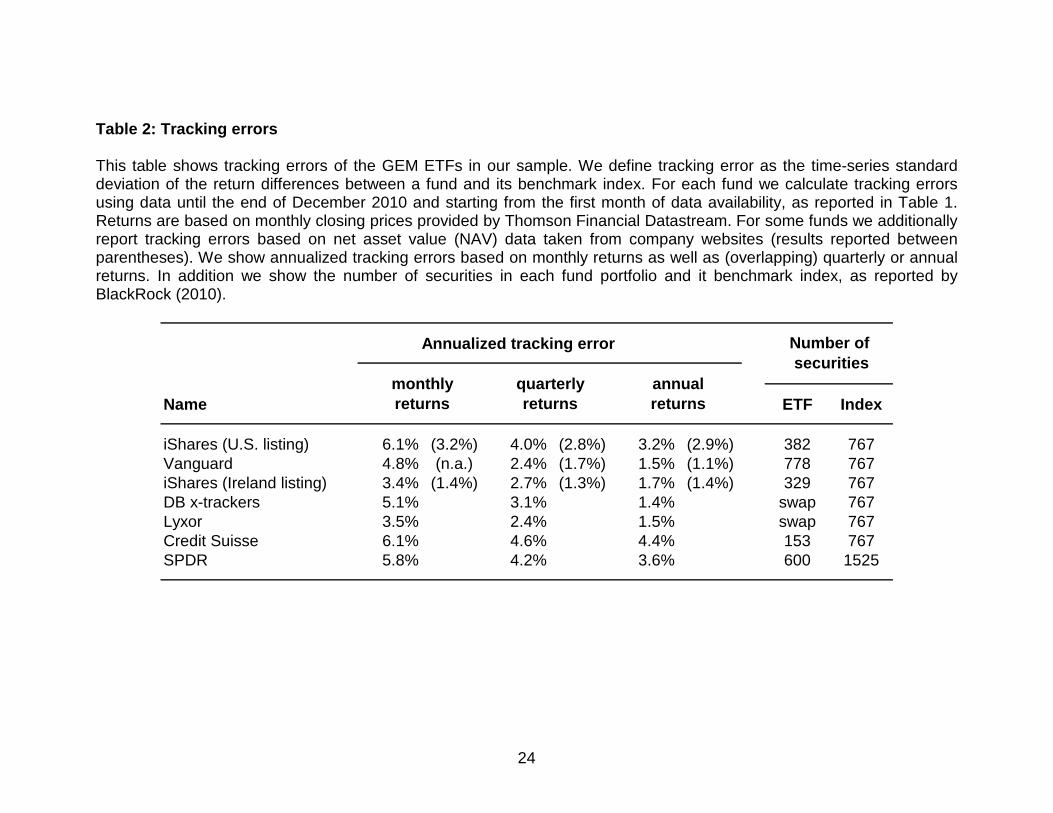
Table 2 shows that, in the short run, the ETFs in our sample exhibit high levels of
tracking error, in the range of 3 to 6 percent on an annual basis. As expected,
tracking errors are lower when estimated using quarterly and annual data, or
when based on NAV data. We also observe that, for longer estimation horizons,
tracking errors based on closing prices converge to the level of tracking errors
estimated using the funds’ NAVs, with only small differences remaining at an
annual horizon. This finding indicates that a large portion of the high short-run
tracking error levels can be attributed to temporary price fluctuations of the ETFs
around their NAVs. Nonetheless, the tracking error levels we document for GEM
ETFs remain substantially higher than the levels reported for passive funds
investing in developed equity markets. For example, Blitz, Huij and Swinkels
5 In these and the following analyses we use benchmark returns which assume full reinvestment
of dividends, unless explicitly stated otherwise.
10
(2011) report annual tracking errors of 0.5 to 0.8 percent for passive funds
tracking broad equity indexes for developed markets.
When we consider the funds’ tracking error levels and the replication
techniques they use, it appears that funds relying on statistical replication exhibit
higher levels of tracking error than those that rely on full replication. For example,
the iShares (U.S. listing), Credit Suisse and SPDR funds exhibit long-term
tracking errors of more than three percent on an annual basis. A vivid example of
the possible implications of such high tracking-error levels can be found in the
track record of the iShares ETF (U.S. listing), which fell short of its benchmark
index by more than 10 percent over the year 2009.6 Although funds that exhibit
such high tracking-error levels may claim and intend to provide passive
exposure, it is arguable if they truly qualify as such.
With long-term tracking errors ranging from 1 to 1.5 percent, the
Vanguard, DB x-trackers and Lyxor funds that rely on full replication techniques
appear to do a better job at tracking their benchmark indexes than the other
ETFs in our sample. Nevertheless, their tracking-error levels remain substantially
higher than the figures reported for developed equity markets ETFs. This
indicates that staying close to the benchmark index is more challenging for GEM
ETFs than for passive funds that invest in developed equity markets.
The remaining fund, the iShares ETF (Ireland listing), is an interesting
case, as it is the only statistical-replication fund which manages to achieve a
tracking error level close to that of full-replication funds. This is particularly
6 This figure is 7 percent based on NAV data.
11
striking in light of the fact that the iShares ETF (U.S. listing), which is managed
by the same firm and applies the same investment philosophy, exhibits a
considerably higher tracking-error level. We contacted Blackrock, which manages
the iShares funds, and their explanation for this observation is that although the
investment philosophy of the two funds is indeed similar, the funds are managed
by independent portfolio management teams, which can make different choices
with regard to trading in local shares versus ADRs/GDRs, target levels of
transaction cost and spreads and, as is already evident from the data in Table 2,
the total number of stocks in portfolio. This example illustrates that although our
results indicate that the statistical replication technique is typically accompanied
by higher levels of tracking error than the full replication technique, they should
certainly not be construed to imply that every fund which uses statistical
replication will be unsuccessful at staying close to its benchmark index, nor that
every fund which uses full replication is guaranteed to be successful at staying
close to its benchmark index.
3.2 Cross-sectional dispersion in stock returns and tracking error levels
We now turn to investigating the relation between GEM ETF tracking error levels
and cross-sectional dispersion in stock returns in emerging markets. In particular,
we investigate if the tracking-error levels of GEM ETFs are higher when cross-
sectional return dispersion increases, and if this effect is stronger for funds that
rely on statistical replication techniques to track their benchmark indexes. To
12
motivate this analysis, note that the return difference between a fund and its
benchmark index in period t can be expressed as
(1) ))(( ,,,,, tbi
titititdiff rrbpr −−=∑
where pi,t is the portfolio weight in stock i at the beginning of period t, bi,t is the
benchmark index weight in stock i at the beginning of period t, ri,t is the return of
stock i over period t and rb,t is the return of the benchmark index over period t.
Equation (1) implies that both the magnitude of stock weight differences and the
cross-sectional dispersion in stock returns are factors that can contribute to
tracking error. In the extreme case that fund weights are identical to benchmark
index weights (perfect full replication), or in the extreme case that the cross-
sectional dispersion in stock returns is zero (i.e., if all stocks have exactly the
same return), the tracking error would be zero.
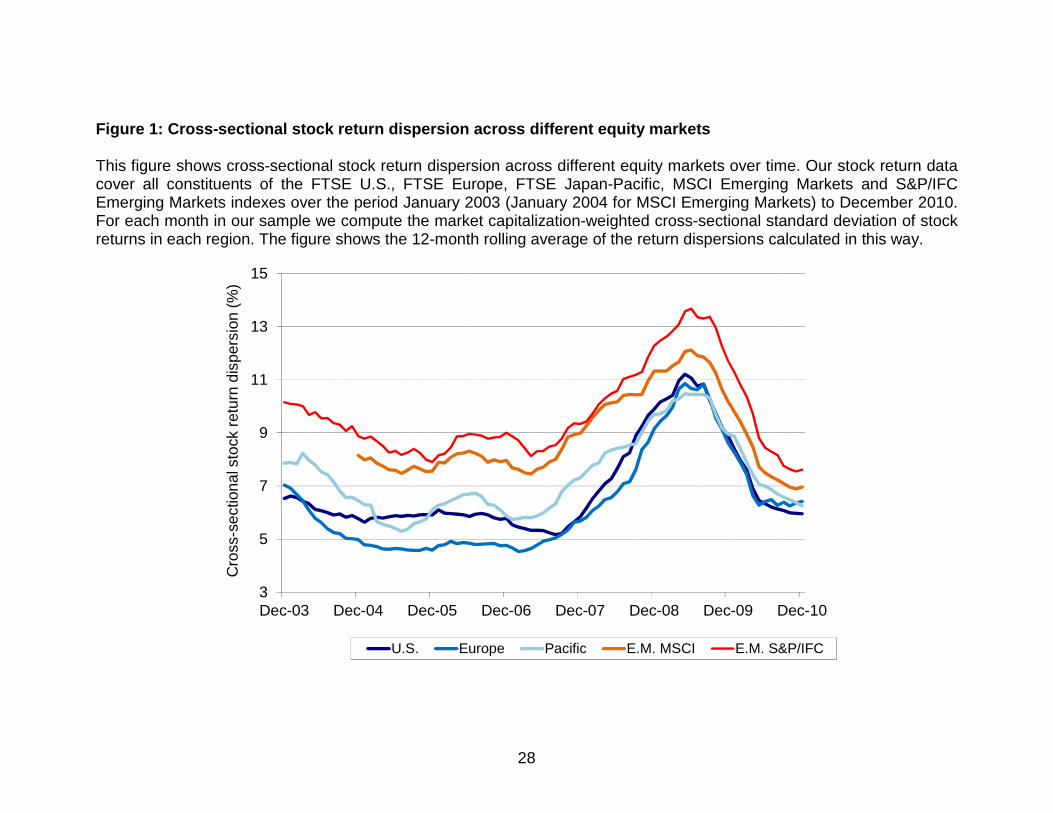
For our empirical analysis we first compute the dispersion in cross-
sectional stock returns for the U.S., the European, the Pacific, and emerging
equity markets. Our stock return data cover all constituents of the FTSE U.S.,
FTSE Europe, FTSE Japan-Pacific, MSCI Emerging Markets and S&P/IFC
Emerging Markets indexes over the period January 2003 to December 2010.7
For each month in our sample we compute the market capitalization-weighted
cross-sectional standard deviation of stock returns in each region. Figure 1
shows the 12-month rolling average return dispersions over time. We clearly
7 Except for the MSCI Emerging Markets index, for which constituent data is only available from
January 2004 onwards.

13
observe that the return dispersion in emerging markets is structurally higher than
in the U.S., Europe and the Japan-Pacific regions. For the MSCI Emerging
Markets universe, average cross-sectional volatility is around 29% higher than in
the developed market regions, while for the S&P/IFC Emerging Markets universe,
which contains more small stocks, the average cross-sectional volatility is even
around 42% higher. Our finding of large return dispersion in emerging markets is
consistent with the findings of Harvey (1995) and Phylaktis and Xia (2006) that,
compared to developed markets, additional common factors are required to
explain equity returns in emerging markets, and the result of Dey (2005) that the
sources of risk in emerging and developed markets are different.
[INSERT FIGURE 1 ABOUT HERE]
We continue our analysis by splitting our sample into two subsamples,
corresponding to a low- and a high-return dispersion regime. The regime
classification is based on whether the average cross-sectional dispersion of stock
returns in emerging markets over a particular period is below or above its median
level over the entire sample period.8 For each fund in our sample we then
compute tracking error levels conditional on the prevailing dispersion regime. The
results using monthly as well as (overlapping) quarterly or annual return data are
presented in Table 3.
[INSERT TABLE 3 ABOUT HERE]
8 For this analysis we use dispersion estimates based on S&P/IFC index constituent data, as the
available history for MSCI is incomplete. However, Figure 1 indicates that over the overlapping
period MSCI data implies a very similar regime classification.

14
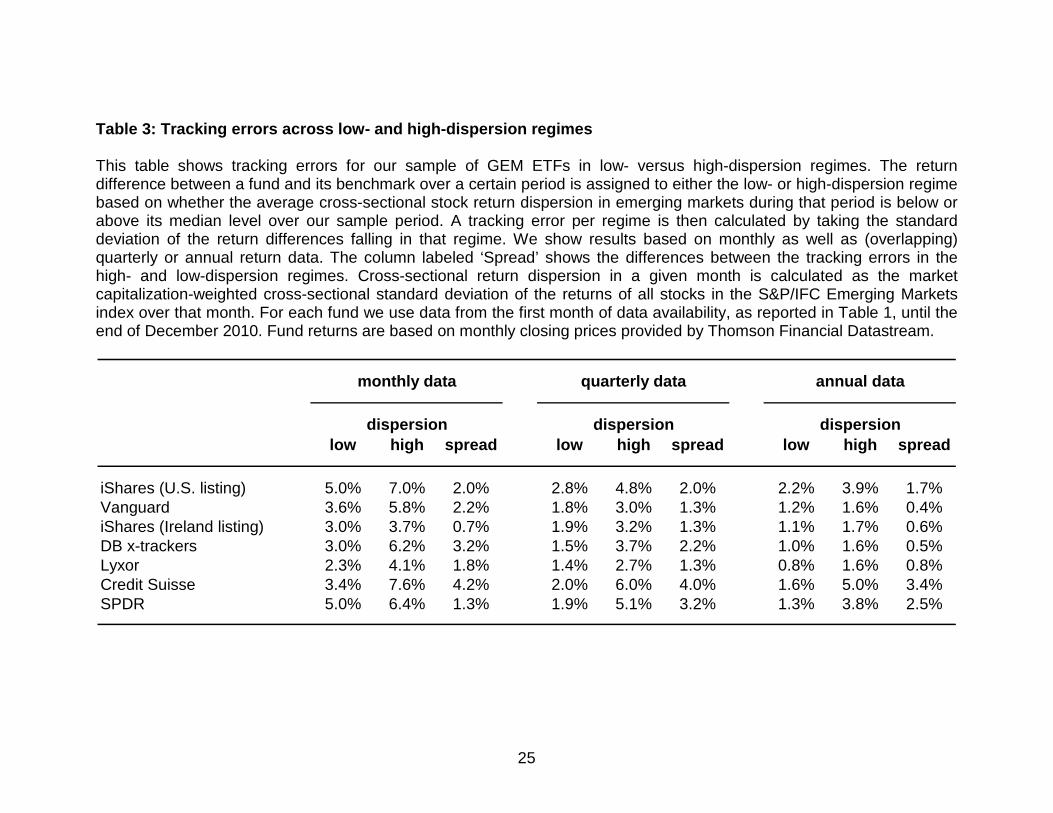
For all GEM ETFs we observe that tracking error levels are higher during periods
of high cross-sectional return dispersion than during periods of low dispersion,
regardless of the frequency used to calculate returns. Focusing on the results
based on annual return data, which are least affected by short-term noise factors,
we observe that the spread in tracking-error levels during low and high return
dispersion regimes is particularly large for GEM ETFs that rely on statistical
replication. Specifically, we observe tracking error spreads of 1.7 to 3.4 percent
for the iShares (U.S. listing), Credit Suisse and SPDR ETFs, which all use
statistical replication, versus spreads of only 0.4 to 0.8 percent for the Vanguard,
DB x-trackers and Lyxor ETFs that rely on full replication techniques. These
results indicate that it is more difficult to control long-term tracking error when
cross-sectional return dispersion increases, but particularly so for funds relying
on statistical replication techniques.9
3.3 GEM ETF performance
We proceed by evaluating the average performance of GEM ETFs. In Table 4 we
first show fund returns minus gross benchmark returns. Gross benchmark returns
are calculated assuming full reinvestment of dividends. In the second column of
the table we show fund returns minus net benchmark returns. Net benchmark
returns are computed assuming the reinvestment of dividends that remain after
9 The exception to this rule is again the iShares (Ireland listing), which we previously observed to
be the only statistical-replication fund with a tracking error comparable to the full-replication funds.
Not surprisingly, therefore, the observed tracking error spread for this fund is also comparable to
that of the full-replication funds.
15
taxation against the maximum rates applicable to non-resident institutional
investors. In the third column of the table we show fund returns minus net
benchmark returns plus the expense ratio of a fund. By adding back the expense
ratio we adjust for the costs incurred by a fund. Fund total expense ratios are
shown in the fourth column of the table.
[INSERT TABLE 4 ABOUT HERE]
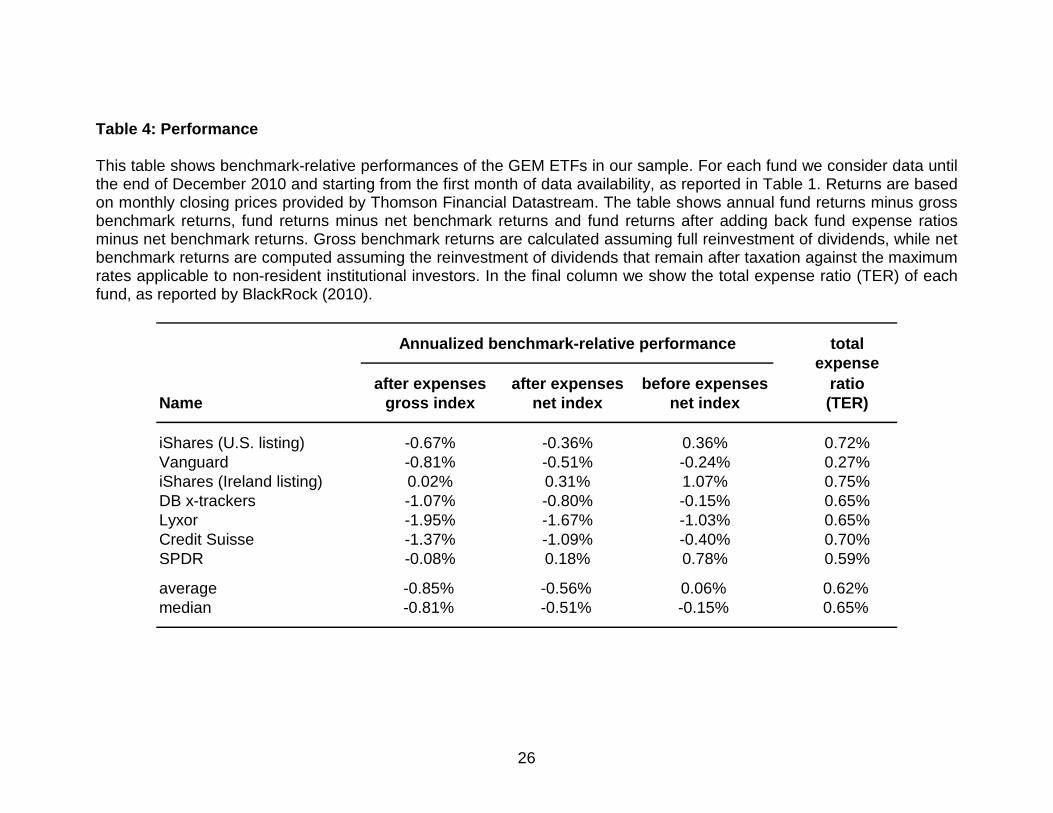
Based on Table 4 we conclude that the average GEM ETF in our sample
underperforms its gross benchmark index by 85 basis points per annum.
Interestingly, the magnitude of this underperformance is not much different from
the figure reported by Blitz, Huij and Swinkels (2011) for a sample of passive
funds that mainly invest in developed equity markets.10 Another result of that
study is that the expected return on an ETF is equal to its gross benchmark index
return, minus its expense ratio and minus dividend taxes. This approximation
also appears to be a good estimate for the expected return of GEM ETFs, as
Table 4 shows that GEM ETF performance adjusted for expenses is very close to
net benchmark index returns. Expenses contribute 62 basis points to GEM ETF
underperformance, while the estimated impact of dividend taxation is 29 basis
points. This amounts to 91 basis points in total, which is very close to the actual
underperformance of 85 basis points. The relative impact of dividend withholding
taxes and expenses on fund performance in emerging markets differs from that in
developed equity markets though. Whereas Blitz, Huij and Swinkels (2011) report
that the explanatory power of dividend withholding taxes as a determinant of ETF
10 The authors report that the funds in their sample underperform their benchmark indexes with
50 to 150 basis points per annum, with a median of 84 basis points.
16
underperformance is at least on par with fund expenses, the impact of
withholding taxes appears to be about half that of fund expenses in emerging
markets. This finding can be attributed to the fact that dividend withholding taxes
are generally lower for emerging than for developed markets, while fund expense
ratios tend to be higher.11
Our finding that expenses and dividend withholding taxes suffice for
explaining the average return of GEM ETFs indicates that other potential
explanatory factors, such as trading costs, do not have a material impact on long-
term expected fund performance. Although trading costs are known to be higher
in emerging markets than in developed markets (Domowitz, Glen and Madhavan,
2001; Chiyachantana, Jain, Jiang and Wood, 2004), GEM ETFs do not appear to
perform worse than developed markets passive funds. A possible explanation for
this observation might be that the higher trading costs in emerging markets are
offset by higher revenues from securities lending activities.
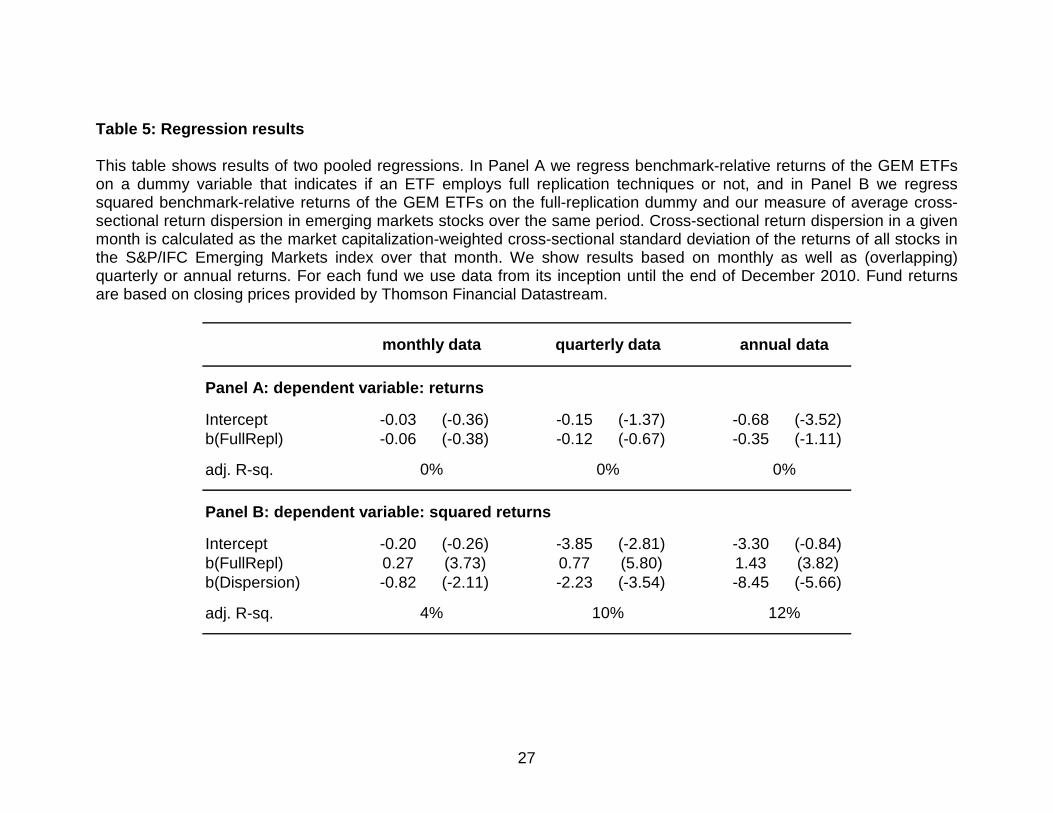
Another interesting observation is that ETFs that rely on statistical
replication techniques do not appear to perform better than their full-replication
counterparts. To formally test the impact of different replication techniques on
GEM ETF performance we perform two pooled regressions. In the first
regression we regress benchmark-relative returns of the GEM ETFs on a dummy
variable that indicates if an ETF employs full replication techniques or not, and in
the second regression we regress squared benchmark-relative returns of the
11 For example, Blitz, Huij and Swinkels (2011) report expense ratios of 35-50 basis points per
annum and a dividend withholding tax impact of 50-60 basis points per annum for European-
listed ETFs tracking the S&P 500, MSCI U.S.A., MSCI Europe or MSCI World index.

17
GEM ETFs on the full-replication dummy and our measure of average cross-
sectional return dispersion in emerging markets stocks over the same period. We
run separate regressions using monthly as well as (overlapping) quarterly or
annual return data. The resulting coefficient estimates and adjusted R-squared
values are reported in Table 5.
[INSERT TABLE 5 ABOUT HERE]
The coefficient estimates of the regressions where we use squared ETF
benchmark-relative returns as the dependent variable corroborate our previous
findings, indicating that GEM ETF tracking-error levels are positively related to
cross-sectional return dispersion of emerging market stocks and lower for funds
that employ full replication techniques. All t-statistics are highly significant. The
coefficient estimates of the regression where we use ETF benchmark-relative
returns as dependent variable are also consistent with our previous finding that
there is no strong evidence in support of the notion that ETFs that employ
statistical replication techniques might earn better returns than ETFs that rely on
full replication. While we do observe negative point estimates for the full
replication dummy variable, all coefficient estimates are statistically insignificant.
4. Conclusion
In this paper we examine the performance of exchange-traded funds (ETFs) that
provide passive exposure to global emerging markets (GEM) equities. We find
that GEM ETFs exhibit higher levels of tracking error than developed markets
ETFs, which we relate to the cross-sectional dispersion in stock returns being

18
structurally larger in emerging markets. We find that this feature of emerging
markets also has important implications for the replication techniques that are
used by the ETFs to track their benchmark indexes. We find that especially ETFs
that rely on statistical replication are prone to high levels of tracking error, and
particularly so during periods of high return dispersion. At the same time there is
no convincing evidence that these funds earn better returns than ETFs that rely
on full-replication techniques. The long-term average underperformance of GEM
ETFs is similar to that of developed markets ETFs. We find that, on average,
GEM ETFs fall short of their benchmark indexes by around 85 basis points per
annum, which is in line with the expected drag on return due to fund expense
ratios plus the impact of withholding taxes on dividends. While ETFs that use
statistical replication earn somewhat better returns than ETFs that use full
replication, the return differences are only marginal and statistically insignificant.
19
References
Abel, E., and Fletcher, J. (2004), “An Empirical Examination of UK Emerging
Market Unit Trust Performance”, Emerging Markets Review, Vol. 5, No. 4,
pp. 389-408
Agapova, A. (2011), “Conventional Mutual Index Funds versus Exchange-Traded
Funds”, Journal of Financial Markets, Vol. 14, No. 2, pp. 323-343
Beasley, J.E., and Canakgoz, N.A. (2009), “Mixed-Integer Programming
Approaches for Index Tracking and Enhanced Indexation”, European
Journal of Operational Research, Vol. 196, No. 1, pp. 384-399
Beasley, J.E., Meade, N., and Chang, T.J. (2003), “An Evolutionary Heuristic for
the Index Tracking Problem”, European Journal of Operational Research,
Vol. 148, No. 3, pp. 621-643
Bekaert, G., Harvey, C.R., and Lumsdaine, R.L. (2002). “The Dynamics of
Emerging Market Equity Flows”, Journal of International Money and
Finance, Vol. 21, No. 3, pp. 295–350
Blitz, D.C., Huij, J., and Swinkels, L.A.P. (2011), “On the Performance of
European Index Funds and ETFs”, SSRN working paper, No. 1438484
(forthcoming European Financial Management)
BlackRock (2010), ETF Landscape Global Handbook, Q2 2010
Bollen, N. P. B., and Busse, J. A. (2005), “Short-term Persistence in Mutual Fund
Performance”, Review of Financial Studies, Vol. 18, No.2, pp. 569-597
Carhart, M.M. (1997), “On Persistence in Mutual Fund Performance”, Journal of
Finance, Vol. 52, No. 1, pp. 57-82

20
Chiyachantana, C.N., Jain, P. K., Jiang, C., and Wood, R.A. (2004), “International
Evidence on Institutional Trading Behavior and Price Impact”, Journal of
Finance, Vol. 59, No. 2, pp. 869-898
Coriellia, F., and Marcellino, M. (2006), “Factor Based Index Tracking”, Journal of
Banking and Finance, Vol. 30, No. 8, pp. 2215-2233
Dey, K.D. (2005), “Turnover and Return in Global Stock Markets”
Emerging Markets Review, Vol. 6, No. 1, pp. 45-67
Domowitz, I., Glen, J., and Madhavan, A. (2001), “Liquidity, Volatility and Equity
Trading Costs Across Countries and Over Time”, International Finance, Vol.
4, No. 2, pp. 221–255
Elton, E. J., Gruber, M. J., and Blake, C. R. (1996), “The Persistence of Risk-
Adjusted Mutual Fund Performance”, Journal of Business, Vol. 69, No. 2,
pp. 133-157
Elton, E. J., Gruber, M. J., and Busse, J. A. (2004), “Are Investors Rational?
Choices among Index Funds”, Journal of Finance, Vol. 59, No. 1, pp. 261-
288
Frino, A., Gallagher, D.R., and Oetomo, T.N. (2006), “Further Analysis of the
Liquidity and Information Components of Institutional Orders: Active versus
Passive Funds”, Pacific-Basin Finance Journal, Vol. 14, No. 5, pp. 439-452
Gastineau, G.L. (2004), “The Benchmark Index ETF Performance Problem”,
Journal of Portfolio Management, Vol. 30, No. 2, pp. 96-103
Gottesman, A., and Morey, M.R. (2007), “Predicting Emerging Market Mutual
Fund Performance”, Journal of Investing, Vol. 16, No. 3, pp. 111-122

21
Haslem, J.A. (2003), “Mutual Funds: Risk and Performance Analysis for Decision
Making”, Oxford: Blackwell Publishing
Harvey, C. (1995), “Predictable Risk and Returns in Emerging Markets”, Review
of Financial Studies, Vol. 8, No. 3, pp. 773–816
Hayat, R.. and Kraeussl, R. (2011), “Risk and Return Characteristics of Islamic
Equity Funds” Emerging Markets Review, Vol. 12, No. 2, pp. 189-203
Hendricks, D., Patel, J., and Zeckhauser, R. (1993), “Hot Hands in Mutual Funds:
Short-run Persistence of Relative Performance”, Journal of Finance, Vol. 48,
No. 1, pp. 93-130
Huij, J., and Post, T. (2011), “On the Performance of Emerging Markets Equity
Mutual Funds”, Emerging Markets Review, Vol. 12, No. 3, pp. 238-249
Johnson, W.F. (2009), “Tracking Errors of Exchange Traded Funds”, Journal of
Asset Management, Vol. 10, No. 4, pp. 253-262
Klapper, L., Sulla, V., and Vittas, D. (2004), “The Development of Mutual Funds
Around the World”, Emerging Markets Review, Vol. 5, No.1, pp. 1-38
Poterba, J.M, and Shoven, J.B. (2002), “Exchange-Traded Funds: A New
Investment Option for Taxable Investors”, American Economic Review, Vol.
92, No. 2, pp. 422-427
Phylaktis, K., and Xia, L. (2006). “Sources of Firms' Industry and Country Effects
in Emerging Markets”. Journal of International Money and Finance, Vol. 25,
No. 3, pp. 459–475

22
Shin, S., and Soydemir, G. (2010), “Exchange-Traded Funds, Persistence in
Tracking Errors and Information Dissemination”, Journal of Multinational
Financial Management, Vol. 20, No. 4-5, pp. 214-234
Svetina, M., and Wahal, S. (2008), “Exchange Traded Funds: Performance and
Competition”, SSRN working paper, No.1303643

23
Table 1: Sample overview
This table provides an overview of our sample of exchange-traded funds that provide passive exposure to global emerging markets equities. Starting from the long-list of ETFs provided by BlackRock (2010) we select all U.S. and European listed funds that track a conventional broad emerging markets index and have a live track-record of at least one year. For each fund we show the country of domicile, the target (benchmark) index, the assets under management and the start date of data availability. Source: BlackRock (2010).
ReplicationISIN Name Domicile Index AuM ($ mln) technique Data start
US4642872349 iShares (U.S. listing) United States MSCI EM 33,628 statistical Apr-03US9220428588 Vanguard United States MSCI EM 24,313 full (stocks) Mar-05IE00B0M63177 iShares (Ireland listing) Ireland MSCI EM 3,587 statistical Dec-05LU0292107645 DB x-trackers Luxembourg MSCI EM 3,565 full (swaps) Jul-07FR0010429068 Lyxor France MSCI EM 1,275 full (swaps) Jun-07LU0254097446 Credit Suisse Luxembourg MSCI EM 602 statistical Jul-06US78463X5095 SPDR United States S&P EM BMI 140 statistical Mar-07
24
Table 2: Tracking errors
This table shows tracking errors of the GEM ETFs in our sample. We define tracking error as the time-series standard deviation of the return differences between a fund and its benchmark index. For each fund we calculate tracking errors using data until the end of December 2010 and starting from the first month of data availability, as reported in Table 1. Returns are based on monthly closing prices provided by Thomson Financial Datastream. For some funds we additionally report tracking errors based on net asset value (NAV) data taken from company websites (results reported between parentheses). We show annualized tracking errors based on monthly returns as well as (overlapping) quarterly or annual returns. In addition we show the number of securities in each fund portfolio and it benchmark index, as reported by BlackRock (2010).
Annualized tracking error
Name ETF Index
iShares (U.S. listing) 6.1% (3.2%) 4.0% (2.8%) 3.2% (2.9%) 382 767Vanguard 4.8% (n.a.) 2.4% (1.7%) 1.5% (1.1%) 778 767iShares (Ireland listing) 3.4% (1.4%) 2.7% (1.3%) 1.7% (1.4%) 329 767DB x-trackers 5.1% 3.1% 1.4% swap 767Lyxor 3.5% 2.4% 1.5% swap 767Credit Suisse 6.1% 4.6% 4.4% 153 767SPDR 5.8% 4.2% 3.6% 600 1525
securitiesNumber of
returnsquarterlyreturns
monthlyreturns
annual
25
Table 3: Tracking errors across low- and high-dispersion regimes
This table shows tracking errors for our sample of GEM ETFs in low- versus high-dispersion regimes. The return difference between a fund and its benchmark over a certain period is assigned to either the low- or high-dispersion regime based on whether the average cross-sectional stock return dispersion in emerging markets during that period is below or above its median level over our sample period. A tracking error per regime is then calculated by taking the standard deviation of the return differences falling in that regime. We show results based on monthly as well as (overlapping) quarterly or annual return data. The column labeled ‘Spread’ shows the differences between the tracking errors in the high- and low-dispersion regimes. Cross-sectional return dispersion in a given month is calculated as the market capitalization-weighted cross-sectional standard deviation of the returns of all stocks in the S&P/IFC Emerging Markets index over that month. For each fund we use data from the first month of data availability, as reported in Table 1, until the end of December 2010. Fund returns are based on monthly closing prices provided by Thomson Financial Datastream.
monthly data quarterly data annual data
dispersion dispersion dispersionlow high spread low high spread low high spread
iShares (U.S. listing) 5.0% 7.0% 2.0% 2.8% 4.8% 2.0% 2.2% 3.9% 1.7%Vanguard 3.6% 5.8% 2.2% 1.8% 3.0% 1.3% 1.2% 1.6% 0.4%iShares (Ireland listing) 3.0% 3.7% 0.7% 1.9% 3.2% 1.3% 1.1% 1.7% 0.6%DB x-trackers 3.0% 6.2% 3.2% 1.5% 3.7% 2.2% 1.0% 1.6% 0.5%Lyxor 2.3% 4.1% 1.8% 1.4% 2.7% 1.3% 0.8% 1.6% 0.8%Credit Suisse 3.4% 7.6% 4.2% 2.0% 6.0% 4.0% 1.6% 5.0% 3.4%SPDR 5.0% 6.4% 1.3% 1.9% 5.1% 3.2% 1.3% 3.8% 2.5%
26
Table 4: Performance
This table shows benchmark-relative performances of the GEM ETFs in our sample. For each fund we consider data until the end of December 2010 and starting from the first month of data availability, as reported in Table 1. Returns are based on monthly closing prices provided by Thomson Financial Datastream. The table shows annual fund returns minus gross benchmark returns, fund returns minus net benchmark returns and fund returns after adding back fund expense ratios minus net benchmark returns. Gross benchmark returns are calculated assuming full reinvestment of dividends, while net benchmark returns are computed assuming the reinvestment of dividends that remain after taxation against the maximum rates applicable to non-resident institutional investors. In the final column we show the total expense ratio (TER) of each fund, as reported by BlackRock (2010).
Annualized benchmark-relative performance total
after expenses after expenses before expenses ratioName gross index net index net index (TER)
iShares (U.S. listing) -0.67% -0.36% 0.36% 0.72%Vanguard -0.81% -0.51% -0.24% 0.27%iShares (Ireland listing) 0.02% 0.31% 1.07% 0.75%DB x-trackers -1.07% -0.80% -0.15% 0.65%Lyxor -1.95% -1.67% -1.03% 0.65%Credit Suisse -1.37% -1.09% -0.40% 0.70%SPDR -0.08% 0.18% 0.78% 0.59%
average -0.85% -0.56% 0.06% 0.62%median -0.81% -0.51% -0.15% 0.65%
expense
27
Table 5: Regression results
This table shows results of two pooled regressions. In Panel A we regress benchmark-relative returns of the GEM ETFs on a dummy variable that indicates if an ETF employs full replication techniques or not, and in Panel B we regress squared benchmark-relative returns of the GEM ETFs on the full-replication dummy and our measure of average cross-sectional return dispersion in emerging markets stocks over the same period. Cross-sectional return dispersion in a given month is calculated as the market capitalization-weighted cross-sectional standard deviation of the returns of all stocks in the S&P/IFC Emerging Markets index over that month. We show results based on monthly as well as (overlapping) quarterly or annual returns. For each fund we use data from its inception until the end of December 2010. Fund returns are based on closing prices provided by Thomson Financial Datastream.
Panel A: dependent variable: returns
Intercept -0.03 (-0.36) -0.15 (-1.37) -0.68 (-3.52)b(FullRepl) -0.06 (-0.38) -0.12 (-0.67) -0.35 (-1.11)
adj. R-sq.
Panel B: dependent variable: squared returns
Intercept -0.20 (-0.26) -3.85 (-2.81) -3.30 (-0.84)b(FullRepl) 0.27 (3.73) 0.77 (5.80) 1.43 (3.82)b(Dispersion) -0.82 (-2.11) -2.23 (-3.54) -8.45 (-5.66)
adj. R-sq.
0% 0% 0%
12%10%4%
monthly data quarterly data annual data
28
Figure 1: Cross-sectional stock return dispersion across different equity markets
This figure shows cross-sectional stock return dispersion across different equity markets over time. Our stock return data cover all constituents of the FTSE U.S., FTSE Europe, FTSE Japan-Pacific, MSCI Emerging Markets and S&P/IFC Emerging Markets indexes over the period January 2003 (January 2004 for MSCI Emerging Markets) to December 2010. For each month in our sample we compute the market capitalization-weighted cross-sectional standard deviation of stock returns in each region. The figure shows the 12-month rolling average of the return dispersions calculated in this way.
3
5
7
9
11
13
15
Dec-03 Dec-04 Dec-05 Dec-06 Dec-07 Dec-08 Dec-09 Dec-10
Cro
ss-s
ectio
nal s
tock
ret
urn
disp
ersi
on (
%)
U.S. Europe Pacific E.M. MSCI E.M. S&P/IFC