Embed Size (px)
Citation preview
Evaluating the Effects of a Finger-Imaging Requirement
for SNAP Eligibility on
Food Stamp Participation and Food Security
Nick Pietrini
University of Notre Dame
Professor Bill Evans
Health Economics
April 27, 2015
Pietrini 2
Abstract:
The Supplemental Nutrition Assistance Program (SNAP), previously known as the Food
Stamp Program, provides a crucial resource for impoverished households in increasing
purchasing power and food security. Fraud presents a large cost concern to the program,
and the federal government mandates that the states must maintain a system that prevents
duplicate or ineligible participants from receiving benefits. To satisfy this requirement,
four states (Arizona, California, New York, and Texas) required applicants to submit to a
finger-imaging requirement to receive benefits at different times in the last two decades.
However, a large opposition to finger-imaging appeared, claiming it decreased SNAP
participation by increasing the costs in time, money, stigma, and inconvenience of
applying for benefits, and every state save Arizona repealed the requirement. I exploit the
variation in timing by state with a difference in difference framework to examine the
impact of this eligibility requirement on SNAP participation and food insecurity. I find
the requirement decreases SNAP participation by 1.3 and 1.5 percentage points for
individuals at or below 200% and 130% of the poverty threshold, respectively, and the
effect intensifies for whites (non-Hispanic), children, and single mothers. Food insecurity
increases for white mothers below 185% of the poverty line and white children of all
incomes and below 185% of the poverty line. However, a finger-imaging requirement
improves SNAP participation and food security for Hispanics and has no effect for blacks
(non-Hispanic), suggesting that the increased costs associated with finger-imaging are
equaled or exceeded by the benefit of reducing discrimination from SNAP officers by
confirming one’s legal US residence and freedom from felony drug convictions.
Pietrini 3
I. Introduction
At the end of the last century, the Supplemental Nutrition Assistance Program
(SNAP), formerly known as the Food Stamp Program, trended toward a system of
requiring program applicants to submit to finger-imaging in order to receive benefits. The
practice started in Los Angeles County in 1991, and news of reduced fraud and costs
evidenced by decreased enrollment encouraged other states to adopt the practice.
Opponents of biometric identification argued that enrollment dropped due to the
increased cost and inconvenience of application and recertification with finger-imaging
rather than from fewer fraudulent enrollees, increasing the rate of eligible
nonparticipation. The ethical concern of the association between finger-imaging and
criminal treatment reinforced the backlash, and the fingerprinting requirement for SNAP
started disappearing as quickly as it arrived, with Arizona as the only remaining state
with the requirement.
Food stamps are an effective and efficient tool in alleviating poverty and food
insecurity, making the eligible nonparticipation due to increased costs of application and
recertification a significant problem. In 2013 alone, food stamps elevated 4.9 million
people above the poverty threshold, 2.2 million of whom were children (Trisi 2013). A
USDA study found the prevalence of very low food security in SNAP eligible households
declined with an increase in SNAP benefits from 2008 to 2009 despite an expected
increase in food insecure households due to decreased income and employment from the
recession (Rosenbaum 2013). As a result of better nutrition, food stamp participation
improves the health of its recipients, evidenced by an improvement in birth outcomes as
measured by mean birth weight and incidence of low birth weight with the Food Stamp
Pietrini 4
Program rollout from 1965 to 1971 (Almond et al. 2008). This paper examines the effect
of a finger-imaging requirement on SNAP enrollment and food insecurity.
In order to answer this question, I exploit the variation in the timing by year and
the location by state of the requirement. At different points over the last twenty years,
four states (Arizona, California, New York, and Texas) required food stamp applicants to
be fingerprinted to receive benefits. The timing of when the requirement started and
ended differs across each state. I exploit this variation with a difference in difference
framework to examine the impact of these eligibility requirements. In particular, I use
panels of repeated cross sections and add state and year fixed-effects into the model. This
allows me to control for differences in the permanent differences across states that are
common over time that may alter take-up (such as underlying food prices or the ease with
which people can enroll within a state) and enrollment trends over time that are common
to all states (such as the Great Recession).
I find that finger-imaging SNAP applicants reduces enrollment by 0.9 percentage
points for adults and 1.6 percentage points for children with a gross household income at
or below 130% of the federal poverty threshold, which I use as an approximation for food
stamp eligibility. I also find differences in the effect by race and ethnicity, with whites
experiencing the biggest enrollment loss, and by age and gender, with SNAP
participation for children and single mothers decreasing more than other adults with the
policy. In addition, a finger-imaging requirement increases the likelihood of white
children and mothers below 185% of the poverty threshold being food insecure, defined
by the USDA as the “limited or uncertain availability of nutritionally adequate and safe
Pietrini 5
foods or limited or uncertain ability to acquire acceptable foods in socially acceptable
ways,” by 6 and 4.9 percentage points, respectively.
However, the opposite trend is found with the Hispanic population. Hispanic
adults and children under 200% of the poverty threshold respond to a finger-imaging
requirement by increasing SNAP participation by 1.2 and 1.1 percentage points, and
Hispanic children under 185% of the poverty line respond with a 2.5 percentage point
reduction in food insecurity. In addition, no significant correlation exists between a
finger-imaging requirement and SNAP participation or food insecurity for black
individuals. I suggest that a finger-imaging requirement provides eligible Hispanics and
blacks a chance to prevent discrimination from SNAP officers based upon race or
ethnicity by providing further evidence of legal US residence and a criminal record free
of any felony drug convictions, both of which are required to receive SNAP benefits. In
addition, I assert that the increased SNAP enrollment and decreased food insecurity for
Hispanics can be attributed in part to a sharp increase in the amount of naturalizations
and number of Hispanic citizens exactly when states instituted the policy. With finger-
imaging resulting in increased SNAP participation and food security for Hispanics and no
change for blacks, the anti-discriminatory benefits of finger-imaging and rise in the
number of SNAP eligible Hispanics balanced the increased costs of enrollment and
recertification from finger-imaging for blacks and exceeded them for Hispanics.
II. Background
Food stamps are an essential part of impoverished families’ income, often
providing the resources to meet their basic needs. In order to be eligible for SNAP,
Pietrini 6
individual or household gross income must be at or below 130% of the federal poverty
threshold (Aussenberg 2014). US citizenship is also required, though exceptions exist for
immigrants with legal US residence of 5 years or longer, immigrants receiving disability-
assistance, and children under 18. SNAP is a federally funded program, with states
covering only a small portion of administrative costs (Ben-Shalom et al. 2011).
According to a study by the Food Research and Action Committee, SNAP is the
most effective program in lifting families above one half of the poverty threshold, and
one of the most effective in lifting families completely out of poverty (Maryns 2008).
When paired with the Earned Income Tax Credit, SNAP participation allows a minimum
wage worker’s family to reach an income level above the poverty threshold (CBPP
2015). In addition, food stamps can increase the purchasing power of a family of four
supported by a full-time, year-round minimum wage worker by 36 percent (Rosenbaum
et al. 2005). Comparing new SNAP enrollees to households receiving benefits for six
months, SNAP decreased food insecurity by 9 and 10 percentage points for all
households and households with children, respectively (Mabli et al. 2013). Food stamps
are also efficient, as the CBO found increases in SNAP benefits as one of the two most
cost-effective of all tax and spending options examined in boosting jobs and growth in a
struggling economy, generating $1.70 in economic activity for each dollar increase in
SNAP benefits (Rosenbaum 2013).
Despite the program’s efficiency in alleviating poverty and food insecurity, one in
every three eligible persons does not receive benefits, reducing SNAP’s effectiveness
(Ratcliffe et al. 2008). Although this occurs in part from misperception over one’s
eligibility, the largest contributor to eligible nonparticipation is the high costs in time,
Pietrini 7
money, stigma, and inconvenience of applying for benefits. Bartlett and Burnstein (2004)
found the costs of application and participation as a reason for not seeking benefits for 61
percent of eligible nonparticipants. In 2000, 10% of households reported being food
insecure, but the risk increased to 45% for SNAP eligible nonparticipants. Finger-
imaging increases the cost of obtaining food stamps, evidenced in a study where it was
found to decrease the likelihood that an eligible household will complete an application
by 23 percent (Bartlett et al. 2004). Furthermore, finger-imaging was one of only five
factors that negatively impacted food stamp participation.
Finger-imaging deters participation in SNAP through a variety of avenues. First,
many consider it an unjust treatment of poor people, as finger-imaging is associated with
criminals and can be considered degrading, leaving some to choose to not participate due
to pride or a perceived ethical dilemma. Second, it increases the cost and inconvenience
of receiving benefits, as it may require an additional trip to a separate facility to
complete, increasing the costs of transportation, childcare, and/or lost wages. Every adult
in the household must be fingerprinted until benefits can be received, often requiring
multiple trips due to a lack of information or schedule conflicts. Last, finger-imaging
increases fears of interagency sharing in applicants, specifically for those attempting to
commit fraud and receive excess benefits and undocumented immigrants (who cannot
legally obtain food stamps) fearful of information sharing with the INS. Although
deterring fraud is the intended effect of finger-imaging, its unintended costs may also
prevent many SNAP eligible individuals from receiving benefits.
Fraud presents a large problem to SNAP due to the high costs of providing
excessive benefits. The largest portion of fraud comes from individuals using duplicate
Pietrini 8
identities to obtain excessive benefits (Sticha 2009). With a duplicate identity, an
individual applies for and receives benefits from multiple programs he or she is ineligible
for or eligible for but with a smaller benefit. For example, being a recipient of Temporary
Assistance to Needy Families (TANF) benefits automatically reduces one’s benefit
amount from SNAP, so applying under separate identification would give an individual
full benefits from both programs. An applicant can also use a duplicate identity to receive
benefits from the same program twice. With a false birth certificate, an individual obtains
secondary identification from issuing agencies and can acquire multiple cases of
assistance simultaneously.
In order to prevent fraud, the Food Stamp Act [7 CFR 272.4(f)(1)] requires each
state to establish a system that prevents no applicant from receiving monthly benefits
“more than once a month, in more than one jurisdiction, or in more than one household
within the State.” In order to comply, states have integrated fraud reduction systems into
their application process, and individuals must provide basic documentation including
names and social security numbers as a minimum and other measures of identification as
states deem appropriate. These include the Eligibility Verification System (IEVS), which
mandates matching case records with six external databases, and the Electronic Benefit
Transfer (EBT), which replaces paper coupons and creates an electronic record of each
transaction (Sticha 2009). For the purposes of this paper, the fraud reducing measure of
interest is biometric identification technology, which identifies people based on physical
characteristics, such as hand shape, voice patterns, and, most notably for SNAP,
fingerprints. Under the Food Stamp Act, biometric identification fulfills the States’
requirement in stopping the excessive procurement of benefits. In fact, fingerprinting is
Pietrini 9
especially useful in eliminating duplicate applicants, as an applicant’s fingerprint can be
analyzed against a database with beneficiaries of SNAP and other welfare programs to
ensure he or she is not receiving benefits under separate identification. However, finger-
imaging is limited in reducing across-state duplicate participation, as the fingerprinting
trend for other welfare programs closely followed that of SNAP by time and state,
although certain exceptions exist (Connecticut, Illinois, and Massachusetts had finger-
imaging requirements for other welfare programs without requiring the same for SNAP
applicants) (Sticha & Ford 1999).
Previous work shows considerable ambiguity in the effect of biometric testing on
enrollment and fraud. Sticha et al. (1999) found that finger imaging systems detects
approximately 1 duplicate application for every 5000 cases, with statewide and interstate
systems increasing the detection rate (1999). Using the most controlled estimate of
refusal by existing enrollees, the authors found the finger-imaging requirement reduces
participation by 1.3% (Ernst & Young 1995). Bartlett et al. (2004) found that a finger-
imaging requirement reduced the likelihood of a completed application by 23 percentage
points, which was more than any other measured factor. However, in an accompanying
survey, only 1 percent of applicants who did not complete the application process
mentioned it as a reason. There is currently no research linking food insecurity to a
finger-imaging requirement for SNAP.
In this study, I attempt to fill a gap in the literature by analyzing individual-level
panel data that covers every year finger-imaging has been used as a fraud-reduction
measure in SNAP (1991-2014).This allows any estimate of finger-imaging’s effect on
SNAP participation to not include a reduction in the number of duplicate applicants, as
Pietrini 10
using individual-level data rather than participation data from SNAP directly avoids
counting individual participants twice. This isolates the effect to applicants deterred by
the increased cost and inconvenience of application and recertification. In addition, by
examining the effect of finger-imaging on food insecurity, this study shows how reduced
SNAP participation translates into increased difficulties for the poor. Finally, this study
separates how finger-imaging impacts SNAP participation and food insecurity by race,
income level, age, and marital status, illuminating how the policy disproportionately hurts
whites, children, and single mothers but also provides a defense against SNAP officer
discrimination for blacks and Hispanics.
III. Data and Empirical Model
The data used to analyze the impact of a finger-imaging requirement on SNAP
enrollment comes from the IPUMS-CPS database. IPUMS-CPS is a database containing
50 years (1962-2011) of the Current Population Survey (CPS), which is a monthly
household survey conducted by the US Census Bureau and the Bureau of Labor
Statistics. Initially designed to measure unemployment after the great depression, the
survey expanded to include “a battery of labor force and demographic questions”, with
supplemental inquiries on specific topics added for particular months over time. One of
these supplemental surveys is the March Annual Demographic File and Income
Supplement, or the March CPS, which has become a crucial resource for social scientists
and policymakers. For example, the March CPS is the source of annual data on national
poverty rates and the fraction uninsured. The IPUMS version of the CPS provides a
useful continuity to the March CPS data by “harmonizing” variables across time, greatly
Pietrini 11
improving the feasibility of cross time comparisons. This study also incorporates the
December CPS Food Security Supplement, which adds additional questions to the survey
on individuals’ food security and expenditures and use of food and nutrition assistance
programs.
In this study, I use panels of repeated cross sections from the March CPS for the
years 1991 through 2014 to determine the impact of multiple variables on food stamp
participation. The sample is limited to individuals with households at or below 200% of
the poverty threshold. In addition, I use panels of repeated cross sections from the
December CPS Food Security Supplement for the years 1998 through 2010 to estimate
the impact of a finger-imaging requirement on the food insecurity of individuals and
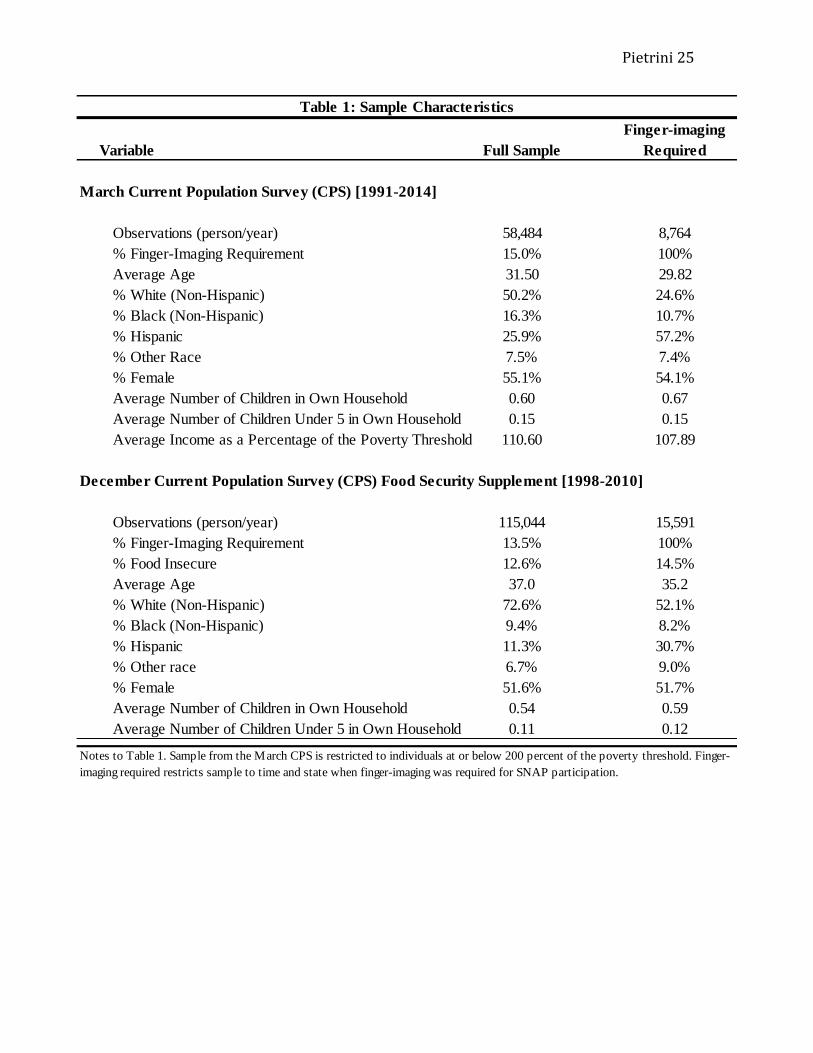
households. Both surveys use individual-level observations, with approximately 60,000
observations per year in the March CPS and 100,000 for the December CPS. Summary
Statistics for the March and December CPS are listed in Table 1.
A major limitation of the data is that the survey instrument does not identify
whether respondents are undocumented immigrants. In selecting a sample of likely
SNAP enrollees, I use low income families that will necessarily include many
undocumented workers and hence, people categorically ineligible for benefits. A second
limitation is the lack of county level data in the December CPS, meaning all food
insecurity regressions are limited to state-wide finger-imaging requirements. Finally, the
December CPS is without many of the variables included in the more complete March
CPS, meaning the controls in the food insecurity regressions are less comprehensive than
those in the SNAP participation regressions.
Pietrini 12
Using variables on demographic information and food stamp participation, I
measure the impact of fingerprinting on SNAP participation while including state and
year fixed effects to control for differences in SNAP participation by location and time.
In addition, I control for a variety of demographic variables, such as income as a
percentage of the poverty threshold, age, age2, race, and education. Furthermore, while
continuing to control for state and year fixed-effects, I regress food insecurity against the
presence of fingerprinting requirement and the set of demographic controls.
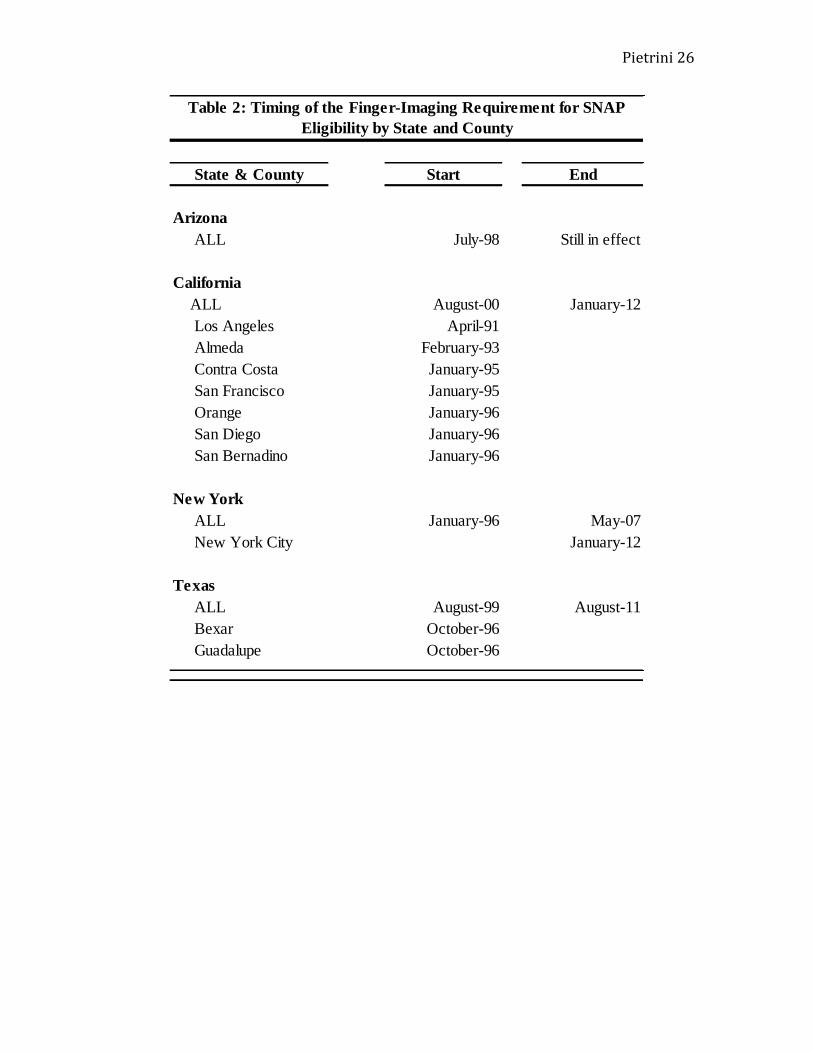
The model exploits the variation in the timing and location of the fingerprinting
requirement with a difference in difference framework to examine its effect on SNAP
participation and food insecurity. Table 2 shows the start and end dates of the finger-
imaging requirement for SNAP beneficiaries, starting with Los Angeles County in 1991.
Although Arizona, Texas, California, and New York all had statewide finger-imaging
requirements from 2000 to 2007, Arizona is the only remaining state with the
requirement.
𝑆𝑁𝐴𝑃𝑖𝑠𝑡 = 𝛼 + 𝐹𝑖𝑛𝑔𝑒𝑟𝑠𝑡𝛽1 + 𝑋𝑖𝑠𝑡𝛽2 + 𝜇𝑠 + 𝜏𝑡 + 𝑣𝑖𝑠𝑡
I use the above model in determining the impact of a fingerprinting requirement
and demographic characteristics on food stamp participation. SNAPist represents whether
individual i in state s in year t is a food stamp recipient. Fingerist determines the presence
of a food stamp requirement in year t in state s. Demographic variables and household
characteristics are represented in Xist. These characteristics include race/ethnicity (non-
Hispanic white, non-Hispanic black, Hispanic), age, age2, education, gender, income as
percentage of the poverty threshold, number of own children in the household, and
number of own children under 5 in the household. When looking specifically at children,
Pietrini 13
Xist incorporates the mother’s age, education, and marital status. In addition, µs represents
the state-level fixed effects, τt represents the year fixed effects, and vist represents the
random error term. The basic requirement for SNAP enrollment is a gross household
income at or below 130% of the federal poverty threshold, and I restrict the sample to
households with a gross household income of 130% or below the poverty level in certain
regressions to determine the impact of finger-imaging on the SNAP eligible population.
𝐹𝑜𝑜𝑑𝐼𝑛𝑠𝑒𝑐𝑢𝑟𝑖𝑡𝑦𝑖𝑠𝑡 = 𝛼 + 𝐹𝑖𝑛𝑔𝑒𝑟𝑠𝑡𝛽1 + 𝑋𝑖𝑠𝑡𝛽2 + 𝜇𝑠 + 𝜏𝑡 + 𝑣𝑖𝑠𝑡
The second model determines how a finger-imaging requirement and
demographic characteristics impacts the food security of an individual. FoodInsecurityist
is a dummy variable with a value of 1 indicating a household is classified as low or very
low food security, meaning households “reduced the quality, variety, and desirability of
their diets” and, for households with very low food security, experienced a significant
disruption in the “quality of food intake and normal eating patterns”. Again, demographic
and household characteristics are represented in the vector Xist, including family income,
education, race, age, age2, gender, and number of own children in the household.
Analysis restricted to mothers includes number of children under 5 and marital status.
Analysis restricted to children includes the mother’s age, education, and marital status.
IV. Results
A. Food Stamp Participation
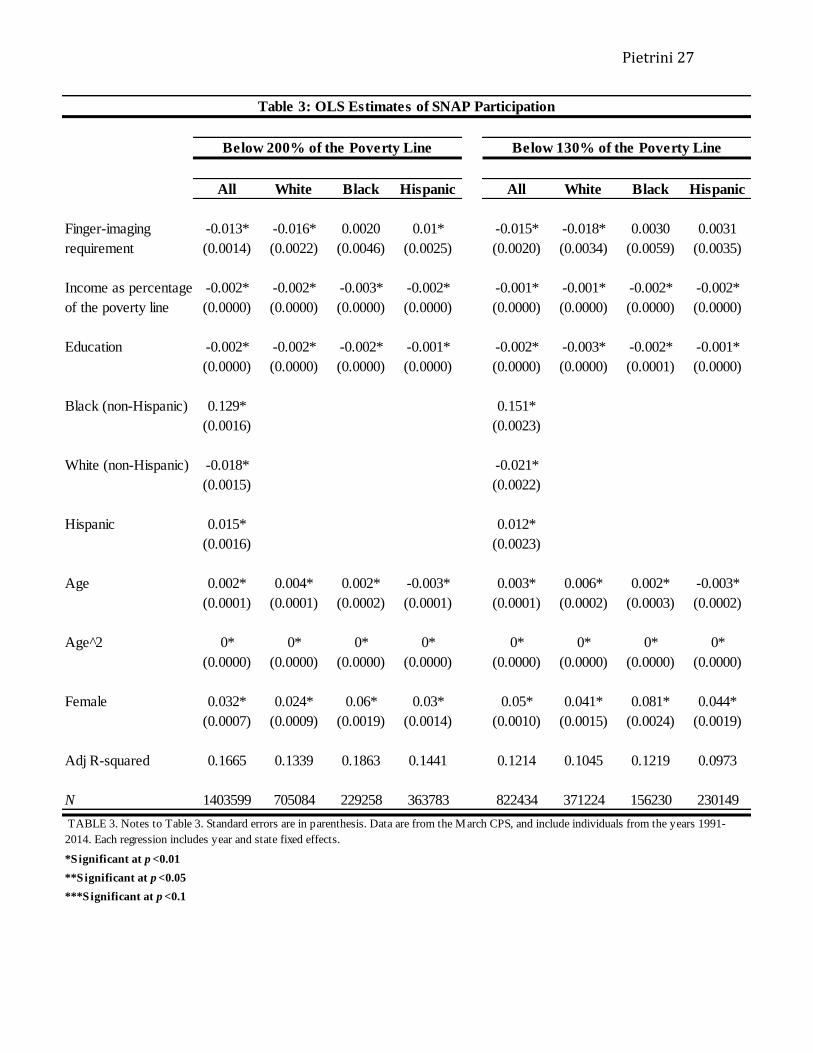
Table 3 displays OLS estimates of the food stamp participation regression with
state and year effects. It shows that a finger-imaging requirement reduces SNAP
participation by 1.3 percentage points for individuals below 200% of the poverty
Pietrini 14
threshold and 1.5 percentage points for individuals below 130% of the poverty threshold.
When separate models are estimated by race and ethnicity, only whites (non-Hispanic)
show decreased food stamp participation with a finger-imaging requirement, with
enrollment drops of 1.6 and 1.8 percentage points when below 200% and 130% of the
poverty threshold, respectively. Finger-imaging had no statistically significant effect on
blacks’ (non-Hispanic) food stamp participation and a statistically significant positive
effect on Hispanics’ SNAP participation below 200% of the poverty threshold.
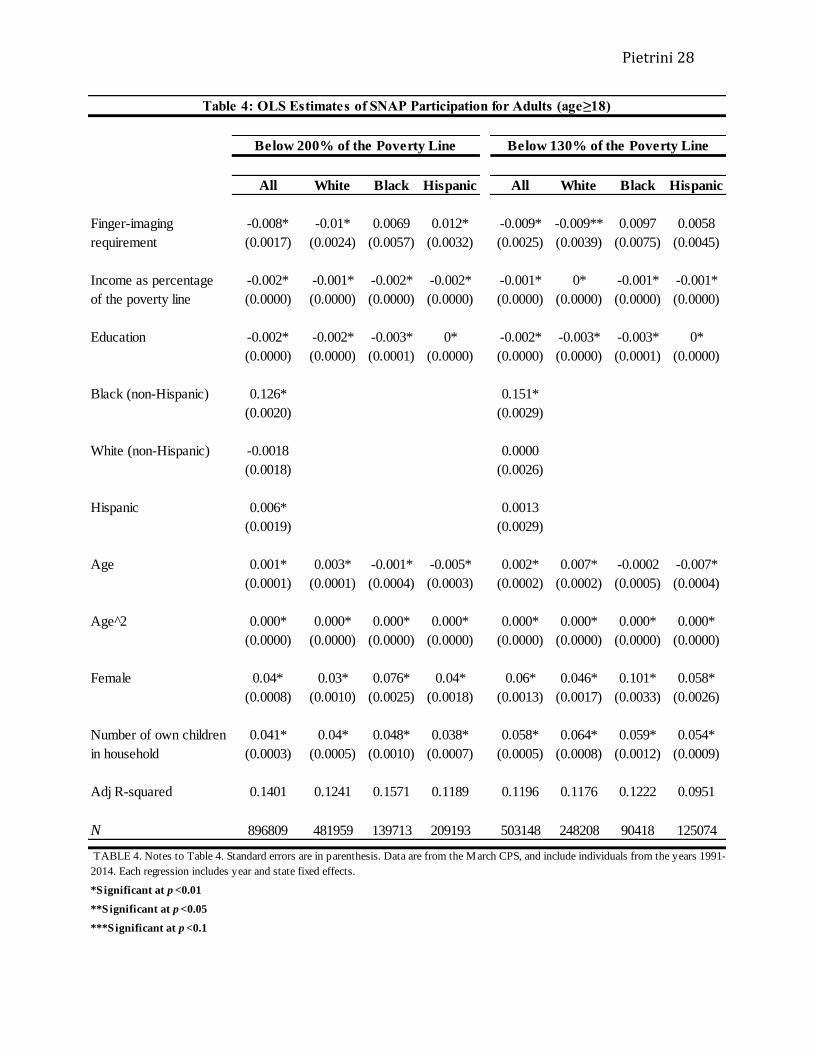
Table 4 isolates the effect of finger-imaging on SNAP participation to individuals
aged 18 and older. A finger-imaging requirement decreases food stamp participation by
0.8 and 0.9 percentage points for adults below 200% and 130% of the poverty threshold,
respectively. A finger-imaging requirement remains statistically significant in decreasing
white individuals’ and increasing Hispanic individuals below 200% of the poverty
threshold’s SNAP participation. Across all samples, increases in income and education
and decreases in the number of own children in the household statistically significantly
decrease food stamp participation.
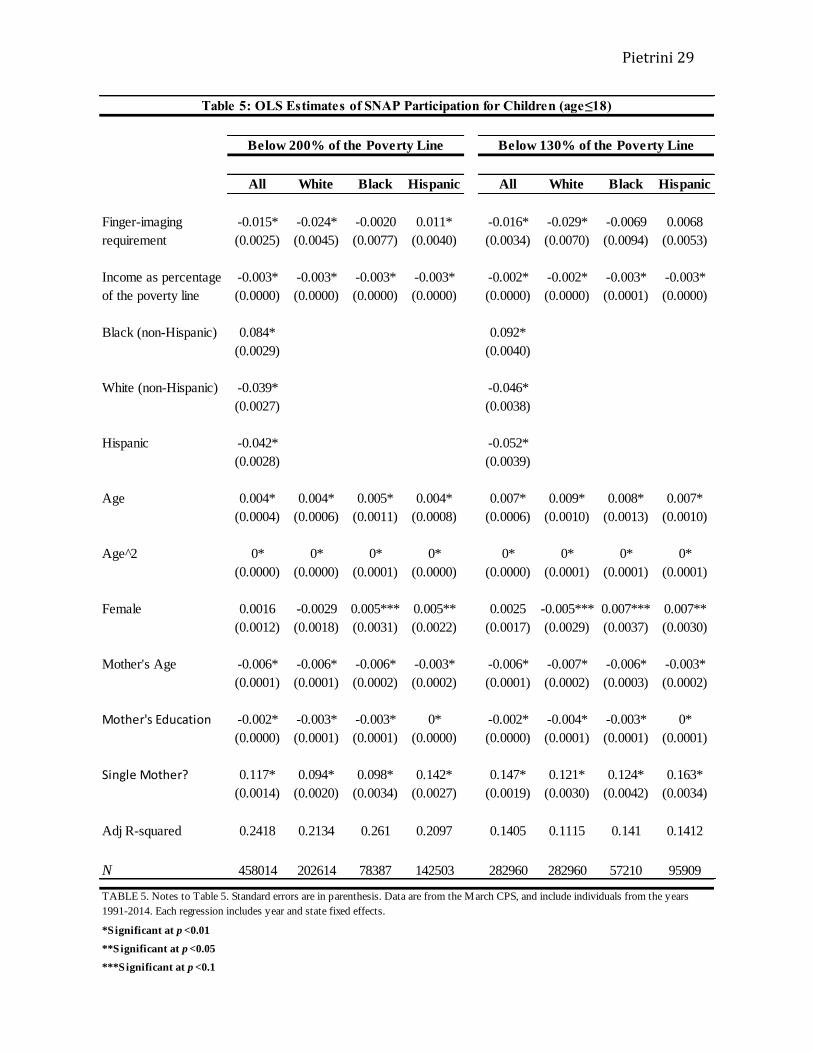
Table 5 isolates the effect of finger-imaging on SNAP participation to children
under the aged 18 and younger. The impact of finger-imaging on SNAP participation is
amplified for children, with statistically significant decreases in participation of 1.5 and
1.6 percentage points from finger-imaging for children below 200% and 130% of the
poverty threshold, respectively. White children experience an even greater effect, with a
2.4 percentage point decrease for children under 200% of the poverty threshold and a 2.9
percentage point decrease for children under 130% of the poverty threshold in SNAP
participation. The only other subsample where finger-imaging statistically significantly
Pietrini 15
affects SNAP participation is with Hispanic children under 200% of the poverty
threshold, where it increases SNAP participation by 1.1 percentage points.
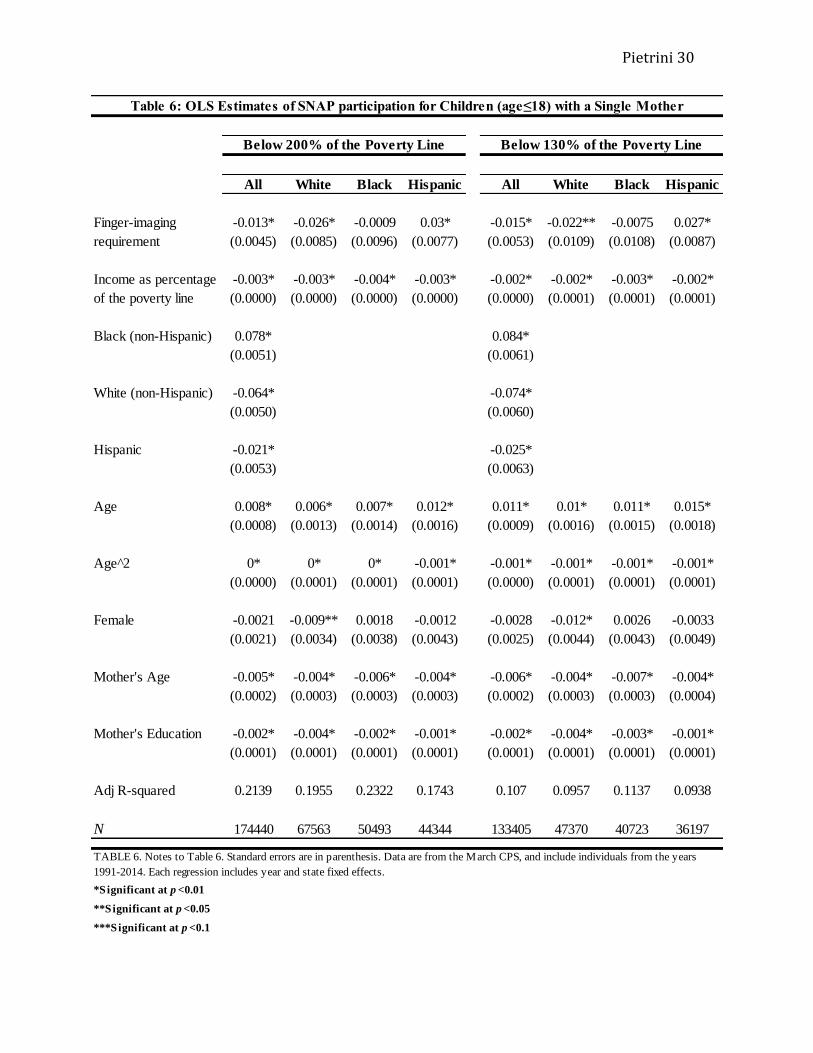
Table 6 estimates SNAP participation for children with single mothers. Finger-
imaging remains a statistically significant predictor of lower SNAP participation for all
children and white children with single mothers under 200% and 130% of the poverty
threshold, with a finger-imaging requirement lowering participation by 1.3 and 1.5
percentage points for all children with single mothers below 200% and 130% of the
poverty threshold and 2.6 and 2.2 percentage points for white children with single
mothers below 200% and 130% of the poverty threshold. Finger-imaging increases
SNAP participation for Hispanic children with single mothers below 200% and 130% of
the poverty threshold by 3 and 2.7 percentage points, respectively.
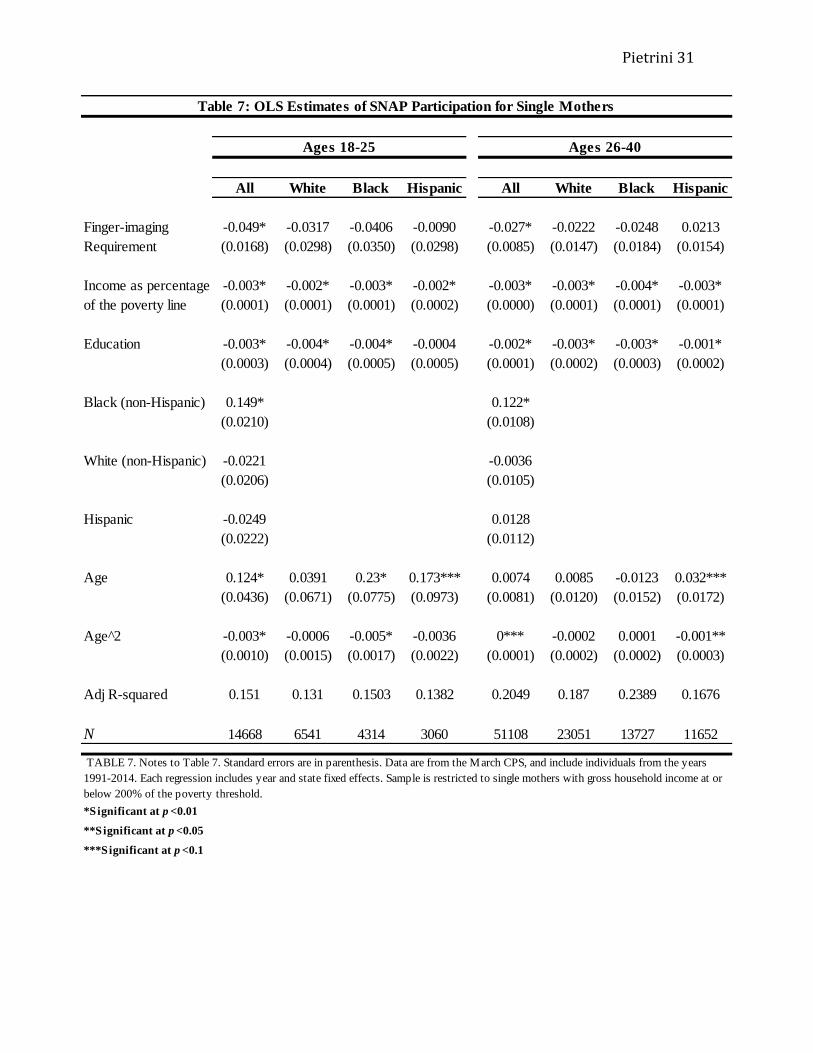
Table 7 estimates this effect for single mothers, with participation decreasing by
4.9 percentage points for single mothers ages 18 to 25 and by 2.7 percentage points for
single mothers ages 26 to 40. There is no statistically significant effect of finger-imaging
on SNAP participation within each race subsample.
B. Food Insecurity
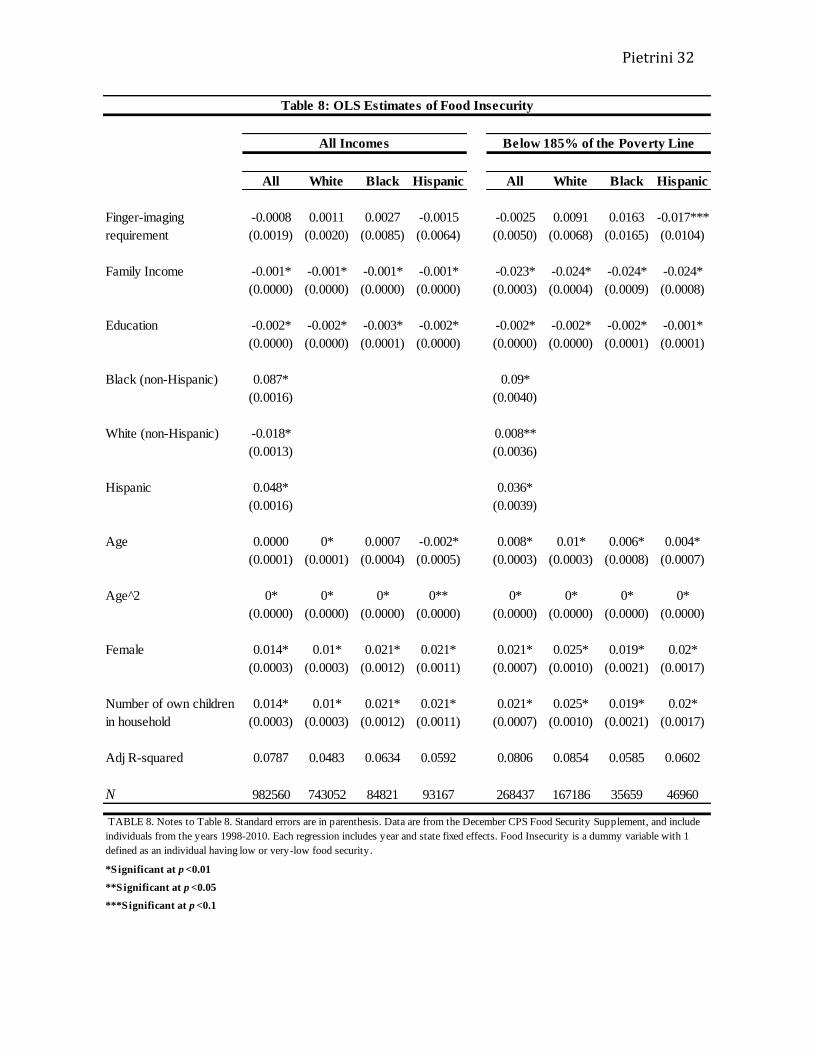
Table 8 estimates the effect of a finger-imaging requirement for SNAP on food
insecurity in adults, and finds no statistically significant relationship for adults of all
incomes and those below 185% of the poverty threshold. Only Hispanic adults under
185% of the poverty threshold had statistically significant results, with a finger-imaging
requirement decreasing the expectation of being food insecure by 1.7 percentage points.
Other results include increased food insecurity with being female and increasing the
Pietrini 16
number of own children in the household and decreased food insecurity with increasing
family income and education for all groups.
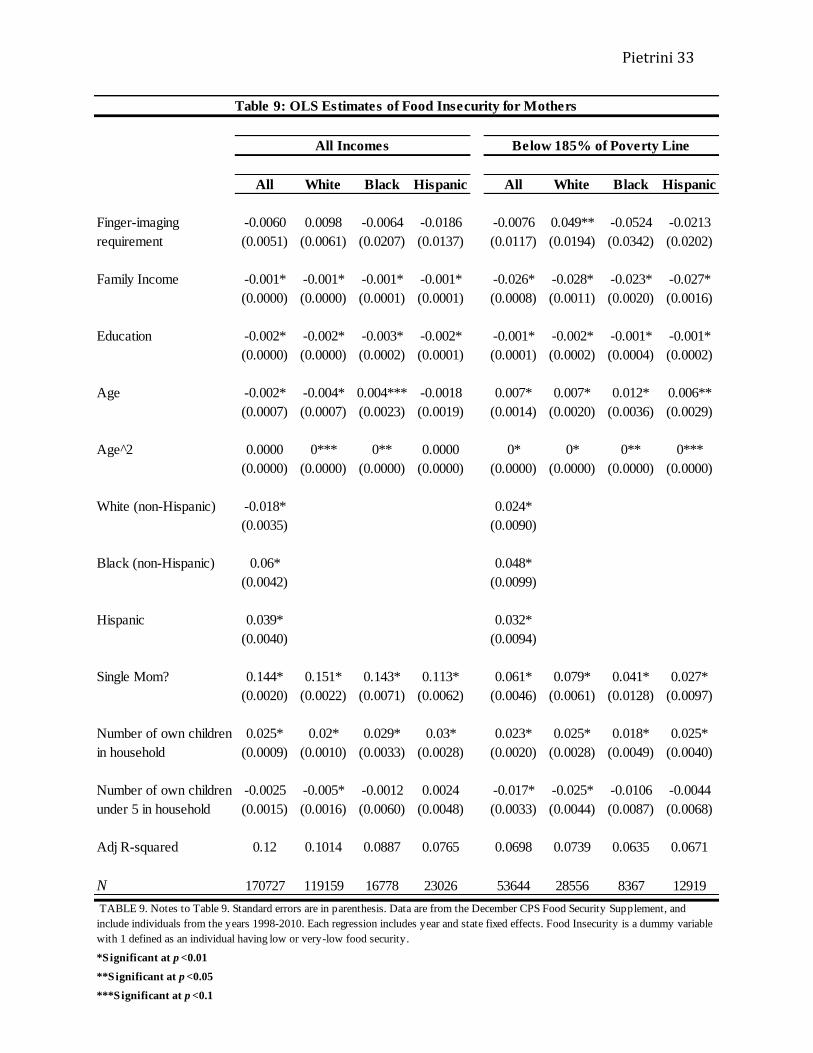
Table 9 estimates food insecurity for mothers. A finger-imaging requirement
increases food insecurity by 4.9 percentage points for white mothers. Family income and
education correlate negatively and being a single mother and increased numbers of own
children in the household correlate positively with food insecurity across all samples. For
white mothers of all incomes and below 185% of the poverty threshold and all mothers
below 185% of the poverty threshold, increasing the number of children under 5 in the
household, while holding the total number of own children in the household constant,
decreases food insecurity by 0.5, 1.7, and 2.5 percentage points, respectively. Being a
single mother is a statistically significant indicator of increased food insecurity for all in
the sample.
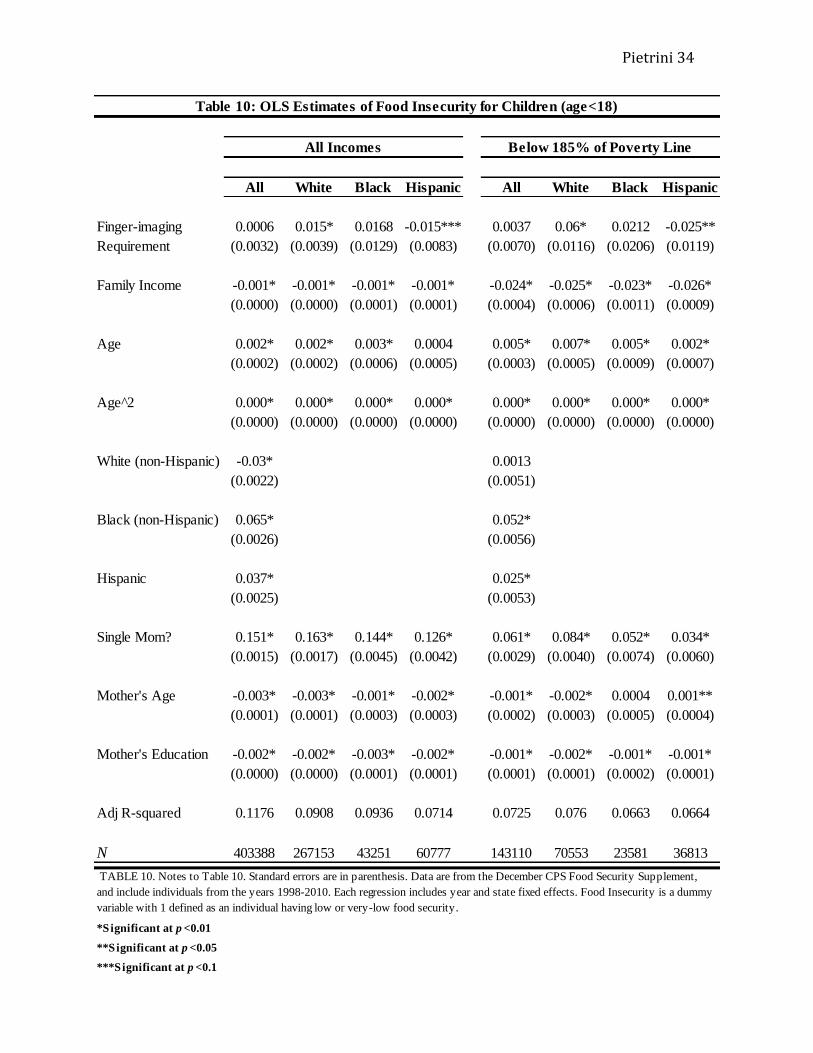
Table 10 examines food insecurity for children. A finger-imaging requirement for
food stamp participation increases food insecurity in white children of all incomes and
below 185% of the poverty threshold by 1.5 and 6 percentage points, respectively.
However, the same requirement decreases food insecurity for Hispanic children of all
incomes and below 185% of the poverty threshold by 1.5 and 2.5 percentage points. For
all children under 185% of the poverty threshold, food insecurity increases in age and if
the child has a single mother and decreases in family income, mother’s age (except for
black children), and mother’s education.
Pietrini 17
V. Discussion
The primary finding of this study - the 1.3 percentage point decrease in SNAP
participation with a finger-imaging requirement for all individuals at or below 200% of
the federal poverty threshold - is exactly in line with Ernst & Young’s (1995) initial
estimation. When separate models are estimated by race and ethnicity, I find that the
negative impact of finger-imaging on SNAP participation is present only for white
individuals. I find that a finger-imaging requirement for SNAP statistically significantly
decreases SNAP participation for white adults and children and increases food insecurity
for white mothers below 185% of the poverty threshold and white children while no
significant relationship between finger-imaging and the two measures of SNAP exists for
black individuals. These results suggest that finger-imaging does significantly increase
the costs of enrollment and recertification and disproportionately hurts white applicants’
SNAP participation and food security.
The most peculiar finding of the study is the theme of increasing SNAP
participation and decreasing food insecurity with a finger-imaging requirement for
Hispanics, which contradicts the intuitive impact of such a measure. Not only would
Hispanics incur the same increased costs and inconvenience of application and
recertification and the possible humiliation from the association between finger-imaging
and criminals as whites, but Hispanics account for 81% of the undocumented immigrants
in the US, meaning that if a significant amount of undocumented immigrants are
receiving benefits, fears over interagency sharing, specifically with the INS, should
disproportionately decrease SNAP participation for Hispanic by decreasing fraud (Passel
and Cohn 2009). However, IPUMS-CPS does not include information to determine if an
Pietrini 18
individual is an undocumented immigrant, so the extent of this effect is unknown. In
addition, a finger-imaging requirement did not affect SNAP participation and food
insecurity for black individuals.
One possible explanation for the positive impact of finger-imaging on SNAP
participation and food security for Hispanics is that the inclusion of a finger-imaging
requirement allows Hispanic applicants to prove their status as legal US residents.
Wozniak (2014) argued that drug testing provides non-using blacks an opportunity to
prove their drug-free status to employers, and found that both employment and wages for
low-skilled black men increased with pro-testing legislation. If SNAP officers
discriminate against Hispanics based on the large population of undocumented Hispanic
immigrants, especially in Arizona, Texas, and California, finger-imaging allows eligible
Hispanics to prove their citizenship status and reduce the threat of being ethnically
discriminated against, resulting in increased SNAP enrollment and decreased food
insecurity, despite other costs increasing due to finger-imaging.
In addition, finger-imaging could also benefit both blacks and Hispanics in a
similar fashion by allowing them to prove that they have never had a felony drug
conviction. In 1996, congress passed the Personal Responsibility and Work Opportunity
Reconciliation Act, which includes a ban on felony drug convicts from receiving benefits
through SNAP. In the same way drug testing helped blacks prove their status as non-
users in Wozniak’s (2014) study, Hispanics and blacks benefit from the effect of finger-
imaging on reducing discrimination by SNAP officers based upon the high proportion of
blacks and Hispanics serving jail time for drug charges relative to whites (Carson 2013).
Pietrini 19
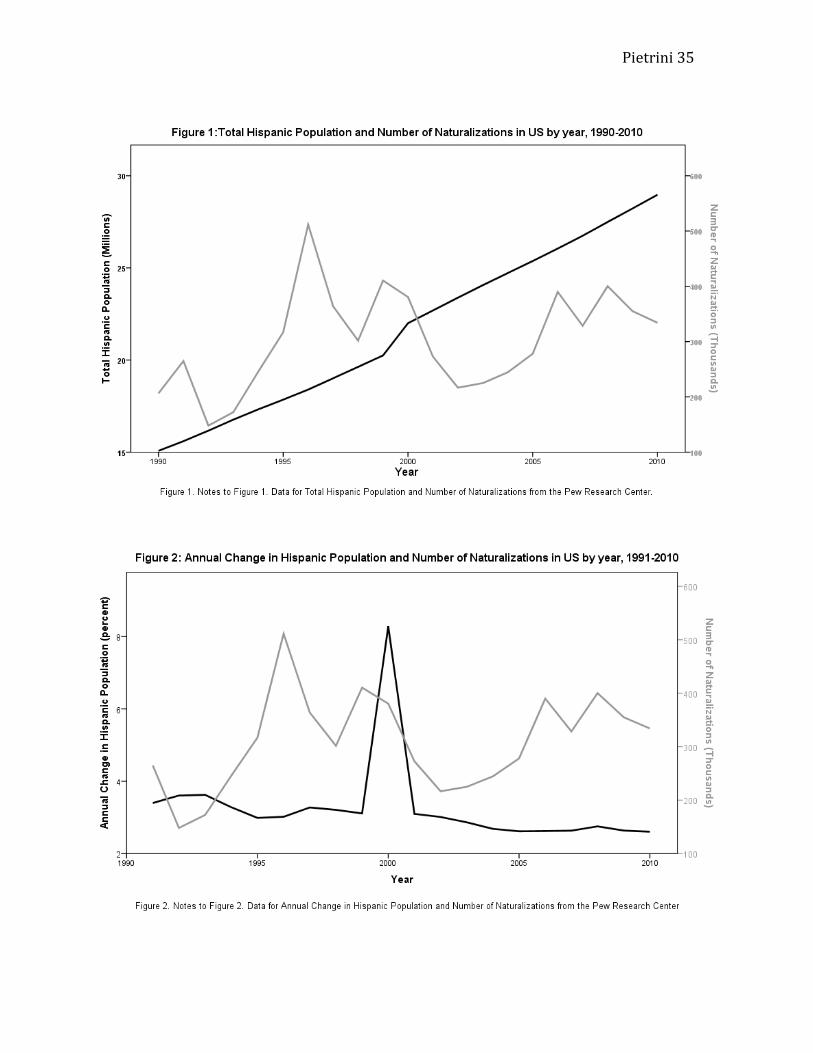
Another possible explanation of the unexpected result for Hispanics is an increase
in the number of naturalizations of illegal or legal immigrant Hispanics in the states of
interest coinciding with the implementation of statewide finger-imaging systems. In
2013, 35% of the Hispanic population in the United States was immigrants (Zong and
Batalova 2015). The naturalization rate doubled from 1995 to 2005 for eligible Mexican
immigrants, who account for the largest foreign-born population in the US, rose markedly
from 2000 to 2002 for Central American immigrants, and rose 80% from 1995 to 2005
for Caribbean immigrants (Passel 2007). Figure 1 shows sharp increases in the number of
persons naturalized in the four states with fingerprinting requirement in 1996, 1999, and
2000, years that approximately coincide with the statewide fingerprinting implementation
for all four states. The 1999-2000 jump coincides with a jump in the number of Hispanic
citizens in fingerprinting states, as shown in figure 2 with the number of Hispanic citizens
increasing by 8.3% from 1999 to 2000 while no other years show an increase above
3.6%. Considering all four states that ever used finger-imaging in SNAP are among the
top ten by Hispanics as a percent of the state population according to the 2010 census,
finger-imaging implementation for SNAP could be explained as an attempt to hinder
enrollment growth in the face of a rapid increase in the number of SNAP eligible
applicants. US citizenship is a prerequisite in most cases for SNAP eligibility, and these
results suggest that the increases in SNAP enrollment and decreases in food insecurity for
Hispanics may be due to a sharp increase in the amount of SNAP eligible Hispanics at the
same time as states implemented finger-imaging as a requirement for SNAP, rather than
Hispanics responding to the policy by increasing SNAP participation.
Pietrini 20
VI. Conclusion
In sum, I find a finger-imaging requirement significantly reduces SNAP
participation for all individuals at or below 200% and 130% of the poverty threshold by
1.3 and 1.5 percentage points, respectively. This effect increases for whites (non-
Hispanic), children, and single mothers. Finger-imaging increases food insecurity for
white mothers below 185% of the poverty threshold and white children of all incomes
and below 185% of the poverty threshold. However, Hispanics respond in the opposite
manner to a finger-imaging requirement for SNAP enrollment by increasing SNAP
participation and decreasing food insecurity. Although initially counterintuitive, the
results are likely a result of a) the ability of a finger-imaging requirement to strengthen
SNAP applications by Hispanics against discrimination from SNAP officers by affirming
legal US residence and freedom from any felony drug convictions and b) the timing of a
sharp increase in the number of US naturalization coinciding with the integration of a
finger-imaging requirement for food stamps. Since no significant relationship exists
between finger-imaging for SNAP and black (non-Hispanic) SNAP participation and
food insecurity, the capability of finger-imaging to remove doubt about eligibility based
upon one’s criminal record also likely improves SNAP participation and food security for
blacks, effectively negating the increased costs to enrollment and recertification due to
finger-imaging.
The takeaways from this study should be twofold. First, finger-imaging does
significantly increase the costs of application and recertification, as evidenced by the
decreases in SNAP participation and food security for whites, who likely experience very
little effect from reduced discrimination. Second, finger-imaging provides a measure
Pietrini 21
against discrimination from SNAP officers based upon race or ethnicity, evidenced by the
lack of an effect for blacks and the positive effect for Hispanics from finger-imaging on
SNAP participation and food security. Even if one assumes that a finger-imaging
requirement does not reduce fraud through duplicate participation, finger-imaging for
SNAP is not an unambiguously hurtful requirement for SNAP applicants, as the
increased costs are balanced for blacks and exceeded for Hispanics by the benefit of
proving further evidence of one’s US residence or lack of a criminal history. A possible
solution to the problem is to maintain finger-imaging as part of the SNAP application
process, but as an optional step designated as a way to strengthen one’s application rather
than a requirement. Potential problems include the cost of such a system and choosing to
forgo finger-imaging being seen as an admission of ineligibility by SNAP officers, and a
more thorough examination of these costs versus the benefits of optional finger-imaging
would be needed to fully explore if such a system should be instituted.
Possible future research on the subject should include exploring other fraud and
discrimination reduction measures to discover if any are successful without increasing the
costs of application and recertification. Using the same econometric method employed in
this study, decreases in overall SNAP participation could indicate if a measure increases
costs to SNAP participation and difference in SNAP participation by race could indicate
if a measure has any anti-discriminatory benefit. Comparing the results with data on the
frequency of fraud detection would verify if any measures possess the fraud and
discrimination reducing capabilities of a finger-imaging requirement without the
accompanying increased costs to participation. In addition, finding more extensive
controls for SNAP eligibility that include citizenship status would likely yield more
Pietrini 22
substantial results by removing the effect of the coinciding timing of the increase in
naturalized Hispanics with the implementation of the finger-imaging requirement, and
reveal the extent to which the surge in naturalization affected the results of this study.
Removing the effect of changes in the number of SNAP eligible individuals would more
accurately measure the increase in costs from a finger-imaging requirement against its
benefit of reducing discrimination by confirming one’s US residence and criminal record.
Furthermore, examining individual applications to SNAP offices with and without finger-
imaging requirements and determining if there is a systematic difference in acceptance
based upon a finger-imaging requirement for completed applications (to remove any
effect from the increased costs of application) of whites versus blacks or Hispanics would
further clarify the extent of discrimination in the SNAP application process and the
capability of finger-imaging to lessen such discrimination. Additionally, using a more
extensive measure of food insecurity could yield more statistically significant results, as
being on food stamps may not completely solve issues of food security, but likely reduces
the severity of the food insecurity substantially.
Pietrini 23
References:
Almond, D., Hoynes, Hilary W, & Schanzenbach, Diane. (2008). Inside the War on
Poverty The Impact of Food Stamps on Birth Outcomes (Working paper series (National
Bureau of Economic Research) ; no. w14306). Cambridge, Mass: National Bureau of
Economic Research.
Aussenberg, R. (2014). Supplemental Nutrition Assistance Program (SNAP): A Primer
on Eligibility and Benefits.
Bartlett, S., & Burstein, N. (2004). Food Stamp Program Access Study: Eligible
Nonparticipants. Food Assistance and Nutrition Program.
Bartlett, S., Burnstein, N., & Hamilton, W. (2004). Food Stamp Program Access Study:
Final Report. Food Assistance and Nutrition Program.
Ben-Shalom, Y., Moffitt, Robert A, & Scholz, John Karl. (2011). An Assessment of the
Effectiveness of Anti-Poverty Programs in the United States (Working paper series
(National Bureau of Economic Research) ; no. w17042). Cambridge, Mass: National
Bureau of Economic Research.
Carson, E. (2013, September 30). Prisoners in 2013. Retrieved from
http://www.bjs.gov/index.cfm?ty=pbdetail&iid=5109
Economic Research Service (ERS), U.S. Department of Agriculture (USDA). SNAP
Policy Database. http://www.ers.usda.gov/data-products/snap-policy-database.aspx
Gonzalez-Barrera, A., Lopez, M., Passel, J., & Taylor, P. (2013). The Path Not Taken.
Pew Hispanic Center.
Mabli, J., Ohls, J., Dragoset, L., Castner, L., & Santos, B. (2013). Measuring the Effect of
Supplemental Nutrition Assistance Program (SNAP) Participation on Food Security.
Maryns, N. (2008). Access and Access Barriers to Getting Food Stamps: A Review of the
Literature. Food Research and Access Center.
Passel, J. (2007, March 28). Growing Share of Immigrants Choosing Naturalization. Pew
Hispanic Center.
Passel, J. (2009, April 1). A Portrait of Unauthorized Immigrants in the United States.
Pew Hispanic Center
Policy Basics: The Earned Income Tax Credit. (2015). Center on Budget and Policy
Priorities.
Pietrini 24
Ratcliffe, C., Mckernan, S., & Finegold, K. (2008). Effects of Food Stamp and TANF
Policies on Food Stamp Receipt. Social Service Review, 82(2), 291-334.
Rosenbaum, D. (2013, March 11). SNAP Is Effective and Efficient.
Sticha, P., Thomas, D., Zamberlan, C., & Gribben, M. (1999). Use of Biometric
Identification Technology to Reduce Fraud in the food Stamp Program: Final Report.
U.S. Department of Agriculture.
Sticha, P., & Ford, J. (1999). Introduction to Biometric Identification Technology:
Capabilities and Applications to the Food Stamp Program. U.S. Department of
Agriculture.
Trisi, D. (n.d.). SNAP and Unemployment Insurance Kept Millions out of Poverty Last
Year, Census Supplemental Poverty Measure Shows. Center on Budget and Policy
Priorities.
Wozniak, A. (2013). Discrimination and the Effects of Drug Testing on Black
Employment. SSRN Working Paper Series,SSRN Working Paper Series, May 2013.
Zong, J., & Batalova, J. (2015, February 1). Frequently Requested Statistics on
Immigrants and Immigration in the United States. Migration Policy Institute.
Pietrini 25
Finger-imaging
Full Sample Required
March Current Population Survey (CPS) [1991-2014]
Observations (person/year) 58,484 8,764
% Finger-Imaging Requirement 15.0% 100%
Average Age 31.50 29.82
% White (Non-Hispanic) 50.2% 24.6%
% Black (Non-Hispanic) 16.3% 10.7%
% Hispanic 25.9% 57.2%
% Other Race 7.5% 7.4%
% Female 55.1% 54.1%
Average Number of Children in Own Household 0.60 0.67
Average Number of Children Under 5 in Own Household 0.15 0.15
Average Income as a Percentage of the Poverty Threshold 110.60 107.89
December Current Population Survey (CPS) Food Security Supplement [1998-2010]
Observations (person/year) 115,044 15,591
% Finger-Imaging Requirement 13.5% 100%
% Food Insecure 12.6% 14.5%
Average Age 37.0 35.2
% White (Non-Hispanic) 72.6% 52.1%
% Black (Non-Hispanic) 9.4% 8.2%
% Hispanic 11.3% 30.7%
% Other race 6.7% 9.0%
% Female 51.6% 51.7%
Average Number of Children in Own Household 0.54 0.59
Average Number of Children Under 5 in Own Household 0.11 0.12
Table 1: Sample Characteristics
Variable
Notes to Table 1. Sample from the March CPS is restricted to individuals at or below 200 percent of the poverty threshold. Finger-
imaging required restricts sample to time and state when finger-imaging was required for SNAP participation.
Pietrini 26
Start End
Arizona
ALL July-98 Still in effect
California
ALL August-00 January-12
Los Angeles April-91
Almeda February-93
Contra Costa January-95
San Francisco January-95
Orange January-96
San Diego January-96
San Bernadino January-96
New York
ALL January-96 May-07
New York City January-12
Texas
ALL August-99 August-11
Bexar October-96
Guadalupe October-96
State & County
Table 2: Timing of the Finger-Imaging Requirement for SNAP
Eligibility by State and County
Pietrini 27
All White Black Hispanic All White Black Hispanic
Finger-imaging -0.013* -0.016* 0.0020 0.01* -0.015* -0.018* 0.0030 0.0031
requirement (0.0014) (0.0022) (0.0046) (0.0025) (0.0020) (0.0034) (0.0059) (0.0035)
Income as percentage -0.002* -0.002* -0.003* -0.002* -0.001* -0.001* -0.002* -0.002*
of the poverty line (0.0000) (0.0000) (0.0000) (0.0000) (0.0000) (0.0000) (0.0000) (0.0000)
Education -0.002* -0.002* -0.002* -0.001* -0.002* -0.003* -0.002* -0.001*
(0.0000) (0.0000) (0.0000) (0.0000) (0.0000) (0.0000) (0.0001) (0.0000)
Black (non-Hispanic) 0.129* 0.151*
(0.0016) (0.0023)
White (non-Hispanic) -0.018* -0.021*
(0.0015) (0.0022)
Hispanic 0.015* 0.012*
(0.0016) (0.0023)
Age 0.002* 0.004* 0.002* -0.003* 0.003* 0.006* 0.002* -0.003*
(0.0001) (0.0001) (0.0002) (0.0001) (0.0001) (0.0002) (0.0003) (0.0002)
Age^2 0* 0* 0* 0* 0* 0* 0* 0*
(0.0000) (0.0000) (0.0000) (0.0000) (0.0000) (0.0000) (0.0000) (0.0000)
Female 0.032* 0.024* 0.06* 0.03* 0.05* 0.041* 0.081* 0.044*
(0.0007) (0.0009) (0.0019) (0.0014) (0.0010) (0.0015) (0.0024) (0.0019)
Adj R-squared 0.1665 0.1339 0.1863 0.1441 0.1214 0.1045 0.1219 0.0973
N 1403599 705084 229258 363783 822434 371224 156230 230149
*Significant at p <0.01
**Significant at p <0.05
***Significant at p <0.1
Table 3: OLS Estimates of SNAP Participation
Below 130% of the Poverty LineBelow 200% of the Poverty Line
TABLE 3. Notes to Table 3. Standard errors are in parenthesis. Data are from the March CPS, and include individuals from the years 1991-
2014. Each regression includes year and state fixed effects.
Pietrini 28
All White Black Hispanic All White Black Hispanic
Finger-imaging -0.008* -0.01* 0.0069 0.012* -0.009* -0.009** 0.0097 0.0058
requirement (0.0017) (0.0024) (0.0057) (0.0032) (0.0025) (0.0039) (0.0075) (0.0045)
Income as percentage -0.002* -0.001* -0.002* -0.002* -0.001* 0* -0.001* -0.001*
of the poverty line (0.0000) (0.0000) (0.0000) (0.0000) (0.0000) (0.0000) (0.0000) (0.0000)
Education -0.002* -0.002* -0.003* 0* -0.002* -0.003* -0.003* 0*
(0.0000) (0.0000) (0.0001) (0.0000) (0.0000) (0.0000) (0.0001) (0.0000)
Black (non-Hispanic) 0.126* 0.151*
(0.0020) (0.0029)
White (non-Hispanic) -0.0018 0.0000
(0.0018) (0.0026)
Hispanic 0.006* 0.0013
(0.0019) (0.0029)
Age 0.001* 0.003* -0.001* -0.005* 0.002* 0.007* -0.0002 -0.007*
(0.0001) (0.0001) (0.0004) (0.0003) (0.0002) (0.0002) (0.0005) (0.0004)
Age^2 0.000* 0.000* 0.000* 0.000* 0.000* 0.000* 0.000* 0.000*
(0.0000) (0.0000) (0.0000) (0.0000) (0.0000) (0.0000) (0.0000) (0.0000)
Female 0.04* 0.03* 0.076* 0.04* 0.06* 0.046* 0.101* 0.058*
(0.0008) (0.0010) (0.0025) (0.0018) (0.0013) (0.0017) (0.0033) (0.0026)
Number of own children 0.041* 0.04* 0.048* 0.038* 0.058* 0.064* 0.059* 0.054*
in household (0.0003) (0.0005) (0.0010) (0.0007) (0.0005) (0.0008) (0.0012) (0.0009)
Adj R-squared 0.1401 0.1241 0.1571 0.1189 0.1196 0.1176 0.1222 0.0951
N 896809 481959 139713 209193 503148 248208 90418 125074
*Significant at p <0.01
**Significant at p <0.05
***Significant at p <0.1
Below 200% of the Poverty Line Below 130% of the Poverty Line
Table 4: OLS Estimates of SNAP Participation for Adults (age≥18)
TABLE 4. Notes to Table 4. Standard errors are in parenthesis. Data are from the March CPS, and include individuals from the years 1991-
2014. Each regression includes year and state fixed effects.
Pietrini 29
All White Black Hispanic All White Black Hispanic
Finger-imaging -0.015* -0.024* -0.0020 0.011* -0.016* -0.029* -0.0069 0.0068
requirement (0.0025) (0.0045) (0.0077) (0.0040) (0.0034) (0.0070) (0.0094) (0.0053)
Income as percentage -0.003* -0.003* -0.003* -0.003* -0.002* -0.002* -0.003* -0.003*
of the poverty line (0.0000) (0.0000) (0.0000) (0.0000) (0.0000) (0.0000) (0.0001) (0.0000)
Black (non-Hispanic) 0.084* 0.092*
(0.0029) (0.0040)
White (non-Hispanic) -0.039* -0.046*
(0.0027) (0.0038)
Hispanic -0.042* -0.052*
(0.0028) (0.0039)
Age 0.004* 0.004* 0.005* 0.004* 0.007* 0.009* 0.008* 0.007*
(0.0004) (0.0006) (0.0011) (0.0008) (0.0006) (0.0010) (0.0013) (0.0010)
Age^2 0* 0* 0* 0* 0* 0* 0* 0*
(0.0000) (0.0000) (0.0001) (0.0000) (0.0000) (0.0001) (0.0001) (0.0001)
Female 0.0016 -0.0029 0.005*** 0.005** 0.0025 -0.005*** 0.007*** 0.007**
(0.0012) (0.0018) (0.0031) (0.0022) (0.0017) (0.0029) (0.0037) (0.0030)
Mother's Age -0.006* -0.006* -0.006* -0.003* -0.006* -0.007* -0.006* -0.003*
(0.0001) (0.0001) (0.0002) (0.0002) (0.0001) (0.0002) (0.0003) (0.0002)
Mother's Education -0.002* -0.003* -0.003* 0* -0.002* -0.004* -0.003* 0*
(0.0000) (0.0001) (0.0001) (0.0000) (0.0000) (0.0001) (0.0001) (0.0001)
Single Mother? 0.117* 0.094* 0.098* 0.142* 0.147* 0.121* 0.124* 0.163*
(0.0014) (0.0020) (0.0034) (0.0027) (0.0019) (0.0030) (0.0042) (0.0034)
Adj R-squared 0.2418 0.2134 0.261 0.2097 0.1405 0.1115 0.141 0.1412
N 458014 202614 78387 142503 282960 282960 57210 95909
*Significant at p <0.01
**Significant at p <0.05
***Significant at p <0.1
TABLE 5. Notes to Table 5. Standard errors are in parenthesis. Data are from the March CPS, and include individuals from the years
1991-2014. Each regression includes year and state fixed effects.
Below 200% of the Poverty Line Below 130% of the Poverty Line
Table 5: OLS Estimates of SNAP Participation for Children (age≤18)
Pietrini 30
All White Black Hispanic All White Black Hispanic
Finger-imaging -0.013* -0.026* -0.0009 0.03* -0.015* -0.022** -0.0075 0.027*
requirement (0.0045) (0.0085) (0.0096) (0.0077) (0.0053) (0.0109) (0.0108) (0.0087)
Income as percentage -0.003* -0.003* -0.004* -0.003* -0.002* -0.002* -0.003* -0.002*
of the poverty line (0.0000) (0.0000) (0.0000) (0.0000) (0.0000) (0.0001) (0.0001) (0.0001)
Black (non-Hispanic) 0.078* 0.084*
(0.0051) (0.0061)
White (non-Hispanic) -0.064* -0.074*
(0.0050) (0.0060)
Hispanic -0.021* -0.025*
(0.0053) (0.0063)
Age 0.008* 0.006* 0.007* 0.012* 0.011* 0.01* 0.011* 0.015*
(0.0008) (0.0013) (0.0014) (0.0016) (0.0009) (0.0016) (0.0015) (0.0018)
Age^2 0* 0* 0* -0.001* -0.001* -0.001* -0.001* -0.001*
(0.0000) (0.0001) (0.0001) (0.0001) (0.0000) (0.0001) (0.0001) (0.0001)
Female -0.0021 -0.009** 0.0018 -0.0012 -0.0028 -0.012* 0.0026 -0.0033
(0.0021) (0.0034) (0.0038) (0.0043) (0.0025) (0.0044) (0.0043) (0.0049)
Mother's Age -0.005* -0.004* -0.006* -0.004* -0.006* -0.004* -0.007* -0.004*
(0.0002) (0.0003) (0.0003) (0.0003) (0.0002) (0.0003) (0.0003) (0.0004)
Mother's Education -0.002* -0.004* -0.002* -0.001* -0.002* -0.004* -0.003* -0.001*
(0.0001) (0.0001) (0.0001) (0.0001) (0.0001) (0.0001) (0.0001) (0.0001)
Adj R-squared 0.2139 0.1955 0.2322 0.1743 0.107 0.0957 0.1137 0.0938
N 174440 67563 50493 44344 133405 47370 40723 36197
*Significant at p <0.01
**Significant at p <0.05
***Significant at p <0.1
Table 6: OLS Estimates of SNAP participation for Children (age≤18) with a Single Mother
Below 200% of the Poverty Line Below 130% of the Poverty Line
TABLE 6. Notes to Table 6. Standard errors are in parenthesis. Data are from the March CPS, and include individuals from the years
1991-2014. Each regression includes year and state fixed effects.
Pietrini 31
All White Black Hispanic All White Black Hispanic
Finger-imaging -0.049* -0.0317 -0.0406 -0.0090 -0.027* -0.0222 -0.0248 0.0213
Requirement (0.0168) (0.0298) (0.0350) (0.0298) (0.0085) (0.0147) (0.0184) (0.0154)
Income as percentage -0.003* -0.002* -0.003* -0.002* -0.003* -0.003* -0.004* -0.003*
of the poverty line (0.0001) (0.0001) (0.0001) (0.0002) (0.0000) (0.0001) (0.0001) (0.0001)
Education -0.003* -0.004* -0.004* -0.0004 -0.002* -0.003* -0.003* -0.001*
(0.0003) (0.0004) (0.0005) (0.0005) (0.0001) (0.0002) (0.0003) (0.0002)
Black (non-Hispanic) 0.149* 0.122*
(0.0210) (0.0108)
White (non-Hispanic) -0.0221 -0.0036
(0.0206) (0.0105)
Hispanic -0.0249 0.0128
(0.0222) (0.0112)
Age 0.124* 0.0391 0.23* 0.173*** 0.0074 0.0085 -0.0123 0.032***
(0.0436) (0.0671) (0.0775) (0.0973) (0.0081) (0.0120) (0.0152) (0.0172)
Age^2 -0.003* -0.0006 -0.005* -0.0036 0*** -0.0002 0.0001 -0.001**
(0.0010) (0.0015) (0.0017) (0.0022) (0.0001) (0.0002) (0.0002) (0.0003)
Adj R-squared 0.151 0.131 0.1503 0.1382 0.2049 0.187 0.2389 0.1676
N 14668 6541 4314 3060 51108 23051 13727 11652
*Significant at p <0.01
**Significant at p <0.05
***Significant at p <0.1
Table 7: OLS Estimates of SNAP Participation for Single Mothers
Ages 18-25 Ages 26-40
TABLE 7. Notes to Table 7. Standard errors are in parenthesis. Data are from the March CPS, and include individuals from the years
1991-2014. Each regression includes year and state fixed effects. Sample is restricted to single mothers with gross household income at or
below 200% of the poverty threshold.
Pietrini 32
All White Black Hispanic All White Black Hispanic
Finger-imaging -0.0008 0.0011 0.0027 -0.0015 -0.0025 0.0091 0.0163 -0.017***
requirement (0.0019) (0.0020) (0.0085) (0.0064) (0.0050) (0.0068) (0.0165) (0.0104)
Family Income -0.001* -0.001* -0.001* -0.001* -0.023* -0.024* -0.024* -0.024*
(0.0000) (0.0000) (0.0000) (0.0000) (0.0003) (0.0004) (0.0009) (0.0008)
Education -0.002* -0.002* -0.003* -0.002* -0.002* -0.002* -0.002* -0.001*
(0.0000) (0.0000) (0.0001) (0.0000) (0.0000) (0.0000) (0.0001) (0.0001)
Black (non-Hispanic) 0.087* 0.09*
(0.0016) (0.0040)
White (non-Hispanic) -0.018* 0.008**
(0.0013) (0.0036)
Hispanic 0.048* 0.036*
(0.0016) (0.0039)
Age 0.0000 0* 0.0007 -0.002* 0.008* 0.01* 0.006* 0.004*
(0.0001) (0.0001) (0.0004) (0.0005) (0.0003) (0.0003) (0.0008) (0.0007)
Age^2 0* 0* 0* 0** 0* 0* 0* 0*
(0.0000) (0.0000) (0.0000) (0.0000) (0.0000) (0.0000) (0.0000) (0.0000)
Female 0.014* 0.01* 0.021* 0.021* 0.021* 0.025* 0.019* 0.02*
(0.0003) (0.0003) (0.0012) (0.0011) (0.0007) (0.0010) (0.0021) (0.0017)
Number of own children 0.014* 0.01* 0.021* 0.021* 0.021* 0.025* 0.019* 0.02*
in household (0.0003) (0.0003) (0.0012) (0.0011) (0.0007) (0.0010) (0.0021) (0.0017)
Adj R-squared 0.0787 0.0483 0.0634 0.0592 0.0806 0.0854 0.0585 0.0602
N 982560 743052 84821 93167 268437 167186 35659 46960
*Significant at p <0.01
**Significant at p <0.05
***Significant at p <0.1
All Incomes Below 185% of the Poverty Line
TABLE 8. Notes to Table 8. Standard errors are in parenthesis. Data are from the December CPS Food Security Supplement, and include
individuals from the years 1998-2010. Each regression includes year and state fixed effects. Food Insecurity is a dummy variable with 1
defined as an individual having low or very-low food security.
Table 8: OLS Estimates of Food Insecurity
Pietrini 33
All White Black Hispanic All White Black Hispanic
Finger-imaging -0.0060 0.0098 -0.0064 -0.0186 -0.0076 0.049** -0.0524 -0.0213
requirement (0.0051) (0.0061) (0.0207) (0.0137) (0.0117) (0.0194) (0.0342) (0.0202)
Family Income -0.001* -0.001* -0.001* -0.001* -0.026* -0.028* -0.023* -0.027*
(0.0000) (0.0000) (0.0001) (0.0001) (0.0008) (0.0011) (0.0020) (0.0016)
Education -0.002* -0.002* -0.003* -0.002* -0.001* -0.002* -0.001* -0.001*
(0.0000) (0.0000) (0.0002) (0.0001) (0.0001) (0.0002) (0.0004) (0.0002)
Age -0.002* -0.004* 0.004*** -0.0018 0.007* 0.007* 0.012* 0.006**
(0.0007) (0.0007) (0.0023) (0.0019) (0.0014) (0.0020) (0.0036) (0.0029)
Age^2 0.0000 0*** 0** 0.0000 0* 0* 0** 0***
(0.0000) (0.0000) (0.0000) (0.0000) (0.0000) (0.0000) (0.0000) (0.0000)
White (non-Hispanic) -0.018* 0.024*
(0.0035) (0.0090)
Black (non-Hispanic) 0.06* 0.048*
(0.0042) (0.0099)
Hispanic 0.039* 0.032*
(0.0040) (0.0094)
Single Mom? 0.144* 0.151* 0.143* 0.113* 0.061* 0.079* 0.041* 0.027*
(0.0020) (0.0022) (0.0071) (0.0062) (0.0046) (0.0061) (0.0128) (0.0097)
Number of own children 0.025* 0.02* 0.029* 0.03* 0.023* 0.025* 0.018* 0.025*
in household (0.0009) (0.0010) (0.0033) (0.0028) (0.0020) (0.0028) (0.0049) (0.0040)
Number of own children -0.0025 -0.005* -0.0012 0.0024 -0.017* -0.025* -0.0106 -0.0044
under 5 in household (0.0015) (0.0016) (0.0060) (0.0048) (0.0033) (0.0044) (0.0087) (0.0068)
Adj R-squared 0.12 0.1014 0.0887 0.0765 0.0698 0.0739 0.0635 0.0671
N 170727 119159 16778 23026 53644 28556 8367 12919
*Significant at p <0.01
**Significant at p <0.05
***Significant at p <0.1
All Incomes Below 185% of Poverty Line
Table 9: OLS Estimates of Food Insecurity for Mothers
TABLE 9. Notes to Table 9. Standard errors are in parenthesis. Data are from the December CPS Food Security Supplement, and
include individuals from the years 1998-2010. Each regression includes year and state fixed effects. Food Insecurity is a dummy variable
with 1 defined as an individual having low or very-low food security.
Pietrini 34
All White Black Hispanic All White Black Hispanic
Finger-imaging 0.0006 0.015* 0.0168 -0.015*** 0.0037 0.06* 0.0212 -0.025**
Requirement (0.0032) (0.0039) (0.0129) (0.0083) (0.0070) (0.0116) (0.0206) (0.0119)
Family Income -0.001* -0.001* -0.001* -0.001* -0.024* -0.025* -0.023* -0.026*
(0.0000) (0.0000) (0.0001) (0.0001) (0.0004) (0.0006) (0.0011) (0.0009)
Age 0.002* 0.002* 0.003* 0.0004 0.005* 0.007* 0.005* 0.002*
(0.0002) (0.0002) (0.0006) (0.0005) (0.0003) (0.0005) (0.0009) (0.0007)
Age^2 0.000* 0.000* 0.000* 0.000* 0.000* 0.000* 0.000* 0.000*
(0.0000) (0.0000) (0.0000) (0.0000) (0.0000) (0.0000) (0.0000) (0.0000)
White (non-Hispanic) -0.03* 0.0013
(0.0022) (0.0051)
Black (non-Hispanic) 0.065* 0.052*
(0.0026) (0.0056)
Hispanic 0.037* 0.025*
(0.0025) (0.0053)
Single Mom? 0.151* 0.163* 0.144* 0.126* 0.061* 0.084* 0.052* 0.034*
(0.0015) (0.0017) (0.0045) (0.0042) (0.0029) (0.0040) (0.0074) (0.0060)
Mother's Age -0.003* -0.003* -0.001* -0.002* -0.001* -0.002* 0.0004 0.001**
(0.0001) (0.0001) (0.0003) (0.0003) (0.0002) (0.0003) (0.0005) (0.0004)
Mother's Education -0.002* -0.002* -0.003* -0.002* -0.001* -0.002* -0.001* -0.001*
(0.0000) (0.0000) (0.0001) (0.0001) (0.0001) (0.0001) (0.0002) (0.0001)
Adj R-squared 0.1176 0.0908 0.0936 0.0714 0.0725 0.076 0.0663 0.0664
N 403388 267153 43251 60777 143110 70553 23581 36813
*Significant at p <0.01
**Significant at p <0.05
***Significant at p <0.1
All Incomes Below 185% of Poverty Line
Table 10: OLS Estimates of Food Insecurity for Children (age<18)
TABLE 10. Notes to Table 10. Standard errors are in parenthesis. Data are from the December CPS Food Security Supplement,
and include individuals from the years 1998-2010. Each regression includes year and state fixed effects. Food Insecurity is a dummy
variable with 1 defined as an individual having low or very-low food security.
Pietrini 35