Embed Size (px)
Citation preview

Evaluating the Effect of
Advance Yield Markings and
Symbolic Signs on Vehicle-
Pedestrian Conflicts at Marked
Midblock Crosswalks across
Multilane Roads
February 2016
Charles D. Baker, Governor
Karyn E. Polito, Lieutenant Governor
Stephanie Pollack, MassDOT Secretary & CEO


i
Technical Report Document Page
1. Report No.
SPRII.2.05.28 2. Government Accession No.
N/A 3. Recipient's Catalog No.
N/A
4. Title and Subtitle
Evaluating the Effect of Advance Yield Markings and Symbolic Signs on Vehicle Pedestrian Conflicts at Marked Midblock Crosswalks across Multilane Roads
5. Report Date
February 2016
6. Performing Organization Code
7. Author(s)
Donald L. Fisher, John Collura, Matthew R. E. Romoser, Michael Knodler, Radha Gomez, Siby Samuel, Luis Roman, Mal Abdul
8. Performing Organization Report No.
UMTC-11.01
9. Performing Organization Name and Address
University of Massachusetts Amherst 214 Marston Hall Amherst, MA 01003
10. Work Unit No. (TRAIS)
11. Contract or Grant No.
ISA #58738 12. Sponsoring Agency Name and Address
Massachusetts Department of Transportation Office of Transportation Planning 10 Park Plaza, Suite 4150 Boston, MA, 02116
13. Type of Report and Period Covered
Final Report: July 2009 –September 2011
14. Sponsoring Agency Code
15. Supplementary Notes
16. Abstract
The Commonwealth of Massachusetts has made walkable communities a priority. Pedestrian safety is key to the success of this objective. Pedestrians are at high risk when traversing unsignalized, marked crosswalks located either midblock or at T-intersections, especially when a vehicle adjacent to the driver blocks his or her view of a crossing pedestrian. A number of treatments have been proposed to reduce crashes at such crosswalks under these conditions. In four experiments, two performed on a driving simulator and two conducted on streets in the town of Greenfield, Massachusetts, the behavior of drivers exposed to modified standard yield markings (MSYM) was compared with the behavior of drivers exposed to “advance yield markings” (AYM). AYMs consist of a line of white triangles twenty to fifty feet in advance of the crosswalk. A sign indicating that drivers should yield at the markings accompanies the markings. On all measures of safety, the AYMs were superior to MSYMs at midblock crosswalks and T-intersections. Moreover, at T-intersections, pedestrians were safer when the mainline crosswalk was located at the far side of the cross street rather than the near side.
17. Key Word
Crosswalks, Advance Yield Markings, Pedestrian Safety, Midblock, Scanning, Yielding
18. Distribution Statement
19. Security Classif. (of this report)
Unclassified 20. Security Classif. (of this page)
Unclassified 21. No. of Pages
68 22. Price
N/A
Form DOT F 1700.7 (8-72) Reproduction of completed page authorized

ii
This page left intentionally blank.

iii
Evaluating the Effect of Advance Yield Markings and Symbolic Signs on Vehicle Pedestrian Conflicts at
Marked Midblock Crosswalks across Multilane Roads
Final Report
Prepared By:
Principal Investigators: Donald L. Fisher, PhD
John Collura, PhD, P.E.
Contributing Authors: Mal Abdul
Radha Gomez Michael Knodler
Luis Roman Matthew R.E. Romoser
Silby Samuel
University of Massachusetts Amherst 214 Marston Hall
Amherst, MA 01003
Prepared For:
Massachusetts Department of Transportation Office for Transportation Planning
10 Park Plaza, Suite 4150 Boston, MA 02116
February 2016

iv
This page left intentionally blank.

v
Acknowledgements
Prepared in cooperation with the Massachusetts Department of Transportation, Office of Transportation Planning, and the United States Department of Transportation, Federal Highway Administration. The Project Team would like to acknowledge the efforts of Larry Petrin and the members of the Town of Greenfield Department of Public Works for all of their assistance with preparing crosswalks and arranging for the installation of signs for this experiment. We would also like to thank Chief of Police David Guilbault of the Greenfield Police Department and the detail officers who kept our graduate students and other pedestrians safe during the field experiment. Finally, the team would like to thank the Massachusetts Department of Transportation for their sponsorship of this important work.
Disclaimers
The contents of this report reflect the views of the authors, who are responsible for the facts and the accuracy of the data presented herein. The contents do not necessarily reflect the official view or policies of the Massachusetts Department of Transportation or the Federal Highway Administration. This report does not constitute a standard, specification, or regulation. Use of trade names in this publication is solely for identification. No endorsement of the product(s) named is implied by the University of Massachusetts, the Massachusetts Department of Transportation, the United States Department of Transportation or the Federal Highway Administration, nor is any discrimination intended to the exclusion of similar products not named.

vi
This page left intentionally blank.
vii
Executive Summary
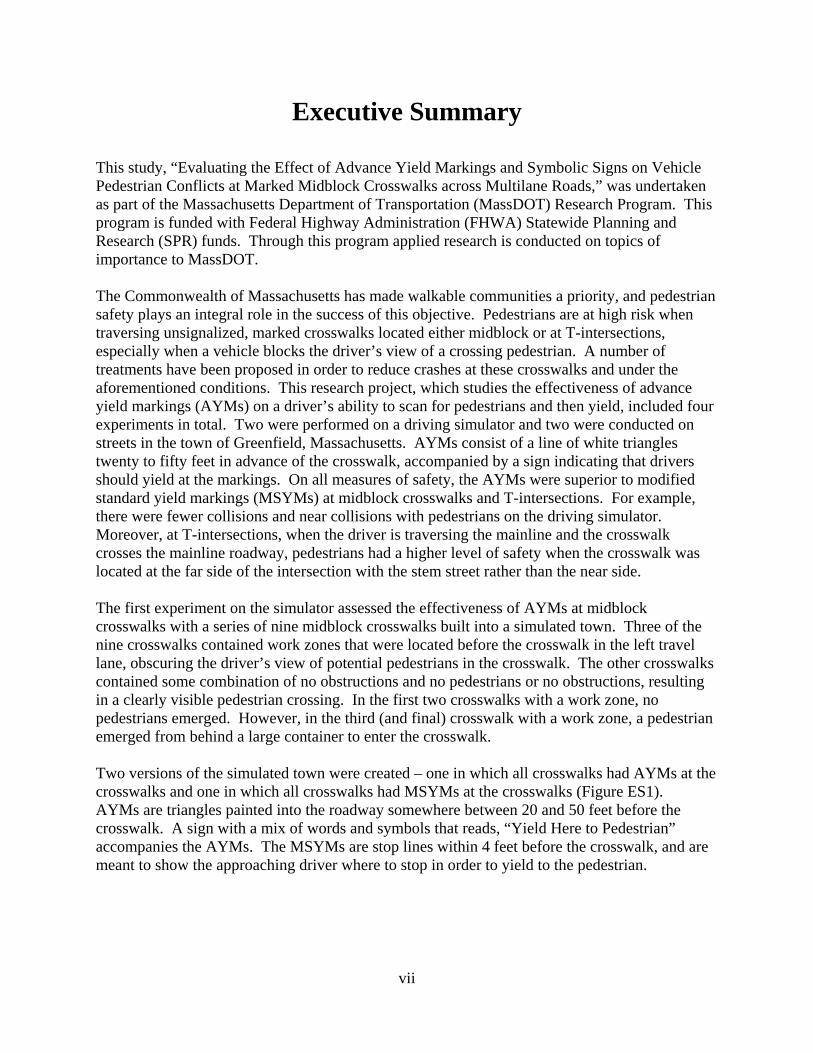
This study, “Evaluating the Effect of Advance Yield Markings and Symbolic Signs on Vehicle Pedestrian Conflicts at Marked Midblock Crosswalks across Multilane Roads,” was undertaken as part of the Massachusetts Department of Transportation (MassDOT) Research Program. This program is funded with Federal Highway Administration (FHWA) Statewide Planning and Research (SPR) funds. Through this program applied research is conducted on topics of importance to MassDOT. The Commonwealth of Massachusetts has made walkable communities a priority, and pedestrian safety plays an integral role in the success of this objective. Pedestrians are at high risk when traversing unsignalized, marked crosswalks located either midblock or at T-intersections, especially when a vehicle blocks the driver’s view of a crossing pedestrian. A number of treatments have been proposed in order to reduce crashes at these crosswalks and under the aforementioned conditions. This research project, which studies the effectiveness of advance yield markings (AYMs) on a driver’s ability to scan for pedestrians and then yield, included four experiments in total. Two were performed on a driving simulator and two were conducted on streets in the town of Greenfield, Massachusetts. AYMs consist of a line of white triangles twenty to fifty feet in advance of the crosswalk, accompanied by a sign indicating that drivers should yield at the markings. On all measures of safety, the AYMs were superior to modified standard yield markings (MSYMs) at midblock crosswalks and T-intersections. For example, there were fewer collisions and near collisions with pedestrians on the driving simulator. Moreover, at T-intersections, when the driver is traversing the mainline and the crosswalk crosses the mainline roadway, pedestrians had a higher level of safety when the crosswalk was located at the far side of the intersection with the stem street rather than the near side. The first experiment on the simulator assessed the effectiveness of AYMs at midblock crosswalks with a series of nine midblock crosswalks built into a simulated town. Three of the nine crosswalks contained work zones that were located before the crosswalk in the left travel lane, obscuring the driver’s view of potential pedestrians in the crosswalk. The other crosswalks contained some combination of no obstructions and no pedestrians or no obstructions, resulting in a clearly visible pedestrian crossing. In the first two crosswalks with a work zone, no pedestrians emerged. However, in the third (and final) crosswalk with a work zone, a pedestrian emerged from behind a large container to enter the crosswalk. Two versions of the simulated town were created – one in which all crosswalks had AYMs at the crosswalks and one in which all crosswalks had MSYMs at the crosswalks (Figure ES1). AYMs are triangles painted into the roadway somewhere between 20 and 50 feet before the crosswalk. A sign with a mix of words and symbols that reads, “Yield Here to Pedestrian” accompanies the AYMs. The MSYMs are stop lines within 4 feet before the crosswalk, and are meant to show the approaching driver where to stop in order to yield to the pedestrian.

viii
Figure ES1: Crosswalk Setups for Experiment 1 - (A) Modified Standard Yield Marking (MSYM) Condition; (B) Advance Yield Marking (AYM) Condition
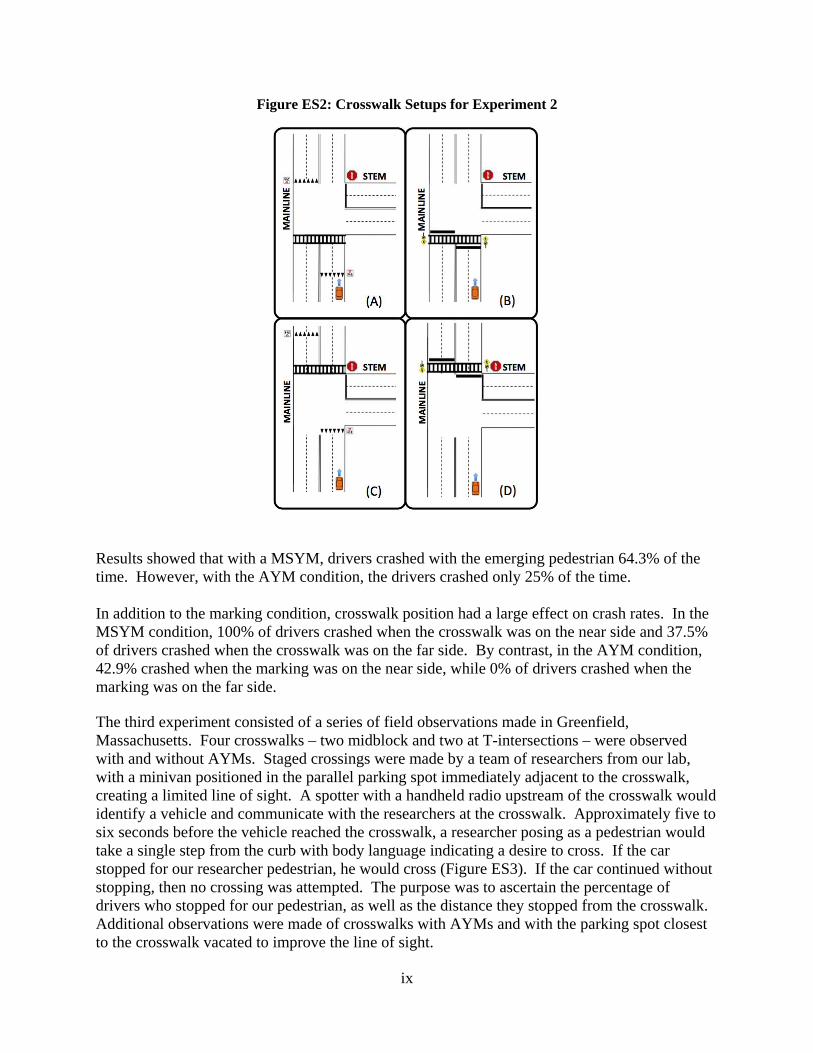
Drivers in the simulator either received the version with 100% AYMs or the version with 100% MSYMs. In order to simulate worst-case conditions, drivers were also given a simulated cell phone task. Research has shown that cell phone use decreases a driver’s ability to process information from the periphery of the visual field and also makes it less likely that drivers will scan to the side, away from the forward roadway (Strayer, Drews & Johnston, 2003). Results showed that the advanced notice of the crosswalk afforded by AYMs makes it more likely that drivers will scan for pedestrians in the crosswalk and on the side of the road before reaching the crosswalk. In the final scenario in which the pedestrian does emerge, fewer drivers in the experiment crashed with the pedestrian in the AYM condition than in the MSYM condition. The primary goal of the second experiment was to determine whether AYMs make it more likely that drivers will scan for pedestrians on the crosswalks across the mainline roadway at a T-intersection. A secondary objective was to determine if mainline crosswalks should be placed on the near or far side of the T-intersection’s stem roadway. In the second experiment drivers received a simulated town setup with either all AYMs or all MSYMs at T-intersection crosswalks (Figure ES2). There were a total of seven crosswalks with obstructions, either in the form of a stopping truck or a work zone. At six of the crosswalks, no pedestrian emerged. At the final crosswalk, a pedestrian emerged from in front of a truck that had stopped for the pedestrian in the right lane. Also, the position of the crosswalks on the near or far side of the stem was alternated with each driver in order for crosswalk positioning to be evaluated.
ix
Figure ES2: Crosswalk Setups for Experiment 2
Results showed that with a MSYM, drivers crashed with the emerging pedestrian 64.3% of the time. However, with the AYM condition, the drivers crashed only 25% of the time. In addition to the marking condition, crosswalk position had a large effect on crash rates. In the MSYM condition, 100% of drivers crashed when the crosswalk was on the near side and 37.5% of drivers crashed when the crosswalk was on the far side. By contrast, in the AYM condition, 42.9% crashed when the marking was on the near side, while 0% of drivers crashed when the marking was on the far side. The third experiment consisted of a series of field observations made in Greenfield, Massachusetts. Four crosswalks – two midblock and two at T-intersections – were observed with and without AYMs. Staged crossings were made by a team of researchers from our lab, with a minivan positioned in the parallel parking spot immediately adjacent to the crosswalk, creating a limited line of sight. A spotter with a handheld radio upstream of the crosswalk would identify a vehicle and communicate with the researchers at the crosswalk. Approximately five to six seconds before the vehicle reached the crosswalk, a researcher posing as a pedestrian would take a single step from the curb with body language indicating a desire to cross. If the car stopped for our researcher pedestrian, he would cross (Figure ES3). If the car continued without stopping, then no crossing was attempted. The purpose was to ascertain the percentage of drivers who stopped for our pedestrian, as well as the distance they stopped from the crosswalk. Additional observations were made of crosswalks with AYMs and with the parking spot closest to the crosswalk vacated to improve the line of sight.

x
Figure ES3: Experiment 3 Field Observation Study
Results showed that with a limited line of sight (vehicles parked next to the crosswalk), the percentage of drivers who stopped improved at all four crosswalks. However, the stopping rate markedly improved when the parking spot closest to the crosswalk was vacated. Additionally, when this parking spot was vacant, cars stopped further from the crosswalk. In experiment four, a series of field drives was conducted in Greenfield, Massachusetts using the same crosswalks, with and without AYMs. Drivers were fitted with a mobile eye tracker by our research team, and then proceeded to drive a 20-minute route that intersected all four crosswalks. Sixteen drivers drove the crosswalks with AYMs and a separate group of sixteen drivers drove the crosswalks without AYMs. Again, a large vehicle (SUV, minivan or pickup truck) was parked at the parking spot immediately adjacent to the crosswalk. In three of the four crosswalks – those with parking spots within ten feet of the crosswalk – results showed that drivers were more likely to take a glance at the area where the pedestrian is obscured when AYMs were in place than when they were not. On average, drivers in the AYM condition were 25% more likely to glance toward the obscured pedestrian than when no AYMs were installed. In summary, AYMs are shown to be effective in changing driver scanning behavior, making them more likely to look for potential pedestrians in crosswalks. In situations where drivers are distracted or not anticipating a pedestrian, the simulator studies show that deadly crashes are less likely to occur. At T-intersection crosswalks, locating the mainline crosswalk on the far side of the intersection with the stem increases the line of sight for the driver and greatly reduces the likelihood of a pedestrian vehicle crash. These results were validated in the field as drivers were more likely to stop for staged pedestrians after AYMs were put in place and were significantly more likely to stop when sight lines were cleared by having empty parking spots closest to the crosswalk. Drivers on real roads were also more likely to scan for pedestrians when AYMs were present.
xi
Table of Contents
TechnicalReportDocumentPage.....................................................................................................i
Acknowledgements...............................................................................................................................v
Disclaimers...............................................................................................................................................v
ExecutiveSummary............................................................................................................................vii
TableofContents..................................................................................................................................xi
ListofTables........................................................................................................................................xiii
ListofFigures......................................................................................................................................xiv
1.0Introduction.....................................................................................................................................1
2.0Task1:MidblockCrosswalkSimulatorExperiment.........................................................52.1. Method....................................................................................................................................................52.1.1.Introduction.......................................................................................................................................................52.1.2.Participants........................................................................................................................................................52.1.3.Stimuli...................................................................................................................................................................62.1.4.DrivingSimulator.............................................................................................................................................62.1.5.Scenarios.............................................................................................................................................................62.1.6.Procedure............................................................................................................................................................92.1.7.DependentVariablesandDataCollection.............................................................................................9
2.2. Results.................................................................................................................................................112.2.1.Crashes...............................................................................................................................................................112.2.2.Glances...............................................................................................................................................................12
2.3SummaryofResults...............................................................................................................................13
3.0Task2:T‐IntersectionCrosswalkSimulatorExperiment.............................................153.1. Method.................................................................................................................................................153.1.1.Introduction.....................................................................................................................................................153.1.2.Participants......................................................................................................................................................153.1.3.Stimuli.................................................................................................................................................................153.1.4.Scenarios...........................................................................................................................................................173.1.5.Procedure..........................................................................................................................................................193.1.6.DependentVariablesandDataCollection...........................................................................................19
3.2. Results.................................................................................................................................................203.2.1.Crashes...............................................................................................................................................................203.2.2.Glances...............................................................................................................................................................21
3.3SummaryofResults...............................................................................................................................21
4.0Task3:FieldObservationalExperiment.............................................................................234.1. Method.................................................................................................................................................234.1.1.Introduction......................................................................................................................................................234.1.2.Crosswalks.........................................................................................................................................................234.1.3.ExperimentalSetup........................................................................................................................................254.1.4.Procedure...........................................................................................................................................................274.1.5DependentVariables......................................................................................................................................28

xii
4.2 Results.................................................................................................................................................284.2.1.YieldingBehavior............................................................................................................................................284.2.2.StoppingDistance...........................................................................................................................................30
4.3SummaryofResults...............................................................................................................................31
5.0Task4:In‐VehicleFieldExperiment.....................................................................................325.1. Method.................................................................................................................................................335.1.1.Introduction......................................................................................................................................................335.1.2.Participants.......................................................................................................................................................335.1.3.Crosswalks&ExperimentalSetup...........................................................................................................335.1.4.Procedure...........................................................................................................................................................345.1.5.DependentVariables.....................................................................................................................................35
5.2 Results.................................................................................................................................................355.2.1.Glances................................................................................................................................................................35
5.3SummaryofResults...............................................................................................................................36
6.0GeneralConclusions....................................................................................................................376.1Tasks1&2–SimulatorExperiments..............................................................................................376.2Tasks3&4–FieldObservationsandIn‐VehicleDrives..........................................................386.3Recommendations..................................................................................................................................38
7.0References......................................................................................................................................40
8.0Appendices.....................................................................................................................................428.1AppendixA................................................................................................................................................448.2AppendixB................................................................................................................................................49

xiii
List of Tables
Table1:DescriptionofNineScenariosUsedinDrivingSimulator,inAdvanceYieldMarking(AYM)andModifiedStandardYieldMarking(MSYM)Setups............................7
Table2:NumberofCrashesandNearCrashesinAdvanceYieldMarking(AYM)andModifiedStandardYieldMarking(MSYM)Conditions..........................................................12
Table3:DescriptionofSevenScenariosinAdvanceYieldMarking(AYM)andModifiedStandardYieldMarking(MSYM)SetupsUsedinDrivingSimulator..............17
Table4:CrashResultsinFinal"EmergingPedestrian"Scenario......................................21
Table5:GlancestoTargetZoneineachScenario...................................................................21
Table6:YieldingBehaviorofObservedDriversatGreenfield,MassachusettsCrosswalksinStandardandAdvanceConditions....................................................................29
Table7:EstimatedAverageStoppingDistancefromCrosswalkforYieldingVehiclesinObservationalExperiment..........................................................................................................30

xiv
List of Figures
FigureES1:CrosswalkSetupsforExperiment1‐(A)ModifiedStandardYieldMarking(MSYM)Condition;(B)AdvanceYieldMarking(AYM)Condition...................viii
FigureES2:CrosswalkSetupsforExperiment2.......................................................................ix
FigureES3:Experiment3FieldObservationStudy...................................................................x
Figure1:SimulatorTreatmentConditions‐(A)ModifiedStandardYieldMarking(MSYM)Condition;(B)AdvanceYieldMarking(AYM)Condition.......................................2
Figure2:AdvanceYieldMarking(AYM)Scenario‐NoObstruction,PedestrianonRightSide.................................................................................................................................................8
Figure3:ModifiedStandardYieldMarkings(MSYM)‐ObstructioninLeftLane,NoPedestrian................................................................................................................................................8
Figure4:LaunchZones(LZ)andTargetZones(TZ)whenObstructionsPresent.......11
Figure5:ProbabilityofaGlanceTowardthePedestrianasaFunctionofHowCloseTheDriveristotheCrosswalkandTypeofPavementMarkings......................................13
Figure6:NearandFarSideCrosswalkSetupswhenStemonRight.................................16
Figure7:ScreenCapturefromSimulation‐Scenario3,AdvanceYieldMarkings(AYMs),....................................................................................................................................................18
CrosswalkonNearSide.....................................................................................................................18
Figure8:ScreenCapturefromSimulation‐Scenario7,PedestrianEmergingfromRightSide,ModifiedStandardYieldMarkings(MSYMs),CrosswalkonFarSide.........18
Figure9:LaunchandTargetZonesforScenariosforEyeFixationswithTruckObstructionatCrosswalkintheLeft(A)andRight(B)Lane...............................................20
Figure10:CrosswalksUsedinExperiment...............................................................................24
Figure11:GeneralizedCrosswalkSetupforObservationalExperiment........................25
Figure12:ScreenCapturefromFieldObservationVideoRecordingatFederalandOsgoodStreets......................................................................................................................................26
Figure13:ScreenCapturefromFieldObservationVideoRecordingatMainStreet..26
Figure14:GeneralizedSetupandDriverLineofSightforObservationsTakenwith0,1or2EmptySpacesImmediatelyBeforetheCrosswalk......................................................28
Figure15:RouteforIn‐VehicleExperiment(Task4),withRouteDirectionIndicatedbyYellowArrows,CrosswalksIndicatedbyNumberinCircles.........................................34
Figure16:PercentageofDriversGlancingTowardAreaWherePedestrianMayEmergeFromBehindStagedVehicle,ImmediatelyAdjacenttoCrosswalk...................36

xv
This page left intentionally blank.
1
1.0 Introduction
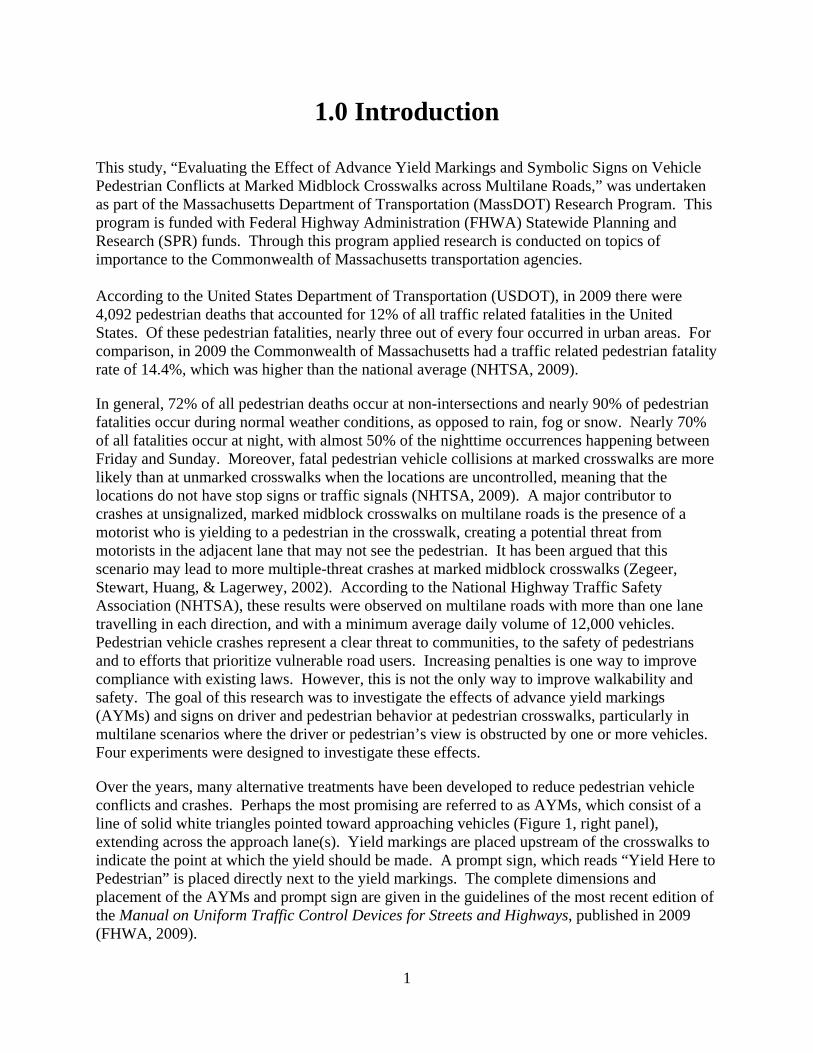
This study, “Evaluating the Effect of Advance Yield Markings and Symbolic Signs on Vehicle Pedestrian Conflicts at Marked Midblock Crosswalks across Multilane Roads,” was undertaken as part of the Massachusetts Department of Transportation (MassDOT) Research Program. This program is funded with Federal Highway Administration (FHWA) Statewide Planning and Research (SPR) funds. Through this program applied research is conducted on topics of importance to the Commonwealth of Massachusetts transportation agencies. According to the United States Department of Transportation (USDOT), in 2009 there were 4,092 pedestrian deaths that accounted for 12% of all traffic related fatalities in the United States. Of these pedestrian fatalities, nearly three out of every four occurred in urban areas. For comparison, in 2009 the Commonwealth of Massachusetts had a traffic related pedestrian fatality rate of 14.4%, which was higher than the national average (NHTSA, 2009).
In general, 72% of all pedestrian deaths occur at non-intersections and nearly 90% of pedestrian fatalities occur during normal weather conditions, as opposed to rain, fog or snow. Nearly 70% of all fatalities occur at night, with almost 50% of the nighttime occurrences happening between Friday and Sunday. Moreover, fatal pedestrian vehicle collisions at marked crosswalks are more likely than at unmarked crosswalks when the locations are uncontrolled, meaning that the locations do not have stop signs or traffic signals (NHTSA, 2009). A major contributor to crashes at unsignalized, marked midblock crosswalks on multilane roads is the presence of a motorist who is yielding to a pedestrian in the crosswalk, creating a potential threat from motorists in the adjacent lane that may not see the pedestrian. It has been argued that this scenario may lead to more multiple-threat crashes at marked midblock crosswalks (Zegeer, Stewart, Huang, & Lagerwey, 2002). According to the National Highway Traffic Safety Association (NHTSA), these results were observed on multilane roads with more than one lane travelling in each direction, and with a minimum average daily volume of 12,000 vehicles. Pedestrian vehicle crashes represent a clear threat to communities, to the safety of pedestrians and to efforts that prioritize vulnerable road users. Increasing penalties is one way to improve compliance with existing laws. However, this is not the only way to improve walkability and safety. The goal of this research was to investigate the effects of advance yield markings (AYMs) and signs on driver and pedestrian behavior at pedestrian crosswalks, particularly in multilane scenarios where the driver or pedestrian’s view is obstructed by one or more vehicles. Four experiments were designed to investigate these effects.
Over the years, many alternative treatments have been developed to reduce pedestrian vehicle conflicts and crashes. Perhaps the most promising are referred to as AYMs, which consist of a line of solid white triangles pointed toward approaching vehicles (Figure 1, right panel), extending across the approach lane(s). Yield markings are placed upstream of the crosswalks to indicate the point at which the yield should be made. A prompt sign, which reads “Yield Here to Pedestrian” is placed directly next to the yield markings. The complete dimensions and placement of the AYMs and prompt sign are given in the guidelines of the most recent edition of the Manual on Uniform Traffic Control Devices for Streets and Highways, published in 2009 (FHWA, 2009).

2
Figure 1: Simulator Treatment Conditions - (A) Modified Standard Yield Marking (MSYM) Condition; (B) Advance Yield Marking (AYM) Condition
Previous studies have shown that the use of AYMs, along with an associated “Yield Here to Pedestrian” sign, increases the driver’s yielding distance while reducing the number of conflicts at multilane crosswalks with uncontrolled approaches (Van Houten, Malenfant, & McCusker, 2001; Van Houten, McCusker, Huybers, Malenfant & Rice-Smith, 2002). In theory, this treatment has the potential to reduce conflicts in multi-threat and sight-limited scenarios. First, the treatment alerts the driver of possible pedestrians that may be further upstream of the crosswalk. Second, it prompts the driver to yield further upstream from the crosswalk, thereby increasing the separation between the driver and the pedestrian. Thus, AYMs and an associated “Yield Here to Pedestrian” sign provide more time for the driver to react and respond. However, it is not known whether these changes occur solely in scenarios where the pedestrian is visible in the crosswalk. This question has persisted due to a lack of detail in the aforementioned results. Specifically, there has been no indication of whether any of the scenarios included sight-limited situations in general and multi-threat situations in particular. The four experiments described below were designed and undertaken to determine whether the AYMs performed as well in the multi-threat scenario as they did in scenarios where pedestrians were clearly visible.
The first two experiments utilized simulators. In the first experiment (Task 1), eye tracking equipment was used to study the effect of AYMs on the driver’s ability to scan and anticipate the presence of a pedestrian in the crosswalk on two-way, multilane midblock crosswalks. The cognitive load placed on the drivers was varied and different combinations of obscuring vehicles and structures were used. In the second experiment (Task 2), the first experiment was repeated, with the addition of investigating crosswalks located on the near and far side of T-intersections. In addition to having stopped vehicles which obscure or hide pedestrians, crosswalks at T-intersections carry the additional threat of having unexpected turning vehicles conflicting with pedestrians and cross traffic. In both experiments, the goal was to investigate whether the AYMs would elicit additional scanning to the side by the driver, thereby decreasing crashes in scenarios where pedestrians emerged from behind stopped vehicles.

3
The third and fourth experiments were conducted in the field. In the third experiment (Task 3), four crosswalks, including two midblock and two T-intersections, were selected for observation in Greenfield, Massachusetts. Staged pedestrian crossings were conducted with large vehicles parked in the parallel parking spots immediately adjacent to the crosswalk. Observations were taken both before and after AYMs and signage were put in place. In the fourth experiment (Task 4), drivers recruited by a Greenfield driving school were fitted with a head-mounted eye tracker and asked to drive a route that intercepted the four selected crosswalks. A varied group of drivers were run through the experiment both before and after the AYMs were put in place.
Permission to undertake each of the four experiments was granted by the Institutional Review Board (IRB), which is an organization that reviews experiments involving human subjects to ensure the experiment as designed will do no physical or psychological harm to drivers and those involved in administering the experiment itself.

4
This page left intentionally blank.

5
2.0 Task 1: Midblock Crosswalk Simulator Experiment
2.1. Method
2.1.1. Introduction
The primary purpose of the first experiment was to study whether the clear sightline afforded by AYMs would cause more drivers to scan to the side for pedestrians, thereby reducing pedestrian vehicle crashes. Drivers who participated in this experiment were asked to navigate through a virtual town that contained a number of unsignalized, marked midblock crosswalks while performing a secondary task. In each scenario there were four travel lanes, two in each direction. In some cases, pedestrians would be triggered to cross the street as the driver approached, both from the left and right sides. Obstructions, which were always work zones consisting of reflectorized drums surrounding a bulldozer and other heavy equipment, were occasionally present in one of the travel lanes, in front of the crosswalk (on the near or driver’s side of the crosswalk). In the simulator scenarios, there was no advance signage for the work zones. In each drive scenario, work zones obscured a total of four crosswalks. The first two work zones were static sites with no workers or pedestrians moving about. In the first two, as well as the third work zone scenario, pedestrians did not emerge from the obscured portion of the crosswalk. However, in the final work zone, a pedestrian did emerge unexpectedly from the obscured portion of the crosswalk. The first three work zones strategically left out an emerging pedestrian in order to prevent the driver from increasing their vigilance during the final work zone scenario (where a pedestrian does appear from behind a piece of construction equipment). Experience has shown that if only a single hazardous looking situation (such as a work zone) is present in a simulation, drivers may begin to operate the vehicle in a hyper vigilant state, much more so than if they were driving in a real life situation. To avoid biasing driver behavior with the potential fear of unexpected lane changes upon approaching the crosswalk, work zones were used as obstructions instead of large vehicles. Thus, until the last scenario, the driver either navigates a sight-limited scenario at a marked, midblock crosswalk with no pedestrian or navigates an unobstructed scenario with an occasional pedestrian. When several hazardous situations in a row present themselves with no materialized hazards, drivers tend to relax and drive more naturally. We wanted to link one stimulus (an obstruction) with the absence of a pedestrian and a second stimulus (no obstruction) with the presence of a pedestrian. This makes the last scenario one in which we can determine whether drivers maintain their vigilance in both the AYM and the modified standard yield marking (MSYM) conditions.
2.1.2. Participants
Twenty-four drivers participated in the first experiment, ranging in age from eighteen to thirty years. Twelve drivers were randomly assigned to either the MSYM or AYM condition. Originally, there was an additional cohort of research participants with drivers aged forty-five to sixty years. However, due to an unusually high rate of simulator sickness in this group, the data

6
for these drivers had to be thrown out of the final analysis. The average age was 24.5 in the MSYM condition and 24.9 in the AYM condition. Most drivers were familiar with AYMs and had some experience with them in their day-to-day driving. Drivers were recruited from the campus population and the immediate Amherst, Massachusetts area.
2.1.3. Stimuli
A series of scenarios with crosswalks were developed for this experiment. In the MSYM condition, crosswalks had traditional stop lines located four feet before the crosswalk, along with a traditional pedestrian crosswalk sign. This condition was tested as a modification to standard crosswalks with no stop lines, providing a cue for drivers and showing them where to stop when a pedestrian is waiting to cross. This condition also prompted drivers to check for pedestrians when their view was obstructed. In the AYM condition, AYMs and associated yield to pedestrian signs were placed. The AYMs in this experiment consisted of a series of solid white triangles, twenty-four inches wide at the top and thirty-six inches long, with the “point” of the triangle oriented toward the approaching driver. The triangles were situated in a line across the lane thirty feet upstream of the crosswalk, conforming to the guidelines set forth by the 2009 edition of the Manual on Uniform Traffic Control Devices for Streets and Highways (MUTCD). The crosswalk setup for the MSYM and AYM conditions can be found in Figure 1.
2.1.4. Driving Simulator
The fixed-base simulator included a full size Saturn sedan in which all vehicle controls were fully operative. The visual world was displayed on three screens, allowing for 150 degrees of vision in the horizontal direction and 30 degrees in the vertical direction. Images were displayed with a refresh rate of 60 Hz and with a resolution of 1400 pixels by 1050 pixels. The images were updated 60 times per second using a network of four advanced Realtime Technologies simulator servers, which parallel process the images projected to each of the three screens using high-end multimedia video processors.
2.1.5. Scenarios
There were a total of nine marked, midblock crosswalk scenarios used for this experiment. A list of the scenarios developed is provided in Table 1, listed in the order that participants encountered each scenario. The two variables manipulated in this experiment included 1) the presence or absence of an obstruction in front of the crosswalk, and 2) the presence or absence of a pedestrian at the side of the crosswalk. As noted above, in these scenarios a pedestrian emerged from behind an obstruction only in the last scenario (Scenario 9). The final scenario was critical in determining whether or not the increased sightline provided by AYMs can lead to a lower crash rate. Due to the first eight scenarios having no hidden pedestrian (only highly visible ones with no obstructions), the driver experienced the scenario without preconceived expectations that the scenario would contain a hidden pedestrian. This situation is reflective of real world driving scenarios, in which crashes or pedestrians appearing unexpectedly from obscured areas are relatively low frequency events. Finally, other pedestrians were included in the simulations that were not directly related to the marked, midblock crosswalk scenarios. The inclusion of these pedestrians indicated to the driver that pedestrians were in the area and may cross the street (e.g., at four way intersections).

7
Table 1: Description of Nine Scenarios Used in Driving Simulator, in Advance Yield Marking (AYM) and Modified Standard Yield Marking (MSYM) Setups
Scenario Scenario Description
1 Midblock Crosswalk with No Obstruction and Pedestrian entering from LEFT Side 2 Midblock Crosswalk with No Obstruction and No Pedestrian 3 Midblock Crosswalk with Obstruction in Left Lane and No Pedestrian 4 Midblock Crosswalk with No Obstruction and Pedestrian entering from RIGHT Side5 Midblock Crosswalk with Obstruction in Left Lane and No Pedestrian 6 Midblock Crosswalk with No Obstruction and Pedestrian entering from RIGHT Side7 Midblock Crosswalk with No Obstruction and No Pedestrian 8 Midblock Crosswalk with No Obstruction and No Pedestrian
9 Midblock Crosswalk with Obstruction in Left Lane and Pedestrian at the middle of the crosswalk attempting to traverse to the RIGHT
Note: See Appendix A for full descriptions and plan views of scenarios. Please note that Scenario 4 contains the same roadway geometry as Scenario 6. Illustrations of the driver’s view of the various scenarios are provided below. The scenarios include the AYM condition with no obstruction, with pedestrian preparing to cross from the right side (Table 1, Scenarios 4 and 6; Figure 2), and the MSYM condition with an obstruction present in the left lane, but no pedestrian in view (Table 1, Scenarios 3 and 5; Figure 3). Simulator screen captures and complete descriptions of each scenario can be found in Appendix A.

8
Figure 2: Advance Yield Marking (AYM) Scenario - No Obstruction, Pedestrian on Right Side (Scenarios 4 and 6)
Note: Small image on top right hand side is the view from the rear view mirror.
Figure 3: Modified Standard Yield Markings (MSYM) - Obstruction in Left Lane, No Pedestrian (Scenarios 3 and 5)
Note: Small image on top right hand side is the view from the rear view mirror.

9
2.1.6. Procedure
Drivers were provided informed consent forms, filled out pre-experiment questionnaires and then practiced a five-minute drive in the simulator. Afterward, the drivers were fitted and calibrated with an Applied Science Laboratories Mobile-Eye eye tracking system. Next, depending upon the cohort to which they were randomly assigned, drivers drove either the MSYM or AYM experimental scenario. The two experimental drives contained each of the nine scenarios listed in Table 1, with the only difference between the MSYM and AYM drives being the type of crosswalk. The drive contained either 100% MSYM-style crosswalks or 100% AYM-style crosswalks.
To increase the cognitive load on the drivers, a simulated cell phone task was developed for this experiment, with all participants receiving instructions to participate in the task. The purpose of introducing a cognitive load onto drivers was to simulate the worst-case scenario of a distracted driver. Distractions such as cell phone use increase the cognitive and perceptual load on a driver, increasing reaction time and reducing the likelihood that a driver will detect critical information and changes in the environment (Beede & Kass, 2006; Muttart, Fisher, Knodler, & Pollatsek, 2007). In addition, when distracted, drivers process less peripheral information and tend to focus primarily on what is directly in front of the vehicle, making it more likely that a pedestrian stepping into a crosswalk will not be seen (Strayer, Drews & Johnston, 2003). To simulate the cell phone task, a series of short, five word sentences were played to the driver using an audio recording. Drivers had to identify the subject and object of the sentence and then determine whether the sentence was rational or nonsensical. For instance, if provided the sentence, “The cat climbed the tree,” the driver would verbally reply, “Cat … Tree … Yes.” If the sentence was, “The dog flew the plane,” the driver would reply, “Dog … Plane … No.” Before beginning the drive, participants were given a practice series of sentences. Following the drive, the simulation was ended and the eye tracker was removed from the driver. The simulation experiment ended with a debriefing session.
2.1.7. Dependent Variables and Data Collection
The dependent variables included: 1) whether the driver did or did not fixate predefined areas of visual interest in the driving environment, and 2) whether the driver crashed or was in a near crash.
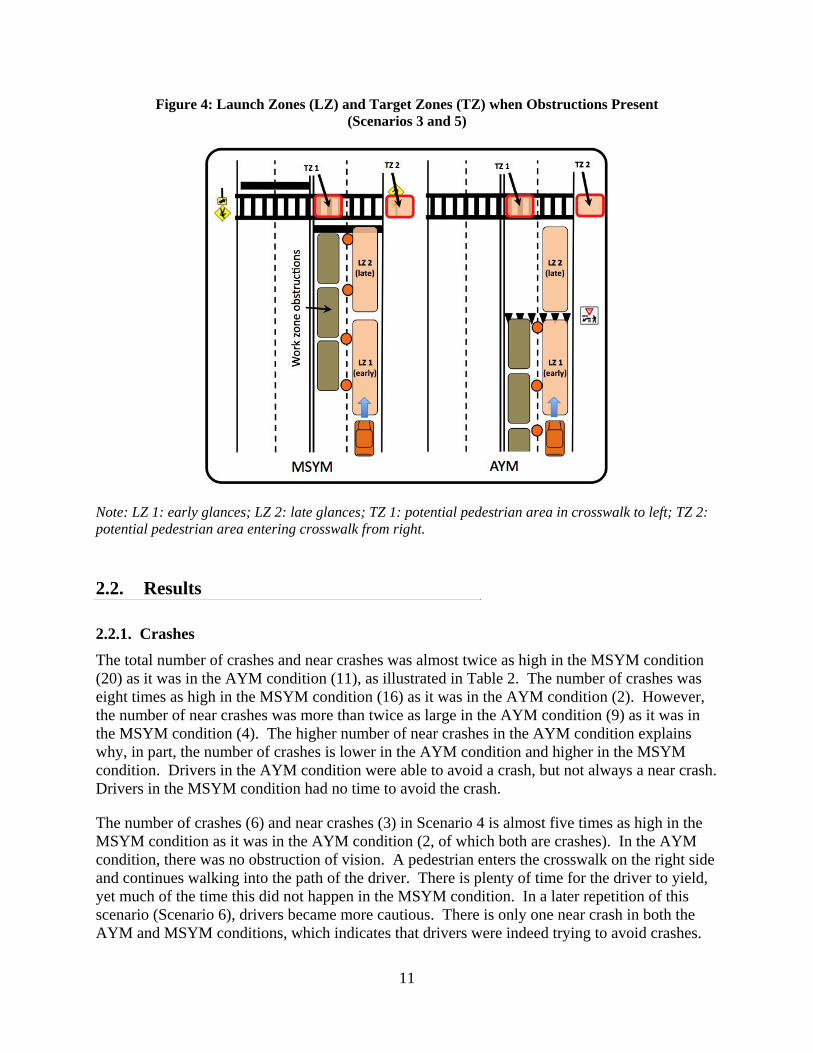
With respect to 1) above, two sets of reference points were used to define the areas of visual interest. One set defined the area of the roadway in which the driver must be operating when the fixation was scored (the launch zone), and the other defined the area of the roadway or environment at which the driver must be looking (the target zone). If the driver was in the launch zone when he or she fixated in the target zone, then the driver was considered to have looked at the risky situation or area of interest along the road. For the purpose of the experiment, there were two such launch zones and target zones (a total of four visual zones). Launch zones and target zones are described in more detail below and visually in Figure 4.
Two target zones were defined for this study. Target zone 1 (TZ 1) included the area in the crosswalk to the left of the driver within which, in the case of obstructions, a pedestrian would be potentially hidden. Target zone 2 (TZ 2) included the area on the sidewalk to the right, where pedestrians would enter the crosswalk crossing from the driver’s right to the left. Ideally, a

10
driver approaching a crosswalk would check both target zones for pedestrians. Launch zone 1 (LZ 1) included an area between 30 and 150 feet before the crosswalk, in which a driver might take an early glance in anticipation of a pedestrian being in the crosswalk on the left, or approaching the crosswalk on the right. LZ 1 ended at the AYMs for the AYM condition. Launch zone 2 (LZ 2) included an area between zero and 30 feet before the crosswalk, in which a driver might take a late glance to check for pedestrians if their view was obscured. A glance toward either TZ 1 or TZ 2 in LZ 1 would indicate that the driver anticipated the possibility of a pedestrian. A glance toward either zone in LZ 2 would indicate that the driver was taking a tactical glance because either their view was obscured or they wanted to check again for the possibility of pedestrians. The work zone served as a visual obstruction blocking the view of a potential pedestrian entering the crosswalk from the left. It was assumed that drivers predicted the risk if they fixated on the area where a pedestrian may emerge or where a pedestrian was actually located. If the driver fixated on this area, a hit or a correct response was recorded (value=1), otherwise a miss was recorded (value=0).
Scenarios with obstructions were compared to those without obstructions in the left lane. Given that there are two possible directions from which pedestrians might emerge, both directions had to be checked by the driver in order to ensure that no pedestrians were in or near the crosswalk. The critical issue is that drivers anticipated the possibility of pedestrians in or around the crosswalk. Therefore, comparisons were made between the crosswalks with obstructions and no pedestrians (Scenarios 3 & 5) and the crosswalks without obstructions and no pedestrians (Scenarios 2 & 7).
With respect to variable 2 above, drivers were scored for collisions and near collisions, given a score of colliding if they failed to apply the brakes in time to avert contact with the pedestrian on the crosswalk. Near collisions were defined as collisions that were effectively avoided due to emergency vehicle maneuvers employed by the driver. For example, hard braking and swerving, when occurring near launch zone 1, was considered a near collision. In this case illustrated in Figure 4, the driver almost manages to avoid colliding with the pedestrians.
11
Figure 4: Launch Zones (LZ) and Target Zones (TZ) when Obstructions Present (Scenarios 3 and 5)
Note: LZ 1: early glances; LZ 2: late glances; TZ 1: potential pedestrian area in crosswalk to left; TZ 2: potential pedestrian area entering crosswalk from right.
2.2. Results
2.2.1. Crashes
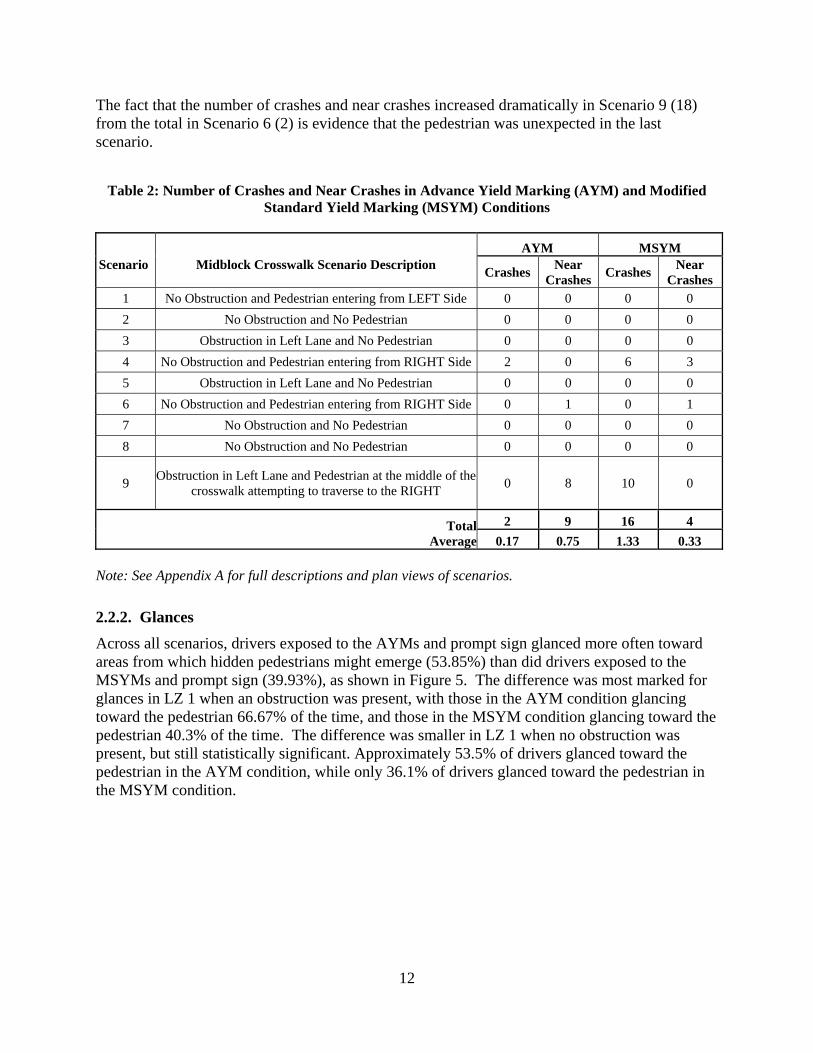
The total number of crashes and near crashes was almost twice as high in the MSYM condition (20) as it was in the AYM condition (11), as illustrated in Table 2. The number of crashes was eight times as high in the MSYM condition (16) as it was in the AYM condition (2). However, the number of near crashes was more than twice as large in the AYM condition (9) as it was in the MSYM condition (4). The higher number of near crashes in the AYM condition explains why, in part, the number of crashes is lower in the AYM condition and higher in the MSYM condition. Drivers in the AYM condition were able to avoid a crash, but not always a near crash. Drivers in the MSYM condition had no time to avoid the crash.
The number of crashes (6) and near crashes (3) in Scenario 4 is almost five times as high in the MSYM condition as it was in the AYM condition (2, of which both are crashes). In the AYM condition, there was no obstruction of vision. A pedestrian enters the crosswalk on the right side and continues walking into the path of the driver. There is plenty of time for the driver to yield, yet much of the time this did not happen in the MSYM condition. In a later repetition of this scenario (Scenario 6), drivers became more cautious. There is only one near crash in both the AYM and MSYM conditions, which indicates that drivers were indeed trying to avoid crashes.
12
The fact that the number of crashes and near crashes increased dramatically in Scenario 9 (18) from the total in Scenario 6 (2) is evidence that the pedestrian was unexpected in the last scenario.
Table 2: Number of Crashes and Near Crashes in Advance Yield Marking (AYM) and Modified
Standard Yield Marking (MSYM) Conditions
Scenario
Midblock Crosswalk Scenario Description
AYM MSYM
Crashes Near
Crashes Crashes
Near Crashes
1 No Obstruction and Pedestrian entering from LEFT Side 0 0 0 0
2 No Obstruction and No Pedestrian 0 0 0 0
3 Obstruction in Left Lane and No Pedestrian 0 0 0 0
4 No Obstruction and Pedestrian entering from RIGHT Side 2 0 6 3
5 Obstruction in Left Lane and No Pedestrian 0 0 0 0
6 No Obstruction and Pedestrian entering from RIGHT Side 0 1 0 1
7 No Obstruction and No Pedestrian 0 0 0 0
8 No Obstruction and No Pedestrian 0 0 0 0
9 Obstruction in Left Lane and Pedestrian at the middle of the
crosswalk attempting to traverse to the RIGHT 0 8 10 0
Total Average
2 9 16 4
0.17 0.75 1.33 0.33 Note: See Appendix A for full descriptions and plan views of scenarios.
2.2.2. Glances
Across all scenarios, drivers exposed to the AYMs and prompt sign glanced more often toward areas from which hidden pedestrians might emerge (53.85%) than did drivers exposed to the MSYMs and prompt sign (39.93%), as shown in Figure 5. The difference was most marked for glances in LZ 1 when an obstruction was present, with those in the AYM condition glancing toward the pedestrian 66.67% of the time, and those in the MSYM condition glancing toward the pedestrian 40.3% of the time. The difference was smaller in LZ 1 when no obstruction was present, but still statistically significant. Approximately 53.5% of drivers glanced toward the pedestrian in the AYM condition, while only 36.1% of drivers glanced toward the pedestrian in the MSYM condition.

13
Figure 5: Probability of a Glance Toward the Pedestrian as a Function of How Close The Driver is to the Crosswalk and Type of Pavement Markings
Note: LZ 1 – solid lines; LZ 2 – dashed lines. AYM: Advance Yield Marking – solid squares; MSYM Modified Standard Yield Marking – open diamonds.
2.3 Summary of Results
According to the results of this experiment, AYMs can both decrease crashes in multi-threat scenarios as well as increase the number of glances towards the potential threat. Overall, there were eight times as many crashes when drivers encountered MSYMs as when drivers encountered AYMs in the multi-threat scenarios. Additionally, looking solely at glances, when drivers were located more than thirty feet in front of the crosswalk, they glanced 66% more frequently towards the potential threat if they encountered AYMs than if they encountered MSYMs (a difference of 26.4 percentage points, 66.7% vs. 40.3%). Clearly these results indicate that the greater sightline afforded by the AYMs – when the work zone obstruction is further back – creates a significant advantage for drivers who are distracted or may not be expecting a pedestrian in the crosswalk. Drivers in this study, all of whom were engaged in a simulated cell phone task, were much more likely to fixate areas that may contain pedestrians when sightlines were greater than they would be if vehicles in the adjacent lane stopped at the AYMs. Crashes were also more likely to occur in those situations where sightlines to the crosswalk were severely constrained, as they were in the MSYM condition. These results indicate that it is not solely the markings themselves that create the advantage, but the way the scenarios play out when MSYMs are used (the obscuring vehicle is immediately adjacent to the

14
crosswalk) versus the way the scenarios play out when AYMs are used (the obscuring vehicle is much farther upstream of the crosswalk).

15
3.0 Task 2: T-Intersection Crosswalk Simulator Experiment
3.1. Method
3.1.1. Introduction
Drivers in the second experiment drove through a simulated town that contained a series of unsignalized, T-intersection crosswalks, while performing a secondary task. All drivers were fitted with a mobile eye tracking system. One cohort of drivers drove through a simulated town that contained crosswalks with MSYMs, while the other cohort of drivers experienced a simulated town that contained crosswalks with AYMs. The virtual environments and the scenarios contained within were identical except for the different pavement marking conditions. Various combinations of vehicle obstruction, crosswalk placement and intersection configurations were tested. The primary interests of this experiment were the number of drivers who scanned the road for potential pedestrians and any effects the different yield marking and signage configurations had on scanning. Another interest was if the placement of the crosswalk on the near or far side of the intersection was safer, relative to pedestrian vehicle conflicts. The final scenario in the drive contained a pedestrian that walked out in front of the driver from behind a stopped truck. Four different configurations of this final scenario were tested, allowing for an assessment regarding the likelihood of a crash given a specific configuration.
3.1.2. Participants
Twenty-seven drivers ranging in age from 18-33 years participated in the experiment. Thirteen drivers were randomly assigned to the MSYM condition and fourteen were assigned to the AYM condition. The average age was 24.5 in the MSYM condition and 26.2 in the AYM condition. Most drivers were familiar with AYMs and had some experience with them in their day-to-day driving. Drivers were recruited from the campus population and the immediate Amherst, Massachusetts area. Again, the data for drivers in older age groups had to be discarded due to unusually high rates of simulator sickness.
3.1.3. Stimuli
The drivers traveled on a four-lane road with two travel lanes in each direction. A series of scenarios was developed for this experiment as the driver navigated the simulated town. In this case, a total of seven T-intersection scenarios were constructed. In the first six scenarios, obstructions came in the form of either a truck rolling up to the intersection to make a turn or a construction zone placed just before the crosswalk. The purpose of the obstructions was to block the view of any possible pedestrians in the crosswalk from the driver. In this experiment, the obstruction was either in the left or right travel lane. If the obstruction was a truck, sometime prior to the driver’s arrival, the truck would turn onto the road going the same direction as the driver, either from a side street, parking lot or bus stop. Next, the truck would roll up to the crosswalk at the intersection with its turn signal on, and position itself either in the left or right

16
lane, depending on whether a left or right turn was indicated. The truck would remain there until the driver passed the intersection, not turning immediately because it was waiting for a vehicle or pedestrian to clear the road onto which it was preparing to turn. In the scenario with a work zone, the obstruction was in the left travel lane prior to the crosswalk, and was a static work zone with no advance signage.
One group of the drivers saw MSYMs throughout, while the other group saw AYMs. Variables that were kept consistent between scenarios within a group of drivers included the lane of the obstruction (left or right), the side the branch of the T-intersection was on (left or right) and the side of the intersection the crosswalk was on (near or far). In all scenarios, the driver drove across the mainline of the T-intersection and did not have a stop sign or traffic light, giving the driver the right of way. The stem of the T-intersection contained a stop sign. Examples are given below in Figure 6. Though not shown here, when the stem was on the left the same setup applied, except the stem was on left side of roadway instead of the right as below.
Figure 6: Near and Far Side Crosswalk Setups when Stem on Right
Note: (A) Advance Yield Marking (AYM) condition, near side of stem; (B) Modified Standard Yield Marking (MSYM) condition, near side of stem; (C) Advance Yield Marking (AYM) condition, far side of stem; (D) Modified Standard Yield Marking (MSYM) condition, far side of stem. The final scenario was the pedestrian conflict scenario. In this scenario, the truck stopped at the intersection on the near side in the lane furthest to the right, with its right turn signal on for both the AYM and MSYM conditions. There was a side road to the right of the T-intersection. For
17
half of the drivers, the crosswalk was on the near side of the intersection. For the other half, the crosswalk was on the far side of the intersection.
3.1.4. Scenarios
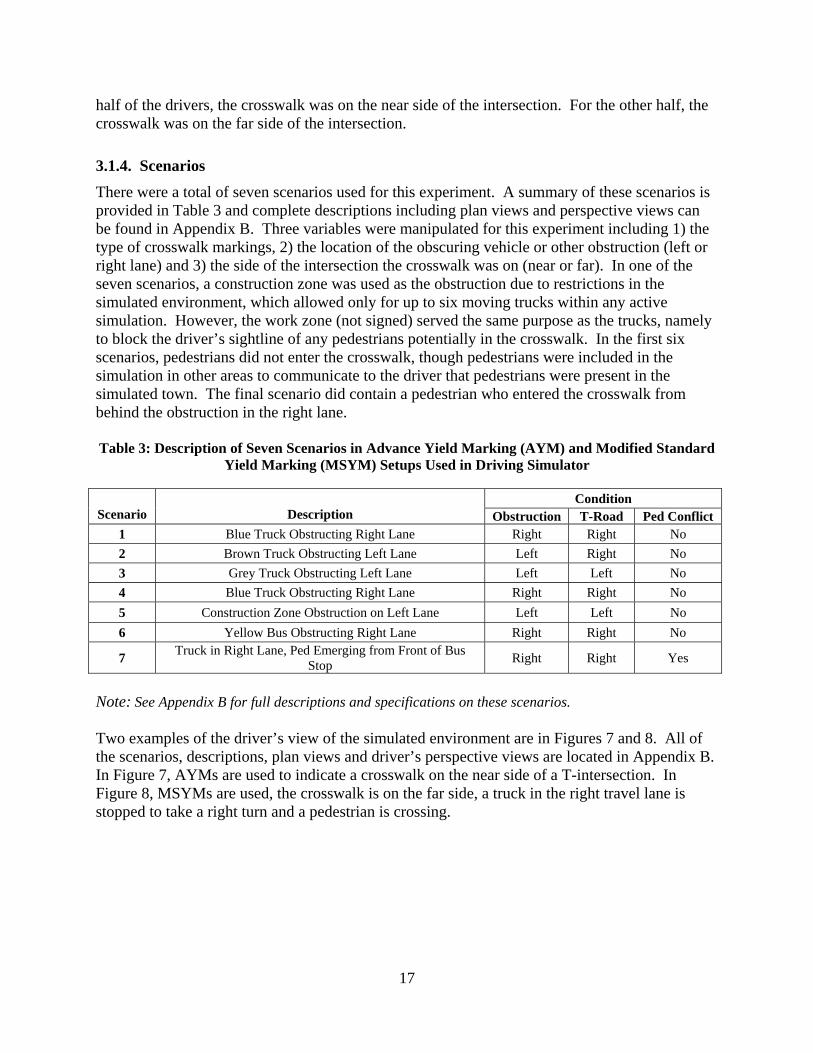
There were a total of seven scenarios used for this experiment. A summary of these scenarios is provided in Table 3 and complete descriptions including plan views and perspective views can be found in Appendix B. Three variables were manipulated for this experiment including 1) the type of crosswalk markings, 2) the location of the obscuring vehicle or other obstruction (left or right lane) and 3) the side of the intersection the crosswalk was on (near or far). In one of the seven scenarios, a construction zone was used as the obstruction due to restrictions in the simulated environment, which allowed only for up to six moving trucks within any active simulation. However, the work zone (not signed) served the same purpose as the trucks, namely to block the driver’s sightline of any pedestrians potentially in the crosswalk. In the first six scenarios, pedestrians did not enter the crosswalk, though pedestrians were included in the simulation in other areas to communicate to the driver that pedestrians were present in the simulated town. The final scenario did contain a pedestrian who entered the crosswalk from behind the obstruction in the right lane. Table 3: Description of Seven Scenarios in Advance Yield Marking (AYM) and Modified Standard
Yield Marking (MSYM) Setups Used in Driving Simulator
Scenario
Description
Condition Obstruction T-Road Ped Conflict
1 Blue Truck Obstructing Right Lane Right Right No
2 Brown Truck Obstructing Left Lane Left Right No
3 Grey Truck Obstructing Left Lane Left Left No
4 Blue Truck Obstructing Right Lane Right Right No
5 Construction Zone Obstruction on Left Lane Left Left No
6 Yellow Bus Obstructing Right Lane Right Right No
7 Truck in Right Lane, Ped Emerging from Front of Bus
Stop Right Right Yes
Note: See Appendix B for full descriptions and specifications on these scenarios. Two examples of the driver’s view of the simulated environment are in Figures 7 and 8. All of the scenarios, descriptions, plan views and driver’s perspective views are located in Appendix B. In Figure 7, AYMs are used to indicate a crosswalk on the near side of a T-intersection. In Figure 8, MSYMs are used, the crosswalk is on the far side, a truck in the right travel lane is stopped to take a right turn and a pedestrian is crossing.

18
Figure 7: Screen Capture from Simulation - Scenario 3, Advance Yield Markings (AYMs), Crosswalk on Near Side
Figure 8: Screen Capture from Simulation - Scenario 7, Pedestrian Emerging from Right Side,
Modified Standard Yield Markings (MSYMs), Crosswalk on Far Side

19
3.1.5. Procedure
Drivers were provided with informed consent paperwork, filled out a series of pre-experiment questionnaires and then had a five-minute practice drive in the simulator. Afterward, the drivers were fitted and calibrated with an Applied Science Laboratories Mobile-Eye eye tracking system. Next, depending upon the cohort to which they were randomly assigned, drivers operated either the MSYM or AYM experimental drive. The experimental drives contained all seven scenarios listed in Table 3. The only difference between the MSYM and AYM experimental drives was the type of crosswalk, which contained either 100% MSYM-style crosswalks or 100% AYM-style crosswalks. In addition to driving, drivers were given a secondary simulated cell phone task to increase cognitive load. Please see Section 2.1.6 for more information regarding the cognitive load task. After the drive, the eye tracker was removed and drivers exited the vehicle for a debriefing session.
3.1.6. Dependent Variables and Data Collection
Dependent variables for this experiment included: 1) whether or not drivers fixated on areas of interest in the crosswalk scenarios, and 2) whether or not, in the final scenario, the driver was successfully able to avoid a crash or near crash.
As with Task 1, areas of interest were defined as target zones and the areas from which drivers were expected to launch their eye fixations were defined as launch zones. Also, as with Task 1, there were two launch zones (LZ 1 early and LZ 2 late) and two target zones (TZ 1 and TZ 2). The conditions for which glances are recorded or not recorded were the same as for Task 1 – if a driver is within a launch zone and fixates within the specified target zone, then a hit is recorded. The launch and target zones used in Task 2 are summarized in Figure 9. Though the stem of the T-intersection is located on the left side in (A) and the right side in (B), the location of the stem could appear on either side depending on the scenario (see Appendix B).

20
Figure 9: Launch and Target Zones for Scenarios for Eye Fixations with Truck Obstruction at Crosswalk in the Left (A) and Right (B) Lane
3.2. Results
3.2.1. Crashes
This experiment was used to explore two questions. The first question was whether AYMs decrease the likelihood of a crash or near crash when a path intrusion by an obscured pedestrian occurs. The second question was whether having the crosswalk on the near or far side of the intersection made a difference in the likelihood of a crash or near crash.
The differences between the MSYMs and AYMs will be addressed first. As seen in Table 4, nine out of fourteen drivers (64.3%) had a crash or near crash with the pedestrian when the pedestrian emerged in the final scenario in the MSYM condition. However, only three out of twelve drivers (25.0%) had a crash or near crash in the AYM condition.
Further, the placement of the crosswalk did have an effect on crash rates. In the MSYM condition, 100% of drivers had a crash or near crash with the pedestrian when the crosswalk was on the near side of the intersection (i.e., just beyond the front bumper of the obscuring vehicle). Three drivers crashed with the pedestrian while three others had a near crash. However, when the crosswalk was moved to the far side of the intersection, there were no crashes and only three near crashes in the MSYM condition. In both cases, the truck was stopped in the right lane immediately before the intersection. In the AYM condition, there were three crashes when the crosswalk was on the near side and no near crashes. There were no crashes or near crashes when the crosswalk was on the far side.

21
Table 4: Crash Results in Final "Emerging Pedestrian" Scenario
Crash Type MSYM AYM
Near Side Far Side Near Side Far Side Pedestrian Crash 3 0 3 0
Near Crash 3 3 0 0
Total Crashes / Near Crashes
6 3 3 0
# Drivers 6 8 7 5 % Drivers in Crash /
Near Crash 100% 37.5% 42.9% 0.0%
3.2.2. Glances
As can be seen in Table 5, a relatively high percentage of drivers in both the MSYM and AYM conditions glanced at the target zone immediately in front of the obscuring truck as they were passing. Across all scenarios, on average, 87.8% of drivers glanced in front of the obstruction in the MSYM condition. In the AYM condition, on average, 94.0% of drivers looked, an improvement of 6.2%. This trend was relatively consistent across all scenarios.
Table 5: Glances to Target Zone in each Scenario
Scenario Description MSYM AYM
Total Avg Total Avg Blue Truck Obstructing Right Lane 49 87.5% 43 89.6% Brown Truck Obstructing Left Lane 47 83.9% 46 88.5% Grey Truck Obstructing Left Lane 45 80.4% 49 94.2% Blue Truck Obstructing Right Lane 49 87.5% 49 94.2% Construction Zone Obstruction in Left Lane 48 85.7% 50 96.2% Yellow Bus Obstructing Right Lane 53 94.6% 46 97.9% Truck in Right Lane, Ped Emerging from in Front of
Bus 53 94.6% 47 97.9%
Average Across Scenarios (and all participants) 344 87.8% 330 94.0%
3.3 Summary of Results
All of the crashes occurred when the crosswalk was in the MSYM condition and located on the near side of the side street at the T-intersection. No crashes occurred with either MSYMs or AYMs when the crosswalk was located on the far side of the side street. This experiment did not test the scenario in which the obscuring truck was positioned immediately adjacent to the crosswalk in the MSYM condition on the far side of the T-intersection and at the Advance Yield line before the intersection in the AYM condition.

22
Based on the results of Task 1 in which no accidents occurred when the crosswalk was on the far side of the T-intersection, a prediction can be made that crashes would more likely have occurred on the far side had the truck stopped in front of the stop bar in the MSYM condition. In the AYM condition, the markings and the truck would be on the near side of the cross street, and with the crosswalk on the far side of the intersection, it is likely no crashes would occur. For this reason, the AYM condition is arguably safer than the MSYM condition when a truck is parked on both the near and far side of the T-intersection. Nevertheless, the fact that an equal number of crashes occurred for the MSYM and AYM conditions when the crosswalk was on the near side of the side street indicates that this placement may be dangerous.

23
4.0 Task 3: Field Observational Experiment
4.1. Method
4.1.1. Introduction
In the fourth experiment, the main observation was the yielding behavior of real world drivers to a staged pedestrian at four selected crosswalks in Greenfield, Massachusetts. During the staged crossings, video recordings of each crosswalk were taken as well as the audio CB-radio communications of the research team as they coordinated the crossings. Of primary interest in this experiment was whether AYMs resulted in higher yield rates and yield points further back from the crosswalk. In addition, in order to study a condition that best emulated the guidance of the MUTCD, an impromptu experiment was conducted which looked at the driver’s line of sight by removing parallel-parked vehicles near the studied crosswalks.
4.1.2. Crosswalks
Working closely with town officials and police, four crosswalks in Greenfield, Massachusetts were selected for this experiment. Each crosswalk was within three blocks of the downtown area and had frequent pedestrian crossings. Each crosswalk contained only the zebra striped crosswalk markings during the initial phase of the experiment and was restriped with AYMs during the later phase of the experiment. Two of the crosswalks were midblock crosswalks located on Main Street and Court Square. The crosswalk located on Main Street consisted of two travel lanes, one in each direction, and two parking lanes. The crosswalk located on Court Square consisted of a wide, single travel lane, a parking lane on the left and a bus stop on the right. The other two crosswalks were located at T-intersections. Of these, the first crosswalk, located at the corner of Federal and Church Streets, had a crosswalk located immediately before the intersection (for traffic approaching from the north) with a side street to the left. The second crosswalk, located at the corner of Federal and Osgood Streets, also had a crosswalk located immediately before the intersection with a side street to the right. An edited Google Earth screen capture of the studied crosswalks is provided in Figure 10, with locations of crosswalks labeled and the direction of travel for traffic that was studied at each crosswalk illustrated with a white arrow. The placement of the AYMs is also indicated in Figure 10.

24
Figure 10: Crosswalks Used in Experiment
Note: (A) Main Street (midblock crosswalk); (B) Court Square (midblock crosswalk); (C) Federal & Osgood Streets (T-intersection crosswalk, branch to right) (D) Federal & Church Streets (T-intersection crosswalk, branch to left). In order to assess the effectiveness of AYMs on driver yielding behavior, observations were taken at each crosswalk both before and after AYMs were placed. In the sections below, the “standard condition” refers to the observations that were taken at each crosswalk before AYMs were painted. Unlike in the simulator experiments described previously, the crosswalks in the standard condition for the field study discussed in this and the next chapter contained no stop bars. These were standard crosswalks that conformed to MUTCD guidelines. In the standard condition only the striped crosswalk markings (zebra stripes) were present. These crosswalk stripes were cleaned and repainted prior to making observations. The “advance condition” refers to the observations that were made after AYMs were placed. The placement of the AYMs conformed to MUTCD guidelines requiring that the markings be placed within 20-50 feet from the crosswalk. Their placement was determined by using the emergency stopping distance of a vehicle traveling at the posted speed limit. For example, a driver that sees an unexpected pedestrian entering the crosswalk and executes an emergency stop starting at the AYMs should not intersect the crosswalk. If the calculated stopping distance would place the AYMs within an intersection, the markings were moved out of the intersection and placed in line with the corner of the two intersecting roadways. In these situations (Federal & Osgood Streets and Federal & Church Streets), the adjustments did not place any of the studied crosswalks outside of the 50 foot maximum specified by the MUTCD guidelines.

25
4.1.3. Experimental Setup
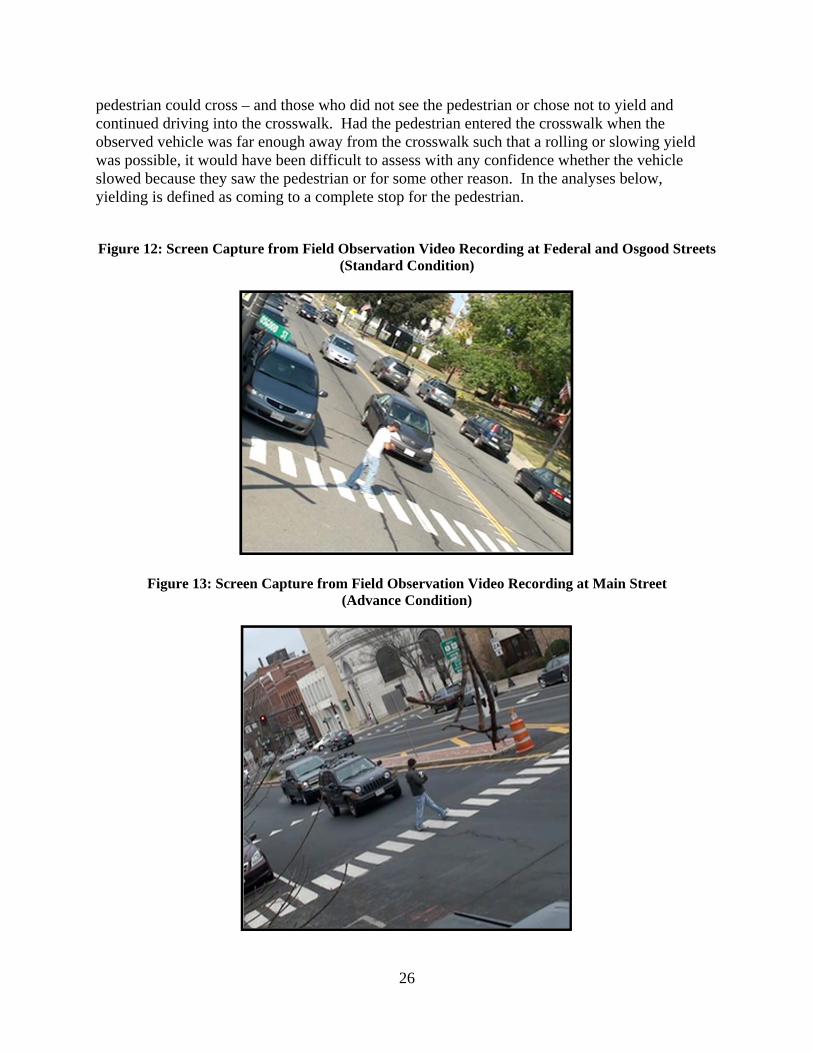
A large staged vehicle (a rented SUV or pickup truck) was placed in the parallel parking spot immediately adjacent to the crosswalk parked in the direction of the tested vehicle. A high fidelity digital video camera was attached fifteen to twenty feet up the nearest convenient tree or light pole and pointed at the crosswalk. Strips of white tape six inches long were placed along the centerline of the street as a gauge to mark distances so that the vehicular stopping distance could be judged from the video. The tape was set at two-foot intervals beginning in the area from the crosswalk to 20 feet away. From 20 feet to 60 feet from the crosswalk, the strips were set in ten-foot intervals. Figure 11 describes the general setup for the observational experiment and Figures 12 and 13 contain screen captures of the field experiment. In both cases (Figures 12 and 13) vehicles have stopped and staged pedestrians are in the crosswalk. Note the tape markings on the centerline at 2-foot intervals. Staged vehicles (rented pickups or minivans) are in marked parking spots immediately adjacent to crosswalk.
Figure 11: Generalized Crosswalk Setup for Observational Experiment
The research team consisted of four members: three researchers (the spotter, the observer/data recorder and the staged pedestrian) and a safety agent (a police officer). The role of the spotter was to identify vehicles approaching the crosswalk and to signal the staged pedestrian when it was time to enter the crosswalk. The observer/data collector’s job was to record the behavior of the observed vehicle and note whether a proper yield was made. The staged pedestrian’s job was to approach the crosswalk when signaled to do so, take a single step from the curb into the crosswalks and then stop, using body language that indicated a desire to cross (one foot forward and attempting to make eye contact with approaching driver). The staged pedestrian timed his or her entry into the crosswalk such that the observed vehicle would have to come to a complete stop in order to yield to him or her. Acknowledging that yielding does not always lead to stopping, the rationale for the timing of the crosswalk entries was to more easily discriminate between those drivers who saw the pedestrian and responded properly – by stopping so the
26
pedestrian could cross – and those who did not see the pedestrian or chose not to yield and continued driving into the crosswalk. Had the pedestrian entered the crosswalk when the observed vehicle was far enough away from the crosswalk such that a rolling or slowing yield was possible, it would have been difficult to assess with any confidence whether the vehicle slowed because they saw the pedestrian or for some other reason. In the analyses below, yielding is defined as coming to a complete stop for the pedestrian.
Figure 12: Screen Capture from Field Observation Video Recording at Federal and Osgood Streets
(Standard Condition)
Figure 13: Screen Capture from Field Observation Video Recording at Main Street (Advance Condition)

27
The safety agent was a local police officer hired to prevent local pedestrians not involved in the experiment from walking out into the crosswalk during the experiment. If a pedestrian did need to cross, the officer would enter the crosswalk, stop traffic and act as a crossing guard for the pedestrian. To prevent observed drivers from reacting to the presence of a police officer in the vicinity, a blind was placed to hide the officer from oncoming traffic, but such that the officer would be close enough to the crosswalk to be able to intervene if a pedestrian needed to cross. All four members of the team were provided hand-held radios for communicating with each other, and another was mounted on the fixture holding the video camera. This arrangement ensured that audio communications between the research team would be recorded along with the video recording of the staged crossings.
4.1.4. Procedure
The same procedure was followed for observations at all four crosswalks in the experiment. For each observation, the spotter identified a vehicle approaching the crosswalk by stating the vehicle type (sedan, SUV, pickup truck, etc.) and color. The spotter ensured that there was sufficient space between the target vehicle and the car in front of it such that the target vehicle would not be influenced by the actions of any vehicles ahead. Once the spotter called out the vehicle over the radio, the staged pedestrian approached the crosswalk, took a single step into the crosswalk and was positioned such that he or she was partially obscured by the staged vehicle parked adjacent to the crosswalk. The observer/data recorder then made notes regarding whether the driver yielded to the staged pedestrian and whether a yield was a hard stop. If anything interfered with the driver’s approach to the intersection, such as another vehicle pulling out of a side street or parallel parking spot or another pedestrian entering the sidewalk (requiring an intervention from the safety agent), then the data from that observation was discarded.
A total of 100 observations for the standard condition were recorded in the same fashion at each of the four crosswalks. A few weeks later, after AYMs were painted, another 100 observations for the advance condition were recorded. In the advance condition, 50 observations were recorded with the staged vehicle moved back one parallel parking place and with the space closest to the crosswalk left empty. Because time allowed at the Federal & Osgood Streets crosswalk this was also done a second time with the staged vehicle moved back two spots, with two empty spaces preceding the crosswalk. The original proposal did not call for these observations with additional empty spaces. The review of the standard condition results, however, became relevant to evaluate the effect of having the space between the AYMs and the crosswalk devoid of cars. Therefore, the required 100 observations were divided between conditions in which zero or one parking spaces were vacated. In one location (Federal & Osgood) an additional 50 observations were recorded, as it was allowed for by the geometry of the roadway and arrangement of parking spaces in that area. See Figure 14 for an example of the setup. In the MUTCD, it is stated that no vehicles should be parked between the AYMs and the crosswalk. However, parallel parking spots are often found immediately adjacent to crosswalks.

28
Figure 14: Generalized Setup and Driver Line of Sight for Observations Taken with 0, 1 or 2 Empty Spaces Immediately Before the Crosswalk
4.1.5 Dependent Variables
In this experiment, a “yield” is defined as a driver coming to a complete stop for the pedestrian. The dependent variables for this experiment included: 1) whether or not an approaching vehicle yielded (stopped) for the staged pedestrian, and 2) for those drivers who did yield, the distance from the crosswalk (estimated from video, in feet) the vehicle stopped. These variables were recorded for both standard crosswalk and AYM conditions, including the additional observations of conditions where the spaces immediately before the crosswalk were vacant to improve the approaching driver’s sightline.
4.2 Results
4.2.1. Yielding Behavior
The yielding behavior of the observed drivers in this experiment is summarized in Table 6. Recall that for the purposes of this experiment, because the staged pedestrian was not presented until the vehicle was within approximately five or six seconds of the crosswalk, yielding is defined as the approaching vehicle coming to a complete stop.
The Court Square crosswalk was a midblock crosswalk near the town common and town hall in Greenfield, Massachusetts, with wide roads and relatively low speeds compared to other crosswalks that were studied. The square contained a bus stop at which the Pioneer Valley Transit Authority (PVTA) and charter bus companies frequently picked up and dropped off passengers. Additionally, the area contained a high concentration of pedestrians crossing the street, which made it ideal for the experiment.

29
Table 6: Yielding Behavior of Observed Drivers at Greenfield, Massachusetts Crosswalks in Standard and Advance Conditions
Crosswalk Location
Empty Spaces
Adjacent*
Total Observations
Total Yields
% Yields
Total Observations
Total Yields
% Yields
Court Square 0 100 26 26.0 50 12 24.0 1 -- -- -- 50 20 40.0
Federal & Church
0 99 38 38.4 50 27 54.0 1 -- -- -- 52 47 90.4
Federal & Osgood
0 102 18 17.6 49 10 20.4 1 -- -- -- 50 18 36.0 2 -- -- -- 50 33 66.0
Main Street 0 100 3 3.0 52 10 19.2 1 50 28 56.0 49 29 59.2
*Note: The number of empty spaces immediately adjacent to crosswalk. “0” = staged vehicle parked in spot immediately adjacent to crosswalk. “1” = 1 empty space. “2” = 2 empty spaces. At Court Square (a midblock crosswalk), 100 observations were taken during the standard condition with zero empty spaces adjacent to the crosswalk (see Figure 10B). In the advance condition, 50 observations were taken with zero empty spaces adjacent and 50 were taken with one empty space adjacent. With zero empty spaces adjacent, there was no significant change in the yielding behavior of approaching drivers. In the standard condition, 26% of drivers yielded to pedestrians as compared to 24% in the advance condition. However, in the advance condition when the space closest to the crosswalk was kept empty, yielding increased to 40% of approaching drivers.
At Federal and Church Streets (a T-intersection crosswalk with the branching road to the left of traffic approaching from the north), in the standard condition 99 observations were taken with zero empty spaces adjacent to the crosswalk. In the advance condition, 50 observations were taken with zero empty spaces adjacent and 52 were taken with one empty space adjacent. It should be noted that there was a commercial driveway (about the same width as a parking spot) between the crosswalk and the nearest parallel parking spot, making the “zero empty spaces” condition in this crosswalk similar to that of the “one empty space” condition of the other three crosswalks. With zero empty spaces adjacent, yielding increased from 38.4% in the standard condition to 54.0% in the advance condition. With one empty space adjacent in the advance condition, yielding behavior of approaching drivers improved markedly to 90.4%.
At Federal and Osgood Streets (a T-intersection crosswalk with the branching road to the right of traffic approaching from the north), in the standard condition 102 observations were taken with zero empty spaces adjacent to the crosswalk. In the advance condition, 49 observations were taken with zero empty spaces adjacent, 50 observations were taken with one empty space adjacent, and 50 observations were taken with two empty spaces adjacent to the crosswalk. With zero empty spaces adjacent, yielding behavior did not change significantly from the standard condition, with 17.6% of vehicles yielding, to the advance condition, with 20.4% of vehicles yielding. With one empty space adjacent in the advance condition, yielding behavior increased to 36.0%. A decision was made in the field to take 50 additional observations with two empty

30
spaces adjacent to the crosswalk. With these conditions, yielding behavior increased to 66.0% of approaching vehicles.
At Main Street (a midblock crosswalk), in the standard condition 100 observations were taken with zero empty spaces and 50 were taken with one empty space adjacent to the crosswalk. In the advance condition, 52 observations were taken with zero empty spaces and 49 were taken with one empty space adjacent to the crosswalk. In the standard condition, only 3.0% of oncoming vehicles yielded to our pedestrian with zero empty spaces whereas 19.2% yielded in the advance condition. With one empty space, yielding behavior improved markedly in both conditions with 56.0% yielding in the standard condition and 59.2% yielding in the advance condition.
4.2.2. Stopping Distance
An analysis of stopping distance for yielding vehicles was conducted. Stopping distance was determined by estimating the position of the yielding vehicle’s front bumper relative to the tape lines made on the roadway in the video record. Due to parked cars and the lack of a convenient place to put the equipment, laser distance recorders could not be used. As a result, stopping distance had to be estimated from the white strips placed in the roadway at two-foot increments. The results are summarized in Table 7.
With zero spaces empty adjacent to the crosswalk, the presence of the advance yield lines had little effect on the stopping distance of the vehicles that did yield. As seen in Table 7, in some cases, the average stopping distance actually decreased. However, when parking spaces adjacent to the crosswalk were vacated, the average stopping distance of vehicles increased. It should be noted that all of the stopping distances were less than the distance the AYMs were placed from the crosswalks. In other words, the vast majority of the drivers who did stop did not stop at the AYMs, but instead rolled over them and stopped somewhere between the AYMs and the crosswalk.
Table 7: Estimated Average Stopping Distance from Crosswalk for Yielding Vehicles in Observational Experiment
Crosswalk Location Spaces Adjacent* Average Stopping Distance (ft)
Standard Condition Advance Condition
Court Square 0 14.7 10.0 1 -- 19.9
Federal & Church 0 10.9 11.8 1 -- 17.0
Federal & Osgood 0 16.8 13.6 1 -- 17.1 2 -- 19.5
Main Street 0 13.0 17.7 1 17.6 23.9
*Note: The number of empty spaces immediately adjacent to crosswalk. “0” = staged vehicle parked in spot immediately adjacent to crosswalk. “1” = 1 empty space. “2” = 2 empty spaces.

31
4.3 Summary of Results
On average, drivers yielded 29.4% of the time when the AYMs were present, but only 21.3% of the time when the MSYMs were present. The fact that, on average, drivers stopped closer to the crosswalk in the advance condition than the standard condition may indicate a general pattern and cause for concern. Alternatively, it could indicate that the increase in the percentage of drivers yielding in the advance condition occurs for those pedestrians who stepped out too late for drivers to stop in the standard condition, but not too late for drivers to stop in the advance condition. Drivers in the standard condition may well have struck the pedestrian had the pedestrian stepped out into traffic unwittingly in a real life situation.

32
This page left intentionally blank.
33
5.0 Task 4: In-Vehicle Field Experiment
5.1. Method
5.1.1. Introduction
In this experiment, the effect of AYMs on driver behavior was investigated. However, instead of staging crossings, drivers were observed as they drove a route that intersected all four crosswalks. Fitted with an eye tracker and accompanied by a licensed driving instructor, drivers operated a driving school vehicle. The primary interest was whether drivers scanned for pedestrians more often when AYMs and signage were present than when MSYMs were in place.
5.1.2. Participants
Working closely with a Greenfield, Massachusetts driving school, a total of 32 drivers were recruited for the experiment. Sixteen drivers were observed when the crosswalks were equipped with MSYMs. Several weeks later, after the AYMs and signage were put in place, a second cohort of 16 drivers was observed (advance condition). Sixteen males and 16 females participated in the experiment, ranging in age from 18-51, with an average age of 27.8. All of the drivers recruited for the study had at least 18 months of driving experience.
5.1.3. Crosswalks & Experimental Setup
The crosswalks used for this experiment were the same as were used in Task 3 (refer to Figure 10). The experimental set up was similar to that described in Figure 11. However, because this was an in-vehicle experiment with drivers operating vehicles on a route that would intercept all four crosswalks, each crosswalk had to have a staged vehicle and safety officer (in Task 3, only one crosswalk was studied at a time). This requirement presented logistical challenges. Data for each condition were collected over the course of three back-to-back days, with six to seven time slots for drivers per day. Four large pickup trucks were rented the afternoon before the first day of collection and stationed at the Greenfield, Massachusetts police station and the meters for the parking spots immediately adjacent to each target crosswalk were bagged with orange “no parking” signs. The morning of the experiment, the pickup trucks were positioned at each crosswalk. After the placement of the trucks, members of the lab met with the four police officers assigned to the experiment to act as safety agents at each crosswalk.
Due to the placement of large vehicles in the parking spots nearest each crosswalk as part of the experiment, the police officers were present to act as crossing guards for any pedestrians not related to the experiment. To keep themselves concealed from drivers and avoid biasing driver behavior, officers sat in the passenger seat of the pickup trucks that were parked near the crosswalk. The police officers and researchers exchanged cell phone numbers in case there was an issue with the experiment. The route began and terminated at the driving school and intersected the crosswalks in the same direction as observed traffic in Task 3 (as illustrated in Figure 15).

34
Figure 15: Route for In-Vehicle Experiment (Task 4), with Route Direction Indicated by Yellow Arrows, Crosswalks Indicated by Number in Circles
Note: (1) Court Square, (2) Main Street, (3) Federal & Church Streets, (4) Federal & Osgood Streets.
5.1.4. Procedure
Drivers were randomly assigned to participate in the standard or advance condition. Six to seven drivers were scheduled each day and one driver was run at a time. In order to prevent biasing their behavior, the driver was not informed of the true purpose of the experiment, which was to evaluate how they scan the road at the target crosswalks. Instead, the drivers were told that the experiment was intended to evaluate day-to-day performance of drivers of various ages. Once the informed consent form was signed, drivers were taken out to a driving school car which they would use to drive the route illustrated in Figure 15.
Once in the car, drivers were instructed to adjust the seat and mirrors to their liking. A licensed driving instructor was present in the passenger seat whose job was to provide the driver with turn-by-turn instructions and to intervene if the driver made a mistake. The driving school car was a mid-size automatic transmission four-door sedan with a passenger side brake pedal installed for the driving instructor. Once situated in the driving school vehicle, the driver was then fitted and calibrated with a mobile eye tracking system. A member of the research team rode along in the back seat to monitor the eye tracking digital recorder during the ride. Once the eye tracker was calibrated and recording, the driver was instructed to drive the specified route as per their normal habits. The route took approximately twenty minutes to complete and no staged pedestrians were used during the experiment. The eye tracking record was instead used to

35
determine if the driver anticipated the potential presence of a pedestrian entering the crosswalk hidden by the large vehicle immediately adjacent to the crosswalk. Once the driver finished driving the route and had returned to the driving school, the eye tracker was removed and the driver was invited back into the driving school for debriefing.
5.1.5. Dependent Variables
The dependent variable in this experiment was the presence or absence of a glance toward the area from which the pedestrian could emerge from behind the obscuring staged vehicle. Glances were measured with the lab’s mobile eye tracking system.
5.2 Results
5.2.1. Glances
The eye tracking record for each driver was analyzed, with the main interest being how drivers scanned for potential pedestrians in the crosswalks in both the standard and advance conditions. Two independent reviewers who were not involved with the data collection scored each driver’s video record from their eye tracking scene camera and came to consensus on any trials on which they disagreed. To prevent bias in scoring, reviewers did not know which group the drivers were assigned to (standard or advance) or the age and gender of the drivers. Reviewers determined whether or not drivers made eye glances toward the area from which pedestrians might emerge as the driver approached the crosswalk.
The hypothesis was that the AYMs and signage would provide visual cues to the driver that a pedestrian may be in the crosswalk and, as a result, the driver would be more likely to direct eye fixations towards the area from which the pedestrian might emerge from behind the staged vehicle. Eye movements were recorded throughout the drive. However, the videos from the eye tracker tapes were analyzed only from the time the front of the driver’s vehicle crossed the back bumper of the staged vehicle to when the front of the driver’s vehicle intersected the crosswalk.
Results show that, with the exception of the one crosswalk at Federal and Church Streets, drivers did look more often towards the area from which a pedestrian might emerge. Figure 16 contains a summary of the results. At the Court Square crosswalk (midblock), the percentage of drivers glancing toward the area from which pedestrians might emerge increased from 75% in the standard condition to 86.7% in the advance condition. At the Main Street crosswalk (midblock), the percentage of drivers increased from 56.3% to 81.3%. At the Federal & Osgood Streets crosswalk (T-intersection), the percentage of drivers increased from 68.8% to 81.3%. Only the Federal & Church Streets crosswalk (T-intersection) remained the same at 75.0% in both conditions. This may be in part because there were no parking spots immediately adjacent to the crosswalk, so drivers had a longer opportunity to glance to check for hidden pedestrians (see Figure 12 for an example).
If one only considers the three crosswalks (Court Square, Main Street, and Federal & Osgood) in which vehicles could be parked immediately adjacent to the crosswalk, then on average, drivers in the advance condition were 25% more likely to glance toward the area in the crosswalk where

36
pedestrians are obscured than in the standard condition (a difference of 16.4 percentage points, 66.7% versus 84.1%).
Figure 16: Percentage of Drivers Glancing Toward Area Where Pedestrian May Emerge From
Behind Staged Vehicle, Immediately Adjacent to Crosswalk
Note: Pedestrian emerged from right in all but Court Square crosswalks.
5.3 Summary of Results
In three of the four crosswalks, drivers were more likely to scan to the side toward the area where pedestrians could emerge when AYMs were in place than when MSYMs were. The only exception was the Federal & Church crosswalk, where 75% of the drivers glanced in both conditions. This may be partially due to the fact that at this particular crosswalk, there was a commercial driveway between the crosswalk and the nearest parallel parking spot. Drivers had a much longer opportunity in that case to view pedestrians as they approached the crosswalk. In the other crosswalks, vehicles were parked immediately adjacent to the crosswalk itself, meaning that drivers had a shorter amount of time to view the sidewalk that was obscured by the vehicle.
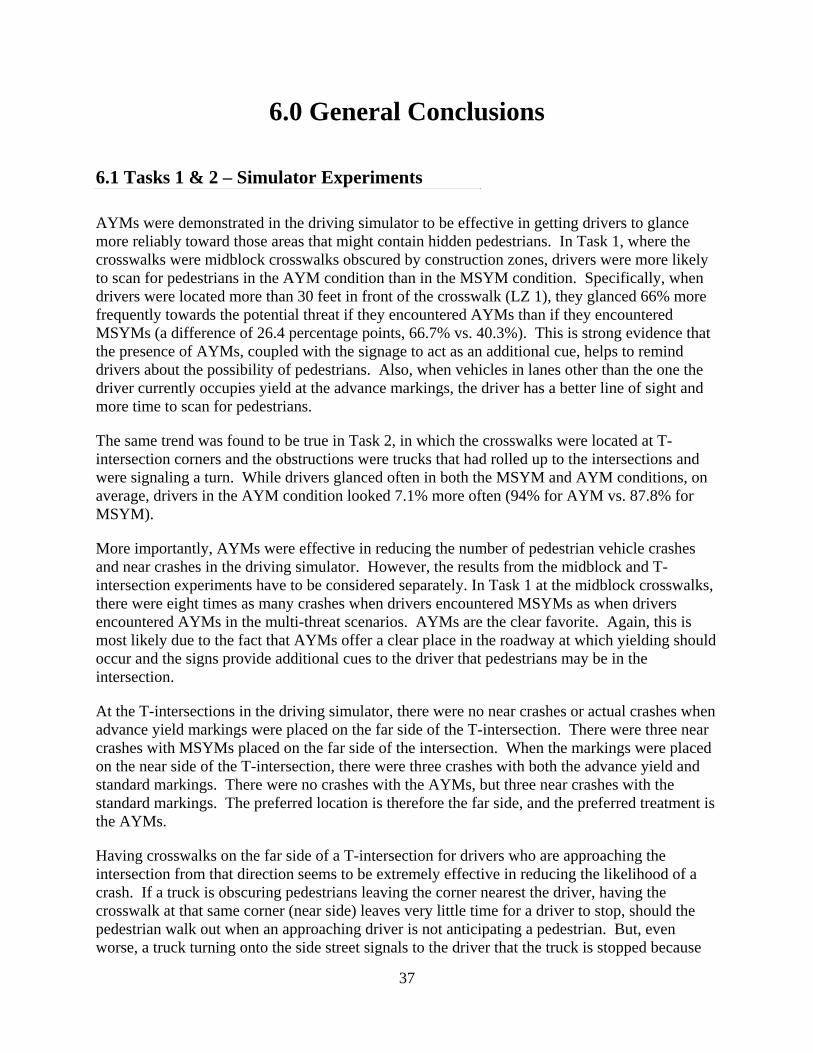
37
6.0 General Conclusions
6.1 Tasks 1 & 2 – Simulator Experiments
AYMs were demonstrated in the driving simulator to be effective in getting drivers to glance more reliably toward those areas that might contain hidden pedestrians. In Task 1, where the crosswalks were midblock crosswalks obscured by construction zones, drivers were more likely to scan for pedestrians in the AYM condition than in the MSYM condition. Specifically, when drivers were located more than 30 feet in front of the crosswalk (LZ 1), they glanced 66% more frequently towards the potential threat if they encountered AYMs than if they encountered MSYMs (a difference of 26.4 percentage points, 66.7% vs. 40.3%). This is strong evidence that the presence of AYMs, coupled with the signage to act as an additional cue, helps to remind drivers about the possibility of pedestrians. Also, when vehicles in lanes other than the one the driver currently occupies yield at the advance markings, the driver has a better line of sight and more time to scan for pedestrians.
The same trend was found to be true in Task 2, in which the crosswalks were located at T-intersection corners and the obstructions were trucks that had rolled up to the intersections and were signaling a turn. While drivers glanced often in both the MSYM and AYM conditions, on average, drivers in the AYM condition looked 7.1% more often (94% for AYM vs. 87.8% for MSYM).
More importantly, AYMs were effective in reducing the number of pedestrian vehicle crashes and near crashes in the driving simulator. However, the results from the midblock and T-intersection experiments have to be considered separately. In Task 1 at the midblock crosswalks, there were eight times as many crashes when drivers encountered MSYMs as when drivers encountered AYMs in the multi-threat scenarios. AYMs are the clear favorite. Again, this is most likely due to the fact that AYMs offer a clear place in the roadway at which yielding should occur and the signs provide additional cues to the driver that pedestrians may be in the intersection.
At the T-intersections in the driving simulator, there were no near crashes or actual crashes when advance yield markings were placed on the far side of the T-intersection. There were three near crashes with MSYMs placed on the far side of the intersection. When the markings were placed on the near side of the T-intersection, there were three crashes with both the advance yield and standard markings. There were no crashes with the AYMs, but three near crashes with the standard markings. The preferred location is therefore the far side, and the preferred treatment is the AYMs.
Having crosswalks on the far side of a T-intersection for drivers who are approaching the intersection from that direction seems to be extremely effective in reducing the likelihood of a crash. If a truck is obscuring pedestrians leaving the corner nearest the driver, having the crosswalk at that same corner (near side) leaves very little time for a driver to stop, should the pedestrian walk out when an approaching driver is not anticipating a pedestrian. But, even worse, a truck turning onto the side street signals to the driver that the truck is stopped because

38
of a turn, not because of a crossing pedestrian. This may be the explanation for why the crash rates for the advance yield and standard markings are the same at the T-intersection but radically different at the midblock crosswalk. Moving the crosswalk to the far side of the intersection allows more time for the driver to detect the presence of the pedestrian after having passed the truck and provides an earlier free line of sight to the pedestrian even if the driver misinterprets the turn signal.
6.2 Tasks 3 & 4 – Field Observations and In-Vehicle Drives
In Task 3, with the exception of Court Square, the presence of the AYMs and additional signage improved the number of drivers who yielded to pedestrians in the crosswalks when vehicles were parked immediately adjacent to the crosswalk. One possible explanation for the lack of an increase at Court Square is the low speed and relatively large width of the roadway (one travel lane, with a parking lane on the left and bus lanes on the right). Perhaps approaching drivers felt they could “get around” pedestrians in the crosswalk and drove considerably farther away from the side of the road on which the pedestrian was crossing. Moreover, because of the width of the road, if drivers occupied a position farther away from the pedestrian, the pedestrian could have been visible sooner and about at the same distance for both the MSYMs and AYMs. Thus, little would be gained with the AYMs.
The results do show that there is a measureable benefit to the AYMs and signage. However, including the removal (vacating) of the parking spot closest to the crosswalk provides an even more marked improvement in the yielding behavior of drivers. At all four crosswalks, the introduction of AYMs and signage alone, without eliminating any parking spots, improved yielding behavior by 8.2% on average. However, when the nearest parking spot to the crosswalk was vacated, the average improvement increased to 35.1%. Eliminating two parking spots (at Federal and Osgood Streets) improved yielding by 56.1%. It is clear that in order to maximize the benefit of AYMs, at a minimum, the parking spaces between the AYMs and the crosswalk should be eliminated.
In Task 4, as with the simulator experiments, AYMs appear to be more effective than MSYMs in causing approaching drivers to scan for potentially hidden pedestrians. This result provides an important validation of the simulator results and only serves to underline the benefit of AYMs in the field.
6.3 Recommendations
It is clear from the evidence presented in this report that AYMs reduce crashes and increase glances for pedestrians in a driving simulator. These results were validated in the field as drivers were shown to be more likely to look toward those areas where pedestrians might be obscured by vehicles near the crosswalk after AYMs were installed. It is recommended that AYMs be used at all marked, midblock crosswalks. At T-intersections on the driving simulator, pedestrians

39
were safest when the crosswalk was placed on the far side of the intersection and AYMs were used. When the crosswalk was on the near side, there were more near crashes when MSYMs were used. In the field, only near side crosswalks at T-intersections were observed. Of the two T-intersection field locations, drivers yielded more frequently when AYMs were used and they glanced more frequently towards the pedestrian in one location as opposed to the other. At T-intersections, the crosswalk should be placed on the far side wherever possible. Regardless of the location of the crosswalk (near or far side), AYMs should be used.
The data from the field observational experiment demonstrated that removing the parking spot immediately adjacent to the crosswalk led to much higher yield rates for oncoming vehicles. Drivers were much more likely to yield when they had a clearer line of sight, allowing the driver to perceive the presence of the pedestrian and respond accordingly. This was true at both midblock and T-intersection crosswalks. It is recommended that in both midblock and T-intersection crosswalks all parking spots between the crosswalk and the AYMs be eliminated.
Future work could include writing a technical article for publication. It is also recommended that additional training be developed for those in the field who would ultimately implement these designs. Finally, if the team concludes that this is something that should be pursued, the team can draft recommended modifications to the MUTCD. Included in the modifications would be recommended standards for AYMs at midblock and T-intersection crosswalks at both 4-lane and 2-lane roads with parallel parking spots immediately adjacent to the crosswalk.

40
This page left intentionally blank.

41
7.0 References
Beede, K. E., & Kass, S. J. (2006). Engrossed in conversation: The impact of cell phones on simulated driving performance. Accident Analysis and Prevention, 38(2), 415-421. FHWA, U.S. Department of Transportation. (2009). Manual on Uniform Traffic Control Devices for Streets and Highways (MUTCD). 2009 Edition. Muttart, J. W., Fisher, D. L., Knodler, M., & Pollatsek, A. (2007). Driving without a clue: Evaluation of driver simulator performance during hands-free cell phone operation in a work zone. Transportation Research Record, 2018, 9-14. National Highway Traffic Safety Administration (NHTSA), National Center for Statistics and Analysis. (2009). Traffic Safety Facts, 2009 Data. (Department of Transportation Publication No. DOT HS 811 394). Strayer, D. L., Drews, F. A., & Johnston, W. A. (2003). Cell phone-induced failures of visual attention during simulated driving. Journal of Experimental Psychology – Applied, 9(1), 23-32. Van Houten, R., Malenfant, J. E. L., & McCusker, D. (2001). Advance yield markings reduce motor vehicle/pedestrian conflicts at multilane crosswalks with an uncontrolled approach. Transportation Research Record, 1773, 69-74. Van Houten, R., McCusker, D, Huybers, S, Malenfant, J. E. L., & Rice-Smith, D. (2002). Advance yield markings and fluorescent yellow-green RA-4 signs at crosswalks with uncontrolled approaches. Transportation Research Record, 1818, 119-124. Zegeer, C. V., Stewart, J. R., Huang, H. H., & Lagerwey, P. A. (2002). Safety effects of marked vs. unmarked crosswalks at uncontrolled locations: Executive summary and recommended guidelines (FHWA-RD-01-075, Final Report). McLean, VA: Turner-Fairbank Highway Research Center, Federal Highway Administration.

42
This page left intentionally blank.

43
8.0 Appendices

44
This page left intentionally blank.

45
8.1 Appendix A
Experiment 1 Scenario Descriptions
Scenario 1 - Midblock Crosswalk with No Obstruction and Pedestrian entering from LEFT side.
As driver approaches crosswalk, pedestrian steps into crosswalk from the left side of the roadway approximately 5 to 6 seconds before driver’s arrival.
PLAN VIEW
Scenarios 2, 7 and 8 - Midblock Crosswalk with No Obstruction and No Pedestrian.
As driver approaches crosswalk, there are no obstructions or pedestrians in or around crosswalk.
PLAN VIEW

46
Scenarios 3 & 5 - Midblock Crosswalk with Work Zone in Left Lane and No Pedestrian.
As driver approaches crosswalk, there are obstructions and no pedestrians.
PLAN VIEW
Scenarios 4 & 6 - Midblock Crosswalk with No Obstruction and the Pedestrian entering from RIGHT side.
As driver approaches crosswalk, there are no obstructions and no pedestrians in or around crosswalk.
PLAN VIEW

47
Scenario 9 - Midblock Crosswalk with Obstruction in Left Lane and Pedestrian at the middle of the crosswalk attempting to traverse to the RIGHT.
As driver approaches crosswalk, there are obstructions and pedestrians in or around crosswalk.
PLAN VIEW

48
This page left intentionally blank.
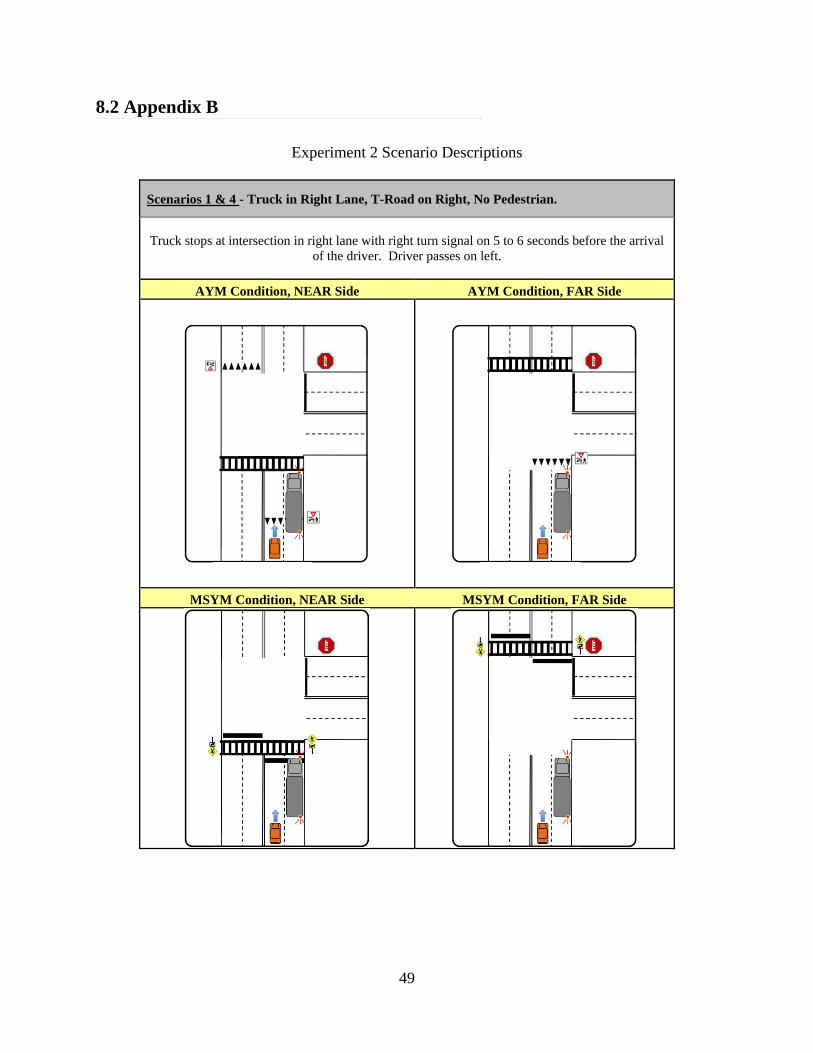
49
8.2 Appendix B
Experiment 2 Scenario Descriptions
Scenarios 1 & 4 - Truck in Right Lane, T-Road on Right, No Pedestrian.
Truck stops at intersection in right lane with right turn signal on 5 to 6 seconds before the arrival of the driver. Driver passes on left.
AYM Condition, NEAR Side AYM Condition, FAR Side
MSYM Condition, NEAR Side MSYM Condition, FAR Side

50
Scenario 2 - Truck in Left Lane, T-Road on Right, No Pedestrian.
Truck stops at intersection in left lane with left turn signal on 5 to 6 seconds before the arrival of the driver. Driver passes on right.
AYM Condition, NEAR Side AYM Condition, FAR Side
MSYM Condition, NEAR Side MSYM Condition, FAR Side
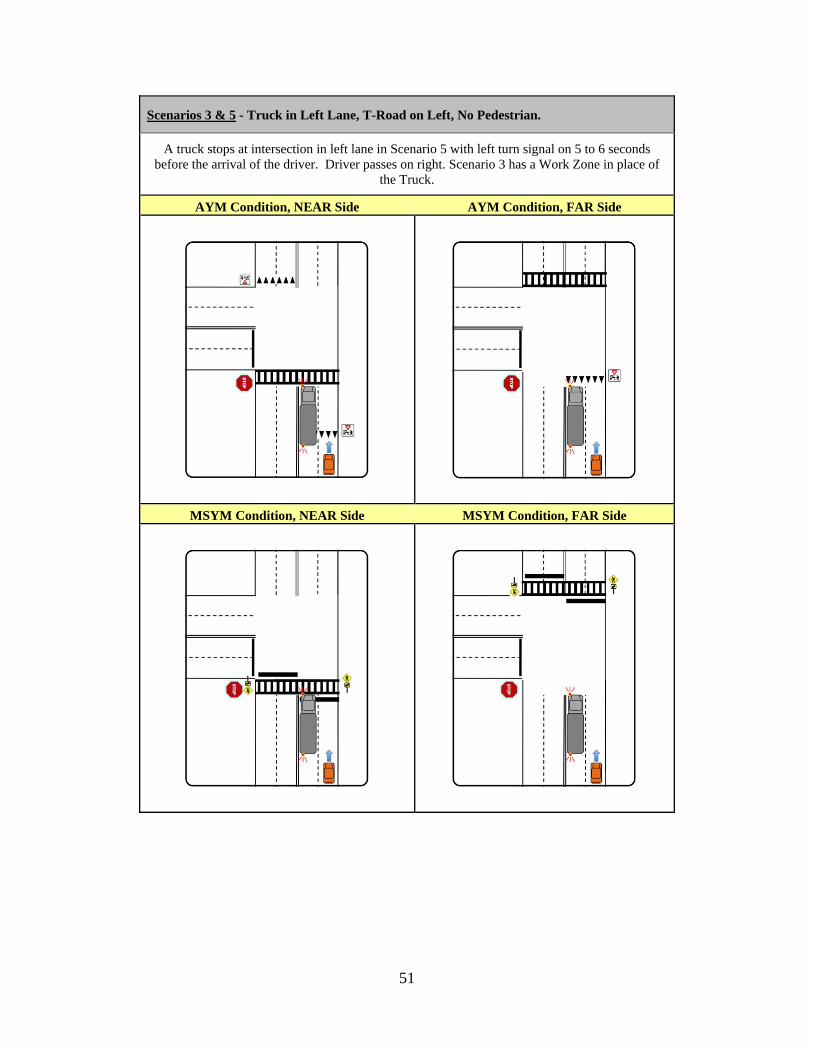
51
Scenarios 3 & 5 - Truck in Left Lane, T-Road on Left, No Pedestrian.
A truck stops at intersection in left lane in Scenario 5 with left turn signal on 5 to 6 seconds before the arrival of the driver. Driver passes on right. Scenario 3 has a Work Zone in place of
the Truck.
AYM Condition, NEAR Side AYM Condition, FAR Side
MSYM Condition, NEAR Side MSYM Condition, FAR Side
52
Scenario 7 - Truck in Right Lane, T-Road on Right, Pedestrian Emerges from in Front of Truck.
Truck stops at intersection with right turn signal on 5 to 6 seconds before the arrival of the driver. Driver passes on left. As driver is 3 seconds from crosswalk, pedestrian moves into driver’s
path.
AYM Condition, NEAR Side AYM Condition, FAR Side
MSYM Condition, NEAR Side MSYM Condition, FAR Side