Embed Size (px)
Citation preview
Evaluating the Economics of Construction and Demolition
Waste Minimisation and Zero Waste in the New Zealand
Construction Industry
Van Tran
2017
Evaluating the Economics of Construction and Demolition
Waste Minimisation and Zero Waste in the New Zealand
Construction Industry
Van Tran
A thesis submitted to
Auckland University of Technology
in fulfilment of the requirements for the degree of
Doctor of Philosophy (PhD)
2017
Faculty of Design and Creative Technologies
Auckland University of Technology
Attestation of Authorship
I, Van Dai Tran, hereby declare that this thesis is my own work and that, to the best of
my knowledge, does not contain any materials previously or currently published or
written by another person - nor does it contain any material which to a substantial
extent has been accepted for the award of any other degrees at any other universities.
Van Tran.

ABSTRACT
I
ABSTRACT
ABSTRACT
II
Currently, up to 50% of construction and demolition (C&D) waste is disposed of in
landfills contributing to significant environmental, social and economic costs to New
Zealand. However, current understanding of C&D costs is poor both internationally and
within New Zealand. This thesis addresses this deficit by developing a framework to
evaluate the economics of C&D waste minimisation. An understanding gained from this
research could help New Zealand develop appropriate strategies to address C&D waste
issues.
As the research problem is complex and wide-ranging, this study used a mixed-method
approach. Semi-structured elite interviews with highly experienced construction
personnel were used to identify factors affecting a C&D waste minimisation strategy.
This also established the context of the economic evaluation framework. Economic
modelling was subsequently employed to develop the economic evaluation framework.
The framework was then applied on two case studies: 1) a development of a large
education facility and 2) a refurbishment of a commercial office space.
The study found that:
1. a C&D waste landfill/cleanfill charge of $150 per tonne can a) deter construction
from disposing of waste; and b) force construction to rethink waste disposal
2. C&D waste minimisation can offer clients benefits including tangible returns (i.e.
cost savings) and intangible potentials (i.e. increased reputation)
3. there are costs of implementing C&D waste minimisation - but benefits gained
can outweigh such costs; and
4. the optimal rate of reduction for C&D waste in the non-residential projects
studied was 71% - 78%

ABSTRACT
III
Overall, this research has made a contribution to knowledge through the development
of a robust economic evaluation framework. Moreover, the study has also provided an
impetus for future work in C&D waste minimisation economics in New Zealand.

IV
This page has been intentionally left blank
CONTENTS
V
TABLE OF CONTENT
CONTENTS
VI
Table of Contents
ABSTRACT ................................................................................................................. i
ACKNOWLEDGEMENT ........................................................................................... xxi
CHAPTER 1 - INTRODUCTION ................................................................................ 1
1.1. Defining C&D Waste ..................................................................................... 2
1.1.1. Working Definition of Waste ................................................................... 3
1.1.2. Working Definition of C&D Waste ........................................................... 4
1.2. Problems with C&D Waste ............................................................................ 5
1.3. Estimates of potential gains from minimising C&D waste internationally ...... 7
1.3.1. Environmental Cost of C&D Waste ......................................................... 7
1.3.2. Social Cost of C&D Waste .................................................................... 10
1.3.3. Economic Cost of C&D Waste .............................................................. 11
1.4. Other dimensions affecting C&D waste minimisation .................................. 13
1.4.1. Political dimension of C&D waste minimisation .................................... 13
1.4.2. Technological dimension of C&D waste minimisation .......................... 15
1.5. Problem Statement, Research Aim and Research Question ...................... 16
1.5.1. Problem Statement ............................................................................... 16
1.5.2. Research Aim and Objectives .............................................................. 17
1.5.3. Research Question ............................................................................... 18
1.6. Thesis Contribution and Overview .............................................................. 19
CONTENTS
VII
CHAPTER 2 – LITERATURE REVIEW .................................................................... 21
2.1. Sources of C&D Waste ............................................................................... 22
2.1.1. Industry Fragmentation as a Source of Waste ...................................... 22
2.1.2. Wastages in Construction Practice ....................................................... 23
2.1.3. Waste Minimisation Efforts by Construction ......................................... 24
2.2. Waste Minimisation - A Systems Perspective ............................................. 25
2.3. Research Framework .................................................................................. 28
2.3.1. Relationships between Categories ....................................................... 29
2.4. The ‘Green’ Concept ................................................................................... 31
2.4.1. Green Cities .......................................................................................... 31
2.4.2. Green Infrastructure ............................................................................. 33
2.4.3. Green Construction .............................................................................. 36
2.5. Sustainable Construction ............................................................................ 39
2.5.1. Sustainability and Sustainable Development ........................................ 39
2.5.2. Sustainable Development in Urban Environments ............................... 40
2.5.3. Sustainability in Construction ................................................................ 41
2.5.4. Sustainability Understanding in Construction ....................................... 43
2.6. C&D Waste Management ........................................................................... 46
2.6.1. Waste Management Overview .............................................................. 46
2.6.2. Solid Waste Management in Construction ............................................ 49
CONTENTS
VIII
2.7. C&D Waste Minimisation ............................................................................ 54
2.7.1. Proposals for C&D Waste Reduction .................................................... 54
2.7.2. Recent C&D Waste Minimisation Programmes Worldwide ................... 57
2.7.3. Lean Construction as a C&D Waste Minimisation Method ................... 58
2.8. Zero Waste.................................................................................................. 60
2.8.1. Recent History ...................................................................................... 60
2.8.2. The Zero Waste Paradigm .................................................................... 62
2.8.3. Zero Waste Considerations at a National Level .................................... 63
2.8.4. Zero Waste Concept at the Regional Level .......................................... 66
2.8.5. Zero Waste at Industry Level ................................................................ 68
2.9. C&D Waste: Economic Considerations ....................................................... 73
2.10. Knowledge Gaps...................................................................................... 76
2.10.1. Definition of C&D waste in New Zealand ........................................... 76
2.10.2. Motivators for C&D waste minimisation ............................................. 77
2.10.3. Economic evaluation of C&D waste minimisation .............................. 78
2.11. Conclusion ............................................................................................... 79
CHAPTER 3 - AN OVERVIEW OF ECONOMIC EVALUATION METHODS ............ 81
3.1. Introduction ..................................................................................................... 82
3.2. Nature of this Research .............................................................................. 83
3.3 Economic Evaluation Method Overview ......................................................... 84
CONTENTS
IX
3.3. Financial Analysis (FA) ............................................................................... 86
3.3.1. Payback Period (PBP) ........................................................................ 86
3.3.2. Internal Rate of Return (IRR) ............................................................. 87
3.3.3. Net Present Value (NPV) ................................................................... 88
3.3.4. Real Options (RO) .............................................................................. 89
3.3.5. FA method used in this research ....................................................... 91
3.4. Economic Impact Analysis (EIA) ................................................................. 92
3.5. Benefit-Cost Analysis (BCA) ....................................................................... 93
3.6. Cost Effectiveness Analysis (CEA) ............................................................. 95
3.7. Fiscal Impact Analysis (FIA) ........................................................................ 95
3.8. Chosen Economic Evaluation Methods in this Study .................................. 96
3.8.1. Evaluation of Methods .......................................................................... 96
3.8.2. Choice of Economic Evaluation Methods for this Research ................. 98
3.9. C&D Waste Economic Models – A Comparison.......................................... 99
3.10. Conclusion ............................................................................................. 101
CHAPTER 4 - RESEARCH METHODOLOGY ....................................................... 103
4.1. Introduction ............................................................................................... 104
4.2. Problem Analysis ...................................................................................... 105
4.3. Research Aim ............................................................................................ 105
4.4. Philosophical Foundation of Research Methodology ................................ 106
CONTENTS
X
4.4.1. Ontology ............................................................................................. 106
4.4.2. Epistemology ...................................................................................... 108
4.5. Research Methodological Position ............................................................ 111
4.6. Research Method ...................................................................................... 113
4.6.1. Interview Research ............................................................................. 114
4.6.2. Modelling Research ............................................................................ 117
4.6.3. Case Study Research ......................................................................... 118
4.7. Conclusion ................................................................................................ 120
CHAPTER 5 - CONTEXTUALISING THE ECONOMIC EVALUATION FRAMEWORK
............................................................................................................................... 121
5.1. Phase 1: Establishing context of economic model .................................... 124
5.1.1. States of affairs of C&D waste minimisation in New Zealand ............. 125
5.1.2. Factors affecting C&D waste minimisation ......................................... 127
5.1.3. Benefits of C&D waste minimisation ................................................... 128
5.2. Stakeholders in Waste Minimisation ......................................................... 128
5.3. Research Focus ........................................................................................ 132
5.3.1. Stakeholder Groups ............................................................................ 132
5.3.2. Focus on processes ........................................................................... 133
5.4. Phase 2: Validation ................................................................................... 134
5.5. Conclusion ................................................................................................ 134
CONTENTS
XI
CHAPTER 6 - DEVELOPMENT OF THE ECONOMIC FRAMEWORK .................. 136
6.1. Overview of the Economic Framework ...................................................... 137
6.2. Focus of this Research ............................................................................. 137
6.3. Economic Framework: The Concept ......................................................... 138
6.4. Modelling Assumptions ............................................................................. 142
6.4.1. Market Assumptions ........................................................................... 142
6.4.2. Design-out-Waste Assumptions ......................................................... 144
6.4.3. Assumptions on Waste Minimisation Strategies ................................. 147
6.5. Economic Framework: The Models ........................................................... 150
6.5.1. Economic Models for Benefits of Zero Waste ..................................... 152
6.5.2. Economic Models for Costs of Zero Waste ......................................... 156
6.5.3. Benefit-Cost Ratio .............................................................................. 157
6.6. Applications of the Economic Framework ................................................. 158
6.7. Conclusion ................................................................................................ 159
CHAPTER 7 – CASE STUDY ONE........................................................................ 160
ECONOMIC EVALUATION OF MINIMISING MULTIPLE C&D WASTE STREAMS
............................................................................................................................... 160
7.1. Case Study Overview ................................................................................ 161
7.1.1. Project Background ............................................................................ 162
7.1.2. Design Costs ...................................................................................... 163
CONTENTS
XII
7.1.3. Design-out-waste Cost ....................................................................... 165
7.1.4. C&D Waste Breakdown ...................................................................... 166
7.2. Benefit Assumptions ................................................................................. 167
7.2.1. Direct Benefits .................................................................................... 167
7.2.2. Valuing Client’s Benefits ..................................................................... 168
7.3. Economic Calculations .............................................................................. 169
7.4. Unit Cost Calculations ............................................................................... 171
7.4.1. Base Rates for Calculations ............................................................... 171
7.4.2. Unit Cost of Collecting Waste ............................................................. 172
7.4.3. Unit Cost of Sorting Waste ................................................................. 172
7.4.4. Unit Cost of Recycling and Reusing Waste ........................................ 174
7.4.5. Unit Cost of Energy ............................................................................ 174
7.4.6. Design-out-waste Costs...................................................................... 175
7.5. Results of the Economic Evaluation .......................................................... 176
7.6. Analysis ..................................................................................................... 179
7.6.1. Basis of Comparison .......................................................................... 179
7.6.2. Costs versus Savings ......................................................................... 181
7.6.3. Analysis of Design-out-Waste ............................................................. 188
7.7. Benefit-Cost Analysis ................................................................................ 191
7.7.1. BCR of Level 1 ................................................................................... 193
CONTENTS
XIII
7.7.2. BCR of Level 5 ................................................................................... 193
7.7.3. BCR of Level 6 and Level 7 ................................................................ 194
7.8. Findings .................................................................................................... 195
7.8.1. Waste Strategy Level 1 – Landfilling .................................................. 195
7.8.2. Waste Minimisation Levels 6 and 7 .................................................... 196
7.8.3. Implications of landfill charge variable ................................................ 198
7.8.4. Limitation ............................................................................................ 198
7.9. Operatives in C&D Waste Minimisation .................................................... 199
7.9.1. Client and Project Manager (client side) ............................................. 199
7.9.2. Designers ........................................................................................... 200
7.9.3. Contractors ......................................................................................... 201
7.10. Conclusion ............................................................................................. 203
CHAPTER 8 – CASE STUDY TWO ....................................................................... 204
ECONOMIC EVALUATION OF MINIMISING SINGLE C&D WASTE STREAM .... 204
8.1. Case Study Overview ................................................................................ 205
8.1.1. Project Background ............................................................................ 206
8.1.2. Breakdown of Project Budget ............................................................. 207
8.2. Waste Generation Calculations ................................................................. 209
8.2.1. Design Costs ...................................................................................... 210
8.2.2. Design-out-waste Cost ....................................................................... 212
CONTENTS
XIV
8.2.3. Unit Cost of Brick ................................................................................ 215
8.3. Unit Cost Calculations ............................................................................... 215
8.3.1. Base Rates for Calculations ............................................................... 216
8.3.2. Unit Cost of Collecting Waste ............................................................. 216
8.3.3. Unit Cost of Sorting Waste ................................................................. 216
8.3.4. Unit Cost of Recycling and Reusing Waste ........................................ 217
8.3.5. Unit Cost of Energy ............................................................................ 218
8.4. Benefit Assumptions ................................................................................. 219
8.4.1. Direct Benefits .................................................................................... 219
8.4.2. Valuing Client’s Benefits ..................................................................... 220
8.5. Economic Evaluation Results .................................................................... 221
8.6. Analysis ..................................................................................................... 224
8.6.1. Basis of Comparison .......................................................................... 224
8.6.2. Costs versus Cost Savings ................................................................. 226
8.6.3. Analysis of Design-Out-Waste ............................................................ 230
8.7. Benefit-Cost Analysis ................................................................................ 234
8.7.1. BCR of Level 1 ................................................................................... 236
8.7.2. BCR of Level 2 and Level 3 ................................................................ 236
8.7.3. BCR of Level 4 ................................................................................... 236
8.7.4. BCR of Level 5 ................................................................................... 237
CONTENTS
XV
8.7.5. BCR of Level 6 and Level 7 ................................................................ 237
8.8. Findings .................................................................................................... 239
8.8.1. Waste Strategy Level 1 – Landfilling .................................................. 239
8.8.2. Levels 6 and 7 Waste Minimisation Strategies ................................... 239
8.8.3. Implications of landfill charge variable ................................................ 241
8.8.4. Limitation ............................................................................................ 242
8.9. Operatives in C&D Waste Minimisation .................................................... 243
8.9.1. Client and Project Manager (client side) ............................................. 243
8.9.2. Designers ........................................................................................... 244
8.9.3. Contractors ......................................................................................... 244
8.10. Validation Summary ............................................................................... 245
8.11. Conclusion ............................................................................................. 246
CHAPTER 9 – CONCLUSION ............................................................................... 247
9.1. Introduction ............................................................................................... 248
9.2. Conceptual and Theoretical Challenges ................................................... 248
9.3. Research Problem .................................................................................... 249
9.1. Restatement of Research Objectives ........................................................ 250
9.2. Objective One ........................................................................................... 250
9.2.1. Objective Statement ........................................................................... 250
9.2.2. Method................................................................................................ 251
CONTENTS
XVI
9.2.3. Findings .............................................................................................. 253
9.2.4. Implications ......................................................................................... 255
9.3. Objective Two ........................................................................................... 257
9.3.1. Objective Statement ........................................................................... 257
9.3.2. Method................................................................................................ 257
9.3.3. Findings .............................................................................................. 257
9.3.4. Implications ......................................................................................... 259
9.4. Objective Three ......................................................................................... 261
9.4.1. Objective Statement ........................................................................... 261
9.4.2. Method................................................................................................ 262
9.4.3. Findings .............................................................................................. 263
9.4.4. Implications ......................................................................................... 270
9.5. Limitations ................................................................................................. 273
9.6. Future Research ....................................................................................... 275
9.7. Contribution to Knowledge ........................................................................ 277
9.8. Research Finding Evaluation .................................................................... 278
9.9. Research Conclusion ................................................................................ 278
REFERENCES ....................................................................................................... 281
APPENDICES ........................................................................................................ 340
APPENDIX A – PHASE 1 INTERVIEW QUESTIONS ............................................ 341
CONTENTS
XVII
APPENDIX B – PHASE 1 INTERVIEW RESULTS ............................................. 342
APPENDIX C – PHASE 2 INTERVIEW QUESTIONS ......................................... 346
APPENDIX D – PHASE 2 INTERVIEW RESULTS ............................................. 347
APPENDIX E – ETHICS APPROVAL FROM AUT .............................................. 348
APPENDIX F – CASE STUDY 1 CALCULATIONS ............................................. 350
APPENDIX G – CASE STUDY 2 CALCULATIONS ............................................ 353
Figure 1: Holistic Approach to Understanding Zero Waste in New Zealand
Construction ............................................................................................................. 29
Figure 2: Integrated Waste Management. Source: EPA (2002) ............................... 47
Figure 3: Close-loop model of the ZeroWIN Project. Source: Curran & Williams
(2012) ....................................................................................................................... 64
Figure 4: Theoretical Hierarchy of C&D Waste Minimisation in New Zealand
Construction ........................................................................................................... 141
Figure 5: Tornado Chart of Benefits and Costs - Case Study One ......................... 182
Figure 6: Presentation of Results in Case Study One ............................................ 192
Figure 7: Tornado Chart of Benefits and Costs - Case Study Two ......................... 223
Figure 8: Representation of Results - Case Study Two.......................................... 235
Table 1: Relationship between Research Objectives and Research Questions ....... 18
CONTENTS
XVIII
Table 2: Lean Construction and its Impacts ............................................................. 58
Table 3: Comparison of Economic Evaluation Methods ........................................... 98
Table 4: Heraclitean Ontology vs. Parmenidean Ontology ..................................... 107
Table 5: Positivism vs. Interpretivism ..................................................................... 109
Table 6: Positivism vs. Interpretivism Summary ..................................................... 110
Table 7: Tipping Fees for C&D Waste in Auckland ................................................ 127
Table 8: Responsibilities of Stakeholders in Building Construction ........................ 144
Table 9: Commitments of Stakeholders ................................................................. 146
Table 10: List of C&D Waste Minimisation Strategies ............................................ 147
Table 11: Assumed Increases of Design Fees ....................................................... 148
Table 12: List of Modelling Variables...................................................................... 151
Table 13: Key Cost Formulae ................................................................................. 157
Table 14: Design Fee Breakdown .......................................................................... 163
Table 15: Design Fee for Individual Profession as Percentages of Total Project Cost
............................................................................................................................... 164
Table 16: Design Fees as Percentages of Project Budget ..................................... 165
Table 17: Demolition Waste Breakdown ................................................................ 166
Table 18: Construction Waste Breakdown ............................................................. 166
Table 19: Costs of New Materials .......................................................................... 170
Table 20: Charge-out Rates for Machinery ............................................................ 171
CONTENTS
XIX
Table 21: Haulage Charge ..................................................................................... 171
Table 22: Design Cost for Each Strategy ............................................................... 176
Table 23: Design-Out-Waste Cost for Each Strategy ............................................. 176
Table 24: Modelling Result - Case Study One ....................................................... 178
Table 25: Basis of Comparison Conversion ........................................................... 180
Table 26: Converted Results .................................................................................. 181
Table 27: Assumed Increases of Design Fees (Duplicate of Table 12) .................. 188
Table 28: Design Cost and Design-Out-Waste Cost for Each Strategy.................. 188
Table 29: Design Cost Breakdown for Each Profession ......................................... 189
Table 30: Design-Out-Waste Cost Breakdown for Each Profession ...................... 189
Table 31: BCR for Each C&D Waste Minimisation Strategy ................................... 192
Table 32: Refurbishment Project Summary ............................................................ 207
Table 33: Project Budget Breakdown - Percentage (Supplied by Building Owner) 208
Table 34: Breakdown of Project Budget – Dollar Value (Calculated) ..................... 208
Table 35: Key Modelling Assumptions (Brick Waste) ............................................. 209
Table 36: Design Fee for Each Profession as Percentage of Total Project Budget 211
Table 37: Design Fee for Each Profession ............................................................. 211
Table 38: Assumed Increases of Design Fees (Duplicate of Table 12) .................. 212
Table 39: Cost of Design Increases ....................................................................... 213
Table 40: Cost of Design-out-waste Increases ....................................................... 214
CONTENTS
XX
Table 41: Modelling Result - Case Study Two ....................................................... 222
Table 42: Modelling Results of Case Study Two .................................................... 225
Table 43: Design Cost and Design-Out-Waste Cost for Waste Minimisation
Strategies ............................................................................................................... 232
Table 44: Increases in Design-Out-Waste Cost (Percentage) ................................ 232
Table 45: Increases in Design-Out-Waste Cost (Dollar Value) .............................. 233
Table 46: BCR of C&D Waste Minimisation Strategies - Case Study Two ............. 234
Table 47: C&D Waste Minimisation Strategies in this Research ............................ 263
Table 48: Associating Research Findings with Research Questions ..................... 278
Table 49: Associating Research Findings with Research Objectives ..................... 278
Table 50: Associating Research Objectives with Research Aim ............................ 278
Table 51: Unit Cost Calculations ............................................................................ 350
Table 52: Case Study 1 Calculations ..................................................................... 351
Table 53: Case Study 2 Calculations ..................................................................... 353
ACKNOWLEDGEMENT
XXI
ACKNOWLEDGEMENT
This thesis would not have been possible without assistance and support from many
people that I have been privileged to meet and know.
Thank you to my primary research supervisor, Professor John E. Tookey, for your
supervision. Your inputs and guidance have been particularly helpful in shaping my
understanding and thinking in this research. Thank you also for your humanity and your
understanding and all the opportunities you provided during my study which allowed me
to provide for my young family.
To my secondary research supervisor, Dr. Dave Moore, I thank you for your advices in
this research and in life in general. Your professional and practical inputs have helped
me structure the work professionally; while your fatherly advices have helped me
become a good dad to my daughter Jewel and good husband to my wife Rose.
To the industry sponsors of this research, thank you. In particular, I would like to thank
Mr. Kevin Golding and GIB Plasterboards for co-funding my research scholarship and
for your continuing professional support. Thank you Mr. Wayne Sharman and BRANZ
for providing me a research scholarship.
I also wish to thank the people who have made my PhD journey enjoyable. First and
foremost I thank my Mum Tran Thi Lu and my Dad Tran Quy An for their
encouragement and support; which, ultimately led to the completion of this thesis. I
would also like to thank my siblings, my brother Tran Dai Quoc Viet and his wife Ho
Hao and my sister Tran Dieu Diem Hoa, for their support along the way.
ACKNOWLEDGEMENT
XXII
To my friends and colleagues in the New Zealand construction industry, thank you for
all of your inputs and feedback for this study.
Above all, I would like to thank two special people in my life. To my wife Rose Le for all
her love, encouragement and patience throughout my studies. And especially to my
daughter Jewel Elena Tran for her unconditional love and her infectious laughter – you
are an angel in my life, providing me a purpose in life, allowing me to have fun and
giving me valuable downtimes to de-stress.
CHAPTER 1 – INTRODUCTION
1
CHAPTER 1 - INTRODUCTION
CHAPTER 1 – INTRODUCTION
2
The construction industry has an important role in the national economy of countries
around the world (Shakantu, 2005). Construction contributes significantly to the
competitiveness and prosperity of the overall economy both directly and indirectly
(Lawson, 2013). In direct terms, construction contributes between 5% and 7% of any
nation’s Gross Domestic Product (GDP) and is one of the largest employers in any
economy (Australian Bureau of Statistics, 2010; Building Performance, 2015; UK
Government, 2015). The indirect influences of construction on the economy are even
more pronounced, with the industry representing around 50% of Gross Fixed Capital
Formation in most countries (Wibowo, 2003; PwC, 2011).
However, construction is well-known for its ineffective use of resources, leading to
significant wastages (LePatner, 2008; Landin & Oberg, 2014). Recently significant
efforts have been invested in tackling the waste problem created in, and by, the
industry. The study reported in this thesis focuses on one aspect of these efforts: the
economics of construction and demolition (C&D) waste minimisation. By understanding
this aspect, it is anticipated that appropriate strategies can be made to improve waste
minimisation in the New Zealand construction industry.
1.1. Defining C&D Waste
C&D waste is a term collectively given to all waste generated by the construction
industry. Currently there is no single definition of C&D waste (Kumara, 2009). For
example, the Environment Protection Authority (EPA) in South Australia has two
definitions of C&D waste: one for inert stream and one for mixed stream (EPA, 2009).
CHAPTER 1 – INTRODUCTION
3
In New Zealand, C&D waste is not specifically defined in the Waste Minimisation Act
2008; rather it is included in the Ministry for the Environment’s (MfE) general definition
of waste – although a list of C&D waste streams is provided by the MfE (MfE, 2008;
MfE, 2017). This lack of C&D waste in New Zealand means that C&D waste
minimisation practices are not uniformly adopted between locations and authorities,
leading to variations in C&D waste classification and management strategies. In turns,
this means efforts to address C&D waste are different between locations which further
exacerbates the problems with C&D waste in construction.
This lack of a uniform C&D waste definition means that there is an urgent need to
define C&D waste in this study. The definition of C&D waste in this research should be
broad enough to cover the essence of C&D waste in construction context; but it should
be limited within the scope of the study.
1.1.1. Working Definition of Waste
Although New Zealand has a definition of ‘waste’ in the Waste Minimisation Act 2008
(MfE, 2008), the researcher feels that the MfE’s waste definition is too broad. Given the
research problem being investigated is wide-ranging, there is a need to provide
necessary focuses in this research to ensure the research problem can be addressed
within the allocated 3-year timeframe.
Therefore, a conscious decision was made in this research to adopt the definition of
‘waste’ offered by the United Nations Statistics Division (UNStats) due to its specificity.
In this study, ‘waste’ is defined as ‘materials that are not prime products for which the
generator has no further use in terms of purposes of production, transformation or
consumption, and of which the generator wants to dispose’ (UNStats, 2015).
CHAPTER 1 – INTRODUCTION
4
As shown in this definition, the main focus of current waste management paradigm
rests on the management of physical waste. This focus has been the main platform
upon which waste management strategies are formulated and executed (see, for
example, Hyder Consulting et al, 2011 or Marshall & Farahbakhsh, 2013). Although this
line of thought has allowed for successful implementations of many waste
management/waste minimisation strategies (e.g. Allen et al, 2012), it is becoming
outdated (Seadon, 2010). Current thinking around waste minimisation includes aspects
of the ‘lean’ concept. In this new paradigm, wastage includes non-quantifiable factors
such as time, delays, defects and under-utilisation of skills (Rogers Builders, 2010;
Mortensen Construction, 2013; Aitken, 2014).
1.1.2. Working Definition of C&D Waste
In the construction context, this new line of thinking of waste is particularly applicable.
C&D waste consists of two components: physical waste and process waste. The
physical component of C&D waste is generated during the construction and demolition
processes. Physical waste includes, but is not limited to, bricks, glass, plastics,
concrete, timber, asphalt, gypsum and metals. As the physical C&D waste consists of
many chemicals as a result of industrial processes, when discarded to the environment,
these waste streams can have significant negative effects to the surrounding
environments and on human health (Coudert et al 2013; Kijjanapanich et al, 2013).
On the other hand, process waste is mainly generated by the industry’s sub-optimal
operations. Process waste may include, but is not limited to, time, delays and skills.
Although both physical waste and process waste affect the bottom lines of construction
companies, it is the latter that can have the most significant effects on construction, as it
CHAPTER 1 – INTRODUCTION
5
undermines the ability of the industry to deliver stated outcomes. Further, process
waste can cost companies and industry significantly in term of productivity, which in
turns lowers the industry’s competitiveness. Process waste has been extensively
studied in the field of Lean Construction (Howell, 1999). Although the consideration of
process waste is required to provide a complete picture around C&D waste in
construction, the fact that it lies outside of the scope of this study means that C&D
waste does not cover this aspect in its definition.
Therefore, in this research C&D waste is defined as ‘materials which arise from the
construction and/or demolition of buildings, structures or likewise, for which the
generator has no further use for the purpose of continued production and/or
consumption, and of which the generator wants to dispose’ (UNStats, 2015).
1.2. Problems with C&D Waste
C&D waste is a significant problem world-wide due to it being generated in large
quantities throughout the life of a structure (Conlin, 2012; Hassan et al, 2012). C&D
waste is present in all stages: from construction to maintenance and renovation, and
finally though to demolition of the building or structure. The problem with C&D waste is
not new. In Brazil, Soibelman (1993) monitored the waste of seven materials in five
building sites and found values ranging from 5.06% to 11.62% in terms of cost. In
Norway, Sjoholt (1998) estimated that the costs due to nonconformity, errors,
alterations and wastage during the building process were around 10% of the total
building cost. It has been consistently shown in the literature that C&D waste represents
between 10% and 36% of all landfill waste worldwide (Kartam et al, 2004; Tam & Tam,
CHAPTER 1 – INTRODUCTION
6
2006; Tam, 2007; Yuan & Shen 2011; Hu, 2011; Hassan et al, 2012). The large
volumes of C&D waste can have significant environmental impacts due to leachate of
hazardous materials from chemical and industrial treatments (Wang et al, 2010;
Coudert et al 2013; Kijjanapanich et al, 2013).
It has been argued that a significant amount of C&D waste can be diverted by
implementing ‘design-out-waste’ concept (Chong et al, 2009; WRAP, 2011, 2012).
However, design-out-waste is not widely practised due mainly to a (false) perception of
its high cost of implementation (Osmani, et al, 2008). Perhaps this is the reason the
problem with waste generation in construction, and particularly C&D waste, continues to
persist.
Comparatively the situation in New Zealand is by turn much better and worse than
elsewhere. Latest figures from the Ministry for the Environment showed that nationally
C&D waste comprises 50% of all waste generated in New Zealand (MfE, 2013). An
area by area comparison showed construction in the Auckland region generated 35% of
the whole region’s waste output. Further, publicly available information shows that
performance figures for waste minimisation have not markedly improved between 1997
and present day, with The Ministry for the Environment website continues to cite C&D
waste arising as constituting circa 20% of all landfill and 80% of all cleanfill deposits,
just as they did in 1997 (MfE website, 2013). At the same time, the sizes of available
landfill and cleanfill sites in New Zealand have been significantly reduced due to C&D
waste being continually dumped into landfills or cleanfills (Kazor and Koppel, 2007). For
example, in the case of plasterboard-type products there is only one licensed cleanfill
disposal location in the Auckland region (the Envirofert facility at Tuakau). In turns, the
reduction of available landfills and cleanfills makes the problem with C&D waste even
CHAPTER 1 – INTRODUCTION
7
more acute. It has been argued that most C&D waste in New Zealand is disposed
unnecessarily due to sub-optimal processes (Level, 2015). The result is at least 50% of
C&D waste currently in landfills or cleanfills could be diverted. This shows there is a
need for immediate attention from all stakeholders in New Zealand, both inside and
outside of the construction industry, to address C&D waste.
1.3. Estimates of potential gains from minimising C&D waste
internationally
The cost of C&D waste can be broadly divided into three categories: Environmental
Cost, Social Cost and Economic Cost – but most attention is paid exclusively to the
economic component (Peng, 2010; Level, 2015).
1.3.1. Environmental Cost of C&D Waste
The environmental cost of C&D waste is represented by two areas: resource depletion
and pollution.
1.3.1.1. Resource Depletion
As shown in Section 1.2, construction’s ineffective use of materials in its production
processes represents a major problem. On the one hand, the industry continues to
require a significant amount of natural and virgin materials (Fadiya et al, 2014).
Available statistics shows that globally construction requires up to 50% of the world’s
energy, 50% of the world’s water uses and between 60% - 90% of the world’s timber
products (Willmott Dixon Co., 2010).
CHAPTER 1 – INTRODUCTION
8
On the other hand, the industry continues to generate a significant amount of C&D
waste – sometimes up to 50% of all landfill waste (Kievan, 2013; MfE, 2013). Further, it
has been documented that construction has contributed to the significant air pollution in
cities (23%) and drinking water pollution (40%) (Willmott Dixon Co., 2010). All this
represents in a severe depletion of natural resources.
It can be seen in the above argument that in the long term this ‘mine-build-discard’
mindset is not sustainable, given the world’s limited natural resources (Seadon, 2010).
Therefore, there is a need for construction to take a broader view of its actions and
reconsider its responsibilities, especially those around waste minimisation.
1.3.1.2. Pollution
Pollution caused by construction includes air, noise and soil pollution.
Air pollution includes dust generated during demolition and fumes from exhaust and
other combustible emissions of transport vehicles. Air pollution such as dust can cause
significant nuisance to the local communities if not managed properly. This type of
pollution can have significant effects on the surrounding communities during the
generation and disposal of C&D waste (Fayad & Bekhazi, 2009).
Noise pollution is mainly caused by construction and demolition activities. This type of
pollution can cause significant nuisance communities. Further, the vibration from
construction and/or demolition activities can also cause damages to surrounding
structures and buildings.
On the other hand, soil pollution is caused by leachate of heavy metals or chemicals
over time (Wang, 2010). Construction materials are often treated with chemicals to
prolong their working lives. When treated materials are disposed of in landfills, such
CHAPTER 1 – INTRODUCTION
9
chemicals are released into the environment as the materials breakdown, causing soil
and water pollution (van der Sloot et al, 1996). The effects of soil pollutions are
significant because they can affect the land and underground water tables which cities
rely on to serve their citizens.
Greenhouse gas (GHG) emission in the context of C&D waste is mainly generated
during the transportation and processing of C&D waste. As C&D waste is often bulky,
large machinery are required to transport and process it, resulting in a large amount of
carbon dioxide (CO2) being released into the atmosphere. It has been argued that the
construction industry generates an equivalent of 50% of all global greenhouse gases
(Willmott Dixon Co., 2010). Pollution and GHG emission can cost the country and the
planet significantly. These costs can be calculated in terms of health and wellbeing of
citizens. They can also be calculated in terms of the efforts and money spent on
mitigating the effects of such pollution. Further, the costs can be in terms of lost
opportunities such as the limited opportunities to reuse landfill sites due to potential
health hazards (Level, 2015).
However, most current C&D waste and C&D waste minimisation studies only briefly
mention the environmental issues related to pollution and GHG (see, for example:
Fayad et al, 2009; Fadiya et al, 2014; Wang et al, 2014; Kucukvar et al, 2015). A small
number of studies explore GHG in C&D waste minimisation. But they used estimates
and assumptions to model the effects of pollution in C&D waste minimisation (see, for
example: Coelho & de Brito, 2012; Kucukvar et al, 2015). In the researcher’s opinion,
this is an area which further research effort is needed.
CHAPTER 1 – INTRODUCTION
10
Overall, as can be seen in the discussions of environmental components above, C&D
waste can have significant effects on the surrounding environments. Therefore, there is
an urgent need for the construction industry to manage and minimise its C&D waste
output to reduce these environmental impacts.
Further, as the above environmental impacts can be severe and may have long term
impacts, their costs may be borne by the society in general. The following section
discusses the social cost of C&D waste in detail to provide an understanding of this
topic.
1.3.2. Social Cost of C&D Waste
Social cost is the costs to the communities and to construction companies in dealing
with the effects of C&D waste pollution. Social cost of C&D waste can be measured
directly or indirectly.
Direct social costs include reparation costs to damaged properties or costs to address
communities’ concerns. Reparation costs arise from the need to address damages to
structures and buildings caused by noise and vibration pollution. These costs are often
borne by construction companies. However, the fact that local communities suffer such
damages and discomfort before reparatory work is carried out means that the social
cost associated with this pollution is also significant. Community-related costs arise
from the need to address communities’ concerns regarding projects or critical activities
in such projects. For example, communities may be affected by the increase in traffic
during construction and/or demolition processes. Not only does the increased traffic
cause delays and congestions to local networks, it also increases the risk for public and
CHAPTER 1 – INTRODUCTION
11
workers’ safety, especially during peak hours or at schools’ opening and closing times.
For these reasons, the social cost to construction is significant, including oppositions to
a project by communities.
On the other hand, indirect social cost includes the costs borne by the public health
systems in treating accidents or diseases arisen from C&D waste pollution. For
example, it has been shown that high levels of air pollutants can cause sickness and
other respiratory problems to the people working at and/or living around the
construction or demolition sites (Fayad & Bekhazi, 2009). The health cost associated
with this type of pollution is often borne by society.
To reduce the social cost (both in direct and indirect terms) means that there is a need
to minimise C&D waste. And to ensure a waste minimisation strategy is sustainable,
there is a need to understand the economics of such a strategy. The following section
will discuss the economic cost of C&D waste in detail.
1.3.3. Economic Cost of C&D Waste
Arguably, the economic cost of C&D waste has a direct relationship to both
environmental and social cost of C&D waste.
From the environmental perspective, as the amount of C&D waste being disposed of by
the construction industry continues to grow, there is an increased need for additional
landfill sites or cleanfill sites to help manage C&D waste. There are costs associated
with these additional investments in infrastructure. And although the costs of such
investments may be high, the investors may also require high return rates to justify their
investments. The returns for the investors are in forms of waste disposal fees or landfill
charges. As landfill charges grow, so do the costs of C&D waste disposal. In other
CHAPTER 1 – INTRODUCTION
12
words, high landfill charges make it expensive to dispose of C&D waste. In many
economic situations, construction companies would pass these costs onto the
consumers to compensate for their high cost of waste disposal. Given that the amount
of C&D waste keeps growing (not declining), the end consumers end up paying more
for materials and wastages, labour to process C&D waste, and transportation of C&D
waste. It is therefore in the consumers’ best interest to demand construction companies
to cut down unnecessary costs. And it can be done through minimising the amount of
C&D waste produced in projects. By having a waste minimisation strategy, the client
can ensure they save on materials as well as on waste disposal charges.
From a socio-environmental perspective, as the social cost of C&D waste grows, it
becomes a substantial burden for society (Storey et al, 2003; Myers, 2005; Ding, 2008;
MfE, 2010). Although some parts of the social cost is borne by construction companies
(see Section 1.3.2), a majority of the social cost of C&D waste is borne by the public
(Fayad & Bekhazi, 2009; Willmott Dixon Co., 2010). For instance, as the amount of
C&D waste keeps growing, so does the amount of health problems associated with it.
The growing C&D waste-related health problems will likely stretch the (already-
stretched) public health systems worldwide further.
C&D waste is a major issue faced by both the society and the construction industry.
Given the problem with C&D waste is serious and has been around for a long time,
there is an urgent need for construction to address C&D waste.
As money is an important consideration in construction, there is an immediate need to
investigate the economics of C&D waste reduction strategies in the New Zealand
construction industry. This is the rationale for the study reported in this thesis.
CHAPTER 1 – INTRODUCTION
13
1.4. Other dimensions affecting C&D waste minimisation
1.4.1. Political dimension of C&D waste minimisation
The pressure for reducing C&D waste in construction comes from various levels: local,
national and international (Snow, 2001). One particularly significant aspect in recent
years has been the introduction of much legislation and many directives worldwide
aiming to improve industrial and social sustainability (Langfield, 2011; Metro Vancouver,
2011; Adams et al, 2011; Seattle Council, 2013). In New Zealand, the Waste
Management Act was introduced in 2008 to change the status quo of waste in
construction. The principle mechanism of the Waste Management Act (2008) was to
provide funding for waste minimisation programmes, enable product stewardship
schemes for construction materials and reduce the environmental harms caused by
those materials. This can be achieved by the imposition of a levy on all waste sent to
landfills. The levy creates an economic imperative to reduce total amounts of waste
arising from construction sites and introduce waste minimisation. Specifically, each
tonne of waste removed from sites and deposited into landfill or cleanfill would result in
$10 levy. The Waste Management Act (2008) was also intended to force people to think
about how they dispose of materials more broadly. It has been reported that the overall
effects of the Act to date has been positive in the New Zealand context (MfE, 2009;
MfE, 2012).
However, compared to other waste minimisation programmes worldwide such as the
Sustainability Advantage programme in New South Wales, perhaps New Zealand can
do more to encourage C&D waste minimisation. Information about the Sustainable
CHAPTER 1 – INTRODUCTION
14
Advantage programme can be found on the Environmental New South Wales’ website
(Environmental New South Wales, 2014).
It has been suggested by overseas authors that maybe the reason for the slow adoption
of C&D waste minimisation is due to a lack of necessary supports and interventions by
authorities (Jaillon et al, 2009; Hu, 2011). Interventions include ‘pull’ factors such as
incentives and subsidies as well as ‘push’ factors such as industry-focused legislations
and/or industry performance standards. It has been shown that a combination of
regulation and economic incentives is effective in reducing C&D waste (Yuan et al,
2011). Similar, Poon et al (2001) and Poon et al (2004) showed that regulations and
economics are key factors in influencing and altering behaviours of operatives towards
C&D waste generation. Yu et al (2013) showed that C&D-specific waste levy charges
can have significant effects on construction’s behaviours regarding C&D waste. It has
been reported that after 3 years of implementing the Construction Waste Disposal
Charging Scheme (2006–2008), Hong Kong managed to significantly reduce solid
construction waste (Yu et al, 2013). However, it has been noted that such successful
C&D waste reduction scheme is only sustainable if appropriate efforts are made to
improve the industry’s behaviours towards, and practices in, C&D waste minimisation
(Yu et al, 2013).
This observation is valid because top down approaches in waste minimisation (i.e. one
driven by policies and regulations) can only drive the agenda so far, there is a need for
a bottom-up approach from the industry itself to have a truly lasting and sustainable
waste minimisation programme.
CHAPTER 1 – INTRODUCTION
15
1.4.2. Technological dimension of C&D waste minimisation
To date, many authors have relied on technology to minimise C&D waste. For instance,
Huang et al (2002) used mechanical sorting techniques to recycle construction waste.
This is an interesting study because this type of study is not common in construction.
But the novelty of this approach is already available in other sectors such as the mining
sector (http://www.crcore.org.au/coarse-liberation-circuits.html and
http://www.crcore.org.au/7-news/general-news/110-news-archive - section ‘MineSense
joins CRC ORE’, 2013).
Similarly, Li et al (2005) utilised mapping technologies such as GPS and GIS used to
track and manage onsite C&D waste. Li et al (2005)’s approach was found to be
effective in tracking and managing materials and waste. Moreover, compared to the
standard approach, greater efficiency and productivity could be gained through this
system (Li et al, 2005). Approaches like Li et al (2005)’s has gained popularity in recent
times, with increasing number of New Zealand firms employing them to study materials
flows (e.g. Aurecon).
Techno-centric approaches have been found to be helpful in the management of C&D
materials and waste. However, techno-centric approaches can be costly, as specialist
equipment can be expensive and may not be applicable to every project. Besides, there
is little evidence that such high-tech approaches are more effective than other waste
minimisation techniques. As a result, further research effort is required in this area to
help construction understand the role and potentials of techno-centric approaches in the
management of C&D waste. This understanding will in turns allow construction to
formulate appropriate strategies to manage its C&D waste outputs.
CHAPTER 1 – INTRODUCTION
16
Although it is technically feasible to recycle most construction materials, the type and
amount of material to be salvaged is often highly dependent on its value (Tam & Tam,
2006; Tam, 2010; Lu & Yuan, 2011). This means C&D waste minimisation depends on
both construction’s technical capabilities as well as levels of commitment of the
stakeholders within the industry. This argument shows the importance of economic
considerations in C&D waste minimisation. Given monetary returns to shareholder are
the key driver in construction, there is a need to assess the economics of waste
minimisation strategies so that potential values of C&D waste minimisation can be
understood and implemented (Peng et al, 2010). In turns, this understanding of can add
significant values to the operations of construction companies and ensure the long-term
sustainability of the industry.
1.5. Problem Statement, Research Aim and Research Question
1.5.1. Problem Statement
Currently there is a lack of tools and methods for the evaluation of economics of C&D
waste minimisation in New Zealand. This is perhaps since C&D waste minimisation is a
relatively new field of research in New Zealand, with very few publications in New
Zealand focusing on this area (e.g. Storey, 2003; Brown & Allcock, 2008; Letendre,
2013; Berry, 2014). As a new field of study, there are research areas that need to be
addressed and used as the basis for further progresses. One such area in New Zealand
is in economic evaluation of C&D waste minimisation.
Worldwide, there are several studies focusing on the economics of C&D waste
management/minimisation (see, for example: Yahya & Boussabaine, 2006; Begum et
CHAPTER 1 – INTRODUCTION
17
al, 2006; Tam & Tam, 2008; Jain, 2012; Fadiya et al, 2014; Marzouk & Azab, 2014;
Dajadian & Koch, 2014; Abdelhamid, 2014). In New Zealand, currently there is only one
publication that explores this area (Covec, 2007).
The lack of economic evaluation frameworks appropriate, and applicable, to New
Zealand means that construction stakeholders are not well-informed of the values of
waste minimisation. This lack of understanding may in turns have detrimental effects on
efforts to address C&D waste problems by the governments and the industry.
To this end, there is an urgent need to evaluate the economics of C&D waste
minimisation and C&D zero waste in the context of New Zealand construction.
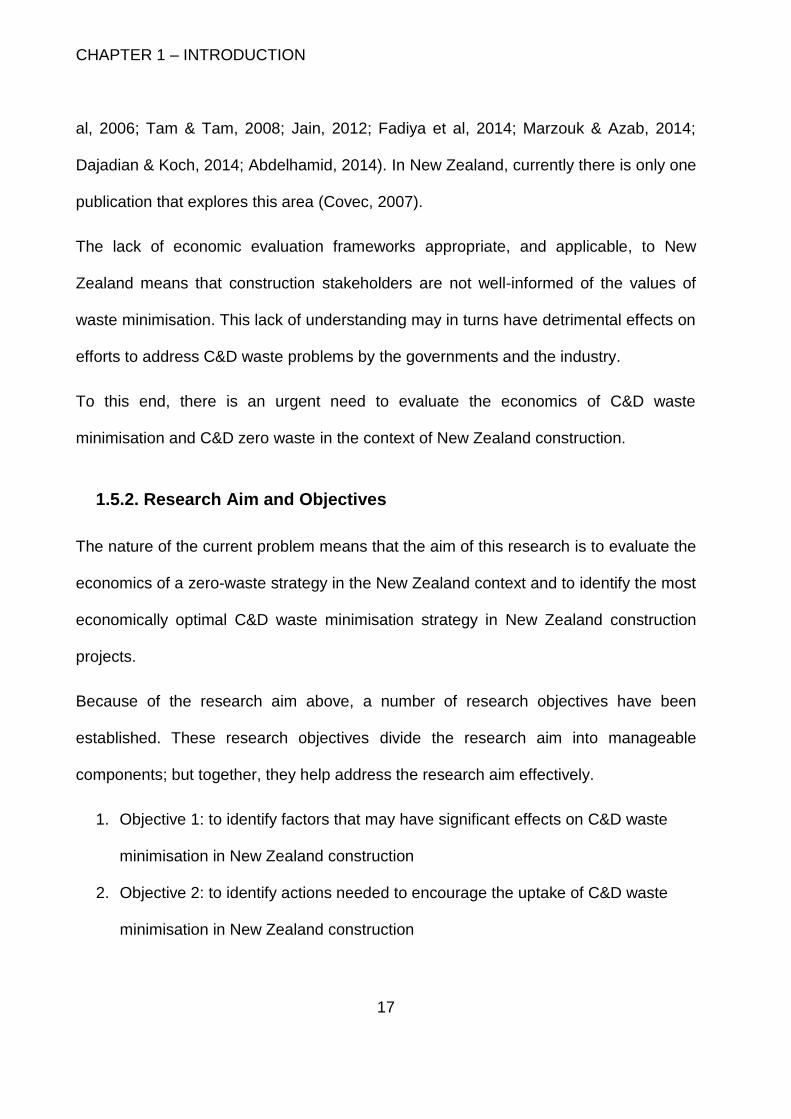
1.5.2. Research Aim and Objectives
The nature of the current problem means that the aim of this research is to evaluate the
economics of a zero-waste strategy in the New Zealand context and to identify the most
economically optimal C&D waste minimisation strategy in New Zealand construction
projects.
Because of the research aim above, a number of research objectives have been
established. These research objectives divide the research aim into manageable
components; but together, they help address the research aim effectively.
1. Objective 1: to identify factors that may have significant effects on C&D waste
minimisation in New Zealand construction
2. Objective 2: to identify actions needed to encourage the uptake of C&D waste
minimisation in New Zealand construction
CHAPTER 1 – INTRODUCTION
18
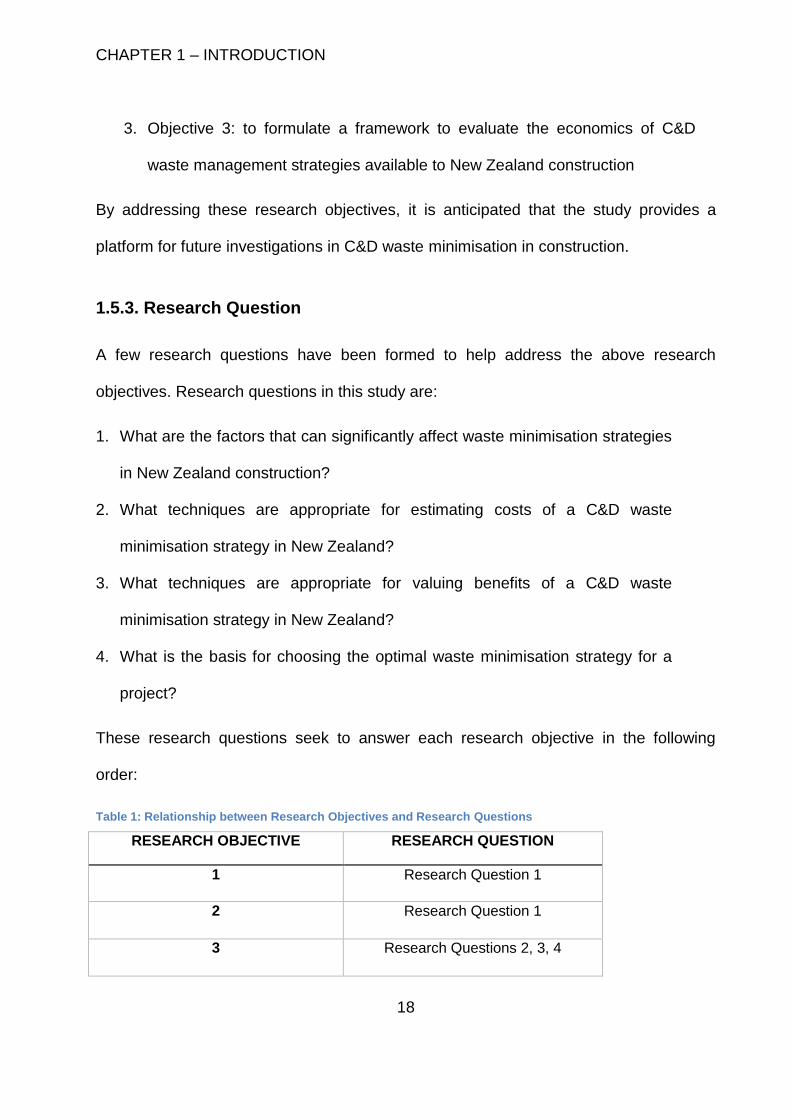
3. Objective 3: to formulate a framework to evaluate the economics of C&D
waste management strategies available to New Zealand construction
By addressing these research objectives, it is anticipated that the study provides a
platform for future investigations in C&D waste minimisation in construction.
1.5.3. Research Question
A few research questions have been formed to help address the above research
objectives. Research questions in this study are:
1. What are the factors that can significantly affect waste minimisation strategies
in New Zealand construction?
2. What techniques are appropriate for estimating costs of a C&D waste
minimisation strategy in New Zealand?
3. What techniques are appropriate for valuing benefits of a C&D waste
minimisation strategy in New Zealand?
4. What is the basis for choosing the optimal waste minimisation strategy for a
project?
These research questions seek to answer each research objective in the following
order:
Table 1: Relationship between Research Objectives and Research Questions
RESEARCH OBJECTIVE RESEARCH QUESTION
1 Research Question 1
2 Research Question 1
3 Research Questions 2, 3, 4
CHAPTER 1 – INTRODUCTION
19
1.6. Thesis Contribution and Overview
Although C&D waste minimisation has been studied internationally, its economics has
not been investigated in the New Zealand construction context. This study aims to
develop an economic framework that is applicable to the evaluation of C&D waste
management strategies in New Zealand. This framework differs to other evaluation
methods in that it uses a combination of standard economic evaluation techniques such
as Economic Impact Analysis, Benefit-Cost Analysis and Cost Effectiveness Analysis to
help convey messages in a clear and concise manner.
With its focus on the investigation of economics of C&D management, this thesis can
make significant contributions to an overall understanding of C&D waste management
in the context of New Zealand construction. The thesis is organised as follows:
Chapter 2 reviews relevant literature pertaining to C&D waste management and C&D
waste minimisation. The aim of this chapter is to develop a good understanding of
issues around C&D waste minimisation and to identify existing knowledge gaps in order
to establish research strategies to address them.
Chapter 3 reviews economic evaluation techniques. This chapter aims to provide a
good understanding of economic evaluation tools that are available for this research.
The chapter concludes with a list of appropriate economic evaluation methods for this
research.
Chapter 4 discusses the methodology adopted for this research and reasoning for the
choice of the research instrument. Ontologically, the study followed the Parmenidean
worldview, given its focus on developing an economic evaluation framework.
CHAPTER 1 – INTRODUCTION
20
Epistemologically, a mixed-paradigm was chosen as to address both qualitative and
quantitative aspects of the research. Subsequently the chapter shows suitable research
methods for this study are: semi-structured elite interviewing, modelling research and
case study.
Chapter 5 outlines the theoretical construct of the proposed economic evaluation
framework and provides descriptions of its applications.
Chapter 6 applies the proposed economic evaluation framework to a new construction
project. This Chapter focuses on evaluating the economics of minimising a range of
C&D waste materials, including asbestos-contaminated materials, concrete, scrap
metals, timber, plasterboard, steel, cardboard, glass, hardfill materials, plastic, polyester
materials and other general waste.
Chapter 7 further tests the application of the proposed economic evaluation framework
in a refurbishment project. This Chapter focuses on the brick material. And the
framework is used to evaluate the economics of waste minimisation strategies for brick
waste.
Chapter 8 discusses key findings from this study. The chapter describes how each
research objective is achieved. This chapter also describes the key strengths and
limitations of the study and suggests opportunities for future research.
Finally, conclusions are set at Chapter 9.
CHAPTER 2 – LITERATURE REVIEW
21
CHAPTER 2 – LITERATURE REVIEW
CHAPTER 2 – LITERATURE REVIEW
22
2.1. Sources of C&D Waste
There are many factors that can have significant effects on the generation of C&D
waste. However, two main factors that contribute significantly to the generation of
wastages in construction are the industry’s fragmented nature and current practices
being carried out in the industry.
2.1.1. Industry Fragmentation as a Source of Waste
A significant factor in waste generation is perhaps the fragmented nature of the
construction industry. The construction industry is made up by a large number of small-
to-medium sized companies. In New Zealand, there are a total of 51,178 companies
operating in the construction sector as of 2014 (Statistics New Zealand, 2015). Of this
total, 24% (or 12,285 companies) are proprietary (Statistics New Zealand, 2015).
Construction’s fragmentation is not new and it has both positive and negative
implications to construction (Egan, 1998). On the one hand, the fragmentation allows
the industry to be flexible to deal with the variable workloads caused by economic
cycles (Egan, 1998). On the other, due to this fragmentation each trade tends to focus
on their area of expertise and thus limiting the continuous collaborations between
partners (Barawas et al, 2013). Because of this fragmentation, the views on C&D waste
between construction groups differ significantly. For instance, waste minimisation is not
highly ranked in the design process by architects (Osmani et al, 2008); however civil
engineers felt that more could be done at the design phase to minimise waste (Chong
et al, 2009).
CHAPTER 2 – LITERATURE REVIEW
23
2.1.2. Wastages in Construction Practice
It has been reported that over-specification of materials is a main reason for wastages
in construction (Sealey et al, 2001). Li et al (2012) showed that the largest contributor to
C&D waste in a commercial building is concrete waste (43.5%), followed by timber
formwork (18.7%), steel bar (9.8%), brick and block (8.4%), mortar (8.4%) and tile
(1.2%). This wastage rate is significant. Predominantly, C&D waste in construction is
due to traditional practices in the industry, where stock ‘shrinkages’ are taken into
account when estimating materials (Sealey et al, 2001). Other sources of waste in
construction may come from the industry’s internal inefficiency. These inefficiencies
include, but not limited to, a lack of an integrated network for collection, utilisation and
reuse of C&D waste materials (Fatta et al, 2003); a lack of standardisation or
specifications of waste materials (Hadjieva-Zaharieva et al, 2003); lack of at-source
waste management directives and capacities (Lu et al; 2011), lack of skills/poor
workmanship and heavy reliance on traditional construction methods and materials
(Hassan et al, 2012).
Another crucial factor that may have significant contribution to waste generation in
construction is a lack of commitments and supports for waste minimisation from
management and construction stakeholders (Teo & Loosemore, 2001; Hadjieva-
Zaharieva et al, 2003; Hassan et al, 2012). It has been found that human behaviours
such as attitudes and perceptions towards C&D waste can have significant impacts on
the success of a C&D waste minimisation strategy (Teo & Loosemore, 2001; Kulatunga
et al, 2006; Begum et al, 2006; Begum et al, 2008; Afroz et al, 2008). However, due to
the fragmented nature of the construction industry and the disaggregation of
CHAPTER 2 – LITERATURE REVIEW
24
roles/responsibilities between construction professionals, significant waste is still being
generated in, and by, construction.
Waste is often viewed as inevitable part of construction (Osmani et al, 2008). As such,
C&D waste minimisation has received a low priority in construction (Teo & Loosemore,
2001; Chong et al, 2009). This is particularly true during busy times such as in a
construction boom, where designers and contractors are pressured to finish projects in
the shortest time possible. The result is less time and resources are allocated to C&D
waste management and minimisation (Teo & Loosemore, 2001). It has been reported
that decisions made to at design stage could help reduce up to 33% of C&D waste in
any construction project (Osmani et al, 2008). However, the reasons designers do not
often implement waste reduction in the design process are due to external influencing
factors such as clients’ requirements and costs (Poon et al, 2004).
The above argument shows there is an urgent need to incorporate waste minimisation
in building construction practices to reduce amount wastage currently being generated
by the construction industry. It seems now is the right time for New Zealand
construction to undertake this task because currently the country is experiencing a
construction boom in Christchurch and Auckland.
2.1.3. Waste Minimisation Efforts by Construction
Recently, efforts have been spent to establish ‘best practices’ for reducing C&D waste
(BRANZ, 2014). Notable New Zealand-based initiatives include ‘Resource Efficiency in
the Building and Related Industries’ (REBRI) programme and New Zealand Zero Waste
initiative. However, such programmes have yet to show tangible results. This lack of
CHAPTER 2 – LITERATURE REVIEW
25
evidence may be a cause for the slow uptake of waste minimisation in New Zealand
construction.
The review of literature has revealed that much recent effort has focused on identifying
factors that may have significant effects on C&D waste generation. The result is a rich
body of knowledge concerning the sources of waste in construction has been provided.
Further, these investigations have collectively provided a glimpse into successes and
failures in C&D waste management and waste minimisation.
However, most current emphases on C&D waste management and C&D waste
minimisation remain on moderations of behaviours instead of looking for ways in which
the totality of the system can work together to minimise waste (Teo & Loosemore,
2001). While focussing on the end-user is the easiest way to influence C&D waste – i.e.
by using the power of the demand chain to affect the supply process, given the
fragmented nature of the construction industry, this consideration would appear to be
simplistic. It has been argued that such an approach can be enhanced through the
incorporation of ‘systems view’ of behaviours (Seadon, 2010). It is anticipated that a
systems approach will enhance the understanding around C&D waste minimisation,
which in turns can be used as the basis for further developments in C&D waste
minimisation.
2.2. Waste Minimisation - A Systems Perspective
As shown in Section 2.1.2, successful C&D waste minimisation strategies require both
appropriate technical capabilities and commitments from the management (Wang et al,
2010; Lu & Yuan, 2011). Further, Chapter 1 shows that C&D waste management may
CHAPTER 2 – LITERATURE REVIEW
26
also depend on the economics of such strategies (Tam & Tam, 2006; Tam, 2010). It
has been argued that the traditional reductionist approach in solid waste management
is no longer capable of handling the complexity required by modern waste minimisation
programmes (Marshall & Farahbakhsh, 2013). In the reductionist view, waste
management processes such as waste generation, waste collection, and waste
disposal are treated as independent operations (Seadon, 2010, p. 1640). Due to this
compartmentalisation, solutions for each process along this chain remain independent
of each other and may not properly address the waste problem (Marshall &
Farahbakhsh, 2013). By contrast, modern waste management and minimisation
strategies require multi-dimensional considerations encompassing social, cultural,
political, and environmental facets. Further, these considerations may be interlinked
and interactive (Seadon, 2010). Therefore, a more holistic framework such as a
systems approach is required to sufficiently address solid waste, including C&D waste,
problems (Marshall & Farahbakhsh, 2013; Business Dictionary, 2015). In other words,
the need for a systems approach in waste minimisation arises from the complexity of
managing and minimising C&D waste streams.
The review of literature has revealed that the systems approach to waste minimisation
is not widely practiced in the construction industry. On balance this is likely due to the
fragmented nature of the construction industry. It has been widely reported that there is
a lack of coordination between construction groups in C&D waste management (i.e.
Fredricsen, 2003; Hu, 2011; Hassan et al, 2012). And as a result, C&D waste
management and minimisation in construction is still ad-hoc (Teo & Loosemore, 2001).
For example, construction designs often do not incorporate prefabricated components
and assemblies that minimise waste (Jaillon et al, 2009). This is a missed opportunity
CHAPTER 2 – LITERATURE REVIEW
27
because the use of prefabrication could significantly reduce C&D waste in construction
– by up to 52% compared to traditional construction techniques (Jaillon et al, 2009).
Further, it has been reported that there are minimal interactions between the designers
and the material suppliers and between the suppliers and contractors (Dainty & Brooke,
2004; WRAP, 2007, 2009, 2011). This lack of collaboration/interaction between key
project partners is a significant reason for the continued over-ordering of construction
materials as well as the continued wastage throughout the supply chain (Dainty &
Brooke, 2004). These are a few potential issues that are extant in the ‘system’ that
currently exist in the construction industry. For example, contractors are often
incentivised by their suppliers to buy materials in bulk. By doing so, contractors can get
greater discount rates from merchants and suppliers. In turns, this encourages the
contractors to use materials without any disregard for recycling and reuse, as it is
cheaper to buy new materials than to recycle and reuse similar materials.
The above arguments show that there is an urgent need for construction to implement a
systems approach to address its C&D waste. However, given the lack of precedent
cases in this area, the first step is to have a good understanding of C&D waste
minimisation and current practices. Once such an understanding is achieved,
appropriate strategies can be developed to ensure the systems-based C&D waste
minimisation strategies work and deliver values to the intended construction
stakeholders.
The following sections in this chapter will examine in detail concepts associated with
C&D waste minimisation.
CHAPTER 2 – LITERATURE REVIEW
28
2.3. Research Framework
The requirement of the systems approach means that it is necessary to understand all
facets of waste minimisation in the construction context. This includes overarching
concepts such as ‘Green’ and ‘Sustainability’, as well as C&D waste-specific topics
such as ‘Waste Minimisation’ and its objective: ‘Zero Waste’. It is anticipated that by
reviewing literature in these topics, the researcher can build sufficient knowledge in,
and understanding of, C&D waste minimisation. Moreover, it allows the researcher to
identify challenges and issues that the industry faces in its quest to achieve zero waste.
To help discuss these related topics, this research introduces a framework to help
review literature related to waste minimisation and zero waste systematically (see
Figure 1 overleaf). This framework arises from the researcher’s need to have a holistic
understanding of subjects related to C&D waste minimisation and zero waste. It is
based on the researcher’s experience and understanding of the New Zealand
construction industry. This literature review framework has allowed the researcher to
gain a comprehensive understanding of subjects concerning C&D waste.
In this framework, each circle represents a study area (or ‘category’) that is relevant to
C&D waste minimisation. These categories are: Green Construction, Sustainable
Construction, C&D Waste Management, C&D Waste Minimisation and C&D Zero
Waste. Each category is an area of study and can be discussed independently.
However, it is necessary to contextualise the research topic in this manner to provide a
good understanding of issues, challenges and opportunities in C&D waste minimisation.
In this framework, each circle represents a category; and each sub-category is eclipsed
by a larger category (i.e. the outer circles). By employing this approach, the literature
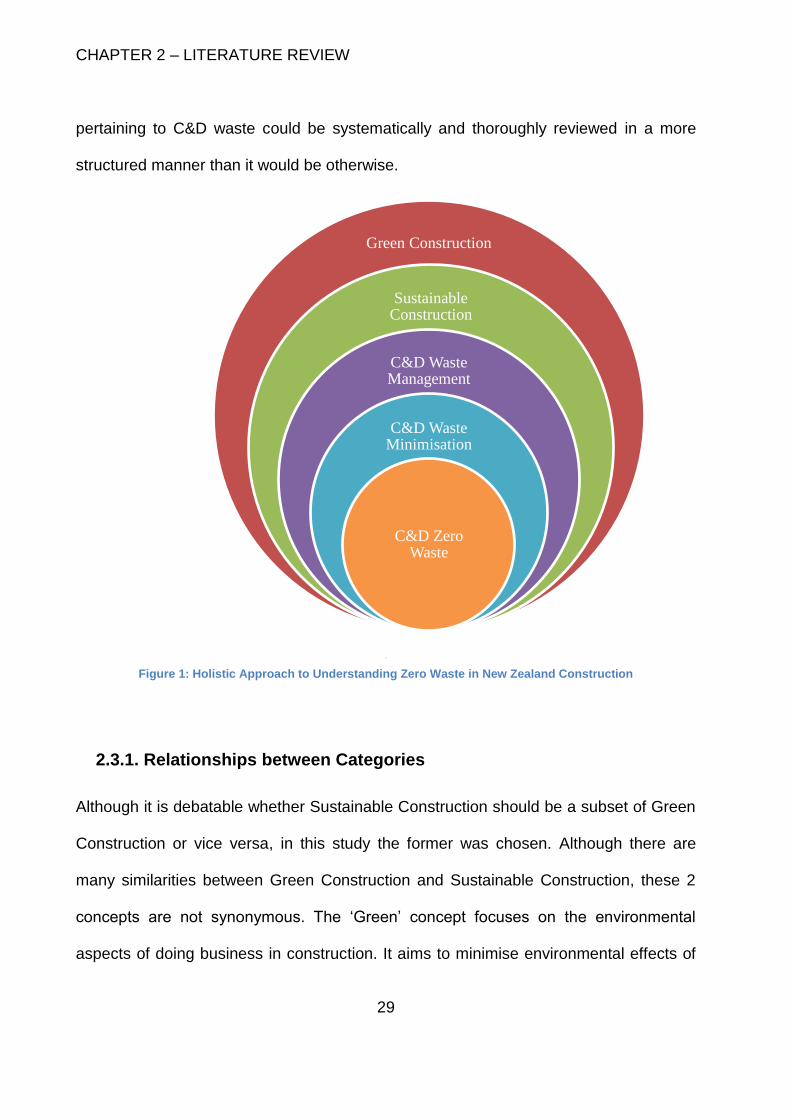
CHAPTER 2 – LITERATURE REVIEW
29
pertaining to C&D waste could be systematically and thoroughly reviewed in a more
structured manner than it would be otherwise.
2
Figure 1: Holistic Approach to Understanding Zero Waste in New Zealand Construction
2.3.1. Relationships between Categories
Although it is debatable whether Sustainable Construction should be a subset of Green
Construction or vice versa, in this study the former was chosen. Although there are
many similarities between Green Construction and Sustainable Construction, these 2
concepts are not synonymous. The ‘Green’ concept focuses on the environmental
aspects of doing business in construction. It aims to minimise environmental effects of
Green Construction
Sustainable Construction
C&D Waste Management
C&D Waste Minimisation
C&D Zero Waste
CHAPTER 2 – LITERATURE REVIEW
30
construction by promoting ‘green’ practices, regardless of costs and social impacts.
This consideration is a one-dimensional. Further, it can lead to many problems in
construction, including inefficiency and long term liabilities. On the other hand, in
‘Sustainable Construction’, not only does the focus rest on the environmental aspect of
doing business but it also takes in consideration the economic and social aspects of
doing business. This means the concept ‘Sustainable Construction’ is more thorough in
its focus than it is in ‘Green Construction’. For this reason, in this study Sustainable
Construction is considered a subset of Green Construction.
The relationships between other sub-categories are straightforward. ‘Sustainable
Construction’ demands that C&D waste must be appropriately managed. This need
leads to discussions on ‘C&D Waste Management’. As such, C&D Waste Management
is a subset of Sustainable Construction.
Similarly, C&D waste minimisation is a direct consequence of C&D waste management,
because the former focuses on diverting waste from landfill while the latter focuses on
more general waste disposal (which includes waste dumping among considerations)
and waste treatment settings. Thus, the topic C&D Waste Minimisation is a subset of
C&D Waste Management.
Finally, there must be a goal in C&D waste minimisation, and C&D zero waste is an
appropriate target. Therefore C&D Zero Waste is the subset of C&D Waste
Minimisation. The following sections will discuss each of the topics in Figure 1 in detail
in this order.
Detailed discussions using this framework are structured as follows. Section 2.4 will
discuss the ‘Green’ concept, including Green Construction; while Section 2.5 will focus
CHAPTER 2 – LITERATURE REVIEW
31
on ‘Sustainability’ and ‘Sustainable Construction’. The Sections 2.6 and 2.7 will offer
insights into ‘C&D Waste Management’ and ‘C&D Waste Minimisation’, respectively.
And finally, Section 2.8 will discuss effort to date to achieve ‘Zero Waste’ in industries,
including construction.
2.4. The ‘Green’ Concept
In this section, three areas related to the ‘green’ concept will be discussed. They are:
Green Cities, Green Infrastructure and Green Construction/Buildings. These areas are
relevant to this study, as they are related to the construction industry.
2.4.1. Green Cities
The ‘Green City’ is a relatively new concept (Kahn, 2006). It explores the relationships
between urban developments and the natural environments and how to balance the
developments in cities without having adverse effects on the natural environment.
It has been observed that urban environments often have distinctive biophysical
features compared to rural areas (Gill et al, 2006). Urban areas have higher climates
and hydrological variabilities due to the amplification of energies and increased surface
runoffs of rainwater, respectively. Further, a significant amount of land in, and around,
urban areas is exploited for roads and buildings. Recently, developments of land have
increased significantly worldwide at the expense of the already-limited parks and other
green spaces (Sandstrom, 2002). This increased development has in turns severely
affected the urban biodiversity.
CHAPTER 2 – LITERATURE REVIEW
32
Due to its focus on the urban environments, the ‘Green City’ concept has gained
significant popularity in recent times, particularly important in densely populated areas
(Sandstrom, 2002; Wolf, 2003; Gill et al, 2006; Kahn, 2006; Tzoulas et al, 2007;
Vandermeulen, 2011; M’Ikiugu et al, 2012). As population and urbanisation grow, there
are significant expectations and requirements from citizens for efficient and reliable
infrastructure to deliver essential goods and services. In turns this has put significant
pressures on land and infrastructure uses.
For its part, construction has put significant emphasis on delivering buildings and
infrastructure for commercial, residential and industrial purposes in response to
demands from its clients (Wolf, 2003; Matsuoka & Kaplan, 2008; Bomans et al, 2010).
However, as the city population continue to expect to live in an environment with clean
air and less pollution, construction is also required to adequately respond to this new
expectation. Given the important role construction plays in urban development, green
city seems an appropriate framework for construction to meet all requirements from its
clients.
To date, much effort worldwide has been to explore and understand the green city
concept in great detail. For example, Sandstrom (2002) investigated the applicability of
green city and green infrastructure from a legislative perspective while Wolf (2002)
viewed green space and green city from a social perspective. Although the approaches
of these two researchers are different, they have found that there is still much work to
promote and implement the green city concept.
Taking a different approach, M’Ikiugu et al (2012) developed a tool for planners using
landscape metrics and geographic information system (GIS) to analyse urban green
CHAPTER 2 – LITERATURE REVIEW
33
space (UGS). It was found that there is an urgent need for cities to incorporate green
spaces into urban development (M’Ikiugu et al, 2012). To achieve this, there needs to
be a paradigm shift that gives UGS the same or more weight than other physical
development undertakings and policies (M’Ikiugu et al, 2012). M’Ikiugu et al’s (2012)
findings are relevant and important in the context of green city. This is because trees
and green spaces are essential and can be regarded as a living system to support and
enhance the quality of life for urban environments. Thus, it can be argued that by
improving green space and green infrastructure, a city can fulfil its obligations to provide
environmental, socio-cultural, and economic benefits to its citizens (Sandstrom, 2002;
Wolf, 2003).
2.4.2. Green Infrastructure
‘Green Infrastructure’ is the upgraded concept of ‘Urban Green Space’ (Tzoulas et al,
2007). Originally, the term “green infrastructure” describes a network of natural green
space such as forests, wetlands, waterways, wildlife habitats, parks and other
conservation lands in and around urban and urban-fringe areas (Weber et al, 2006;
Mell, 2008).
Like built infrastructure such as roads and utilities, green infrastructure provides
essential ecological services necessary for city dwellers’ well-being. Ecosystem
services provided by green infrastructure include cleaning the air, filtering and cooling
water, storing and cycling nutrients, conserving and generating soils, pollinating crops
and other plants (Weber et al, 2006). However, the term ‘green infrastructure’ now has
a meaning that is closer to sustainability goals that cities are trying to achieve through a
mix of natural approaches (Foster et al, 2011). Examples of green infrastructure include
CHAPTER 2 – LITERATURE REVIEW
34
green alleys and streets; urban forestry; green open spaces such as parks and
wetlands; and adapting buildings to better cope with floods and coastal storm surges
(Foster et al, 2011). Therefore, green infrastructure can be considered as a coherent
planning concept comprising of all natural, semi-natural and artificial networks of
multifunctional ecological systems within, around and between urban areas at all spatial
scales (Sandstrom, 2002; Kambites & Owen, 2006; Tzoulas et al, 2007).
It has been observed that if proactively planned, developed, and maintained, green
infrastructure has the potential for effective urban development by integrating economic
growth, nature conservation and public health promotion (Tzoulas et al, 2007; Mell,
2008).
In practice, green infrastructure approaches consist of a mix of new concepts and
technology and traditional “hard” infrastructures to create an enhanced level of urban
sustainability and resilience (Foster et al, 2011). It has been reported that due to its
adaptive capabilities, local governments have started to adopt green infrastructure in
their planning and urban development (see, for example Wolf, 2003; Weber et al, 2006;
Tzoulas et al, 2007; Schilling & Logan, 2008 and Foster et al, 2011).
The review of literature has shown that green infrastructure has been extensively
studied worldwide. Kambites & Owen (2006) studied green infrastructure planning in
the UK and identified a few essential attributes of green infrastructure planning. These
attributes are connectivity in all green infrastructure planning processes; the need for a
partnership, particularly involvement of local communities throughout the process; and
the need to embed green infrastructure planning in democratic and statutory planning
CHAPTER 2 – LITERATURE REVIEW
35
systems. Moreover, these findings appear to have international relevance and
significance, not just particular to the case of the UK (Kambites & Owen, 2006).
Based on the British experience, many authors attempted to apply this concept to other
parts of the world. Amati & Taylor (2010) focused on the Canadian context, and that of
Toronto, to examine challenges in integrating the concepts green belts with green
infrastructure. Conversely, Qureshi et al (2010) analysed the effects of ecological
disturbances on public health due to high cutback in Karachi’s green infrastructure.
Both studies found that there is a need to develop a comprehensive urban greening
strategy, which considers the needs and priorities of the population.
In the US, the green infrastructure concept is more welcoming and has been more
widely practiced than the rest of the world (Wise, 2008). Wise (2008) reported green
infrastructure is being up-taken in Seattle, Portland (Oregon), Twin Cities (Minnesota),
Burnsville (Minnesota), Chicago, Milwaukee, Philadelphia, Washington D.C. and
Kansas City. Gill et al (2006) investigated the role of green spaces and green
infrastructure in the adaptation of cities to climate change. Through modelling, Gill et al
(2006) could quantify the potential of the green infrastructure to moderate climate
change impacts in towns and cities. Specifically, the biophysical features of green
space in urban areas (trees, gardens or parks) provide vital ecosystem services for
cities because they offer cooler microclimates to an area and reduce surface water
runoff, and ultimately, offer cities a potential adapt for climate change (Gill et al, 2006).
Similarly, Spatari et al (2011) used life cycle assessment (LCA) to analyse urban green
infrastructure and found that if the concept implemented throughout an urban
watershed, significant cost savings from energy usage can be achieved throughout a
city’s network of water pollution control facilities (Spatari et al, 2011). In a similar
CHAPTER 2 – LITERATURE REVIEW
36
fashion, Vandermeulen et al (2011) showed that by investing in green infrastructure, not
only can such investments make significant contributions to the environment but it also
creates direct and indirect positive effects for a region.
However, it has been warned that creating green infrastructure is only the first step in
urban planning (Hostetler et al, 2011). To promote and streamline green infrastructure,
more funding and development is needed (Mell, 2008). This means everyone, from
planners, to developers, to researchers, and residents, has a role to play in shifting from
conventional development methodology to green infrastructure (Hostetler et al, 2011).
Overall, the review of literature has shown that to achieve green infrastructure, there
needs to be willingness and appropriate strategies from governments and practitioners.
The construction industry plays a key role to deliver green infrastructure to cities. And
as implied by Hostetler et al (2011), the construction industry needs to shift its focus to
‘greener’ development paradigms to help deliver the green infrastructure objectives;
and green construction is a solution for the construction industry to meet this
requirement.
2.4.3. Green Construction
As discussed in Sections 2.4.1 and 2.4.2, ‘Green Construction’ plays a key role in
delivering ‘Green Cities’ and ‘Green Infrastructure’. In the construction context, the
‘Green’ concept focuses on construction practices that promotes environmentally-
friendly designs and uses energy efficient materials and equipment to minimise the
adverse effects brought by the construction process to the environment (Kubba, 2009;
Levy, 2009; Kubba, 2010). This means green construction is ‘a process of building
structures using environmentally friendly resources while ensuring the building performs
CHAPTER 2 – LITERATURE REVIEW
37
efficiently throughout its lifecycle’ (Kats, 2003; Boyle, 2004; Haapio & Viitaniemi, 2008;
Green Building Solutions, 2013).
However, it must be noted there is a significant difference between ‘green buildings’
and ‘green processes’. While the former relies on a rating system such as LEED or Star
Rating to be classified as ‘green’, it is the undertaking of the latter (i.e. to produce a
building) that has the greatest impacts on the environment (Reznick Group, 2009;
Green & May, 2003). In fact, Levin (2000) found that although the industry has steadily
moved towards green building practices, there is little evidence showing such practices
producing less overall environmental damage than the status quo. The result is that
many dubious ‘green’ practices with undetermined environmental impacts have been
accepted and become the norm in construction (Levin, 2000; Kats, 2003; Lam et al,
2010).
It has been reported that the ‘Green Construction’ concept has gained significant
attention over the last decade due to their perceived positive effects on urban
environments (Sandstrom, 2002; Wolf, 2003; Gill et al, 2006; Kahn, 2006; Tzoulas et al,
2007; M’Ikiugu et al, 2012). This is because urban growth has put immense pressure on
land uses in cities worldwide; and the ‘green’ concept can help calibrate the
environmental changes caused by such growth (Vandermeulen, 2011).
However, it has been argued that green buildings could be substantially more costly
than conventional ones; so, from the cost-benefit perspective, green construction might
not be attractive to conventional builders or developers (Kats, 2003). This perception
has been a substantial obstacle to a wider adoption of the green methodology.
CHAPTER 2 – LITERATURE REVIEW
38
Despite this drawback, the review of literature to date has shown that green
construction has had positive impacts on construction (Ofori, 2000; Ahn & Pearce,
2007; Build It Green, 2007; Nielson et al, 2009; Nahmens, 2009; Banawi, 2013). For
instance, Ofori (2000) applied the green idea to construction in Singapore and found
that green procurement with stringent requirements for environmental control and
performance criteria had significantly positive effect on the supply chain of Singaporean
construction. At the same time, Nahmens (2009) contended that green construction is a
natural extension of the ‘Lean Construction’ concept, evidenced by the fact that the
removal of C&D waste from construction processes has become a norm in construction
projects. This argument is dubious because although there are similarities between the
two concepts, green construction places great emphasis on environmentally-friendly
construction practices. On the other hand, lean construction focuses on minimising
wastages in construction processes.
Lam et al (2010) investigated factors that may have significant effects on the
implementation of green specifications in construction. Using a cross-sectional survey
regarding green specifications conducted in Hong Kong in 2007 and extensive
literature, the study found five independent factors affecting green construction,
including 1) technology and techniques, 2) reliability and quality of specification, 3)
leadership and responsibility, 4) stakeholder involvement, and 5) guide and
benchmarking systems (Lam et al, 2010). Upon further analysis, it was found that
different stakeholders tend to have different emphases on the relative importance of
these five factors (Lam et al, 2010). Kats (2003) and Lam et al (2010) show that there
are many things to consider when implementing the green construction concept.
CHAPTER 2 – LITERATURE REVIEW
39
Overall, it has been shown in literature that significant benefits could be gained by the
construction industry by simply being ‘greener’ (Tam et al, 2004; Ahn & Pearce, 2007;
Venus, 2011). Not only do these benefits come in term of environmental credentials, but
also in term of profitability. Therefore, there is a case for the construction industry to
take part in the ‘green’ movement; and the first step is to manage its waste output.
2.5. Sustainable Construction
2.5.1. Sustainability and Sustainable Development
‘Sustainability’ is defined as “the ability to be sustained, supported, upheld or confirmed”
(Dictionary.com, 2015). In other words, sustainability is the capacity of a natural-social
system to maintain and increase values of environmental, social or economic
components (Manzini et al, 2011). It has been observed that currently there are various
definitions of ‘sustainability’; each with its own meaning depending on the context used
(Glavic & Lukman, 2006; Brochner et al, 2010). As such, ‘sustainability’ can be open to
a wide range of interpretations. A complete history of sustainability is provided by Chiu
(2012).
Sustainable development arose in the 1980’s of the 20th century. In a global context,
‘sustainable development’ mandates that any economic or social developments should
improve the environment (Hendler, 1980; Todorov & Marinova, 2011). Over the last few
decades, this concept has developed from a global political process into a holistic
framework that touches every part of society (Hendler, 1980; Myers, 2005). Broadly,
sustainable development is defined as a process of achieving three interrelated
components: social equity, environmental protection, and economic growth in urban
CHAPTER 2 – LITERATURE REVIEW
40
development without major compromises to the future generations (WCED, 1987;
Khalfan, 2006; Manzini et al, 2011). These components are often known as the ‘triple
bottom line’. However, sometimes other components such as political, institutional
and/or technical capacity are also considered (Hill & Bowen, 1997).
To date, significant efforts have been made to understand sustainable development.
Hueting & Reijnders (2004) proposed sustainability indicators with additive
characteristics covering economic, social and environmental aspects. Similarly, Manzini
et al (2011) considered environmental, anthropo-centric and bio/eco-centric dimensions
in sustainability and sustainable development. These studies are useful, as they are the
first step to help understand sustainable development.
2.5.2. Sustainable Development in Urban Environments
The emphasis of sustainability and sustainable development is on long-term benefits to
society (Seabrooke et al, 2004). Currently the greatest amount of world resources is
consumed in urban environments. About 78% of carbon emissions come from fossil
fuels burnt to make cement; 76% of industrial wood worldwide is used in metropolitan
areas; and 60% of the water that runs through pipelines is consumed by cities (Mora,
2005). As the driving power for economic and social developments of most countries,
cities constantly require significant resources to fuel its appetite. Therefore, it is
appropriate to consider sustainable development in urban context.
Often professionals such as architects, planners, engineers, philosophers, artists,
sociologists, and economists all have different views on sustainability and sustainable
developments. This is due to their training and practices of these respective disciplines,
thus solutions put forth by each profession. Therefore, to ensure truly sustainable
CHAPTER 2 – LITERATURE REVIEW
41
solutions can be delivered and applied in the urban environments, there is a need for
holistic frameworks to encourage cross-disciplinary interactions between various
professions and stakeholders (Jones & Jones, 2007). Sustainability and sustainable
development hence encompasses technological means for dealing with environmental
issues and includes socio-economic and philosophical considerations (Jones & Jones,
2007).
2.5.3. Sustainability in Construction
Recently, sustainability has been widely adopted by the construction industry worldwide
(Saparauskas & Turskis, 2010). Originally, the term ‘sustainable construction’ was used
to describe the goal of construction of attaining ‘sustainability’ (Edum-Fotwe & Price,
2009; Chen & Chambers, 2010). This means sustainable construction can be thought of
as ‘the industry’s capacity to meet, maintain and improve social, environmental and
economic values for its stakeholders and participants’.
Sustainable construction is closely associated with green construction in many aspects,
especially around environmental responsibilities of construction businesses (Khalfan
2006). But unlike green construction, sustainable construction also considers the
economic social and cultural aspects of doing business in construction.
It has been observed that there is an important distinction between ‘sustainability’ and
‘sustainable construction’. The former is the ultimate objective of sustainable
construction while the latter is the process of achieving such an objective (Abidin &
Pasquire, 2005). To achieve sustainability, the industry must promote cross-disciplinary
collaborations between construction partners (Hill & Bowen, 1997; Persson & Olander,
2004; Khalfan, 2006). And such collaborations start well before construction: from
CHAPTER 2 – LITERATURE REVIEW
42
planning and design stages and continue throughout the construction of the project.
The collaborations may even extend to the management of the building’s serviceability
during its lifetime (Kubba, 2009).
In theory, sustainable construction processes would force the construction industry to
rethink of its environmental responsibility, social awareness, and economic profitability.
However, due to the fragmented nature of the construction industry, it is not easy to
apply this concept to practice (Adetunji et al, 2003; Lorenz et al, 2006; Chong et al,
2009; du Plessis, 2010). In fact, there is a wide range of factors that can affect
sustainability in construction. They range from micro-level such as specific strategies to
address sustainability and/or the involvement of stakeholders to macro-level such as
economic and/or legal systems which the industry operates in (Bon & Hutchinson,
2000; Adetunji et al, 2003; Chen & Chambers, 2010).
Besides, construction companies are resistant to changes, particularly around adopting
sustainability practices. This is mainly due to the perceived high costs associated with
such changes (Revell & Blackburn, 2005). This shows economic considerations of
sustainability are high in the agenda within the construction industry. Given that
construction is a labour-intensive-and-low-profit-margin industry, it is understandable
that economic considerations remain at the forefront of its agenda.
Therefore, to promote and encourage the uptake of sustainable construction, the
construction industry must first effectively address the economics of sustainability
strategies. This study contributes to this aspiration by developing a framework to
evaluate the economics of minimising C&D waste. It is anticipated that by
understanding the economics of C&D waste minimisation, appropriate strategies can be
CHAPTER 2 – LITERATURE REVIEW
43
made to promote waste minimisation and advance sustainability practices in New
Zealand construction.
2.5.4. Sustainability Understanding in Construction
It has been reported that the lack of understanding of sustainability is the main cause
for the lack of progress in sustainability (Hall & Purchase, 2006). Recently, significant
effort has been made to achieve a good understanding of sustainability in construction.
Sustainability considerations are thought to encompass four aspects: environmental,
economic social and cultural dimensions (AUT, 2015). But in construction, sustainability
considerations have mostly focused on environmental aspect because the industry is
one of the largest users of natural resources and one of the largest polluters worldwide
(Hueting & Reijnders, 2004). It has been argued that by influencing construction’s
performances in the environmental aspect will force the industry to place greater value
on other dimensions (economic and/or social) (Haapio & Viitaniemi, 2007; Ding, 2008).
On contrary, it has been argued that the most effective approach is to influence the
economic aspect (Bon & Hutchinson, 2000). This is because the construction industry is
mostly made up of small and medium companies with limited resources (Myers, 2005).
As a result, small companies do not have the capacities to develop and implement
sustainability measures due to the high costs associated with such implementations
(Revell & Blackburn, 2005). Besides, as sustainable construction is an incremental
process, this requires construction companies to have long-term strategic goals
(Bourdeau, 1999; Chong et al, 2009). But construction projects are short-term by
nature. This discrepancy does not permit construction companies, particularly small
companies, to implement sustainability measures in all their projects. Thus having a
CHAPTER 2 – LITERATURE REVIEW
44
market oriented economic-based system will likely encourage construction companies
to uptake sustainability practices and measures (Bon & Hutchinson, 2000).
To date, many studies have focused on developing metrics to help understand
construction’s aspiration to achieve sustainability. For instance, Rijsberman & van de
Ven (2000) developed a system consisting of four basic elements to assess the
sustainability aspect of design and management of urban water systems. Hueting &
Reijnders (2004) proposed sustainability indicators with additive characteristics to
measure economic and social elements sustainability. Similarly, Persson & Olander
(2004) developed a method to estimate stakeholders’ views on sustainability of
construction projects. Fernández-Sánchez & Rodríguez-López (2010) developed a
methodology to identify, classify and prioritise sustainability indicators based on risk
management standards. These studies have been helpful in providing construction
resources to achieve sustainability.
Currently there are numerous sustainability indicators used in the building sector
worldwide (Fernández Sánchez, 2008). They can be broadly divided into 4 main
categories Environmental Impact Assessment tools such as Life Cycle Analysis (LCA)
or Criteria-based tools (CB) or a combination of LCA and CB; Economical Assessment
tools such as Life Cycle Costs (LCC), Cost-Benefit Analysis, Financial Appraisal (FA),
Social Financial Appraisal (SFA), Cost-Revenue Analysis (CRA),Cost-Benefit Analysis
(CBA), and Social Cost-Benefit Analysis (SCBA); Social and Cultural Assessment tools
such as Social Surveys, Questionnaires, Interviews, Statistics; and Multi Criteria
Analysis (Rijsberman & van de Ven, 2000; Persson & Olander, 2004). However, it is
difficult to compare these tools because each was designed for assessing a specific
building type (Haapio & Viitaniemi, 2007). Another problem is each environmental
CHAPTER 2 – LITERATURE REVIEW
45
assessment tool was developed for a specific purpose (research, consulting, decision
making and maintenance) for a different user group (designers, architects, researchers,
consultants, owners, tenants and authorities). This means there exist errors in the
underlying assumptions and definitions used, their calculations. Consequently, these
errors could significantly affect the assessment results of these sustainability tools.
Perhaps the greatest impacts on understanding sustainability in construction can be
achieved via education (Murray & Cotgrave, 2007). Currently significant emphasis in
construction education at tertiary level remains on the technical know-hows of their
respective disciplines (e.g. architecture, civil engineering, quantity surveying,
surveying). There is little focus on construction sustainability in these syllabuses
although construction sustainability plays a big part in the professional practices of
these disciplines. The result is students, upon completing their formal education at
tertiary providers, will have to be trained in sustainability by their employers. This
double-handling of education is a significant waste to the industry and is, hence, not
ideal from the sustainability perspective.
In response to this demand, many higher education institutions have incorporated
sustainability in their education programmes (Wang, 2009). However, currently there is
no consensus on the operational requirements on sustainability in these programmes.
Instead, materials taught in sustainability courses are based on the instructors’
experiences. Further, there is a degree of resistance from education providers to
include sustainability into their teaching curricula (Murray & Cotgrave, 2007). Therefore,
there is an urgent need for comprehensive guidelines and strategies for education
providers to prepare students with sustainability knowledge and techniques (Wang,
2009). In a case study in New Zealand, Kestle & Rimmer (2010) assessed a student’s
CHAPTER 2 – LITERATURE REVIEW
46
ability to apply relevant and defensible real-time sustainable design and construction to
a concept and found that given sufficient freedom, students could demonstrate an
appropriate level of understanding of sustainability.
Overall, construction’s lack of aspirations to achieve sustainability is universal.
Therefore, there is a need for a major cultural shift to enhance the sector’s respect for
sustainability (Fellows and Liu, 2007; Yip & Poon, 2009). By understanding the culture
of the construction industry, appropriate strategies can be implemented to enhance the
uptake potentials for construction sustainability. One such strategy is to assess the
economic imperatives of minimising construction’s C&D waste outputs. It is indeed a
fundamental rationale for the study reported in this thesis.
2.6. C&D Waste Management
2.6.1. Waste Management Overview
Waste management is a process involves ‘collect, transport, process, dispose and
monitor waste materials to reduce their effect on human health and/or local amenity’
(Ecolife, 2015). Waste in this sense is materials that are produced by human activities
and can be solid, liquid, gaseous or radioactive. It has been observed that waste
generation increases as population and economic developments grow. This means
improper handling of waste can pose significant risks to human health and the
environment (EPA, 2002). Adverse effects of uncontrolled waste disposal and improper
waste handling include water and soil contamination, increased insect and rodent
populations and safety hazards such as fires or explosions.
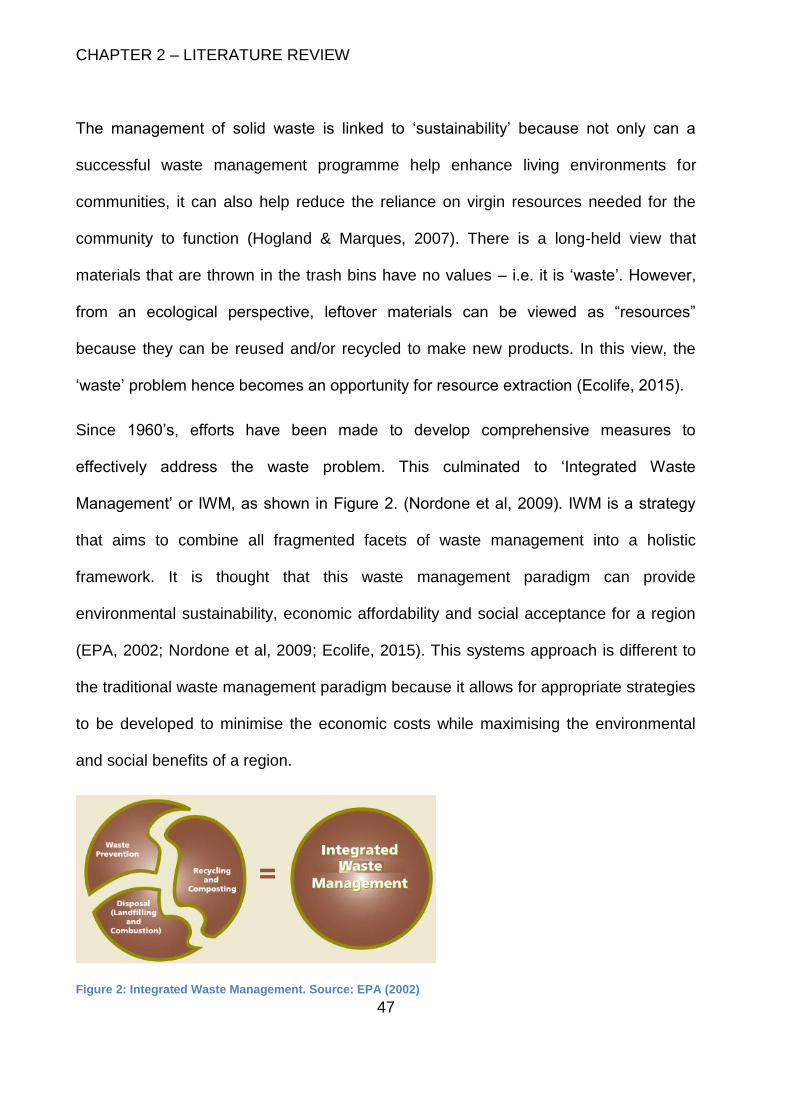
CHAPTER 2 – LITERATURE REVIEW
47
The management of solid waste is linked to ‘sustainability’ because not only can a
successful waste management programme help enhance living environments for
communities, it can also help reduce the reliance on virgin resources needed for the
community to function (Hogland & Marques, 2007). There is a long-held view that
materials that are thrown in the trash bins have no values – i.e. it is ‘waste’. However,
from an ecological perspective, leftover materials can be viewed as “resources”
because they can be reused and/or recycled to make new products. In this view, the
‘waste’ problem hence becomes an opportunity for resource extraction (Ecolife, 2015).
Since 1960’s, efforts have been made to develop comprehensive measures to
effectively address the waste problem. This culminated to ‘Integrated Waste
Management’ or IWM, as shown in Figure 2. (Nordone et al, 2009). IWM is a strategy
that aims to combine all fragmented facets of waste management into a holistic
framework. It is thought that this waste management paradigm can provide
environmental sustainability, economic affordability and social acceptance for a region
(EPA, 2002; Nordone et al, 2009; Ecolife, 2015). This systems approach is different to
the traditional waste management paradigm because it allows for appropriate strategies
to be developed to minimise the economic costs while maximising the environmental
and social benefits of a region.
Figure 2: Integrated Waste Management. Source: EPA (2002)
CHAPTER 2 – LITERATURE REVIEW
48
To date many studies have investigated solid waste management worldwide. Hogland
& Marques (2007) argued that the basic requirements for a successful waste
management programme are technology and standards for occupational health and
safety (OH&S). Although this view is valid, it is only likely valid for developed countries,
as the costs of purchasing the technologies and the costs of developing OH&S
standards are perceived as being too high by less-developed nations. However,
Shekdar (2009) recently found that the general waste management trend in both
developed and developing economies in Asia is in line with that elsewhere in the world.
It was reported that a handful of developed Asian countries such as Japan and South
Korea are having specific waste minimisation strategies in place; while the rest are
aiming to incorporate the 3R methodologies (reduce, reuse and recycle) in their
practices (Shekdar, 2009).
Nguyen & Schnitzer (2009) investigated solid waste management in Southeast Asia
and proposed a pragmatic model for managing waste for countries in this region. When
applied to a case study in Vietnam, it was found that the model, ‘A zero emissions agro-
based industrial ecosystem (AIZES)’, is suitable for the food processing industries.
Further, AIZES shows that waste can be reused as resources (Nguyen & Schnitzer,
2009). There are a number of fundamental differences between waste management
models proposed by Shekdar (2009) and Nguyen & Schnitzer (2009) respectively:
whereas the former is conceptual and can provide a framework that Asian nations could
adapt to their needs, the latter is practical and applicable to less-wealthy developing
nations of Southeast Asia. However, these two models can complement each other.
Further, when used together, they are can provide a good framework for solid waste
management.
CHAPTER 2 – LITERATURE REVIEW
49
2.6.2. Solid Waste Management in Construction
In construction, C&D waste can have significant impacts on the sustainability aspiration
of the whole sector. As mentioned in Section 2.5, most virgin materials currently being
mined is consumed by the construction industry. Any wastage generated by
construction represents a significant dissipation of resources (Hu, 2011). The fact that
C&D waste makes up between 10% and 36% of all landfill waste worldwide means that
construction has a significant problem with its waste (Kartam et al, 2004; Tam, 2007;
Yuan & Shen 2011; Hu, 2011; Hassan et al, 2012). The problem with C&D waste stems
from the fact that it is generated at every stage in the life of a structure (Conlin, 2012;
Hassan et al, 2012). Further, C&D waste can contain many hazardous materials from
chemical and industrial treatments (Wang et al, 2010). This means when C&D waste is
disposed of into landfill it can have major negative impacts on the environment due to
chemical leachate. As a result, there is an urgent need for the construction industry to
manage its solid C&D waste outputs.
2.6.2.1. Classification of C&D Waste
C&D waste can be divided into 2 categories: inert and non-inert materials. Using the
European waste list system, these two broad categories can be broken down to eight
C&D waste types: ‘concrete, bricks, tiles and ceramics’, ‘wood, glass and plastic’,
‘bituminous mixtures, coal tar and tarred products’, ‘metals (including their alloys)’, ‘soil
(including excavated soil from contaminated sites), stones and dredging spoil’,
‘insulation materials and asbestos-containing construction materials’, ‘gypsum-based
construction material’ and ‘other construction material’ (Lu et al, 2011). Similarly, New
Zealand has its own classification consisting of nine main types of C&D waste. These
CHAPTER 2 – LITERATURE REVIEW
50
classifications are useful because they allow for effective tracking and accurate
measurements of material wasted in construction projects (Fatta et al, 2003; Osmani et
al, 2008; Osmani, 2011; Yuan & Shen, 2011).
2.6.2.2. Recent Investigations in C&D Waste Management
To date there have been several studies aiming to promote the management of solid
C&D waste in construction worldwide. For instance, Jaillon et al (2008) found that waste
can be reduced significantly using compared to the conventional stick-built system. It
has been reported that up to 52% of C&D waste could be reduced using prefabrication
(Jaillon et al, 2008). This means a wider use of prefabrication could significantly reduce
the amount of waste generated in the Hong Kong building industry. Similarly, Poon et al
(2004) provided a detailed framework for managing and minimising building waste. As
evidenced by its successful applications in five housing projects, this framework could
potentially benefit the construction industry significantly (Poon et al, 2004). Kofoworola
& Gheewala (2009) developed a useful model to quantify the amount of C&D waste
generated in Thailand’s construction industry. With appropriate modifications, this
model could be useful, and applicable, to New Zealand construction. However, this
model lacks necessary rigour due to it not being applied to many cases. This is the
model’s weakness and cautions are needed when applying it to New Zealand. In Spain,
a waste management model called the Alcores model was introduced to control, treat
and reuse C&D waste in real time (Solís-Guzmán et al, 2009). The Alcores model is
more useful than one proposed by Kofoworola & Gheewala (2009) in that it has been
successfully tested in Seville. But again, cautions need to be taken when attempting to
implement this model in New Zealand because calibrations or modifications might still
be required.
CHAPTER 2 – LITERATURE REVIEW
51
Recently, Llatas (2011) introduced a model for quantification of project construction
waste in accordance to the waste list of Europe. This model is superior to both Solís-
Guzmán et al (2009) and Kofoworola & Gheewala (2009) because it is more systematic
and structured in its approach than the previous 2 (Llatas, 2011). Specifically, Llatas
(2011)’s model provided a classification system of C&D waste and related variables
such as quantification factors for building elements (constructive characteristics and
building materials). Another advantage of Llatas (2011)’s model over the other 2 models
is that it can be easily adapted for use in other countries without too much tweaking and
users can use create a C&D waste database from this model for monitoring purposes
(Llatas, 2011).
2.6.2.3. C&D Waste Management Systems Dynamics
With the development of advanced computer technologies, an increasing number of
authors have opted for simulations to study C&D waste (see, for example Shen & Tam,
2002; Love et al, 2002; Hao et al, 2007; Osmani et al, 2008; Osmani, 2011; Lu et al,
2011; Li et al, 2012; Yuan, 2012 or Ye et al, 2012). Of all simulation modelling tools,
systems dynamics seems to be the preferred choice. This is perhaps due to systems
dynamics’ ability to deal with complex issues involving social, economic and their
interactions (Ding, 2007; Ye et al, 2012). It was found that systems dynamics can aid
decision makers and practitioners to understand the complexity of information and
processes in managing C&D waste (Hao et al, 2007). Moreover, systems dynamics
could deepen the understanding about relationships in C&D waste
management/reduction strategies C&D (Yuan et al, 2011). For example, Zhao et al
(2011) applied systems dynamics to study the economic feasibility of a C&D waste
recycling centre. It was found that major factors affecting economic feasibility of the
CHAPTER 2 – LITERATURE REVIEW
52
project include unit cost and potential profits of the plant as well as additional revenues
from location advantage (Zhao et al, 2011).
Although systems dynamics is a powerful tool, it is unsuitable for this PhD study. To
successfully use a systems dynamics simulation, there is a requirement for reliable
quantitative and quantitative data (Hao et al, 2007). Qualitative data are often collected
via series of workshops or in-depth discussions while quantitative information must be
presented in a clear and consistent format. However, the dynamics of this specific
research, i.e. evaluating economics of C&D waste management strategies in New
Zealand, means that to utilise systems dynamics as a mean of solution would expand
the scope of the data acquisition process to make it unrealistic for the problem as
defined.
2.6.2.4. Challenges and Opportunities in C&D Waste Management
In theory, waste management practices differ between construction types (e.g.
residential, industrial and commercial) and between locations (e.g. developed countries
and developing nations). However, in practice, waste management strategies like
Waste Hierarchy, Source Reduction, Extended Producer Responsibility or User/Polluter
Pays Principle are often implemented, as they can ensure waste generators meet their
obligations under legislative requirements (BMA, 2009).
It has also been reported that the applications of C&D waste management have had
varying degrees of success. McDonald & Smithers (1998) found that when compared
with a similar project, waste-focussed projects could offer the stakeholders substantial
savings. This shows that by having a well thought-through waste management plan can
offer significantly benefits. McDonald & Smithers’ (1998) results was later supported by
CHAPTER 2 – LITERATURE REVIEW
53
Shen & Tam (2002) and later Tam (2007), with both studies confirmed that having a
waste management plan in construction can significantly improve the success rates of
reducing and reusing C&D waste.
However, the main barriers for implementation of C&D waste management are 1) the
lack of incentives offered to contractors; and 2) the relatively high costs associated with
such implementations (Shen & Tam, 2002; Kartam et al, 2004; Tam, 2007). Due to
these barriers, construction still has significant impacts on the environments. For
instance, in the Hong Kong construction industry in 2004, as high as 42 projects under
study (out of 69) did not have any measures to collect and separate C&D wastes while
44 projects did not use recycled building materials in any form (Wong & Yip, 2004). The
review of literature to date has revealed that cost and financial considerations related to
C&D waste management remain universal and unchanged in the psych of people
involved in construction across the world. However, if the construction industry is
committed to managing its C&D waste outputs, it can be postulated that savings such
as those reported in McDonald & Smithers (1998) are achievable.
An additional benefit of C&D waste management that is often ignored is a close
relationship between C&D waste management and onsite productivity. Dainty & Brooke
(2004) found that when waste management programmes were used on high-profile
projects, productivity, site safety and project profit margins were all achieved. The
benefits of a good C&D waste management could also extend beyond the construction
sector (Peng et al, 2010). It has been reported that a recovery and recycling of C&D
waste programme could achieve two goals: first it created more jobs for the local
population in Thailand; and second, at the same time it reduced the energy
consumption in the same location (Kofoworola & Gheewala, 2009). Therefore, for a
CHAPTER 2 – LITERATURE REVIEW
54
waste management programme to succeed, the focus should rest on long-term benefits
to be gained instead of the associated short-term expenses (Shen & Tam, 2002).
Overall, there have been many applications of C&D waste management in construction.
However, the degree of success varies significantly from project to project. This is due
mainly to the fragmented nature of the construction industry. Nevertheless, such efforts
are the positive sign, as it shows the sector has realised the importance of, and its
responsibilities for, managing impacts of its operations. However, to ensure a full
understanding of C&D waste management is achieved, there is a need to show that
significant economic values can be generated from managing C&D waste. This is
indeed a fundamental rationale for the study reported in this thesis.
2.7. C&D Waste Minimisation
As presented in the Figure 1, C&D waste minimisation is a sub-category of C&D waste
management. Currently, there is an urgent need for the construction industry to rethink
its C&D waste management strategies. Predominantly, C&D waste results from internal
industry processes, mostly from the sector’s requirements, and waste, of natural
resources (Osmani, 2011; Hu, 2011). Waste minimisation can arguably help
construction to be more efficient and sustainable long term.
2.7.1. Proposals for C&D Waste Reduction
The analysis of the literature body collected for this research has found that recent
effort has mostly focused on the following 10 areas: Waste quantification and
evaluation, Waste reduction by design, On-site construction waste sorting
methods/techniques, Data collection models (flows and mapping of wastes),
CHAPTER 2 – LITERATURE REVIEW
55
Improvements of on-site waste management practices, Reuse/recycle of construction
waste, Benefits of waste minimisation, Waste minimisation guides, Attitudes towards
construction waste, Comparative waste management studies.
These findings are consistent with those of Osmani’s (2012). The three research
themes identified in Osmani (2012) but were not included here are: ‘Procurement
strategies to suit waste minimisation’; ‘Impact of legislation on waste management
practices’ and ‘Development of on-site waste auditing and assessment tools’. This
minor deviation is due to the different approaches of the two studies: Osmani (2012)’s
study focused on policies of C&D waste management and minimisation; whereas the
research contained in this thesis focuses on economics of C&D waste minimisation.
It has been suggested that C&D waste minimisation could be achieved by having good
relationship with stakeholders throughout the project life (Farinan & Caban, 1998;
Treloar et al, 2003; Dainty & Brooke, 2004; Khalfan, 2006; Kubba, 2009). In the
researcher’s opinion, this is idealistic. In theory, this idea could significantly reduce
onsite waste. However, in practice it is difficult to attain due to the industry’s
fragmentation. Besides, the applicability of this idea in construction is currently unclear.
The fragmentation problem in construction is nothing new. For this to work, it will
require a total change in the industry’s mind-set.
The fragmented nature of construction is known to be the main hindrance for the
implementation of such a collaborative framework. As construction is mostly made up of
small construction companies working in a low profit margin and competitive market,
time and costs are often at their key considerations. Often a collaborative framework
such as one proposed by the above authors requires significant investments, in terms
CHAPTER 2 – LITERATURE REVIEW
56
of time and money, from the involved partners. Therefore, small construction
companies may be deterred by this idea. However, this observation is entirely based on
the researcher’s experience and knowledge in New Zealand construction. But the lack
of literature on this subject matter means that there is an urgent need for investigations
into this area. Such an investigation is worthwhile because it can provide construction a
good understanding of relationship between sizes of construction companies and
willingness to participate in collaborative framework to reduce C&D waste in the
residential construction sector. This understanding can in turns help the construction
industry to develop appropriate strategies to enhance the uptake of C&D waste
minimisation in the construction industry.
Similarly, Saunders & Wynn (2004) suggested that having appropriate training for site
personnel could significantly improve reduce waste. Although Saunders & Wynn
(2004)’s C&D waste reduction proposal is not new, it requires a significant effort and
commitment from the industry. Currently in construction, training and education is a
costly component for companies so it is often not done systematically to minimise on-
going costs. Such one-off training may not be effective, as it lacks the depth and
context to properly educate tradesmen of values and benefits of waste reduction.
Hence, there must be a concerted effort by all stakeholders for such a training
programme to be effective. As an example, Lingard et al (2010) showed that goal
setting and feedback should be included in a waste management programme because
they can help improve the project’s overall efficiency and waste reduction
performances.
CHAPTER 2 – LITERATURE REVIEW
57
2.7.2. Recent C&D Waste Minimisation Programmes Worldwide
In terms of programmes to help the construction industry address C&D waste
minimisation, there have been several waste minimisation programmes available
worldwide. Some typical examples include SMARTWaste (McGrath, 2001) or REBRI
(BRANZ, 2013). However, one thing that has impeded the uptake of tools such as
SMARTWaste or REBRI is the construction industry’s reluctance to implement new
ideas and systems. One exception is the case in New South Wales, Australia, where an
umbrella waste management programme called Sustainability Advantage has been in
operation and achieved critical successes not only in construction but also in other
sectors (Environmental NSW, 2014).
More practically, Lingard et al (2010), Hu (2011) and Osmani (2011) showed that waste
could be significantly reduced by implementing integrated design and construction.
Similarly, Treloar et al (2003) suggested techniques such as life-cycle analysis (LCA) or
life-cycle costing (LCC) could be employed at early stages of the construction process
to inform stakeholders of values of C&D waste management. Although such whole-of-
life perspectives are useful, it is unclear in Treloar et al (2003) that they were used in
residential construction, i.e. the focus of Treloar et al (2003)’s study. Perhaps LCA and
LCC are more beneficial for decision-makers in large construction projects than they
are in smaller ones, e.g. residential construction. But currently there is no way to verify
this assumption, as little evidence can be found in the body of literature for this study.
This is a gap in knowledge and future studies can be undertaken to explore this area.
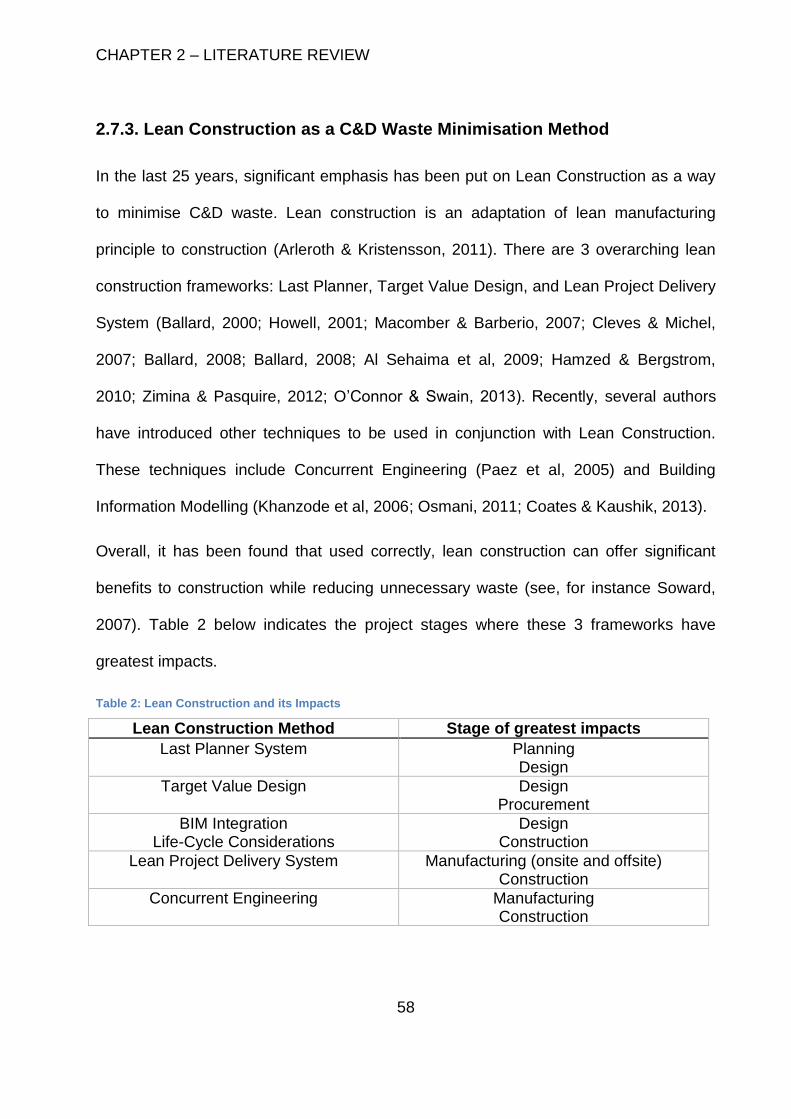
CHAPTER 2 – LITERATURE REVIEW
58
2.7.3. Lean Construction as a C&D Waste Minimisation Method
In the last 25 years, significant emphasis has been put on Lean Construction as a way
to minimise C&D waste. Lean construction is an adaptation of lean manufacturing
principle to construction (Arleroth & Kristensson, 2011). There are 3 overarching lean
construction frameworks: Last Planner, Target Value Design, and Lean Project Delivery
System (Ballard, 2000; Howell, 2001; Macomber & Barberio, 2007; Cleves & Michel,
2007; Ballard, 2008; Ballard, 2008; Al Sehaima et al, 2009; Hamzed & Bergstrom,
2010; Zimina & Pasquire, 2012; O’Connor & Swain, 2013). Recently, several authors
have introduced other techniques to be used in conjunction with Lean Construction.
These techniques include Concurrent Engineering (Paez et al, 2005) and Building
Information Modelling (Khanzode et al, 2006; Osmani, 2011; Coates & Kaushik, 2013).
Overall, it has been found that used correctly, lean construction can offer significant
benefits to construction while reducing unnecessary waste (see, for instance Soward,
2007). Table 2 below indicates the project stages where these 3 frameworks have
greatest impacts.
Table 2: Lean Construction and its Impacts
Lean Construction Method Stage of greatest impacts
Last Planner System Planning Design
Target Value Design Design Procurement
BIM Integration Life-Cycle Considerations
Design Construction
Lean Project Delivery System Manufacturing (onsite and offsite) Construction
Concurrent Engineering Manufacturing Construction
CHAPTER 2 – LITERATURE REVIEW
59
Despite the benefits that lean construction can offer, the uptake of this concept in
construction has been slow. Currently there is no argument and/or explanation as to
why this is the case. This is a knowledge gap that needs to be addressed urgently.
Perhaps this knowledge gap is a factor that contributes to lean construction not being
viewed as an attractive option for construction companies, as it fits into the ‘too-much-
work-to-implement-but-commercially-uncertain’ category. Commercial uncertainty in this
sense means that construction companies may view lean construction as a novelty
method, i.e. one which does not offer them significant competitive advantages over their
competitions simply by implementing it. This shows that in order for lean construction,
or any waste minimisation-focussed systems, to be accepted and implemented by the
construction industry, they should offer construction companies compelling economic
reasons for implementation.
However, the review of literature to date has revealed there is a lack of tools and
techniques to aid such economic considerations. This is another gap in the body of
knowledge and one that needs to be addressed urgently. An understanding of factors
impeding the widespread uptake of lean construction would help the construction
industry to establish appropriate strategies to address such factors. It is anticipated that
once lean construction is used by the construction industry, it can help the industry to
address its C&D waste issues.
Despite its usefulness in accounting for C&D waste, lean construction is not a suitable
method for this study. The dynamics of this research means that effort should be
focused on developing an economic evaluation framework to assess the economics of
C&D waste management strategies in New Zealand. This requirement means that to
CHAPTER 2 – LITERATURE REVIEW
60
employ lean construction as a mean of solution would expand the scope of the data
acquisition process to make it unrealistic for the problem as defined.
2.8. Zero Waste
According to the conceptual C&D waste model presented in Figure 1, zero waste is the
goal of C&D waste minimisation. This is also a universal and accepted understanding
worldwide (Curran & Williams, 2012). Theoretically, ‘zero waste’ is a philosophy that
aims to alter the current patterns of resource usage to minimise and reduce waste to
zero (Whitlock et al, 2007; Connett, 2008; Young et al, 2010). However, currently there
is no single definition of ‘zero waste’ and each author defines ‘zero waste’ differently to
suit their own agendas (Phillips et al, 2011). This is a weakness of this theory.
In theory, zero waste can be achieved through 100% recycling or reusing materials. But
in practice, 100% efficient use of materials is not possible. So, zero waste is understood
as a new standard for systems efficiency and integration (Whitlock et al, 2007; Curran &
Williams, 2012). In this context, waste can be thought of as ‘residual products’ or
‘potential resources’. This means zero waste is a logical aspiration of sustainability.
2.8.1. Recent History
The term “zero waste” was first used publicly as the name of a company, Zero Waste
Systems Incorporated (ZWSI), in 1974 in Oakland, California (Palmer, 2013). ZWSI’
main activity was trading reusable laboratory chemicals in California as well as
repackaging and reselling by-products from other industries (Zaman & Lehmann, 2011).
As ZWSI was the only company in the world working in this business at that time, it was
CHAPTER 2 – LITERATURE REVIEW
61
well-recognised internationally (Palmer, 2013). Consequently, the term Zero Waste has
been widely used as a vision and goal for society (Palmer, 2013).
However, zero waste is sometimes considered as a direct result of Integrated Waste
Management (ZeroWaste, 2011). In fact, a complete history of Zero Waste was
provided in a report funded by the European Economic Commission (ZeroWaste,
2011).
Since 1980’s, ‘zero waste’ has become a powerful environmental initiative worldwide
(Snow & Dickinson, 2001). In New Zealand, the zero-waste concept has been widely
accepted since its introduction, with over one third of New Zealand’s local authorities
have now set targets of zero waste to landfill (Snow & Dickinson, 2001).
From its conception, the ‘zero waste’ philosophy has challenged people’s
understanding and practices around waste management and waste minimisation (ZWA,
2013).
In the ‘traditional’ waste minimisation framework, majority of waste is often disposed of
in landfill or incinerators. For example, it has been reported that in the USA alone, 7.6
billion tons of non-hazardous industrial waste were generated and managed annually in
landfills (GM, 2012). Not only is this approach wasteful, expensive and harmful for
environment, it has not kept pace with the scale, persistence and toxicity of the waste
(ZWA, 2013).
To the contrary, zero waste suggests that ‘waste’ should be thought of as ‘residual
products’ or ‘potential resources’ in a continuous, integrated, closed-loop system.
By reconceptualising waste as resources, society in general is in a win-win situation.
This is because not only do zero waste practices support employment, business
CHAPTER 2 – LITERATURE REVIEW
62
innovation and ‘green growth’, such practices can also help significantly reduce energy
and water usage, green-house gas (GHG) emissions, pollution and loss of bio-diversity
(AUMA, 2012). Moreover, waste, now viewed as resources, can be conserved, used
efficiently and recycled back into the economy. Opportunities that zero waste can offer
include reduced costs, increased profits, and reduced environmental impacts when
using these ‘resources’ as inputs to natural or industrial systems. This further enhances
the wealth of the society (ZWA, 2015).
2.8.2. The Zero Waste Paradigm
It has been widely agreed that waste disposal and waste minimisation are the first and
second generations of resource planning, respectively. Zero waste can hence be
thought of as the third generation of resource planning (ZWI, 2015). It has been
suggested that to reach Zero Waste, waste prevention must be the new focus instead
of simply focusing on management of waste (Doppelt et al, 1999). According to zero
waste, the best way to avoid waste is to reuse everything perpetually. In this sense,
zero waste aims to wring maximum efficiency from the use of resources (ZWA, 2013).
However, this goal can only be achieved if ‘reuse’ is designed into products right from
the start, i.e. attentions need to be paid to the whole lifecycle of products (Green Peace,
2002). This is a different perspective to recycling, where the designers often have the
notion of ‘discard’ in mind when designing a product. As a result, current ‘extract, use
and discard’ systems squander valuable resources while creating an accumulating debt
of damage to land, air, water resources and biodiversity (Doppelt et al, 1999).
Due to the limited literature on zero waste in the construction context, discussions about
zero waste will include zero waste studies pertaining to other industries. This ensures
CHAPTER 2 – LITERATURE REVIEW
63
sufficient knowledge and understanding on this subject matter can be achieved. In
particular, zero waste discussions at three levels are made to provide a good
understanding of this subject matter. They are discussions of zero waste at: national
level, regional level and industry level.
2.8.3. Zero Waste Considerations at a National Level
The concept of zero waste has been accepted and implemented worldwide. Currently at
the national level, many countries have specific regulations and strategies to achieve
Zero Waste (Connett, 2008; Curran & Williams, 2012). These countries include Italy,
Germany and France, Japan, New Zealand and Australia, Canada and the USA. The
use of regulations and policies to help achieve zero waste is largely a top-down
approach. At the national level, this is perhaps the only way which the government
could influence the behaviours of stakeholders and help drive the implementation of the
concept (Liss, 2000). Indeed, it has been reported that through governments’ effective
introductions and controls of environmental policies and waste incentive programmes,
many success stories about waste reduction and elimination have emerged around the
world (Connett, 2008; Young et al, 2010; Snyman & Vorster, 2011; Phillips et al, 2011
or the GAIA Report - Allen et al, 2012).
In addition, there have been many methods developed to measure, quantify and track
zero waste. Whitlock et al (2007) suggest that ‘Value Chain Analysis’ should be utilised
to study the paradigm shift to zero waste. This is a commonly-used tool in waste water
treatment and one could provide decision-makers an understanding of drivers affecting
zero waste (Whitlock et al, 2007). Similarly, Curran & Williams (2012) argued that a
closed-loop model like that used in the ZeroWIN Project might be appropriate for
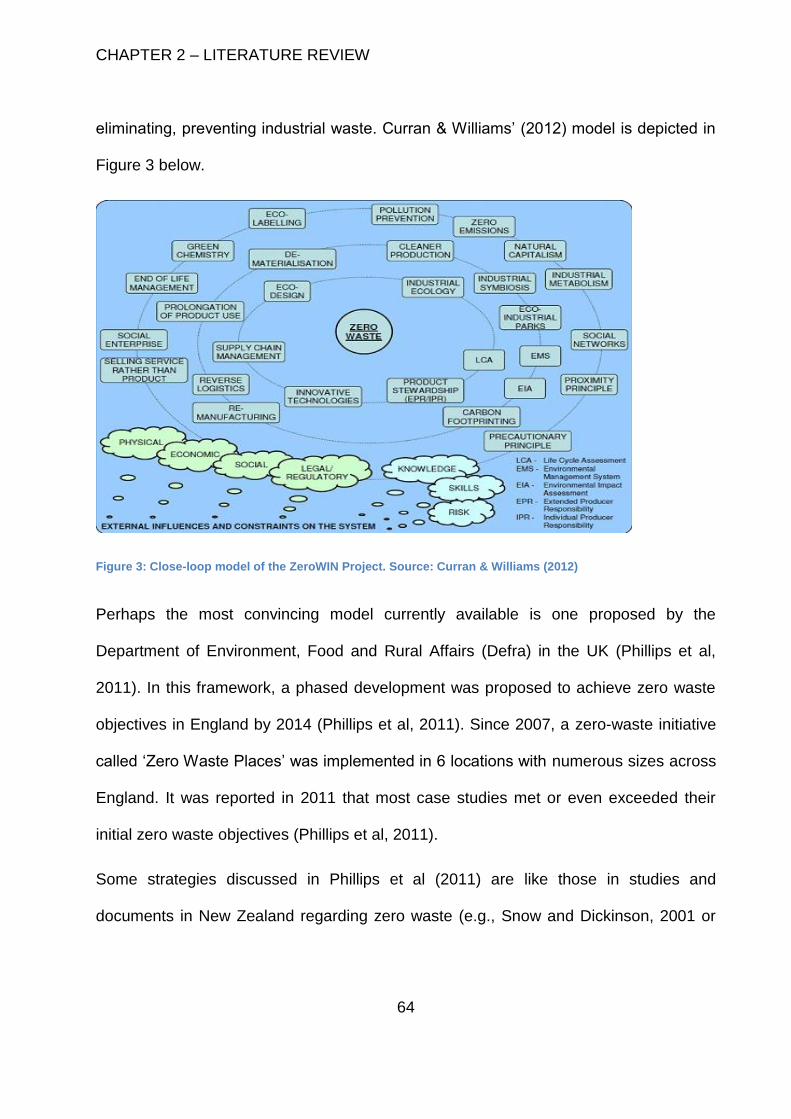
CHAPTER 2 – LITERATURE REVIEW
64
eliminating, preventing industrial waste. Curran & Williams’ (2012) model is depicted in
Figure 3 below.
Figure 3: Close-loop model of the ZeroWIN Project. Source: Curran & Williams (2012)
Perhaps the most convincing model currently available is one proposed by the
Department of Environment, Food and Rural Affairs (Defra) in the UK (Phillips et al,
2011). In this framework, a phased development was proposed to achieve zero waste
objectives in England by 2014 (Phillips et al, 2011). Since 2007, a zero-waste initiative
called ‘Zero Waste Places’ was implemented in 6 locations with numerous sizes across
England. It was reported in 2011 that most case studies met or even exceeded their
initial zero waste objectives (Phillips et al, 2011).
Some strategies discussed in Phillips et al (2011) are like those in studies and
documents in New Zealand regarding zero waste (e.g., Snow and Dickinson, 2001 or
CHAPTER 2 – LITERATURE REVIEW
65
Ministry for the Environment, 2010). These similarities may be due to the fact that New
Zealand often looks to England as a ‘big brother’ in terms of policies and goal settings.
Currently, there are issues in New Zealand that have prevented high adoption rates of
zero waste in the country (MfE, 2010). There is a severe lack of information regarding
size, composition and effects of waste to the New Zealand environment. Without this
information, it is difficult for New Zealand to establish baseline objectives for waste
minimisation and zero waste.
Also, the geography of New Zealand, where towns and cities are dispersed, means that
significant wastage is inherent in the supply chains of all goods and materials in the
New Zealand economy. This wastage is in forms of infrastructure and energy, as large
infrastructures are required to service small communities. Further, given New Zealand
is a small, unreliable and uneconomical market for recycled materials, it does not
currently have any economic schemes to encourage adoption of zero waste. The lack
of economic schemes may be a crucial factor contributing to the low adoption rate of
zero waste in New Zealand (Liss, 2000). Therefore, New Zealand can learn from
experience of other countries to establish appropriate strategies to encourage the
adoption of zero waste policies in the country.
One significant example is the case of Taiwan. Taiwan’s specific waste minimisation
approach includes six specific strategies, namely: regulatory amendments,
consumption education, financial incentives, technical support, public awareness and
stepwise target reviews. It was reported that after 4 years of implementing the zero-
waste system (2003-2007), Taiwan’s municipal solid waste outputs were reduced by
37%, which far exceeded the original target of 25% reduction. At the same time, Taiwan
CHAPTER 2 – LITERATURE REVIEW
66
could minimise its industrial waste outputs by 76% (Young et al, 2010). Although this
achievement is impressive, one must be cautious when looking at statistics figures like
these. This is because although the waste reduction is significant, over the same period
a large portion of Taiwan’s manufacturing capabilities were moved to China (Michigan
State University, 2013). In the researcher’s opinion, this movement of industrial and
manufacturing capacity between Taiwan and China could skew Taiwan’s waste
statistics somehow. Despite this, Taiwan is on a proper path to achieve zero waste, with
many useful strategies and suggestions have been proposed to help drive the country
towards its goal (Young et al, 2010).
Overall, the review of literature pertaining to zero waste at the national level has
revealed that the concept is well-perceived and adopted worldwide. But each country
needs to be selective of appropriate approaches to take to achieve its successful zero
waste goals.
2.8.4. Zero Waste Concept at the Regional Level
Like undertaking at a national level, zero waste has also been widely adopted at
regional level. In Los Angeles, 62% of the city’s waste is recycled; while San Francisco
has established itself as the global leader in waste management, with 77%-80% of the
city’s waste is recycled and reused (Allen et al, 2012; PBS, 2013). In Italy, it has been
reported that even relatively small cities like Novara (population 100,000) near Turin
has managed to reach the reduction rate of 70% in very short time - 18 months
(Connett, 2008). In Canada, a growing number of municipalities are adopting a Zero
Waste as a long-term goal that drives management decisions (AUMA, 2012). For
instance, it was reported that people at many municipalities are encouraged to reduce
CHAPTER 2 – LITERATURE REVIEW
67
waste such as disposable foodware; and instead, reuse, recycle, and compost all such
resources whenever applicable (AUMA, 2012). Many other successful cases in
implementing zero waste can be found in studies extensively focussing on, or pertaining
to, zero waste such as Connett (2008), Zaman & Lehmann (2011), Lehmann (2011) or
Allen et al (2012).
In New Zealand, the Opotiki District Council was the first regional council to adopt a
Zero Waste policy. The council has 5 Resource Recovery Centres; and which together,
have consistently diverted 90% of waste from landfill since 1999 (Knight, 2007).
Recently, it has been reported that Auckland Council has adopted zero waste strategy
as well. Specifically, Auckland has set a detailed plan for managing and minimising
waste, with targets of reducing up to 30% of domestic and in-house council rubbish by
2018 and ultimately, reducing 30% of all waste to landfill by 2027, including C&D waste
(Auckland Council, 2012). Although these waste reduction goals of Auckland Council
are insignificant in comparison to zero waste set out elsewhere (such as those by
Austin Council in Austin, Texas (ARRPM, 2013)), they are ambitious due to Auckland’s
size in the New Zealand setting. However, based on recent success stories of zero
waste implementation in cities worldwide, it is anticipated that Auckland’s goals in zero
waste could be achievable.
It must be noted that to achieve zero waste, there must be clear guidance as well as
incentives to change waste behaviours of all stakeholders and encourage for the uptake
of sustainable waste management strategies (Liss, 2000). Since all this comes with a
cost to the local authorities, there needs to be holistic and integrated waste
management systems in place so the local authorities can make appropriate plans
(Zotos et al, 2009).
CHAPTER 2 – LITERATURE REVIEW
68
Similarly, Zaman & Lehmann (2011) demonstrated that a holistic waste management
framework could help cities to work towards ‘‘zero waste” objectives. Such a holistic
framework must encompass relevant tools, systems, and technologies. Further, the
framework must be affordable, practicable, and effective within their local regulations
(Zaman & Lehmann, 2011). It was anticipated that this model could be applicable to
industrialising Asian and African nations as well as Australia.
Overall, these works all have a major limitation in that they do not offer any specific
recommendations about the operational requirements and objectives for having a zero-
waste strategy at municipal levels.
Municipal solid waste is comprised of many types of waste; of which C&D waste is
composed of about 30%-40% (Wang et al, 2010; Yuan & Shen, 2011). By not having a
specific recommendation on how to manage and/or reduce this waste stream is a major
weakness of the above-mentioned municipal zero waste studies. It has been shown
that having appropriate technology and guiding principles (through regulations and
policies) are of utmost importance if a city wants to reach a zero-waste objective
(Snyman & Vorster, 2011).
2.8.5. Zero Waste at Industry Level
The review of literature to date has revealed that there is a limited body of knowledge
on zero waste at industry level. This lack of studies at this level is perhaps due to the
complexity in reporting zero waste at the industry level.
At the national or regional levels, authorities can introduce and pass
directives/legislations regarding zero waste. In effect, a national or regional body can
CHAPTER 2 – LITERATURE REVIEW
69
amalgamate related (or sometimes, distantly related) industries together and establish
zero waste strategies without having to worry about how each industry works in order to
achieve such strategies.
However, at the industry level, each sector is specific about the way it operates; so it is
not possible to amalgamate practices of different sectors together. As an example, the
construction sector is comprised of many subsectors (inter alia building, civil,
infrastructure) and companies of all sizes operating within or across each sector; each
of these subsectors or companies have their own specific ways of working. That makes
it difficult for the industry body to implement or impose/enforce a complex strategy such
as zero waste to the whole sector using a top-down approach because it may not be
able to pinpoint exactly what needs to be done, and how, in order to achieve zero waste
for that specific sector.
In the current setting for this research, zero waste studies pertaining to construction are
of most interest. However, due to the limited number of zero waste studies in the
industry, zero waste cases from other sectors have been included to draw analogous
findings for comparisons.
2.8.5.1. Zero Waste Studies in Manufacturing Industry
Some of the earliest studies concerning zero waste at the industry level are Mason et al
(2003) and Kumar et al (2005). Although the former is descriptive in nature, it could
nevertheless be considered as an impetus for achieving zero waste for universities.
In principle, Kumar et al (2005) agreed with Mason et al (2003) that there needs to be a
close interactions and integration approaches between stakeholders. However, the
research settings of Kumar et al’s (2005) research are different to those of Mason et
CHAPTER 2 – LITERATURE REVIEW
70
al’s (2003) study. Whereas Mason et al (2003) focused on the education sector, Kumar
et al (2005) studied the manufacturing industry.
It was found that for the manufacturing industry to achieve zero waste successfully, it
must overcome a number of industry-specific barriers and challenges (Kumar et al,
2005). These challenges range from social and environmental considerations; to
techno-centric issues around product design, manufacturing and recovery technologies;
and finally to end user-related matters such as economics of products and/or users’
usage patterns (Kumar et al, 2005). It was further found that the most sustainable
recovery option is reusing the whole product because it adheres to the central themes
of zero waste (Kumar et al, 2005). However, the some results of this study may not be
generalisable and applicable to the construction industry because not every product in
construction (e.g. building or building part) is fully reusable as in the case of
manufacturing industry. In spite of that drawback, Kumar et al (2005)’s findings related
to challenges facing an industry in the quest of, becoming zero waste is nonetheless
highly relevant to the construction setting.
Similarly (still in the manufacturing sector), Ball et al (2009) examined challenges in
designing and developing a zero carbon manufacturing facility. It was found it is
technically viable to achieve a zero carbon objective by smartly integrating flows of
material, energy and waste in the manufacturing process (Ball et al, 2009).
Overall, Kumar et al (2005) and Ball et al (2009) have demonstrated that although it is
possible to achieve zero waste via technologies alone, careful considerations must be
given to this approach because it is an expensive path to achieve zero waste. At the
same time, the true long-term success of the techno-centric approach is not fully
CHAPTER 2 – LITERATURE REVIEW
71
secured, as takes out the equation considerations for human’s waste behaviours.
Therefore, in the researcher’s opinion, a sustainable path towards zero waste must
include a combination of technology, metrics and policies.
Recently, a number of major manufacturing companies including Kodak, Ford, GM,
Chrysler and 3M all have specific policies and plans for improving their designs in order
to allow for easy recycling and reusing of their end products (ZeroWaste, 2011). For
instance, it has been reported that as of 2011, more than 90% of the waste generated
at GM’s worldwide manufacturing facilities was recycles or reused (GM, 2012).
Consequently, GM has been continual recognised for its outstanding waste reduction
by the U.S. EPA (GM, 2012). This is indeed a significant achievement and one which
shows the feasibility and viability of a zero waste policy. Similarly in New Zealand,
Fonterra has managed to divert over 75% of waste from its nationwide operations,
including the complete removal of dirty plastic from its waste streams (Knight, 2007). In
another example, a recent waste audit at Counties Power, which operates between
southern Papakura and North Waikato regions, showed that majority of material used
by the company could be diverted from landfill. In turns, Counties Power could
potentially save up to $50,000 per annum in waste disposal (Knight, 2007).
2.8.5.2. Zero Waste Studies in Construction Industry
In the construction context, although there has been significant effort in minimising
adverse physical effects of the industry on the environment, i.e. solid C&D waste (i.e. Li
et al, 2005 or Poon et al, 2010), the ‘zero waste’ concept still does not seem to get any
traction (Osmani, 2011). It has been argued that by reducing C&D waste, construction
could potentially experience significant benefits, both in terms of performance and cost
savings (Lingard et al, 2010). But this requires every stakeholder in the construction
CHAPTER 2 – LITERATURE REVIEW
72
supply chain to be proactive in promoting and practicing waste minimisation so that
waste minimisation/zero waste schemes can be effective and self-sustaining (Osmani,
2011). Moreover, construction and the government need to collaborate closely to
establish a framework to promote and encourage waste reduction as well as associated
enforcement methods (Snyman & Vorster, 2011). It has been shown that such a close
collaboration between the industry and the government could offer mutual benefits,
because while the industry could improve its image of pursuing a better environment,
the government gets closer to its national or regional zero waste objectives (Young et
al, 2010).
As mentioned earlier, although the number of studies pertaining to zero waste in
construction is relatively small in comparison to those in other industries, there is a
growing attention given to this issue by construction researchers. In 2002, Alexander
(2002) studied the opportunities and resources needed for successful zero waste
implementation in the hotel industry and found that in order for it to be implemented,
there needs to be a tight integration across the whole sector. It was shown that by
having monitoring systems and standards in place, ‘green hotel’ could be achieved in
many countries and locations around the world (Alexander, 2002).
Rubinstein (2012) developed a guideline to achieving the zero C&D waste for builders
and contractors. It was anticipated that by following the steps outlined in this study, a
safer and waste-free worksite could be the reality in the construction sector (Rubinstein,
2012).
At a technical level, Kinuthia & Nidzam (2011) investigated the opportunity for the
construction sector to move towards zero industrial waste by reusing brick dust.
CHAPTER 2 – LITERATURE REVIEW
73
Through laboratory testing and experiments, Kinuthia & Nidzam (2011) showed that this
technology works well and could be used as a material for infrastructure construction.
Further, the technology is shown to be sustainable in both economic and environmental
terms (Kinuthia & Nidzam, 2011). This study is particularly helpful in convincing the
sector to be more sustainable since it has provided a proof that if appropriate effort and
technologies are utilised, a zero-waste objective in construction could totally be
achieved.
2.8.5.3. Zero Waste Literature Findings
Overall, the body of knowledge regarding zero waste is small, with few technical
publications available worldwide. Most of current literature on zero waste tends to
describe zero waste rather than offering any real insights into the concept. As such,
there is significant knowledge gap that needs to be filled.
In the construction context, there is even smaller portion of literature pertaining to zero
waste that is available. This research is one of the first studies worldwide to explore
zero waste in construction, aiming to assess economics of zero waste in this context.
Findings of this research will enhance the construction industry’s understanding of zero
waste and its benefits. Further, it is anticipated that this study can help enrich the
current general body of knowledge in zero waste.
2.9. C&D Waste: Economic Considerations
For C&D waste minimisation to become a normal practice in construction, there is a
requirement for construction companies to pay attention to the environmental, social
and economic aspects of their businesses (Lu & Yuan, 2010; Yuan, 2012). This triple-
CHAPTER 2 – LITERATURE REVIEW
74
bottom line (TBL) approach can offer construction companies significant benefits,
including tangible benefits (such as cost reductions) as well as intangible benefits (such
as improved public image) (Chung & Lo, 2002; Tam, 2010).
The main consideration for undertaking C&D waste minimisation is its economics.
These economic considerations include costs of waste (Peng et al, 2010) and cost of
implementation (Shen & Tam, 2002; Kartam et al, 2004; Tam, 2007), as well as the
returns on such investments. It has been shown that although it is possible to reuse and
recycle most C&D waste using current technologies, waste minimisation in construction
still fails to achieve its objectives due to the lack of necessary commercial arguments
for its implementation (Ball et al, 2009). Without being shown the commercial
imperatives of minimising C&D waste, construction stakeholders are unlikely to change
their wasteful attitudes and behaviours to implement C&D waste minimisation
strategies.
This finding shows that financial considerations related to waste management are
universal and have remained unchanged in the psyche of people in construction. This is
the fundamental rationale for undertaking the research reported in this thesis. It is
anticipated that based on this study appropriate strategies can be established in the
New Zealand construction industry to reduce C&D waste.
Recently, much effort has been made to evaluate the economics of C&D waste
management and minimisation. For instance, Yahya & Boussabaine (2006) proposed a
framework to assess eco-costs of construction waste programmes while Begum et al
(2006) provided useful cost-benefit analysis model to evaluate economics performance
of Malaysian construction’s waste minimisation. Similarly, Tam & Tam (2008) provided
CHAPTER 2 – LITERATURE REVIEW
75
a step-wise incentive scheme to evaluate the economics of C&D waste strategies. This
model has proven to be effective in encouraging C&D waste minimisation practices in
Hong Kong (Tam & Tam, 2008).
As money is a key driver in a waste minimisation strategy, there needs to be
instruments to enhance its effectiveness. These instruments can be ‘push’ factors such
as industry-focused legislations and/or performance standards. Alternatively, they can
be ‘pull’ factors such as incentives and subsidies.
In the ‘push’ category, it has been shown that C&D waste-specific landfill and levy
charges help reduce levels of waste generated significantly (Sealey et al, 2001; MfE,
2009; Yu et al, 2013). Actions in the ‘push’ category are often mandated by governance
bodies such as the government or industry bodies. However, these organisations can
only implement a strategy if they see values in doing so; and often such values
predominantly include economic considerations.
By contrast, in the ‘pull’ category it has been shown that with right incentive schemes,
significant volumes of C&D waste can be eliminated (Tam & Tam, 2008). Unlike in the
‘push’ category, actions to introduce incentives or penalties can be undertaken by
anyone in the supply chain. For example, in a project the client could introduce
penalties to cut cost and to ensure contractors deliver projects to the required
standards. At the same time, the client may offer incentives to motivate contractors to
deliver project goals quickly or timely. In return, the contractor may use penalties to
pass on the cost to their sub-contractors and suppliers. Alternatively, the contractor may
pass on a fraction of incentives received to their sub-contractors and suppliers to
motivate them or to establish a working relationship with their sub-contractors. In
CHAPTER 2 – LITERATURE REVIEW
76
construction, often only the costs associated with a C&D waste management strategy is
guaranteed to be passed down the supply chain line, as companies look to minimise
their risks. While on the other hand the financial benefits may be introduced for a
specific reason and as the client side sees fit. Currently there is a lack of incentive and
penalty schemes in New Zealand to encourage the construction industry to manage
and minimise its waste outputs.
Being a major waste generator in New Zealand, the construction industry can do more
to minimise waste; and in turns, be a good promoter of waste minimisation. It is
anticipated that based on the results of this research, appropriate pathways can be
formulated to guide and ensure the New Zealand construction industry meet its
sustainability objectives.
2.10. Knowledge Gaps
Through the review of the literature, a few knowledge gaps have been identified.
2.10.1. Definition of C&D waste in New Zealand
As mentioned in Section 1.1, currently there is a lack of definitions of C&D waste
worldwide. This lack of definition for C&D waste has many implications in New Zealand.
First, the lack of a uniform C&D waste definition in New Zealand contributes to the lack
of understanding of C&D waste compositions. Without a clear idea of C&D waste
compositions, it is difficult to formulate strategies to address C&D waste streams.
Second, the lack of C&D waste definitions means that waste may be classified
differently between locations, leading to varying waste minimisation practices. The
CHAPTER 2 – LITERATURE REVIEW
77
result is C&D waste management/minimisation efforts at one location may not be
applicable to other locations, thus exacerbating the C&D waste problems further.
To overcome this challenge, this research introduced a definition of C&D waste in
Section 1.2. This definition of C&D waste was specific for this study and was introduced
to avoid any potential ambiguity in, and associated with, all work reported in this thesis.
Although the definition of C&D waste offered here is specific to this study, it is
anticipated that it contributes to the current knowledge in C&D waste minimisation.
2.10.2. Motivators for C&D waste minimisation
Through reviewing the literature, it can be argued that without a good understanding of
the factors affecting C&D waste minimisation, it is difficult to develop appropriate
strategies that could be adopted by all construction stakeholders. In New Zealand,
currently there is no existing literature that specifies the motivators that drive C&D
waste minimisation strategies. This is a missed opportunity and one which this research
could partially address.
Based on the existing literature and the researcher’s experience in the New Zealand
construction industry, it could be contended that a lack of incentive and penalty
schemes in New Zealand has discouraged construction to minimise its C&D waste. This
is purely a speculation and will require further researches to investigate it. In this study,
this speculation is not tested, as it is outside the scope of this research.
It can also be contended that a collaborative working environment is a key motivator in
C&D waste minimisation. It has been shown in the literature that to successfully
implement a C&D waste minimisation strategy, there is a requirement that construction
stakeholders must work together collaboratively. However, currently there is a lack of a
CHAPTER 2 – LITERATURE REVIEW
78
collaborative framework in New Zealand construction. This lack of collaboration in New
Zealand is due to the industry’s fragmentation. As such, there is an urgent need to
investigate the relationship between company sizes and its willingness to participate in
collaborative framework to reduce C&D waste. This understanding can help New
Zealand construction to develop appropriate strategies for C&D waste minimisation.
2.10.3. Economic evaluation of C&D waste minimisation
The literature review demonstrates that currently there is no existing economic
framework for the evaluation of the economics of C&D waste minimisation strategies in
New Zealand construction. In a way, this knowledge gap is a direct result of the first
knowledge gap. However, it is perhaps as important as, if not more important than, the
former. This is because the lack of economic evaluation methods to assess the
economics of C&D waste minimisation strategies is the main reason construction
continues to do nothing about its C&D waste issues.
Further, the literature review indicates that there are currently a number of economic
models concerning C&D waste management and minimisation (e.g. Covec, 2007; Tam
& Tam, 2008; Jain, 2012; Coelho & de Brito, 2012; Dajadian & Koch, 2014; Fadiya et al,
2014; Abdelhamid, 2014; Marzouk & Azab, 2014; Wang et al, 2014). However, these
models could not sufficiently address a key issue: how to identify 1) the optimal C&D
waste minimisation strategies and 2) the optimal C&D waste reduction rate. This is a
major knowledge gap in the current understanding of C&D waste minimisation
economics which needs to be addressed. This is indeed the fundamental rationale for
the research reported in this thesis.
CHAPTER 2 – LITERATURE REVIEW
79
2.11. Conclusion
This chapter has discussed in detail C&D waste and its related areas. In particular,
topics that have been touched upon in this chapter include Green Construction,
Sustainable Construction, C&D Waste Management, C&D Waste Minimisation and
Zero Waste. Green Construction and Sustainable Construction are wide-ranging
research topics; and they have provided sufficient background to the study reported in
this thesis. This is mainly due to these concepts’ broad focuses on minimising adverse
environmental effects of construction.
Overall, there have been many techniques and methods proposed in the literature
regarding C&D waste minimisation. However, it has been found through the literature
review that to ensure the long-term viability of any C&D waste minimisation strategies,
the construction industry must be convinced of the economics of such strategies. This is
because money considerations are still a key consideration in construction thinking.
Therefore, the strategies need to demonstrate commercial imperatives for them to be
implemented.
Zero waste is the final topic discussed in this chapter. In a way, zero waste is the goal
of waste minimisation. It was shown thorough the review of literature that this topic is
still in its infancy, with limited publications dedicated to this area of research. With
recycling and reusing waste as its focus, the ‘zero waste’ concept indeed suits the
purpose of this study well. Due to the limited literature in the body of knowledge of zero
waste, there is no study to date that investigates the economics of implementing it. This
CHAPTER 2 – LITERATURE REVIEW
80
is indeed a gap in knowledge that needs to be filled; and this study is in an appropriate
position to facilitate it.
To understand the economics of C&D waste minimisation strategies, there is an urgent
need to understand methods used in the economic evaluation process. This area of
knowledge will be discussed in Chapter 3. Discussions of economic evaluation methods
will provide a good understanding of the techniques available and their suitability for this
study.
CHAPTER 3 – ECONOMIC EVALUATION METHOD OVERVIEW
81
CHAPTER 3 - AN OVERVIEW OF ECONOMIC EVALUATION
METHODS
CHAPTER 3 – ECONOMIC EVALUATION METHOD OVERVIEW
82
Chapter 2 has provided an understanding of issues related to C&D waste and C&D
waste minimisation. It was found in Chapter 2 that there is a need to evaluate the
economics of C&D waste minimisation strategies in New Zealand. To this end, there is
an urgent need to understand economic evaluation techniques that are available and
their suitability to this research. This is the purpose of this chapter.
3.1. Introduction
Economic evaluation is a process involves establishing, modelling, analysing and
recommending courses of action to help achieve an economic objective. It is a complex
process in which critical factors such as costs, risks and returns are thoroughly
analysed and evaluated. Investment decisions are then made based on the economic
analysis (Dimitrakopoulos and Abdel Sabour 2007; Steffen et al. 2008; Topal 2008;
Card 2009). It has been observed that by considering various alternative options,
economic evaluations can help decision makers add significant values to a strategy for
a relatively small cost (Mackenzie and Cusworth, 2006).
This chapter provides readers a general understanding of economic evaluation
methods. Subsequently appropriate economic evaluation methods for this research will
be chosen in section 3.9.
CHAPTER 3 – ECONOMIC EVALUATION METHOD OVERVIEW
83
3.2. Nature of this Research
The question of whether this study should take a macroeconomic approach or a
microeconomic approach is one which the researcher has been grappled with since the
beginning of this research journey.
On the one hand, to ensure a waste minimisation strategy for the construction industry
to be successful, this research needs to take a big-picture view of the issues related to
C&D waste and C&D waste minimisation in New Zealand construction in order to
develop a framework to evaluate its economics accordingly. This means a
macroeconomic vision is required.
On the other hand, since the New Zealand construction industry is made up mostly of
small companies with limited resources. As a result, large-scale or industry-wide C&D
waste minimisation programmes are often the main deterrent to small construction
companies, given the relatively high costs associated with such implementations. This
means only a selected few companies with resources can afford to have
comprehensive C&D waste management programmes.
Besides due to the fragmented nature of the New Zealand construction industry, the
uptake C&D waste minimisation largely depends on the willingness of construction
companies. It is therefore difficult to implement such programme industry-wide without
buy-ins from the construction companies.
Often, the implementation a C&D waste minimisation strategy is on a case-by-case
basis and is highly dependent on the specific nature and requirements of each project.
Considering the above reasons, the researcher concluded that it is appropriate to
consider this research at the microeconomic level.
CHAPTER 3 – ECONOMIC EVALUATION METHOD OVERVIEW
84
3.3 Economic Evaluation Method Overview
All available economic evaluation tools originate from the financial industry, where they
are used extensively to value investments and their respective risks and returns
(Maybee, 2010).
There are many economic evaluation methods available and their complexity depends
on the problems at hand. Highly complex economic evaluation tools include
econometrics and complex systems while simple economic evaluation techniques are
payback period and break-even analyses. In this study, the problem of evaluating the
economics of zero waste in the building construction context means that the chosen
economic evaluation tool must satisfy two fundamental conditions.
First, the economic evaluation framework developed in this research must be user-
friendly. The New Zealand building industry is made up mostly of small- to-medium size
companies who have different aims and objectives. Due to their limited size and
resources, these companies often require seeing values in waste minimisation before
committing their resources to take part in such a strategy. This requirement means that
the framework developed in this research must be easy to use. This allows companies
to adapt the framework to suit their needs
Second, as shown in Chapter 2, C&D waste consists of many waste streams. And there
are many interacting factors that may affect a waste minimisation strategy. As a result,
the framework developed in this research should be flexible enough to evaluate the
economics of waste minimisation strategies for diverse types of C&D waste streams
under various situations. This means the economic evaluation tool must be able to
CHAPTER 3 – ECONOMIC EVALUATION METHOD OVERVIEW
85
process new information as they emerge and model it without major modification and
tweaking of existing economic models.
The two fundamental requirements above mean that highly complex methods such as
econometrics and complex systems modelling are unsuitable for this research. This is
because both methods are highly specialised and require a high degree of technical
capability in economic theory to operate. Further, as additional information emerges,
these methods are incapable of processing it without the involvement of major
remodelling work.
Therefore, due to the specific requirement of this study and the limitation posed by
techniques such as econometrics and systems modelling, this research will focus on
more traditional economic evaluation techniques instead.
However, this chapter only discusses five traditional economic evaluation categories.
This is to ensure the scope of the study remains manageable. These categories are:
• Financial Analysis (FA)
• Benefit-Cost Analysis (BCA)
• Economic impact analysis (EIA)
• Cost Effectiveness Analysis (CEA)
• Fiscal Impact Analysis (FIA)
Economic evaluation techniques in these five categories will be refined further to
choose the most appropriate evaluation methods for this research.
CHAPTER 3 – ECONOMIC EVALUATION METHOD OVERVIEW
86
3.3. Financial Analysis (FA)
Financial analysis is an umbrella term comprising various techniques and methods
used to evaluate projects or strategies. Common economic evaluation tools in this
category include, but not limited to, Payback Period, Internal Rate of Return, Net
Present Value and Real Options.
This section will discuss these methods in detail to provide a good understanding of
their strengths and weaknesses. Subsequently, arguments will be made regarding the
most appropriate methods to be used in this study.
3.3.1. Payback Period (PBP)
Payback Period (PBP) is ‘the time required for the capital outlay to be repaid’. In other
words, it is the estimated time taken for the project to produce profits equals to the initial
capital.
However, this approach is theoretically flawed due to several shortcomings. First, PBP
is not a discounting technique, as it does not account for the time value of money or the
opportunity cost (Topal, 2008). Second, PBP only considers a relatively fixed time
horizon on investment; and this may cause biases towards investments with long-term
benefits (Abdel Sabour & Poulin, 2006). Despite being a commonly used evaluation
techniques, PBP could provide ambiguous results in situations where the sign of the
cash flows switch between positive and negative more than once (Maybee 2010). While
PBP is used as a “sanity check”, the method does not provide a good platform to rank
multiple alternatives (Lee and Strang, 2003a).
CHAPTER 3 – ECONOMIC EVALUATION METHOD OVERVIEW
87
Recently, improvements to PBP have been made. Discounted PBP (DPBP) is a
reformulated evaluation technique that is Net Present Value (NPV)-compatible and
capable of producing results that recognise the entire project cash flow (Hajdasinski,
2012). The advantage of this approach over the traditional PBP is its ability to convey
informative facts for investment decision making purposes. The reformulation also
provides a means of ranking mutually exclusive alternatives through the evaluation of
projects based on their differential cash flows (Maybee, 2010).
Recently another method has been introduced by Alesii (2006). In this novel approach,
PBP is combined with Internal Rate of Return (IRR) to reduce their weaknesses (Alesii,
2006). Overall, Alesii’s (2006) method could provide results that are consistent with the
NPV-based techniques.
3.3.2. Internal Rate of Return (IRR)
Internal rate of return (IRR) is another evaluation technique often used in financial
analysis. IRR is often used to measure and compare the profitability of investments: the
higher the IRR of a project, the more desirable it is.
IRR is the rate at which the net present value of inflow cash equals the present value of
outflow cash. IRR could offer valuable insight into the yielding rate or return on
investment of a project. This technique is very widely used. For example, more than half
of mining companies in 1994 used IRR for project valuation while 40% using net
present value (NPV) (Hajdasinski, 2012).
CHAPTER 3 – ECONOMIC EVALUATION METHOD OVERVIEW
88
3.3.3. Net Present Value (NPV)
NPV is arguably the most widely used economic evaluation technique for decades
(Dimitrakopoulos & Sabour, 2007; Topal, 2008). It is a standard evaluation technique in
many industries.
In this method, all future cash flows are estimated and discounted to the present day’s
value using an appropriate discount rate. NPV is the sum of all discounted future cash
flows. NPV method is used for dual purpose. First, NPV is used as an economic
evaluation tool to place a value on a project. At the same time, NPV is used as a
decision-making tool to guide managers and decision makers to choose between
alternatives, i.e. a project with highest NPV values (among alternatives) is accepted.
In NPV method, discount rates have significant effect on the value of a project: a small
change in the discount rate can cause a large change in NPV values. Further, choosing
the appropriate discount rate is probably the most difficult and uncertain part of NPV
methodology. As a result, NPV’s reliability is often questioned (Xie, 2010). It is often
found that NPV undervalues projects because it 1) lacks the ability to account for
different types of uncertainties and risks in such projects and 2) fails to price flexibility
inherently exists in the management of risky assets (Topal, 2008). By including time-
value-of-money and risk discounting in one single discount rate, the single-rate NPV
approach is inherently biased against high-margin/long-life assets with large capital
requirements and a bias towards low-margin/short-life assets with low capital
investment (Lai & Stange, 2009b). Therefore, variable discount rates should be used in
NPV calculations (Blais et al, 2007; Pietersz, 2011). Another drawback of NPV as an
evaluation tool is its implicit assumption of the certainty regarding future cash flow over
CHAPTER 3 – ECONOMIC EVALUATION METHOD OVERVIEW
89
the life of the project (Fox, 2008). Often, effects of cyclical fluctuation capital and
operating costs are ignored in NPV method. Even though smoothing these can make it
easy for NPV calculations, these factors indeed change constantly and will affect the
project value long term (Martinez, 2009).
The final pitfall of NPV is its built-in assumption that a manager is passive in decision-
making (Dimitrakopoulos & Sabour, 2007). That is managers are ‘victims of
circumstances’ with no ability to affect positive improvements in cash flows et cetera
during the operation of the asset. This is in contrast to reality, where managers have
significant flexibility (Maybee, 2010). And once the project starts, the manager have
discretions concerning all aspects of the project, from design to sourcing of materials to
production methods (Martinez, 2009). However, the consensus for making decisions
based on this technique is to undertake the investments with positive NPVs and reject
those with negative NPVs (Sabour & Poulin, 2006). With immediate
acceptance/rejection, NPV ignores the value of options such as
deference/abandonment or expansion/contraction/shut down of the investment.
Therefore, it must be careful when using and interpreting results of NPV evaluation
method (Fox, 2008; Pietersz, 2011).
3.3.4. Real Options (RO)
RO is considered an improvement of NPV. It is an adoption of the financial industry’s
Options Theory to real-life projects in construction, mining or oil & gas industries
(Borison, 2003). Like its financial counterpart, a real option is the right, but not the
obligation, to undertake business decisions. It has mainly used to evaluate investments
with significant uncertainty because under uncertain conditions, RO performs better
CHAPTER 3 – ECONOMIC EVALUATION METHOD OVERVIEW
90
than the conventional NPV due to the inclusion of management flexibility
(Dimitrakopoulos, 2010; Birge, 2012). This managerial flexibility provides opportunities
to maximise the upside potential while limiting the downside losses.
Construction investments, like other real-life investments, have three important
characteristics. First, investment is partially or completely irreversible. This means once
project investments are made, their capital costs become totally or partially sunk.
Second, there is uncertainty over the future return from the investment. It is difficult, if
not impossible, to predict accurately the levels of tenancy in any commercial or building
projects at the commencement of the project. Finally, the management have a degree
of flexibility in timing the investment. In any construction company, the management
can choose if, and when, to invest in a project that meets the company objectives.
However, NPV cannot incorporate these three characteristics (Yang & Blyth 2007). RO
adjusts risk within cash flows while NPV adjusts risk by aggregating cash flows. This
small difference allows RO to differentiate assets according to their unique risk
characteristics, while the conventional NPV approach cannot (Samis et al, 2006).
Another advantage of RO over NPV is the way it handles discount rates: while NPV
uses risk-adjusted discount rate, RO uses a risk-free rate or lending rate when risk-free
rate is not available (Smith & McCardle, 1996; Walls, 2004; Martinez, 2009). Therefore,
RO yields higher values than conventional NPV method. Although the difference in risk
adjustment between the NPV and RO appears to be a nuance, RO allows management
to use market information to determine value of risks (Samis et al, 2007). In the
absence of flexibility, the only difference between NPV and RO is the manner of
accounting for the effect of cash flow uncertainty on asset value. It has been
recommended against scraping altogether the traditional NPV method, as the
CHAPTER 3 – ECONOMIC EVALUATION METHOD OVERVIEW
91
advantages of RO over NPV are not fully proven (Dimitrakopoulos & Sabour, 2007).
Nonetheless, RO has become a useful tool for decision-making (Barman & Nash,
2007).
3.3.5. FA method used in this research
In the FA methodology, the PBP technique does not account for time value of money.
This is a major drawback because a waste minimisation strategy can take a long time to
reap the benefits. And PBP’s inability to account for time value of the money spent on
such a strategy may limit the economic understanding of such a strategy significantly.
Similarly, due to an uncertainty around the benefits or returns associated with a waste
minimisation strategy, it can be difficult to project or estimate the expected rate of return
(IRR) for such a strategy. In practice, if the required IRR is too high, companies may be
shied away from such an implementation due to their fear of not achieving it. But on the
other hand, if the IRR is too low, companies may not be so keen to invest in a risky
strategy consisting of high upfront cost with uncertain and low returns.
As a relatively new economic evaluation technique, real options (RO) has not been
widely used and understood by the construction industry. This is perhaps due to it being
relatively more complex than NPV in calculating the final values. According to the first
fundamental requirement for economic evaluation framework set out in Section 3.2
above, RO is not suitable for this research.
NPV is chosen method as a preferred economic evaluation method in this research.
NPV is sufficient in this study because it is a widely-used and well-understood
technique by construction professionals. This allows the study to convey its concept
and findings to a wide range of audience in the New Zealand construction industry.
CHAPTER 3 – ECONOMIC EVALUATION METHOD OVERVIEW
92
3.4. Economic Impact Analysis (EIA)
EIA is an economic evaluation technique that focuses on providing the estimated
economic contributions or benefits of a strategy to the surrounding communities where
the strategy is applicable as well as the general economies (see, for example, Bellu &
Pansini, 2009; Impact Datasource, 2009; PwC, 2012; Loftsgaarden & Derczo, 2013).
The economic impacts can be broadly divided into 3 categories: direct impacts, indirect
impacts and induced impacts (Weisbrod & Weisbrod, 1997; Knapp, 2001).
Direct impacts are the direct results of the strategy under study such as the number of
jobs created as a result of the strategy implementation or amount of salaries and wages
generated by the strategy implementation. Alternatively, direct impacts can be
measured by business outputs (such as volumes of sales) or added value (such as
taxes or gross regional product).
Unlike direct impacts, indirect impacts are ‘second round’ impacts that would only
happen if the strategy were implemented. Indirect impacts can be measured by the
number of jobs created in the supply chain i.e. those created by suppliers and
subcontractors to meet strategy’s demand. It can also be measured through business
outputs such as amount of income which is generated from suppliers’ purchasing goods
and services or the added values such as taxes as a result of the purchase of goods
and services by suppliers.
Finally, induced impacts are the result of people spending their disposable incomes at
the household level. These disposable incomes can be wages and salaries earned by
people.
CHAPTER 3 – ECONOMIC EVALUATION METHOD OVERVIEW
93
The sum of these 3 categories of economic impacts is the ‘total economic impact’ of a
strategy. The outputs of an EIA are typically used to demonstrate the economic
importance of a strategy to a range of stakeholders including government, community
and organisations. Therefore, the economic impact analysis can be powerful tool to
build support from stakeholders (EPA, 2010; PwC, 2012)
In term of methods used in the EIA, there are 2 types: the input-output model (I/O
model) and economic simulations. The I/O model often relies on inter-industry data to
determine the economic impacts of the strategy on the regional economy. Some
examples of I/O models used for economic impact analyses are IMPLAN and MITEIM
(Mulkey & Hodges, 2012). On the other hand, economic simulations often rely on
econometric and general equilibrium models to determine the economic impacts of the
strategy. As a result, this type of EIA models is complex and requires expert knowledge
in econometrics. In addition, economic simulations often require significant data. One
example of economic simulation type is the REMI Model (REMI, 2015). Between the 2
EIA methods, the I/O model is more widely used.
As a macroeconomic evaluation tool, EIA may not be applicable to this research. A
detailed evaluation of economic evaluation tools in section 3.8 will provide further
insight into this matter.
3.5. Benefit-Cost Analysis (BCA)
BCA is an economic evaluation method aiming to systematically and fairly estimate the
strengths and weaknesses of competing options or strategies (AmStat, 2006). In BCA,
CHAPTER 3 – ECONOMIC EVALUATION METHOD OVERVIEW
94
the benefits and costs of the proposed strategies is determined and quantified into
dollar values. These monetary terms are often adjusted for the time value of money
(Europa, 2008). The economic efficiency of each strategy is compared against each
other using a benefit-to-cost ratio. Based on the benefit-cost ratio of each option, the
decision-maker can choose a strategy that best suits their requirements. BCA provides
decision makers with a consistent and effective way to assess the merits of alternative
strategies to make sound decisions
BCA can be used either as a stand-alone evaluation technique or in conjunction with
other economic evaluation methods such as cost-effectiveness analysis, risk-benefit
analysis, economic impact analysis and fiscal impact analysis. Due to its versatility,
BCA is widely used by both the government and private sectors (OECD, 2006; Cellini &
Kee, 2010). In New Zealand, BCA is the standard economic evaluation technique
employed by the New Zealand Transport Agency (NZTA). Recently NZTA has
published an economic evaluation manual with BCA as the central evaluation theme
(NZTA, 2013). All transport-related publications from the Agency have used BCA as the
standard measure (e.g. Leung et al., 2013; Opus, 2015).
BCA has many advantages, including the ability to provide well-educated estimates of
the best option among alternatives. However, due to the difficulty of estimating all costs
and benefits accurately, careful and thorough considerations are recommended when
using BCA results (OECD, 2006).
As a flexible economic evaluation tool, BCA may be suitable for this research. A
detailed evaluation of economic evaluation tools in section 3.8 will provide further
insight into this matter.
CHAPTER 3 – ECONOMIC EVALUATION METHOD OVERVIEW
95
3.6. Cost Effectiveness Analysis (CEA)
Like BCA, CEA is an economic evaluation technique that relates the costs of a
programme to its key outcomes or benefits (Cellini & Kee, 2010). CEA works by
benchmarking the cost of each strategy against the unit of effectiveness (or output). A
programme is considered ‘cost-effective’ if it can present a bargain in relation to its
competitors for the same amount of resources (Pinkerton et al., 2002). In this sense,
CEA is best suited for comparison between alternatives that can deliver similar benefits.
CEA is often used in lieu of BCA when the benefits are difficult to evaluate, e.g. safety,
health or perceptions (WHO, 2003; Jamison, 2006; Phillips, 2009).
However, due to the difficulty to estimate ‘effectiveness’, it has been recommended that
CEA should be used in conjunction with other economic evaluation techniques such as
sensitivity analysis, BCA or EIA (Phillips, 2009; Cellini & Kee, 2010; Europa. 2014).
As a flexible economic evaluation tool, CEA may be suitable in this study. A detailed
evaluation of economic evaluation tools in section 3.8 will provide further insight into
this matter.
3.7. Fiscal Impact Analysis (FIA)
Fiscal impact analysis is a tool often used by the local government to compare the costs
incurred in the developments of policies, strategies or projects against the revenues
generated from such developments (Atlanta, 2009). It is similar to the cash flow
analysis used by the private sector since it projects the public sector’s cash flows
resulted from the proposed developments. A FIA should reflect the strategy’s capital
CHAPTER 3 – ECONOMIC EVALUATION METHOD OVERVIEW
96
costs, operating expenses and revenue in detail (Kotval & Mullin, 2006). This is in
contrast to an Economic Impact Analysis, as the latter only evaluates direct and indirect
impacts (such as new jobs, real disposable income and consumer spending) on the
overall economy.
The advantage of FIA is the technique can provide officials with detailed forecast of a
strategy or project. However, its drawback is that it requires significant data to obtain
refined estimates (Harrison & French, 2000, SmartGrowth America, 2013).
As a macroeconomic evaluation tool, FIA may not be applicable to this research. A
detailed evaluation of economic evaluation tools in section 3.8 will provide further
insight into this matter.
3.8. Chosen Economic Evaluation Methods in this Study
3.8.1. Evaluation of Methods
All four categories of economic evaluation tools described in this chapter are useful.
Further, they all have their respective strengths and weaknesses. As a result, careful
considerations are needed when choosing them for economic evaluations.
In this study, the chosen economic evaluation tools must meet two fundamental criteria
set out in Section 3.2. As a result, there is a need to evaluate the economic evaluation
techniques to ensure they are suitable for the context of this research and in
accordance with the above fundamental criteria.
For this purpose, several criteria are introduced to help the evaluation. These criteria
are unique to this research for two reasons.
CHAPTER 3 – ECONOMIC EVALUATION METHOD OVERVIEW
97
First, they focus on the research problems of this study - to addressing the economics
of C&D waste management. This criterion is important because it ensures the chosen
economic evaluation methods are suitable to address the research context.
Second, the criteria introduced here closely follow the theme of the first fundamental
criterion set in Section 3.2. This ensures the chosen economic evaluation methods
meet the research requirements of this study.
These criteria are:
• The ability of the economic evaluation tool to consider economics of C&D
waste management strategies at macro level
• The ability of the economic evaluation tool to consider economics of C&D
waste management strategies at micro level
• The ability of the economic evaluation tool to compare economic efficiencies
of C&D waste management strategies
• The ability of the economic evaluation tool to assess economic viability of
each strategy
• The ability of the economic evaluation tool to provide indications to achieve
economic objectives
Table 3 below summarises the comparison of economic evaluation methods.
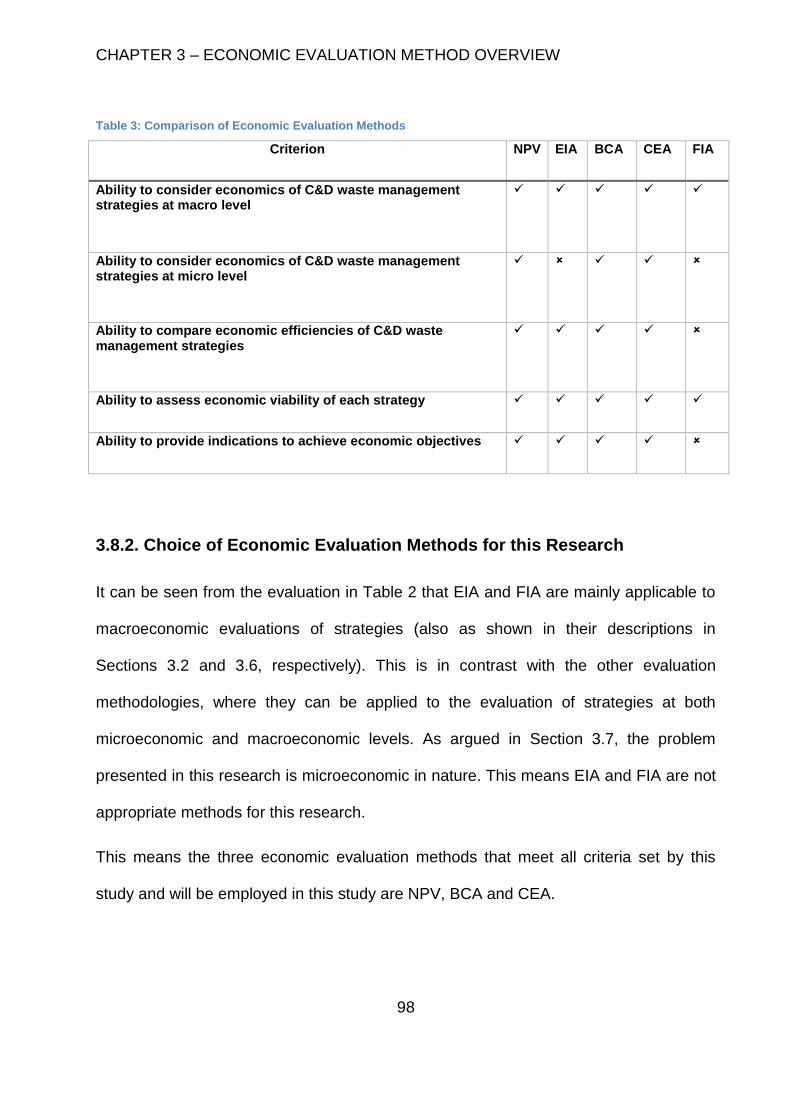
CHAPTER 3 – ECONOMIC EVALUATION METHOD OVERVIEW
98
Table 3: Comparison of Economic Evaluation Methods
Criterion NPV EIA BCA CEA FIA
Ability to consider economics of C&D waste management strategies at macro level
✓ ✓ ✓ ✓ ✓
Ability to consider economics of C&D waste management strategies at micro level
✓ ✓ ✓
Ability to compare economic efficiencies of C&D waste management strategies
✓ ✓ ✓ ✓
Ability to assess economic viability of each strategy ✓ ✓ ✓ ✓ ✓
Ability to provide indications to achieve economic objectives ✓ ✓ ✓ ✓
3.8.2. Choice of Economic Evaluation Methods for this Research
It can be seen from the evaluation in Table 2 that EIA and FIA are mainly applicable to
macroeconomic evaluations of strategies (also as shown in their descriptions in
Sections 3.2 and 3.6, respectively). This is in contrast with the other evaluation
methodologies, where they can be applied to the evaluation of strategies at both
microeconomic and macroeconomic levels. As argued in Section 3.7, the problem
presented in this research is microeconomic in nature. This means EIA and FIA are not
appropriate methods for this research.
This means the three economic evaluation methods that meet all criteria set by this
study and will be employed in this study are NPV, BCA and CEA.
CHAPTER 3 – ECONOMIC EVALUATION METHOD OVERVIEW
99
NPV is used wherever applicable to account for the time value of money. Due to its
versatility, NPV will allow the framework to be used widely in the New Zealand
construction industry.
BCA is used to compare the economic efficiency of C&D waste minimisation strategies.
It is anticipated that this information can be used to formulate appropriate strategies to
address C&D waste.
Finally, CEA is used to compare the cost efficiency C&D waste management strategies.
By using CEA in conjunction with BCA, the research can provide sufficiently detailed
information regarding the most economically optimal C&D waste minimisation
strategies.
3.9. C&D Waste Economic Models – A Comparison
To ensure the economic evaluation framework developed above is unique, it is
necessary to compare this framework with those in other studies. Recently, Dajadian &
Koch (2014) discussed several costing models for C&D waste management. These
models were basic and did not consider the values gained from C&D waste
management. This is unlike the economic framework developed in this thesis, where
both costs and benefits associated with C&D waste minimisation are taken into account
and evaluated accordingly.
Similarly, Fadiya et al (2014) introduced a model to estimate the cost of construction
waste. Fadiya et al’s (2014) model has several similarities to the costing calculations in
the framework developed in this research, including those for unit cost calculations and
cost of waste. However, unlike the costing model in this study, Fadiya et al’s (2014)
CHAPTER 3 – ECONOMIC EVALUATION METHOD OVERVIEW
100
cost of waste did not consider cost of design-out-waste, cost of waste policy, cost of
waste collection, cost of recycling waste, cost of reusing waste and cost of energy. This
was Fadiya et al’s (2014) drawback and has been addressed by this research.
Taking a distinct perspective, Tam & Tam (2008) focused on the benefit side of C&D
waste minimisation. In their study, Tam & Tam’s (2008) study focused on incentive
schemes as the main mechanisms to motivate C&D waste minimisation. Tam & Tam’s
(2008) work was relevant to this study. In fact, it provided the researcher some basic
steps in formulating calculations for economic evaluation purposes. As a result, it was
used a reference in the development of the economic evaluation framework in this
study. The weakness of Tam & Tam’s (2008) work is its inability to provide an objective
evaluation of waste minimisation strategies, as it did not consider the costs associated
with such strategies.
In his work, Jain (2012) offered a robust economic framework taking into consideration
both costs and benefits of C& waste management. Jain’s (2012) approach is different to
other studies discussed in this section thus far. In fact, this approach is like one offered
in this study. However, unlike this study, Jain’s (2012) is descriptive in nature, as it only
outlined the main cost and benefit components without showing their detailed
calculations. Further, Jain’s (2012) costing model did not consider three key
components: the cost of design-out-waste, the cost of waste policy and the cost of
energy. Jain’s (2012) drawbacks have been largely addressed in this study.
In 2007, Covec Limited was commissioned by the Ministry for the Environment to
conduct a cost – benefit analysis of recycling waste in New Zealand. On the surface,
Covec’s (2007) study and the current research appear to take a similar path. However,
CHAPTER 3 – ECONOMIC EVALUATION METHOD OVERVIEW
101
Covec’s (2007) study covered a wide range of waste, including household waste, C&D
waste and industrial waste. Further, Covec’s (2007) underlying conceptual framework is
much different to that of this study’s. Whereas the benefit component in Covec’s (2007)
covered three aspects (landfill costs, collection for landfill and ‘other’), the benefit
component of this study cover four areas: cost saving of materials, cost savings on
waste generation, cost saving from reusing and recycling and revenue from selling
construction recycled materials. Similarly, the cost component of Covec’s (2007) study
only covered two areas (collection and sorting) whereas the cost component of this
study is much more comprehensive, covering eight areas: design-out-waste, waste
policy, waste collection, waste disposal, recycling, reusing waste, energy and waste
material. Further, the calculations in Covec’s (2007) were descriptive in nature, making
it difficult to understand derivations of costs and benefits. Like all studies above, all of
Covec’s (2007) weaknesses have been rectified in this research.
Aside from similar studies to this research, there are a number of studies that are useful
for the development of economic evaluation this research. They include the work of
Coelho & de Brito (2012), Abdelhamid (2014), Marzouk & Azab (2014), Wang et al
(2014). Although these studies did not address the economics of C&D waste
minimisation, collectively they have provided the researcher an in-depth understanding
of issues and factors affecting C&D waste minimisation strategies.
3.10. Conclusion
This chapter has reviewed commonly-used and readily-available economic evaluation
methods. Subsequently, the chapter evaluates their suitability in the problem being
CHAPTER 3 – ECONOMIC EVALUATION METHOD OVERVIEW
102
investigated by this research, i.e. evaluation of C&D waste minimisation strategies in
New Zealand.
It has been found that economic evaluation techniques that will be employed in this
study are Net Present Value (NPV), Benefit-Cost Analysis (BCA); and Cost Efficiency
Analysis (CEA). These methods are suitable for this research, as they meet the two
fundamental research requirements for this study.
Chapter 2 and Chapter 3 have provided a good understanding of C&D waste issues
and methods to evaluate economics of C&D waste minimisation strategies.
The next chapter proceeds to identify the research methodology that will be employed
in this research.
CHAPTER 4 – RESEARCH METHODOLOGY
103
CHAPTER 4 - RESEARCH METHODOLOGY
CHAPTER 4 – RESEARCH METHODOLOGY
104
Chapter 2 reviewed literature pertaining to practices around C&D waste minimisation
and zero waste. As a result of this literature review, a number of knowledge gaps were
identified. To address these knowledge gaps, this study requires an appropriate
research methodology. This chapter will discuss the research strategy to be employed
in this research.
4.1. Introduction
The word ‘methodology’ means the ‘theory of undertaking an activity’ (Novikov &
Novikov, 2013). It originates from the word ‘method’ (meaning a ‘systematic procedure
or technique of doing something’) and the suffix ‘-ology’ (indicating ‘science or study’)
(Oxford Dictionaries, 2014). Research methodology is thus the theory of undertaking
research. It is a way to systematically solve a research problem (Kothari, 2004;
Rajasekar et al, 2006).
Research methodology is important because it provides a research necessary scientific
and philosophical background (Adams et al, 2007; Jonker & Pennink, 2010). A research
methodology is useful, as it allows the researcher to understand knowledge and
constraints placed upon their concept of ‘knowledge’. Further, a research methodology
provides the researcher with an understanding that although there are diverse ways
that knowledge can be created, only knowledge generated in a methodical and
justifiable way is accepted (Adams et al, 2007; Jonker & Pennink, 2010). Therefore,
research methodology needs to be carefully identified, designed and applied in any
research.
CHAPTER 4 – RESEARCH METHODOLOGY
105
4.2. Problem Analysis
The problem being investigated in this research is specific:
• Currently there is a lack of an understanding of factors affecting C&D waste
minimisation strategies in New Zealand
• Currently there is a lack of an established economic evaluation framework to
evaluate and establish optimal waste minimisation strategies for building
projects
To resolve the above problem, it is necessary to identify and understand the factors that
may have significant effects on C&D waste minimisation strategies in New Zealand. At
the same time, it is important to understand the economic impacts of these factors on
C&D waste minimisation strategies. The second understanding will in turns allow for an
establishment of the most optimal C&D waste minimisation strategy in building projects.
These two requirements mean that there is a need for this research to establish an
economic framework to evaluate the economics of C&D waste minimisation strategies
in the New Zealand building industry.
4.3. Research Aim
The aim of this research is to evaluate the economics of a zero-waste strategy in the
New Zealand context and to identify the most economically optimal waste minimisation
strategy in New Zealand construction projects.
CHAPTER 4 – RESEARCH METHODOLOGY
106
4.4. Philosophical Foundation of Research Methodology
There are four branches of philosophy: metaphysics, epistemology, ethics and logic
(Shakantu, 2004). However, only the first two branches are relevant to research
methodology (Chia, 2002; Babbie, 2007). It has been argued that ontological
assumptions are the precursor of epistemological assumptions. In turns,
epistemological assumptions are the precursor of methodological considerations
(Cohen et al, 2007). In this sense, the researcher’s worldview can have significant
influence on their search for knowledge. In this study, the philosophical foundation of
research methodology is established as per Cohen et al (2007). This means
discussions about the ontology of a study are offered first; followed by the
epistemology.
4.4.1. Ontology
Ontology is the study of ‘being’ (Cocchiarella, 2007; Gray, 2009). The study of ontology
revolves around 2 opposing types: Heraclitean ontology (‘becoming’) and Parmenidean
ontology (‘being’). Their differences are summarised in Table 4.
Between these 2 ontological traditions, Parmenidean ontology is more popular in
Western philosophy than its counterpart (Gray, 2009). This is despite evidence of
recent interests in Heraclitean thinking (Chia, 2002; Shakantu, 2004).
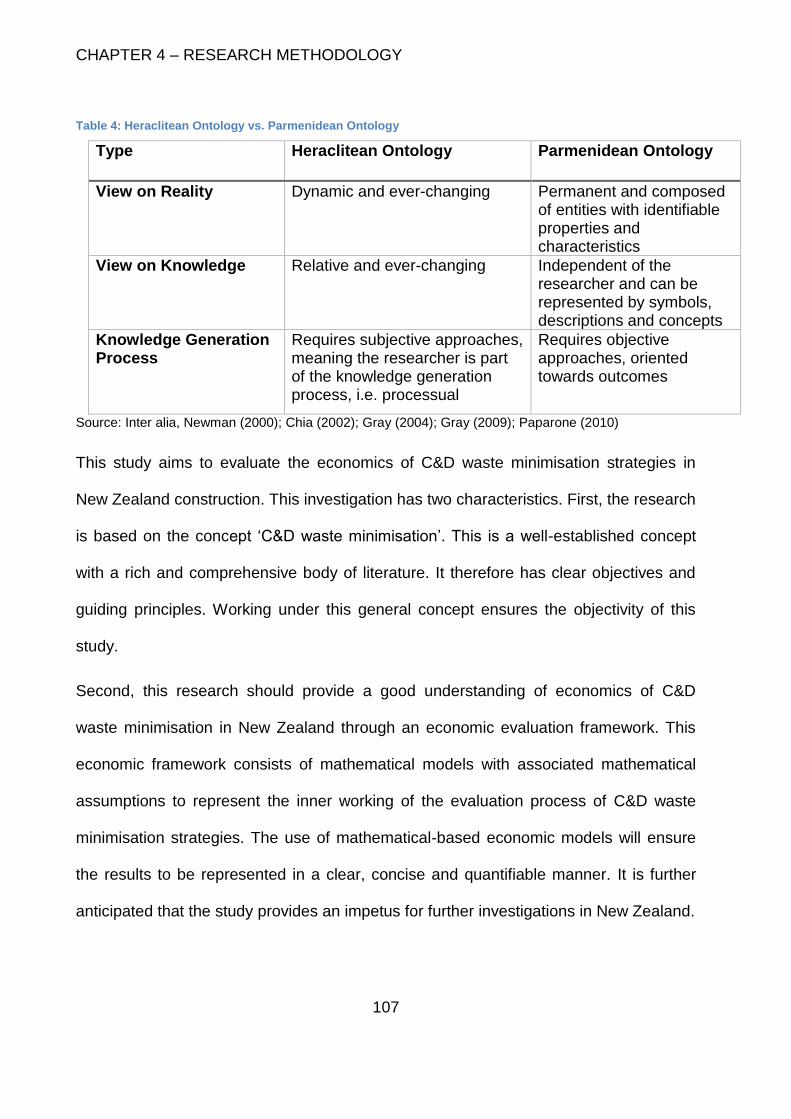
CHAPTER 4 – RESEARCH METHODOLOGY
107
Table 4: Heraclitean Ontology vs. Parmenidean Ontology
Type Heraclitean Ontology Parmenidean Ontology
View on Reality Dynamic and ever-changing Permanent and composed of entities with identifiable properties and characteristics
View on Knowledge Relative and ever-changing Independent of the researcher and can be represented by symbols, descriptions and concepts
Knowledge Generation Process
Requires subjective approaches, meaning the researcher is part of the knowledge generation process, i.e. processual
Requires objective approaches, oriented towards outcomes
Source: Inter alia, Newman (2000); Chia (2002); Gray (2004); Gray (2009); Paparone (2010)
This study aims to evaluate the economics of C&D waste minimisation strategies in
New Zealand construction. This investigation has two characteristics. First, the research
is based on the concept ‘C&D waste minimisation’. This is a well-established concept
with a rich and comprehensive body of literature. It therefore has clear objectives and
guiding principles. Working under this general concept ensures the objectivity of this
study.
Second, this research should provide a good understanding of economics of C&D
waste minimisation in New Zealand through an economic evaluation framework. This
economic framework consists of mathematical models with associated mathematical
assumptions to represent the inner working of the evaluation process of C&D waste
minimisation strategies. The use of mathematical-based economic models will ensure
the results to be represented in a clear, concise and quantifiable manner. It is further
anticipated that the study provides an impetus for further investigations in New Zealand.
CHAPTER 4 – RESEARCH METHODOLOGY
108
From an ontological perspective, the above arguments imply a Parmenidean worldview
for this study. According to Parmenidean reasoning, this study is also a good
opportunity to learn about C&D waste minimisation. And knowledge about this topic can
be progressively accumulated via contributions of subsequent studies (Paparone,
2010).
4.4.2. Epistemology
Epistemology is the study of ‘knowing’. It refers to the question of how we know the
world (Babbie, 2007; Feast & Melles, 2010). Epistemological enquiries revolve around
evidence and reasoning to justify or clarify of one’s understanding or belief (Fumerton,
2006; Poli, 2010). There are 2 competing epistemological strands: Positivism and
Interpretivism.
Positivism seeks knowledge through the accumulation of verified facts without the
human elements (Collis & Hussey, 2009). In positivism, reality exists outside of the
researchers’ perceptions (Weber, 2004). Therefore, the researchers are passive
spectator of the event under investigation.
On the other hand, Interpretivism maintains that social phenomena do not exist
independently of the researcher’s own interpretations; instead it is the interpretation of
social phenomena that affects social reality (Christou et al, 2010).
However, in both epistemological strands, a researcher’s knowledge and perception is
highly dependent on their historical, social and cultural background. This means the
researchers must be careful with, and aware of the limitations of, their findings
(Shakantu, 2004).
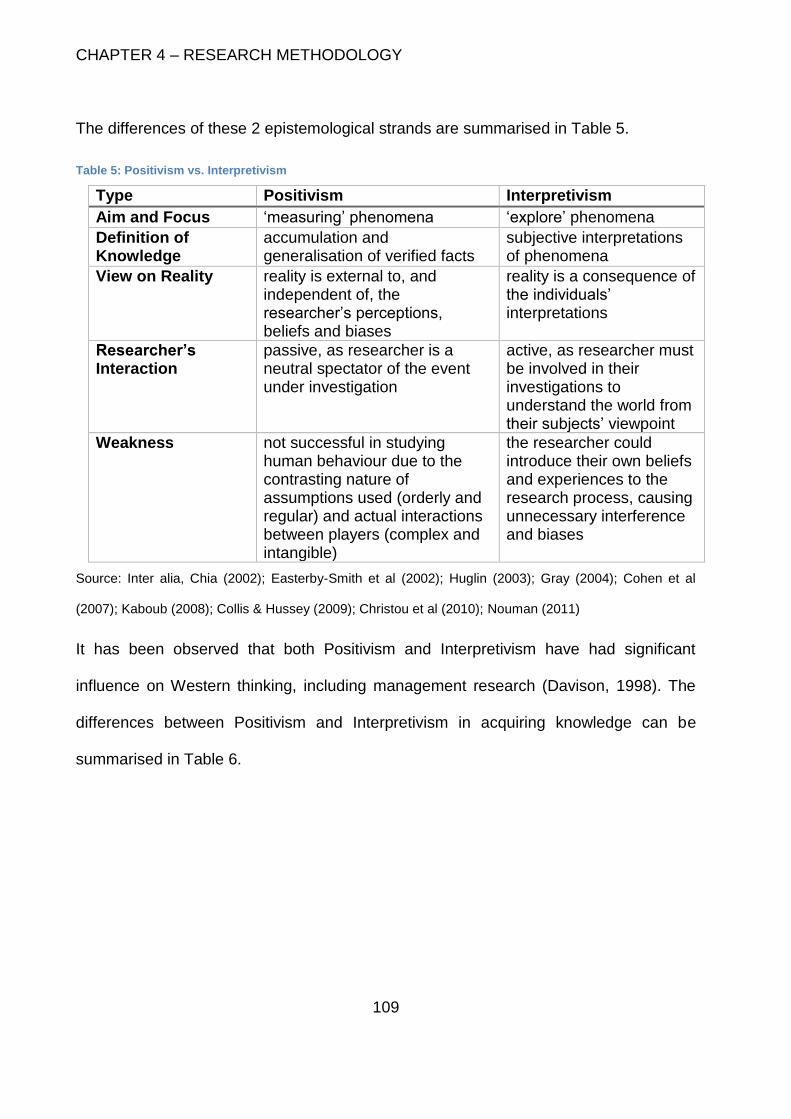
CHAPTER 4 – RESEARCH METHODOLOGY
109
The differences of these 2 epistemological strands are summarised in Table 5.
Table 5: Positivism vs. Interpretivism
Type Positivism Interpretivism
Aim and Focus ‘measuring’ phenomena ‘explore’ phenomena
Definition of Knowledge
accumulation and generalisation of verified facts
subjective interpretations of phenomena
View on Reality reality is external to, and independent of, the researcher’s perceptions, beliefs and biases
reality is a consequence of the individuals’ interpretations
Researcher’s Interaction
passive, as researcher is a neutral spectator of the event under investigation
active, as researcher must be involved in their investigations to understand the world from their subjects’ viewpoint
Weakness not successful in studying human behaviour due to the contrasting nature of assumptions used (orderly and regular) and actual interactions between players (complex and intangible)
the researcher could introduce their own beliefs and experiences to the research process, causing unnecessary interference and biases
Source: Inter alia, Chia (2002); Easterby-Smith et al (2002); Huglin (2003); Gray (2004); Cohen et al
(2007); Kaboub (2008); Collis & Hussey (2009); Christou et al (2010); Nouman (2011)
It has been observed that both Positivism and Interpretivism have had significant
influence on Western thinking, including management research (Davison, 1998). The
differences between Positivism and Interpretivism in acquiring knowledge can be
summarised in Table 6.
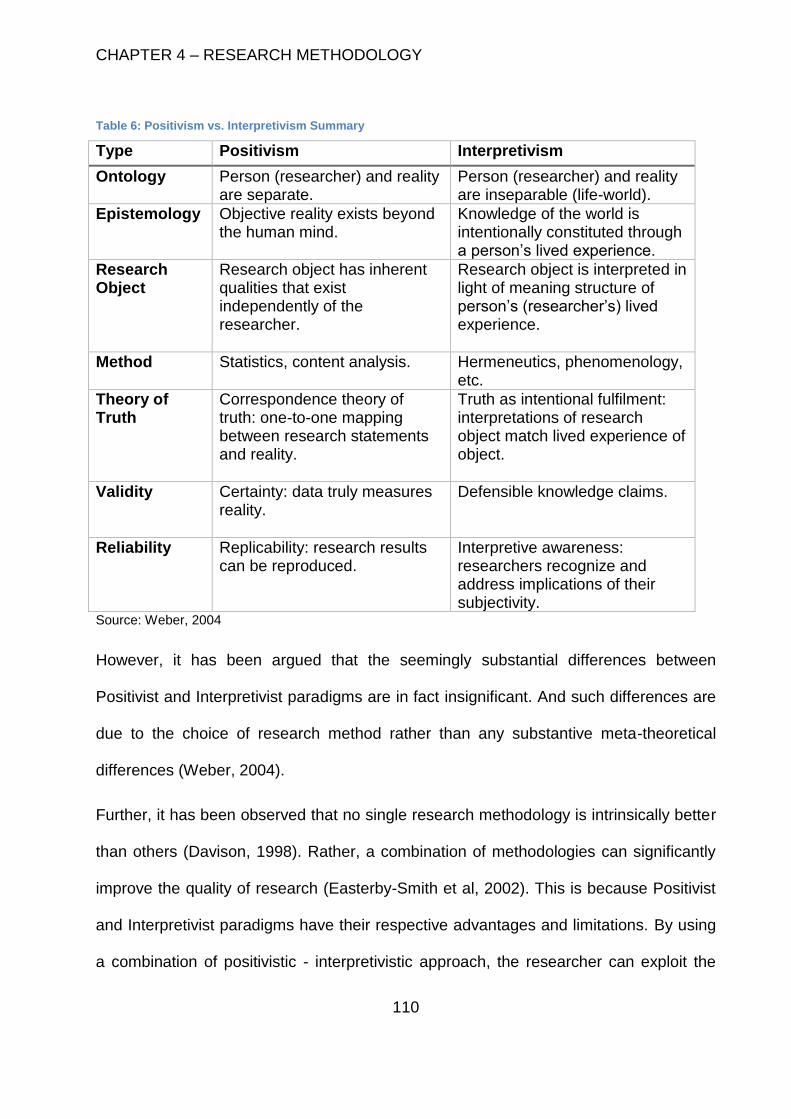
CHAPTER 4 – RESEARCH METHODOLOGY
110
Table 6: Positivism vs. Interpretivism Summary
Type Positivism Interpretivism
Ontology Person (researcher) and reality are separate.
Person (researcher) and reality are inseparable (life-world).
Epistemology Objective reality exists beyond the human mind.
Knowledge of the world is intentionally constituted through a person’s lived experience.
Research Object
Research object has inherent qualities that exist independently of the researcher.
Research object is interpreted in light of meaning structure of person’s (researcher’s) lived experience.
Method Statistics, content analysis. Hermeneutics, phenomenology, etc.
Theory of Truth
Correspondence theory of truth: one-to-one mapping between research statements and reality.
Truth as intentional fulfilment: interpretations of research object match lived experience of object.
Validity Certainty: data truly measures reality.
Defensible knowledge claims.
Reliability Replicability: research results can be reproduced.
Interpretive awareness: researchers recognize and address implications of their subjectivity.
Source: Weber, 2004
However, it has been argued that the seemingly substantial differences between
Positivist and Interpretivist paradigms are in fact insignificant. And such differences are
due to the choice of research method rather than any substantive meta-theoretical
differences (Weber, 2004).
Further, it has been observed that no single research methodology is intrinsically better
than others (Davison, 1998). Rather, a combination of methodologies can significantly
improve the quality of research (Easterby-Smith et al, 2002). This is because Positivist
and Interpretivist paradigms have their respective advantages and limitations. By using
a combination of positivistic - interpretivistic approach, the researcher can exploit the
CHAPTER 4 – RESEARCH METHODOLOGY
111
strengths of each paradigm while at the same time reducing their respective
weaknesses.
4.5. Research Methodological Position
It has been argued that the nature of a research problem affects the ways the research
solutions are produced (Tookey, 1998; Shakantu, 2004; Egbelakin & Wilkinson, 2008).
As a result, a methodology should be chosen to reflect the specific needs of the
research.
The nature of the problem in this research is to evaluate the economics of C&D waste
minimisation strategies. However, Chapter 2 has revealed that there is a lack of
understanding of factors affecting C&D waste minimisation strategies in New Zealand.
This means there is an immediate need to identify these factors and explain the causal
relationships between them. Only once this understanding is achieved that the research
can evaluate the economics of C&D waste minimisation strategies.
The above requirement means that a sequential research approach is needed in this
study. In this approach, the qualitative component must be undertaken before the
development its quantitative counterpart. In other words, findings of the qualitative
component are the basis for the design and development of the quantitative
component.
Furthermore, as this research is the first study in New Zealand to establish a framework
to evaluate the economics of C&D waste minimisation, it faces a lack of necessary
theoretical perspective and empirical data to aid its development. It is anticipated that
by utilising a multi-paradigm approach, this research can overcome this challenge.
CHAPTER 4 – RESEARCH METHODOLOGY
112
Based on the research aim, from an ontologically perspective a Parmenidean worldview
is required in this research - for the development of an objective economic evaluation
framework.
Epistemologically, to establish and understand factors affecting C&D waste
minimisation in New Zealand, there is a need to interact with necessary operatives
involved in the construction industry to obtain their perspectives on this subject matter.
Subsequently, the researcher is required to interpret the results of such interactions in
order to develop an economic framework for the evaluation of C&D waste minimisation
strategies. As a result of this requirement, an interpretivistic approach is needed in this
study.
At the same time, the research’s requirement to develop an economic evaluation
framework means that the study is mathematical and analytical in nature. This implies
the research also requires a positivistic approach.
The above arguments point to the fact that there is a requirement to employ both
positivistic paradigm and interpretivistic paradigm in this study. The decision to choose
a mixed-paradigm approach to address this study’s problem was not due to the inability
to evaluate between the merits and demerits of each paradigm. Rather, it was due to
the need of this study. It was also a result of the researcher’s understanding that all
research approaches are valuable if used appropriately and that a research can have
elements of both positivism and interpretivism.
A mixed-paradigm approach will enhance the quality of the research’s methodological
enquiries. It is also anticipated the combination of positivistic - interpretivistic approach
will ensure the economic evaluation framework developed in this research is applicable
CHAPTER 4 – RESEARCH METHODOLOGY
113
to the New Zealand context. The research approach of this study is further elaborated
in the subsequent sections.
4.6. Research Method
Because of the decision to employ a mixed methodology (as argued in Section 4.5), the
research methods used in this research must be a combination of those belonging to
the positivistic paradigm and those belonging to the interpretivistic paradigm.
Generally, a research containing a combination of research techniques is more
advantageous than one relying on a single-method research approach. This is because
in the multi-method approach, the strengths of individual research techniques can offset
the weaknesses of others. At the same time, in the multi-method approach, individual
research methods can complement each other, thus reinforcing the strengths of
individual research methods.
The problem being investigated in this research is specific: to develop an economic
framework to evaluate the economics of C&D waste minimisation strategies in New
Zealand. However, as previously mentioned, there is a severe lack of necessary
empirical information on, and around, C&D waste and C&D waste minimisation in New
Zealand. Thus, a multi-method approach is utilised to overcome this challenge.
In this multi-method approach, there are two specific requirements. The first
requirement is to establish baseline empirical data for the research problem. The
second requirement is to develop an economic evaluation framework based on the
empirical information obtained in the first requirement.
CHAPTER 4 – RESEARCH METHODOLOGY
114
In the first requirement, there is a need to identify and understand factors that may have
significant effects on C&D waste minimisation strategies in New Zealand. This can be
achieved by employing qualitative research techniques to obtain opinions from
practising operatives in the New Zealand construction industry. The information
provided by these individuals can be used as the basis for the development of the
economic evaluation framework. Qualitative techniques to be employed in this study are
semi-structured interviewing and elite interviewing.
In the second requirement, quantitative techniques are needed for the development of
the economic evaluation framework. This need arises from the fact that the study is
mathematical and analytical in nature; and only quantitative methods are capable of
fulfilling this requirement. Quantitative method employed in this study is economic
modelling and case study.
4.6.1. Interview Research
Interview is a familiar research method that has been used in many fields (DiCicco-
Bloom & Crabtree, 2006). There is a wide range of interviewing approaches available,
including: face-to-face interviews, telephone interviews, computer interviews, serial
interviews or group interviews (Opdenakker, 2006). Further, each interview approach
can have certain characteristics such as in-depth, structured, semi-structured, open-
ended or closed. But the overall theme of interview research is to describe and
understand the research topic through views of the interviewees (Valenzuela &
Shrivastava, 2003).
CHAPTER 4 – RESEARCH METHODOLOGY
115
4.6.1.1. Semi-Structured Interviewing
In this research, an interview research method is used to identify and understand
factors as well as the aspirations of the New Zealand construction industry around C&D
waste minimisation. The interviews will be carried out with practising construction
professionals in New Zealand to obtain their opinions and feedback on this subject
matter. The chosen interview method in this research shall be one-on-one semi-
structured interviewing.
Semi-structured interview was chosen because of its 2 key strengths. First, semi-
structured interviews allow interviewees to express their opinions on current C&D waste
management practices in New Zealand, as well as the industry’s zero C&D waste
aspirations. Such information should contribute to the richness of data collected
significantly. Second, there is a high degree of interactions between the interviewer (the
researcher) and the interviewees. As a result, any complex issues or questions around
this subject matter can be discussed and clarified instantly. Further, interviews with
willing participants will be administered both before and after the economic modelling
process. This is to ensure relevant variables can be identified for the modelling process
and the modelling results can be administered properly in accordance to the research’s
requirements.
4.6.1.2. Elite Interviewing
This is a subclass of interview research. The term ‘elite’ originates from political science
(Richards, 1996; Berrry, 2007; Tansey, 2007). It refers to members in society who hold
significant power and can decide in, or influence, policy-making process (Bozoki, 2011).
However, recently it has acquired a broader meaning to include people of high levels of
CHAPTER 4 – RESEARCH METHODOLOGY
116
status, or hold significant responsibilities, within their professions or industries (Harvey,
2011).
Therefore, ‘elite interviewing’ is a research method undertaken by the researcher with
people of high level of standing within their organisations, professions or industries in
order to obtain their individual insights or first-hand account of a topic or a subject
matter (Hochschild, 2009; Bozoki, 2011). It has been observed that elite interviewing
contains a rich source data and other information for empirical research due to the
wealth of knowledge and experience possessed by the interviewees (Tansey, 2007).
In this research, elite interviews are employed to obtain opinions and feedback from
construction professionals in the New Zealand construction industry regarding the state-
of-affairs of C&D waste minimisation and zero waste in this industry. For practical
purposes, a working definition of ‘elite’ in this study is adopted from that in Hochschild’s
(2009) and Harvey’s (2011). In particular, the ‘elites’ in this research are defined as
‘someone who holds a senior management position within their organisation and who
has at least 10 years of experience in the construction industry’.
Semi-structured interview and elite interview research methods are used together in this
study to obtain opinions of construction personnel to explain how C&D waste
minimisation fits in with the industry’s overall sustainability aspirations. Interviews are
employed in two phases: Phase 1 - before economic modelling and Phase 2 - after
economic modelling. In the first phase, interviews are employed to obtain opinions of
the chosen construction professionals. Interview results in the first phase will help this
research establish the basis for economic modelling. In the second phase, interviews
CHAPTER 4 – RESEARCH METHODOLOGY
117
with from the same professionals are used to obtain their feedback on the research
results. Interview results in the second phase will help validate the study’s outcome.
4.6.2. Modelling Research
Modelling is a positivistic method that has been widely used in economics (Caldwell,
1980). By definition, a model is artificial in nature - it is a product from model builder’s
conscious effort. In other words, it is an abstract representation of a phenomenon from
the developer’s point-of-view (Boland, 2000). In this sense, a model is neither ‘realistic’
nor ‘ordinary’.
In economics, models are often based on mathematical concepts to represent or
explain observed phenomena (Ayarkwa et al, 2011; DEFRA, 2011; US DOI, 2011;
White, 2012; Gurtler-Schrieverhoff et al, 2014). Because of this abstracted
representation, economic modelling has many built-in flaws (Drummond, 2005). These
flaws include inadequate and/or excessive use of assumptions and data; problems in
aggregating results; and selective reporting of findings.
In this research, economic modelling is employed for the development of an economic
framework to evaluate C&D waste minimisation strategies. This choice aligns well with
previous economic studies in waste management and waste minimisation (Goldman &
Ogishi, 2001; Al-Hajj & Hamani, 2011; Ayarkwa et al, 2011; Kuslyaykina; 2013; Borisov,
2014) or zero waste (Doppelt & Dowling-Wu, 1999; Shen et al, 2004; Begum et al,
2006; Yuan et al., 2011; Hogg et al, 2011; Till, 2013).
However, upon understanding afore-mentioned issues associated with modelling
research, efforts have been made in this research to minimise such modelling
CHAPTER 4 – RESEARCH METHODOLOGY
118
drawbacks. This was done by collating qualitative data and quantitative data to ensure
the economic models developed in this research are applicable to the New Zealand
cases.
4.6.3. Case Study Research
Case study research is a well-understood, well-developed research method which has
been extensively used in many areas (Yin, 2004; Baxter & Jack, 2008). Case study is a
robust research approach as it allows for in-depth exploration and understanding of
complex issues (Zainal, 2007). Various publications and studies on case study have
been created (see, for example Yin, 2004; Yin, 2011 or Neale et al, 2006). But a
definition offered by Davison (1998) summarises the essence of case study. In this
definition, ‘case study’ is defined as a method to examine a phenomenon in its natural
setting by employing multiple methods of data collection from one or a number of
subjects, let them by people, groups or organisations. Further, in case study, the
boundaries of the phenomenon being investigated are not clearly evident at the outset
of the research and the research process often involves no experimental control or
manipulation (Davison, 1998).
Case study research is employed to test the applicability of the economic evaluation
framework developed in this study. Specifically, the economic evaluation framework will
be applied to two case studies to investigate its generalisability and flexibility. Due to
the lack of reliable data related to C&D waste, case study research is particularly useful
for this research. This is because case study research allows the economic framework
developed in this study to be applied to cases with readily-available data on C&D waste
and C&D waste minimisation.
CHAPTER 4 – RESEARCH METHODOLOGY
119
Case study often involves 3 phases: exploring the research subject, evaluating the
subject matter and testing research hypothesis (Barkley, 2006). Therefore, there are a
number of factors to consider when deciding if case study approach is appropriate for
the investigation at hand. These factors include the settings of the research (natural vs.
controlled or contemporary vs. historical) and the theoretical background of the
research (theory building vs. theory testing). It has been argued that case study is an
advantageous methodology in situations where the first criterion of each factor prevails,
such as research in contemporary setting that seeks to explore or establish a
theoretical foundation for a study area) (Baxter & Jack, 2008; Yin, 2011).
In case study research, careful considerations must be given to research design,
especially in the choice between single and multiple case studies (Baxter & Jack,
2008). Often the choice between these 2 research designs depends on many factors
relating to the research such as its functional requirements or availability of relevant
cases (Barkley, 2006). Single case study is used to examine a unique or representative
case where the researcher is required to pay close and careful attention (Zainal, 2007).
On the other hand, multiple case study research design is employed in situations where
the researcher wishes to strengthen research findings via replication, cross-comparison
or hypothesis testing (multiple case study research design is employed in situations
where the researcher wishes to strengthen research findings via replication, cross-
comparison or hypothesis testing (Yin, 2004). It has been argued that multiple case
studies are more advantageous than single case studies due to its ability to convey
richer information (Barkley, 2006; Yin, 2011).
As outlined above, this study employs two case studies to test the applicability and
flexibility of the developed economic framework. As both case studies have rich
CHAPTER 4 – RESEARCH METHODOLOGY
120
datasets, the economic evaluation framework can be applied directly to them without
significant additional modelling work. Further, as the case studies are different in
nature, by demonstrating the applicability of this framework to both cases, the research
shows the framework developed here is indeed flexible and could be used in different
situations.
4.7. Conclusion
This chapter has offered detailed discussions on the research methodology and
research methods appropriate for this study. This was achieved through a systematic
approach: from highlighting the philosophical position of the research; to justifying the
underlying research design for the study; and, finally, to indicating the research
techniques to be employed for subsequent research phases.
The next chapter will provide a basis for the development of the economic evaluation
framework in this research.
CHAPTER 5 – CONTEXTUALISING THE ECONOMIC MODEL
121
CHAPTER 5 - CONTEXTUALISING THE ECONOMIC
EVALUATION FRAMEWORK
CHAPTER 5 – CONTEXTUALISING THE ECONOMIC MODEL
122
This research will address two knowledge gaps.
First, current C&D waste minimisation strategies in New Zealand do not seem to be
effective. This is due to a lack of understanding of key drivers influencing those
strategies. The current emphasis of C&D waste minimisation rests on moderations of
people’s behaviours through technology and guidelines such as the REBRI and Green
Star/Green Building systems. Perhaps this approach was perceived as an easy way to
reduce C&D waste. As a result, significant investments in terms of both monetary and
effort have been spent on developing such systems. However, the fact that C&D waste
minimisation in New Zealand construction has not improved significantly means that
there is an urgent need for a new approach to address and minimise C&D waste.
As previously mentioned, construction’s fragmentation has both risks and benefits for a
strategy. As such, without proper considerations of these factors, a waste minimisation
strategy is unlikely to succeed. One-dimensional considerations focusing on behaviours
may appear to be too simplistic. Perhaps a better approach would be to look for
systematic ways to minimise waste. This could be done by influencing key C&D waste
minimisation drivers.
It has been shown in Chapter 2 that financial considerations are a key driver in
construction. This means for a waste minimisation to succeed, it needs to demonstrate
its economic benefits to construction stakeholders. By influencing the economic aspects
of C&D waste minimisation, it is likely that construction will develop imperatives to
minimise its C&D waste output. This is the fundamental rationale this research.
The second gap that this research will address is associated with the lack of techniques
to evaluate the economics of a C&D waste minimisation strategy in New Zealand
CHAPTER 5 – CONTEXTUALISING THE ECONOMIC MODEL
123
construction. While some efforts have been made to quantify the cost and benefit of
C&D waste minimisation, they are mostly applicable to overseas cases (see, for
example Begum et al, 2006; Tam & Tam, 2008; Yuan et al, 2011 or Yu et al, 2013).
Currently there is no study in New Zealand exploring this area. This is a missed
opportunity and one which needs to be addressed urgently so a good understanding of
C&D waste economics can be achieved.
In this thesis, an economic evaluation framework is developed. It is intended that the
framework is flexible enough to be used in various situations and for different waste
streams. Efforts have been made to ensure this framework is appropriate for, and
applicable to, the New Zealand construction industry. The economic framework is
developed using a 2-phase approach.
In Phase 1, the research aims to establish the context of economic model via a series
of interviews with elite practicing professionals in the New Zealand construction
industry. These professionals will have at least 11 years of work experience in the New
Zealand construction industry. Further, they must hold at least a senior managerial role
within their respective organisations. The two restrictions above are used in this
research to help limit of the scope of this research to a small pool of very experience
individuals with in-depth understanding of the New Zealand construction. Further, these
restrictions can ensure the feedback from these experienced practicing professionals is
of high quality.
Once the baseline economic framework has been established and preliminary
modelling has been undertaken, Phase 2 of the qualitative research will commence. In
Phase 2, the research focusing on validation and confirmation of the assumptions and
CHAPTER 5 – CONTEXTUALISING THE ECONOMIC MODEL
124
claims made in the economic models. The preliminary results will be presented to the
same group of interviewees to obtain their second-round feedback. It is anticipated that
the feedback obtained in this round will be helpful for the researcher in the refinement of
the economic framework.
5.1. Phase 1: Establishing context of economic model
In this phase, interviews with elite practicing professionals in the New Zealand
construction industry were undertaken. To ensure the study meets all stringent
requirements needed for an academic research, ethics approvals was sought and
approved by the AUT Ethics Committee.
Elite interviews were carried out with seven highly experienced professionals using a
semi-structured interview approach. These professionals come from different
background, including:
• A Director of a project management company with 40 years of work
experience in NZ
• A waste management consultant with 35 years of work experience in NZ
• A senior architect with 20 years of work experience in both the UK and NZ
• A senior project manager with 20 years of work experience in NZ
• A construction manager of a major construction company with 20 years of
work experience in both the UK and NZ
• A construction manager of a major construction company with 15 years of
work experience in both the UK and NZ
CHAPTER 5 – CONTEXTUALISING THE ECONOMIC MODEL
125
• A product category manager of a building merchant with 11 years of work
experience in NZ construction supply chain management
As argued in Section 4.6.1.2, a significant valuable information can be obtained from
the use of elite interviews due to the participants’ wealth of knowledge and experience
in construction. But at the same time, results obtained from the interviews may not be
the reflection of views and opinions of the entire construction industry and are only
applicable to this research due to a limited number of interviews undertaken. This could
be a potential weakness of this research.
Interview questions and transcripts of the interviews with these professionals can be
found in Appendix A and Appendix B, respectively.
5.1.1. States of affairs of C&D waste minimisation in New Zealand
The wealth of knowledge and experience possessed by these elite individuals has been
particularly useful for this research. It has been revealed through the interviews that
although it is possible to reduce and recycle C&D waste in NZ, waste reduction and
waste recycling are not considered a high priority in practice. This is mainly due to two
main reasons.
First, there is a perception in the industry that a waste minimisation strategy costs a
significant amount of money to implement. Due to this perception, waste minimisation is
not considered a high agenda by construction stakeholders. The result of this
perception is that the uptake of waste minimisation in the New Zealand construction
industry has been slow. Therefore, in order to improve waste minimisation in the New
Zealand construction industry, there is an urgent need for a meaningful strategy to
CHAPTER 5 – CONTEXTUALISING THE ECONOMIC MODEL
126
encourage the uptake of waste minimisation practices. Further, for such a waste
minimisation strategy to be sustainable, there is a need for a good understanding of its
economics so careful can proper planning can be undertaken to ensure its longevity.
Second, there exists a high degree of resistance for implementation of new ideas and
concepts from the industry. Perhaps this is because of the traditional conservative
nature of the construction industry. It was also found in the interviews that there is a
lack of economic incentives offered to companies to minimise C&D waste. It has been
argued that a robust incentive scheme can help increase the uptake of C&D waste
minimisation significantly (Tam & Tam, 2008). This is because money is an important
economic driver in construction and by having such a scheme could potentially increase
the success rates of a waste minimisation programme. On the other hand, without
enough economic imperatives, it is unlikely that the New Zealand construction industry
will make changes to accommodate the adoption of new concept such as zero waste.
Although it is possible to model the economic impacts of a penalty – incentive scheme
on a waste minimisation strategy, this option will not be explored this study. This is due
to practical reasons. Tam & Tam’s (2008) model was developed specifically for, and
tested solely in, Hong Kong. As a result of its restricted application, it is difficult to
measure the robustness of this model as well as applicability to different locales.
Moreover, the incentive model proposed by Tam & Tam (2008) would require a
significant amount of work to modify to suit the New Zealand. This means by adopting
Tam & Tam’s (2008) incentive model into the current research would mean the scope of
this research would be expanded significantly. This is an opportunity for subsequent
studies to explore.
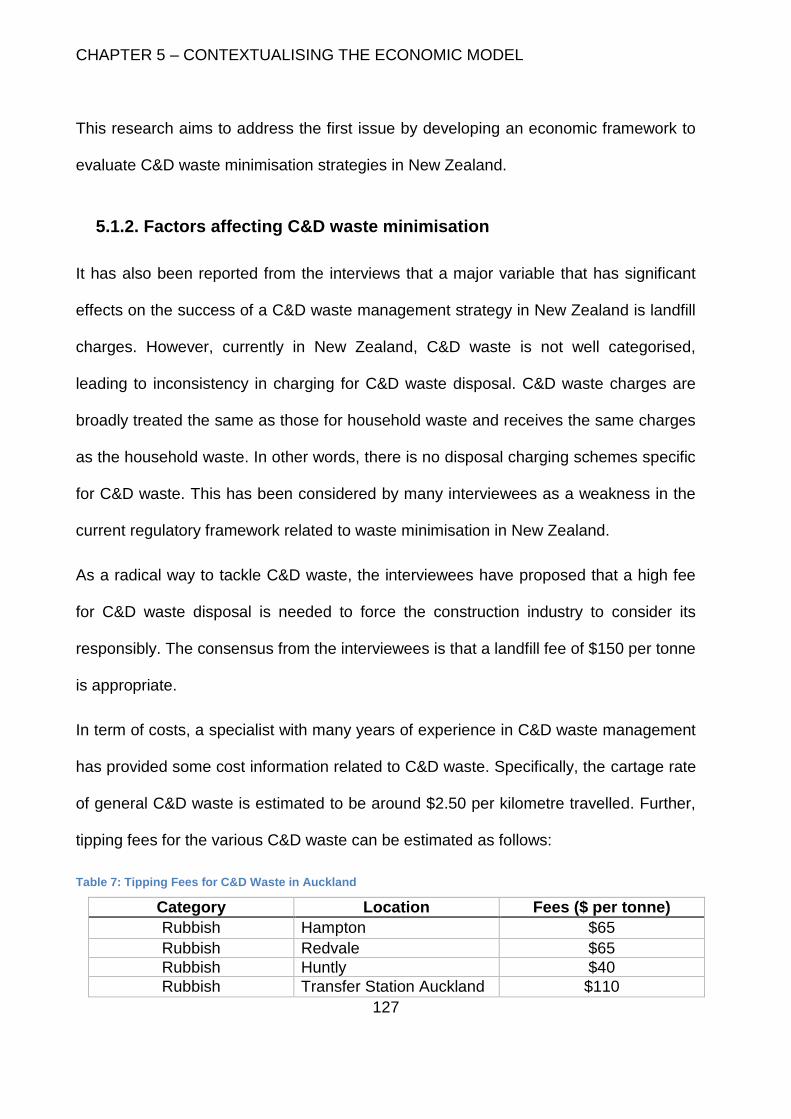
CHAPTER 5 – CONTEXTUALISING THE ECONOMIC MODEL
127
This research aims to address the first issue by developing an economic framework to
evaluate C&D waste minimisation strategies in New Zealand.
5.1.2. Factors affecting C&D waste minimisation
It has also been reported from the interviews that a major variable that has significant
effects on the success of a C&D waste management strategy in New Zealand is landfill
charges. However, currently in New Zealand, C&D waste is not well categorised,
leading to inconsistency in charging for C&D waste disposal. C&D waste charges are
broadly treated the same as those for household waste and receives the same charges
as the household waste. In other words, there is no disposal charging schemes specific
for C&D waste. This has been considered by many interviewees as a weakness in the
current regulatory framework related to waste minimisation in New Zealand.
As a radical way to tackle C&D waste, the interviewees have proposed that a high fee
for C&D waste disposal is needed to force the construction industry to consider its
responsibly. The consensus from the interviewees is that a landfill fee of $150 per tonne
is appropriate.
In term of costs, a specialist with many years of experience in C&D waste management
has provided some cost information related to C&D waste. Specifically, the cartage rate
of general C&D waste is estimated to be around $2.50 per kilometre travelled. Further,
tipping fees for the various C&D waste can be estimated as follows:
Table 7: Tipping Fees for C&D Waste in Auckland
Category Location Fees ($ per tonne)
Rubbish Hampton $65
Rubbish Redvale $65
Rubbish Huntly $40
Rubbish Transfer Station Auckland $110
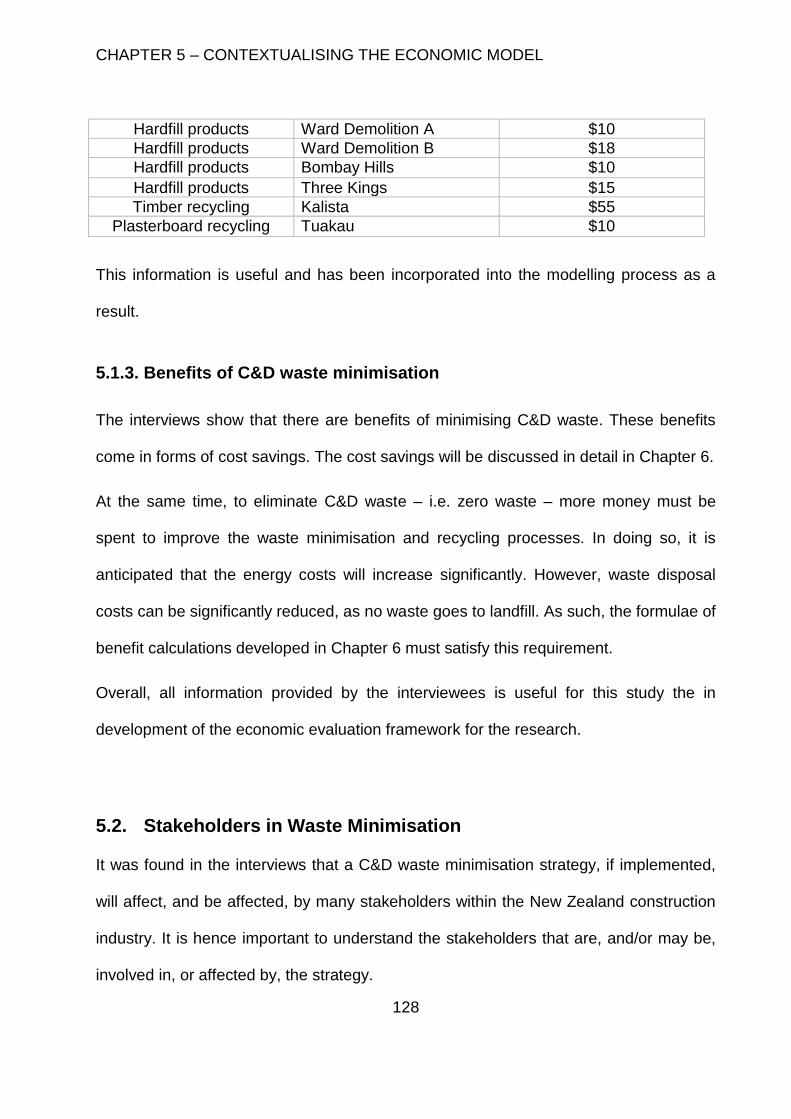
CHAPTER 5 – CONTEXTUALISING THE ECONOMIC MODEL
128
Hardfill products Ward Demolition A $10
Hardfill products Ward Demolition B $18
Hardfill products Bombay Hills $10
Hardfill products Three Kings $15
Timber recycling Kalista $55
Plasterboard recycling Tuakau $10
This information is useful and has been incorporated into the modelling process as a
result.
5.1.3. Benefits of C&D waste minimisation
The interviews show that there are benefits of minimising C&D waste. These benefits
come in forms of cost savings. The cost savings will be discussed in detail in Chapter 6.
At the same time, to eliminate C&D waste – i.e. zero waste – more money must be
spent to improve the waste minimisation and recycling processes. In doing so, it is
anticipated that the energy costs will increase significantly. However, waste disposal
costs can be significantly reduced, as no waste goes to landfill. As such, the formulae of
benefit calculations developed in Chapter 6 must satisfy this requirement.
Overall, all information provided by the interviewees is useful for this study the in
development of the economic evaluation framework for the research.
5.2. Stakeholders in Waste Minimisation
It was found in the interviews that a C&D waste minimisation strategy, if implemented,
will affect, and be affected, by many stakeholders within the New Zealand construction
industry. It is hence important to understand the stakeholders that are, and/or may be,
involved in, or affected by, the strategy.
CHAPTER 5 – CONTEXTUALISING THE ECONOMIC MODEL
129
Key stakeholders identified through interviews include: client (building owner), project
manager (client side), designers, prime contractors and specialist waste management
contractors.
In this research, a ‘client’ is defined in this research as the ‘building owners’. Under this
definition, the ‘client’ can be assumed to have full ownership of their buildings and can
make decisions to change and alter the buildings. It can be further assumed that when
the client is a rational being and only makes investment decisions under sound
economic analyses. Decisions made by the client’s regarding the changes of their
buildings include, but not limited to, renovation, remodelling, demolition and
reconstruction of the building. It can be also assumed that such changes can take place
at any point in time that the client sees fit. However, the client must be responsible for
all costs associated with his or her decisions regarding such changes.
A project manager (client side) is defined in this research as someone working for the
client to manage the entire project on their behalf. The project manager can either be
an internal party from within the client’s organisation or they can be an external party
hired by the client for the duration of the project under consideration. Based on
information gathered from the interviews with project managers, the project manager
(client side) is typically responsible for all aspects of the project delivery, including, but
not limited to, client briefing, financial and cost administration, project programming,
consultant engagement, design management and project delivery supervision. Due to
their deep involvement in the entire project, the project manager often has a good
understanding of the project. They can identify areas that need to be improved as well
as opportunities to reduce waste.
CHAPTER 5 – CONTEXTUALISING THE ECONOMIC MODEL
130
‘Designers’ is a broad term defining people or groups of people who are involved in the
design management and/or design of the project. In this research, designers may
include, but not limited to, project managers, design managers, planners, land
surveyors, architects and engineers. Sometimes, depending on the projects, the
contractors and specialists sub-contractors may be involved in aspects of the design
process. The interviews with architects, contractors and waste management contractors
showed that in waste minimisation-focused project, it is beneficial to get contractors and
specialist waste management contractors involved early in the design process so areas
and opportunities to reduce waste can be identified early and understood by all parties.
The prime contractor in a building project is defined in this research as the lead
company responsible for the construction and delivery of the project. Interviews with
contractors revealed that main contractors in New Zealand often operate as
Construction Managers. This means that they often focus on project supervision, with
work packages sub-contracted to their sub-contractors. The interviewees confirmed that
this practice allows the main contractors to minimise their project and organisational
risks (by means of distributing them to the sub-contractors). In waste minimisation,
often main contractors would require their sub-contractors to take actions to reduce and
minimise waste, thus passing all waste minimisation responsibilities to the sub-
contractors. Therefore, from the main contractor’s perspective, they are not directly
affected by a waste minimisation strategy in a project. On the other hand, by taking part
in such a strategy, they could gain significant benefits such as, but not limited to,
possible earnings from design consulting, free training in waste minimisation for key
staff and significant marketing and public relations exposure from being involved in
such a waste minimisation-focused project.
CHAPTER 5 – CONTEXTUALISING THE ECONOMIC MODEL
131
Specialist waste management contractors often involves in the waste management
process of the project’s physical wastages. As the role of this group of contractors is
specific and specialised, they can add significant values to a waste minimisation-
focused project. It was revealed in interviews with main contractors and specialist waste
management sub-contractors that in a waste minimisation-focused project, if the
contractors are involved early in the project, including at the design stage, it is likely that
they will take proactive approaches to reduce and minimise wastages during
construction process.
The interviews have also revealed a laisses-fair attitude in the New Zealand
construction industry regarding C&D waste management. Often once contract is signed,
and construction cost for contractor is fixed, the opportunity to minimise waste often
rests with the subcontractors carrying out the work onsite. The contractor then focuses
their effort on making sure the subcontractors meet project timelines and objectives in
order to earn money. At the same time, the subcontractor must make sure they adhere
to all waste minimisation requirements imposed by the main contractor, and meet
project deadlines. This means opportunities to add values to waste minimisation and
zero waste at contraction stage is limited. The construction management interviewees
indicated that significant values could be gained in relation to waste minimisation at the
design stage.
Based on this feedback, the focus of this research is therefore rests on the design-out-
waste component as it helps narrow down the scope of the current research.
CHAPTER 5 – CONTEXTUALISING THE ECONOMIC MODEL
132
5.3. Research Focus
5.3.1. Stakeholder Groups
In this research, the economic framework will focus on the economics of C&D waste
minimisation and zero waste from the client’s perspective. The reason to focus on this
stakeholder group is two-fold. First, the clients are responsible for paying for all
materials and services relating to the construction and/or demolition of their building. As
such, they can have significant influences on waste minimisation practices in the
construction and demolition processes. Based on the assumption that the clients are
rational people who make investment decisions based on sound economic analyses, it
is reasonable to assume that the clients wish to minimise the amount of waste
generated in their projects if and only if the cost associated with waste minimisation
does not outweigh the benefits that can be obtained from such activities.
Second, there are many groups involved in C&D waste minimisation. Aside from the
clients, groups having vested interests in waste minimisation in a building project
include, but not limited to, project managers, consultants, architects, engineers,
contractors and specialist waste management contractors. As shown in Chapter 2, each
of these interest groups has their own economic agendas and objectives for
undertaking waste minimisation and zero waste. To understand the economic agendas
and objectives of these interest groups in relation to C&D waste minimisation and zero
waste would therefore require significant amount of in-depth studies. In relation to this
research, it would mean the scope of this research would be significantly expanded
beyond its time limit of three years of study. To ensure the scope of the study remains
manageable, this study only focus on the client group. The zero-waste economics and
CHAPTER 5 – CONTEXTUALISING THE ECONOMIC MODEL
133
considerations from the viewpoints of other interest groups can be studied in detail by
subsequent researchers.
5.3.2. Focus on processes
The qualitative results show that there is a consensus among interviewees that a C&D
waste minimisation strategy has the greatest impacts at the design stage. This is
because implementing waste minimisation strategies at the design stage such as
design-out-waste does not generally increase the design cost significantly. In fact, it has
been confirmed that sometimes the costs for design-out-waste designs are the same as
the costs for non-waste minimisation-focused designs. However, due to a perception
that the former design types are more expensive than conventional designs, waste
minimisation-focused designs are often ignored by stakeholders.
In addition, it is the design stage that the client has significant influence and inputs in
their projects. Often once the contract is awarded, the responsibility of waste
minimisation rests with the contractors. The client has a minimal influence on waste
minimisation at the construction stage. Therefore, from the client’s perspective, they
need to focus on the stage that they can maximise their influence on the matter of
waste minimisation; and that is the design stage. At the design stage, the client can
work with the design team as well as contractors to ensure their ideas and principles
are met. Also, it is at this stage that the client can set agendas on, and around, waste
minimisation. By working alongside contractors, not only can the client put their ideas
and requirements across to the contractors but the client also has an opportunity to
assess the capability of the contractors and whether they are suitable for the project.
CHAPTER 5 – CONTEXTUALISING THE ECONOMIC MODEL
134
Considering the information above, this research will only consider the design stage for
modelling purposes. The study will also explore the design-out-waste aspect within the
design stage to understand the costs and benefits this process can offer to the client.
The sole consideration of design stage in this study is for practical purposes. By
focusing on this area, this research can limit its scope to a manageable level. This
means this research will not take into consideration of waste minimisation during
construction stage and any stages thereafter. Instead, further researches can be
undertaken by subsequent studies to investigate the economics of zero waste in these
stages.
Chapter 6 will discuss assumptions and modelling procedures in detail.
5.4. Phase 2: Validation
Phase two of the qualitative research was undertaken upon the completion of the
economic evaluation of the case studies.
Telephone interviews were made with the same professionals who participated in the
phase one interviews.
Findings of Phase 2 are summarised in Chapter 8. Phase 2’s transcript is included in
Appendix D.
5.5. Conclusion
This chapter has provided a basis for a development of the economic evaluation
framework in this study. This was achieved using a two-phase approach. In the first
phase, a theoretical perspective for this research was provided using the semi-
CHAPTER 5 – CONTEXTUALISING THE ECONOMIC MODEL
135
structured elite interviewing method with a group of high profile and highly experienced
practising construction professionals. The interview results were used to develop an
economic evaluation framework that was appropriate for, and applicable to, the New
Zealand construction industry.
The second phase was undertaken upon the completion of the economic modelling of
the case studies. Findings in this phase helped confirm the research findings. Further,
they provided information needed for future work.
Chapter 6 discusses how this framework can be used to evaluate the economics of
minimising a number of waste streams in a new construction project. While Chapter 7
describes how it can be applied to the evaluation of the minimisation of brick waste in a
refurbishment project.
CHAPTER 6 – DEVELOPING THE ECONOMIC FRAMEWORK
136
CHAPTER 6 - DEVELOPMENT OF THE ECONOMIC
FRAMEWORK
CHAPTER 6 – DEVELOPING THE ECONOMIC FRAMEWORK
137
Once relevant information regarding the state-of-affairs of C&D waste management and
waste minimisation in the New Zealand construction industry has been obtained from
interviews, the next step is to develop an economic framework to evaluate values of
waste minimisation and zero waste.
6.1. Overview of the Economic Framework
The economic evaluation framework developed in this study is mathematical based.
However, the information obtained from the interviews has also been used as the basis
and incorporated into the framework development process to ensure the framework
remains relevant to the New Zealand case.
In mathematical modelling, a model is a product of its builder’s conscious effort. In other
words, it is an abstract representation of a phenomenon from the developer’s point-of-
view (Boland, 2000). Researchers hence have freedom in choosing their study subjects
and study objects.
6.2. Focus of this Research
As argued in Chapter 5, the economic evaluation framework in this research will focus
on the assessing the economics of C&D waste minimisation and zero waste strategies
from the client’s perspective.
Further, also shown in Chapter 5, to limit the scope of the research this research is
limited to the design phase only, with an exploration of the ‘design-out-waste’
component to understand its economic values to the client. By limiting the scope to the
CHAPTER 6 – DEVELOPING THE ECONOMIC FRAMEWORK
138
design stage, this research will not take into consideration of waste minimisation during
construction stage and any stages thereafter. Instead, further researches can be
undertaken by subsequent studies to investigate the economics of zero waste in these
stages.
6.3. Economic Framework: The Concept
As mentioned in the literature review, currently there is a lack of a theoretical basis for
the ‘zero waste’ concept, despite its successful applications worldwide. In turns, the
lack of an overall theoretical framework for zero waste seems to have discouraged
researches in this area, as evidenced by the limited literature in body of knowledge in
this area. The lack of an overarching theoretical framework for zero waste also means
that each researcher working in this area must develop their own conceptual model to
represent zero waste within their study.
Due to a lack of a pre-existing theoretical framework for zero waste in construction,
there is an immediate need in this study to formulate a conceptual framework to
undertake the economic evaluation of zero waste in construction. Further, due to the
lack of preceding theoretical models in zero waste, the theoretical economic framework
developed in this research will be based on those for related concepts such as
construction waste management and construction waste minimisation.
Many waste management and construction minimisation frameworks for construction
have been used as references. They include the work of Tam & Tam (2008), Jain
(2012), Dajadian & Koch (2014) and Fadiya et al (2014).
CHAPTER 6 – DEVELOPING THE ECONOMIC FRAMEWORK
139
Overall, these waste management and waste minimisation models have provided useful
references for this research. They have enabled the researcher to understand and
refine the waste management and waste minimisation processes to develop a
theoretical framework for zero waste in New Zealand building construction.
The economic hierarchy of C&D waste management and C&D waste minimisation in
the New Zealand building sector is presented graphically in Figure 4. The map was
produced using flow diagrams. In this diagram, each process is represented by a node
and the relationships between the nodes are represented by edges connecting them.
As each process may be affected by another, the diagram employs directed lines to
show the effects of once process on another.
It is believed that by using flow diagram, it is possible to demonstrate the complex
relationships between processes in building construction in trying to achieve zero
waste. Further, the visual representation of this theoretical zero waste framework allows
subsequent researcher to review it and, potentially, enrich the framework by adding
more relevant processes.
In the context of this research, the map of construction zero waste is unique, as it was
developed based on interviews with, and feedbacks from, practising professionals in NZ
construction. Further, as reported earlier, zero waste is a relatively new area of study
and hence containing of a limited body of knowledge. In the context of construction in
New Zealand, there have been no studies exploring this area to date that the
researcher is aware of. As a result, this research contributes to the body of knowledge
in zero waste, particularly in construction context.
CHAPTER 6 – DEVELOPING THE ECONOMIC FRAMEWORK
140
The uniqueness of this research even extends to the way which the data were collected
and the flexibility offered by the framework offers. The economic evaluation framework
developed in this study allows users to evaluate the economics of minimising individual
wastes as well as a basket of waste types.
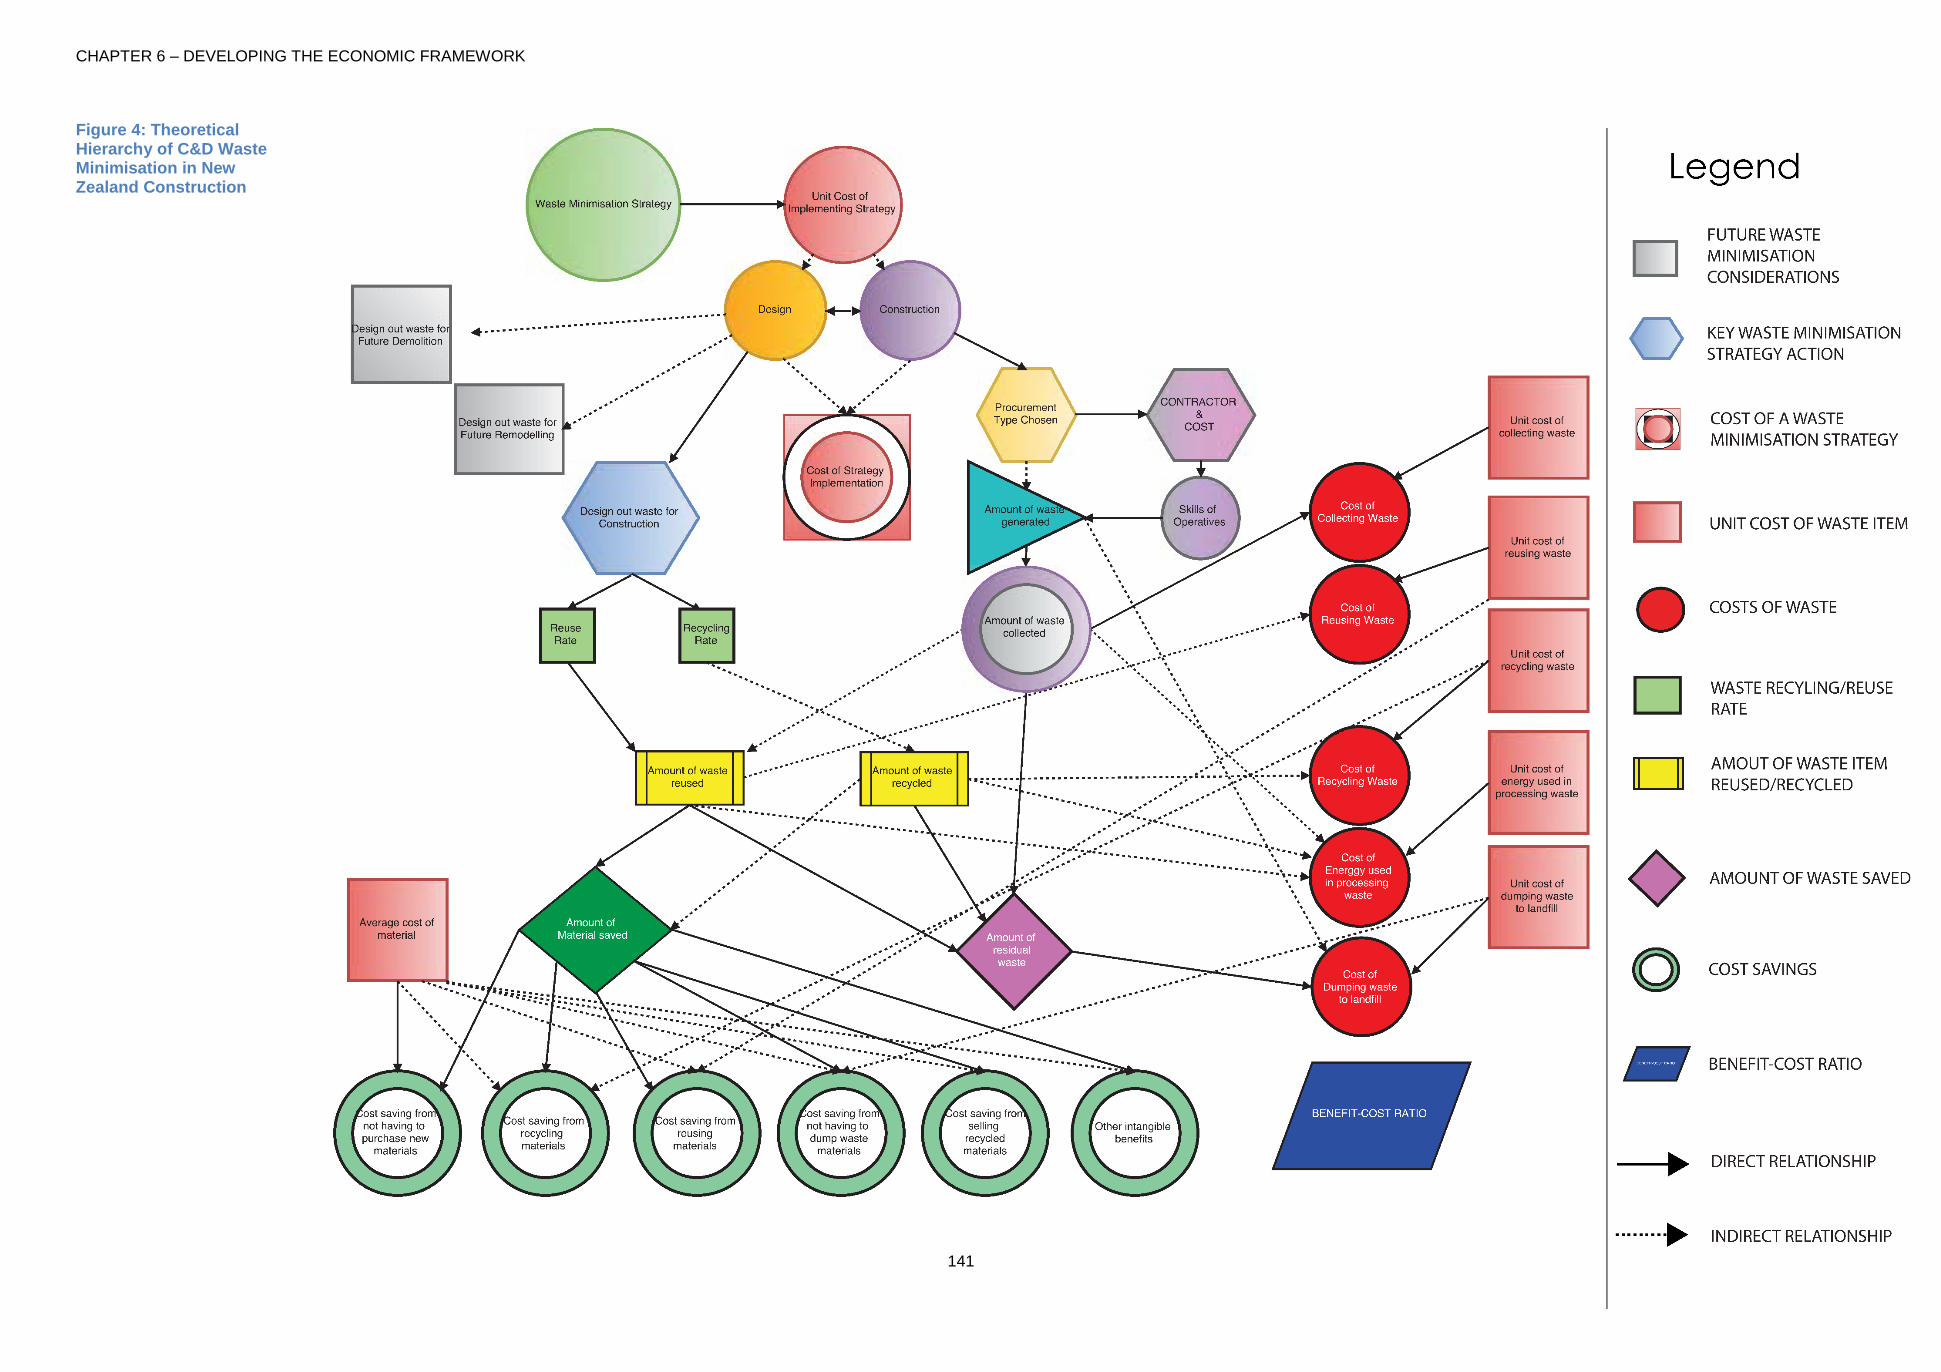
CHAPTER 6 – DEVELOPING THE ECONOMIC FRAMEWORK
141
Figure 4: Theoretical Hierarchy of C&D Waste Minimisation in New Zealand Construction
CHAPTER 6 – DEVELOPING THE ECONOMIC FRAMEWORK
142
In this conceptual framework, two key components of any waste minimisation strategies
are design-out-waste and construction considerations to achieve waste minimisation.
These two key considerations in turns directly and/or indirectly affect several other
components such as amount of waste generated or amount of waste salvaged.
Since each component in the waste minimisation strategy has their own associated unit
cost(s) and/or benefit(s), one can follow the directions of arrows to calculate direct (or
indirect) costs and benefits for all components.
Finally, a Benefit-Cost Ratio can be calculated by dividing the sum of all benefits by the
sum of all costs.
6.4. Modelling Assumptions
For this research, several modelling assumptions have been made to ensure the
economic evaluation framework functions within the research scope. These modelling
assumptions are divided into three broad categories: Market Assumptions, Design-Out-
Waste Assumptions and Assumptions on Waste Minimisation Strategies.
6.4.1. Market Assumptions
Market assumptions refer to a set of conditions needed to ensure the modelling process
work smoothly. In the real world, there are often many interacting factors that affect the
economy and economic activities. These factors may include, but not limited to,
fluctuations in economic cycles, migrations of goods and people; and external events
such as war and disasters. However, for this research, these extreme factors are
ignored in order to simplify the economic modelling process. By assuming these factors
CHAPTER 6 – DEVELOPING THE ECONOMIC FRAMEWORK
143
have zero effects on the situation under consideration, i.e. zero waste, the research can
focus on the essence and explain in detail the inner working of the economic evaluation
framework.
Another key market assumption made by this research is that the market is fluid and
remains in a perfect equilibrium. In other words, there is strong correlation between
supply and demand within the existing market. This means in the current market setting
whatever is sold on the market gets bought by willing buyers. Vice versa, whatever the
customer wishes will be fulfilled by willing supplier of goods and services. This
assumption is used to match sellers and buyers of goods and services in this research.
By using this assumption, the research can remain within the stated scope of study, as
there would be no requirements to model the buying-selling behaviours that may exist
in the construction industry’s market place.
Lastly, this research assumes the perfect economic efficiency exists within the market
considered in this research. Specifically, it is assumed that in the New Zealand building
construction industry, risks and associated benefits (AB) of assuming such risks get
rewarded accordingly. The mechanism for transferring risks and ABs is through
contracts and contractual agreements. Further, all parties will honour their promises
and act accordingly to make sure such promises are honoured. By having this
assumption, the research can ensure all parties, including designers, contractors and
sub-contractors get paid for any risks that they assume for parttaking in a waste
minimisation-zero waste strategy.
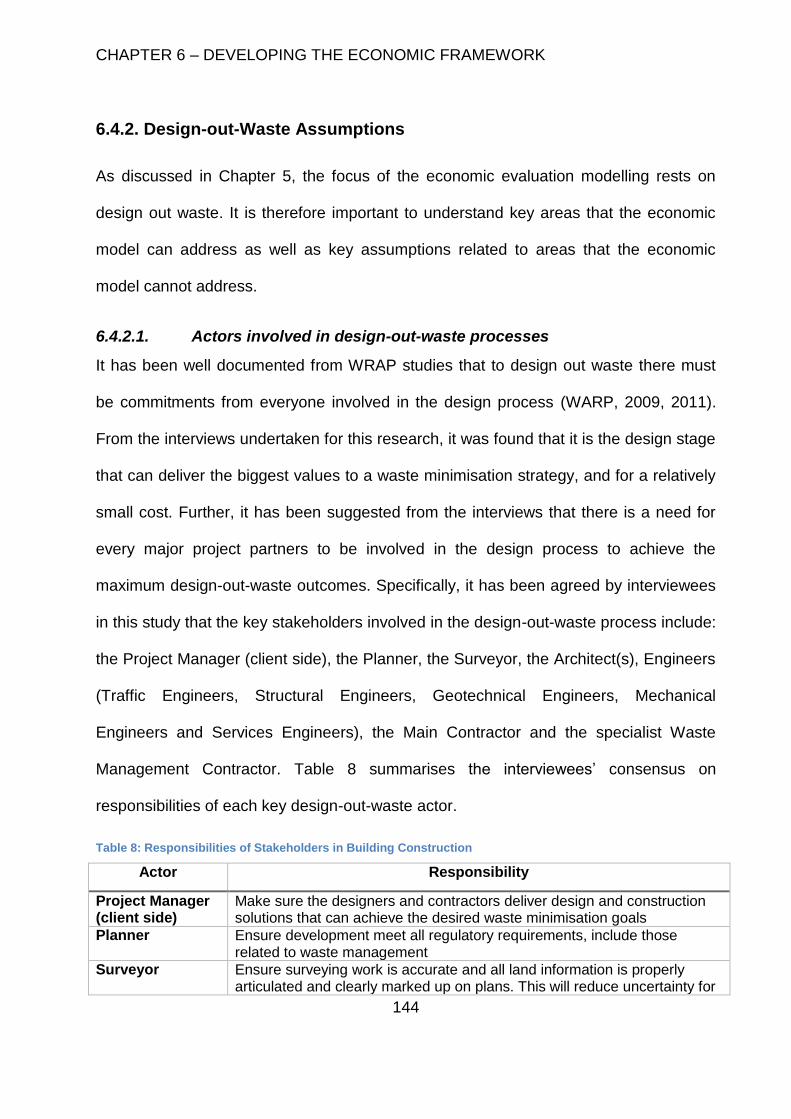
CHAPTER 6 – DEVELOPING THE ECONOMIC FRAMEWORK
144
6.4.2. Design-out-Waste Assumptions
As discussed in Chapter 5, the focus of the economic evaluation modelling rests on
design out waste. It is therefore important to understand key areas that the economic
model can address as well as key assumptions related to areas that the economic
model cannot address.
6.4.2.1. Actors involved in design-out-waste processes
It has been well documented from WRAP studies that to design out waste there must
be commitments from everyone involved in the design process (WARP, 2009, 2011).
From the interviews undertaken for this research, it was found that it is the design stage
that can deliver the biggest values to a waste minimisation strategy, and for a relatively
small cost. Further, it has been suggested from the interviews that there is a need for
every major project partners to be involved in the design process to achieve the
maximum design-out-waste outcomes. Specifically, it has been agreed by interviewees
in this study that the key stakeholders involved in the design-out-waste process include:
the Project Manager (client side), the Planner, the Surveyor, the Architect(s), Engineers
(Traffic Engineers, Structural Engineers, Geotechnical Engineers, Mechanical
Engineers and Services Engineers), the Main Contractor and the specialist Waste
Management Contractor. Table 8 summarises the interviewees’ consensus on
responsibilities of each key design-out-waste actor.
Table 8: Responsibilities of Stakeholders in Building Construction
Actor Responsibility
Project Manager (client side)
Make sure the designers and contractors deliver design and construction solutions that can achieve the desired waste minimisation goals
Planner Ensure development meet all regulatory requirements, include those related to waste management
Surveyor Ensure surveying work is accurate and all land information is properly articulated and clearly marked up on plans. This will reduce uncertainty for
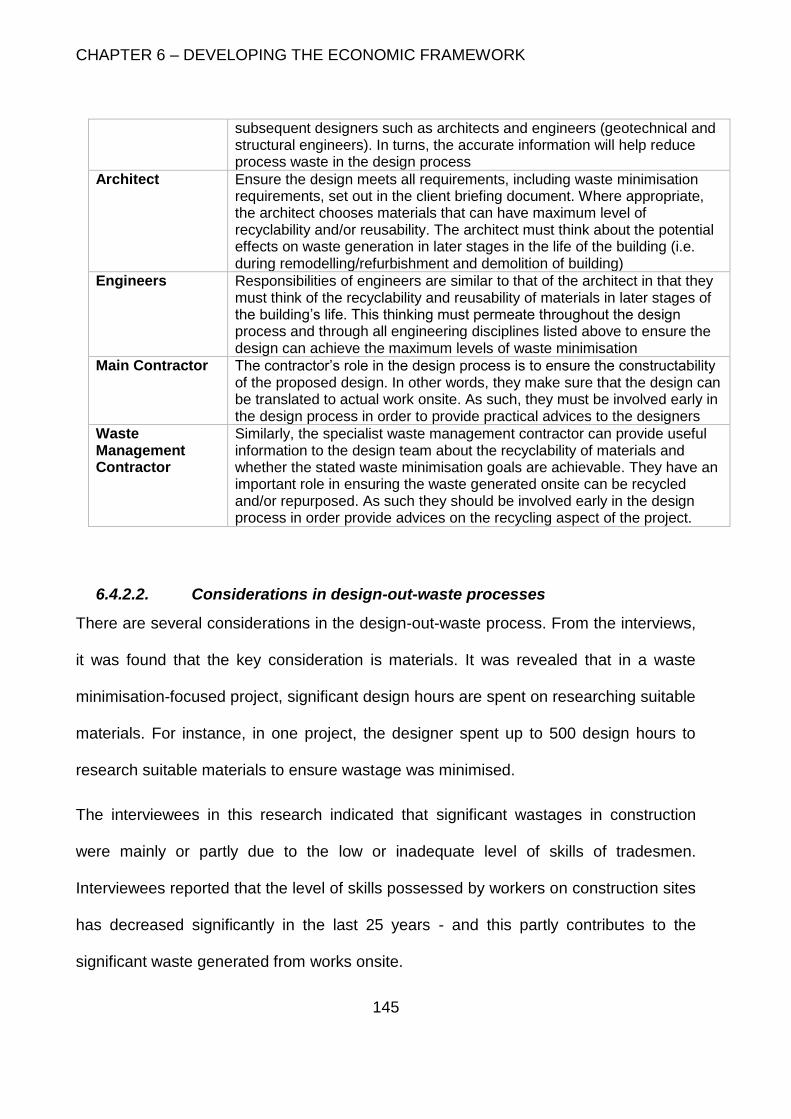
CHAPTER 6 – DEVELOPING THE ECONOMIC FRAMEWORK
145
subsequent designers such as architects and engineers (geotechnical and structural engineers). In turns, the accurate information will help reduce process waste in the design process
Architect Ensure the design meets all requirements, including waste minimisation requirements, set out in the client briefing document. Where appropriate, the architect chooses materials that can have maximum level of recyclability and/or reusability. The architect must think about the potential effects on waste generation in later stages in the life of the building (i.e. during remodelling/refurbishment and demolition of building)
Engineers Responsibilities of engineers are similar to that of the architect in that they must think of the recyclability and reusability of materials in later stages of the building’s life. This thinking must permeate throughout the design process and through all engineering disciplines listed above to ensure the design can achieve the maximum levels of waste minimisation
Main Contractor The contractor’s role in the design process is to ensure the constructability of the proposed design. In other words, they make sure that the design can be translated to actual work onsite. As such, they must be involved early in the design process in order to provide practical advices to the designers
Waste Management Contractor
Similarly, the specialist waste management contractor can provide useful information to the design team about the recyclability of materials and whether the stated waste minimisation goals are achievable. They have an important role in ensuring the waste generated onsite can be recycled and/or repurposed. As such they should be involved early in the design process in order provide advices on the recycling aspect of the project.
6.4.2.2. Considerations in design-out-waste processes
There are several considerations in the design-out-waste process. From the interviews,
it was found that the key consideration is materials. It was revealed that in a waste
minimisation-focused project, significant design hours are spent on researching suitable
materials. For instance, in one project, the designer spent up to 500 design hours to
research suitable materials to ensure wastage was minimised.
The interviewees in this research indicated that significant wastages in construction
were mainly or partly due to the low or inadequate level of skills of tradesmen.
Interviewees reported that the level of skills possessed by workers on construction sites
has decreased significantly in the last 25 years - and this partly contributes to the
significant waste generated from works onsite.
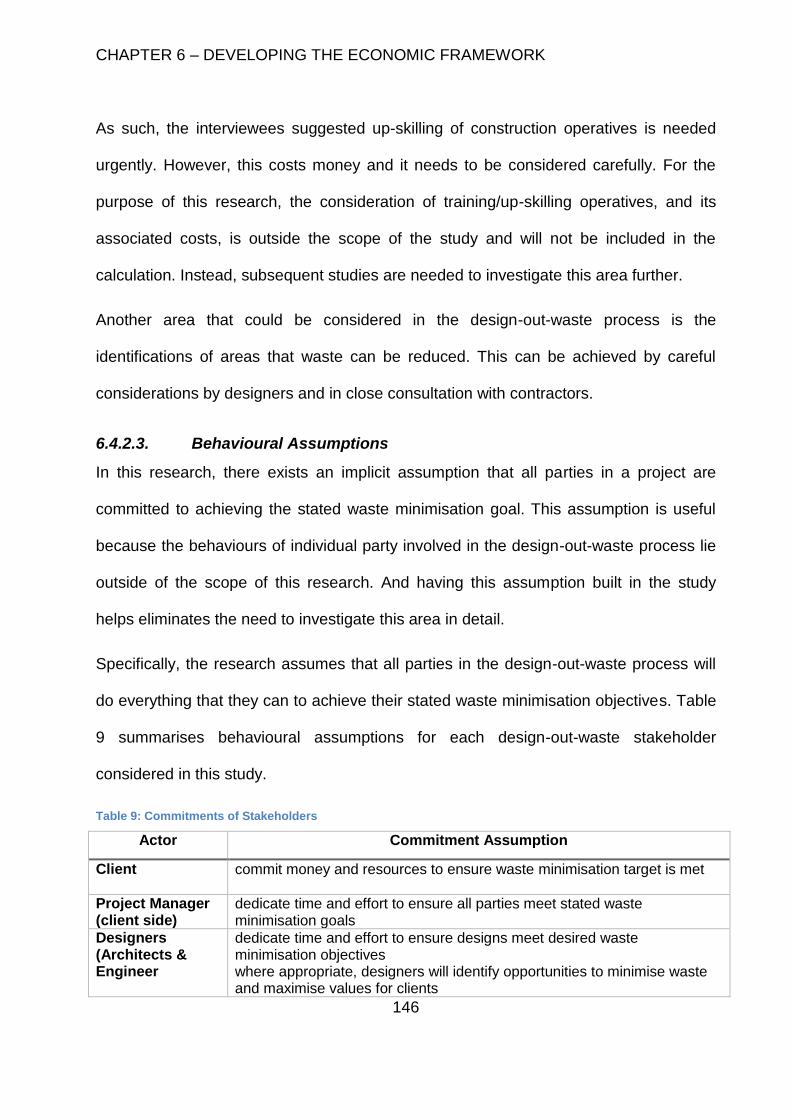
CHAPTER 6 – DEVELOPING THE ECONOMIC FRAMEWORK
146
As such, the interviewees suggested up-skilling of construction operatives is needed
urgently. However, this costs money and it needs to be considered carefully. For the
purpose of this research, the consideration of training/up-skilling operatives, and its
associated costs, is outside the scope of the study and will not be included in the
calculation. Instead, subsequent studies are needed to investigate this area further.
Another area that could be considered in the design-out-waste process is the
identifications of areas that waste can be reduced. This can be achieved by careful
considerations by designers and in close consultation with contractors.
6.4.2.3. Behavioural Assumptions
In this research, there exists an implicit assumption that all parties in a project are
committed to achieving the stated waste minimisation goal. This assumption is useful
because the behaviours of individual party involved in the design-out-waste process lie
outside of the scope of this research. And having this assumption built in the study
helps eliminates the need to investigate this area in detail.
Specifically, the research assumes that all parties in the design-out-waste process will
do everything that they can to achieve their stated waste minimisation objectives. Table
9 summarises behavioural assumptions for each design-out-waste stakeholder
considered in this study.
Table 9: Commitments of Stakeholders
Actor Commitment Assumption
Client commit money and resources to ensure waste minimisation target is met
Project Manager (client side)
dedicate time and effort to ensure all parties meet stated waste minimisation goals
Designers (Architects & Engineer
dedicate time and effort to ensure designs meet desired waste minimisation objectives where appropriate, designers will identify opportunities to minimise waste and maximise values for clients
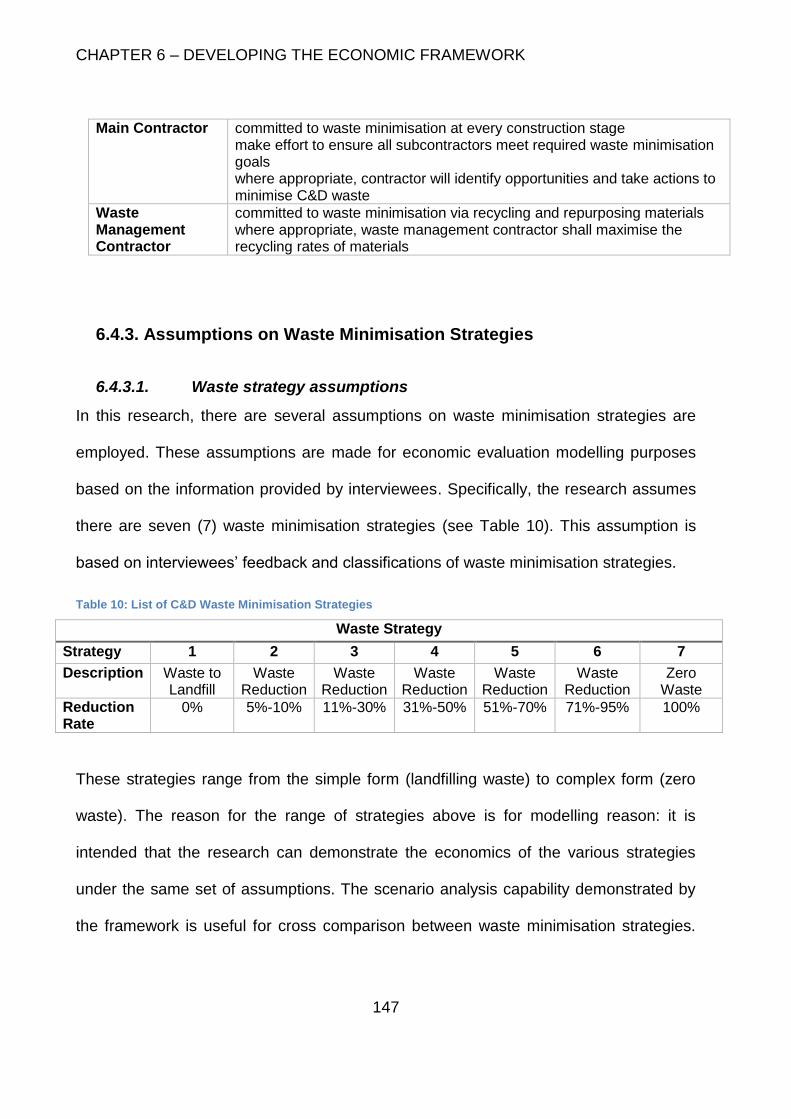
CHAPTER 6 – DEVELOPING THE ECONOMIC FRAMEWORK
147
Main Contractor committed to waste minimisation at every construction stage make effort to ensure all subcontractors meet required waste minimisation goals where appropriate, contractor will identify opportunities and take actions to minimise C&D waste
Waste Management Contractor
committed to waste minimisation via recycling and repurposing materials where appropriate, waste management contractor shall maximise the recycling rates of materials
6.4.3. Assumptions on Waste Minimisation Strategies
6.4.3.1. Waste strategy assumptions
In this research, there are several assumptions on waste minimisation strategies are
employed. These assumptions are made for economic evaluation modelling purposes
based on the information provided by interviewees. Specifically, the research assumes
there are seven (7) waste minimisation strategies (see Table 10). This assumption is
based on interviewees’ feedback and classifications of waste minimisation strategies.
Table 10: List of C&D Waste Minimisation Strategies
Waste Strategy
Strategy 1 2 3 4 5 6 7
Description Waste to Landfill
Waste Reduction
Waste Reduction
Waste Reduction
Waste Reduction
Waste Reduction
Zero Waste
Reduction Rate
0% 5%-10% 11%-30% 31%-50% 51%-70% 71%-95% 100%
These strategies range from the simple form (landfilling waste) to complex form (zero
waste). The reason for the range of strategies above is for modelling reason: it is
intended that the research can demonstrate the economics of the various strategies
under the same set of assumptions. The scenario analysis capability demonstrated by
the framework is useful for cross comparison between waste minimisation strategies.
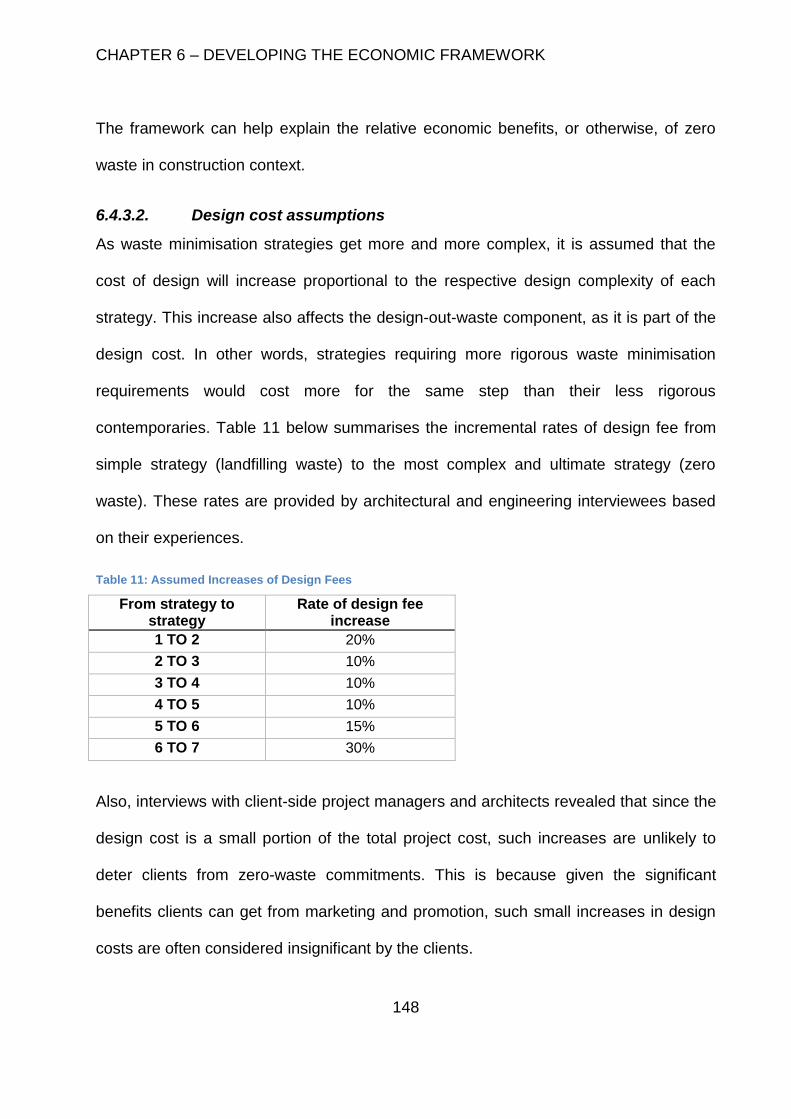
CHAPTER 6 – DEVELOPING THE ECONOMIC FRAMEWORK
148
The framework can help explain the relative economic benefits, or otherwise, of zero
waste in construction context.
6.4.3.2. Design cost assumptions
As waste minimisation strategies get more and more complex, it is assumed that the
cost of design will increase proportional to the respective design complexity of each
strategy. This increase also affects the design-out-waste component, as it is part of the
design cost. In other words, strategies requiring more rigorous waste minimisation
requirements would cost more for the same step than their less rigorous
contemporaries. Table 11 below summarises the incremental rates of design fee from
simple strategy (landfilling waste) to the most complex and ultimate strategy (zero
waste). These rates are provided by architectural and engineering interviewees based
on their experiences.
Table 11: Assumed Increases of Design Fees
From strategy to strategy
Rate of design fee increase
1 TO 2 20%
2 TO 3 10%
3 TO 4 10%
4 TO 5 10%
5 TO 6 15%
6 TO 7 30%
Also, interviews with client-side project managers and architects revealed that since the
design cost is a small portion of the total project cost, such increases are unlikely to
deter clients from zero-waste commitments. This is because given the significant
benefits clients can get from marketing and promotion, such small increases in design
costs are often considered insignificant by the clients.
CHAPTER 6 – DEVELOPING THE ECONOMIC FRAMEWORK
149
6.4.3.3. Energy cost assumptions
There is another implicit assumption that underlies this research. It has been assumed
that the increases in waste strategy costs come from the fact that more energy is
required to process waste and turn them into usable products. This extra energy is
required at every step along the recycling process, from handling and sorting waste
onsite to transport waste to processing plants, to recycling waste and repurposing
waste to usable products. For this research, it is assumed that the energy cost
increases by 25% for Level 6 strategy compared to the Level 1 strategy and by 50% for
Level 7 strategy compared to the Level 1 strategy. This assumption was made based
on feedback from the specialist waste management contractor.
It is anticipated that the increments in energy requirements and consumptions at every
level will in turns have significant implications on the costs associated with the waste
minimisation strategies.
6.4.3.4. Benefit assumptions
It has been suggested by the interviews that there are financial benefits associated with
minimising C&D waste. The interviewees in this research perceive that financial
benefits come in forms of cost savings achieved by the client from minimising waste
and sales of recycled/repurposed materials to third-parties.
As more waste is diverted from landfill, more cost savings can be realised by the client -
and to a degree by the lead contractor also. These cost savings come in forms of
transportation cost savings, purchasing cost savings and cost savings from disposing of
less waste. As waste minimisation strategies get progressively more rigorous, the cost
savings associated with such respective strategies and which can be realised by the
client (and lead contractor) grow significantly.
CHAPTER 6 – DEVELOPING THE ECONOMIC FRAMEWORK
150
At the same time, as more waste is being diverted from landfill, the client can also gain
more intangible benefits associated with it. Such intangible benefits include, but not
limited to, improved reputation, improved morale within their current workforce and/or
improved media coverage. It is often difficult to quantify these intangible benefits.
However, they exist and can offer significant ‘soft’ values to the client as well as
organisations involved in the project. Although intangible, these ‘soft’ values can be
significant to all organisations. As a result, these ‘soft’ values should acquire a dollar
value associated with them.
Although it is possible to model and calculate the dollar values of the intangible
benefits, by doing so would mean the scope of this research would be significantly
expanded. Besides, the intangible benefits remain to be a small component of the
benefit modelling in this thesis. It is hence not justifiable to expand the scope of the
study significantly to accommodate for a small component of the model. Therefore, for
this study, it was decided by the researcher that the monetised values of the intangible
benefits are assumed instead of being calculated. The amount of assumed intangible
benefits varies from project to project. As a result, the corresponding monetised values
of such intangible benefits will also vary from one project to the next. These monetised
values of intangible benefits will be discussed in detail in the case studies in Chapter 7
and Chapter 8 respectively.
6.5. Economic Framework: The Models
The economic models for the framework are developed because of the theoretical
economic framework presented above. These models are mathematical-based and
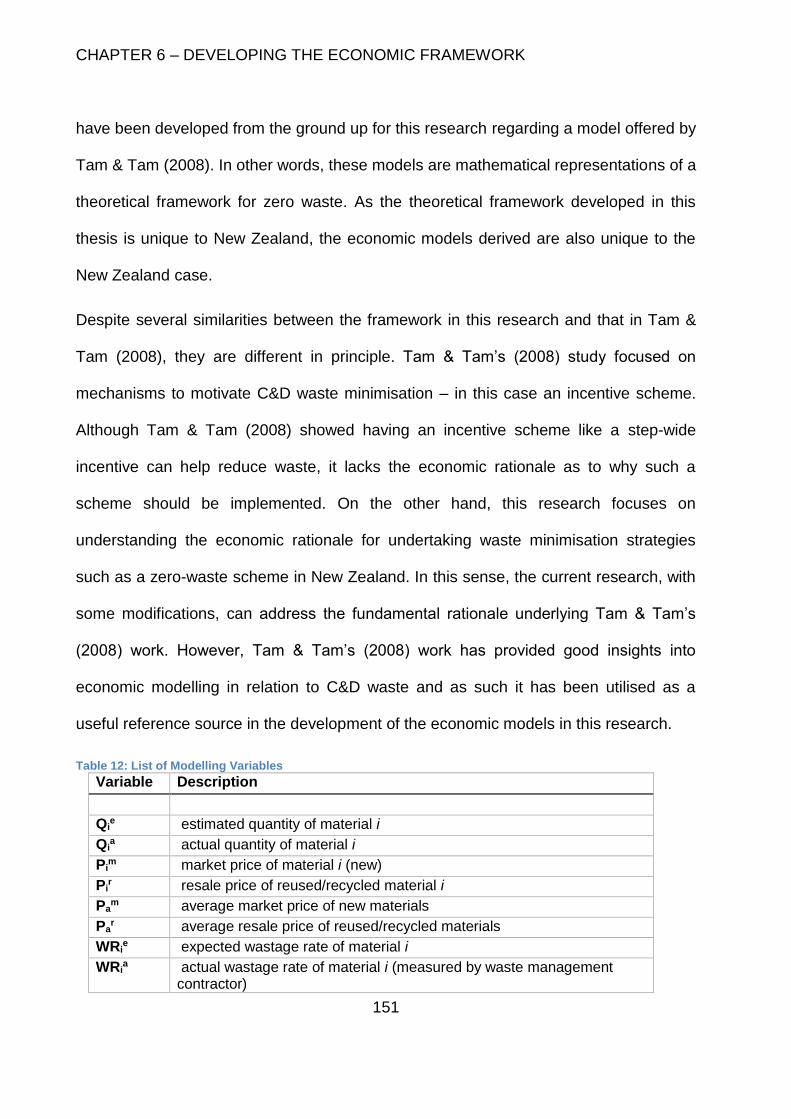
CHAPTER 6 – DEVELOPING THE ECONOMIC FRAMEWORK
151
have been developed from the ground up for this research regarding a model offered by
Tam & Tam (2008). In other words, these models are mathematical representations of a
theoretical framework for zero waste. As the theoretical framework developed in this
thesis is unique to New Zealand, the economic models derived are also unique to the
New Zealand case.
Despite several similarities between the framework in this research and that in Tam &
Tam (2008), they are different in principle. Tam & Tam’s (2008) study focused on
mechanisms to motivate C&D waste minimisation – in this case an incentive scheme.
Although Tam & Tam (2008) showed having an incentive scheme like a step-wide
incentive can help reduce waste, it lacks the economic rationale as to why such a
scheme should be implemented. On the other hand, this research focuses on
understanding the economic rationale for undertaking waste minimisation strategies
such as a zero-waste scheme in New Zealand. In this sense, the current research, with
some modifications, can address the fundamental rationale underlying Tam & Tam’s
(2008) work. However, Tam & Tam’s (2008) work has provided good insights into
economic modelling in relation to C&D waste and as such it has been utilised as a
useful reference source in the development of the economic models in this research.
Table 12: List of Modelling Variables
Variable Description
Qie estimated quantity of material i
Qia actual quantity of material i
Pim market price of material i (new)
Pir resale price of reused/recycled material i
Pam average market price of new materials
Par average resale price of reused/recycled materials
WRie expected wastage rate of material i
WRia actual wastage rate of material i (measured by waste management
contractor)
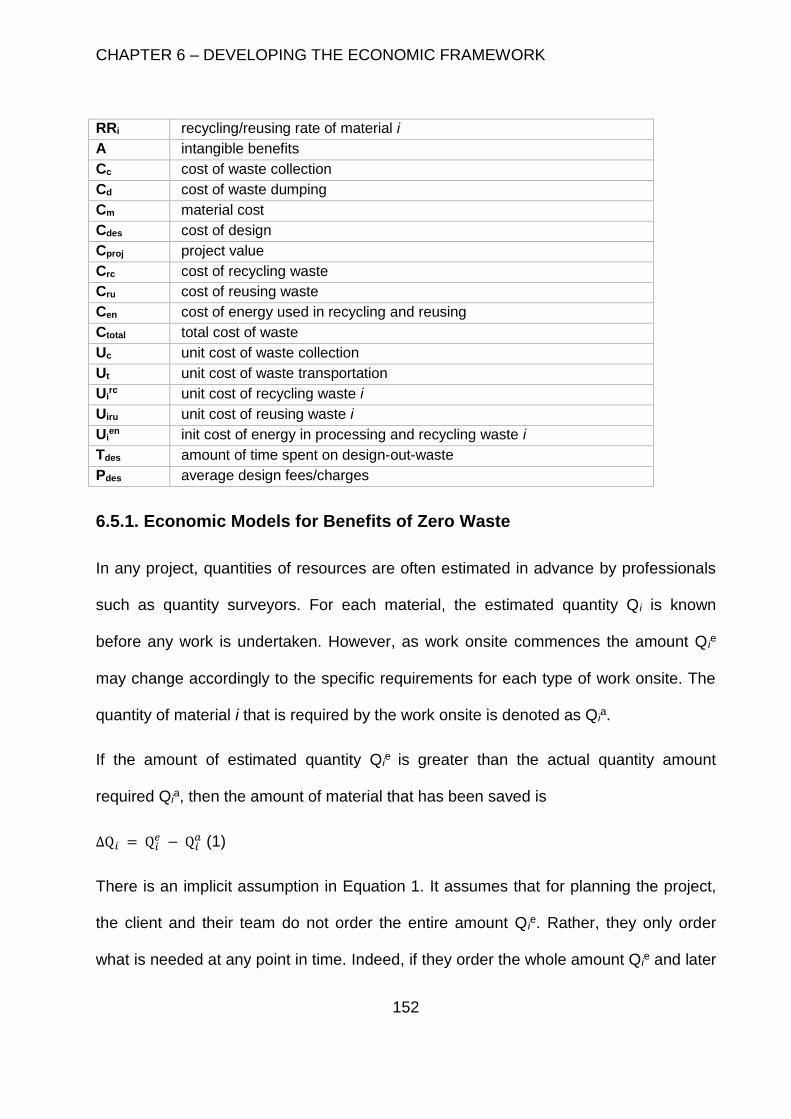
CHAPTER 6 – DEVELOPING THE ECONOMIC FRAMEWORK
152
RRi recycling/reusing rate of material i
A intangible benefits
Cc cost of waste collection
Cd cost of waste dumping
Cm material cost
Cdes cost of design
Cproj project value
Crc cost of recycling waste
Cru cost of reusing waste
Cen cost of energy used in recycling and reusing
Ctotal total cost of waste
Uc unit cost of waste collection
Ut unit cost of waste transportation
Uirc unit cost of recycling waste i
Uiru unit cost of reusing waste i
Uien init cost of energy in processing and recycling waste i
Tdes amount of time spent on design-out-waste
Pdes average design fees/charges
6.5.1. Economic Models for Benefits of Zero Waste
In any project, quantities of resources are often estimated in advance by professionals
such as quantity surveyors. For each material, the estimated quantity Qi is known
before any work is undertaken. However, as work onsite commences the amount Q ie
may change accordingly to the specific requirements for each type of work onsite. The
quantity of material i that is required by the work onsite is denoted as Qia.
If the amount of estimated quantity Qie is greater than the actual quantity amount
required Qia, then the amount of material that has been saved is
ΔQ𝑖 = Q𝑖𝑒 − Q𝑖
𝑎 (1)
There is an implicit assumption in Equation 1. It assumes that for planning the project,
the client and their team do not order the entire amount Qie. Rather, they only order
what is needed at any point in time. Indeed, if they order the whole amount Qie and later
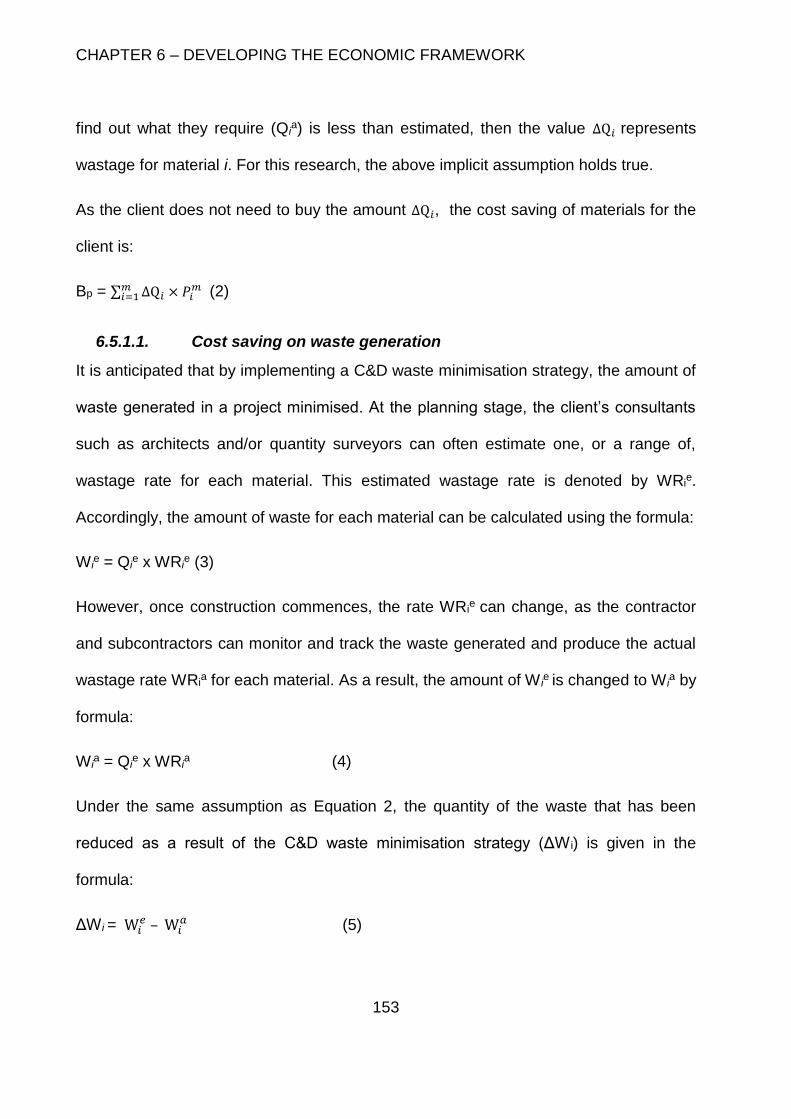
CHAPTER 6 – DEVELOPING THE ECONOMIC FRAMEWORK
153
find out what they require (Qia) is less than estimated, then the value ΔQ𝑖 represents
wastage for material i. For this research, the above implicit assumption holds true.
As the client does not need to buy the amount ΔQ𝑖, the cost saving of materials for the
client is:
Bp = ∑ ΔQ𝑖 × 𝑃𝑖𝑚 𝑚
𝑖=1 (2)
6.5.1.1. Cost saving on waste generation
It is anticipated that by implementing a C&D waste minimisation strategy, the amount of
waste generated in a project minimised. At the planning stage, the client’s consultants
such as architects and/or quantity surveyors can often estimate one, or a range of,
wastage rate for each material. This estimated wastage rate is denoted by WRie.
Accordingly, the amount of waste for each material can be calculated using the formula:
Wie = Qi
e x WRie (3)
However, once construction commences, the rate WRie can change, as the contractor
and subcontractors can monitor and track the waste generated and produce the actual
wastage rate WRia for each material. As a result, the amount of W i
e is changed to Wia by
formula:
Wia = Qi
e x WRia (4)
Under the same assumption as Equation 2, the quantity of the waste that has been
reduced as a result of the C&D waste minimisation strategy (ΔW i) is given in the
formula:
ΔWi = W𝑖𝑒 – W𝑖
𝑎 (5)
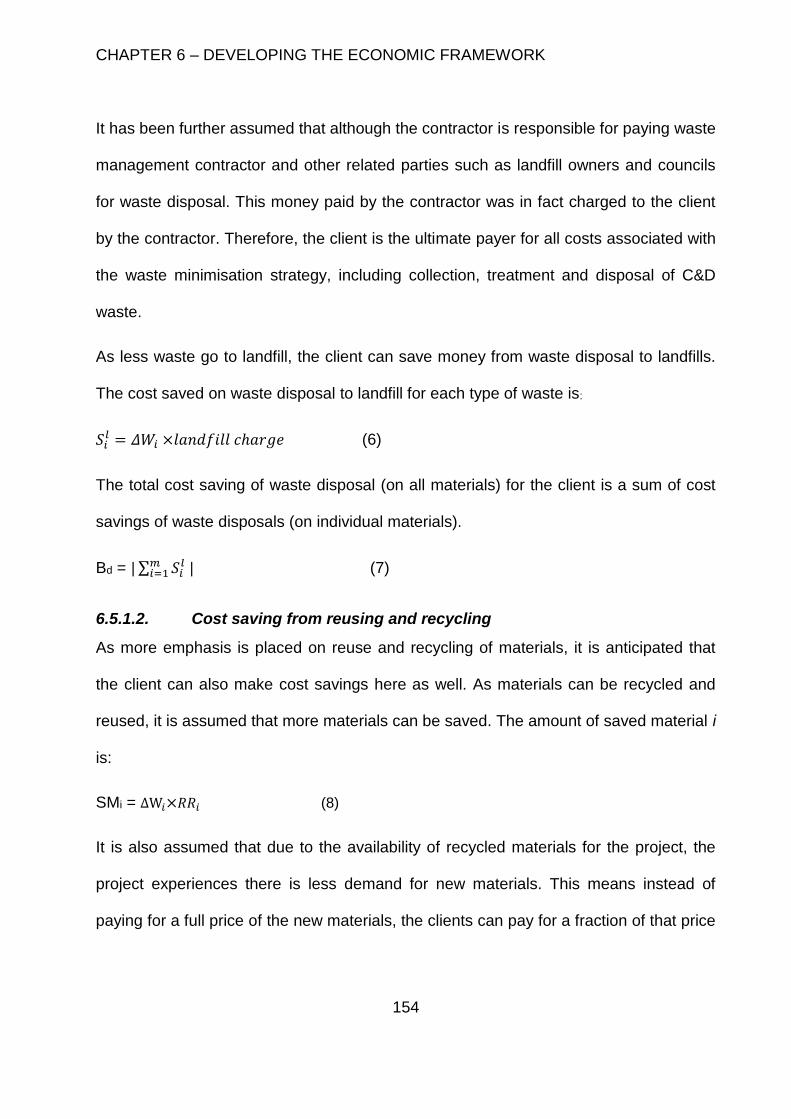
CHAPTER 6 – DEVELOPING THE ECONOMIC FRAMEWORK
154
It has been further assumed that although the contractor is responsible for paying waste
management contractor and other related parties such as landfill owners and councils
for waste disposal. This money paid by the contractor was in fact charged to the client
by the contractor. Therefore, the client is the ultimate payer for all costs associated with
the waste minimisation strategy, including collection, treatment and disposal of C&D
waste.
As less waste go to landfill, the client can save money from waste disposal to landfills.
The cost saved on waste disposal to landfill for each type of waste is:
𝑆𝑖𝑙 = 𝛥𝑊𝑖 ×𝑙𝑎𝑛𝑑𝑓𝑖𝑙𝑙 𝑐ℎ𝑎𝑟𝑔𝑒 (6)
The total cost saving of waste disposal (on all materials) for the client is a sum of cost
savings of waste disposals (on individual materials).
Bd = | ∑ 𝑆𝑖𝑙 |𝑚
𝑖=1 (7)
6.5.1.2. Cost saving from reusing and recycling
As more emphasis is placed on reuse and recycling of materials, it is anticipated that
the client can also make cost savings here as well. As materials can be recycled and
reused, it is assumed that more materials can be saved. The amount of saved material i
is:
SMi = ΔW𝑖×𝑅𝑅𝑖 (8)
It is also assumed that due to the availability of recycled materials for the project, the
project experiences there is less demand for new materials. This means instead of
paying for a full price of the new materials, the clients can pay for a fraction of that price
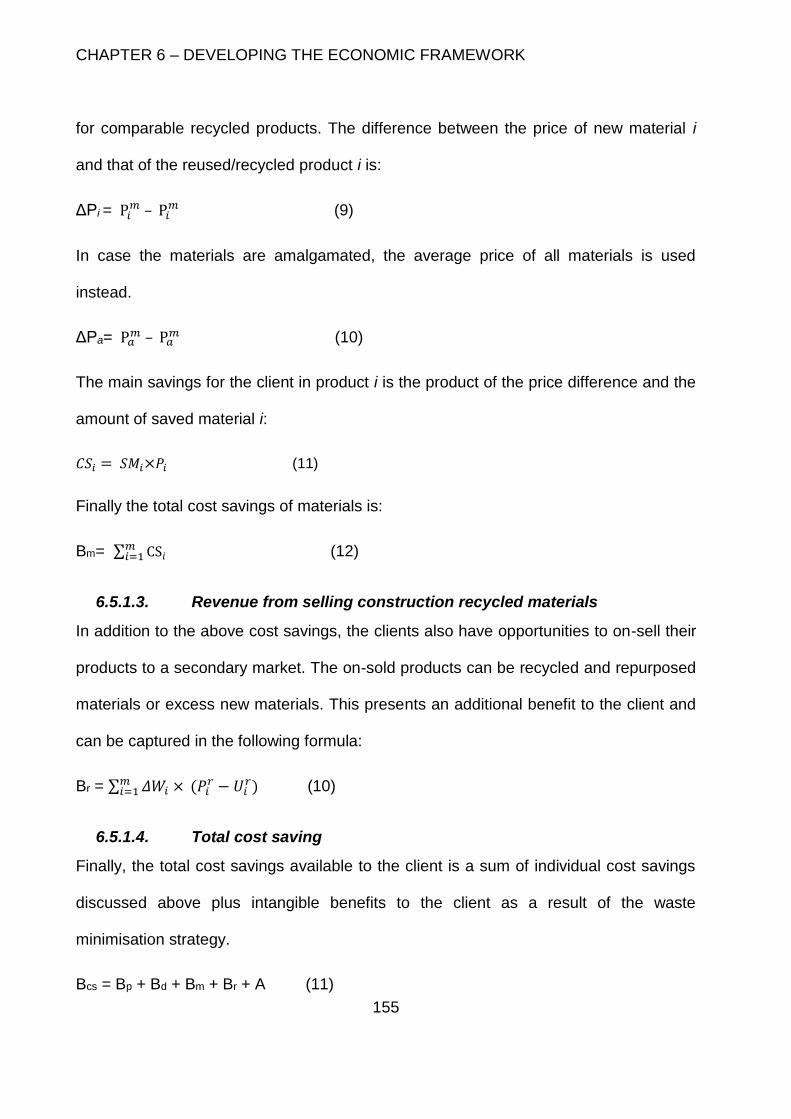
CHAPTER 6 – DEVELOPING THE ECONOMIC FRAMEWORK
155
for comparable recycled products. The difference between the price of new material i
and that of the reused/recycled product i is:
ΔPi = P𝑖𝑚 – P𝑖
𝑚 (9)
In case the materials are amalgamated, the average price of all materials is used
instead.
ΔPa= P𝑎𝑚 – P𝑎
𝑚 (10)
The main savings for the client in product i is the product of the price difference and the
amount of saved material i:
𝐶𝑆𝑖 = 𝑆𝑀𝑖×𝑃𝑖 (11)
Finally the total cost savings of materials is:
Bm= ∑ CS𝑖𝑚𝑖=1 (12)
6.5.1.3. Revenue from selling construction recycled materials
In addition to the above cost savings, the clients also have opportunities to on-sell their
products to a secondary market. The on-sold products can be recycled and repurposed
materials or excess new materials. This presents an additional benefit to the client and
can be captured in the following formula:
Br = ∑ 𝛥𝑊𝑖 × 𝑚𝑖=1 (𝑃𝑖
𝑟 − 𝑈𝑖𝑟) (10)
6.5.1.4. Total cost saving
Finally, the total cost savings available to the client is a sum of individual cost savings
discussed above plus intangible benefits to the client as a result of the waste
minimisation strategy.
Bcs = Bp + Bd + Bm + Br + A (11)
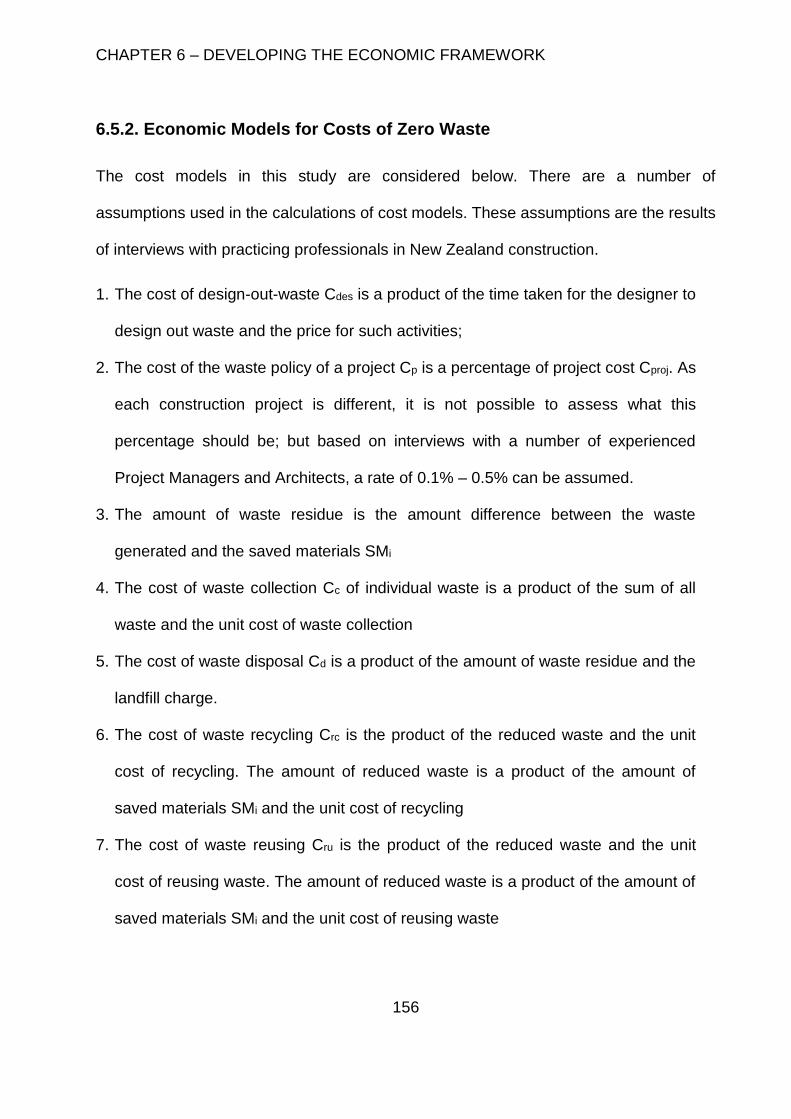
CHAPTER 6 – DEVELOPING THE ECONOMIC FRAMEWORK
156
6.5.2. Economic Models for Costs of Zero Waste
The cost models in this study are considered below. There are a number of
assumptions used in the calculations of cost models. These assumptions are the results
of interviews with practicing professionals in New Zealand construction.
1. The cost of design-out-waste Cdes is a product of the time taken for the designer to
design out waste and the price for such activities;
2. The cost of the waste policy of a project Cp is a percentage of project cost Cproj. As
each construction project is different, it is not possible to assess what this
percentage should be; but based on interviews with a number of experienced
Project Managers and Architects, a rate of 0.1% – 0.5% can be assumed.
3. The amount of waste residue is the amount difference between the waste
generated and the saved materials SMi
4. The cost of waste collection Cc of individual waste is a product of the sum of all
waste and the unit cost of waste collection
5. The cost of waste disposal Cd is a product of the amount of waste residue and the
landfill charge.
6. The cost of waste recycling Crc is the product of the reduced waste and the unit
cost of recycling. The amount of reduced waste is a product of the amount of
saved materials SMi and the unit cost of recycling
7. The cost of waste reusing Cru is the product of the reduced waste and the unit
cost of reusing waste. The amount of reduced waste is a product of the amount of
saved materials SMi and the unit cost of reusing waste
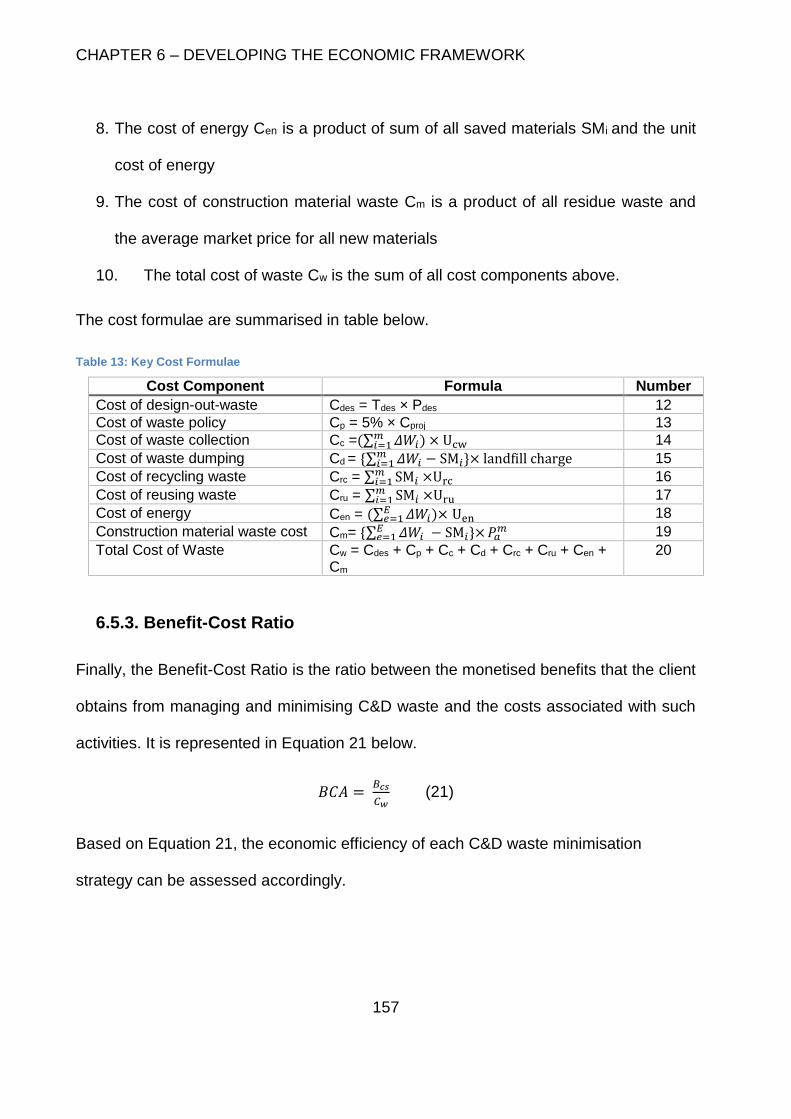
CHAPTER 6 – DEVELOPING THE ECONOMIC FRAMEWORK
157
8. The cost of energy Cen is a product of sum of all saved materials SMi and the unit
cost of energy
9. The cost of construction material waste Cm is a product of all residue waste and
the average market price for all new materials
10. The total cost of waste Cw is the sum of all cost components above.
The cost formulae are summarised in table below.
Table 13: Key Cost Formulae
Cost Component Formula Number
Cost of design-out-waste Cdes = Tdes × Pdes 12
Cost of waste policy Cp = 5% × Cproj 13
Cost of waste collection Cc =(∑ 𝛥𝑊𝑖) × Ucw𝑚𝑖=1 14
Cost of waste dumping Cd = {∑ 𝛥𝑊𝑖 − SM𝑖}× landfill charge𝑚𝑖=1 15
Cost of recycling waste Crc = ∑ SM𝑖 ×Urc𝑚𝑖=1 16
Cost of reusing waste Cru = ∑ SM𝑖 ×Uru𝑚𝑖=1 17
Cost of energy Cen = (∑ 𝛥𝑊𝑖)×𝐸𝑒=1 Uen 18
Construction material waste cost Cm= {∑ 𝛥𝑊𝑖 − SM𝑖}×𝐸𝑒=1 𝑃𝑎
𝑚 19
Total Cost of Waste Cw = Cdes + Cp + Cc + Cd + Crc + Cru + Cen + Cm
20
6.5.3. Benefit-Cost Ratio
Finally, the Benefit-Cost Ratio is the ratio between the monetised benefits that the client
obtains from managing and minimising C&D waste and the costs associated with such
activities. It is represented in Equation 21 below.
𝐵𝐶𝐴 = 𝐵𝑐𝑠
𝐶𝑤 (21)
Based on Equation 21, the economic efficiency of each C&D waste minimisation
strategy can be assessed accordingly.
CHAPTER 6 – DEVELOPING THE ECONOMIC FRAMEWORK
158
6.6. Applications of the Economic Framework
As mentioned in Chapter 3, the economic evaluation framework in this research has
been developed with flexibility in mind. Specifically, the framework is intended to be
applicable to in various situations and with different C&D waste types. It is, hence,
necessary to demonstrate this flexibility in actual cases. Specifically, the economic
evaluation framework will be implemented in two case studies to test its applicability.
In the first case study, the framework is implemented to evaluate the economics of
waste minimisation/zero waste for five waste streams. This example will demonstrate
the applicability of the framework to situations where multiple waste streams are
present. Chapter 7 will cover this case study in detail.
On the other hand, the second case study will demonstrate how the framework can be
used to evaluate the economics of minimising one individual waste stream. This case
study will be covered in Chapter 8.
By demonstrating that the economic evaluation framework can be applied to many
different waste streams, the study reported in this thesis can show that the framework
developed here is applicable to C&D waste in New Zealand.
Further, interviews with construction professionals revealed that 85% of interviewees
believed a cost of landfilling C&D waste to be $150 per tonne would be an appropriate
threshold to deter construction from disposing off C&D waste while at the same time
motivating the New Zealand construction industry to take waste minimisation seriously.
In this study, the validity of this claim will be tested by means of the economic
evaluation framework. Specifically, a cost figure of $150 per tonne for landfill charges
will be applied throughout the economic modelling process. It is anticipated that by
CHAPTER 6 – DEVELOPING THE ECONOMIC FRAMEWORK
159
understanding this variable, appropriate strategies can be subsequently developed to
facilitate a successful C&D waste minimisation programme in New Zealand.
6.7. Conclusion
This chapter has offered detailed discussions on the theoretical economic evaluation
framework to be used in this study. This framework has been developed from the
ground up using qualitative information provided by experienced construction
professionals in New Zealand as a basis. Calculations for economic modelling were
developed accordingly. As a result, the framework developed in this study is
appropriate to New Zealand construction. Further, this framework is flexible and can be
used to evaluate the economics of C&D waste minimisation for different streams.
To demonstrate its applicability to the various C&D waste stream, this framework will be
applied to two case studies. Chapter 7 will discuss how the framework can be used to
evaluate the minimisation of an aggregated waste stream in a new construction project.
Chapter 8 will describe how the framework can be used to evaluate the minimisation of
a single waste stream in a refurbishment project: brick waste.
CHAPTER 7 – CASE STUDY ONE
160
CHAPTER 7 – CASE STUDY ONE
ECONOMIC EVALUATION OF MINIMISING MULTIPLE C&D WASTE STREAMS
CHAPTER 7 – CASE STUDY ONE
161
This chapter demonstrates the application of the economic framework described in
Chapter 5. The economic framework is applied to a wide range of C&D waste streams
in a new-build project. The waste streams considered are divided into two categories:
demolition waste and construction waste.
In the first category, waste considered includes Asbestos-contaminated waste, concrete
and scrap metals. While construction waste includes plasterboard, timber, polyester
materials, steel, cardboard, hardfill, plastic, glass and other general waste.
The waste data sets for this case study were provided by the specialist
demolition/waste management contractor and by the main contractor, respectively. The
data sets are actual accounts for this project and it will be used for the economic
evaluation of waste minimisation strategies, including zero waste, for this case study.
As argued in Chapter 5, the economic evaluation framework focuses on the design
stage of the project. However, for completeness, construction will also be included in
modelling process and briefly mentioned in the analysis. This chapter also explore the
‘design-out-waste’ component to understand its economic values to the client.
7.1. Case Study Overview
The case study considered in this chapter involves the development of a new education
centre for a major Auckland-based education provider. This chapter will evaluate the
economics of waste minimisation strategies associated with this development using the
framework developed in Chapter 6.
CHAPTER 7 – CASE STUDY ONE
162
7.1.1. Project Background
The building is located in the Auckland Central Business District (CBD). Auckland CBD
is the primary business and education district in Auckland Central, with high
concentration of education providers.
This was a complex project. First, there was a limited working space available for this
project. This is mainly due to the fact it is based in the Auckland CBD amid the high
density of surrounding office and apartment buildings. This means the work carried out
onsite during construction was strictly confined to the site boundary only.
The second challenge in this project was the fact that the building is in proximity to a
number of residential apartment buildings. This means careful planning was needed to
ensure the work onsite did not greatly disturb the daily lives of the people living within
the apartment buildings. Specifically, it was found that noise and dust pollution could be
the main issue during construction. Therefore, the contractor took appropriate steps to
ensure the minimum disturbances to people’s lives was achieved.
Finally, due to its central location, there was, and still is, a high traffic volume in the area
surrounding the site. This presented a significant logistical challenge. This problem
required the project team to undertake significant planning and develop execution
systems to ensure materials can be delivered to, and waste can be taken from, site in
an efficient and timely manner.
Once constructed, the building has a total floor area of 20,000 m2.
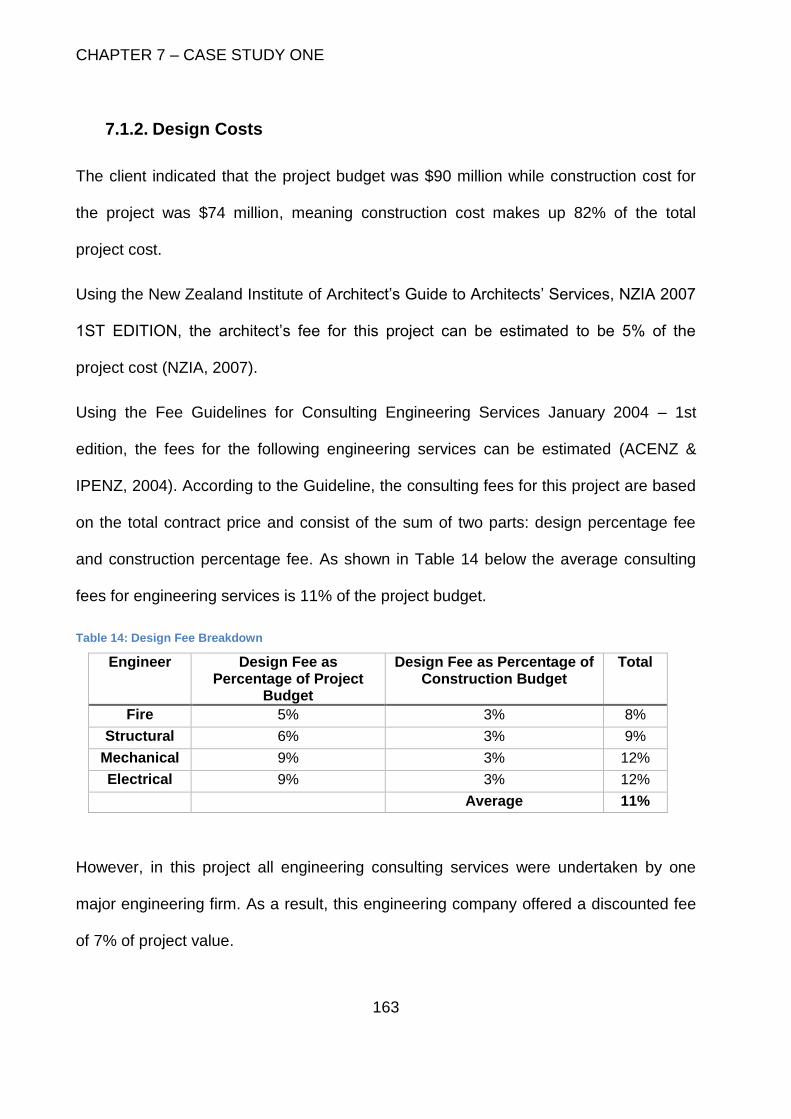
CHAPTER 7 – CASE STUDY ONE
163
7.1.2. Design Costs
The client indicated that the project budget was $90 million while construction cost for
the project was $74 million, meaning construction cost makes up 82% of the total
project cost.
Using the New Zealand Institute of Architect’s Guide to Architects’ Services, NZIA 2007
1ST EDITION, the architect’s fee for this project can be estimated to be 5% of the
project cost (NZIA, 2007).
Using the Fee Guidelines for Consulting Engineering Services January 2004 – 1st
edition, the fees for the following engineering services can be estimated (ACENZ &
IPENZ, 2004). According to the Guideline, the consulting fees for this project are based
on the total contract price and consist of the sum of two parts: design percentage fee
and construction percentage fee. As shown in Table 14 below the average consulting
fees for engineering services is 11% of the project budget.
Table 14: Design Fee Breakdown
Engineer Design Fee as Percentage of Project
Budget
Design Fee as Percentage of Construction Budget
Total
Fire 5% 3% 8%
Structural 6% 3% 9%
Mechanical 9% 3% 12%
Electrical 9% 3% 12%
Average 11%
However, in this project all engineering consulting services were undertaken by one
major engineering firm. As a result, this engineering company offered a discounted fee
of 7% of project value.
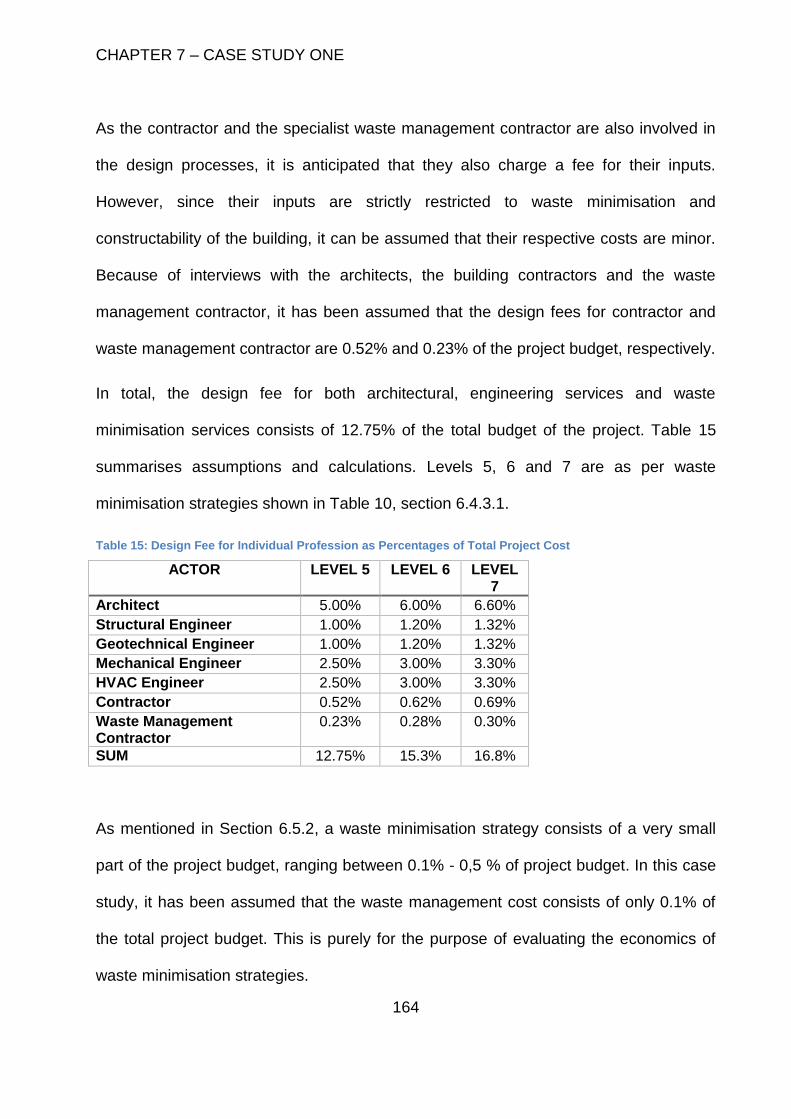
CHAPTER 7 – CASE STUDY ONE
164
As the contractor and the specialist waste management contractor are also involved in
the design processes, it is anticipated that they also charge a fee for their inputs.
However, since their inputs are strictly restricted to waste minimisation and
constructability of the building, it can be assumed that their respective costs are minor.
Because of interviews with the architects, the building contractors and the waste
management contractor, it has been assumed that the design fees for contractor and
waste management contractor are 0.52% and 0.23% of the project budget, respectively.
In total, the design fee for both architectural, engineering services and waste
minimisation services consists of 12.75% of the total budget of the project. Table 15
summarises assumptions and calculations. Levels 5, 6 and 7 are as per waste
minimisation strategies shown in Table 10, section 6.4.3.1.
Table 15: Design Fee for Individual Profession as Percentages of Total Project Cost
ACTOR LEVEL 5 LEVEL 6 LEVEL 7
Architect 5.00% 6.00% 6.60%
Structural Engineer 1.00% 1.20% 1.32%
Geotechnical Engineer 1.00% 1.20% 1.32%
Mechanical Engineer 2.50% 3.00% 3.30%
HVAC Engineer 2.50% 3.00% 3.30%
Contractor 0.52% 0.62% 0.69%
Waste Management Contractor
0.23% 0.28% 0.30%
SUM 12.75% 15.3% 16.8%
As mentioned in Section 6.5.2, a waste minimisation strategy consists of a very small
part of the project budget, ranging between 0.1% - 0,5 % of project budget. In this case
study, it has been assumed that the waste management cost consists of only 0.1% of
the total project budget. This is purely for the purpose of evaluating the economics of
waste minimisation strategies.
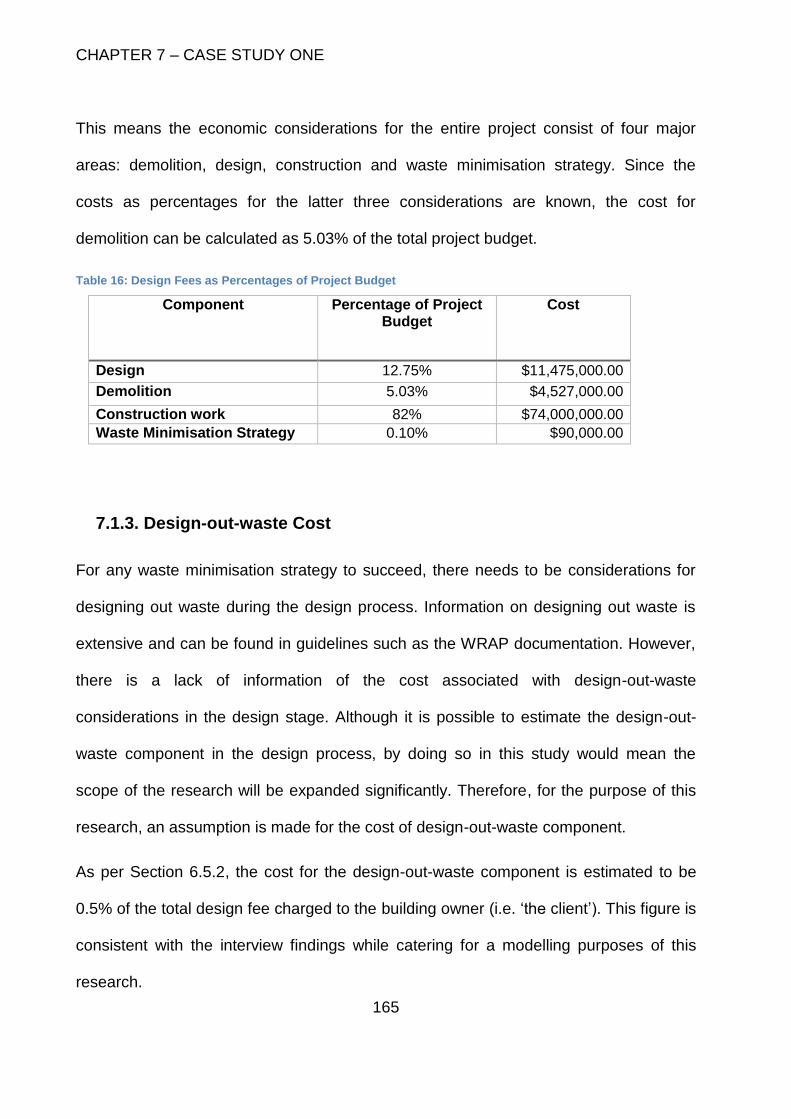
CHAPTER 7 – CASE STUDY ONE
165
This means the economic considerations for the entire project consist of four major
areas: demolition, design, construction and waste minimisation strategy. Since the
costs as percentages for the latter three considerations are known, the cost for
demolition can be calculated as 5.03% of the total project budget.
Table 16: Design Fees as Percentages of Project Budget
Component Percentage of Project Budget
Cost
Design 12.75% $11,475,000.00
Demolition 5.03% $4,527,000.00
Construction work 82% $74,000,000.00
Waste Minimisation Strategy 0.10% $90,000.00
7.1.3. Design-out-waste Cost
For any waste minimisation strategy to succeed, there needs to be considerations for
designing out waste during the design process. Information on designing out waste is
extensive and can be found in guidelines such as the WRAP documentation. However,
there is a lack of information of the cost associated with design-out-waste
considerations in the design stage. Although it is possible to estimate the design-out-
waste component in the design process, by doing so in this study would mean the
scope of the research will be expanded significantly. Therefore, for the purpose of this
research, an assumption is made for the cost of design-out-waste component.
As per Section 6.5.2, the cost for the design-out-waste component is estimated to be
0.5% of the total design fee charged to the building owner (i.e. ‘the client’). This figure is
consistent with the interview findings while catering for a modelling purposes of this
research.
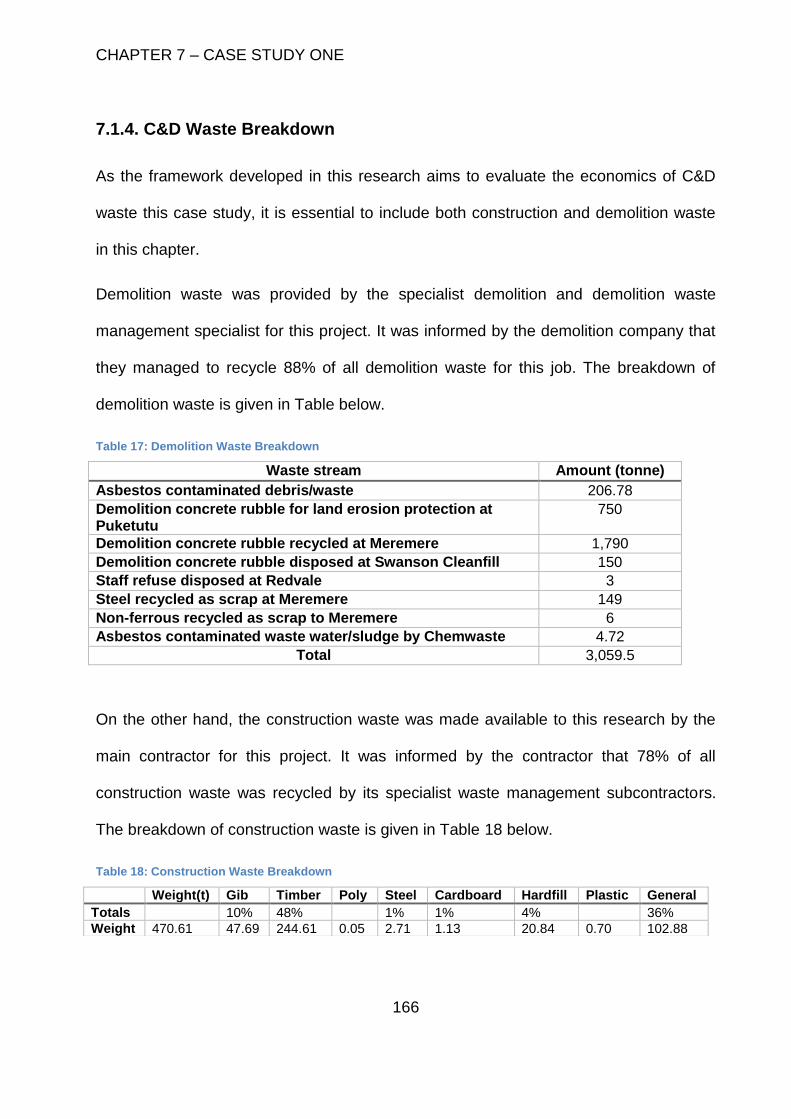
CHAPTER 7 – CASE STUDY ONE
166
7.1.4. C&D Waste Breakdown
As the framework developed in this research aims to evaluate the economics of C&D
waste this case study, it is essential to include both construction and demolition waste
in this chapter.
Demolition waste was provided by the specialist demolition and demolition waste
management specialist for this project. It was informed by the demolition company that
they managed to recycle 88% of all demolition waste for this job. The breakdown of
demolition waste is given in Table below.
Table 17: Demolition Waste Breakdown
Waste stream Amount (tonne)
Asbestos contaminated debris/waste 206.78
Demolition concrete rubble for land erosion protection at Puketutu
750
Demolition concrete rubble recycled at Meremere 1,790
Demolition concrete rubble disposed at Swanson Cleanfill 150
Staff refuse disposed at Redvale 3
Steel recycled as scrap at Meremere 149
Non-ferrous recycled as scrap to Meremere 6
Asbestos contaminated waste water/sludge by Chemwaste 4.72
Total 3,059.5
On the other hand, the construction waste was made available to this research by the
main contractor for this project. It was informed by the contractor that 78% of all
construction waste was recycled by its specialist waste management subcontractors.
The breakdown of construction waste is given in Table 18 below.
Table 18: Construction Waste Breakdown
Weight(t) Gib Timber Poly Steel Cardboard Hardfill Plastic General
Totals 10% 48% 1% 1% 4% 36%
Weight 470.61 47.69 244.61 0.05 2.71 1.13 20.84 0.70 102.88
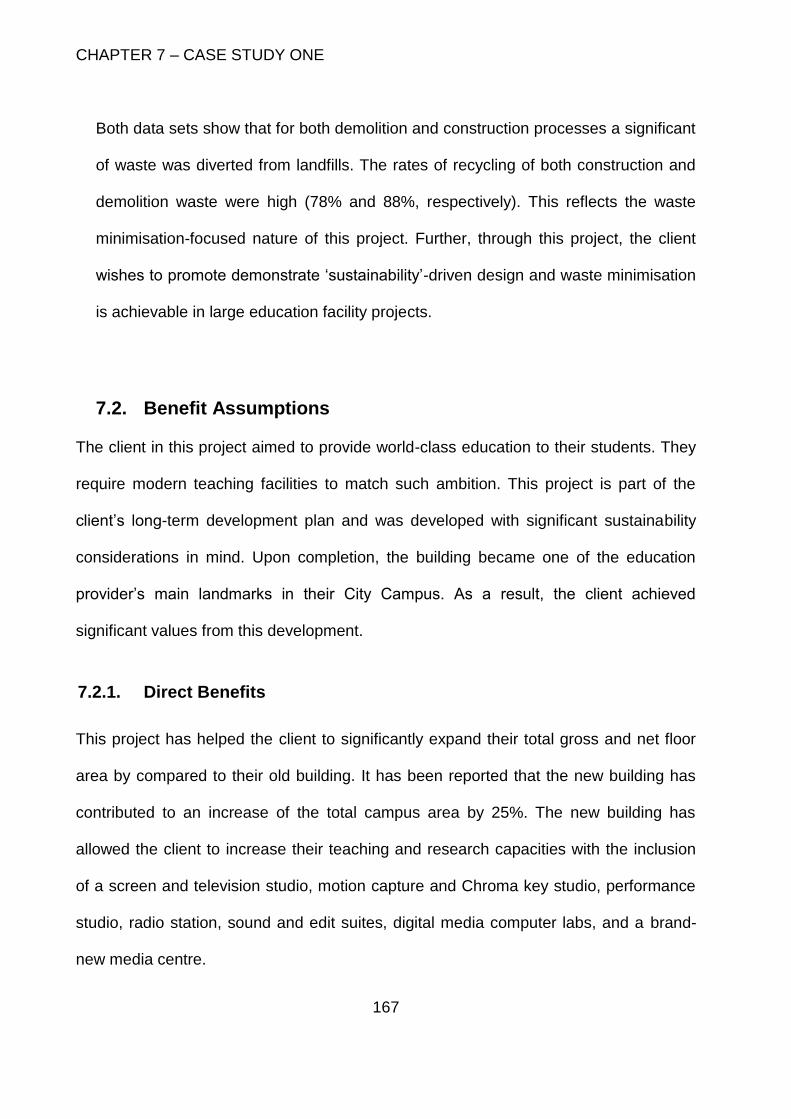
CHAPTER 7 – CASE STUDY ONE
167
Both data sets show that for both demolition and construction processes a significant
of waste was diverted from landfills. The rates of recycling of both construction and
demolition waste were high (78% and 88%, respectively). This reflects the waste
minimisation-focused nature of this project. Further, through this project, the client
wishes to promote demonstrate ‘sustainability’-driven design and waste minimisation
is achievable in large education facility projects.
7.2. Benefit Assumptions
The client in this project aimed to provide world-class education to their students. They
require modern teaching facilities to match such ambition. This project is part of the
client’s long-term development plan and was developed with significant sustainability
considerations in mind. Upon completion, the building became one of the education
provider’s main landmarks in their City Campus. As a result, the client achieved
significant values from this development.
7.2.1. Direct Benefits
This project has helped the client to significantly expand their total gross and net floor
area by compared to their old building. It has been reported that the new building has
contributed to an increase of the total campus area by 25%. The new building has
allowed the client to increase their teaching and research capacities with the inclusion
of a screen and television studio, motion capture and Chroma key studio, performance
studio, radio station, sound and edit suites, digital media computer labs, and a brand-
new media centre.
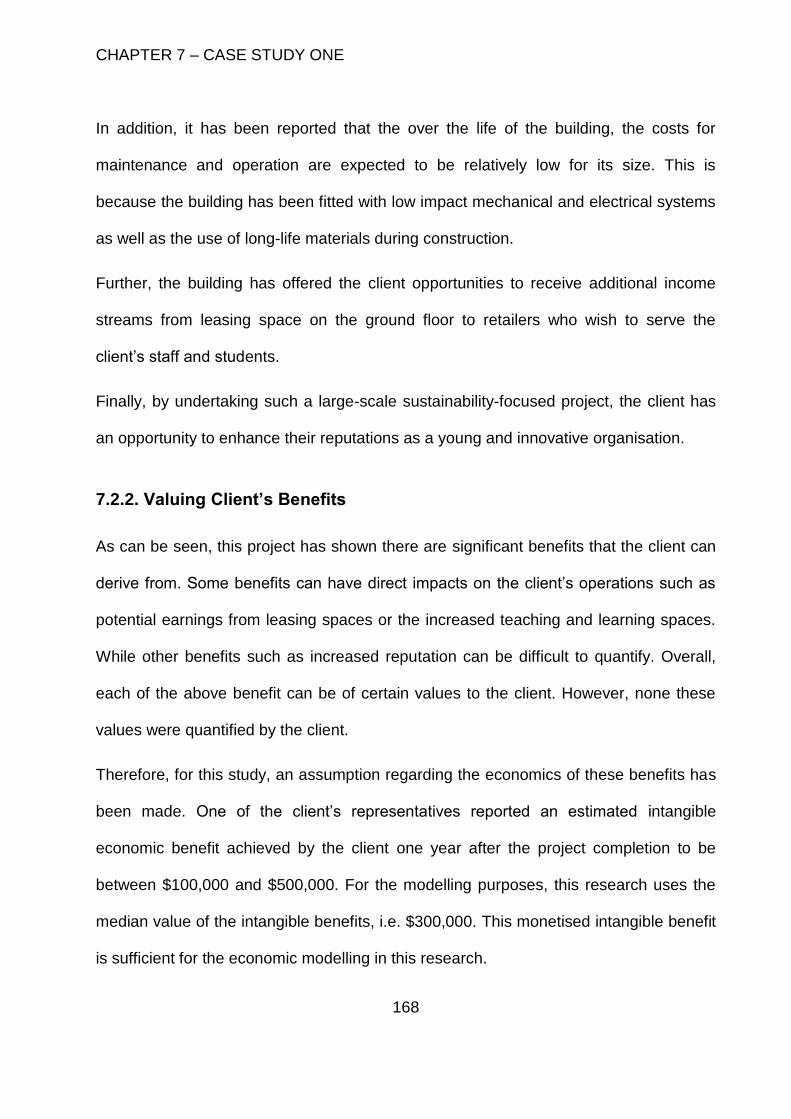
CHAPTER 7 – CASE STUDY ONE
168
In addition, it has been reported that the over the life of the building, the costs for
maintenance and operation are expected to be relatively low for its size. This is
because the building has been fitted with low impact mechanical and electrical systems
as well as the use of long-life materials during construction.
Further, the building has offered the client opportunities to receive additional income
streams from leasing space on the ground floor to retailers who wish to serve the
client’s staff and students.
Finally, by undertaking such a large-scale sustainability-focused project, the client has
an opportunity to enhance their reputations as a young and innovative organisation.
7.2.2. Valuing Client’s Benefits
As can be seen, this project has shown there are significant benefits that the client can
derive from. Some benefits can have direct impacts on the client’s operations such as
potential earnings from leasing spaces or the increased teaching and learning spaces.
While other benefits such as increased reputation can be difficult to quantify. Overall,
each of the above benefit can be of certain values to the client. However, none these
values were quantified by the client.
Therefore, for this study, an assumption regarding the economics of these benefits has
been made. One of the client’s representatives reported an estimated intangible
economic benefit achieved by the client one year after the project completion to be
between $100,000 and $500,000. For the modelling purposes, this research uses the
median value of the intangible benefits, i.e. $300,000. This monetised intangible benefit
is sufficient for the economic modelling in this research.
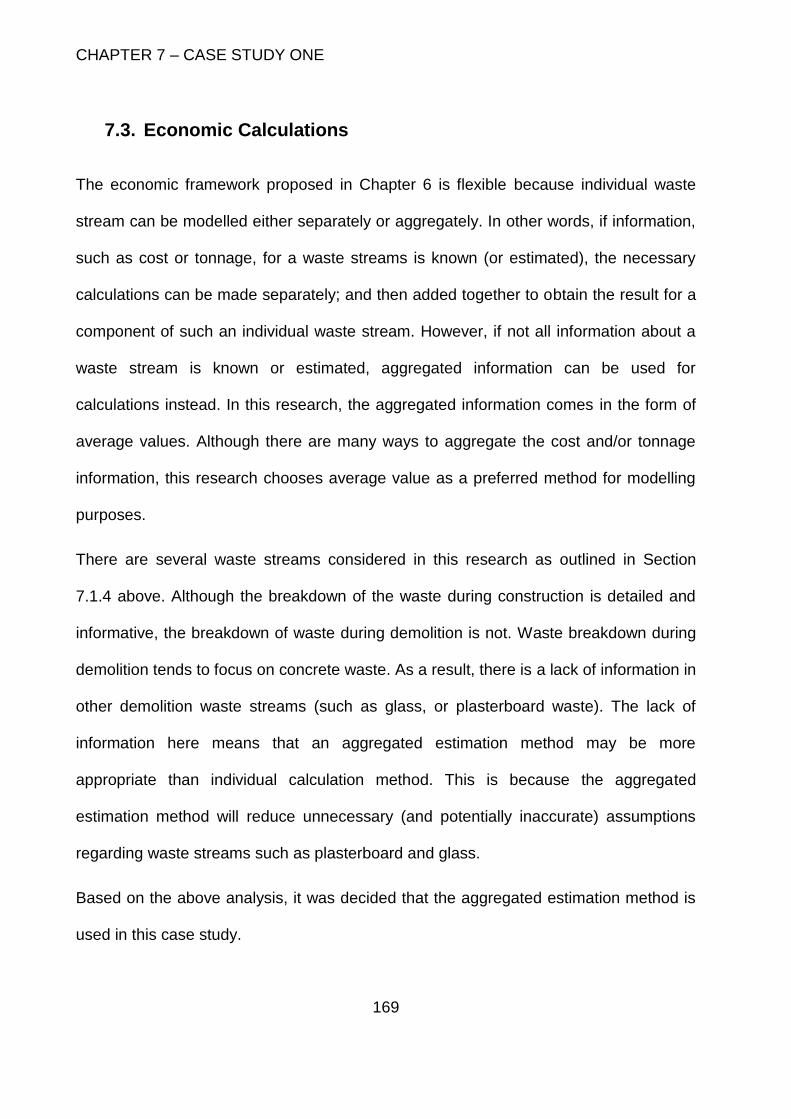
CHAPTER 7 – CASE STUDY ONE
169
7.3. Economic Calculations
The economic framework proposed in Chapter 6 is flexible because individual waste
stream can be modelled either separately or aggregately. In other words, if information,
such as cost or tonnage, for a waste streams is known (or estimated), the necessary
calculations can be made separately; and then added together to obtain the result for a
component of such an individual waste stream. However, if not all information about a
waste stream is known or estimated, aggregated information can be used for
calculations instead. In this research, the aggregated information comes in the form of
average values. Although there are many ways to aggregate the cost and/or tonnage
information, this research chooses average value as a preferred method for modelling
purposes.
There are several waste streams considered in this research as outlined in Section
7.1.4 above. Although the breakdown of the waste during construction is detailed and
informative, the breakdown of waste during demolition is not. Waste breakdown during
demolition tends to focus on concrete waste. As a result, there is a lack of information in
other demolition waste streams (such as glass, or plasterboard waste). The lack of
information here means that an aggregated estimation method may be more
appropriate than individual calculation method. This is because the aggregated
estimation method will reduce unnecessary (and potentially inaccurate) assumptions
regarding waste streams such as plasterboard and glass.
Based on the above analysis, it was decided that the aggregated estimation method is
used in this case study.
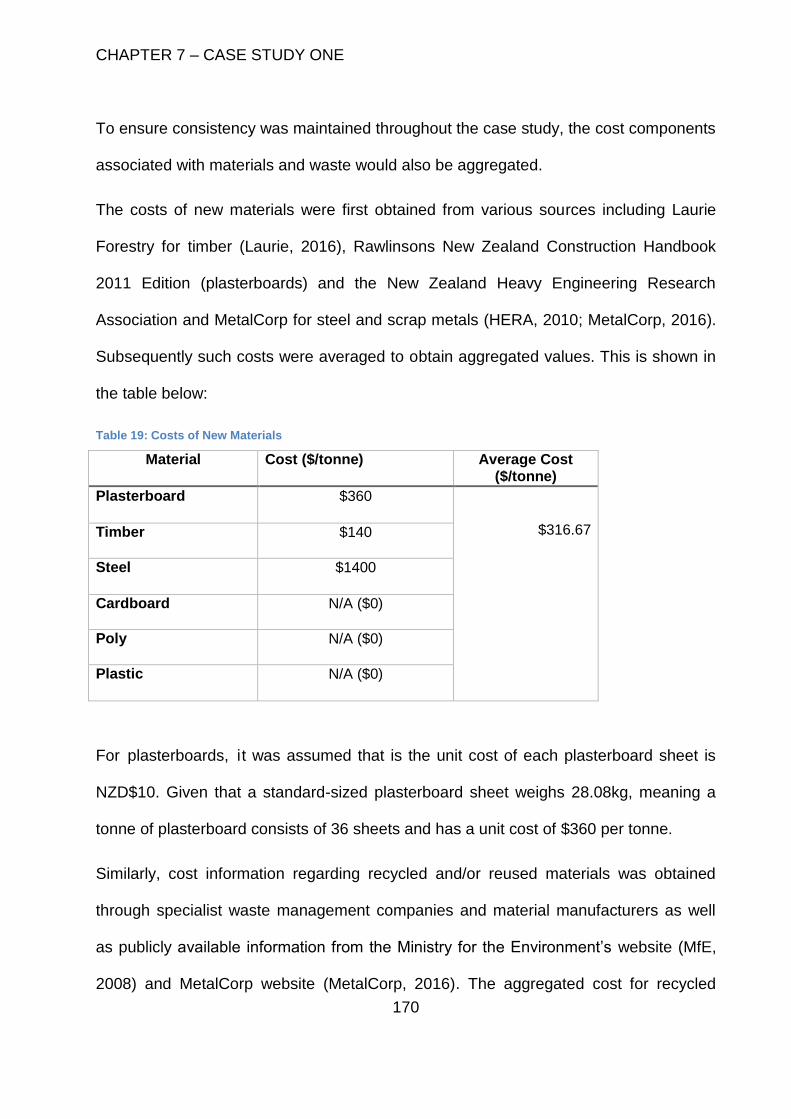
CHAPTER 7 – CASE STUDY ONE
170
To ensure consistency was maintained throughout the case study, the cost components
associated with materials and waste would also be aggregated.
The costs of new materials were first obtained from various sources including Laurie
Forestry for timber (Laurie, 2016), Rawlinsons New Zealand Construction Handbook
2011 Edition (plasterboards) and the New Zealand Heavy Engineering Research
Association and MetalCorp for steel and scrap metals (HERA, 2010; MetalCorp, 2016).
Subsequently such costs were averaged to obtain aggregated values. This is shown in
the table below:
Table 19: Costs of New Materials
Material Cost ($/tonne) Average Cost ($/tonne)
Plasterboard $360
$316.67
Timber $140
Steel $1400
Cardboard N/A ($0)
Poly N/A ($0)
Plastic N/A ($0)
For plasterboards, it was assumed that is the unit cost of each plasterboard sheet is
NZD$10. Given that a standard-sized plasterboard sheet weighs 28.08kg, meaning a
tonne of plasterboard consists of 36 sheets and has a unit cost of $360 per tonne.
Similarly, cost information regarding recycled and/or reused materials was obtained
through specialist waste management companies and material manufacturers as well
as publicly available information from the Ministry for the Environment’s website (MfE,
2008) and MetalCorp website (MetalCorp, 2016). The aggregated cost for recycled
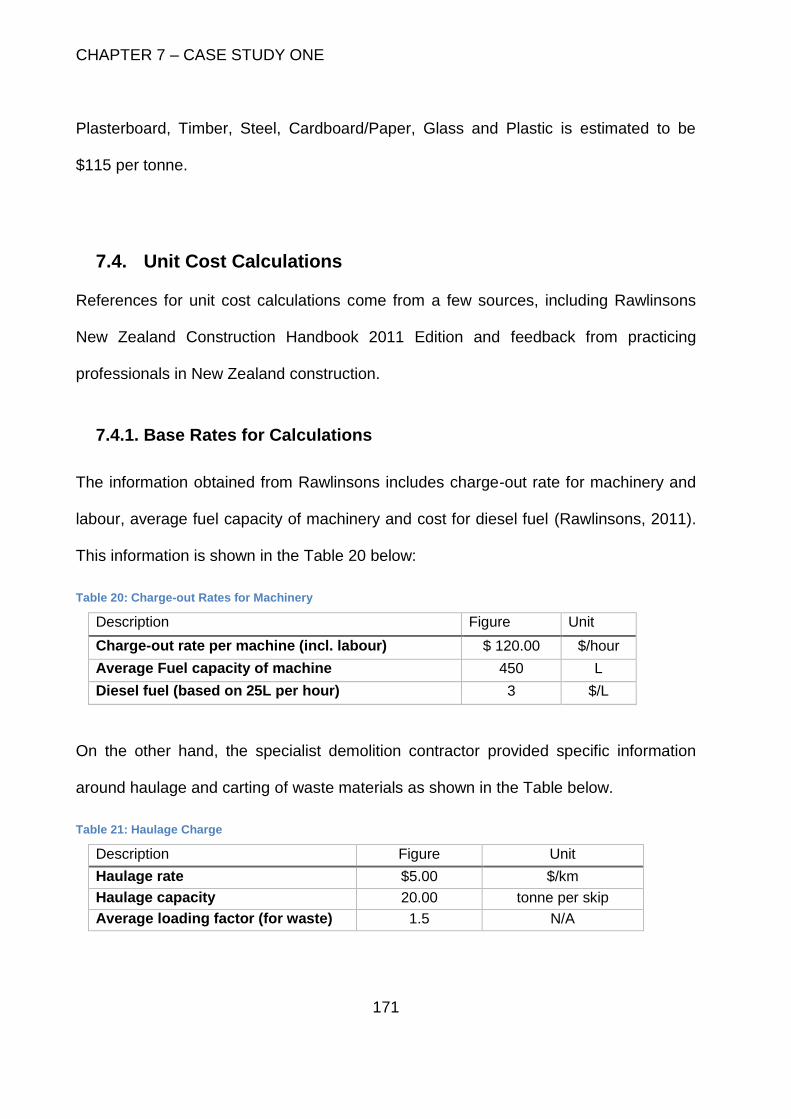
CHAPTER 7 – CASE STUDY ONE
171
Plasterboard, Timber, Steel, Cardboard/Paper, Glass and Plastic is estimated to be
$115 per tonne.
7.4. Unit Cost Calculations
References for unit cost calculations come from a few sources, including Rawlinsons
New Zealand Construction Handbook 2011 Edition and feedback from practicing
professionals in New Zealand construction.
7.4.1. Base Rates for Calculations
The information obtained from Rawlinsons includes charge-out rate for machinery and
labour, average fuel capacity of machinery and cost for diesel fuel (Rawlinsons, 2011).
This information is shown in the Table 20 below:
Table 20: Charge-out Rates for Machinery
Description Figure Unit
Charge-out rate per machine (incl. labour) $ 120.00 $/hour
Average Fuel capacity of machine 450 L
Diesel fuel (based on 25L per hour) 3 $/L
On the other hand, the specialist demolition contractor provided specific information
around haulage and carting of waste materials as shown in the Table below.
Table 21: Haulage Charge
Description Figure Unit
Haulage rate $5.00 $/km
Haulage capacity 20.00 tonne per skip
Average loading factor (for waste) 1.5 N/A
CHAPTER 7 – CASE STUDY ONE
172
From the information obtained from these two sources, several important unit costs
could be estimated. These unit costs are unit cost of waste collection, unit cost of
sorting waste, unit cost of recycling waste, unit cost of reusing waste and unit cost of
energy used. The following sections will discuss the derivations of these unit costs.
7.4.2. Unit Cost of Collecting Waste
In this research, Google Maps was used to track and estimate distances from the
construction site to various waste landfill and cleanfill sites. The research found that the
average distance travel from site to waste disposal sites (d) is 60 kilometres. Given the
haulage rate (hr) is $5 per kilometre and a loading factor (lf) of 1.5, the cost of haulage
per trip (H) is:
H = d x hr x lf = 60 (km) x 5 ($/km) x 1.5 = $450 ($)
Hence the unit cost of waste collection is (Uc) is a division of haulage cost per trip (H)
by the truck capacity (c), this gives:
Uc = 𝐻
𝑐=
$450
20 (𝑡𝑜𝑛𝑛𝑒𝑠) = $22.50 ($/tonne)
7.4.3. Unit Cost of Sorting Waste
To process 3530.11 tonnes of C&D waste in this project, this research assumes there
needs to be 15 machines (Ma) based on feedback from the waste management
contractor. These machines include trucks and specialised machinery that process
waste at landfill.
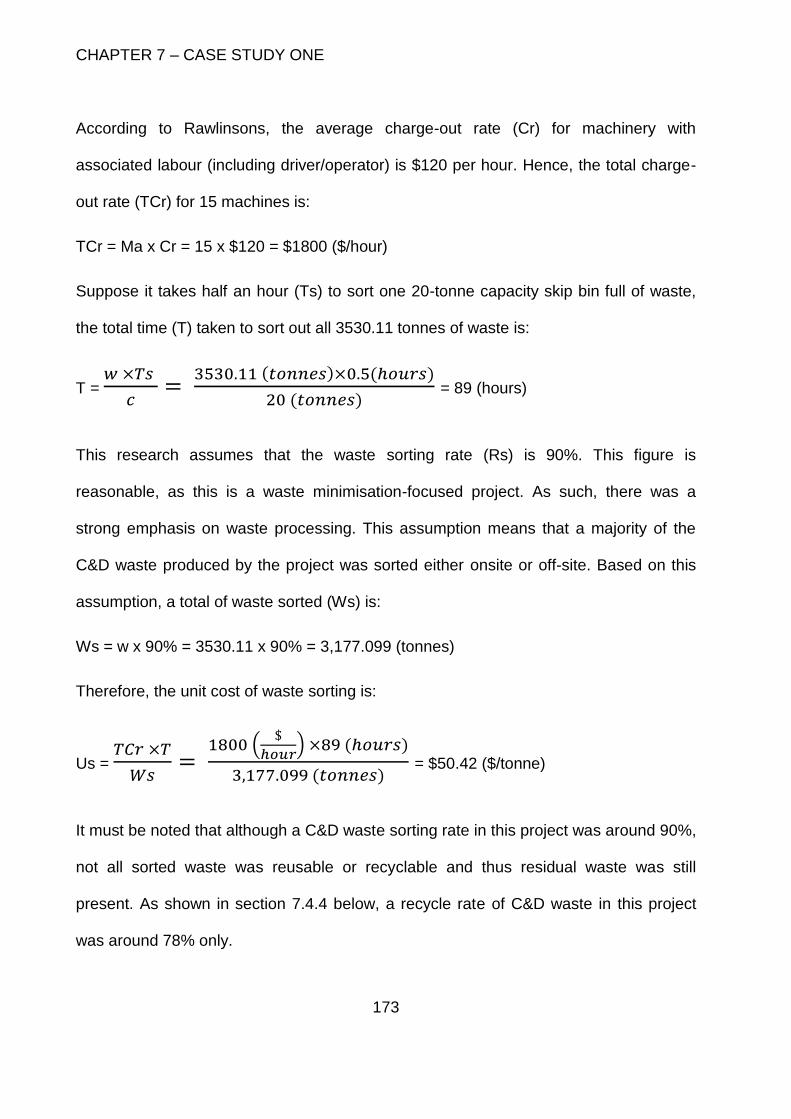
CHAPTER 7 – CASE STUDY ONE
173
According to Rawlinsons, the average charge-out rate (Cr) for machinery with
associated labour (including driver/operator) is $120 per hour. Hence, the total charge-
out rate (TCr) for 15 machines is:
TCr = Ma x Cr = 15 x $120 = $1800 ($/hour)
Suppose it takes half an hour (Ts) to sort one 20-tonne capacity skip bin full of waste,
the total time (T) taken to sort out all 3530.11 tonnes of waste is:
T = 𝑤 ×𝑇𝑠
𝑐=
3530.11 (𝑡𝑜𝑛𝑛𝑒𝑠)×0.5(ℎ𝑜𝑢𝑟𝑠)
20 (𝑡𝑜𝑛𝑛𝑒𝑠) = 89 (hours)
This research assumes that the waste sorting rate (Rs) is 90%. This figure is
reasonable, as this is a waste minimisation-focused project. As such, there was a
strong emphasis on waste processing. This assumption means that a majority of the
C&D waste produced by the project was sorted either onsite or off-site. Based on this
assumption, a total of waste sorted (Ws) is:
Ws = w x 90% = 3530.11 x 90% = 3,177.099 (tonnes)
Therefore, the unit cost of waste sorting is:
Us = 𝑇𝐶𝑟 ×𝑇
𝑊𝑠=
1800 ($
ℎ𝑜𝑢𝑟) ×89 (ℎ𝑜𝑢𝑟𝑠)
3,177.099 (𝑡𝑜𝑛𝑛𝑒𝑠) = $50.42 ($/tonne)
It must be noted that although a C&D waste sorting rate in this project was around 90%,
not all sorted waste was reusable or recyclable and thus residual waste was still
present. As shown in section 7.4.4 below, a recycle rate of C&D waste in this project
was around 78% only.
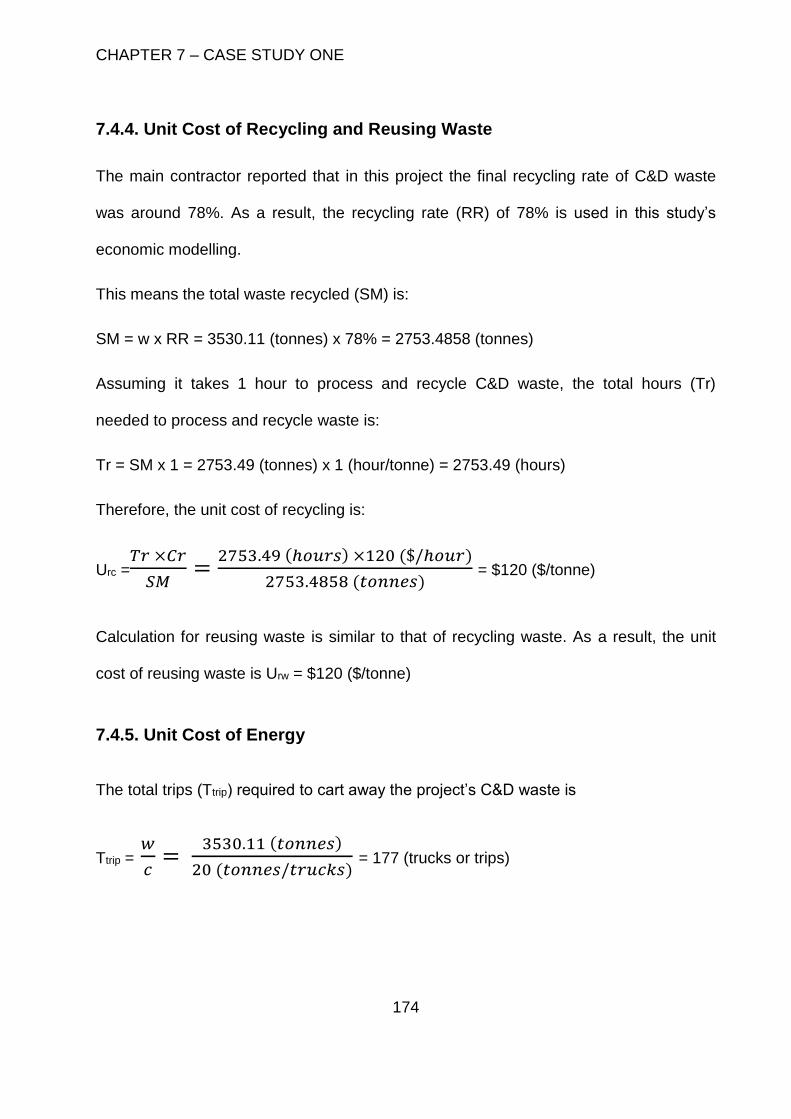
CHAPTER 7 – CASE STUDY ONE
174
7.4.4. Unit Cost of Recycling and Reusing Waste
The main contractor reported that in this project the final recycling rate of C&D waste
was around 78%. As a result, the recycling rate (RR) of 78% is used in this study’s
economic modelling.
This means the total waste recycled (SM) is:
SM = w x RR = 3530.11 (tonnes) x 78% = 2753.4858 (tonnes)
Assuming it takes 1 hour to process and recycle C&D waste, the total hours (Tr)
needed to process and recycle waste is:
Tr = SM x 1 = 2753.49 (tonnes) x 1 (hour/tonne) = 2753.49 (hours)
Therefore, the unit cost of recycling is:
Urc =𝑇𝑟 ×𝐶𝑟
𝑆𝑀=
2753.49 (ℎ𝑜𝑢𝑟𝑠) ×120 ($/ℎ𝑜𝑢𝑟)
2753.4858 (𝑡𝑜𝑛𝑛𝑒𝑠) = $120 ($/tonne)
Calculation for reusing waste is similar to that of recycling waste. As a result, the unit
cost of reusing waste is Urw = $120 ($/tonne)
7.4.5. Unit Cost of Energy
The total trips (Ttrip) required to cart away the project’s C&D waste is
Ttrip = 𝑤
𝑐=
3530.11 (𝑡𝑜𝑛𝑛𝑒𝑠)
20 (𝑡𝑜𝑛𝑛𝑒𝑠/𝑡𝑟𝑢𝑐𝑘𝑠) = 177 (trucks or trips)
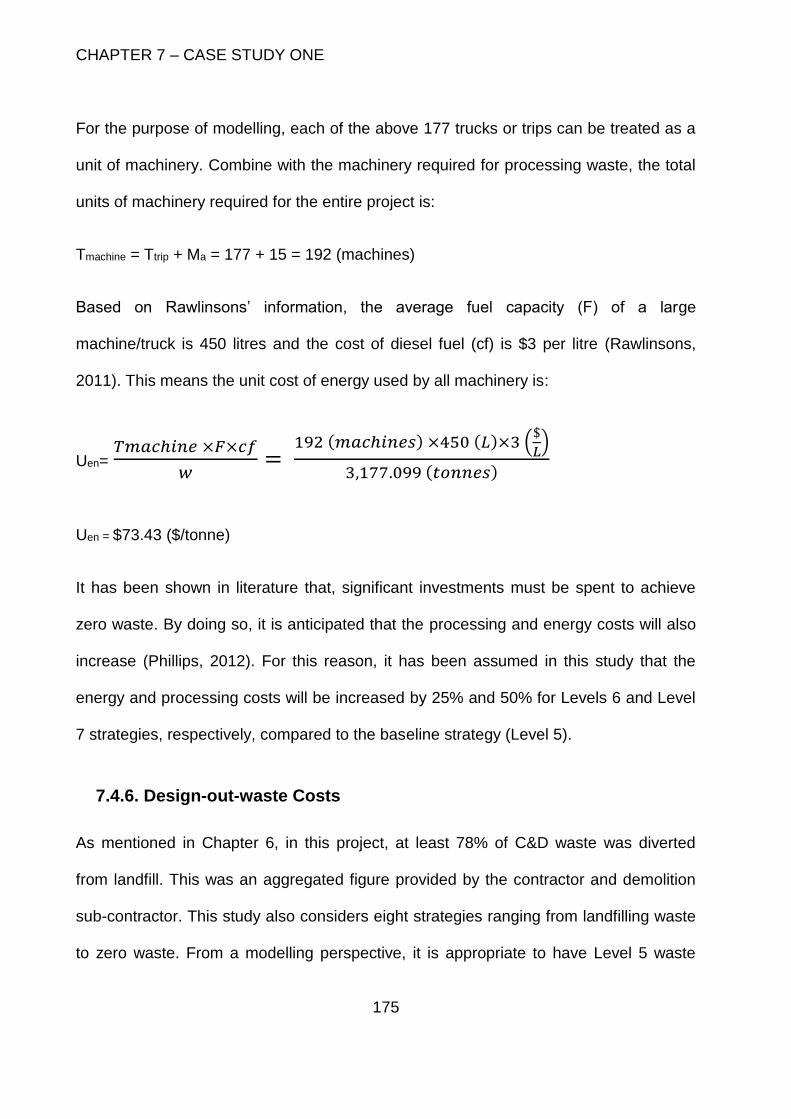
CHAPTER 7 – CASE STUDY ONE
175
For the purpose of modelling, each of the above 177 trucks or trips can be treated as a
unit of machinery. Combine with the machinery required for processing waste, the total
units of machinery required for the entire project is:
Tmachine = Ttrip + Ma = 177 + 15 = 192 (machines)
Based on Rawlinsons’ information, the average fuel capacity (F) of a large
machine/truck is 450 litres and the cost of diesel fuel (cf) is $3 per litre (Rawlinsons,
2011). This means the unit cost of energy used by all machinery is:
Uen= 𝑇𝑚𝑎𝑐ℎ𝑖𝑛𝑒 ×𝐹×𝑐𝑓
𝑤=
192 (𝑚𝑎𝑐ℎ𝑖𝑛𝑒𝑠) ×450 (𝐿)×3 ($
𝐿)
3,177.099 (𝑡𝑜𝑛𝑛𝑒𝑠)
Uen = $73.43 ($/tonne)
It has been shown in literature that, significant investments must be spent to achieve
zero waste. By doing so, it is anticipated that the processing and energy costs will also
increase (Phillips, 2012). For this reason, it has been assumed in this study that the
energy and processing costs will be increased by 25% and 50% for Levels 6 and Level
7 strategies, respectively, compared to the baseline strategy (Level 5).
7.4.6. Design-out-waste Costs
As mentioned in Chapter 6, in this project, at least 78% of C&D waste was diverted
from landfill. This was an aggregated figure provided by the contractor and demolition
sub-contractor. This study also considers eight strategies ranging from landfilling waste
to zero waste. From a modelling perspective, it is appropriate to have Level 5 waste
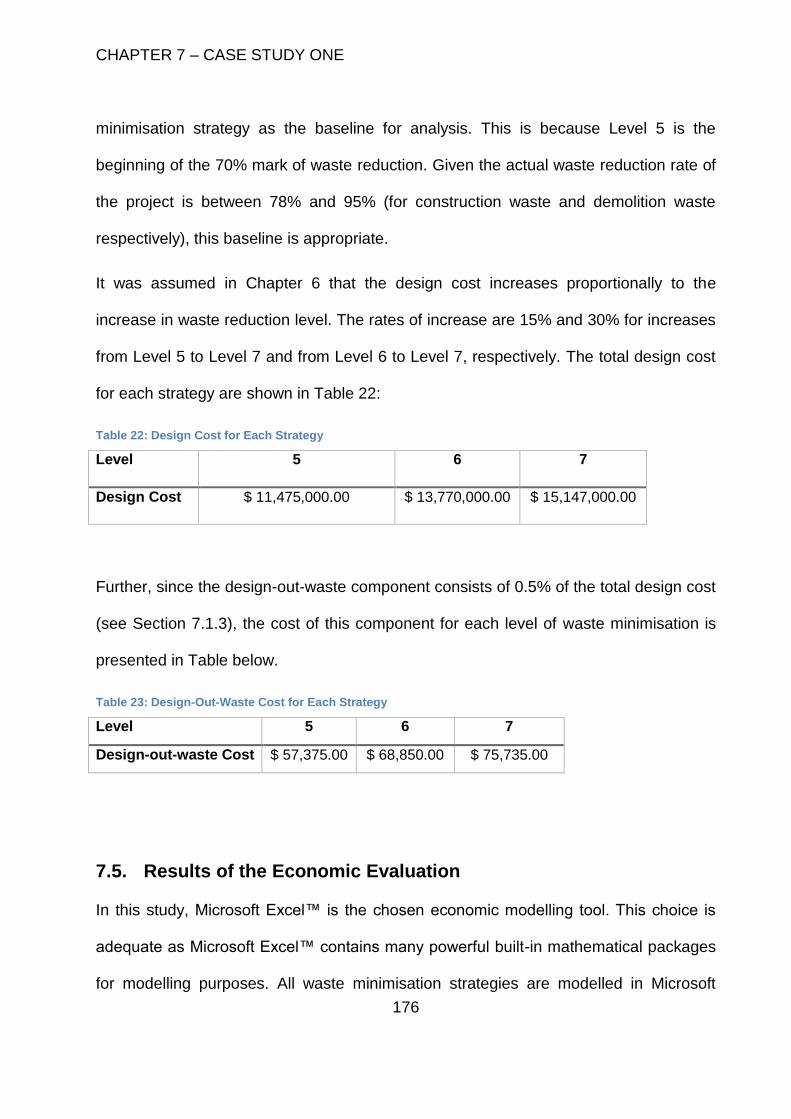
CHAPTER 7 – CASE STUDY ONE
176
minimisation strategy as the baseline for analysis. This is because Level 5 is the
beginning of the 70% mark of waste reduction. Given the actual waste reduction rate of
the project is between 78% and 95% (for construction waste and demolition waste
respectively), this baseline is appropriate.
It was assumed in Chapter 6 that the design cost increases proportionally to the
increase in waste reduction level. The rates of increase are 15% and 30% for increases
from Level 5 to Level 7 and from Level 6 to Level 7, respectively. The total design cost
for each strategy are shown in Table 22:
Table 22: Design Cost for Each Strategy
Level 5 6 7
Design Cost $ 11,475,000.00 $ 13,770,000.00 $ 15,147,000.00
Further, since the design-out-waste component consists of 0.5% of the total design cost
(see Section 7.1.3), the cost of this component for each level of waste minimisation is
presented in Table below.
Table 23: Design-Out-Waste Cost for Each Strategy
Level 5 6 7
Design-out-waste Cost $ 57,375.00 $ 68,850.00 $ 75,735.00
7.5. Results of the Economic Evaluation
In this study, Microsoft Excel™ is the chosen economic modelling tool. This choice is
adequate as Microsoft Excel™ contains many powerful built-in mathematical packages
for modelling purposes. All waste minimisation strategies are modelled in Microsoft
CHAPTER 7 – CASE STUDY ONE
177
Excel™. All modelling outputs are also analysed in Microsoft Excel™. This ensures the
consistency of the study.
With the all necessary unit costs established in the Section above, the economic
modelling framework can be used to evaluate the waste minimisation strategies.
In this case study, four waste minimisation strategies will be considered. They are Level
1 (disposing of waste to landfill); Level 5 (baseline analysis); Level 6 (minimising waste
by 71%-95%) and Level 7 (zero waste). The Level 5 waste minimisation strategy is the
baseline level for analysis as per discussion above. On the other hand, the inclusion of
Level 0 waste strategy is necessary for comparison purposes. By including Level 0
C&D waste strategy in the study, this research can compare the economics of landfilling
waste with the economics of other waste minimisation strategies.
Using the formulations established in Chapter 6, results for each strategy can be
obtained as shown in Table 24 below.
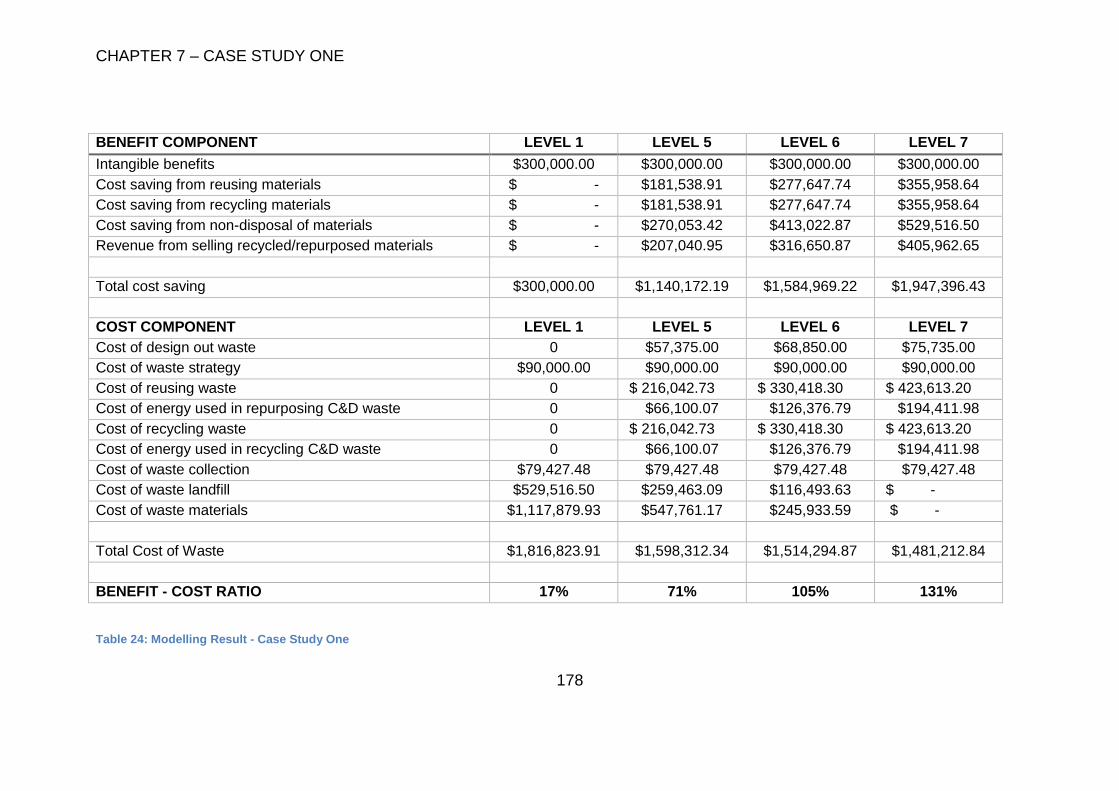
CHAPTER 7 – CASE STUDY ONE
178
BENEFIT COMPONENT LEVEL 1 LEVEL 5 LEVEL 6 LEVEL 7
Intangible benefits $300,000.00 $300,000.00 $300,000.00 $300,000.00
Cost saving from reusing materials $ - $181,538.91 $277,647.74 $355,958.64
Cost saving from recycling materials $ - $181,538.91 $277,647.74 $355,958.64
Cost saving from non-disposal of materials $ - $270,053.42 $413,022.87 $529,516.50
Revenue from selling recycled/repurposed materials $ - $207,040.95 $316,650.87 $405,962.65
Total cost saving $300,000.00 $1,140,172.19 $1,584,969.22 $1,947,396.43
COST COMPONENT LEVEL 1 LEVEL 5 LEVEL 6 LEVEL 7
Cost of design out waste 0 $57,375.00 $68,850.00 $75,735.00
Cost of waste strategy $90,000.00 $90,000.00 $90,000.00 $90,000.00
Cost of reusing waste 0 $ 216,042.73 $ 330,418.30 $ 423,613.20
Cost of energy used in repurposing C&D waste 0 $66,100.07 $126,376.79 $194,411.98
Cost of recycling waste 0 $ 216,042.73 $ 330,418.30 $ 423,613.20
Cost of energy used in recycling C&D waste 0 $66,100.07 $126,376.79 $194,411.98
Cost of waste collection $79,427.48 $79,427.48 $79,427.48 $79,427.48
Cost of waste landfill $529,516.50 $259,463.09 $116,493.63 $ -
Cost of waste materials $1,117,879.93 $547,761.17 $245,933.59 $ -
Total Cost of Waste $1,816,823.91 $1,598,312.34 $1,514,294.87 $1,481,212.84
BENEFIT - COST RATIO 17% 71% 105% 131%
Table 24: Modelling Result - Case Study One
CHAPTER 7 – CASE STUDY ONE
179
7.6. Analysis
This section provides detail analyses of the results obtained from the Section 7.5
above. Three areas that will be considered in this section:
1. The cost of waste versus the cost savings from waste minimisation
2. The cost effectiveness of waste minimisation via design-out-waste
3. The economic efficiencies of waste minimisation strategies
The first consideration is achieved by a direct comparison between the two key
components of a waste minimisation strategy, namely the monetised benefits
associated with a strategy versus the cost of implementing the corresponding strategy.
The second area involves a detailed analysis of the economic effects that design-out-
waste can have on a waste minimisation strategy. The analysis in this area covers
matters such as implications of design-out-waste in practice and potential issues
associated with its implementation.
Finally, the economic efficiencies of each waste minimisation strategy is weighed
against to provide a good understanding of the economic performance of each strategy.
This is achieved by means of a benefit-cost ratio (BCR). The benefit-cost analysis will
also help identify the waste minimisation rate which is considered the economically
optimal rate for the waste minimisation in this case study.
7.6.1. Basis of Comparison
In this research, efforts have been made by the researcher to ensure consistency is
maintained. For comparison purposes, necessary moderations in calculations were
made to make sure costs were compared to corresponding cost savings appropriately.
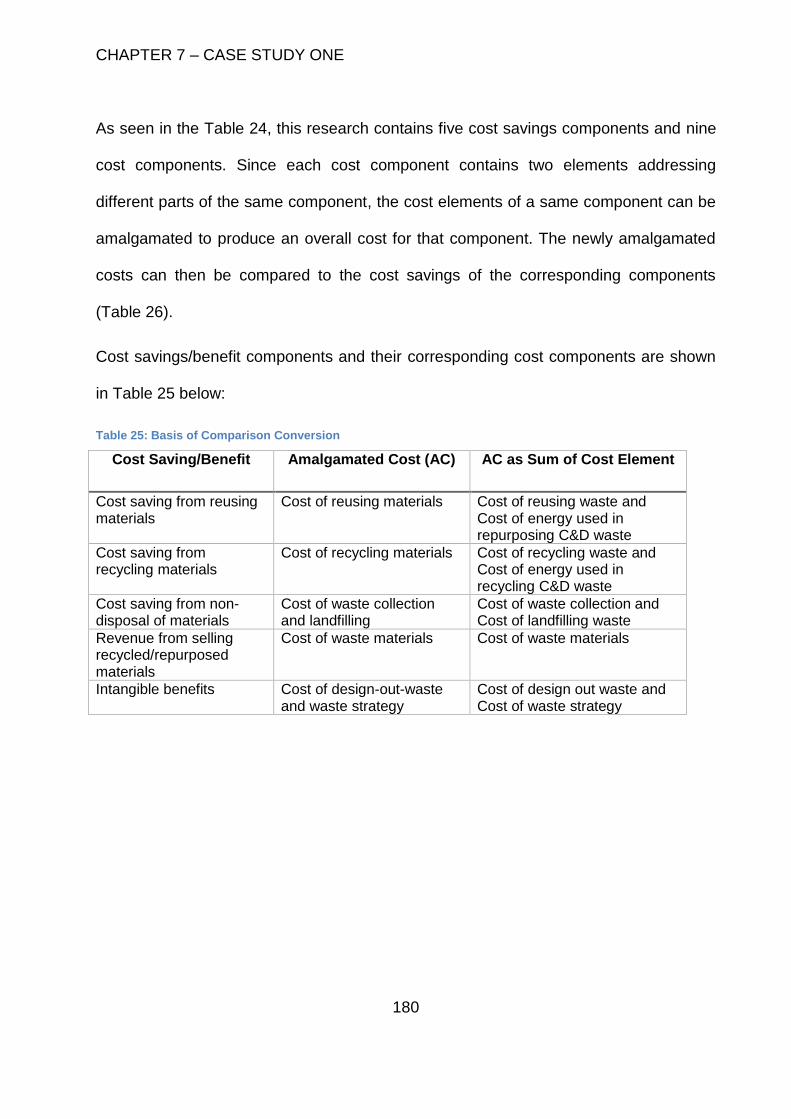
CHAPTER 7 – CASE STUDY ONE
180
As seen in the Table 24, this research contains five cost savings components and nine
cost components. Since each cost component contains two elements addressing
different parts of the same component, the cost elements of a same component can be
amalgamated to produce an overall cost for that component. The newly amalgamated
costs can then be compared to the cost savings of the corresponding components
(Table 26).
Cost savings/benefit components and their corresponding cost components are shown
in Table 25 below:
Table 25: Basis of Comparison Conversion
Cost Saving/Benefit Amalgamated Cost (AC) AC as Sum of Cost Element
Cost saving from reusing materials
Cost of reusing materials Cost of reusing waste and Cost of energy used in repurposing C&D waste
Cost saving from recycling materials
Cost of recycling materials Cost of recycling waste and Cost of energy used in recycling C&D waste
Cost saving from non-disposal of materials
Cost of waste collection and landfilling
Cost of waste collection and Cost of landfilling waste
Revenue from selling recycled/repurposed materials
Cost of waste materials Cost of waste materials
Intangible benefits Cost of design-out-waste and waste strategy
Cost of design out waste and Cost of waste strategy
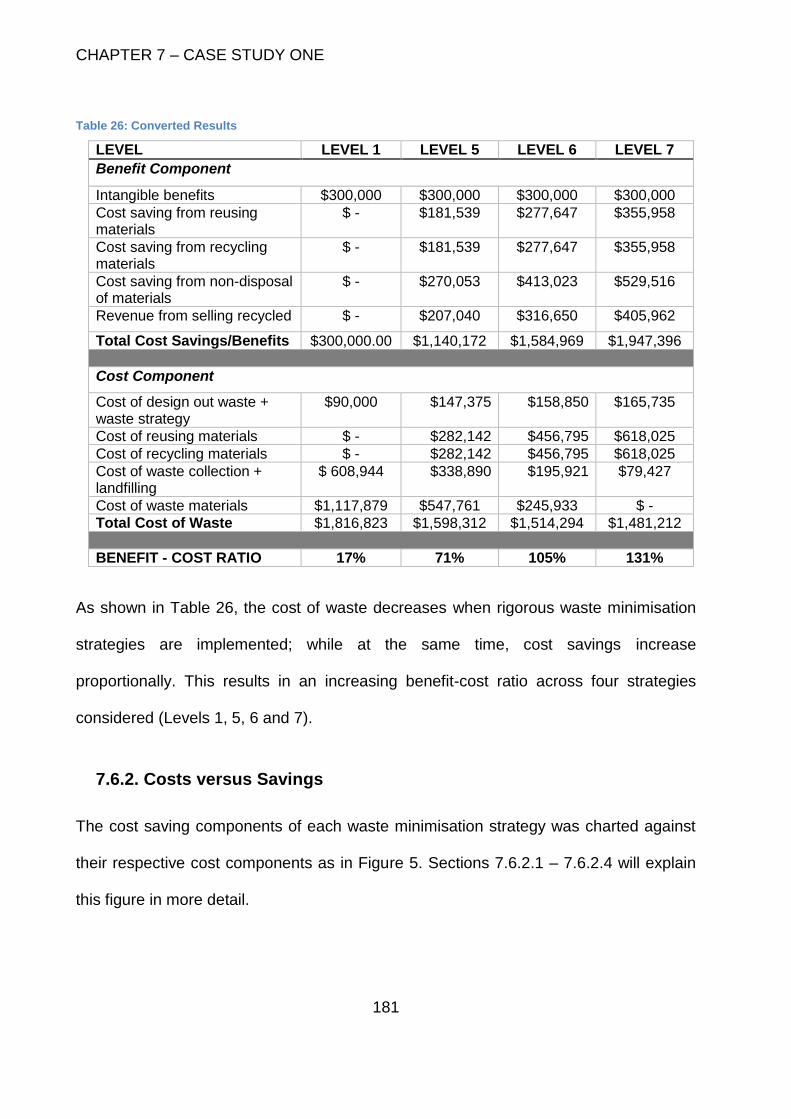
CHAPTER 7 – CASE STUDY ONE
181
Table 26: Converted Results
LEVEL LEVEL 1 LEVEL 5 LEVEL 6 LEVEL 7
Benefit Component
Intangible benefits $300,000 $300,000 $300,000 $300,000
Cost saving from reusing materials
$ - $181,539 $277,647 $355,958
Cost saving from recycling materials
$ - $181,539 $277,647 $355,958
Cost saving from non-disposal of materials
$ - $270,053 $413,023 $529,516
Revenue from selling recycled $ - $207,040 $316,650 $405,962
Total Cost Savings/Benefits $300,000.00 $1,140,172 $1,584,969 $1,947,396
Cost Component
Cost of design out waste + waste strategy
$90,000 $147,375 $158,850 $165,735
Cost of reusing materials $ - $282,142 $456,795 $618,025
Cost of recycling materials $ - $282,142 $456,795 $618,025
Cost of waste collection + landfilling
$ 608,944 $338,890 $195,921 $79,427
Cost of waste materials $1,117,879 $547,761 $245,933 $ -
Total Cost of Waste $1,816,823 $1,598,312 $1,514,294 $1,481,212
BENEFIT - COST RATIO 17% 71% 105% 131%
As shown in Table 26, the cost of waste decreases when rigorous waste minimisation
strategies are implemented; while at the same time, cost savings increase
proportionally. This results in an increasing benefit-cost ratio across four strategies
considered (Levels 1, 5, 6 and 7).
7.6.2. Costs versus Savings
The cost saving components of each waste minimisation strategy was charted against
their respective cost components as in Figure 5. Sections 7.6.2.1 – 7.6.2.4 will explain
this figure in more detail.
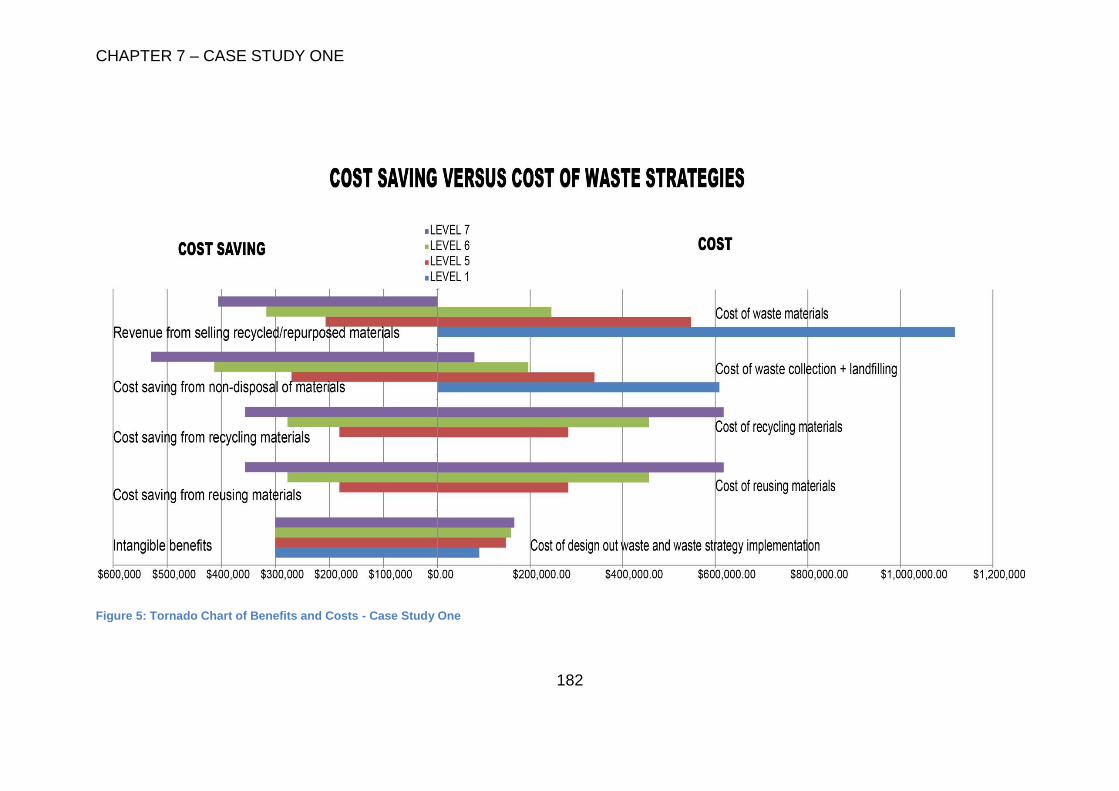
CHAPTER 7 – CASE STUDY ONE
182
Figure 5: Tornado Chart of Benefits and Costs - Case Study One
CHAPTER 7 – CASE STUDY ONE
183
7.6.2.1. Analysis of ‘Do-Nothing’ Waste Strategy (Level 1)
Generally, the cost of waste in Level 1 waste strategy is most significant among the four
waste strategies considered. Both ‘cost of waste materials’ and ‘cost of waste collection
and landfilling’ in this strategy remain highest among the four strategies considered.
At the same time, as C&D waste is being disposed of in landfill, there is no cost for
recycling and repurposing materials. Perhaps this is the only upside in this strategy.
Despite this, the total cost of waste for this strategy remains significantly high (second
only to the zero-waste strategy). This high cost of waste shows that this strategy may
not be cost effective for the client since it does not offer the client any potential benefits
like the other strategies can offer.
There is no cost saving offered to the client in this waste strategy because when the
client decides to send the waste materials to landfill, they have, in effect, buried any
potential cost savings that can be derived such ‘waste’. For instance, the client cannot
on-sell any processed materials to the secondary markets in this strategy in order to
offset the costs of purchasing the original materials.
A combination of a significantly high cost and low returns on investment shows that the
‘do-nothing’ strategy (Level 1) does not, and cannot, offer the client an economical
waste minimisation strategy.
From the economic perspective, this strategy is not economically sound. A benefit - cost
ratio of 17% shows Level 1 strategy can offer a relatively low level of economic
efficiency, thus potentially a low return on investment. Assuming the client is rational
and makes investments which maximises their utilities, from an economic perspective it
is likely that they would explore other alternatives before revisit this strategy.
CHAPTER 7 – CASE STUDY ONE
184
7.6.2.2. Analysis of Level 5 Waste Minimisation Strategy
As shown in Figure 5, the cost of waste materials for this strategy is slightly higher than
the potential revenues that can be derived from it. Unlike Level 1 strategy, the baseline
strategy offers the client more cost savings in all five benefit components. The cost
savings for four benefit components in this strategy (reuse, recycle, non-disposal and
resale) are $181,538.91, $181,538.91, $270,053.42 and $207,040.95. However, the
costs for the respective cost components remain higher than the cost savings for these
four components ($282,142.80, $282,142.80, $338,890.57 and $547,761.17,
respectively). The only exception to this rule is in the last component, where value of
intangible benefits is higher than that of the corresponding costs ($300,000.00
compared to $147,375.00).
Although the cost savings in this strategy are still modest, the higher values in benefit
compared to the Level 1 waste strategy show a significant improvement in terms of
values this strategy can offer to the client. Specifically, the baseline waste minimisation
strategy shows a high degree of economic efficiency with BCR equalling 71%,
compared to Level 1’s BCR of 17%. This means that economically this strategy
performs better than the Level 1 waste strategy.
7.6.2.3. Analysis of Level 6 Waste Minimisation Strategy
In this strategy, the levels of cost savings have improved significantly compared to the
two previous strategies. Apart from the reuse and recycle components, all three other
cost saving components show higher values than those in respective cost components.
This is because more waste is being diverted from landfill. As less waste end up in
landfills, the client pays less to dispose of waste there. Given that the cost of landfilling
is $150 per tonne, the client can save significant amount in this manner.
CHAPTER 7 – CASE STUDY ONE
185
As ‘waste’ is now becoming precursor materials for industrial processing, i.e.
‘resources’, it can be resold or traded in secondary markets to help recuperate some of
the costs the client has first paid for the materials.
The reason the costs of recycling and repurposing materials remain high is due to tow
reasons. First, as shown in Chapter 6, there is an assumption that the energy costs
associated with recycling operations at Level 6 waste minimisation strategy will
increase by 25% compared to those in Level 1 and Level 5 waste strategies. This
means that the energy costs in this strategy are much higher than those in previous
strategies.
Second, as waste minimisation strategies become more rigorous, more ‘potential
resources’ (previously known as ‘waste’) become available. That means there may be
an increase in demand to process and turn these ‘potential resources’ into usable
products. In turns, this means that the cost for recycling and repurposing operations
must increase accordingly. The combined effect of these two cost elements means that
the overall costs for processing waste remain high.
Despite the high processing costs, Level 6 waste minimisation strategy has shown a
significant economic efficiency; with the benefit-cost ratio remaining over 100%. This
high economic efficiency shows that even with a moderately high waste minimisation
rate (78%), the project has provided the client a significant value for money. It also
shows that it is worth undertaking a waste minimisation; but with waste minimisation
rate of at least 78% to ensure an appropriate level of returns on investment.
CHAPTER 7 – CASE STUDY ONE
186
7.6.2.4. Analysis of Zero Waste Strategy – Level 7
Zero waste is the ultimate waste minimisation strategy considered in this research. As
shown in the economic framework developed in this research, in this strategy 100% of
‘waste’ is utilised as ‘resources’ for further industrial processes. In other words, this
strategy achieves total efficiency in usage of all C&D materials.
To adhere to this ideal, the economic model for the zero waste strategy assumes a
waste reduction rate 100% for this strategy. This means in this strategy there is no
residual waste, as all ‘waste’ is recycled, reused or repurposed for other uses. Under
this assumption, the cost of waste materials is zero, since no material is wasted under
this strategy. Similarly, there is no cost of disposal, as no waste will end up in landfill.
The only cost that remains is the cost of collection, as there is still a need to collect the
waste (or new ‘resources’) for further industrial processing.
As in the case of Level 6 waste minimisation strategy, the cost of recycling and the cost
of reusing outweigh the corresponding benefits. This is mainly due to the increases in
both recycling/reusing costs and energy costs. As all ‘waste’ are now ‘resources’ which
need to be processed, the processing costs must increase significantly. At the same
time, under an assumption in Chapter 6, the energy cost associated with such industrial
operations also increase by 50% compared to that in Level 1 and Level 5 waste
strategy. Together, these two cost elements contribute to the significant increases in
recycling and reusing cost components of the zero waste strategy.
It can be observed from Figure 5 that the design cost for the zero waste strategy is
highest among all strategies considered. The high design cost here is due to two
elements: the time and effort required by designers to ensure no waste is generated;
CHAPTER 7 – CASE STUDY ONE
187
and the high cost of compliance associated with the rigorous waste minimisation
practices required by the zero-waste strategy.
In the first element, to achieve zero waste, it is anticipated that the design team
(including architects, engineers and contractors) must spend considerable time and
effort to design systems that generates no waste during construction. It is no doubt that
such a system, if it exists, would be highly complex. This time and effort spent on
design also means that the cost associated with design will likely increase.
Once the waste minimisation system is designed, it must be implemented in order to
achieve the ‘zero waste’ objective. It is contended that due to construction’s fragmented
nature, the implementation of such a system would be highly complicated. Therefore,
there will be a need for a rigorous implementation plan as well as associated
compliance strategy. This requirement means that the cost associated with a waste
minimisation strategy will likely increase as well.
However, the combined cost of these two elements is shown in Figure 5 to be relatively
low compared to their associated benefits, the monetised intangible benefits. This
means that despite the increases in design and compliance costs, the client can derive
much more significant values from the zero-waste strategy. In fact, this strategy has
shown to be the most economically efficient strategy, with BCR remaining well above
the 130% mark. The comparison of economic efficiencies between waste minimisation
strategies will be discussed in detail in Section 7.7.
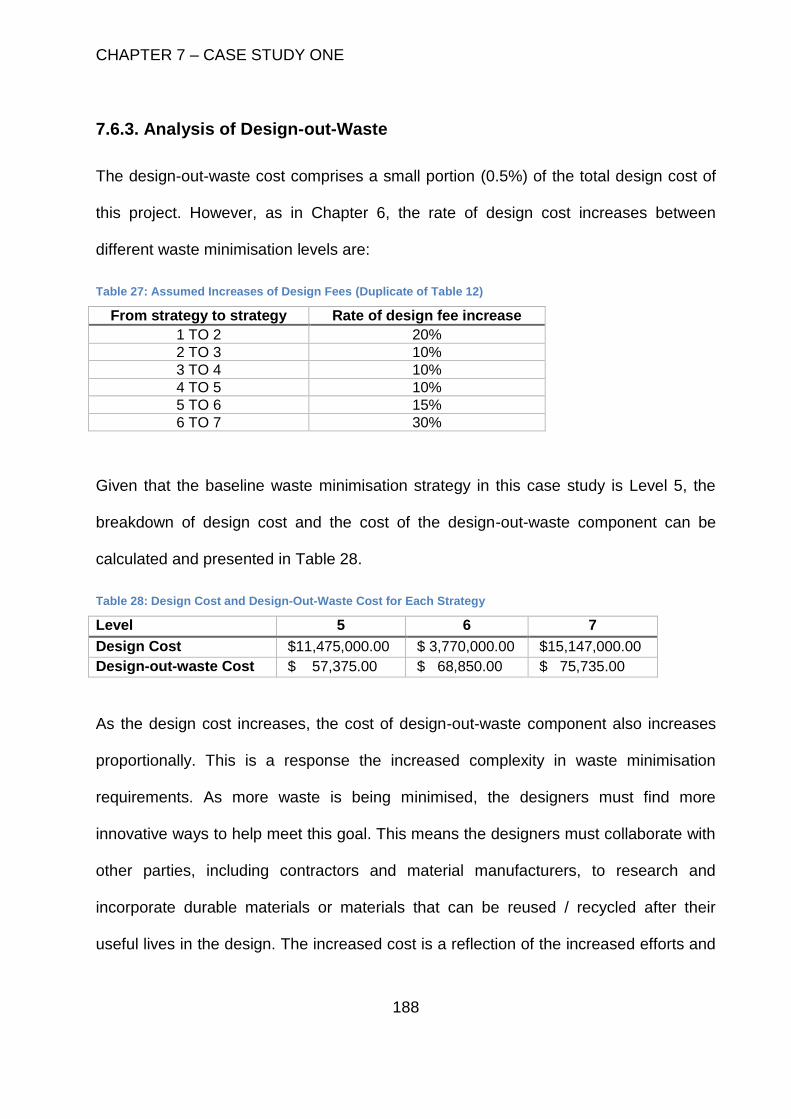
CHAPTER 7 – CASE STUDY ONE
188
7.6.3. Analysis of Design-out-Waste
The design-out-waste cost comprises a small portion (0.5%) of the total design cost of
this project. However, as in Chapter 6, the rate of design cost increases between
different waste minimisation levels are:
Table 27: Assumed Increases of Design Fees (Duplicate of Table 12)
From strategy to strategy Rate of design fee increase
1 TO 2 20%
2 TO 3 10%
3 TO 4 10%
4 TO 5 10%
5 TO 6 15%
6 TO 7 30%
Given that the baseline waste minimisation strategy in this case study is Level 5, the
breakdown of design cost and the cost of the design-out-waste component can be
calculated and presented in Table 28.
Table 28: Design Cost and Design-Out-Waste Cost for Each Strategy
Level 5 6 7
Design Cost $11,475,000.00 $ 3,770,000.00 $15,147,000.00
Design-out-waste Cost $ 57,375.00 $ 68,850.00 $ 75,735.00
As the design cost increases, the cost of design-out-waste component also increases
proportionally. This is a response the increased complexity in waste minimisation
requirements. As more waste is being minimised, the designers must find more
innovative ways to help meet this goal. This means the designers must collaborate with
other parties, including contractors and material manufacturers, to research and
incorporate durable materials or materials that can be reused / recycled after their
useful lives in the design. The increased cost is a reflection of the increased efforts and
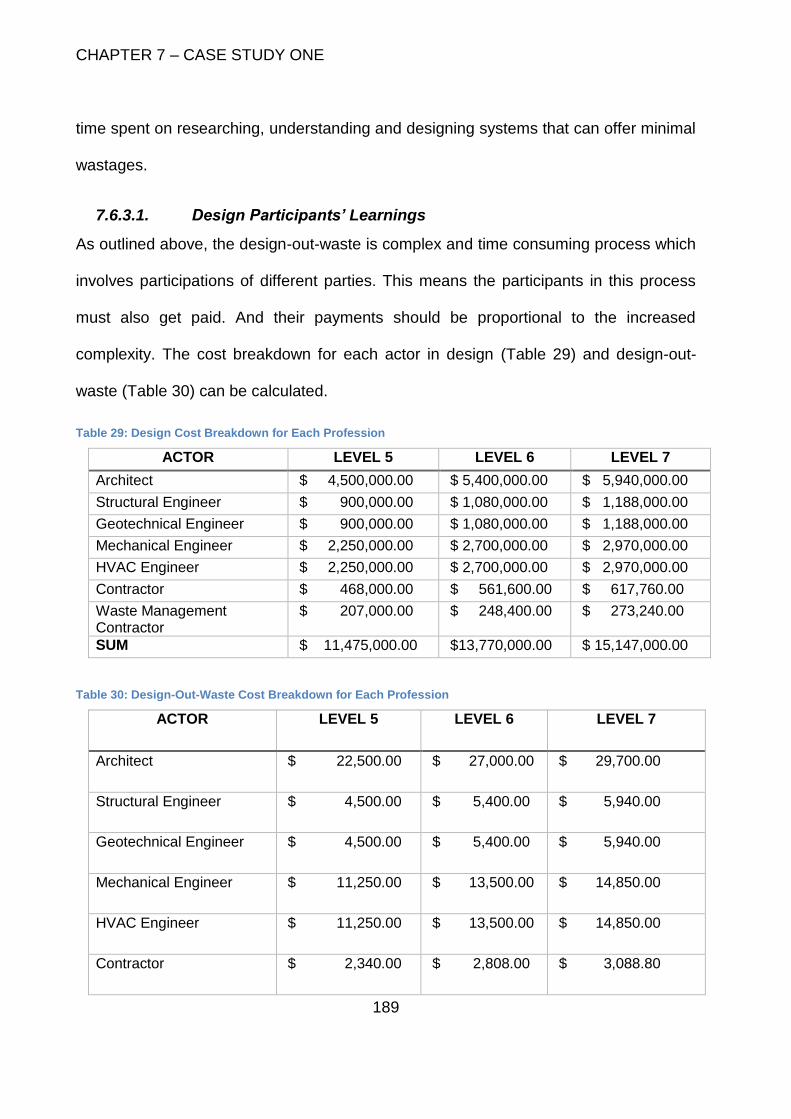
CHAPTER 7 – CASE STUDY ONE
189
time spent on researching, understanding and designing systems that can offer minimal
wastages.
7.6.3.1. Design Participants’ Learnings
As outlined above, the design-out-waste is complex and time consuming process which
involves participations of different parties. This means the participants in this process
must also get paid. And their payments should be proportional to the increased
complexity. The cost breakdown for each actor in design (Table 29) and design-out-
waste (Table 30) can be calculated.
Table 29: Design Cost Breakdown for Each Profession
ACTOR LEVEL 5 LEVEL 6 LEVEL 7
Architect $ 4,500,000.00 $ 5,400,000.00 $ 5,940,000.00
Structural Engineer $ 900,000.00 $ 1,080,000.00 $ 1,188,000.00
Geotechnical Engineer $ 900,000.00 $ 1,080,000.00 $ 1,188,000.00
Mechanical Engineer $ 2,250,000.00 $ 2,700,000.00 $ 2,970,000.00
HVAC Engineer $ 2,250,000.00 $ 2,700,000.00 $ 2,970,000.00
Contractor $ 468,000.00 $ 561,600.00 $ 617,760.00
Waste Management Contractor
$ 207,000.00 $ 248,400.00 $ 273,240.00
SUM $ 11,475,000.00 $13,770,000.00 $ 15,147,000.00
Table 30: Design-Out-Waste Cost Breakdown for Each Profession
ACTOR LEVEL 5 LEVEL 6 LEVEL 7
Architect $ 22,500.00 $ 27,000.00 $ 29,700.00
Structural Engineer $ 4,500.00 $ 5,400.00 $ 5,940.00
Geotechnical Engineer $ 4,500.00 $ 5,400.00 $ 5,940.00
Mechanical Engineer $ 11,250.00 $ 13,500.00 $ 14,850.00
HVAC Engineer $ 11,250.00 $ 13,500.00 $ 14,850.00
Contractor $ 2,340.00 $ 2,808.00 $ 3,088.80
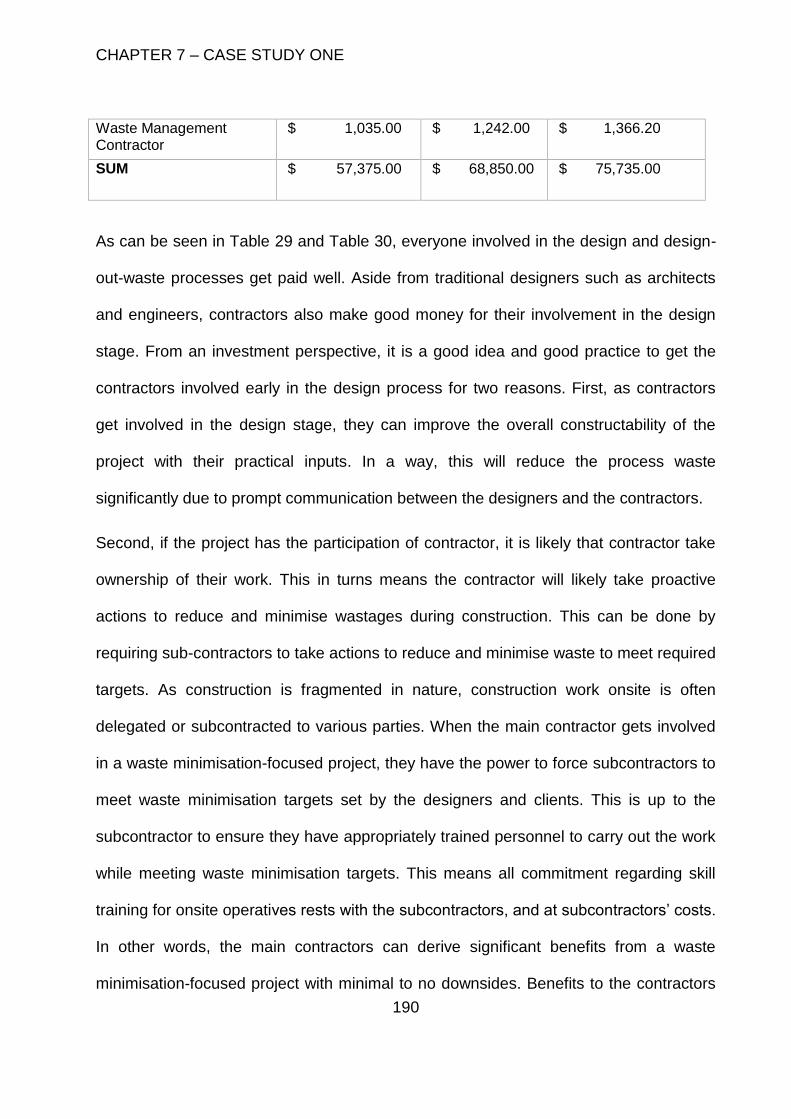
CHAPTER 7 – CASE STUDY ONE
190
Waste Management Contractor
$ 1,035.00 $ 1,242.00 $ 1,366.20
SUM $ 57,375.00 $ 68,850.00 $ 75,735.00
As can be seen in Table 29 and Table 30, everyone involved in the design and design-
out-waste processes get paid well. Aside from traditional designers such as architects
and engineers, contractors also make good money for their involvement in the design
stage. From an investment perspective, it is a good idea and good practice to get the
contractors involved early in the design process for two reasons. First, as contractors
get involved in the design stage, they can improve the overall constructability of the
project with their practical inputs. In a way, this will reduce the process waste
significantly due to prompt communication between the designers and the contractors.
Second, if the project has the participation of contractor, it is likely that contractor take
ownership of their work. This in turns means the contractor will likely take proactive
actions to reduce and minimise wastages during construction. This can be done by
requiring sub-contractors to take actions to reduce and minimise waste to meet required
targets. As construction is fragmented in nature, construction work onsite is often
delegated or subcontracted to various parties. When the main contractor gets involved
in a waste minimisation-focused project, they have the power to force subcontractors to
meet waste minimisation targets set by the designers and clients. This is up to the
subcontractor to ensure they have appropriately trained personnel to carry out the work
while meeting waste minimisation targets. This means all commitment regarding skill
training for onsite operatives rests with the subcontractors, and at subcontractors’ costs.
In other words, the main contractors can derive significant benefits from a waste
minimisation-focused project with minimal to no downsides. Benefits to the contractors
CHAPTER 7 – CASE STUDY ONE
191
can be tangible and intangible. Tangible benefits come from earnings from design, free
training in waste minimisation while intangible benefits come from marketing exposures
and improved reputation. This is means the contractor can get more benefits from a
waste minimisation project compared to a non-waste-focused project of a similar
construction price. From an economic perspective, the contractor would be willing to get
involved in, and committed to, a waste minimisation-focused building project.
7.6.3.2. Cost Implications to the Client
From the client’s perspective, the investment in design can offer significant potential
pay-offs. Having a good design with thorough considerations for waste can result in
fewer materials are being wasted in a project. This allows to the client to receive
significant cost savings (as in the case of Level 6 and Level 7 strategies). At the same
time, the client can get significant ‘soft’ benefits such as improved reputation and
marketing. Although it can be difficult to quantify these ‘soft’ or intangible benefits, they
exist and are of value to the client.
Despite the fact that the design and design-out-waste costs can increase depending on
the types of waste minimisation strategy, given the significant benefits that the client
can get from the project, such increased costs will unlikely deter the client from a waste
minimisation/zero waste strategy.
7.7. Benefit-Cost Analysis
Benefit-Cost Ratio (BCR) of each strategy is essentially the ratios of total monetised
benefits and total costs. BCR assesses the economic efficiency of a strategy. In other
words, it measures how returns on an investment weigh against the associated costs.
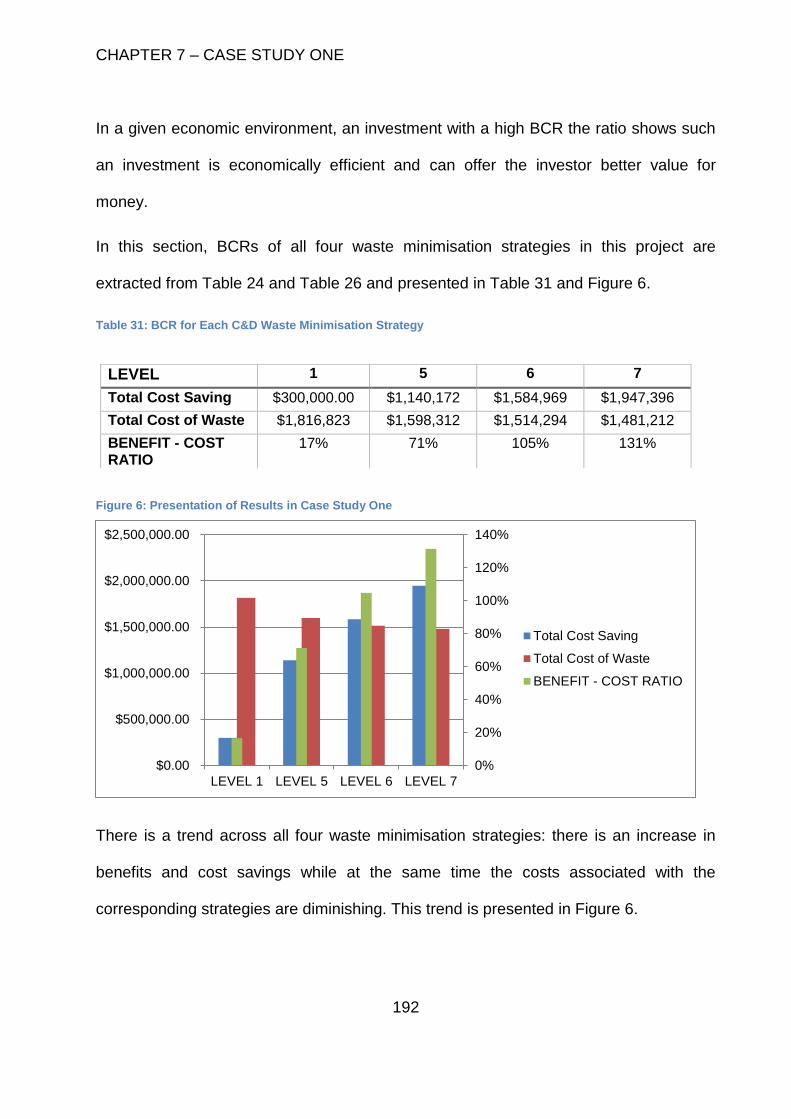
CHAPTER 7 – CASE STUDY ONE
192
In a given economic environment, an investment with a high BCR the ratio shows such
an investment is economically efficient and can offer the investor better value for
money.
In this section, BCRs of all four waste minimisation strategies in this project are
extracted from Table 24 and Table 26 and presented in Table 31 and Figure 6.
Table 31: BCR for Each C&D Waste Minimisation Strategy
Figure 6: Presentation of Results in Case Study One
There is a trend across all four waste minimisation strategies: there is an increase in
benefits and cost savings while at the same time the costs associated with the
corresponding strategies are diminishing. This trend is presented in Figure 6.
0%
20%
40%
60%
80%
100%
120%
140%
$0.00
$500,000.00
$1,000,000.00
$1,500,000.00
$2,000,000.00
$2,500,000.00
LEVEL 1 LEVEL 5 LEVEL 6 LEVEL 7
Total Cost Saving
Total Cost of Waste
BENEFIT - COST RATIO
LEVEL 1 5 6 7
Total Cost Saving $300,000.00 $1,140,172 $1,584,969 $1,947,396
Total Cost of Waste $1,816,823 $1,598,312 $1,514,294 $1,481,212
BENEFIT - COST RATIO
17% 71% 105% 131%
CHAPTER 7 – CASE STUDY ONE
193
This inverse relationship between benefit and cost has resulted in the increases in
BCRs from Level 1 strategy to Level 7 strategy.
7.7.1. BCR of Level 1
Of the four strategies under consideration, waste strategy Level 1 offers the lowest BCR
of 17%. This strategy has the highest cost of waste but with the lowest benefits offered
to client. From an investment perspective, this strategy has a low level of economic
efficiency and as such it is unlikely to be implemented.
7.7.2. BCR of Level 5
The baseline waste minimisation strategy of this case study is of a relatively high order
in all waste strategies considered in this research (Level 5). This means under this
strategy, at least 51% of C&D waste must be reduced and diverted from landfill. This is
a significant waste minimisation requirement and thus has required a significant level of
investments in design and implementation. Due to a relatively high level of investment it
has received, the baseline waste minimisation strategy has achieved a high degree of
economic efficiency. The BCR of this strategy equals 71%. Overall, this strategy has a
relatively low energy cost compared to Level 6 and Level 7 strategies. However, the
costs associated with waste disposal and material waste remain higher than those of
Level 6 and Level 7 strategies. Nevertheless, this strategy may still be worth
considering, given its high economic efficiency level.
CHAPTER 7 – CASE STUDY ONE
194
7.7.3. BCR of Level 6 and Level 7
Both Level 6 and Level 7 waste minimisation strategies can offer the client total
efficiency (105% and 131%, respectively). In other words, these strategies can provide
the client a significant value for money. It is thus worth comparing the Level 6 waste
minimisation strategy and the Level 7 zero waste strategy. This comparison is useful
because it can help identify an optimal waste minimisation strategy for this case.
Overall, Level 6 has a much lower cost in four main cost categories than the zero waste
strategy. These categories are design-out-waste, recycling, reusing and energy used in
processing waste. However, since Level 6 strategy can only reduce 78% of C&D waste,
there is still a significant wastage present in this strategy. This in turns means that the
costs associated with waste disposal and material waste in Level 6 strategy is much
higher than those in the zero waste strategy. In fact it is these high cost components
that have contributed to the higher overall cost of Level 6 compared to that of Level 7.
In a zero waste strategy there is no cost of disposal, as all ‘waste’ is now ‘resources’ for
industrial processing; thus eliminating the need to dispose of waste to landfills. At the
same time, the client also achieves significant increases in cost savings due to this
elimination. The net effect of decreased costs and improved benefits is the BRC under
this strategy has increased significantly (131% compared to 105% in Level 6 strategy).
This sharp increase in BCR is due to the aggressive steps taken in minimising waste
streams.
However, zero waste is an idealised concept and it is impossible to achieve total
elimination of waste. As such, in reality the Level 7 waste minimisation is impractical
despite its high economic efficiency yielding. On the other hand, Level 6 waste
CHAPTER 7 – CASE STUDY ONE
195
minimisation is achievable, and has been achieved in this actual case study. As both
strategies give the client total economic efficiency, and Level 6 is more achievable than
its contemporary Level 7, it is contended in this research that the Level 6 waste
minimisation is the optimal strategy for this case study.
Therefore, it can be argued that it is worth undertaking a waste minimisation in this
case; but the waste minimisation rate must be at least 78% to ensure an appropriate
level of returns on investment.
7.8. Findings
7.8.1. Waste Strategy Level 1 – Landfilling
From the analysis sections, there is little value to the client in disposing of C&D waste to
landfill. By sending waste to landfill, the client gets little economic benefit. The only
benefit to the client in this strategy is savings on labour cost on site from waste
segregation. However, they are still liable for a cost for disposing of such waste,
meaning the client ends up paying twice for the same material. Initially they must pay
for the new and virgin materials for the construction of the building. Then once some of
the new materials is demoted to ‘waste’ during the construction process, the client must
pay a fee to dispose of this waste.
Further, as landfill charges get more expensive, it makes the practice of disposing of
waste an expensive option. At a landfill charge of $150 per tonne, it has been shown
that the disposal costs become a major cost component in the project. Due to this fact,
the client should start to look for approaches to reduce the C&D waste output.
CHAPTER 7 – CASE STUDY ONE
196
7.8.2. Waste Minimisation Levels 6 and 7
Unlike the ‘landfill’ option, the client can get significant economic advantages from
higher level ‘waste minimisation’ strategies (Levels 6 and 7). These advantages include
opportunities to save on materials (as limited wastages occur, and end up, in landfills
under these strategies); opportunities to save on transportation costs (as materials can
be delivered on demand, and minimal dumping trucks required under these strategies);
and opportunity to on-sell the excess materials to secondary markets.
In addition, under these strategies, the client has an opportunity to engage closely with
other stakeholders such as architects, engineers and contractors to manage and
minimise waste. These collaborations can be explicitly expressed via penalty/incentive
schemes to encourage the stakeholders to uptake waste management practices
throughout the project. Since money is an important economic driver in construction, by
having such a scheme could significantly increase the success rates of a waste
management programme (Tam & Tam, 2008). It has been argued by Tam & Tam
(2008) that an introduction of a penalty/incentive scheme can enhance the chance of
achieving the project’s waste minimisation goals. However, this study does not explore
this avenue since it lies outside the scope of the study for the reasons outlined in
Chapter 5. Instead, it has been shown in the analysis above that minimisation and zero
waste strategies are viable and more economically more efficient than the ‘do-nothing’
strategy, i.e. landfilling waste.
Nevertheless, it has been observed by the researcher that the implementation of a
penalty/incentive scheme will likely require a robust contractual agreement between
project partners as well as a comprehensive waste management/waste minimisation
CHAPTER 7 – CASE STUDY ONE
197
plan. This means such a penalty/incentive scheme, if introduced, may increase the cost
component significantly compared to the ‘landfill’ strategy. But as shown in the analysis
above, the economic benefits offered by the ‘waste minimisation’ and ‘zero waste’
strategies can outweigh the additional administrative costs of a waste minimisation
strategy. As such, there may be room to include a penalty/incentive scheme. However,
since this area is outside the scope of the study, there is no way to confirm or deny this
observation. This is indeed an opportunity for subsequent research to explore.
Aside from the direct economic benefits that the client can derived from waste
minimisation and zero waste strategies, the client can also obtain many intangible
benefits from having ‘waste minimisation’ and ‘zero waste’ strategies in their projects.
These include opportunities to improve their reputations and credentials, thus
increasing the opportunities to market their brand/image. In turns, the project creates an
opportunity to increase the value for the education provider via highly competitive
rentals to tenants. Further, the client representative has advised that the development
of this education building has contributed significantly to the increased morale and
productivity of staff and students.
As previously noted in Chapter 6, for the purpose of this study, an assumption on the
value of intangible benefits of ‘waste minimisation’ and ‘zero waste’ strategies has been
made. Specifically, the intangible benefits that the client gets from these strategies are
assumed to be $300,000.
As shown in Section 7.7.3, with such a conservative value for the intangible benefits,
the client can achieve high levels of economic efficiency. Therefore, it can be concluded
that there are indeed values in minimising the C&D waste in this case study.
CHAPTER 7 – CASE STUDY ONE
198
Specifically, both Level 6 waste minimisation and the Level 7 zero waste strategies can
offer the client total economic efficiencies. This means the client has imperatives to
implement either of these options. However, it has been argued in the analysis section
that perhaps Level 6 waste minimisation strategy is the optimal option for the client.
Therefore, the research recommends the client to choose this option.
7.8.3. Implications of landfill charge variable
The analyses above have also shown the variable ‘landfill charges’ can have a
significant influence on the management or minimisation strategies of C&D waste. By
setting the landfill charges at $150 per tonne, this study has observed major impacts
this variable has on both the cost incurred, and the benefits gained, by the client. This is
because landfill charges increase, it becomes more expensive to dispose of waste.
At the same time, the client is incentivised to manage and minimise such waste due to
the significant economic benefit potentials offered by such practices, including, but not
limited to cost-savings and resale of excess materials. In this sense, the variable ‘landfill
charges’ has a positive influence on the benefits obtained by the client from their waste
management/waste minimisation strategies. This finding is important because it
confirms the long-held belief in the New Zealand construction industry that increasing
landfill charges will induce behavioural change in the industry regarding its waste
minimisation.
7.8.4. Limitation
Through this case study, the research has demonstrated that the proposed framework
could be used to evaluate the economics of a range of C&D waste.
CHAPTER 7 – CASE STUDY ONE
199
However, the weakness of this study is it currently focuses on only one fixed area:
landfill fee of $150 per tonne of waste. This makes this study one-dimensional. There
are many factors that can have significant effects on the success of a waste
minimisation strategy. Further, many of such factors are interlinked or inter-related.
Thus, by making ‘landfill fees’ the one key focus, this study does not, and cannot,
exhibit the true extend of the problem related to C&D waste minimisation in New
Zealand. However, this chosen paradigm is necessary given the limited time and scope
imposed on the study reported in this thesis. Subsequent studies can be carried out to
establish other variables that have significant effects on the success of a waste
minimisation strategy. This will help the industry to understand these variables better
and how they can affect a zero waste aspiration in NZ construction.
7.9. Operatives in C&D Waste Minimisation
It is contended that everyone involved in the project has an important role to play to
ensure a waste minimisation strategy meets its intended objectives. This section briefly
discusses the roles and responsibilities of key participants. Although the focus of the
discussion rests on the design phase, their respective responsibilities also extend to the
construction and operation stages.
7.9.1. Client and Project Manager (client side)
These parties are owner of the building and the representative of owner, respectively.
They have the interest of the owner at the centre of their actions. In a waste
minimisation-focused such as this case study, both the client and the Project Manager
CHAPTER 7 – CASE STUDY ONE
200
would work hard to ensure a minimal amount of C&D waste was produced. This is so
they can realise the significant tangible and intangible benefits as outlined above.
As a result, they would tend to be involved in all stages of the development. However,
as outlined in Chapter 5, once the contract was awarded, the influence of the client and
the project manager on waste minimisation would be significantly reduced. Instead, that
responsibility rests with the contractor. And only through the contractor that the client
and the project manager could help reduce waste.
In contrast, the client and the project manager had the greatest influence on the waste
minimisation agenda at the design stage. It is at this stage that they could set targets
and strategies for waste minimisation. By influencing other key participants, it is
contended that a significant wastage could be potentially reduced before the
construction even took place. Further, as argued in Chapter 5 and Chapter 6, the cost
of waste for the client at this stage was insignificant compared to the overall project cost
(and to any changes at later stages for that matter). Therefore, the client should be
proactive and involved in waste minimisation right from the design stage.
7.9.2. Designers
Designers such as architects and engineers have a key role in the waste minimisation
strategy. Through efficient designs, the designers could potentially help reduce
wastages in the construction phase. However, each commercial design entity would
have their own agendas. Therefore, to achieve a common waste minimisation goal,
there is a need for the designers to work collaboratively with other participants,
including the client, other designers and contractors.
CHAPTER 7 – CASE STUDY ONE
201
As the design stage has a potential to maximise the waste reduction, the designers
must be proactive in researching, choosing and designing efficient systems that can
help achieve the intended waste minimisation objective. These systems could include,
but not limited to, new materials, durable materials, building technology and
prefabricated components. For example, it has been shown that prefabrication can help
reduce waste by up to 52% (Jaillon et al, 2009).
Further, designers should also be involved in supervision of the building construction to
ensure all systems work as designed and that wastages could be minimised
accordingly.
From the commercial perspective, the designer has an opportunity to earn significant
more in a waste minimisation-focused project than a comparable non-waste
minimisation-focused project. This is because in the former, the designer must spend
significant more time to research and design appropriate systems to support the
achievement of the intended waste minimisation goal. The more complex or rigorous
the waste minimisation strategy becomes, the more money the designers can earn (as
more hours are required to design appropriate systems). This is the commercial
incentive for the designers in a waste minimisation-focused project such as this one.
7.9.3. Contractors
The contractors have a significant role in ensuring all waste minimisation goals are met
during construction. This role can also extend to the design stage, although their
involvements can be more limited than other participants such as the designers.
CHAPTER 7 – CASE STUDY ONE
202
During the design stage, the contractor can be involved to provide inputs on the
constructability and areas which they think waste could be minimised. The involvement
of the contractor during the design phase can provide significant value to the overall
design. They can bring in with them a wealth of knowledge and experience regarding
constructability and building systems. In turns this can ensure the building is functional
while meeting waste minimisation targets in the construction stage.
For contractors, it is possibly at the construction phase that they have the greatest
influence on waste minimisation. The contractors would be responsible for every aspect
of the construction stage. This means they have the power to make sure C&D waste is
properly sorted, reused or recycled. This could be done through influencing onsite
operatives and subcontractors. They may have opportunities to identify areas to reduce
waste further when the construction is under way.
However, from a commercial perspective there must be incentives for the contractors to
undertake waste minimisation practices onsite. One such incentive is for the client to
engage the contractors early and get them involved in the design stage. By being
involved in the design phase, the contractors have an opportunity to earn extra incomes
aside from their tendered prices. Although the money earned through this involvement
may be relatively insignificant compared to the tendered prices, this early engagement
allows the contractors to have a good understanding of the project. It also gives the
contractors a sense of ownership of the project, which in turns encourages the
contractors to undertake waste minimisation during construction.
Therefore, for a waste minimisation-focused project such as this case study, the early
involvements of the contractors should be welcome and encouraged.
CHAPTER 7 – CASE STUDY ONE
203
7.10. Conclusion
This chapter has demonstrated the applicability of the framework to the evaluation of
waste minimisation strategies for a range of C&D waste streams. The results obtained
show that the building owner can get significant values from C&D waste minimisation.
Further, all associated parties such as designer and contractors can also be beneficial
economically from their involvement in the waste minimisation strategy. Finally, four
waste minimisation strategies were analysed to make a recommendation on an optimal
waste minimisation strategy for this case study.
The case study also explored roles and responsibilities of participants of the waste
minimisation strategy to provide a good understanding of the contributing factors to a
successful waste minimisation strategy.
The next chapter will discuss how this framework can be applied to a single waste
stream (brick waste) in a different project setting (refurbishment).
CHAPTER 8 – CASE STUDY TWO
204
CHAPTER 8 – CASE STUDY TWO
ECONOMIC EVALUATION OF MINIMISING SINGLE C&D WASTE STREAM
CHAPTER 8 – CASE STUDY TWO
205
The economic evaluation framework described in Chapter 6 is intended to be flexible to
various situations concerning C&D waste. Chapter 7 has demonstrated how the
framework can be used to evaluate the economics of minimising multiple waste
streams. This chapter will describe the application of this framework to the economic
evaluation of minimising an individual waste stream: brick.
This chapter considers brick waste from both demolition and construction components
of a project. However, unlike Chapter 7, this chapter investigates an office
refurbishment project. The objective here is to demonstrate the flexibility and usefulness
of this study’s framework in various situations. Results obtained in this chapter will be
thoroughly assessed and interpreted to provide a good understanding of the economic
costs and benefits associated with minimising the brick waste stream.
In this case study, a real dataset with relative values is used and reported. In other
words, the names and the magnitudes of the actual values have been altered for
confidentiality reasons. This is appropriate for the purpose of demonstrating the
application of the economic evaluation being reported in this thesis.
For the purpose in this case study, ‘bricks’ are red clay bricks, not concrete blocks and
‘brick waste’ is defined as broken bricks which cannot be used or reused whether in
whole or in part.
8.1. Case Study Overview
The case study considered in this chapter is the refurbishment of a light commercial
building in the Auckland Central area. This chapter will evaluate the economics of waste
CHAPTER 8 – CASE STUDY TWO
206
minimisation strategies associated with this project using the framework developed in
Chapter 6.
8.1.1. Project Background
The building considered in this project is located in one of the main business districts in
Auckland Central. It lies in a mixed-used area, including residential apartment buildings
as well as business buildings. The total land area of the site (TL) is 691 m2. However,
the case study did not have the size of the building’s footprint. For modelling purposes,
it has been assumed that the building’s footprint comprises 90% of the land area. This
means the building footprint (F) is 622 m2.
It has been estimated by the building owner (therein referred to as ‘client’) that the
aggregated unit cost of project (AUC) is $2,800. This unit cost was measured in dollar
per square metre. This estimated unit cost includes the land value as well as the
demolition and building costs.
Although this unit cost allows the building owner to evaluate the economic viability of
the project, it was not useful for the economic modelling purposes due to its aggregated
nature. Specifically, the inclusion of land value in the given unit cost can have a
skewing effect because it does not reveal the true cost of the refurbishment work (i.e.
demolition and construction work only). Therefore, for modelling purposes, it has been
assumed that the value of the land comprises 40% of the specified unit cost. This is due
to the fact that this land had been purchased by the client a long time ago, thus giving it
a relatively lower cost than a comparable newly-purchased land block in the same area.
This means the unit cost of land (UCL) is:
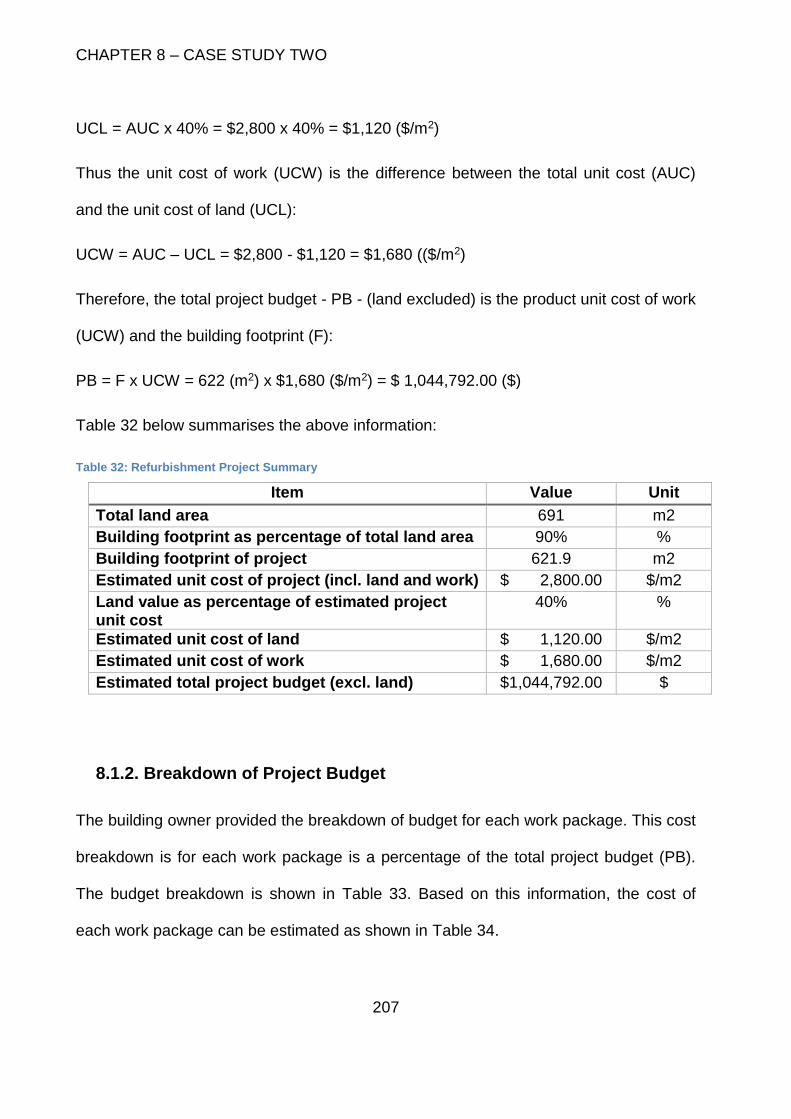
CHAPTER 8 – CASE STUDY TWO
207
UCL = AUC x 40% = $2,800 x 40% = $1,120 ($/m2)
Thus the unit cost of work (UCW) is the difference between the total unit cost (AUC)
and the unit cost of land (UCL):
UCW = AUC – UCL = $2,800 - $1,120 = $1,680 (($/m2)
Therefore, the total project budget - PB - (land excluded) is the product unit cost of work
(UCW) and the building footprint (F):
PB = F x UCW = 622 (m2) x $1,680 ($/m2) = $ 1,044,792.00 ($)
Table 32 below summarises the above information:
Table 32: Refurbishment Project Summary
Item Value Unit
Total land area 691 m2
Building footprint as percentage of total land area 90% %
Building footprint of project 621.9 m2
Estimated unit cost of project (incl. land and work) $ 2,800.00 $/m2
Land value as percentage of estimated project unit cost
40% %
Estimated unit cost of land $ 1,120.00 $/m2
Estimated unit cost of work $ 1,680.00 $/m2
Estimated total project budget (excl. land) $1,044,792.00 $
8.1.2. Breakdown of Project Budget
The building owner provided the breakdown of budget for each work package. This cost
breakdown is for each work package is a percentage of the total project budget (PB).
The budget breakdown is shown in Table 33. Based on this information, the cost of
each work package can be estimated as shown in Table 34.
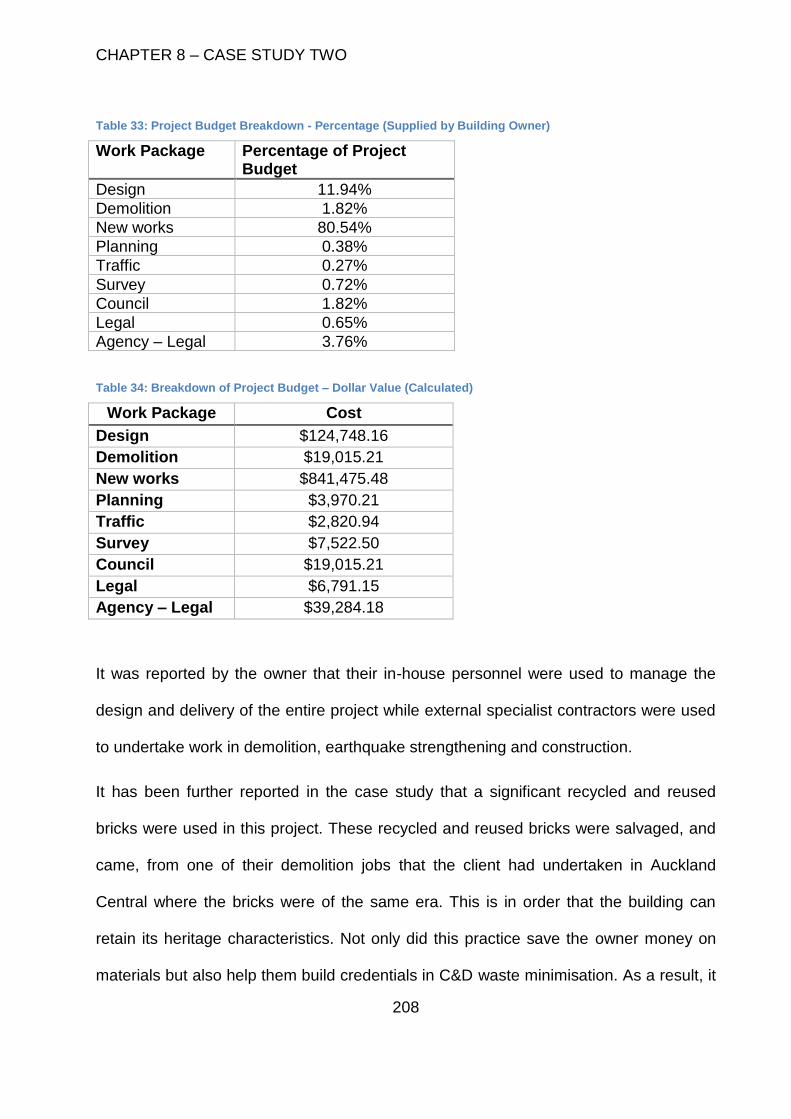
CHAPTER 8 – CASE STUDY TWO
208
Table 33: Project Budget Breakdown - Percentage (Supplied by Building Owner)
Work Package Percentage of Project Budget
Design 11.94%
Demolition 1.82%
New works 80.54%
Planning 0.38%
Traffic 0.27%
Survey 0.72%
Council 1.82%
Legal 0.65%
Agency – Legal 3.76%
Table 34: Breakdown of Project Budget – Dollar Value (Calculated)
Work Package Cost
Design $124,748.16
Demolition $19,015.21
New works $841,475.48
Planning $3,970.21
Traffic $2,820.94
Survey $7,522.50
Council $19,015.21
Legal $6,791.15
Agency – Legal $39,284.18
It was reported by the owner that their in-house personnel were used to manage the
design and delivery of the entire project while external specialist contractors were used
to undertake work in demolition, earthquake strengthening and construction.
It has been further reported in the case study that a significant recycled and reused
bricks were used in this project. These recycled and reused bricks were salvaged, and
came, from one of their demolition jobs that the client had undertaken in Auckland
Central where the bricks were of the same era. This is in order that the building can
retain its heritage characteristics. Not only did this practice save the owner money on
materials but also help them build credentials in C&D waste minimisation. As a result, it
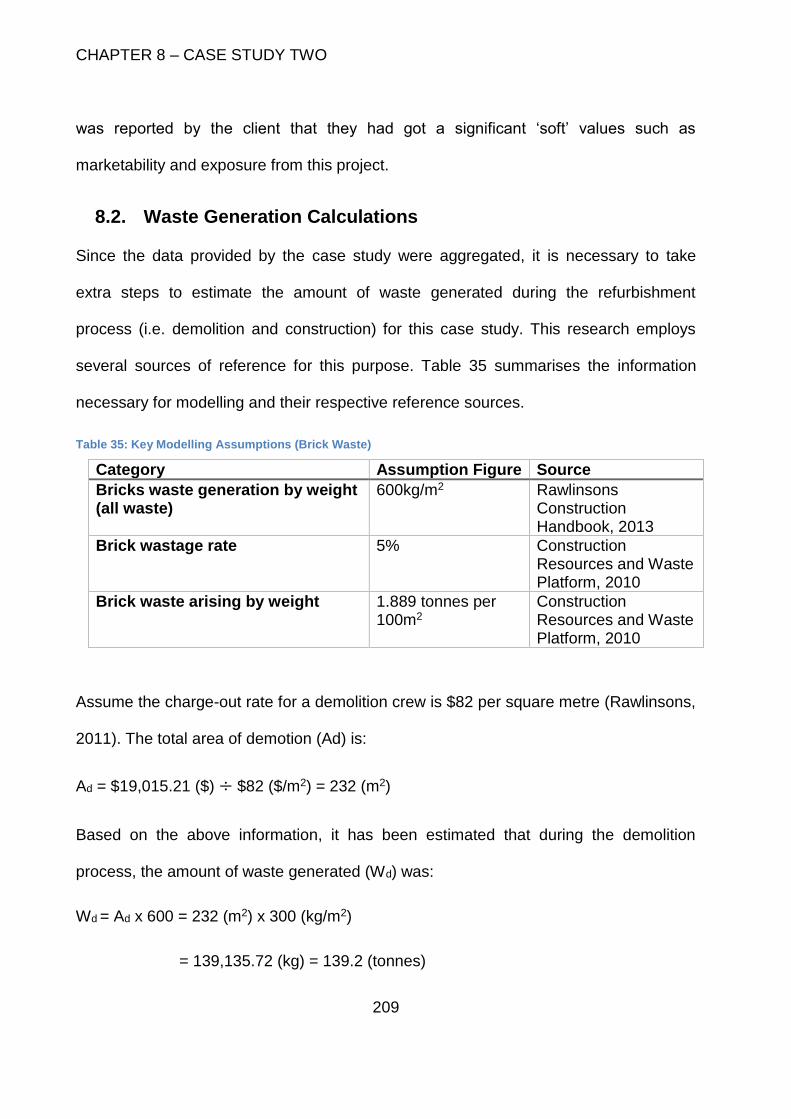
CHAPTER 8 – CASE STUDY TWO
209
was reported by the client that they had got a significant ‘soft’ values such as
marketability and exposure from this project.
8.2. Waste Generation Calculations
Since the data provided by the case study were aggregated, it is necessary to take
extra steps to estimate the amount of waste generated during the refurbishment
process (i.e. demolition and construction) for this case study. This research employs
several sources of reference for this purpose. Table 35 summarises the information
necessary for modelling and their respective reference sources.
Table 35: Key Modelling Assumptions (Brick Waste)
Category Assumption Figure Source
Bricks waste generation by weight (all waste)
600kg/m2 Rawlinsons Construction Handbook, 2013
Brick wastage rate 5% Construction Resources and Waste Platform, 2010
Brick waste arising by weight 1.889 tonnes per 100m2
Construction Resources and Waste Platform, 2010
Assume the charge-out rate for a demolition crew is $82 per square metre (Rawlinsons,
2011). The total area of demotion (Ad) is:
Ad = $19,015.21 ($) ÷ $82 ($/m2) = 232 (m2)
Based on the above information, it has been estimated that during the demolition
process, the amount of waste generated (Wd) was:
Wd = Ad x 600 = 232 (m2) x 300 (kg/m2)
= 139,135.72 (kg) = 139.2 (tonnes)
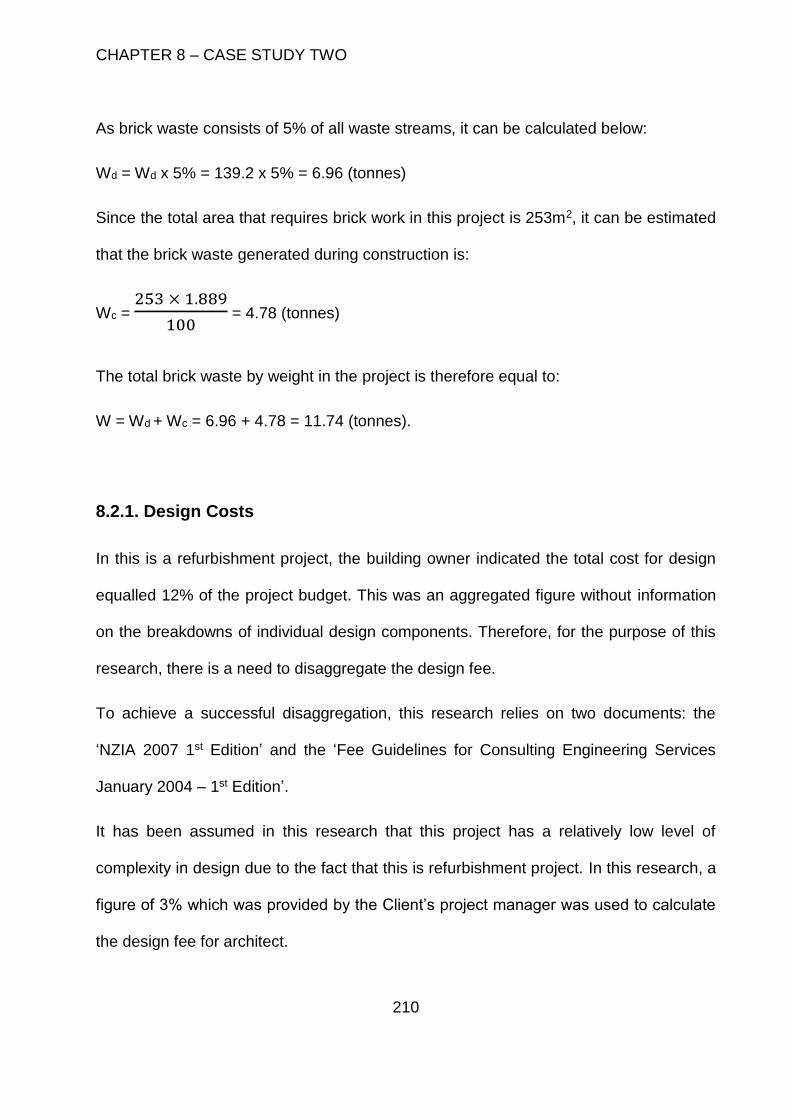
CHAPTER 8 – CASE STUDY TWO
210
As brick waste consists of 5% of all waste streams, it can be calculated below:
Wd = Wd x 5% = 139.2 x 5% = 6.96 (tonnes)
Since the total area that requires brick work in this project is 253m2, it can be estimated
that the brick waste generated during construction is:
Wc = 253 × 1.889
100 = 4.78 (tonnes)
The total brick waste by weight in the project is therefore equal to:
W = Wd + Wc = 6.96 + 4.78 = 11.74 (tonnes).
8.2.1. Design Costs
In this is a refurbishment project, the building owner indicated the total cost for design
equalled 12% of the project budget. This was an aggregated figure without information
on the breakdowns of individual design components. Therefore, for the purpose of this
research, there is a need to disaggregate the design fee.
To achieve a successful disaggregation, this research relies on two documents: the
‘NZIA 2007 1st Edition’ and the ‘Fee Guidelines for Consulting Engineering Services
January 2004 – 1st Edition’.
It has been assumed in this research that this project has a relatively low level of
complexity in design due to the fact that this is refurbishment project. In this research, a
figure of 3% which was provided by the Client’s project manager was used to calculate
the design fee for architect.
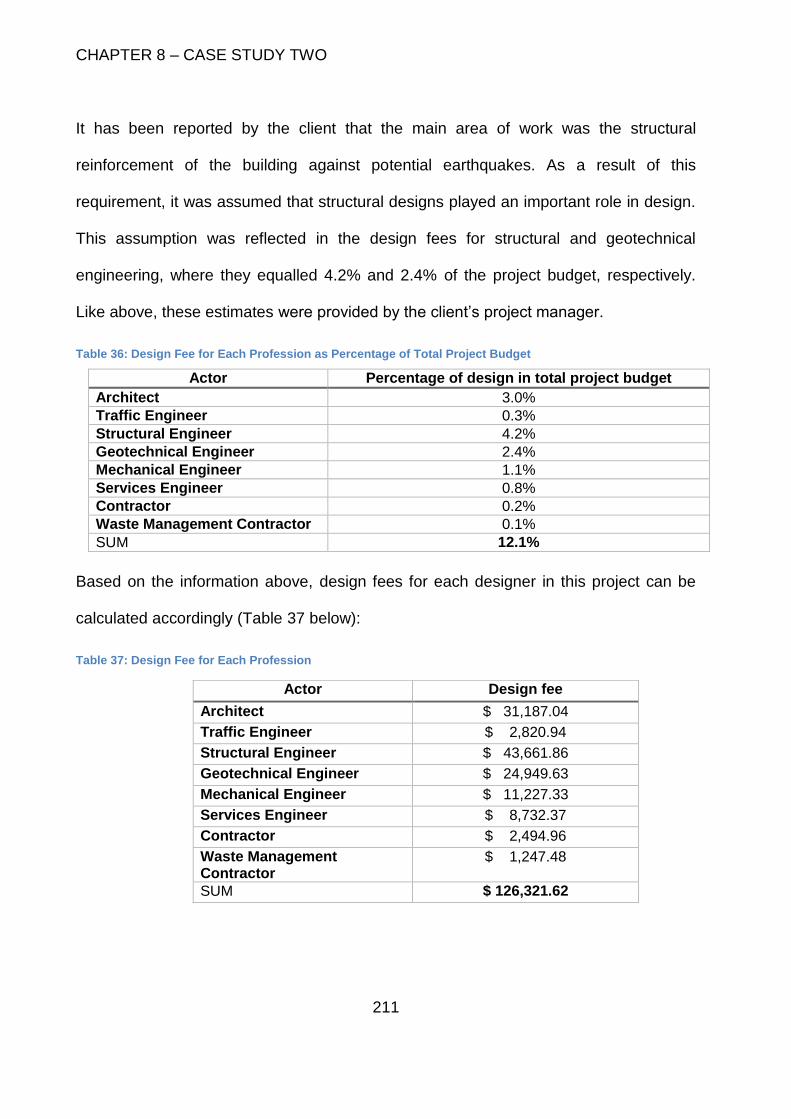
CHAPTER 8 – CASE STUDY TWO
211
It has been reported by the client that the main area of work was the structural
reinforcement of the building against potential earthquakes. As a result of this
requirement, it was assumed that structural designs played an important role in design.
This assumption was reflected in the design fees for structural and geotechnical
engineering, where they equalled 4.2% and 2.4% of the project budget, respectively.
Like above, these estimates were provided by the client’s project manager.
Table 36: Design Fee for Each Profession as Percentage of Total Project Budget
Actor Percentage of design in total project budget
Architect 3.0%
Traffic Engineer 0.3%
Structural Engineer 4.2%
Geotechnical Engineer 2.4%
Mechanical Engineer 1.1%
Services Engineer 0.8%
Contractor 0.2%
Waste Management Contractor 0.1%
SUM 12.1%
Based on the information above, design fees for each designer in this project can be
calculated accordingly (Table 37 below):
Table 37: Design Fee for Each Profession
Actor Design fee
Architect $ 31,187.04
Traffic Engineer $ 2,820.94
Structural Engineer $ 43,661.86
Geotechnical Engineer $ 24,949.63
Mechanical Engineer $ 11,227.33
Services Engineer $ 8,732.37
Contractor $ 2,494.96
Waste Management Contractor
$ 1,247.48
SUM $ 126,321.62
CHAPTER 8 – CASE STUDY TWO
212
8.2.2. Design-out-waste Cost
As in Chapter 7, the design-out-waste component consists of a small percentage of the
design fee. Further, the design-out-waste component can be incorporated into the
design process for a relatively small cost. The interview with the client’s project
manager suggests a figure of 2% of the project’s total design fee is sufficient – and this
figure will be used in this case study to calculate cost of design-out-waste.
Table 38 shows the progressions of fees for design and design-out-waste component,
respectively across seven strategies. The rate of increase is the same as those
indicated in Chapter 6.
Table 38: Assumed Increases of Design Fees (Duplicate of Table 12)
From strategy to strategy
Rate of design fee increase
1 TO 2 20%
2 TO 3 10%
3 TO 4 10%
4 TO 5 10%
5 TO 6 15%
6 TO 7 30%
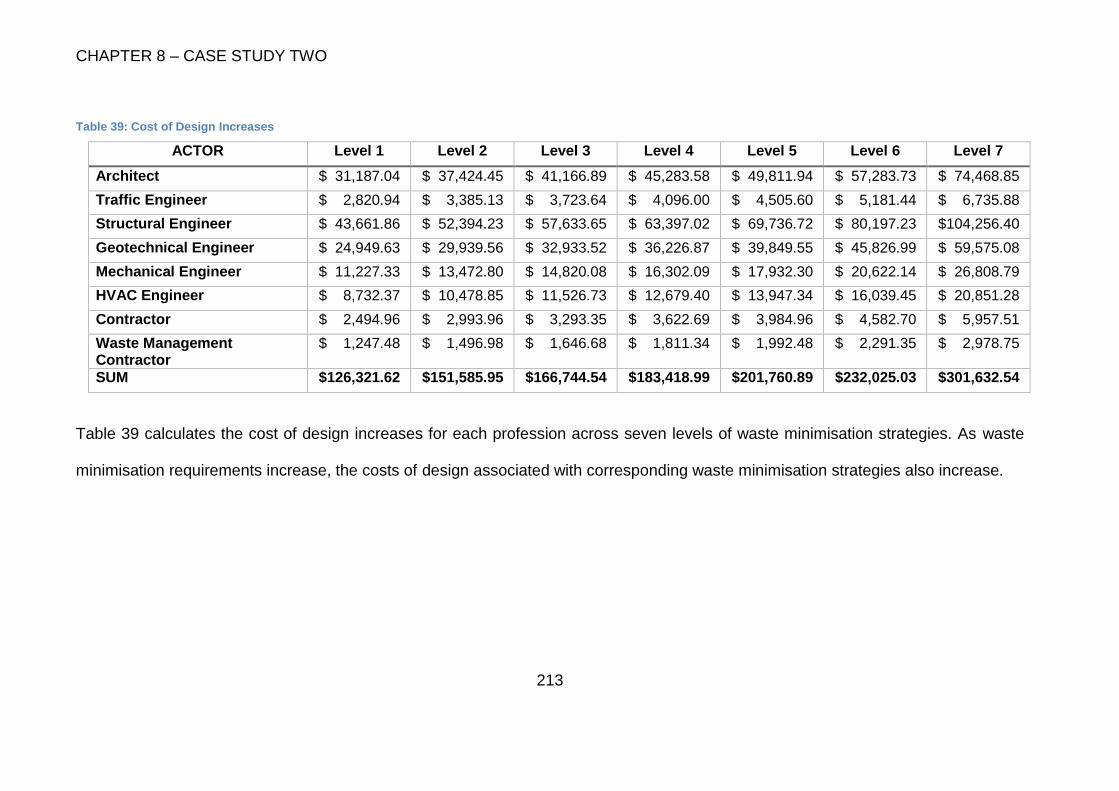
CHAPTER 8 – CASE STUDY TWO
213
Table 39: Cost of Design Increases
ACTOR Level 1 Level 2 Level 3 Level 4 Level 5 Level 6 Level 7
Architect $ 31,187.04 $ 37,424.45 $ 41,166.89 $ 45,283.58 $ 49,811.94 $ 57,283.73 $ 74,468.85
Traffic Engineer $ 2,820.94 $ 3,385.13 $ 3,723.64 $ 4,096.00 $ 4,505.60 $ 5,181.44 $ 6,735.88
Structural Engineer $ 43,661.86 $ 52,394.23 $ 57,633.65 $ 63,397.02 $ 69,736.72 $ 80,197.23 $104,256.40
Geotechnical Engineer $ 24,949.63 $ 29,939.56 $ 32,933.52 $ 36,226.87 $ 39,849.55 $ 45,826.99 $ 59,575.08
Mechanical Engineer $ 11,227.33 $ 13,472.80 $ 14,820.08 $ 16,302.09 $ 17,932.30 $ 20,622.14 $ 26,808.79
HVAC Engineer $ 8,732.37 $ 10,478.85 $ 11,526.73 $ 12,679.40 $ 13,947.34 $ 16,039.45 $ 20,851.28
Contractor $ 2,494.96 $ 2,993.96 $ 3,293.35 $ 3,622.69 $ 3,984.96 $ 4,582.70 $ 5,957.51
Waste Management Contractor
$ 1,247.48 $ 1,496.98 $ 1,646.68 $ 1,811.34 $ 1,992.48 $ 2,291.35 $ 2,978.75
SUM $126,321.62 $151,585.95 $166,744.54 $183,418.99 $201,760.89 $232,025.03 $301,632.54
Table 39 calculates the cost of design increases for each profession across seven levels of waste minimisation strategies. As waste
minimisation requirements increase, the costs of design associated with corresponding waste minimisation strategies also increase.
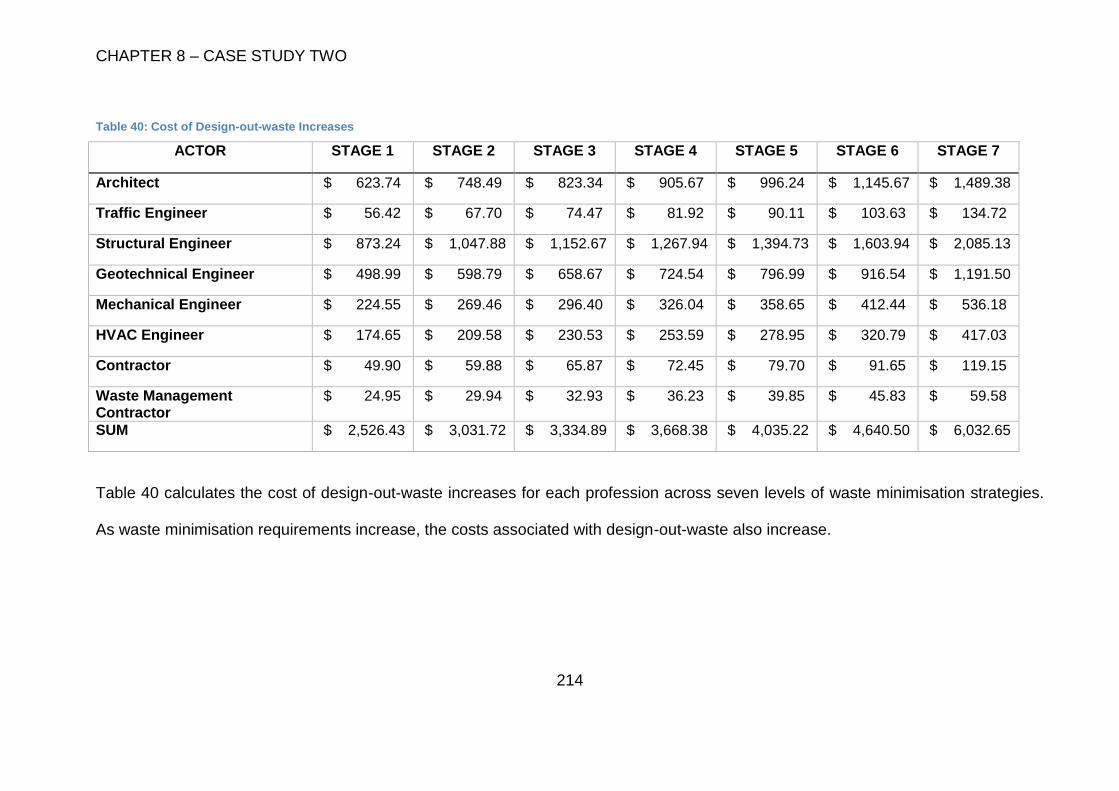
CHAPTER 8 – CASE STUDY TWO
214
Table 40: Cost of Design-out-waste Increases
ACTOR STAGE 1 STAGE 2 STAGE 3 STAGE 4 STAGE 5 STAGE 6 STAGE 7
Architect $ 623.74 $ 748.49 $ 823.34 $ 905.67 $ 996.24 $ 1,145.67 $ 1,489.38
Traffic Engineer $ 56.42 $ 67.70 $ 74.47 $ 81.92 $ 90.11 $ 103.63 $ 134.72
Structural Engineer $ 873.24 $ 1,047.88 $ 1,152.67 $ 1,267.94 $ 1,394.73 $ 1,603.94 $ 2,085.13
Geotechnical Engineer $ 498.99 $ 598.79 $ 658.67 $ 724.54 $ 796.99 $ 916.54 $ 1,191.50
Mechanical Engineer $ 224.55 $ 269.46 $ 296.40 $ 326.04 $ 358.65 $ 412.44 $ 536.18
HVAC Engineer $ 174.65 $ 209.58 $ 230.53 $ 253.59 $ 278.95 $ 320.79 $ 417.03
Contractor $ 49.90 $ 59.88 $ 65.87 $ 72.45 $ 79.70 $ 91.65 $ 119.15
Waste Management Contractor
$ 24.95 $ 29.94 $ 32.93 $ 36.23 $ 39.85 $ 45.83 $ 59.58
SUM $ 2,526.43 $ 3,031.72 $ 3,334.89 $ 3,668.38 $ 4,035.22 $ 4,640.50 $ 6,032.65
Table 40 calculates the cost of design-out-waste increases for each profession across seven levels of waste minimisation strategies.
As waste minimisation requirements increase, the costs associated with design-out-waste also increase.
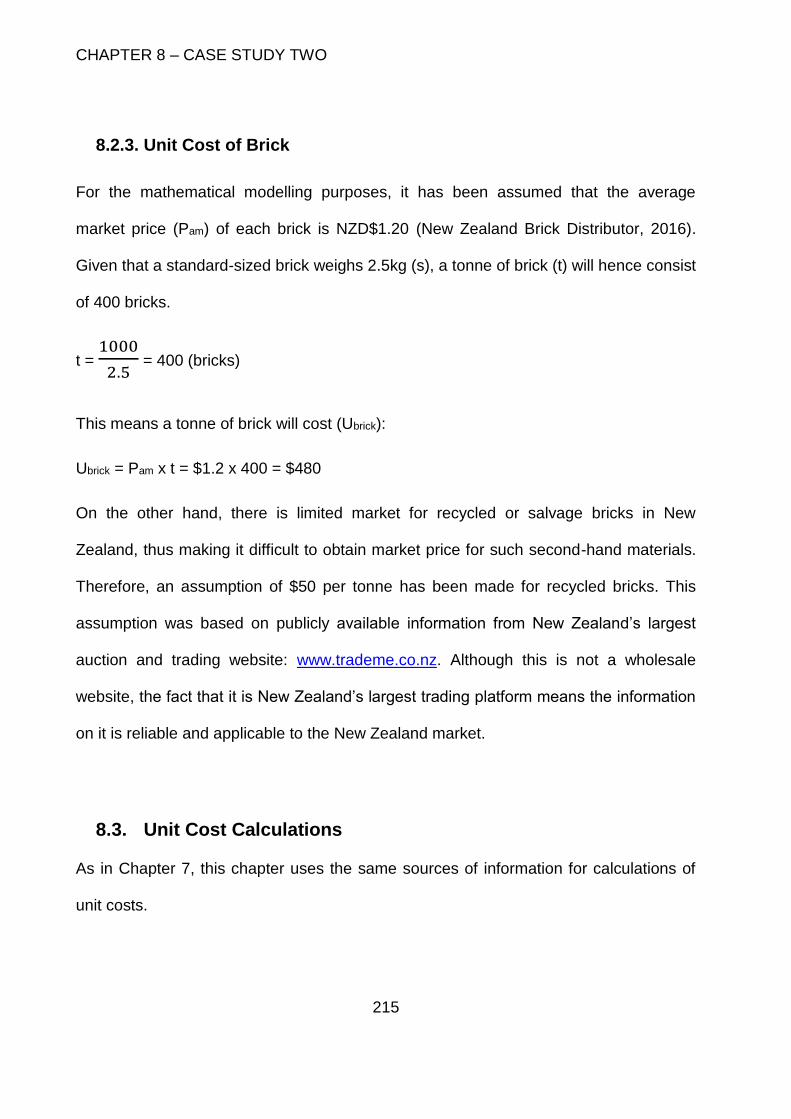
CHAPTER 8 – CASE STUDY TWO
215
8.2.3. Unit Cost of Brick
For the mathematical modelling purposes, it has been assumed that the average
market price (Pam) of each brick is NZD$1.20 (New Zealand Brick Distributor, 2016).
Given that a standard-sized brick weighs 2.5kg (s), a tonne of brick (t) will hence consist
of 400 bricks.
t = 1000
2.5 = 400 (bricks)
This means a tonne of brick will cost (Ubrick):
Ubrick = Pam x t = $1.2 x 400 = $480
On the other hand, there is limited market for recycled or salvage bricks in New
Zealand, thus making it difficult to obtain market price for such second-hand materials.
Therefore, an assumption of $50 per tonne has been made for recycled bricks. This
assumption was based on publicly available information from New Zealand’s largest
auction and trading website: www.trademe.co.nz. Although this is not a wholesale
website, the fact that it is New Zealand’s largest trading platform means the information
on it is reliable and applicable to the New Zealand market.
8.3. Unit Cost Calculations
As in Chapter 7, this chapter uses the same sources of information for calculations of
unit costs.
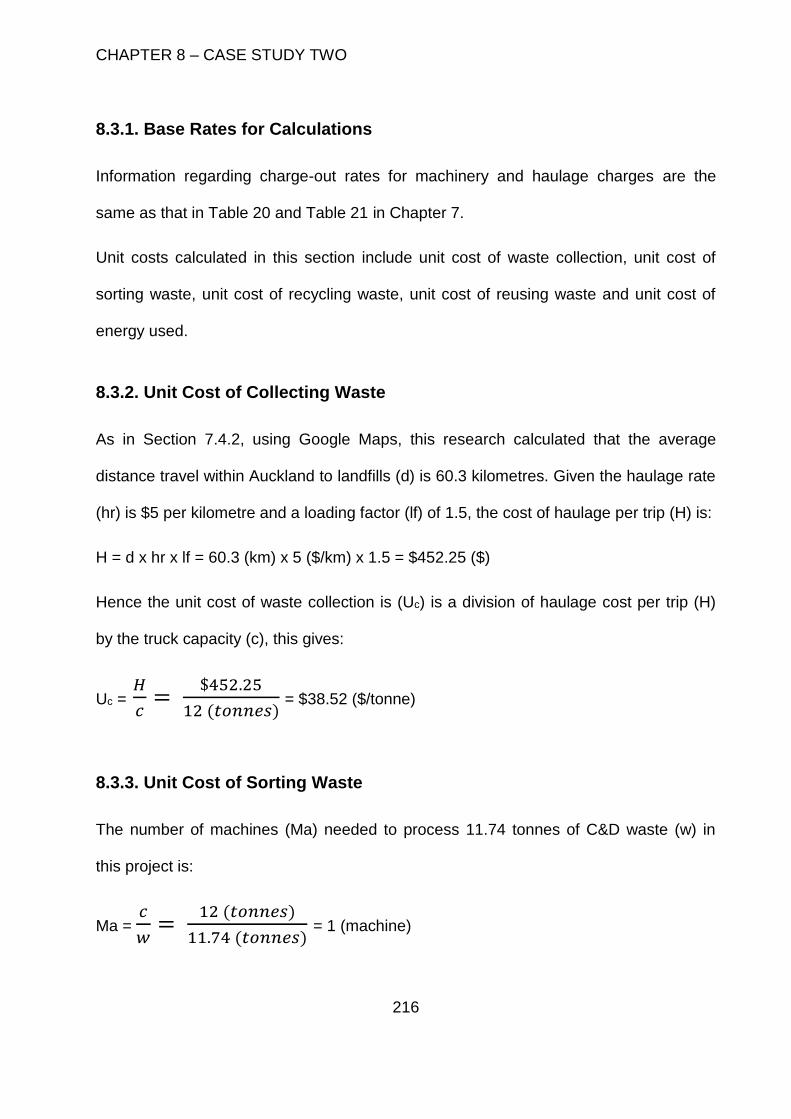
CHAPTER 8 – CASE STUDY TWO
216
8.3.1. Base Rates for Calculations
Information regarding charge-out rates for machinery and haulage charges are the
same as that in Table 20 and Table 21 in Chapter 7.
Unit costs calculated in this section include unit cost of waste collection, unit cost of
sorting waste, unit cost of recycling waste, unit cost of reusing waste and unit cost of
energy used.
8.3.2. Unit Cost of Collecting Waste
As in Section 7.4.2, using Google Maps, this research calculated that the average
distance travel within Auckland to landfills (d) is 60.3 kilometres. Given the haulage rate
(hr) is $5 per kilometre and a loading factor (lf) of 1.5, the cost of haulage per trip (H) is:
H = d x hr x lf = 60.3 (km) x 5 ($/km) x 1.5 = $452.25 ($)
Hence the unit cost of waste collection is (Uc) is a division of haulage cost per trip (H)
by the truck capacity (c), this gives:
Uc = 𝐻
𝑐=
$452.25
12 (𝑡𝑜𝑛𝑛𝑒𝑠) = $38.52 ($/tonne)
8.3.3. Unit Cost of Sorting Waste
The number of machines (Ma) needed to process 11.74 tonnes of C&D waste (w) in
this project is:
Ma = 𝑐
𝑤=
12 (𝑡𝑜𝑛𝑛𝑒𝑠)
11.74 (𝑡𝑜𝑛𝑛𝑒𝑠) = 1 (machine)
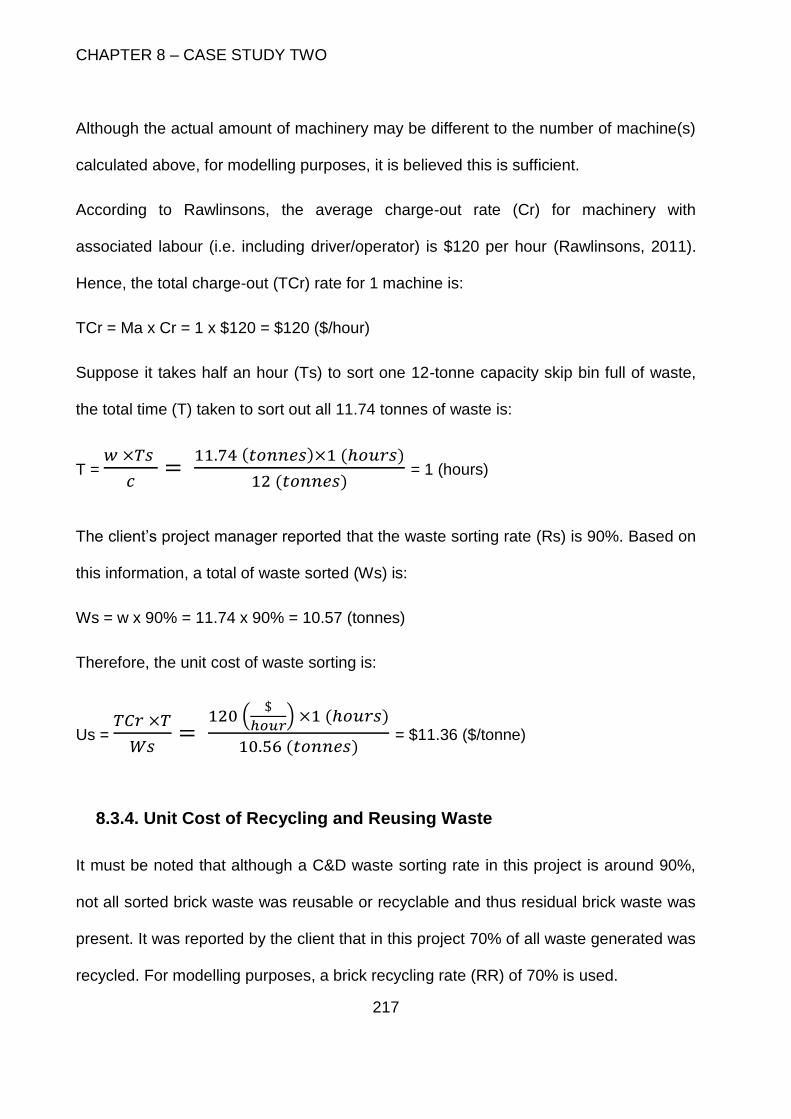
CHAPTER 8 – CASE STUDY TWO
217
Although the actual amount of machinery may be different to the number of machine(s)
calculated above, for modelling purposes, it is believed this is sufficient.
According to Rawlinsons, the average charge-out rate (Cr) for machinery with
associated labour (i.e. including driver/operator) is $120 per hour (Rawlinsons, 2011).
Hence, the total charge-out (TCr) rate for 1 machine is:
TCr = Ma x Cr = 1 x $120 = $120 ($/hour)
Suppose it takes half an hour (Ts) to sort one 12-tonne capacity skip bin full of waste,
the total time (T) taken to sort out all 11.74 tonnes of waste is:
T = 𝑤 ×𝑇𝑠
𝑐=
11.74 (𝑡𝑜𝑛𝑛𝑒𝑠)×1 (ℎ𝑜𝑢𝑟𝑠)
12 (𝑡𝑜𝑛𝑛𝑒𝑠) = 1 (hours)
The client’s project manager reported that the waste sorting rate (Rs) is 90%. Based on
this information, a total of waste sorted (Ws) is:
Ws = w x 90% = 11.74 x 90% = 10.57 (tonnes)
Therefore, the unit cost of waste sorting is:
Us = 𝑇𝐶𝑟 ×𝑇
𝑊𝑠=
120 ($
ℎ𝑜𝑢𝑟) ×1 (ℎ𝑜𝑢𝑟𝑠)
10.56 (𝑡𝑜𝑛𝑛𝑒𝑠) = $11.36 ($/tonne)
8.3.4. Unit Cost of Recycling and Reusing Waste
It must be noted that although a C&D waste sorting rate in this project is around 90%,
not all sorted brick waste was reusable or recyclable and thus residual brick waste was
present. It was reported by the client that in this project 70% of all waste generated was
recycled. For modelling purposes, a brick recycling rate (RR) of 70% is used.
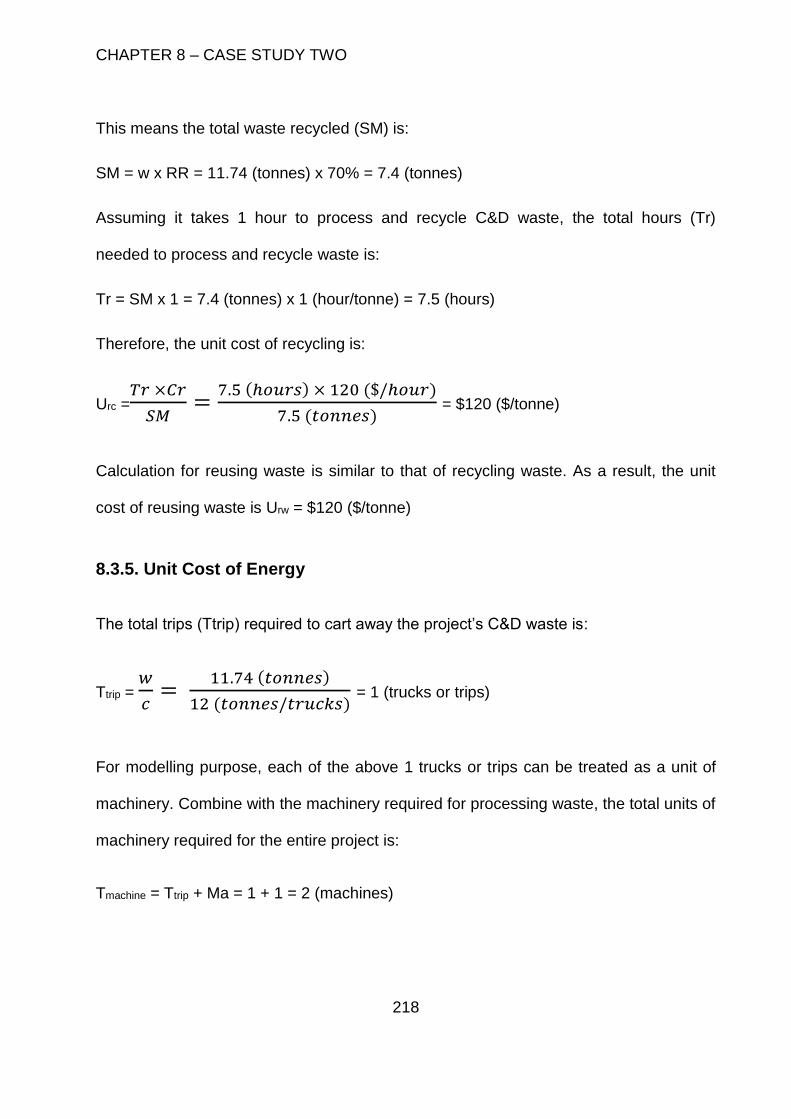
CHAPTER 8 – CASE STUDY TWO
218
This means the total waste recycled (SM) is:
SM = w x RR = 11.74 (tonnes) x 70% = 7.4 (tonnes)
Assuming it takes 1 hour to process and recycle C&D waste, the total hours (Tr)
needed to process and recycle waste is:
Tr = SM x 1 = 7.4 (tonnes) x 1 (hour/tonne) = 7.5 (hours)
Therefore, the unit cost of recycling is:
Urc =𝑇𝑟 ×𝐶𝑟
𝑆𝑀=
7.5 (ℎ𝑜𝑢𝑟𝑠) × 120 ($/ℎ𝑜𝑢𝑟)
7.5 (𝑡𝑜𝑛𝑛𝑒𝑠) = $120 ($/tonne)
Calculation for reusing waste is similar to that of recycling waste. As a result, the unit
cost of reusing waste is Urw = $120 ($/tonne)
8.3.5. Unit Cost of Energy
The total trips (Ttrip) required to cart away the project’s C&D waste is:
Ttrip = 𝑤
𝑐=
11.74 (𝑡𝑜𝑛𝑛𝑒𝑠)
12 (𝑡𝑜𝑛𝑛𝑒𝑠/𝑡𝑟𝑢𝑐𝑘𝑠) = 1 (trucks or trips)
For modelling purpose, each of the above 1 trucks or trips can be treated as a unit of
machinery. Combine with the machinery required for processing waste, the total units of
machinery required for the entire project is:
Tmachine = Ttrip + Ma = 1 + 1 = 2 (machines)
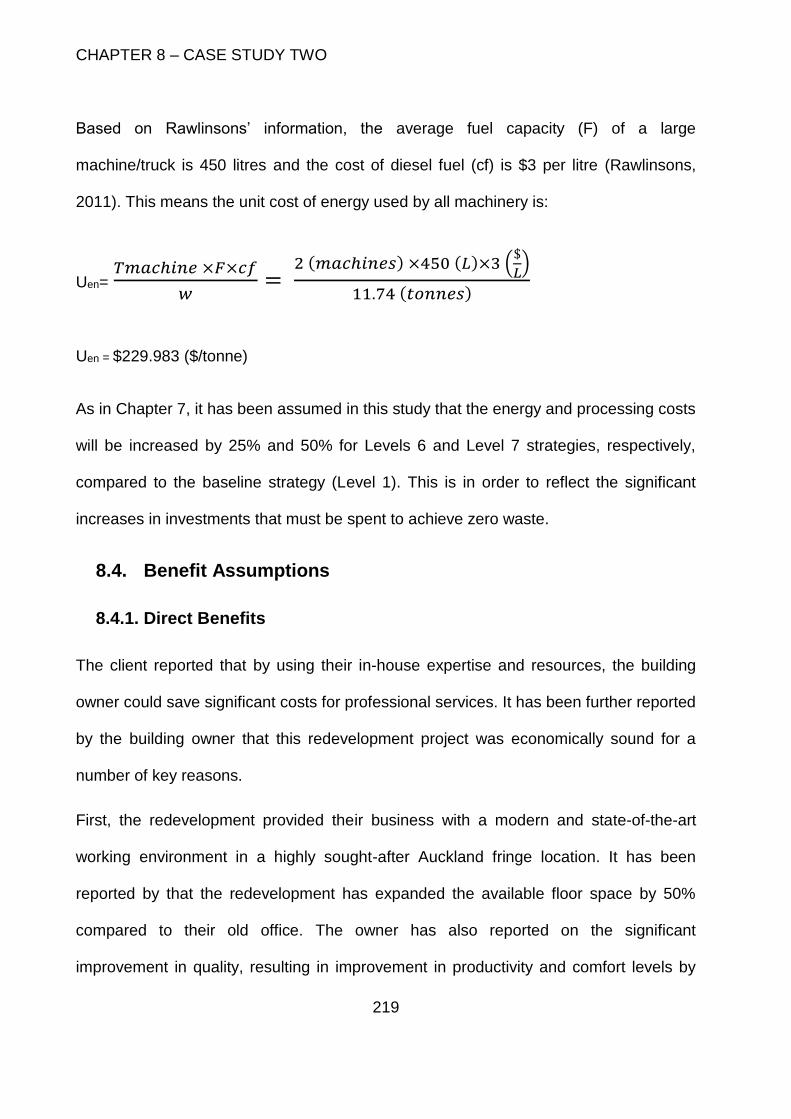
CHAPTER 8 – CASE STUDY TWO
219
Based on Rawlinsons’ information, the average fuel capacity (F) of a large
machine/truck is 450 litres and the cost of diesel fuel (cf) is $3 per litre (Rawlinsons,
2011). This means the unit cost of energy used by all machinery is:
Uen= 𝑇𝑚𝑎𝑐ℎ𝑖𝑛𝑒 ×𝐹×𝑐𝑓
𝑤=
2 (𝑚𝑎𝑐ℎ𝑖𝑛𝑒𝑠) ×450 (𝐿)×3 ($
𝐿)
11.74 (𝑡𝑜𝑛𝑛𝑒𝑠)
Uen = $229.983 ($/tonne)
As in Chapter 7, it has been assumed in this study that the energy and processing costs
will be increased by 25% and 50% for Levels 6 and Level 7 strategies, respectively,
compared to the baseline strategy (Level 1). This is in order to reflect the significant
increases in investments that must be spent to achieve zero waste.
8.4. Benefit Assumptions
8.4.1. Direct Benefits
The client reported that by using their in-house expertise and resources, the building
owner could save significant costs for professional services. It has been further reported
by the building owner that this redevelopment project was economically sound for a
number of key reasons.
First, the redevelopment provided their business with a modern and state-of-the-art
working environment in a highly sought-after Auckland fringe location. It has been
reported by that the redevelopment has expanded the available floor space by 50%
compared to their old office. The owner has also reported on the significant
improvement in quality, resulting in improvement in productivity and comfort levels by
CHAPTER 8 – CASE STUDY TWO
220
their staffs. From a real estate perspective, this project has added significant
commercial values to the building owner’s organisation.
The second benefit to the owner is by undertaking this project using in-house expertise,
they had an opportunity to showcase their capability to deliver a quality project on-time
within budget. In turns, this has helped their company enhance their reputational profile
significantly.
Finally, by moving to the newly-developed office, the owner could lease out their old
office. This means the development has helped them generate additional cash flows. It
has been reported by the owner that over the long term, they could also have an
opportunity to achieve highly competitive rentals should they wish to vacate the current
premises in the future.
The owner has acknowledged that in all direct benefits that have realised, C&D waste
minimisation, including that for brick waste, played an important role and they see
values in undertaking waste minimisation practices in this project.
8.4.2. Valuing Client’s Benefits
The above information shows there were high levels of benefit that can be derived from
this project by the building owner. However, they did not quantify values for such
benefits. Rather, the client’s project manager provided a high-level monetised estimate
of around $10,000 for all intangible benefits the client realised 6 months after moving
into the new premises. For the modelling purposes, this research uses a lower value of
$7,000 to quantify intangible benefits to cater for uncertainties in the client’s estimates.
CHAPTER 8 – CASE STUDY TWO
221
Although this $7,000 figure is conservative, it is sufficient for the economic evaluation of
minimisation strategies for brick waste.
8.5. Economic Evaluation Results
As in Chapter 7, Microsoft Excel™ is chosen as the modelling tool for this chapter.
In this case study, seven waste minimisation strategies were considered. They were
Level 1 (baseline analysis - disposing of waste to landfill); Level 2 (minimising waste by
5%-10%); Level 3 (minimising waste by 11%-30%); Level 4 (minimising waste by 31%-
50%); Level 5 (minimising waste by 51%-70%); Level 6 (minimising waste by 71%-
95%) and Level 7 (zero waste).
Using the formulations established in Chapter 6, result for each strategy is shown in
Table 41 and Figure 7 below. Detailed discussions on Table 41 and Figure 7 are
offered in the following sections.
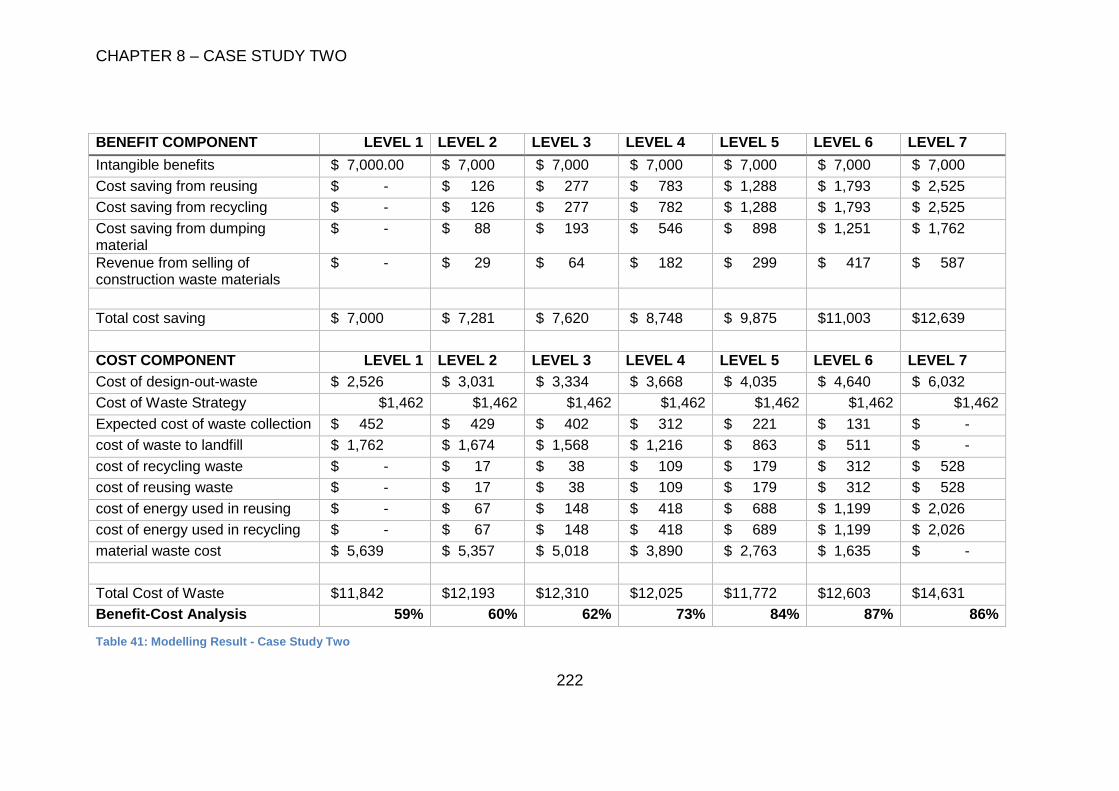
CHAPTER 8 – CASE STUDY TWO
222
BENEFIT COMPONENT LEVEL 1 LEVEL 2 LEVEL 3 LEVEL 4 LEVEL 5 LEVEL 6 LEVEL 7
Intangible benefits $ 7,000.00 $ 7,000 $ 7,000 $ 7,000 $ 7,000 $ 7,000 $ 7,000
Cost saving from reusing $ - $ 126 $ 277 $ 783 $ 1,288 $ 1,793 $ 2,525
Cost saving from recycling $ - $ 126 $ 277 $ 782 $ 1,288 $ 1,793 $ 2,525
Cost saving from dumping material
$ - $ 88 $ 193 $ 546 $ 898 $ 1,251 $ 1,762
Revenue from selling of construction waste materials
$ - $ 29 $ 64 $ 182 $ 299 $ 417 $ 587
Total cost saving $ 7,000 $ 7,281 $ 7,620 $ 8,748 $ 9,875 $11,003 $12,639
COST COMPONENT LEVEL 1 LEVEL 2 LEVEL 3 LEVEL 4 LEVEL 5 LEVEL 6 LEVEL 7
Cost of design-out-waste $ 2,526 $ 3,031 $ 3,334 $ 3,668 $ 4,035 $ 4,640 $ 6,032
Cost of Waste Strategy $1,462 $1,462 $1,462 $1,462 $1,462 $1,462 $1,462
Expected cost of waste collection $ 452 $ 429 $ 402 $ 312 $ 221 $ 131 $ -
cost of waste to landfill $ 1,762 $ 1,674 $ 1,568 $ 1,216 $ 863 $ 511 $ -
cost of recycling waste $ - $ 17 $ 38 $ 109 $ 179 $ 312 $ 528
cost of reusing waste $ - $ 17 $ 38 $ 109 $ 179 $ 312 $ 528
cost of energy used in reusing $ - $ 67 $ 148 $ 418 $ 688 $ 1,199 $ 2,026
cost of energy used in recycling $ - $ 67 $ 148 $ 418 $ 689 $ 1,199 $ 2,026
material waste cost $ 5,639 $ 5,357 $ 5,018 $ 3,890 $ 2,763 $ 1,635 $ -
Total Cost of Waste $11,842 $12,193 $12,310 $12,025 $11,772 $12,603 $14,631
Benefit-Cost Analysis 59% 60% 62% 73% 84% 87% 86%
Table 41: Modelling Result - Case Study Two
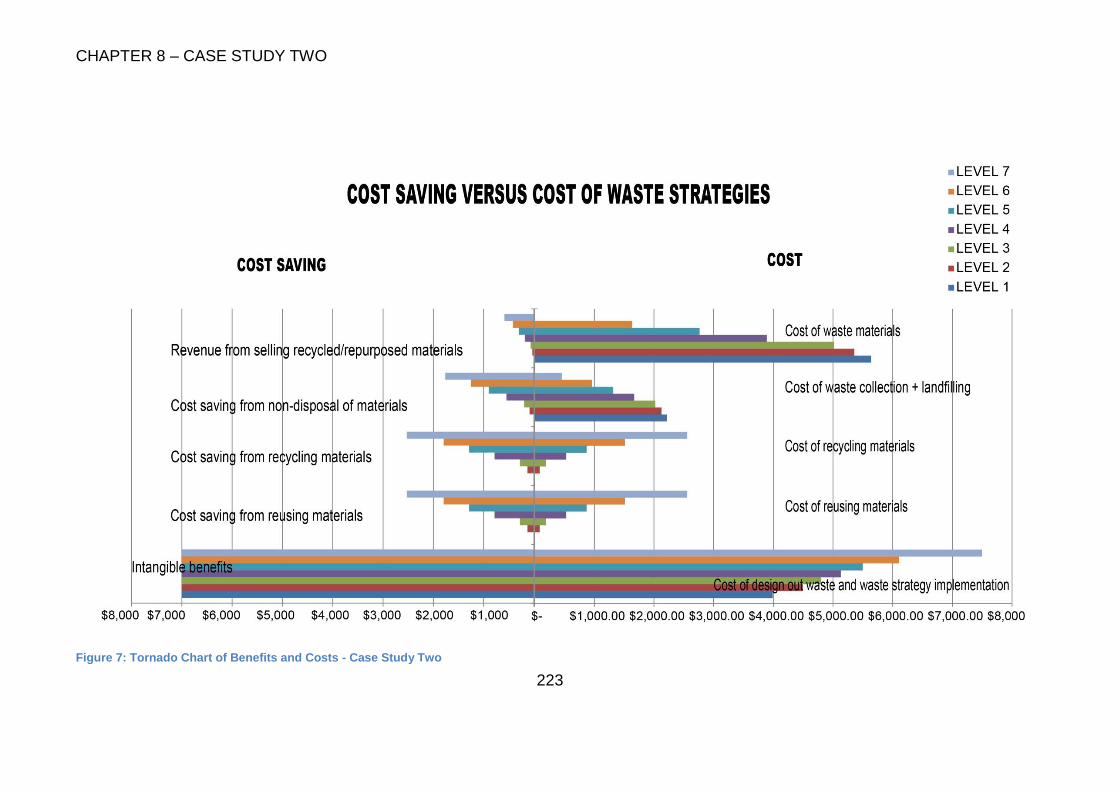
CHAPTER 8 – CASE STUDY TWO
223
Figure 7: Tornado Chart of Benefits and Costs - Case Study Two
CHAPTER 8 – CASE STUDY TWO
224
8.6. Analysis
This section provides detail analyses of the results obtained from the Section 8.5
above. Like in Chapter 7, this chapter considers three areas in its analysis:
a) Cost of waste versus savings from waste minimisation
b) Cost effectiveness of waste minimisation via design-out-waste; and
c) Economic efficiencies of waste minimisation strategies
8.6.1. Basis of Comparison
In this research, efforts have been made by the researcher to ensure consistency is
maintained. For comparison purposes, necessary moderations in calculations were
made to make sure costs were compared to corresponding cost savings appropriately.
In this case study, moderations were undertaken in a similar manner to those in the
case study reported in Chapter 7.
Cost savings/benefit components and their corresponding cost components are similar
to the basis of comparison conversion in Table 25 in Chapter 7.
Table 42 below presents the modelling results after conversion. As shown in Table 42,
costs of waste fluctuate; while cost savings increase progressively as rigorous waste
minimisation strategies are implemented. This results in an increasing benefit-cost ratio
across all seven strategies considered (Levels 1 – 7).
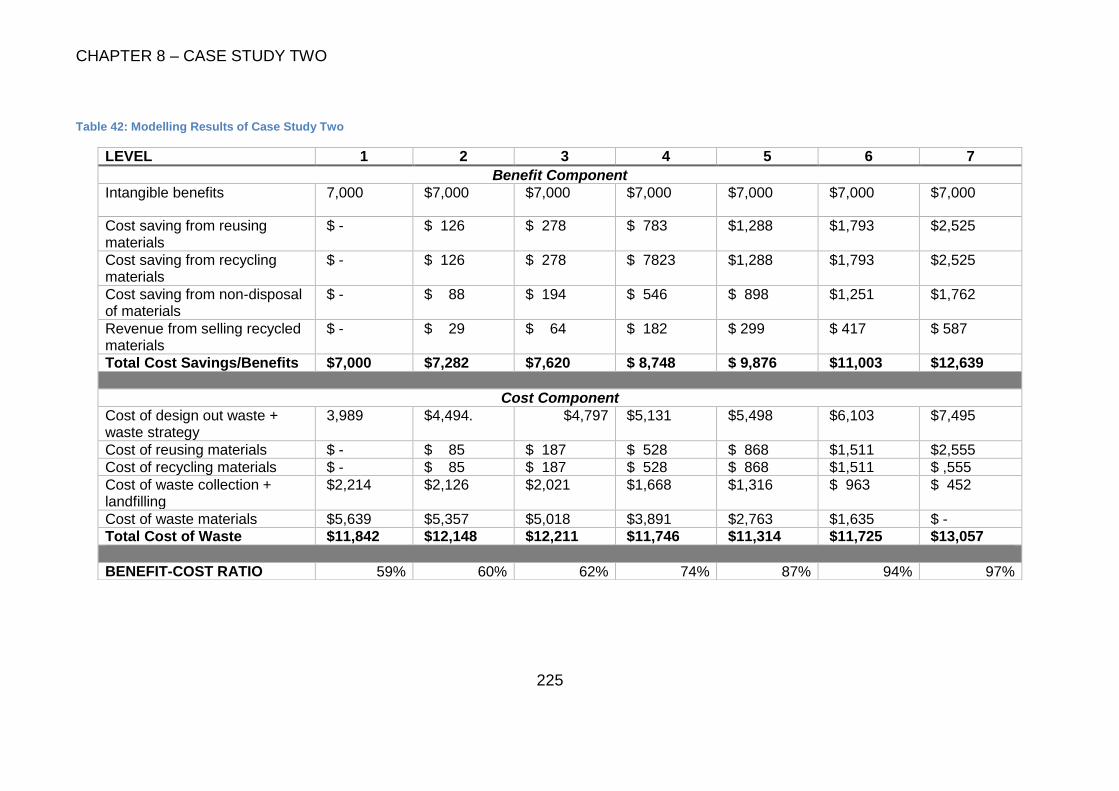
CHAPTER 8 – CASE STUDY TWO
225
Table 42: Modelling Results of Case Study Two
LEVEL 1 2 3 4 5 6 7
Benefit Component
Intangible benefits 7,000 $7,000 $7,000 $7,000 $7,000 $7,000 $7,000
Cost saving from reusing materials
$ - $ 126 $ 278 $ 783 $1,288 $1,793 $2,525
Cost saving from recycling materials
$ - $ 126 $ 278 $ 7823 $1,288 $1,793 $2,525
Cost saving from non-disposal of materials
$ - $ 88 $ 194 $ 546 $ 898 $1,251 $1,762
Revenue from selling recycled materials
$ - $ 29 $ 64 $ 182 $ 299 $ 417 $ 587
Total Cost Savings/Benefits $7,000 $7,282 $7,620 $ 8,748 $ 9,876 $11,003 $12,639
Cost Component
Cost of design out waste + waste strategy
3,989 $4,494. $4,797 $5,131 $5,498 $6,103 $7,495
Cost of reusing materials $ - $ 85 $ 187 $ 528 $ 868 $1,511 $2,555
Cost of recycling materials $ - $ 85 $ 187 $ 528 $ 868 $1,511 $ ,555
Cost of waste collection + landfilling
$2,214 $2,126 $2,021 $1,668 $1,316 $ 963 $ 452
Cost of waste materials $5,639 $5,357 $5,018 $3,891 $2,763 $1,635 $ -
Total Cost of Waste $11,842 $12,148 $12,211 $11,746 $11,314 $11,725 $13,057
BENEFIT-COST RATIO 59% 60% 62% 74% 87% 94% 97%
CHAPTER 8 – CASE STUDY TWO
226
8.6.2. Costs versus Cost Savings
The cost saving components of each waste minimisation strategy was charted against
their respective cost components as in Figure 5.
8.6.2.1. Analysis of Base Waste Strategy (Level 1 - ‘Do-Nothing’)
As can be seen in Figure 7, Level 1 waste strategy has the highest cost of waste
among the seven waste strategies considered. At the same time, its cost of waste
strategy remains the lowest. This is logical because as a base strategy, there is no
need for waste minimisation strategy at this level. Rather, all brick waste generated
would simply be disposed of into landfills.
As all brick waste would end up in landfill, the base strategy does not incur any
recycling and repurposing costs to the client. Perhaps this is the only upside in this
strategy.
However, this strategy is not a cost effective strategy for the client due to its lack of cost
saving offered. When this strategy is chosen, the client has in effect buried any potential
cost savings that can be derived such ‘waste’. Further, as waste ends up in landfills, no
processed materials can be on-sold to the secondary markets to offset the costs of
purchasing the original materials.
Further, this strategy can be potentially damaging to the environment due to the lack of
treatments of waste before disposal. Due to this lack of care for environment, this
strategy has a potential to contribute to the continuing, and significantly, high
percentage of C&D waste being present in all landfill waste streams.
CHAPTER 8 – CASE STUDY TWO
227
Therefore, from an investment perspective this strategy may not be economically sound
for the client. With a benefit - cost ratio of 59%, this is the least efficient strategy. Thus
from an economic perspective it is likely that the client would explore other alternatives.
8.6.2.2. Analysis of Level 2 and Level 3 Waste Minimisation Strategies
Waste minimisation strategies Level 2 and Level 3 show similar results to that of the
base waste strategy (Level 1). Despite more investments in waste minimisation by the
client, the waste reduction rates of 5% and 11% do not seem to have made any major
impacts in terms of economic efficiency compared to that of Level 1. In fact the
economic efficiencies of Level 2 and Level 3 strategies are only 1% and 2% better than
the economic efficiency of Level 1 strategy (at 60% and 62%), respectively. This minor
improvement again may not justify the investments by the client. Thus these waste
minimisation strategies will also likely be ignored by the client.
8.6.2.3. Analysis of Level 4 Waste Minimisation Strategy
At this level, despite 31% of brick waste can be diverted, there are still significant costs
associated with waste material (cost of waste materials) and disposal (cost of collection
and landfilling). Although there are some associated cost-savings are being realised,
the fact that these costs are high shows this strategy does not adequately address the
waste issue.
BCR of this strategy is reasonably high at 74%. This shows the client start to receive
the benefits from their investments on waste minimisation. This realisation can
encourage the client to undertake more rigorous waste minimisation strategies.
CHAPTER 8 – CASE STUDY TWO
228
8.6.2.4. Analysis of Levels 5, 6 and 7 Waste Minimisation Strategies
The economic efficiencies of these three levels are similar with BCRs of 87%, 94% and
97%, respectively. This means the investments that the client makes into waste
minimisation at these levels can deliver values, but do not deliver the total economic
efficiency that the client is looking for.
Moreover, the actual profile of each strategy is totally different. At Level 5, the cost of
waste materials is still relatively high compared to the revenue that can be realised from
reselling recycled materials. However, at Level 6 and Level 7, the cost and revenue in
this component more or less equal. This is because unlike at Level 5, at Level 6, a
significant waste has been reduced, thus reducing the cost of waste; while at Level 7,
there is no waste generated so all bricks can be recycled and/or resold.
However, the costs of reuse and recycling are much higher in Level 6 and Level 7
strategies than they are in Level 5 strategy. As more materials being saved, more
resources and money must be spent to recycle and repurpose the bricks in order to
resell them in the secondary market. Further, the energy needed at these levels
increase by 25% and 50% respectively compared to that in lower levels. This makes the
costs of recycling and reusing at Levels 6 and 7 more expensive than their
contemporaries.
8.6.2.5. Implications of Zero Waste
It can be observed from Figure 7 that the design cost for the zero waste strategy is
highest among all strategies considered. This behaviour is similar to that in Chapter 7.
Perhaps the high design cost here is due to two elements: the time and effort required
by designers to ensure no waste is generated; and the high cost of compliance
CHAPTER 8 – CASE STUDY TWO
229
associated with the rigorous waste minimisation practices required by the zero waste
strategy.
In the first element, to achieve zero waste, it is anticipated that the design team
(including architects, engineers and contractors) must spend time and effort to design
systems that does not generate waste during construction. It is no doubt that such a
system, if it exists, would be highly complex. This time and effort spent on design also
means that the cost associated with design will likely increase.
Once a waste minimisation system has been designed, it must be implemented in order
to achieve the ‘zero waste’ objective. It is contended that due to construction’s
fragmented nature, the implementation of such a system would be highly complicated.
Therefore, there will be a need for a rigorous implementation plan as well as associated
compliance strategy. This requirement means that the cost associated with a waste
minimisation strategy will likely increase as well.
However, despite its high investment cost, the zero waste strategy does not deliver a
significantly high return for the client in this case study. This is shown by the fact that
the BCR of Level 7 strategy is slightly higher than that of Level 6 strategy (97%
compared to 94%, respectively). This means that in this instance, it may be worth the
client’s effort to look at another waste minimisation alternative to the zero waste. This is
because the client can avoid the high investment cost associated with the zero waste
strategy; and at the same time the client can achieve a similar or better return on his
investment. The comparison of economic efficiencies between waste minimisation
strategies will be discussed in detail in Section 8.7.
CHAPTER 8 – CASE STUDY TWO
230
8.6.3. Analysis of Design-Out-Waste
Design-out-waste cost comprises a small portion (2%) of the total design cost of this
project. However, the rate of design cost increases between different waste
minimisation levels are as per Table 40. Such increases are significant nonetheless;
and they could have significant implications on design-out-waste costs.
As the design cost increases, the cost of design-out-waste component also increases
proportionally. This is a response the increased complexity in waste minimisation
requirements. As more waste is being minimised, the designers must find more
innovative ways to help meet this goal. This means the designers must collaborate with
other parties, including contractors and material manufacturers, to research and
incorporate durable materials or materials that can be reused / recycled after their
useful lives in the design. The increased cost is a reflection of the increased efforts and
time spent on researching, understanding and designing systems that can offer minimal
wastages.
8.6.3.1. Design Participants’ Learning
The design-out-waste is complex and time consuming process involving participations
of different parties, all of whom must get paid. And their payments should be
proportional to the increased complexity. Subsequently, the cost breakdown for each
actor in design-out-waste (and design – i.e. the sum) can be calculated.
Tables 43 – 45 demonstrate that aside from traditional designers such as architects and
engineers, contractors also make money for their involvement in the design stage. From
an investment perspective, it is a promising idea and good practice to get the
CHAPTER 8 – CASE STUDY TWO
231
contractors involved early in the design process for two reasons. First, the early
involvement of the contractors in the design stage can help improve the overall
constructability of the project with their practical inputs. This means will significant
process waste can be reduced due to prompt communication between the designers
and the contractors.
Second, by being involved in the design stage, contractor will likely take ownership of
their work. This means the contractor will likely take proactive actions to reduce and
minimise wastages during construction. At the same time, the contractor will have
incentives to require sub-contractors to take actions to reduce and minimise waste.
As argued in Chapter 7, the fragmented nature of the construction industry means that
a majority of actual construction will be delegated or subcontracted. This means the
subcontractor, as opposed to the contractors, will be responsible for ensuring the waste
minimisation targets are met. To achieve this goal, the subcontractor must ensure they
have appropriately trained personnel to carry out the work during construction, at their
costs. From the perspective of the main contractors, their involvement in a waste
minimisation-focused project presents significant benefits from this project with minimal
to no downsides. Benefits that the contractors can get are both tangible and intangible.
Tangible benefits come from earnings from design, free training in waste minimisation
while intangible benefits come from marketing exposures and improved reputation. This
is means the contractor can get more benefits from a waste minimisation project
compared to a non-waste-focused project of a similar construction price. From an
economic perspective, the contractor would likely prefer being involved in, and
committed to, a waste minimisation-focused building project.
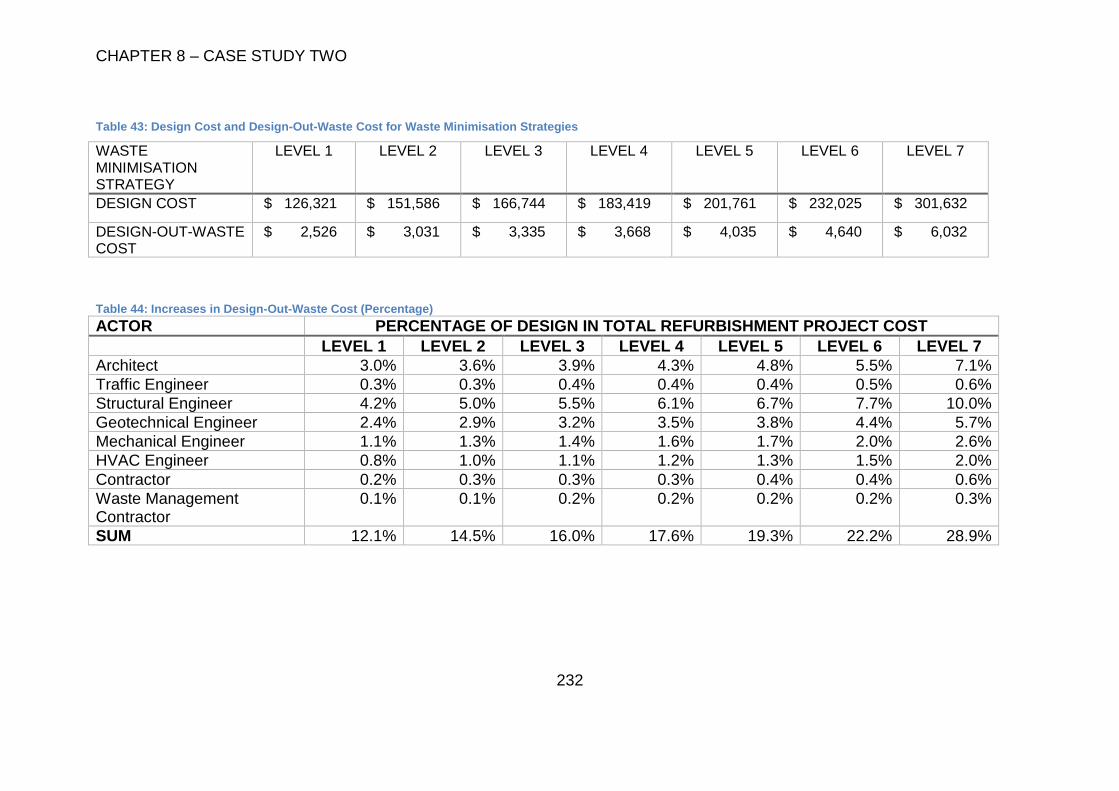
CHAPTER 8 – CASE STUDY TWO
232
Table 43: Design Cost and Design-Out-Waste Cost for Waste Minimisation Strategies
WASTE MINIMISATION STRATEGY
LEVEL 1 LEVEL 2 LEVEL 3 LEVEL 4 LEVEL 5 LEVEL 6 LEVEL 7
DESIGN COST $ 126,321 $ 151,586 $ 166,744 $ 183,419 $ 201,761 $ 232,025 $ 301,632
DESIGN-OUT-WASTE COST
$ 2,526 $ 3,031 $ 3,335 $ 3,668 $ 4,035 $ 4,640 $ 6,032
Table 44: Increases in Design-Out-Waste Cost (Percentage)
ACTOR PERCENTAGE OF DESIGN IN TOTAL REFURBISHMENT PROJECT COST
LEVEL 1 LEVEL 2 LEVEL 3 LEVEL 4 LEVEL 5 LEVEL 6 LEVEL 7
Architect 3.0% 3.6% 3.9% 4.3% 4.8% 5.5% 7.1%
Traffic Engineer 0.3% 0.3% 0.4% 0.4% 0.4% 0.5% 0.6%
Structural Engineer 4.2% 5.0% 5.5% 6.1% 6.7% 7.7% 10.0%
Geotechnical Engineer 2.4% 2.9% 3.2% 3.5% 3.8% 4.4% 5.7%
Mechanical Engineer 1.1% 1.3% 1.4% 1.6% 1.7% 2.0% 2.6%
HVAC Engineer 0.8% 1.0% 1.1% 1.2% 1.3% 1.5% 2.0%
Contractor 0.2% 0.3% 0.3% 0.3% 0.4% 0.4% 0.6%
Waste Management Contractor
0.1% 0.1% 0.2% 0.2% 0.2% 0.2% 0.3%
SUM 12.1% 14.5% 16.0% 17.6% 19.3% 22.2% 28.9%
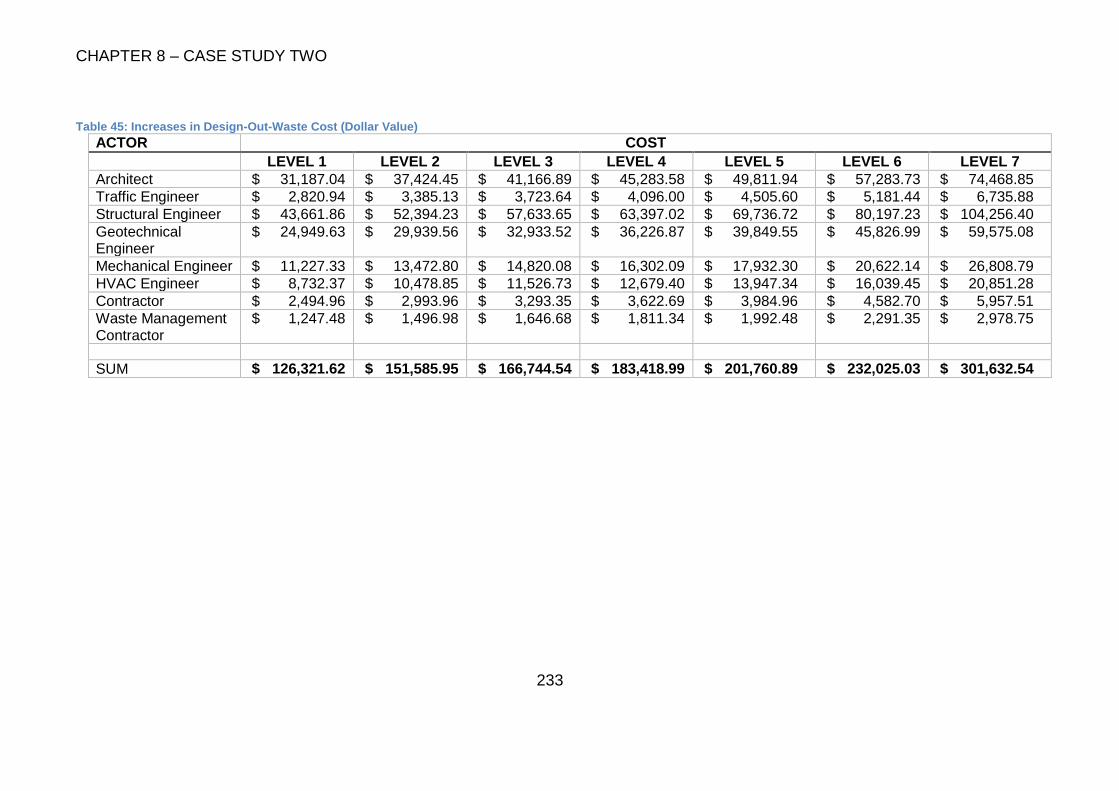
CHAPTER 8 – CASE STUDY TWO
233
Table 45: Increases in Design-Out-Waste Cost (Dollar Value)
ACTOR COST
LEVEL 1 LEVEL 2 LEVEL 3 LEVEL 4 LEVEL 5 LEVEL 6 LEVEL 7
Architect $ 31,187.04 $ 37,424.45 $ 41,166.89 $ 45,283.58 $ 49,811.94 $ 57,283.73 $ 74,468.85
Traffic Engineer $ 2,820.94 $ 3,385.13 $ 3,723.64 $ 4,096.00 $ 4,505.60 $ 5,181.44 $ 6,735.88
Structural Engineer $ 43,661.86 $ 52,394.23 $ 57,633.65 $ 63,397.02 $ 69,736.72 $ 80,197.23 $ 104,256.40
Geotechnical Engineer
$ 24,949.63 $ 29,939.56 $ 32,933.52 $ 36,226.87 $ 39,849.55 $ 45,826.99 $ 59,575.08
Mechanical Engineer $ 11,227.33 $ 13,472.80 $ 14,820.08 $ 16,302.09 $ 17,932.30 $ 20,622.14 $ 26,808.79
HVAC Engineer $ 8,732.37 $ 10,478.85 $ 11,526.73 $ 12,679.40 $ 13,947.34 $ 16,039.45 $ 20,851.28
Contractor $ 2,494.96 $ 2,993.96 $ 3,293.35 $ 3,622.69 $ 3,984.96 $ 4,582.70 $ 5,957.51
Waste Management Contractor
$ 1,247.48 $ 1,496.98 $ 1,646.68 $ 1,811.34 $ 1,992.48 $ 2,291.35 $ 2,978.75
SUM $ 126,321.62 $ 151,585.95 $ 166,744.54 $ 183,418.99 $ 201,760.89 $ 232,025.03 $ 301,632.54
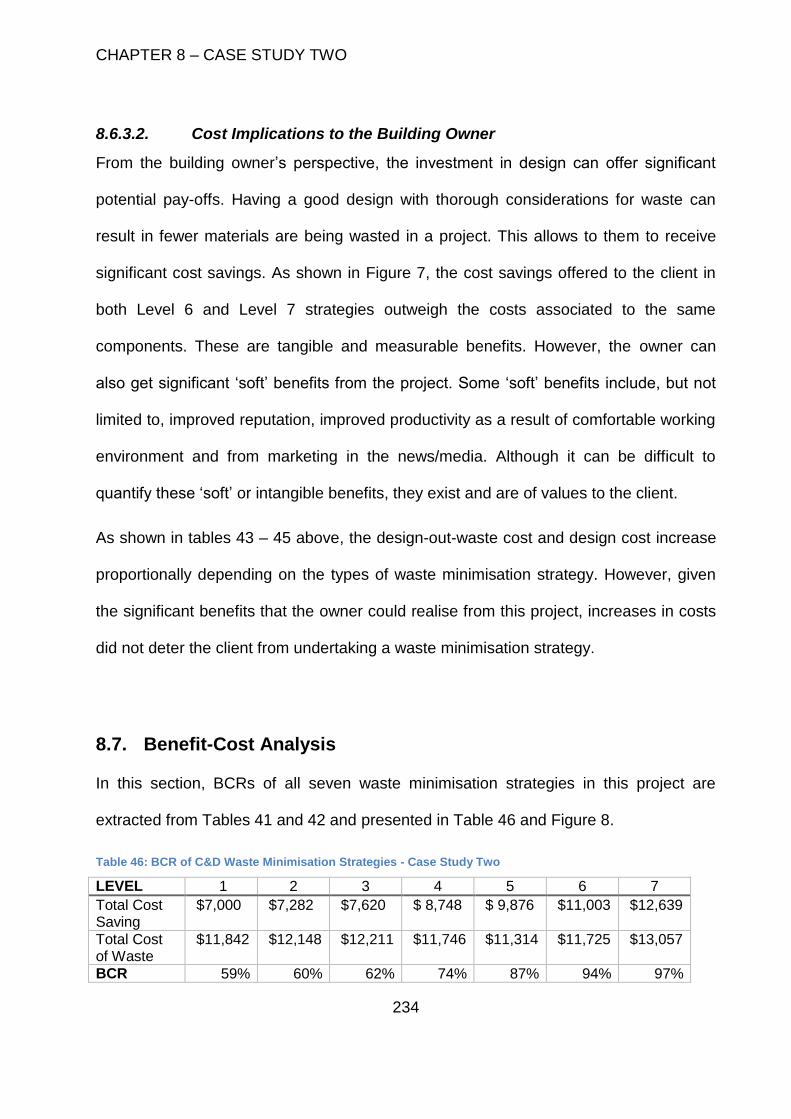
CHAPTER 8 – CASE STUDY TWO
234
8.6.3.2. Cost Implications to the Building Owner
From the building owner’s perspective, the investment in design can offer significant
potential pay-offs. Having a good design with thorough considerations for waste can
result in fewer materials are being wasted in a project. This allows to them to receive
significant cost savings. As shown in Figure 7, the cost savings offered to the client in
both Level 6 and Level 7 strategies outweigh the costs associated to the same
components. These are tangible and measurable benefits. However, the owner can
also get significant ‘soft’ benefits from the project. Some ‘soft’ benefits include, but not
limited to, improved reputation, improved productivity as a result of comfortable working
environment and from marketing in the news/media. Although it can be difficult to
quantify these ‘soft’ or intangible benefits, they exist and are of values to the client.
As shown in tables 43 – 45 above, the design-out-waste cost and design cost increase
proportionally depending on the types of waste minimisation strategy. However, given
the significant benefits that the owner could realise from this project, increases in costs
did not deter the client from undertaking a waste minimisation strategy.
8.7. Benefit-Cost Analysis
In this section, BCRs of all seven waste minimisation strategies in this project are
extracted from Tables 41 and 42 and presented in Table 46 and Figure 8.
Table 46: BCR of C&D Waste Minimisation Strategies - Case Study Two
LEVEL 1 2 3 4 5 6 7
Total Cost Saving
$7,000 $7,282 $7,620 $ 8,748 $ 9,876 $11,003 $12,639
Total Cost of Waste
$11,842 $12,148 $12,211 $11,746 $11,314 $11,725 $13,057
BCR 59% 60% 62% 74% 87% 94% 97%
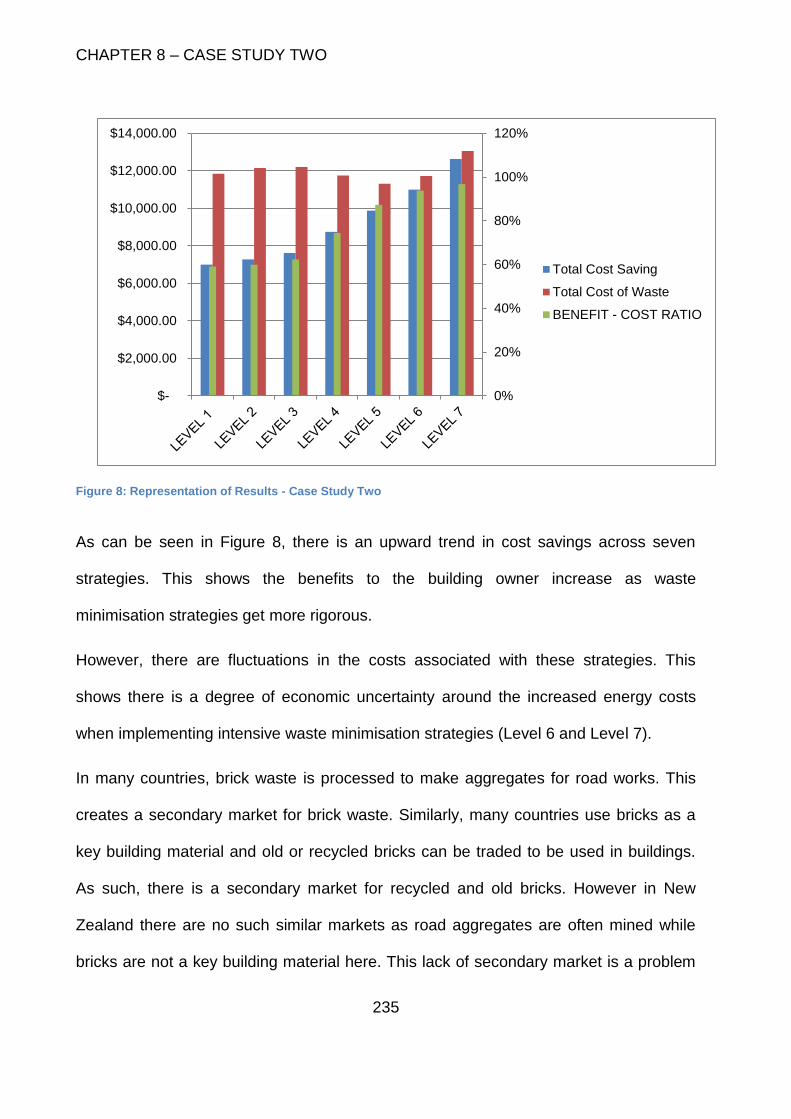
CHAPTER 8 – CASE STUDY TWO
235
Figure 8: Representation of Results - Case Study Two
As can be seen in Figure 8, there is an upward trend in cost savings across seven
strategies. This shows the benefits to the building owner increase as waste
minimisation strategies get more rigorous.
However, there are fluctuations in the costs associated with these strategies. This
shows there is a degree of economic uncertainty around the increased energy costs
when implementing intensive waste minimisation strategies (Level 6 and Level 7).
In many countries, brick waste is processed to make aggregates for road works. This
creates a secondary market for brick waste. Similarly, many countries use bricks as a
key building material and old or recycled bricks can be traded to be used in buildings.
As such, there is a secondary market for recycled and old bricks. However in New
Zealand there are no such similar markets as road aggregates are often mined while
bricks are not a key building material here. This lack of secondary market is a problem
0%
20%
40%
60%
80%
100%
120%
$-
$2,000.00
$4,000.00
$6,000.00
$8,000.00
$10,000.00
$12,000.00
$14,000.00
Total Cost Saving
Total Cost of Waste
BENEFIT - COST RATIO
CHAPTER 8 – CASE STUDY TWO
236
for many types of recycled materials, not just bricks. And as a result, a significant
economic uncertainty is created around the opportunities around, and the resale values
of, recycled materials.
Despite this uncertainty, there is an upward trend in the BCRs across all seven
strategies considered.
8.7.1. BCR of Level 1
Of all strategies under consideration, waste strategy Level 1 offers the lowest BCR of
59%. This strategy has the lowest benefits offered to client. From an investment
perspective, this strategy is unlikely to be implemented, given its low level of economic
efficiency.
8.7.2. BCR of Level 2 and Level 3
The BCRs of Level 2 and Level 3 are similar to that of Level 1 (at 60% and 62%
respectively). From an investment perspective, these strategies are also unlikely to be
implemented, given the low levels of return on investment.
8.7.3. BCR of Level 4
This strategy offers the owner a relatively high degree of economic efficiency, with BCR
equalling 74%. This is a mid-tier strategy, with a high cost of waste and a moderate
return level (benefits). This strategy may be worth considering, given its high economic
efficiency level. The only downside of this strategy is its low level of waste reduction
(31%). Therefore, it is worth exploring other alternatives before settling for this option.
CHAPTER 8 – CASE STUDY TWO
237
8.7.4. BCR of Level 5
Under this strategy, at least 51% of C&D waste must be reduced and diverted from
landfill. This is a significant waste minimisation requirement and thus has required a
significant level of investments in design and implementation. Due to a relatively high
level of investment it has received, the baseline waste minimisation strategy has
achieved a high degree of economic efficiency. The BCR of this strategy equals 87%.
Overall, this strategy has a relatively low energy cost compared to Level 6 and Level 7
strategies. However, the costs of waste disposal and material waste remain higher than
those of Level 6 and Level 7 strategies. Nevertheless, this strategy is worth considering,
given its high economic efficiency level and relatively high waste reduction rate.
8.7.5. BCR of Level 6 and Level 7
Both Level 6 and Level 7 waste minimisation strategies can offer the client similar
economic efficiency rates (94% and 97%, respectively). It can be observed that BCRs
of Level 6 and Level 7 strategies are similar and coupled with the high waste reduction
rates, both Level 6 and Level 7 can provide the building owner value for money. It is
thus worth comparing the Level 6 waste minimisation strategy and the Level 7 zero
waste strategy. This comparison is useful because it can help identify an optimal waste
minimisation strategy for this case.
Overall, Level 6 has a much lower cost in three main cost categories than the zero
waste strategy. These categories are design-out-waste, recycling and reusing waste.
However, since Level 6 strategy can only reduce 71% of C&D waste, there is still a
significant wastage present in this strategy. This in turns means that the costs
CHAPTER 8 – CASE STUDY TWO
238
associated with waste disposal and material waste in Level 6 strategy is much higher
than those in the zero waste strategy.
In a zero waste strategy there is no cost of disposal, as all ‘waste’ is now ‘resources’ for
industrial processing; thus eliminating the need to dispose of waste to landfills. At the
same time, the building owner also achieves significant increases in cost savings due to
this elimination. The net effect of decreased costs and improved benefits is the BRC
under this strategy has increased slightly (97% compared to 94% in Level 6 strategy).
This minor increase in BCR is due to the aggressive steps taken in minimising waste
streams.
However, as argued in Chapter 7, it may not be possible to achieve zero waste, as it is
an idealised concept. As such, in reality the Level 7 waste minimisation is impractical
despite its high economic efficiency yielding. On the other hand, Level 6 waste
minimisation is achievable, and has been achieved in this actual case study. As both
strategies give the client (i.e. the building owner) similar economic efficiencies that are
close to 100%, and Level 6 is more achievable than Level 7, it is contended in this
research that the Level 6 waste minimisation is the optimal strategy for this case study.
Therefore, it can be argued that it is worth undertaking a waste minimisation in this
case; but the waste minimisation rate must be at least 71% to ensure an appropriate
level of returns on investment.
CHAPTER 8 – CASE STUDY TWO
239
8.8. Findings
8.8.1. Waste Strategy Level 1 – Landfilling
From the analysis sections, there is little value to the client in disposing of C&D waste to
landfill. By sending brick waste to landfill, the owner gets little economic benefit. The
only benefit the client could receive in this strategy is the savings from onsite labour
costs from waste segregation. However, the owner was still liable for a cost for
disposing of such waste, meaning they would end up paying twice for the same
material. Initially the client must pay for the new and virgin materials for the construction
of the building. Then once some bricks are demoted to ‘waste’ during the construction
process, the client must also pay a fee to dispose of this waste.
Further, as shown in the framework, a high landfill charge of $150 per tonne makes the
practice of disposing of waste an expensive option. Because of this the client should
start to look for approaches to reduce their brick waste output.
8.8.2. Levels 6 and 7 Waste Minimisation Strategies
Unlike the ‘landfill’ option, the building owner can get significant economic advantages
from higher-level waste minimisation strategies such as those in Level 6 and Level 7.
These advantages include opportunities to save on materials (as limited wastages
occur or end up in landfills under these strategies); opportunities to save on
transportation costs (as materials can be delivered on demand, and minimal dumping
trucks required under these strategies); and opportunity to on-sell the excess materials
to secondary markets.
CHAPTER 8 – CASE STUDY TWO
240
In addition, under waste minimisation strategies, the client has an opportunity to engage
closely with other stakeholders such as architects, engineers and contractors to
manage and minimise waste. These collaborations can be explicitly expressed via
penalty/incentive schemes to encourage the stakeholders to uptake waste management
practices throughout the project. It has been argued by Tam & Tam (2008) that an
introduction of a penalty/incentive scheme can enhance the chance of achieving the
project’s waste minimisation goals. However, in a similar manner to that in Chapter 7,
this avenue is not considered in the economic modelling in this case study. But as
shown in the analysis above, waste minimisation and zero waste strategies are viable
and more economically more efficient than the ‘do-nothing’ strategy, i.e. landfilling
waste.
It has been observed by the researcher that the implementation of a penalty/incentive
scheme will likely require a robust contractual agreement between project partners as
well as a comprehensive waste management/waste minimisation plan. This means
such a penalty/incentive scheme, if introduced, may increase the cost component
significantly compared to the ‘landfill’ strategy. But as shown in the analysis above, the
economic benefits offered by the ‘waste minimisation’ and ‘zero waste’ strategies can
outweigh the additional administrative costs of a waste minimisation strategy. As such,
there may be room to include a penalty/incentive scheme. However, since this area is
outside the scope of the study, there is no way to confirm or deny this observation. This
is indeed an opportunity for subsequent research to explore.
Aside from the direct economic benefits that the client can derived from waste
minimisation and zero waste strategies, the client can also obtain many intangible
benefits from having ‘waste minimisation’ and ‘zero waste’ strategies in their projects.
CHAPTER 8 – CASE STUDY TWO
241
These include opportunities to improve their reputations and credentials, thus
increasing the opportunities to market their brand/image. In turns, the project creates an
opportunity to increase the value for the education provider via highly competitive
rentals to tenants. Further, it has been informed that the development has contributed
significantly to the increased morale and productivity of staff and students.
As noted in Chapter 6, for the purpose of this study, an assumption on the value of
intangible benefits of ‘waste minimisation’ and ‘zero waste’ strategies has been made.
Specifically, the intangible benefits that the client gets from these strategies are
assumed to be $7,000.
As shown in Section 8.7, with such a conservative value for the intangible benefits, the
client can achieved high levels of economic efficiencies. Therefore, it can be concluded
that there are indeed values in minimising the C&D waste in this case study.
As both Level 6 waste minimisation and the Level 7 zero waste strategies can offer the
client a high level of economic efficiency, the client has imperatives to implement either
of these options. However, it has been argued in the analysis section that perhaps
Level 6 waste minimisation strategy is the optimal option for the client. Therefore, the
research recommends the client to choose this option.
8.8.3. Implications of landfill charge variable
The analyses above have also shown the variable ‘landfill charges’ can have a
significant influence on the management or minimisation strategies of C&D waste. By
setting the landfill charges at $150 per tonne, this study has observed major impacts
this variable has on both the cost incurred, and the benefits gained, by the client. This is
CHAPTER 8 – CASE STUDY TWO
242
because landfill charges increase, it becomes more expensive to dispose of waste. It is
anticipated that this high disposal fees will have a deterrent factor to discourage waste
disposal.
At the same time, the client is incentivised to manage and minimise C&D in their
projects due to the significant economic benefit potentials offered by such practices.
Potential benefits to the clients include, but not limited to, cost-savings and resale of
excess materials. In a way, the variable ‘landfill charges’ has a positive influence on the
benefits obtained by the client from their waste management/waste minimisation
strategies. This finding is important because it confirms the long-held belief in the New
Zealand construction industry that increasing landfill charges will induce behavioural
change in the industry regarding its waste minimisation.
8.8.4. Limitation
Through this case study, the research has demonstrated that the proposed framework
is could be applied to a single waste stream. Coupled with findings in Chapter 7, this
study has shown the flexibility of this economic evaluation framework.
However, the weakness of this study is it currently focuses on only one fixed area:
landfill fee of $150 per tonne of waste. This makes this study one-dimensional. There
are many factors that can have significant effects on the success of a waste
minimisation strategy. Further, many of such factors are interlinked or inter-related.
Thus by making ‘landfill fees’ the one key focus, this study does not, and cannot, exhibit
the true extend of the problem related to C&D waste minimisation in New Zealand.
However, this chosen paradigm is necessary given the limited time and scope imposed
on the study reported in this thesis. Subsequent studies can be carried out to establish
CHAPTER 8 – CASE STUDY TWO
243
other variables that have significant effects on the success of a waste minimisation
strategy. This will help the industry to understand these variables better and how they
can affect a zero waste aspiration in New Zealand construction.
8.9. Operatives in C&D Waste Minimisation
It is contended that everyone involved in the project has an important role to play to
ensure a waste minimisation strategy meets its intended objectives. This section briefly
discusses the roles and responsibilities of key participants. Although the focus of the
discussion rests on the design phase, their respective responsibilities also extend to the
construction and operation stages.
8.9.1. Client and Project Manager (client side)
The client and the project manager in this case study is one and the same. The client
used their internal staff to look after the project so they understand the organisation’s
requirements well.
It was informed by the client in this case study that they worked hard to ensure their
objectives were met. As a result, they were involved in all stages of the development,
including construction.
However, it was informed by the client that they had the greatest influence on the waste
minimisation agenda at the design stage. It is at this stage that they could set project
targets and strategies, including a waste minimisation strategy.
CHAPTER 8 – CASE STUDY TWO
244
8.9.2. Designers
Designers such as architects and engineers have an important role in the waste
minimisation strategy. Efficient designs can help reduce wastage in the construction
phase. In this case study, the client employed their internal staff to carry out
architectural design while using external engineering firms to undertake engineering
designs.
The client realised the importance of collaboration between organisations in the design
team, as each commercial design entity would have their own agendas. As such, efforts
were made to ensure such collaboration worked.
Further, the designers were involved in supervision of the building construction to
ensure all systems work as designed and that wastages could be minimised
accordingly.
8.9.3. Contractors
Contractors have a major role in ensuring all waste minimisation goals are met during
construction. This role can also extend to the design stage, although their involvements
can be more limited than other participants such as the designers.
During design, the contractors can be involved to provide inputs on the constructability
and areas which they think waste could be minimised. The involvement of the
contractor during the design phase can provide significant value to the overall design.
They can bring in with them a wealth of knowledge and experience regarding
constructability and building systems. In turns this can ensure the building is functional
while meeting waste minimisation targets in the construction stage.
CHAPTER 8 – CASE STUDY TWO
245
For contractors, it is possibly at the construction phase that they have the greatest
influence on waste minimisation. The contractors would be responsible for every aspect
of the construction stage. This means they have the power to make sure C&D waste is
properly sorted, reused or recycled. This could be done through influencing onsite
operatives and subcontractors. Contractors may have opportunities to identify areas to
reduce waste further when construction commences.
However, from a commercial perspective there must be incentives for the contractors to
undertake waste minimisation practices onsite. One such incentive is for the client to
engage the contractors early and get them involved in the design stage. By being
involved in the design phase, the contractors have an opportunity to earn extra incomes
aside from their tendered prices. Although the money earned through this involvement
may be relatively small compared to the tendered prices, this early engagement allows
the contractors to have a good understanding of the project. It also gives the
contractors a sense of ownership of the project, which in turns encourages the
contractors to undertake waste minimisation during construction.
8.10. Validation Summary
Telephone interviews were made with the same professionals who participated in the
phase one interviews. However, because several professionals have changed jobs or
were unable to answer phone calls, 15-minutes telephone interviews with available
participants were restricted to only three of the original seven professionals (numbers 1,
5 and 6). Interview questions and interview transcripts can be found in Appendix C and
Appendix D, respectively.
CHAPTER 8 – CASE STUDY TWO
246
In general, the feedback from the participants has helped confirm the findings of this
research:
• it is not possible to reuse and recycle all C&D waste (i.e. zero waste).
• optimal range for waste reduction rate obtained in this study (71% - 78%) was
realistic and is achievable in the New Zealand construction industry
• design-out-waste is an effective way of minimising C&D waste
• incentives can help reduce, reuse and recycle C&D waste
8.11. Conclusion
This chapter has demonstrated the applicability of this economic framework to the
evaluation of waste minimisation strategies for the brick waste stream in a
refurbishment project. The results obtained show that the client can get significant
values from waste minimisation. In addition, other parties involved in the waste
minimisation strategy can also obtain some economic benefits. Finally, waste
minimisation strategies were analysed so a recommendation on an optimal waste
minimisation strategy for this case study could be made.
This case study also explored roles and responsibilities of participants of the waste
minimisation strategy to provide a good understanding of the contributing factors to a
successful waste minimisation strategy.
This case study further demonstrated the flexibility of the proposed economic
framework with its application to a single waste stream. In turns, an understanding of
this flexibility allows the framework to be used to evaluate the values of C&D waste
minimisation in New Zealand.
CHAPTER 9 – CONCLUSION
247
CHAPTER 9 – CONCLUSION
CHAPTER 9 – CONCLUSION
248
9.1. Introduction
This thesis has contributed to the understanding of C&D waste minimisation economics
in New Zealand. The thesis has explored areas relevant to C&D waste minimisation
and zero waste. Subsequently an economic evaluation framework was developed to
identify optimal waste minimisation strategies for building construction projects. It is
intended that further research can be undertaken to refine and improve this framework.
The purpose of this chapter is to provide a research overview and summarise key
findings and conclusions regarding the specific research questions and objectives. It
also states the contribution to knowledge this study has made as well as
recommendations for future research.
9.2. Conceptual and Theoretical Challenges
Chapter 1 outlined the problem associated with C&D waste in construction worldwide
as well as that in New Zealand.
Due to a lack of theoretical basis for zero waste, Chapter 2 introduced a conceptual
model to represent the theoretical construct of zero waste in construction setting. This
conceptual model allowed for a systematic review of literature related to C&D waste
minimisation and zero waste. In turns, the literature review provided a good
understanding of issues and challenges in C&D waste minimisation as well as
necessary actions required to address those issues.
It was revealed in Chapter 2 that the most important factor in C&D waste minimisation
is the economics of such a strategy. This finding is important for New Zealand.
CHAPTER 9 – CONCLUSION
249
Currently the country is experiencing a construction boom in Auckland and
Christchurch. It is therefore essential that it has appropriate strategies to address C&D
waste in order to meet its long-term sustainability goals.
In the past, New Zealand often looked to the United Kingdom (UK) for guidance and
adopted their strategies accordingly. However, in C&D waste minimisation, this strategy
may not work, as the underlying dynamics of the construction industries in the UK is
different to that in New Zealand. For instance, while the UK construction can get access
to cheap labour from Eastern Europe relatively easily due to its connectedness with
Europe, it is comparatively more difficult for New Zealand construction to access
cheaper labour due to its location in the middle of the Pacific Ocean. Therefore, to
effectively address its C&D waste problem, New Zealand must develop its own C&D
waste minimisation strategy. Given the importance of economic considerations, the first
step is to develop a framework to evaluate the economics of C&D waste minimisation
strategies in the New Zealand construction industry.
9.3. Research Problem
Currently there is a lack of tools to comprehensively evaluate the economics of C&D
waste minimisation strategies in New Zealand. This means appropriate stakeholders in
construction are not well-informed of the values of waste minimisation and waste
minimisation strategies. In turns this lack of understanding can have detrimental effects
on the efforts to minimise C&D waste.
The problems investigated in this research may be summarised as:
CHAPTER 9 – CONCLUSION
250
• Currently there is a lack of an understanding of factors affecting C&D waste
minimisation strategies in New Zealand
• Currently there is a lack of an established economic evaluation framework to
evaluate and establish optimal waste minimisation strategies for building
projects
9.1. Restatement of Research Objectives
The research objectives are:
1. To identify factors that may have significant effects on C&D waste minimisation
in New Zealand construction
2. To identify actions needed to encourage the uptake of C&D waste minimisation
in New Zealand construction
3. To formulate a framework to evaluate the economics of C&D waste management
strategies available to New Zealand construction
9.2. Objective One
9.2.1. Objective Statement
TO IDENTIFY FACTORS THAT MAY HAVE SIGNIFICANT EFFECTS ON WASTE
MINIMISATION IN THE NEW ZEALAND CONSTRUCTION INDUSTRY
The review of literature in Chapter 2 has revealed there are many factors that can affect
a waste minimisation strategy. These include external factors (such as government
regulations and economic conditions), internal factors (such as the industry’s
CHAPTER 9 – CONCLUSION
251
fragmented nature and technology). These factors have been discussed and studied in
great details overseas. Further, they are postulated to have significant effects on
potential successes of C&D waste minimisation strategies. However, in New Zealand
there is a severe the lack of knowledge on the economic impacts of these factors on
waste minimisation strategies. In turns this is perhaps the main impediment for New
Zealand to undertake meaningful steps to address C&D waste.
In this study, efforts have been made to understand factors affecting C&D waste
minimisation in New Zealand construction. This is important because without this
knowledge, it is difficult to develop meaningful economic models to evaluate C&D waste
minimisation strategies in New Zealand. Objective One was established for this goal,
i.e. to understand these factors from the industry’s perspective.
9.2.2. Method
This objective was achieved via an interviewing technique called ‘elite interviewing’.
This method was undertaken with willing practising professionals in construction. To
ensure the study meets all stringent requirements needed for an academic research,
the research ethics for approval was sought and approved by the AUT Ethics
Committee. The ethics approval letter is included in the Appendix E for reference.
CHAPTER 9 – CONCLUSION
252
Semi-structure elite interviewing method was carried out with seven practising
professionals in the New Zealand construction industry. These professionals come from
different background, including:
• A Project Director with 40 years of work experience in NZ
• A Waste Management Consultant with 35 years of work experience in NZ
• A Senior Architect with 20 years of work experience in both the UK and NZ
• A Senior Project Manager with 20 years of work experience in NZ
• A Construction Manager with 20 years of work experience in the UK and NZ
• A Construction Manager with 15 years of work experience in the UK and NZ
• A Product Category Manager with 11 years of work experience in NZ
construction supply chain management
Overall, the comments and feedback obtained from the interviews were useful for this
research. This is due to the fact that all interviewees are senior managers of their
respective companies and have had extensive involvements in the New Zealand
construction industry. This means there is a wealth of knowledge and experience that
the interviewers possess. As a result, not only are their feedbacks useful for this study,
to a degree they are a reflection of the understanding within this industry regarding C&D
waste minimisation.
The collected data were analysed with the aid of Microsoft ExcelTM. Using this software,
useful information on C&D waste minimisation can be tabulated and extracted from
interview results. Subsequently, key variables affecting C&D waste minimisation could
be identified.
CHAPTER 9 – CONCLUSION
253
9.2.3. Findings
9.2.3.1. Incentives as key drivers for waste minimisation
It has been shown in the literature that by having an appropriate incentive scheme,
significant waste reduction can be achieved (Tam & Tam, 2008). In other words, the
(financial) incentives act as a lever to influence the behaviours of companies and
operatives in the quest to reduce C&D waste. In New Zealand, there are some incentive
schemes, such as the Green Building and Green Star Certification. And they have
shown some success in waste reduction.
By contrast, it was found from the interviews that with the current technology and skills,
it is possible to reduce and recycle C&D waste in New Zealand. However, the reason
the uptake of waste minimisation remains low (and slow) is due to the lack of economic
incentives offered to companies. As money a key economic driver in construction, the
lack of monetary incentives has discouraged construction companies to adopt C&D
waste minimisation practices. As a result, waste reduction is not considered a high
priority in building construction projects.
Further, it is contended that having incentive schemes is not enough. There needs to be
penalty schemes to the similar effect. A penalty scheme is the reverse of an incentive
scheme in that contractors can be penalised for their generation of C&D waste. It is
anticipated that a combination of incentive – penalty scheme can strengthen the
encouragement/enforcement of waste minimisation in the New Zealand construction
industry. This is because on the one hand construction companies can be rewarded for
effective management of C&D waste. On the other hand, they could be penalised for
ineffective C&D waste management. However, a lack of an incentive – penalty scheme
CHAPTER 9 – CONCLUSION
254
in New Zealand is a missed opportunity and one which could be addressed in
subsequent studies.
9.2.3.2. Design-out-waste as a key consideration in projects
The interviews also revealed a common belief in construction that C&D waste
minimisation has the greatest impacts at the design stage. This perception is consistent
with findings in the literature review (see, for example, Chong et al, 2009; WRAP,
2012). It has been argued by WRAP that design-out-waste should be a key
consideration at the design stage in any project to ensure a maximum waste reduction
can be achieved (WRAP, 2007, 2009, 2011).
Further, it was indicated in the interviews that having the design-out-waste
considerations at design stage do not generally increase the additional cost
significantly. Instead, the cost of design-out-waste is so small that sometimes the costs
of waste minimisation-focused designs are the same as those of non-waste
minimisation-focused designs. However, design-out-waste is not placed high in the
project agenda due to the (wrongfully) perception that it would increase the project cost
significantly.
This is finding is consistent with those of WRAP studies. The finding also shows there is
much work to be done to 1) educate people in the construction industry of the value of
design-out-waste; and 2) to change the perception that designs with design-out-waste
components are more expensive than conventional designs (WRAP, 2007, 2009,
2011).
CHAPTER 9 – CONCLUSION
255
9.2.3.3. Landfill charges as key economic factor in waste minimisation
It was also found from the interviews that landfill charges imposed on C&D waste
disposal is a major variable that can have significant effects on the success of a C&D
waste minimisation strategy.
Currently in New Zealand, there are no schemes to differentiate or categorise distinct
types of waste streams, leading to a situation where it is more economical to dispose of
C&D waste than it is to reuse and recycle C&D waste. And this is done at the expense
of the environment. Therefore, the interviewees argued that there is an urgent need for
a fee charging scheme that is specific to C&D waste in order to change construction’s
current waste disposal behaviours.
In specific, there is a common perception among the interviewees that the current C&D
waste landfill charges are too low. They argued that a higher landfill charge for C&D
waste is urgently needed to deter polluters from disposing of C&D waste in landfills.
9.2.4. Implications
9.2.4.1. Implications for New Zealand Construction
The interview results show that there is still much work that needs to be done in C&D
waste minimisation in New Zealand. The industry’s high dependency on the changes of
landfill charges means that it is vulnerable to the external environments. As such, there
is an urgent need for the industry to address this vulnerability.
One approach is for the New Zealand construction industry to establish a closer
working relationship with the waste management industry to manage and minimise the
C&D waste outputs. This could be achieved through contractual agreements or via
collaboration. In the former category, specific requirements regarding C&D waste
CHAPTER 9 – CONCLUSION
256
management such as recycling rates can be tightly incorporated and elaborated in the
contracts for services. This can ensure construction companies meet their waste
management and/or minimisation targets. However, the downside of this option is the
cost, as waste management companies will likely charge construction companies a
premium for such services. In the latter category, construction companies are likely
required to establish a long-term working relationship with waste management
companies to ensure the collaboration in C&D waste management is beneficial for
everyone. Although this option may be less costly to construction companies compared
to the former, it is more time-consuming, as it requires both parties to spend time and
effort to work towards a common goal.
Another approach is for the industry to create an internal industry-driven decision-
making mechanism to promote and encourage C&D waste minimisation in NZ
construction. This is because it has been observed that for any construction-related
programme to be sustainable, it must be driven internally by the industry itself. Such a
decision-making framework can helpful for the industry, as it provides a platform for the
industry as a whole to work towards a common goal of minimising C&D waste.
Moreover, such a framework can help the industry to create and drive initiatives such as
an industry-specific incentive-and-penalty scheme in order to achieve this goal.
9.2.4.2. Implications of this Study
The information obtained from the interviews was particularly helpful for this study.
Based on this information, a contextual framework representing the economics of C&D
waste minimisation in New Zealand construction was developed.
CHAPTER 9 – CONCLUSION
257
9.3. Objective Two
9.3.1. Objective Statement
TO IDENTIFY ACTIONS NEEDED TO ENCOURAGE THE UPTAKE OF ZERO
WASTE IN NEW ZEALAND CONSTRUCTION
9.3.2. Method
The approach undertaken to achieve Objective Two is similar to that in Objective One.
Specifically, one-on-one semi-structured elite interviews were employed to help identify
necessary actions required to encourage the uptake of waste minimisation in New
Zealand construction. Further, the interviews were carried out with the same seven
practicing professionals in the NZ construction industry. Interview results in this
objective were used as basis for the modelling process.
9.3.3. Findings
9.3.3.1. High landfill charges as deterrent to C&D waste disposal
As briefly mentioned in Section 9.2.3.3 above, there is a consensus among
interviewees that there is a need for New Zealand to increase landfill charges. The
rationale for this suggestion is that since money is a key factor in decision-making in
construction, a high fee for C&D waste disposal can, and will, force companies in the
construction industry to reconsider their current practice of disposing of C&D waste to
landfills. This is because high landfill charges will make disposing of waste in landfills
become an expensive exercise which will affect companies’ financial bottom line. Over
CHAPTER 9 – CONCLUSION
258
the long term, it is anticipated that this will make the construction industry more
responsible for its actions around C&D waste.
The consensus from the construction professionals is that the landfill C&D waste
disposal fee of $150 per tonne is appropriate. It is felt that the current C&D waste
landfill charge of $10 per tonne is too low and is an impetus for construction companies
to continue the practice of dumping waste in landfills. It is anticipated that a 1500%
increase in landfill charges will change this behaviour because this high fee will make it
very expensive for construction companies to continue their current practice: disposing
of waste in landfills.
9.3.3.2. Rigorous waste minimisation strategies equals large cost savings
It was revealed in the interviews that there are many benefits associated with C&D
waste minimisation, including direct terms (such as cost savings) as well as indirect
terms (such as improved reputation). Further, all benefits have their associated values;
and such values can be monetised or cost otherwise. Therefore, these benefits need to
be evaluated accordingly.
There are many materials available in New Zealand outlining this fact (BRANZ, 2009;
ITM, 2013). However, the fact that C&D waste remains a large portion of all landfill
waste means that perhaps this is due to the attitude of operatives within the
construction industry regarding C&D waste. It has been shown in overseas studies that
attitudes and perceptions around C&D waste can have significant influence on the
actions of C&D waste minimisation (Teo & Loosemore, 2001; Kulatunga et al, 2006;
Begum et al, 2006; Afroz et al, 2008). As such, there needs to be a comprehensive
CHAPTER 9 – CONCLUSION
259
educational framework setup to provide a good understanding of issues with C&D
waste, and benefits of C&D waste minimisation.
For such an ambitious programme to work, there needs to be commitment from key
stakeholders in construction. These key stakeholders include, but not limited to,
relevant government departments, key industry bodies, construction companies and
education providers. Further, these key stakeholders must work collaboratively to
ensure tangible outcomes around C&D waste minimisation can be achieved. Such an
educational programme can be complex and costly to set up and run, as it involves
many parties with differing interests. However, it is anticipated that such an educational
programme will provide significant benefits to the construction industry via reduced
wastages and increased cost savings. Longer term, this in turns can help the New
Zealand construction industry to be more sustainable.
9.3.4. Implications
9.3.4.1. Implications for NZ Construction
It was generally acknowledged by the interviewees that in the short-term, the high
landfill charging fee of $150 per tonne will deter polluters from disposing C&D waste
into landfill. This is because companies will avoid sending waste to landfills in order to
save costs.
However, at the same time they may find other ways to get rid of the C&D waste. And
this may lead to increased illegal dumping of C&D waste materials.
Therefore, appropriate strategies are needed to minimise adverse environmental effects
that may arise from this proposal. Over the long-term, it is anticipated that construction
CHAPTER 9 – CONCLUSION
260
companies will adjust to this new working environment and minimise their C&D waste
accordingly.
It is also anticipated that as more C&D waste being recycled and repurposed, it could
also create additional economic opportunities such as second-hand markets for
recycled construction materials or niche recycling markets of companies. Not only do
such opportunities help stimulate and encourage waste minimisation actions but they
also have a role in creating additional employment opportunities and additional wealth
for communities. In this sense, the construction industry has an indirect contribution to
the economic development of the wider society.
9.3.4.2. Implications of this Study
As previously stated, the aim of this research is to understand the economics of a zero
waste strategy in the New Zealand construction context and to identify the most
economically optimal waste minimisation strategy in building projects. To achieve this
goal, the current study develops an economic evaluation framework based on feedback
obtained from Objective One and Objective Two.
As identified in these two research objectives, ‘landfill charge’ is the key variable
affecting C&D waste minimisation strategy in New Zealand. As a result of this finding,
the variable ‘landfill charge’ is incorporated into the modelling process. Further, the
landfill charge for C&D waste is set at $150 per tonne. The reason for choosing this
value is to test the hypothesis obtained from the qualitative part of the research: ‘landfill
charge of $150 per tonne can deter polluters from disposing C&D waste to landfills’.
It is anticipated that this approach allows the research to analyse in detail the economic
effects of landfill charges on C&D waste minimisation strategies. By understanding this
CHAPTER 9 – CONCLUSION
261
variable, it is further anticipated that the industry can take appropriate actions and
strategies to facilitate a successful C&D waste minimisation programme in New
Zealand.
9.4. Objective Three
9.4.1. Objective Statement
TO FORMULATE A FRAMEWORK TO EVALUATE THE ECONOMICS OF C&D
WASTE MANAGEMENT STRATEGIES AVAILABLE TO NEW ZEALAND
CONSTRUCTION
Based on relevant qualitative data collected from interviews, an economic framework
was developed to evaluate the economic values of appropriate C&D waste minimisation
strategies, including zero waste. The economic evaluation framework developed in this
research is mathematical-based and is based on results obtained from interviews.
In economics, mathematical-based modelling is often employed to fulfil requirement of
economic evaluation (see, for example: Doppelt & Dowling-Wu, 1999; Begum et al,
2006; Yuan et al., 2011; Hogg et al, 2011; Till, 2013). Given that the specific
requirement of this study is to evaluate the economics of C&D waste minimisation
strategies, it makes sense that this study also uses mathematical modelling as basis for
analysis. As stated in Chapter 5, the focus of the study is on the client’s perspective
regarding C&D waste minimisation, with a ‘client’ being defined as the building owner.
CHAPTER 9 – CONCLUSION
262
9.4.2. Method
To account for the time value of money, wherever appropriate the study employs a
common accounting technique called Net Present Value (NPV). NPV is a powerful
method that takes into account the value of money through time based on discount
rates. As projects under consideration in this study are multi-year projects, NPV is
appropriate to account for time value of money. As a result, NPV would be used
wherever applicable in this study.
In addition, the study also employs a wide range of economic evaluation techniques
such as Economic Impact Analysis (EIA), Benefit-Cost Analysis (BCA) and Cost
Effective Analysis (CEA) to help analyse the results. The combination of these
economic evaluation techniques helps the study convey its results effectively.
To test the applicability of the models developed, the study employs ‘case study’
research. Two case studies were chosen: a new construction of an education centre
and a refurbishment of an office building. The first case study focusses on the economic
evaluation of six waste streams whereas the second case study focuses on one waste
stream (brick waste). The reason for this choice is to demonstrate the flexibility of the
framework developed in this research: the framework could be used to evaluate either a
single waste stream or a range of waste streams.
The research considers seven waste strategies. These strategies range from the most
basic strategy (such as landfilling waste) to the most ambitious level (such as zero
waste). The rationale for the chosen range of waste strategies for this research was
offered in Chapter 6.
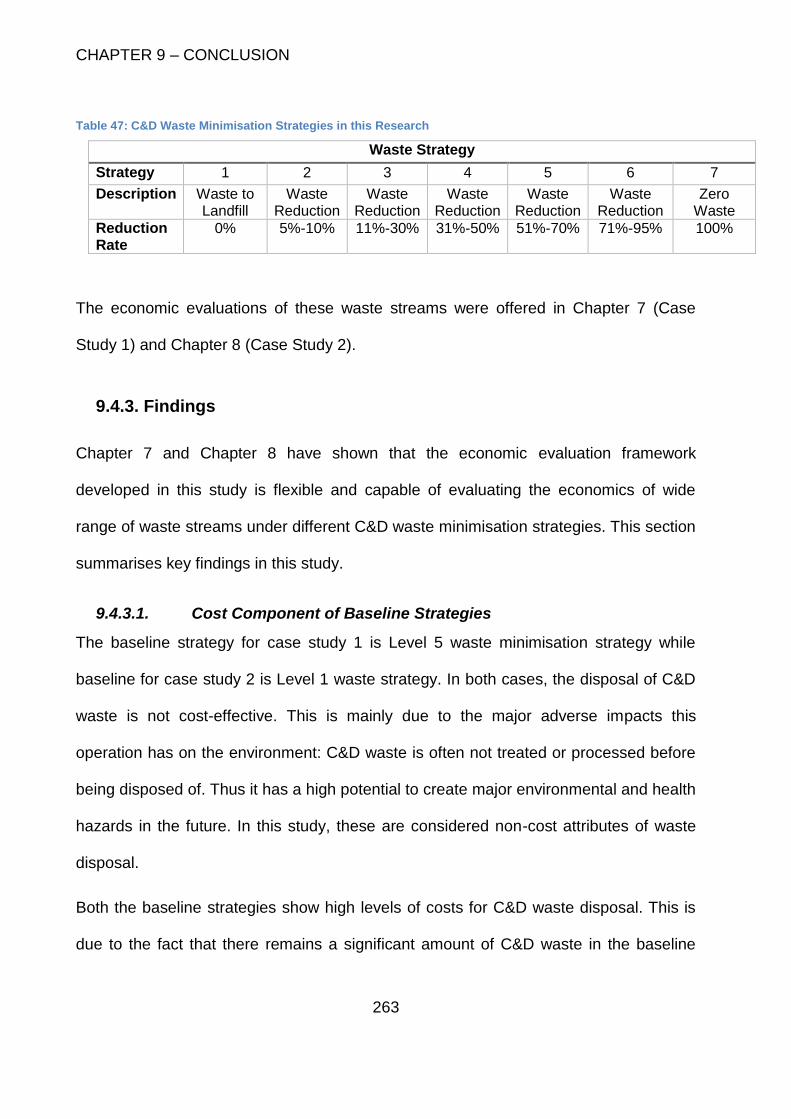
CHAPTER 9 – CONCLUSION
263
Table 47: C&D Waste Minimisation Strategies in this Research
Waste Strategy
Strategy 1 2 3 4 5 6 7
Description Waste to Landfill
Waste Reduction
Waste Reduction
Waste Reduction
Waste Reduction
Waste Reduction
Zero Waste
Reduction Rate
0% 5%-10% 11%-30% 31%-50% 51%-70% 71%-95% 100%
The economic evaluations of these waste streams were offered in Chapter 7 (Case
Study 1) and Chapter 8 (Case Study 2).
9.4.3. Findings
Chapter 7 and Chapter 8 have shown that the economic evaluation framework
developed in this study is flexible and capable of evaluating the economics of wide
range of waste streams under different C&D waste minimisation strategies. This section
summarises key findings in this study.
9.4.3.1. Cost Component of Baseline Strategies
The baseline strategy for case study 1 is Level 5 waste minimisation strategy while
baseline for case study 2 is Level 1 waste strategy. In both cases, the disposal of C&D
waste is not cost-effective. This is mainly due to the major adverse impacts this
operation has on the environment: C&D waste is often not treated or processed before
being disposed of. Thus it has a high potential to create major environmental and health
hazards in the future. In this study, these are considered non-cost attributes of waste
disposal.
Both the baseline strategies show high levels of costs for C&D waste disposal. This is
due to the fact that there remains a significant amount of C&D waste in the baseline
CHAPTER 9 – CONCLUSION
264
strategies. Coupled the high landfill charge of $150 per tonne, the costs associated with
collecting and landfilling the waste remain high.
Although the analysis shows that the costs of design-out-waste in both baseline
strategies are lower than those of other strategies in their respective cases, when taking
non-cost attributes into account, the total cost of waste disposal may end up being
much higher than its current level.
Therefore, due to this high potential cost, it is recommended that the client should
consider other waste minimisation strategies.
9.4.3.2. Cost Component of Level 6 and Level 7 Strategies
At these levels, the ‘costs of design-out-waste and waste strategy’ are significantly
higher than those in the baseline strategies of both case studies. The higher costs of
these components are due to the high compliance cost that the client must spend to
ensure high level of waste reduction. In particular, they must also spend significant
money to establish waste minimisation strategies for the projects and ensure all project
partners follow and adhere to the waste minimisation strategies. Also under Level 6 and
Level 7 strategies, the client must spend more money on design-out-waste than they do
in the lower level strategies.
Further, since these strategies require a significant amount of double-handling of waste,
the cost with such activities must increase accordingly. The double-handling of waste
comes from the fact that waste is transported twice: first, waste must be handled from
collection point (i.e. construction site) to waste management facilities. Subsequently
waste must be handled at waste management facilities to get rid of any residues that
cannot be recycled or salvaged. This is the unique (and costly) feature of this strategy.
CHAPTER 9 – CONCLUSION
265
In the ‘landfill’ strategy, all waste is disposed of to landfill regardless of their reusability
or salvage values. However, in the zero-waste strategy, all waste is recycled or reused
thus eliminating the need to transport waste from waste management facilities to dump
site. As a result, careful consideration must be given to this strategy, as the client may
end up paying twice for the transportation of waste.
The ‘zero waste’ strategy requires rigorous waste minimisation undertaking. As a result,
the waste generated under this strategy is less than that under the other alternative
strategies. This is true in both case studies. Moreover, with the high recycling and reuse
rate (100%), this strategy offers the client a cost-effective option. This is because in the
‘zero waste’ strategy less waste is produced, thereby saving the client on materials.
With less waste produced, the client spends less on transportation and processing
costs while deriving earnings from sales of reused/recycled materials to offset the cost
of purchasing original materials.
Similarly, Level 6 waste minimisation strategies can offer the client a near identical cost
efficiency as the zero-waste strategy. However, unlike the zero case, the Level 6 waste
minimisation is achievable due to their lower requirements for waste reduction rates
than its zero waste counterparts. Level 6 strategy of case study one requires a waste
reduction rate of 78% while Level 6 strategy of case study requires a waste reduction
rate of 71%. In practice, both these waste reduction rates are achievable (and in fact
have been achieved in real situations). Further, the costs associated with achieving
these levels are much lower than those for Level 7 (zero waste) strategy. But the
returns between the two levels for both case studies are similar. And therefore, it can be
argued that Level 6 strategies in both cases are more economical than the Level 7
CHAPTER 9 – CONCLUSION
266
strategies. The cost-effective of Level 6 strategy is a compelling argument for its
implementation in construction projects.
9.4.3.3. Benefit Component of Baseline Strategies
Both case studies show that there is little benefit to the client in the ‘landfill’ strategy. By
dispose of the C&D waste, the clients get rid of all potential cost savings that could be
derived from it. This includes opportunities to on-sell the processed materials to the
secondary markets to offset the costs of purchasing the original materials.
Although in many situations it could be economical to dispose of the waste, as the
additional costs associated with processing waste may outweighs the benefits derived
from it. However, in the case studies considered in this thesis, the benefits of recycling
waste outweigh the cost of landfilling C&D waste. This is a compelling case to consider
C&D waste minimisation as a better alternative to ‘landfilling’ waste.
As the baseline strategy of case study one is a Level 5 waste minimisation strategy, the
degree of benefits that the client can derive from this case is much higher than those in
the baseline strategy of case study two (since the baseline of this case study is Level
1). However, in both cases Level 6 waste minimisation strategy is the ideal strategy for
this case study.
9.4.3.4. Benefit Component of Level 6 and Level 7 Strategies
The benefits offered by these two strategies are much higher than those offered by their
respective baseline strategies. It can be observed that with a high landfill charge, the
clients gain significant economic benefits. This is because as more waste is diverted
from landfills, the client can save more on waste disposal costs. This observation
demonstrates a positive relationship between ‘landfill charges’ and ‘economic benefits’.
CHAPTER 9 – CONCLUSION
267
These arguments show a compelling business case for the clients to implement a waste
minimisation strategy.
However, there is one area that this study did not sufficiently cover, that is the lack of
explicit evaluation of intangible benefits for the clients. There is a common trend in both
case studies: the clients have received significant values from their projects but they did
not quantify and evaluate such intangible benefits in their respective projects. This is a
missed opportunity and one which requires further research.
9.4.3.5. BCA of Baseline Strategies
The Benefit-Cost Ratio (BCR) is the ratio between the benefit component and the cost
component of a strategy. Due to the fact there is no benefit to the clients under the
‘Landfill’ strategy, the BCR of this strategy is 0%. This means the ‘landfill’ strategy is not
an economically efficient option. From an economic perspective, the client should avoid
this strategy and consider other options that can offer better value for money.
By contrast, the baseline strategy for case study one shows a relatively high degree of
economic efficiency (BCR = 71%). This is perhaps due to the high level of investment
that the client has spent in this strategy to ensure at least 51% of their C&D waste
outputs could be diverted from landfills. As argued in Section 9.4.3.3 above, despite its
relatively high economic efficiency, the Level 5 strategy of Case Study One does not
deliver the optimal economic returns and thus it can be improved.
9.4.3.6. BCA of Level 6 and Level 7 Strategies
The BCRs of both these levels show near identical economic efficiency rates (105%
and 131% for Level 6 and Level 7 in case study 1 and 94% and 97% for Level 6 and
Level 7 in case study two).
CHAPTER 9 – CONCLUSION
268
It has been observed that a high landfill charge of $150 per tonne brings a high cost of
waste disposal. This high cost of waste disposal is perhaps the impetus for the clients
to look for alternative options to landfilling waste. An alternative is to minimise waste.
This means there is a need to identify an optimal strategy that could deliver the client a
high level of returns (benefits) for a reasonable price (costs).
As more waste is managed and minimised through waste minimisation strategies, the
clients also receive more benefits through cost savings and material savings. There is a
cost associated with the implementation of the ‘waste management’ strategy. However,
the benefits received by the clients can help recuperate some of this cost. This explains
for the increasing BCRs in all waste minimisation strategies in both case studies.
As more stringent requirements for waste minimisation are required, more aggressive
steps are needed to minimise waste. Steps that the clients employ can be a
combination of management methods including, but not limited to:
• Value Engineering: to realise potential values and areas that can be exploited
to deliver added value to waste minimisation strategy
• Just-in-Time (JIT): to ensure right amount of materials delivered to site when
needed in order to minimise wastage
• Total Quality Management (TQM): to ensure all work packages are
completed to the desired quality to minimise rework and double-handling
This culminates to the ‘zero waste’ strategy. Hence ‘zero waste’ is the ultimate goal of
the ‘waste minimisation’ strategies. In the zero-waste strategy, the disposal costs
decrease sharply due to the elimination of the cost of transporting to landfill.

CHAPTER 9 – CONCLUSION
269
However, the compliance costs associated with the implementation of the zero waste
strategy are significantly higher than those in Level 6 waste strategy. But the rates of
return (BCRs) between the two strategies remain similar.
9.4.3.7. Optimal Rates of Waste Minimisation
This study has made two discoveries. The first discovery is BCR is an appropriate
metric to assess the comparative economic efficiency of C&D waste minimisation
strategies. The second discovery is an establishment of the optimal C&D waste
minimisation rates. The second discovery will be discussed in detail in this section.
From an economic perspective, Level 6 strategy in both case studies is the optimal
waste minimisation strategy, as it delivers the optimal value for money to the clients in
the two cases considered in this research. Based on this result, it can be argued that
the optimal rate for C&D waste minimisation lies between 71% and 78%. The first figure
(71%) comes from the second case study while the second figure (78%) originates from
the first case study. As shown in both case studies, any waste minimisation rates higher
than these base figures only add marginal benefits to the clients while at the same time
incurring higher costs. Therefore, these base figures are optimal minimisation rates for
each case study; and collectively they form a basis for an establishment of the optimal
C&D waste minimisation strategy for this research, namely Level 6.
However, this result is based on the limited sample used in this research (two case
studies). As a result, further research is required to validate this finding. Nevertheless,
this finding has established a basis for future investigations in C&D waste minimisation.
This is based on the fact that no previous studies have made this discovery.
CHAPTER 9 – CONCLUSION
270
9.4.4. Implications
9.4.4.1. Uniqueness of the research
The economic evaluation framework developed in this study is unique to the New
Zealand construction industry for several reasons.
First, it was developed based on interviews with New Zealand-based practising
construction professionals with many years of experience. The feedback received from
these professionals has ensured that the framework is applicable to the New Zealand’s
situation in relation to C&D waste minimisation.
Second, investigations into the economics of C&D waste have not been previously
undertaken in New Zealand. A number of previous studies have outlined potential
benefits of C&D waste management (Snow and Dickinson, 2001; Kazor and Koppel,
2007; Kestle & Rimmer, 2010; ITM, 2013; BRANZ, 2014). However, no studies have
expressly evaluated the economics of a zero-waste strategy. This is knowledge gap in
New Zealand construction that needs to be filled urgently; and it is the objective of the
study reported in this thesis. To this end, this study is the first of its kind in New Zealand
to investigate the zero-waste paradigm of economics of C&D waste minimisation.
Third, the framework was designed to be flexible and applicable to various waste
streams and situations in New Zealand. To validate its flexibility and applicability, the
framework was applied to two case studies of different natures to evaluate a range of
waste streams. The results show the framework was able to achieve its designed
objectives. In other words, the framework could be used to evaluate either a single
waste stream or a multitude of waste streams. Further, the framework can assess the
economics of various waste strategies, ranging from the basic strategy (such as
CHAPTER 9 – CONCLUSION
271
landfilling waste) to the advanced waste minimisation strategy (such as zero waste).
Overall, this New Zealand-centric economic evaluation framework has allowed for its
applications to be unique to the New Zealand cases and situations.
Finally, the research has established the optimal rates C&D waste minimisation strategy
and optimal waste minimisation rates in New Zealand. It was found that the optimal rate
for C&D waste minimisation strategies in the building industry lies between 71% and
78% (Level 6 strategy). Although this finding was based on a limited sample (two case
studies), it has nonetheless established a basis for future research in C&D waste
minimisation. This is since no previous studies have made this discovery and
established such a detailed base figure.
9.4.4.2. Collaboration as a key to desired waste minimisation outcomes
Chapter 7 and Chapter 8 have shown that there needs to be a collaborative working
environment to ensure a successful waste minimisation objective can be achieved. In
this collaboration, the client should be proactive in working with other stakeholders such
as architects, engineers, contractors and specialist waste management sub-contractors
to establish and execute an overall waste strategy.
The economic modelling in Chapters 7 and 8 has confirmed a long-held belief in New
Zealand construction that the variable ‘landfill charges’ indeed has significant influence
on a waste management programme in New Zealand. This means in order for all
stakeholders to get value out of a waste minimisation programme, there needs to be a
close working relationship between construction companies and specialist waste
management companies. This close working relationship can foster opportunities such
CHAPTER 9 – CONCLUSION
272
as a creation of a send-hand market whereby construction companies can provide
specialist waste management companies feedstock for their second-hand markets.
Overall, in this collaboration framework, effort must be spent to monitor, track progress
to ensure all parties follow the plan and to review waste management plan as the
project progresses to ensure it is up-to-date in all circumstances. In all cases, there is a
cost associated with maintaining this collaboration as well as the implementation of a
waste management strategy. However, as shown in Chapters 7 and 8, the benefits that
the clients can derive from such a strategy outweighs this cost. Many of the benefits
that the clients get are intangible and unquantifiable. They include:
• opportunities to improve reputations and credentials to increase the
opportunities to market the clients’ brands and images
• contribution to the increased morale, well-being and productivity of people
working in the buildings
• an opportunity to increase the value to the clients via potential (highly
competitive) rentals
The quantification of these intangible benefits is highly complex and one which
constitutes a different study. Due to the limited time and scope of this research, it is not
possible to explore this area. For the purpose of this study, assumptions regarding the
intangible benefits of ‘waste management’ and ‘zero waste’ strategies have been made
for both case studies. Despite the fact that the assumed economic values for these
intangible benefits are conservative in both cases, the analyses in Chapters 7 and 8
showed the clients achieved high levels of economic efficiency for both ‘waste
CHAPTER 9 – CONCLUSION
273
management’ and ‘zero waste’ strategies. It can be, then, concluded that there are
values in minimising C&D waste.
9.5. Limitations
While the framework developed in this study is flexible and can be used to evaluate the
economics of different C&D waste minimisation strategies, there are limitations in its
methodology.
First, the study only considers one factor that can have significant impacts on the
success of a waste minimisation strategy in NZ construction: landfill charges. This
factor was identified in the research as important drivers in a waste minimisation
strategy. However, this sole focus on this one variable makes this study one-
dimensional. There are many interacting factors that can have significant effects on the
success of a waste minimisation strategy. Thus by making ‘landfill charges’ the one key
variable, this study does not, and cannot, exhibit the true extend of the problem related
to C&D waste minimisation in New Zealand. This is one major weakness of this study.
Second, the economic modelling undertaken in this study is stationary, i.e. nothing
changes under any circumstances. This is the underlying assumption underpinning this
study. Although this assumption helps simplify the modelling process, it is not realistic,
as there is always a degree of uncertainty involved in a C&D waste management
strategy. As a result, subsequent studies can be carried out to establish other variables
that have significant effects on the success of a waste management strategy. These
variables may be tested using advanced techniques for uncertainty analysis such as
Monte Carlo analysis to analyse their behaviour under changing circumstances (i.e.
CHAPTER 9 – CONCLUSION
274
under uncertainty). This will cater for a better understanding of variables or factors
affecting New Zealand construction’s zero waste aspiration.
Third, although the study acknowledged there were many intangible benefits associated
with a C&D waste management strategy, it did not evaluate the economics of such
intangible benefits. Instead, assumptions regarding the economics of the intangible
benefits were made. Although these assumptions simplified the problem at hand
significantly, they may not be realistic; thus rendering the study for potential scrutiny.
Furthermore, without a method to explicitly evaluate the intangible benefits, any attempt
to emulate this study is difficult. This is because assumptions regarding these intangible
benefits must be made every single time; hence making the framework unreliable. This
is a missed opportunity and one which subsequent researches could investigate in
detail.
Finally, the study currently focuses on the economics of C&D waste minimisation from
the client’s perspective. Although this choice is sufficient for the purpose of this study
(i.e. to demonstrate the applicability of the economic framework developed in this
study), it does not cover all aspects relating to C&D waste minimisation in the New
Zealand construction industry. There are many parties involved in a construction
project. They include, but not limited to, clients, architects, engineers, quantity
surveyors, land surveyors, contractors, specialist sub-contractors and waste
management sub-contractors. Each of the parties mentioned above has a different
perspective, a different objective and a different focus relating to C&D waste
management. But they all contribute to the success of an overall project C&D waste
minimisation strategy. By focusing on the client side is a good start, as they ultimately
pay for everything in the construction project. However, this choice may be too narrow
CHAPTER 9 – CONCLUSION
275
and does not cover or reflect all aspects involved in a C&D waste management
strategy. Therefore, there is a need to investigate the economics of C&D waste
minimisation from other parties’ perspectives and this could be catered for by
subsequent researches.
9.6. Future Research
Overall, this study has achieved its stated objectives. Specifically, the study has
demonstrated that the economic framework is flexible and can be applied to various
waste streams. However, based on the limitations identified in Section 9.5, some
suggestions for future work can be made.
First, there is an urgent need to incorporate the incentive – penalty models of this
framework. Although this current research does not include this aspect, it is considered
an important driver for the uptake of C&D waste minimisation in New Zealand. As a
result, there are opportunities for future research to investigate an incentive – penalty
scheme in detail. It is anticipated that by being able to incorporate the incentive and
penalty models, the economic evaluation framework will become more mathematically
and economically sound.
Second, to enhance the value of the study being reported in this thesis, there may be a
need to incorporate uncertainty into the modelling process. As uncertainty is present in
all industrial processes, having it built into the modelling process can help strengthen
the framework developed in this study significantly. Further, the information derived
from the uncertainty models can help cater for improved strategies to address C&D
waste.
CHAPTER 9 – CONCLUSION
276
To enhance this study further, effort can be spent to investigate and quantify the
intangible benefits associated with C&D waste management. This is a missed
opportunity and one which needs to be filled urgently in order to strengthen the value of
this study.
There is also a need to verify (or disprove) the proposed optimal waste reduction rates
found in this research. The optimal waste reduction range of 71%-78% was based on
the two case studies used in this research. Further, it was a product of the economic
evaluation framework developed for, and by, this study. As such, there may be errors
inherent in the assumptions and findings. In order to confirm this proposed optimal
waste reduction range, or otherwise, there is a requirement for further research to be
undertaken urgently. Any further results will provide an improved understanding of this
subject matter and in turns advance the knowledge in C&D waste minimisation
economics.
Finally, there is an urgent need to investigate the economic values of C&D waste
minimisation from other stakeholders’ perspectives. These stakeholders include, but not
limited to, clients, architects, engineers, quantity surveyors, land surveyors, contractors,
specialist sub-contractors and waste management sub-contractors. By understanding
the economic perspectives of these stakeholders on C&D waste minimisation,
appropriate strategies can be developed to ensure the sustainability of a C&D waste
minimisation strategy.
CHAPTER 9 – CONCLUSION
277
9.7. Contribution to Knowledge
Given that there are few studies investigating C&D waste minimisation and C&D zero
waste in New Zealand, this study has contributed to the body of knowledge in the
following ways:
1. The research has developed a bespoke methodology to achieve research
objectives
2. The research has established a conceptual economic model for C&D waste
minimisation that is appropriate for the New Zealand construction industry.
This conceptual model can be used as a roadmap to chart necessary
pathways to minimise C&D waste
3. The economic evaluation framework developed in this research is flexible and
applicable to a range of waste streams and waste minimisation strategies.
This helps advance understanding in the area of C&D waste minimisation
economics
4. The research established a methodology to identify optimal C&D waste
minimisation strategies for clients in building projects
5. As this research is the first in New Zealand to develop a comprehensive
framework to evaluate the economics of C&D waste minimisation, it can be
an impetus for further research in this area in New Zealand
6. This research established optimal rates for C&D waste reduction in the New
Zealand building sector. The optimal waste reduction rate is between 71%
and 78%. This is a major contribution to knowledge because no studies have
identified such detailed waste reduction rates as this research.
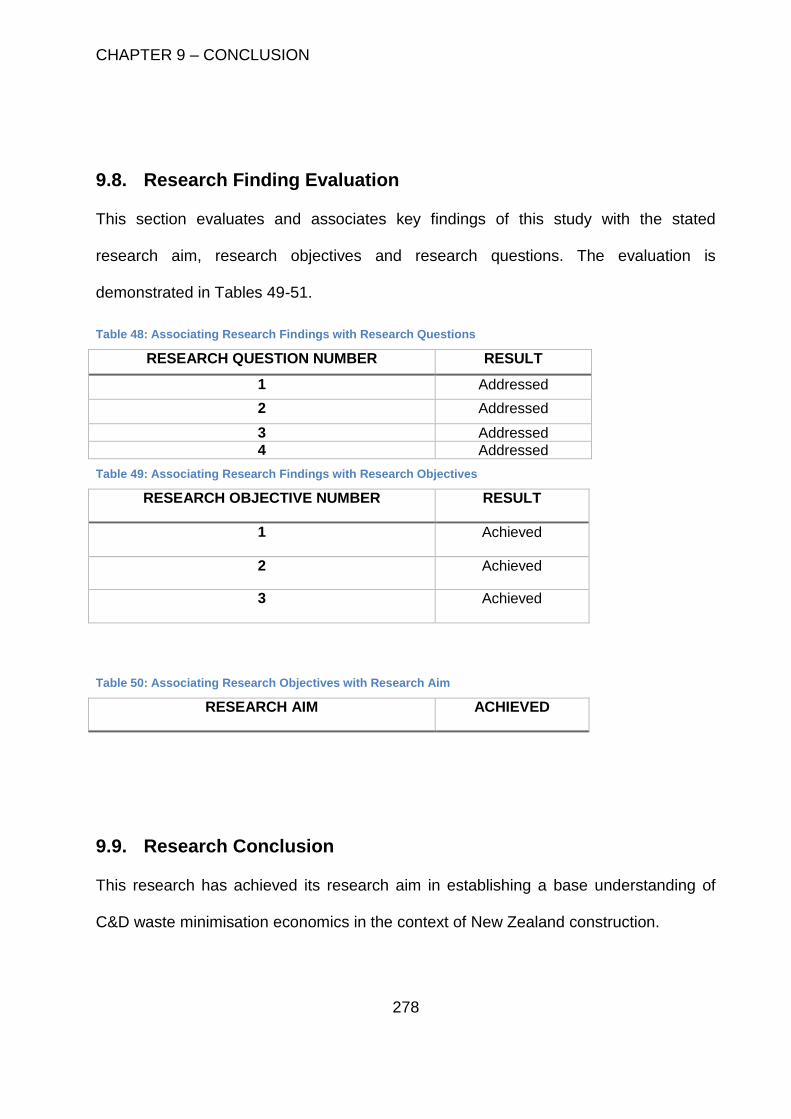
CHAPTER 9 – CONCLUSION
278
9.8. Research Finding Evaluation
This section evaluates and associates key findings of this study with the stated
research aim, research objectives and research questions. The evaluation is
demonstrated in Tables 49-51.
Table 48: Associating Research Findings with Research Questions
RESEARCH QUESTION NUMBER RESULT
1 Addressed
2 Addressed
3 Addressed
4 Addressed
Table 49: Associating Research Findings with Research Objectives
RESEARCH OBJECTIVE NUMBER RESULT
1 Achieved
2 Achieved
3 Achieved
Table 50: Associating Research Objectives with Research Aim
RESEARCH AIM ACHIEVED
9.9. Research Conclusion
This research has achieved its research aim in establishing a base understanding of
C&D waste minimisation economics in the context of New Zealand construction.
CHAPTER 9 – CONCLUSION
279
Through literature review, this research has established an understanding that while
construction plays an important role in national growth and wealth worldwide, it also
created significant unwanted and costly adverse effects in the process in forms of C&D
waste. It was found that there are the costs of C&D waste in forms of environmental
costs (such as resource depletion and pollution), social costs (such as health and
wellbeing of communities) and economic costs (such as remedial costs to manage
effects of C&D waste or additional investments to expand landfill sites). These costs are
significant and have significant impacts on construction’s long term sustainability
aspirations. Therefore, there is an impetus for construction and society in general to
address C&D waste urgently. As money is a key consideration in construction, there is
an immediate need to investigate C&D waste minimisation economics. This was the
rationale for this study.
The literature review also showed that although there are a number of economic
models concerning C&D waste management and minimisation, these models could not
sufficiently address two key issues: 1) how to identify the optimal C&D waste
minimisation strategies and 2) what is the optimal C&D waste reduction rate?
Subsequently, this research employed a mixed-paradigm approach to address this
knowledge gap. The mixed-paradigm approach was employed to help the research
overcome the lack of empirical information on the research subject matter. Further, it
also strengthened the theoretical perspective of the research, as it allowed for the
development of a framework that is appropriate for, and applicable to, the case of New
Zealand construction.
CHAPTER 9 – CONCLUSION
280
As shown through the modelling process, there are significant benefits that can be
derived from the implementation of C&D waste minimisation, including tangible returns
(in forms of cost savings), as well as intangible potentials (such as increased
reputations or potential opportunities for rentals). Although the costs associated with the
implementation of C&D waste minimisation are higher than otherwise, the benefits often
outweigh such costs. Therefore, there are economic imperatives for companies to adopt
and implement C&D waste minimisation in their projects.
It was found, through modelling, that optimal waste reduction rate ranged between 71%
and 78%; and the optimal waste minimisation strategy in New Zealand is Level 6
strategy (with reduction rate between 71% and 80%).
However, one must be careful when interpret the above findings because these results
are specific to this research only. And further investigations are required to confirm (or
otherwise) the validity of the research claim.
Through the development of this robust economic evaluation framework, the study has
provided an impetus for future research. Opportunities for future work were identified
and listed in Section 9.7.
As the first study investigating economics of C&D waste minimisation and C&D zero
waste in New Zealand, this study has made significant contribution to knowledge as
outlined in Section 9.8.
Overall, this research has achieved its stated research aim and objectives by
successfully answer the research questions. The evaluation of the research was shown
in Section 9.9.
REFERENCES
281
REFERENCES
REFERENCES
282
Abdelhamid, M. S. (2014). ‘Assessment of different construction and demolition waste
management approaches’. HBRC Journal, Vol. 10, p. 317–326
Abidin, N. Z. & Pasquire, C. L. (2005). ‘Delivering sustainability through value
management: Concept and performance overview’. Engineering, Construction and
Architectural Management Vol. 12, No. 2, p. 168-180
Abidin, N. Z. (2005). ‘Using value management to improve the consideration of
sustainability within construction’. PhD Thesis, Loughborough University’s Institutional
Repository, Loughborough University
ACENZ & IPENZ (2004). ‘Fee Guidelines for Consulting Engineering Services’. Link:
http://www.acenz.org.nz/uploads/Client/Guideline%20on%20the%20Briefing%20and%2
0Engagement%20for%20Consulting%20Engineering%20Services-
1st%20Edition%202004.pdf
Adams, J.; Khan, H. T. A.; Raeside, R. & White, D. (2007). ‘Research Methods for
Graduate Business and Social Science Students’. Response Books, Sage Publishing
Adams, K.; Johnson, P.; Thornback, J. & Law, C. (2011). ‘WASTE: An Action Plan for
halving construction, demolition and excavation waste to landfill’. Report for the
Strategic Forum for Construction, WRAP
Adams, K.; Johnson, P.; Thornback, J. and Law, C. (2011). ‘Waste: An Action Plan for
halving construction, demolition and excavation waste to landfill’. The Strategic Forum
for Construction, http://www.strategicforum.org.uk/pdf/10WasteActionPlan.pdf
(accessed 04 March 2013)
REFERENCES
283
Adetunji, I. ; Price, A.; Fleming, P. & Kemp P. (2003). ‘Sustainability and the UK
construction industry - a review’. Proceedings of the Institution of Civil Engineers
Engineering Sustainability 156 Issue ES4 Pages 185-199
Afroz, R.; Hanaka, K. & Kurisu, K. H. (2008). ‘Factors Affecting Waste Generation and
Willingness to Recycle: a Study in a Waste Management Program in Dhaka city,
Bangladesh’. FEB Working Paper Series No. 0803, Faculty of Economics and
Business, Universiti Malaysia Sarawak (UNIMAS) 94300 Kota Samarahan, Sarawak,
Malaysia
Agyekum, K. (2012). ‘Minimizing Materials Wastage at the Construction Stage of a
Project through the Implementation of Lean Construction’. Master’s Thesis. Department
of Building Technology, Kwame Nkrumah University of Science and Technology,
Ghana
Aiken, A. (2014). ‘Lean: Concepts and Realities’. Lanner Group. Link:
http://www.lanner.com/en/pdf/lean_and_lanner.pdf
Al Shehaimi, A.; Tzortzopoulos, P. & Koskela, L. (2009). ‘Last Planner System:
Experiences From Pilot Implementation In The Middle East’. Proceedings for the 17th
Annual Conference of the International Group for Lean Construction
Alesii, G. (2006). ‘Payback period and internal rate of return in real options analysis’.
The Engineering Economist Vol. 51, No. 21
Alexander, S. (2002). ‘Green Hotels: Opportunities and Resources for Success’. Zero
Waste Alliance
REFERENCES
284
Al-Hajj, A., & Hamani, K. (2011). ‘Material Waste in the UAE Construction Industry:
Main Causes and Minimisation Practices’. Architectural Engineering and Design
Management, Vol. 7, No. 4, p: 221-235
Allen, C.; Gokaldas, V.; Larracas, A.; Minot, L. A.; Tangri, N.; Tyler, B. and Walker, B.
(2012). ‘On the road to Zero Waste: Successes and Lessons from around the world’.
GAIA Report
Altwies, J. E. & McIntosh, I. B. D. (2001). ‘Quantifying the Cost Benefits of
Commissioning’. Conference: National Conference on Building Commissioning, Hilton
at Cherry Hill, Cherry Hill, New Jersey, USA
Amati, M. & Taylor, L. (2010). ‘From Green Belts to Green Infrastructure’. Planning
Practice & Research Vol. 25, No. 2, p. 143-155
Arleroth, J. & Kristensson, H. (2011). ‘Waste in Lean Construction – A case study of a
PEAB construction site and the development of a Lean Construction Tool’. Master’s
Thesis. Master of Supply Chain Management, Department of Technology Management
and Economics, Division of Logistics and Transportation, Chalmers University of
Technology, Gothenburg, Sweden
Armstrong, R.; Waters, E.; Jackson, N.; Oliver, S.; Popay, J.; Shepherd, J.; Petticrew,
M.; Anderson, L.; Bailie, R.; Brunton, G.; Hawe, P.; Kristjansson, E.; Naccarella, L.;
Norris, S.; Pienaar, E.; Roberts, H.; Rogers, W.; Sowden, A.; Thomas, H. (2007).
‘Guidelines for Systematic reviews of health promotion and public health interventions’.
Melbourne University, Australia. Link:
http://ph.cochrane.org/sites/ph.cochrane.org/files/uploads/Guidelines%20HP_PH%20re
views.pdf
REFERENCES
285
AUMA (2012). ‘Zero Waste Backgrounder - Transforming Municipalities from Waste
Managers to Resource Managers’. Link:
http://www.auma.ca/live/digitalAssets/71/71992_Zero_Waste_Backgrounder-
July_4th.pdf
Australian Bureau of Statistics (2010). ‘1350.0 - Australian Economic Indicators, Oct
2010’. Link:
http://www.abs.gov.au/AUSSTATS/[email protected]/Lookup/1350.0Feature+Article1Oct+2010
AUT University (2015). ‘AUT’s Sustainability Goals 2012-2022’. Link:
https://www.aut.ac.nz/about-aut/sustainability-at-aut/auts-commitment/?a=446603
Ayarkwa, J.; Agyekum, K. & Adinyira, E. (2011). ‘Exploring Waste Minimization
Measures In The Ghanaian Construction Industry’. Built Environmental Journal Vol. 8,
No. 2, p. 22-30
Babbie, E. (2007). ‘The Practice of Social Research’. Wadsworth, Cengage Learning
Ball, P. D.; Evans, S.; Levers, A. and Ellison, D. (2009). ‘Zero carbon manufacturing
facility – towards integrating material, energy, and waste process flows’. Proceedings of
the Institution of Mechanical Engineers, Part B: Journal of Engineering Manufacture,
Vol. 223, p. 1085-1096
Ballard, G. (2008). ‘Target Value Design’. Lean Construction Institute, University of
California, Berkeley
Ballard, G. (2008). ‘The Lean Project Delivery System: An Update’. Lean Construction
Journal 2008, p. 1-19
REFERENCES
286
Banawi, A. A. (2013). ‘Improving Construction Processes by Integrating Lean, Green,
and Six-Sigma’. PhD Thesis: Swanson School of Engineering, University of Pittsburgh,
USA
Barawas, M.; Fleetwood, C.; Folwell, K.; Garrett, R.; Hacche, I.; Liley, J.; Liston, S.;
Scott, N. & Siddique, A. (2013). ‘UK Construction: An economic analysis of the sector’.
Department for Business Innovation & Skills
Barkley, D. L. (2006). ‘The Value of Case Study Research On Rural Entrepreneurship:
Useful Method?’ Regional Economic Development Research Laboratory, E.D.A.
University Center for Economic Development, Department of Applied Economics and
Statistics, Clemson University, Clemson, South Carolina
Barman, B. and Nash, K. (2007). ‘A Streamlined Real Options Model for Real Estate
Development’. Unpublished Thesis: Master of Science in Real Estate Development,
Department of Urban Studies and Planning, Massachusett Institute of Technology
Baxter, P. & Jack, S. (2008). ‘Qualitative Case Study Methodology: Study Design and
Implementation for Novice Researchers’. The Qualitative Report, Vol, 13 No. p: 544-
559
Beer, M.; Fridgen, G.; Mueller, H-V. & Wolf, T. (2013). ‘Benefits Quantification in IT
Projects’. 11th International Conference on Wirtschaftsinformatik, 27th February – 01st
March 2013, Leipzig, Germany
Begum, R. A.; Swiwar, C.; Pereira, J. J. and Jaafar, A. H. (2006). ‘A benefit–cost
analysis on the economic feasibility of construction waste minimisation: The case of
Malaysia’. Resources, Conservation and Recycling Vol. 48, p. 86–98
REFERENCES
287
Begum, R. A.; Swiwar, C.; Pereira, J. J. and Jaafar, A. H. (2007). ‘Factors and values of
willingness to pay for improved construction waste management – A perspective of
Malaysian contractors’. Waste Management Vol. 27, p. 1902–1909
Begum, R. A.; Swiwar, C.; Pereira, J. J. and Jaafar, A. H. (2009). ‘Attitude and
behavioral factors in waste management in the construction industry of Malaysia’.
Resources, Conservation and Recycling Vol. 53, p. 321–328
Bentley, T. A.; Hide, S.; Tappin, D.; Moore, D.; Legg, S.; Ashby, L. & Parker, R. (2006).
‘Investigating risk factors for slips, trips and falls in New Zealand residential construction
using incident-centred and incident-independent methods’, Ergonomics, Vol. 49, No. 1,
p. 62-77, DOI: 10.1080/00140130612331392236
Berry, C. (2014). ‘Residential Construction Waste Reduction: Case Studies and
Resources’. Report PUB/26 for Beacon Pathway Incorporated. Link:
http://www.beaconpathway.co.nz/images/uploads/Report_PUB(26)_Residential_Constr
uction_Waste_Reduction_Case_Studies_v3.pdf
Bin Yusoff, M. N. (2010). ‘Waste Minimization by Recycling of Construction Waste’.
Master’s Thesis. Faculty of Civil Engineering & Earth Resources, University Malaysia
Pahang, Malaysia
Birge, J. R. (2012). ‘Real-Options Valuation and Supply-Chain Management’. Lecture
Notes, Northwestern University
Black. M, Guy. M, McLellan. N (2003). ‘Productivity in New Zealand 1998 to 2002’. New
Zealand Treasury, Wellington 6008, New Zealand
REFERENCES
288
Blais, V., et al. (2007). ‘Using Real Options to Incorporate Price Risk in the Valuation of
a Multi-Mineral Mine’. Book: ‘Orebody modelling and strategic mine planning’; Editor: R.
Dimitrakopoulos. Melbourne, AusIMM.
Blanco, G. and F. Olsina (2011). ‘Optimal Decision-Making under Uncertainty:
Application to Power Transmission Investments’. Stochastic Optimization-Seeing the
Optimal for the Uncertain. I. Dritsas, InTech.
Boland, L. A. (2000). ‘The Methodology of Economic Model Building’. Routledge
Bon R. & Hutchinson K. (2000) ‘Sustainable construction: some economic challenges’.
Building Research & Information, Vol, 28, No. 5-6, p. 310-314
Borison, A. (2003). ‘Real Options Analysis: Where are the Emperor’s Clothes?’. Real
Options Conference. Washington DC, Stanford University.
Borisov, D.; Stefanov, B. & Stoyanov, S. K. (2014). ‘An Algorithm For Metallurgical
Waste Minimization’. Journal of Chemical Technology and Metallurgy, Vol. 49, No. 1, p:
99-105
Bossink, B. A. G. & Brouwers, H. J. H. (1996). ‘Construction Waste: Quantification and
Source Evaluation’. Journal of Construction Engineering and Management, p. 55-60
Bourdeau, L. (2010). ‘Sustainable development and the future of construction: a
comparison of visions from various countries’. Building Research & Information, Vol. 27,
No. 6, p. 354-366
Boyle, C. (2004). ‘Sustainable Buildings in New Zealand’. Discussion papers produced
by the IPENZ Presidential Task Committee on Sustainability
REFERENCES
289
Boyle, C. (2010). ‘Conditional simulation methods to determine optimum drill hole
spacing’. Book: ‘Advances in Orebody modelling and strategic mine planning 1’; Editor:
R. Dimitrakopoulos, Melbourne, AusIMM.
BRANZ (2014). ‘REBRI Tools’. Website. Link:
http://www.branz.co.nz/cms_display.php?sn=111&. Access Date: March, 2014
Brettle, A. (2008). ‘Systematic Reviews’. Article, School of Nursing and Midwifery,
University of Salford. Link:
http://www.cprjournal.com/documents/systematicReviews.pdf
Brochner J.; Ang, G. K. I. & Fredriksson, G. (1999). ‘Sustainability and the performance
concept: encouraging innovative environmental technology in construction’. Building
Research & Information, Vol. 27, No. 6, p. 367-372
Brown, C. & Allcock, S. (2008). ‘Waste Plasterboard Composting - Literature Review’.
Envision New Zealand Limited in Preparation for the Ministry for the Environment
World Commission on Environment and Development (1987). Our Common Future.
Oxford: Oxford University Press. p. 27. ISBN 019282080X.
Build It Green (2007). ‘Home Remodeling: Green Building Guidelines’. Link:
www.BuildItGreen.org
Building Performance (2015). ‘The Importance of the Building and Housing Sector’.
Link: http://www.building.govt.nz/soi0710-parta2
Burnett, J. (2007). ‘City buildings—Eco-labels and shades of green!’ Landscape and
Urban Planning Vol. 83, p. 29–38
REFERENCES
290
Business Dictionary (2015). ‘System Approach Definition’. Link:
http://www.businessdictionary.com/definition/system-approach.html
CABE (2006). ‘Creating excellent buildings: A guide for clients’. Report/Guideline.
Caldwell, B. (1980). ‘Positivist Philosophy of Science and the Methodology of
Economics’. Journal of Economic Issues, Vol. XIV, No. 1, p. 54-76
Callagy, R. (2012). ‘Option Theory and Land Development’. Lecture Notes, MIT Sloan
School of Management
Card, P. (2009). ‘Economic evaluation: it is time we cleaned-out or smartened-up our
discipline’. Project Evaluation Conference, Melbourne, Vic.
Chang, Y-J & Lin, M-D. (2011). ‘Economic Evaluation of Municipal Solid Waste
Management System for Taiwan’s Taichung Special Municipality’. 2nd International
Conference on Environmental Science and Technology, Singapore
Chen J. J. & Chambers D. (1999). ‘Sustainability and the impact of Chinese policy
initiatives upon construction’. Construction Management and Economics, Vol. 17, No. 5,
p. 679-687
Cheng, J. C. P. and Ma, L. Y. H. (2013). ‘A BIM-based system for demolition and
renovation waste estimation and planning’. Waste Management (in Review)
Chia, R. (2002). ‘The Production of Management Knowledge: Philosophical
Underpinnings of Research Design’. Book: ‘Essential Skills for Management Research’.
Editor: Partington, D.
REFERENCES
291
Chia, R. (2002). Book Section: ‘The Production of Management Knowledge:
Philosophical Underpinnings of Research Design’. Book: ‘Essential Skills for
Management Research’. Editor: Partington, D. Sage Publications
Chiara, N., Garvin, M. J. and Vecer, J. (2007). ‘Valuing Simple Multiple-Exercise Real
Options in Infrastructure Projects’. Journal of Infrastructure Systems Vol. 13, No. 2, p.
97-104
Chinda, T.; Pornpromtada, K.; Wadhanakul, N. & Chavengbenjaporn, S. (2012).
‘Investigation of Factors Influencing Construction Waste Recycling Decisions’.
Engineering, Project, and Production Management 2012 Conference
Chiu, RLH (2012). ‘Sustainability’. University of Hong Kong, Hong Kong, China
Chong, W. K.; Kumar, S.;. Haas, C. T.; Beheiry, S. M. A.; Coplen, L. & Oey, M. (2009).
‘Understanding and Interpreting Baseline Perceptions of Sustainability in Construction
among Civil Engineers in the United States’. Journal of Management in Engineering
Vol. 25, p. 143-154
Chong, W.K; Kumar, S; Haas, C. T.; Beheiry, S. M. A.;Coplen, L.; and Oey, M. (2009).
‘Understanding and Interpreting Baseline Perceptions of Sustainability in Construction
among Civil Engineers in the United States’. Journal of Management in Engineering
Vol. 25, No. 3, July 1, 2009, p.143-154
Christopher, M. and Peck, H. (2002). ‘Building the Resilient Supply Chain’. Cranfield
School of Management
REFERENCES
292
Christou. E.; Anastasiadou, C. & Valachis, J. (2007). ‘Research Methodology in
Hospitality Industry: The role of the Inquiry Paradigms’. University of The Aegean,
Mihalon 8, 82100, Chios, Greece
Chung, S. S. & Lo, C. W.H. (2003). ‘Evaluating sustainability in waste management: the
case of construction and demolition, chemical and clinical wastes in Hong Kong’.
Resources, Conservation and Recycling Vol. 37, p. 119-145
Cleves Jr., J. A. & Michel, J. F. (2007). ‘Lean project delivery: A winning strategy for
construction and real estate development’. Grant Thornton
Coates, P. & Kaushik, A. (2013).
‘BIM Design and Pre‐construction: New Models of Engagement -
Using BIM, Target Value Design and Relational Contracts’. Infra Projects
Cocchiarella, N. B. (2007). ‘Formal Ontology and Conceptual Realism’. Springer
Coelho, A. & de Brito, J. (2012). ‘Influence of construction and demolition waste
management on the environmental impact of buildings’. Waste Management Vol. 32, p.
532–541
Cohen, L.; Manion, L. & Morrison, K. (2007). ‘Research Methods in Education’.
Routledge, Taylor & Francis
Collier, A.; Cotterill, A.; Everett, T.; Muckle, R.; Pike, T. & Vanstone, A. (2010).
‘Understanding and influencing behaviours: a review of social research, economics and
policy making in Defra’. Department for Environment, Food and Rural Affairs, UK
Government
REFERENCES
293
Collis, J. & Hussey, R. (2009) Business Research: A practical guide for undergraduate
and postgraduate students, 3rd edition, New York, Palgrave Macmillan.
Conlin, R. (2012). ‘Zero Waste in construction and demolition’. Website: Making It
Work, Link: http://conlin.seattle.gov/2012/12/20/zero-waste-in-construction-and-
demolition/ (accessed 04 March 2013)
Connett, P. (2008). ‘Zero Waste: A Key Move towards a Sustainable Society’. Link:
http://www.americanhealthstudies.org/zerowaste.pdf
Construction Resources and Waste Platform (2010). ‘The True Cost of Waste - Bricks’.
Construction Resources and Waste Platform. Link:
http://www.smartwaste.co.uk/filelibrary/True%20Cost%20of%20Waste/Brick_informatio
n_page.pdf
Coudert, L.; Blais, J-F.; Merciera, G.; Cooper,P.; Gastonguay, L.; Morris, P.; Janin, A. &
Reynier, N. (2113). ‘Pilot-scale investigation of the robustness and efficiency of a
copper-based treated wood wastes recycling process’. Journal of Hazardous
Materials Vol. 261, p. 277–285
Covec (2007). ‘Recycling: Cost Benefit Analysis’. Report for the Ministry for the
Environment (NZ)
Creswell, J. W & Clark, V. L. P. (2011). ‘Designing and Conducting Mixed Methods
Research’. Book. Sage Publishing
Cucchiella, F. and Gastaldi, M. (2006). ‘Risk management in supply chain: A real option
approach’. Journal of Manufacturing Technology Management Vol. 17, No. 6, p. 700-
720
REFERENCES
294
Curran, T. and Williams, I.D. (2012). ‘A zero waste vision for industrial networks in
Europe’. Journal of Hazardous Materials Vol. 207–208, p. 3–7
Dainty, A. R. J. and Brooke, R. J. (2004). ‘Towards improved construction waste
minimisation: a need for improved supply chain integration?’. Structural Survey Vol. 22,
No. 1, p. 20–29
Dajadian, S. A. & Koch, D. C. (2014). ‘Waste Management Models and Their
Applications on Construction Sites’. International Journal of Construction Engineering
and Management 2014, Vol. 3, No. 3, p. 91-98. Link: DOI: 10.5923/j.ijcem.20140303.02
Dantus, M. M. & High, K. A. (1999). ‘Evaluation of waste minimization alternatives
under uncertainty: a multiobjective optimization approach’. Computers and Chemical
Engineering Vol. 23, p: 1493 – 1508
Davis. N (2007). ‘Construction Sector Productivity-Scoping Report’. Martin-Jenkins,
Wellington, New Zealand
Davison, R. M. (1998). ‘An Action Research Perspective of Group Support Systems:
How to Improve Meetings in Hong Kong’. PhD Thesis, City University of Hong Kong.
Link: http://www.is.cityu.edu.hk/staff/isrobert/phd/phd.htm
De Vaus, D (2005) Research design in Social Research, New York University, New
York, USA
Denzin, N. K. & Lincoln, Y. S. (2005). ‘The Sage Handbook of Qualitative Research (3rd
ed.)’. Thousand Oaks, CA: Sage. ISBN 0-7619-2757-3
REFERENCES
295
Department for Environment, Food and Rural Affairs – Defra (2011). ‘The Economics of
Waste and Waste Policy’. Waste Economics Team, Environment and Growth
Economics, Defra
Department of Environment Transport and the Regions (2000). ‘Building a Better
Quality of Life’. Report, HMSO, UK
Department of Housing and Building (2009). ‘Report of the Building and Construction
Sector Productivity Taskforce-A modern efficiency and productive New Zealand built
infrastructure industry’. Department of Housing and Building, Wellington, New Zealand
Dharmavaram, S.; Mount, J. B. & Donahue, B. A. (1990). ‘Automated Economic
Analysis Model For Hazardous Waste Minimization’. Journal of the Air & Waste
Management Association, Vol. 40, No. 7, p. 1004-1011
DiCicco-Bloom, B. & Crabtree, B. F. (2006). ‘Making sense of qualitative research: The
qualitative research interview’. Medical Education Vol. 40, p: 314–321,
doi:10.1111/j.1365-2929.2006.02418.x
Dickson, J. & Lock, D. (2012). ‘Construction Waste Prevention Strategy: Consideration
of Waste Prevention in Materials Certification’. ZeroWIN. Link www.zeroWIN.eu
Dictionary (2015). ‘Sustainability meaning’. Link:
http://dictionary.reference.com/browse/sustainability
Dimitrakopoulos, R. (2010). ‘Stochastic mine planning: methods, examples and value in
an uncertain world’. Book: ‘Advances in Orebody modelling and strategic mine
planning’, Editor: R. Dimitrakopoulos, AusIMM Conference, Melbourne
REFERENCES
296
Dimitrakopoulos, R. and Sabour, S. (2007). ‘Evaluation mine plans under uncertainty:
Can real options make a difference?’. Resources Policy Vol. 32, p. 1-10
Dimitrakopoulos, R., Martinez, L. and Ramazan, S. (2007). ‘A maximum
upside/minimum downside approach to the traditional optimization of open pit mine
design’. Journal of Mining Science Vol. 43, No. 1, p. 73-82
Ding, G. K. C (2007). ‘Sustainable construction - The role of environmental assessment
tools’. Journal of Environmental Management Vol. 86, p. 451–464
Dolan, P. J; Lampo, R. G. & Dearborn, J. C. (1999). ‘Concepts for Reuse and Recycling
of Construction and Demolition Waste’. US Army Corps of Engineers - Construction
Engineering Research Laboratories
Doppelt, B.; Dowling-Wu, L. and Seldman, N. (1999). ‘Report for Oregon and the Pacific
Northwest: Establishing Environmentally Sustainable and Economically Efficient
Economies: From Waste Management towards Zero Waste’
Dowd, K. (2005). ‘Measuring market risk’. Book, John Wiley & Sons, Chichester,
England
Drummond, M. & Sculpher, M. F(2005). ‘Common Methodological Flaws in Economic
Evaluations’. Medical Care, Vol. 43, No. 7
du Plessis, C. (2001). ‘Sustainability and sustainable construction: the African context’.
Building Research & Information, Vol. 29, No. 5, p. 374-380
Dunn, K. (2010). Book Section: ‘Interviewing’. Book: ‘Qualitative Research Methods in
Human Geography’. Editor: Hay, I.
REFERENCES
297
Easterby-Smith, M; Thorpe, R. & Lowe, A. (2002). ‘Management Research: An
Introduction’. Sage Publishing
Ecolife (2015). ‘Definition of Waste Management’. Link:
http://www.ecolife.com/define/waste-management.html
Edum-Fotwe, F. T. & Price, A. D. F. (2009). ‘A social ontology for appraising
sustainability of construction projects and developments’. International Journal of
Project Management Vol. 27, p. 313–322
Egan, J. (1998). ‘Rethinking Construction - The report of the Construction Task Force to
the Deputy Prime Minister, John Prescott, on the scope for improving the quality and
efficiency of UK construction’.
Environment Protection Authority (EPA) (2009). ‘Waste definitions’. Waste Guide. South
Australia Government
Environmental New South Wales, (2014). ‘Sustainability Advantage’. Link:
http://www.environment.nsw.gov.au/sustainbus/sustainabilityadvantage.htm. Access
date: 28/05/2014 and 28/05/2015
Environmental Protection Agency (2002). ‘What Is Integrated Solid Waste
Management?’. Fact Sheet, USA
Environmental Protection Agency (2009). ‘EPA Guideline: Waste Definitions’. Link:
www.epa.sa.gov.au/files/4771336_guide_waste_definitions.pdf. Access Date 26/05/2015
EPPI (2010). ‘EPPI-Centre Methods for Conducting Systematic Reviews’. Report,
Social Science Research Unit, Institute of Education, University of London. Link:
http://eppi.ioe.ac.uk/cms/LinkClick.aspx?fileticket=hQBu8y4uVwI%3D&tabid=88
REFERENCES
298
Fadiya, O. O.; Georakis, P. & Chinyio, E. (2014). ‘Quantitative Analysis of the Sources
of Construction Waste’. Journal of Construction Engineering, Volume 2014. Link:
http://dx.doi.org/10.1155/2014/651060
Farrow, J. R. (2011). ‘Risk Identification and the Quantification of Sustainability
Comprehensive Financial Cost Benefit Analysis that Includes Environmental and Social
Costs - 11553’. Waste Management 2011 Conference, February 27 – March 3, 2011,
Phoenix, AZ, USA
Fatta, D.; Papadopoulos, A.; Avramikos, E.; Sgourou, E.; Moustakas, K.; Kourmoussis,
F.; Mentzis, A.; Loizidou, M. (2003). ‘Generation and management of construction and
demolition waste in Greece—an existing challenge’. Resources, Conservation and
Recycling Vol. 40, p. 81-91
Fayad, R.; Bekhazi, C.; Ford, R.; Chikhail, M.; Demashkieh, M.; Kahwaji, R.; Sulaiman,
A.; Sakar, M; Othmani, A. & Marrouf, M. (2009). ‘Environmental and Social Impact
Assessment of Construction and Operation of Syria Cement Plant and Captive Power
Plant and Associated Quarry Operations, Syria’. ELARD SYRIA & GOLDER
ASSOCIATES AFRICA
Feast, L. & Melles (2010). ‘Epistemological Positions in Design Research: A Brief
Review of the Literature’. Connected 2010 –2nd International Conference On Design
Education 28 June -1 July 2010, University of New South Wales, Sydney, Australia
Fellows, R. & Liu, A. (2007). ‘Impacts of Participants’ Values on Sustainability of
Construction Projects’. School of the Built and Natural Environment, Glasgow
Caledonian University and Department of Real Estate and Construction, The University
of Hong Kong.
REFERENCES
299
Fernández-Sánchez, G. & Rodríguez-López, F. (2010). ‘A methodology to identify
sustainability indicators in construction project management - Application to
infrastructure projects in Spain’. Ecological Indicators Vol. 10, p. 1193–1201
Ford, D., Lander, D. and Voy, J. J. (2002). ‘A real options approach to valuing strategic
flexibility in uncertain construction projects’. Construction Management and Economics
Vol. 20, p. 343-351
Foster, J.; Lowe, A.; Winkelman, S. (2011). ‘The Value of Green Infrastructure for
Urban Climate Adaptation’. Center for Clean Air Policy
Fox, R. (2008). ‘A brief critical history of NPV’. Salford University
Fredricsen, P. (2003). ‘The Changing Scene for Construction and Demolition Waste
Recycling’. Materials Processing Ltd. Link:
http://www.ioqnz.co.nz/uploads/The%20Changing%20Scene%20for%20Construction%
20and%20Demolition%20Waste%20Rec.pdf
Funk, K.; Milford, J. & Simpkins, T. (2013). ‘Waste Not, Want Not: Analyzing the
Economic and Environmental Viability of Waste-to-Energy (WTE) Technology for Site-
Specific Optimization of Renewable Energy Options’. National Renewable Energy
Laboratory for The Joint Institute for Strategic Energy Analysis, U.S. Department of
Energy
Gamba, A. and Fusari, N. (2009). ‘Valuing modularity as a real option’. Management
Science Vol. 55, No. 11, p. 1877-1896
REFERENCES
300
Gay, A. E.; Beam, T. G. & Mar, B. W. (1993). ‘Cost-effective solid-waste
characterization methodology’. Journal of Environmental Engineering, Vol. 119, No. 4,
p. 631-644
General Motors (2012). ‘The Business Case for Zero Waste’. GM News, Link:
http://media.gm.com/media/us/en/gm/news.detail.html/content/Pages/news/us/en/2012/
Oct/1019_Landfill-FreeBlueprint.html
Gibbs, A. (1997). ‘Focus Group’. Link: http://sru.soc.surrey.ac.uk/SRU19.html
Gill, S.E. Handley, J.F. Ennos, A.R. & Pauleit, S. (2006). ‘Adapting Cities for Climate
Change: The Role of the Green Infrastructure’. Built Environment Vol. 33 No. 1, p. 115-
133
Glavic, P. & Lukman, R. (2006). ‘Review of sustainability terms and their definitions’.
Journal of Cleaner Production Vol. 15, p. 1875-1885
Goldman, G. & Ogishi, A. (2001). ‘The Economic Impact Of Waste Disposal And
Diversion In California’. A Report To The California Integrated Waste Management
Board. Department of Agricultural and Resource Economics, University of California,
Berkeley
Gordon, D. (2013). ‘Interviewing in Qualitative Research’. Universal Design Research
Group, Room K107A, School of Computing, Dublin Institute of Technology, Kevin
Street, Dublin 8
Graham, T. & Mitchell, L. (2011). ‘Recycling construction waste’. Build Magazine,
BRANZ
REFERENCES
301
Grant, A., et al. (2005). ‘Mining and commodities exports’. The Australian Treasury
Canberra
Grasselli, M. R. (2003). ‘Getting real with Real Options’. Management Science
Gray, D. E. (2004). ‘Doing Research in the Real World’. Sage Publishing
Gray, D. E. (2009). ‘Doing Research in the Real World – 2nd Edition’. Sage Publishing
Green Building Solutions (2013). ‘What is Green Construction?’. Webs address:
http://www.greenbuildingsolutions.org/Main-Menu/What-is-Green-Construction. Access
date: 04/08/2013
Green Star NZ (2009). ‘Interior Assessment Guide’. New Zealand Green Building
Council.
Green, S. & May, S. (2003). ‘Re-engineering construction: going against the grain’.
Building Research & Information, Vol. 31, No. 2, p. 97-106
Greenwood, D. J. (2001). ‘Subcontract procurement: Are relationships changing?’.
Construction Management and Economics Vol. 19, p. 5-7
Greeves, J. T., Stoll, R. and Tauxe, J. (2010). ‘Risk-Based Performance Assessment of
Large Projects’. WM2010 Conference, Phoenix, AZ
Gruber, T. R. (1995). ‘Toward principles for the design of ontologies used for knowledge
sharing’. International Journal of Human-Computer Studies, Vol. 43, Issues 4-5,
November 1995, pp. 907-928
Guma, A. C. (2008). ‘A Real Options Analysis of a Vertically Expandable Real Estate
Development’. Unpublished Thesis: Master of Science in Real Estate Development,
Department of Urban Studies and Planning, Massachusetts Institute of Technology
REFERENCES
302
Gurtler-Schrieverhoff, M. P.; Engel, A.; Lindermann, U. & Yosefzon, Y. (2014). ‘DFA
Methodology Guide and Economic Model’. European Union - Research, Technological
Development & Demonstration (RTD), Seventh Framework Programme (FP7), Rue
Montoyer 75, MO75 - 2/4 - 1049 Brussels
Guy, G. B. & Kibert, C. J. (1998). ‘Developing indicators of sustainability: US
experience’. Building Research & Information, Vol. 26, No. 1, p. 39-45
Haapio, A. & Viitaniemi, P. (2008). ‘A critical review of building environmental
assessment tools’. Environmental Impact Assessment Review Vol. 28, p. 469–482
Hadjieva-Zaharievaa, R.; Dimitrova, E. & Buyle-Bodin, F. (2003). ‘Building waste
management in Bulgaria: challenges and opportunities’. Waste Management Vol. 23, p.
749–761
Haik, Y. & Shahin, T. (2011). ‘Engineering Design Process – Second Edition’. Cengage
Learning, 200 First Stamford Place, Suite 400, Stamford, CT 06902, USA
Hajdasinski, M. M. (2012). ‘The payback period as a measure of profitability and
liquidity’. Link: http://www.allbusiness.com/accounting-reporting/record-keeping/391065-
1.html#ixzz1jszarXFx
Hall, J. and Nicholls, S. (2006). ‘Valuation of mining projects using option pricing
techniques’. CPA Australian Mining and Energy Conference, UQ Business School, The
University of Queensland
Hall, M. & Purchase, D. (2006). ‘Building or Bodging? Attitudes to Sustainability in UK
Public Sector Housing Construction Development’. Sustainable Development Vol. 14, p.
205–218
REFERENCES
303
Hamzed, F. & Bergstrom, E. (2010). ‘The Lean Transformation: A Framework for
Successful Implementation of the Last Planner System in Construction’. Colorado State
University, Fort Collins, Colorado
Hao, J. L.; Hills, M. J. and Huang, T. (2007). ‘A simulation model using system dynamic
method for construction and demolition waste management in Hong Kong’.
Construction Innovation Vol. 7, No. 1, p. 7-21
Hartlen, J. (1996). ‘Environmental Consequences of Using Residues’. Waste
Management Vol. 16, No. I -3, p. 1-6.
Hassan, S. H.; Ahzahar, N.; Fauzi, M. A. & Eman, J. (2012). ‘Waste Management
Issues in the Northern Region of Malaysia’. Procedia - Social and Behavioral Sciences
Vol. 42 p. 175-181
Hatmoko, J. and Scott, S. (2010). ‘Simulating the impact of supply chain management
practice on the performance of medium‐sized building projects’. Construction
Management and Economics Vol. 28, No. 15, p. 35-49
Hendersona, V. and D. G. Hobson (2001). ‘Real options with constant relative risk
aversion’. Journal of Economic Dynamics & Control Vol. 27
Hendler, S. (1980). ‘Planning Issues and Sustainable Development’. Planning, Theory,
Practice and Education. Center for Urban Policy Research, New Brunswick, NJ, pp.
104–19
Hengels, A. (2005). ‘Creating a Practical Model Using Real Options to Evaluate Large-
Scale Real Estate Development Projects’. Unpublished Thesis: Master of Science in
REFERENCES
304
Real Estate Development, Department of Architecture, Massachusett Institute of
Technology
HERA (2010). ‘IMPORTED STEELWORK: Economic Social and Risk-related Impacts’.
HERA Report No R5-40
Hiles, D. (2001). ‘Heuristic Inquiry and Transpersonal Research’. Conference: CCPE,
London - October, 2001. Link: http://www.psy.dmu.ac.uk/drhiles/HIpaper.htm
Hill R. C. & Bowen P. A. (1997). ‘Sustainable construction: principles and a framework
for attainment’. Construction Management and Economics, Vol, 15, No. 3, p. 223-239
Hoare (2007). ‘Role of Simulation Modelling in Project Evaluation’. Project Evaluation
Conference, Melbourne, Australian Institute of Mining and Metallurgy
Hogland, W. and Marques, M. (2007). ‘Sustainable Waste Management: International
Perspectives’. Proceedings of the International Conference on Sustainable Solid Waste
Management, 5 - 7 September 2007, Chennai, India. pp.1-8
Holden, M. T. & Lynch, P. (1999). ‘Choosing the Appropriate Methodology:
Understanding Research Philosophy’. Waterford Institute of Technology, Cork Road,
Waterford
Holton, I; Glass, J. & Price, A. (2008). ‘Developing a Successful Sector Sustainability
Strategy: Six Lessons from the UK Construction Products Industry’. Corporate Social
Responsibility and Environmental Management Vol. 15, p.29–42
Hopkins. W. G. (2000). ‘Quantitative Research Design’. Department of Physiology,
University of Otago, Dunedin 9001, New Zealand
REFERENCES
305
Hostetlera, M.; Allen, W. & Meurk, C. (2011). ‘Conserving urban biodiversity? Creating
green infrastructure is only the first step’. Landscape and Urban Planning Vol. 100, p.
369–371
Howell, G. A. (1999). ‘What Is Lean Construction – 1999’. Proceedings IGLC-7. Link:
http://www.lcinm.org/uploads/Howell.pdf
Howell, G. A. (2001). ‘Lean Project Delivery’. Lean Construction Institute
Hu, Y. (2011). ‘Minimization Management of Construction Waste’. Department of
Construction Engineering Management, Henan University of Urban Construction, Ping
Dingshan, China
Huang, W-L.; Lin, D-H.; Chang, N-B. and Lin, K-S. (2002). ‘Recycling of construction
and demolition waste via a mechanical sorting process’. Resources, Conservation and
Recycling Vol. 37, p. 23-37
Hueting, R. & Reijnders, L. (2004). ‘Broad sustainability contra sustainability: the proper
construction of sustainability indicators’. Ecological Economics Vol. 50, p. 249–260
Hughes, J. A. & Sharrock, W. W. (1997). ‘The Philosophy of Social Research’.
Longman Publishing
Huglin, L. M. (2003). ‘The relationship between personal epistemology and learning
style in adult learners’. Dissertation Abstracts International, Vol. 64, No. 03, p: 759
Hult, G., Craighead, C. W. and Ketchen, D. J. (2010). ‘Risk uncertainty and supply
chain decisions: A real options perspective’. Decision Sciences Journal Vol. 4, No. 3, p.
435-458
REFERENCES
306
Hyder Consulting; Encycle Consulting & Sustainable Resource Solutions (2011).
‘Construction and Demolition Waste Status Report - Management of Construction And
Demolition Waste In Australia’. Hyder Consulting Pty Ltd
IAEA (1999). ‘Review of the factors affecting the selection and implementation of waste
management technologies’. Waste Technology Section, International Atomic Energy
Agency, Wagramer Strasse 5, P.O. Box 100, A-1400 Vienna, Austria
Jacoby, H. D. and D. G. Laughton (1991). ‘Project Evaluation: A Practical Asset Pricing
Method’. Massachusetts Institute of Technology, Cambridge, MA, USA
Jaillon, L.; Poon, C. S. and Chiang, Y. H. (2009). ‘Quantifying the waste reduction
potential of using prefabrication in building construction in Hong Kong’. Waste
Management Vol. 29, p. 309-320
Jain, M. (2012). ‘Economic Aspects of Construction Waste Materials in terms of cost
savings – A case of Indian construction Industry’. International Journal of Scientific and
Research Publications, Volume 2, Issue 10
Jansen, K. J.; Corley, K. G. & Jansen, B. J. (2007). ‘E-Survey Methodology’. Book:
‘Handbook of Research on Electronic Surveys and Measurements’. Editors: Reynolds,
R. A.; Woods, R. & Baker, J. D.
Janssen. J, McLoughlin. S (2008). ‘New Zealand‟s Productivity Performance’. New
Zealand Treasury, Wellington 6015, New Zealand
Jaques, R. (1988). ‘The Influence of Design and Procurement on Construction Site
Waste Generation -A Pilot Study’. BRANZ Report No. 81 (1998)
REFERENCES
307
Jaques, R. (1998). ‘The Influence of Design and Procurement on Construction Site
Waste Generation -A Pilot Study’. BRANZ Report No. 81 (1998)
Jensen, M. C and Smith, C. W. (1984). ‘The Theory of Corporate Finance: A Historical
Overview’. Book: ‘The Modern Theory of Corporate Finance’, Editor: Michael C. Jensen
and Clifford W. Smith, Jr. (New York: McGraw-Hill Inc., 1984) pp. 2- 20
Jin, J.; Wang, Z. & Ran, S. (2006). ‘Solid waste management in Macao: Practices and
challenges’. Waste Management Vol. 26, p. 1045-1051
Jones, H. & Jones, P. (2007). ‘Cities and sustainability’. Landscape and Urban Planning
Vol. 83, p. 1
Jonker, J. & Pennink, B. W. (2010). ‘The Essence of Research Methodology: A Concise
Guide for Master and PhD Students in Management Science’. Springer, Heidelberg
Kaare, K. and Koppel, O. (2012). ‘Improving the road construction supply chain by
developing a national level performance measurement system: The case of Estonia’.
International Journal of Social and Human Sciences Vol. 6, p. 225-231
Kaboub, F. (2008). ‘Positivist Paradigm’. Encyclopedia-Vol -2 (Pat 2). Page 343
Kale, S. and Arditi, D. (2001). ‘General Contractor’s relationships with subcontractors: A
strategic asset’. Construction Management and Economics Vol.19, p. 541-549
Kambites, C. & Owen, S. (2006). ‘Renewed prospects for green infrastructure planning
in the UK’. Planning Practice & Research, Vol. 21, No. 4, p. 483-496
Kara, S., Kayis, B. and Gomez, E. (2008). ‘Managing supply chain risks in multi-site,
multi-partner engineering projects’. Journal Paper, IBIMA Vol. 5, p. 100-112
REFERENCES
308
Kara, S., Kayis, B. and Gomez, E. (2008). ‘Managing supply chain risks in multi-site,
multi-partner engineering projects’. Journal Paper, IBIMA Vol. 5, p. 100-112 Kazor, M.
and Koppel, J. (2007). ‘Scoping Waste in the Residential Built Environment: Final
Report’. Beacon Pathway Ltd, Auckland
Kartam, N.; Al-Mutairi, N.; Al-Ghusain, I. and Al-Humoud, J. (2004). ‘Environmental
management of construction and demolition waste in Kuwait’. Waste Management Vol.
24, p. 1049–1059
Kats, G. H. (2003). ‘Green Building Costs and Financial Benefits’. Massachusetts
Technology Collaborative
Kazor, M. and Koppel, J. (2007). ‘Scoping Waste in the Residential Built Environment:
Final Report’. Beacon Pathway Ltd, Auckland
Keegan, G. (2014). ‘The Experimental Method’. Link:
http://www.gerardkeegan.co.uk/resource/experimentalmeth1.htm
Keivan, S. (2013). ‘Waste management at no extra cost’. Unpublished Master’s
Dissertation. For the Degree of Masters in Engineering Project Management,
Engineering Project Management Programme, School of Engineering, AUT.
Kestle, L. and Rimmer, T. (2010). ‘Sustainable design and construction education -
getting students on board with the real challenges in NZ’. Report Number SB10NZ,
UNITEC Institute of Technology, Faculty of Technology and Built Environment, PB 92-
025, Auckland, New Zealand
Khalfan, M. M. A. (2006). ‘Managing sustainability within construction projects’. Journal
of Environmental Assessment Policy and Management Vol. 8, No. 1 pp. 41–60
REFERENCES
309
Khanzode, A; Fischer, M.; Reed, D. & Ballard, G. (2006). ‘A Guide to Applying the
Principles of Virtual Design & Construction (VDC) to the Lean Project Delivery Process’.
CIFE Working Paper #093, Center For Integrated Facility Engineering
Kijjanapanich, P.; Annachhatre, A. P.; Esposito, G.; van Hullebusch, E. D. & Lens, P. N.
L. (2013).’ Biological sulfate removal from gypsum contaminated construction and
demolition debris’. Journal of Environmental Management Vol. 131, p. 82-91
Kim, K. (2003). ‘Real Options: A Way to Deal With Market Uncertainty in Real Estate
Development Projects’. Unpublished Thesis: Master of Science in Real Estate
Development, Department of Architecture, Massachuset Institute of Technology
Kinuthia, J.M. and Nidzam, R.M. (2011). ‘Towards zero industrial waste: Utilisation of
brick dust waste in sustainable construction’. Waste Management, Vol. 31, p. 1867–
1878
Knight (2007). ‘Is Zero Waste Conceivable?’. Zero Waste NZ Report
Kofoworola, O. F. and Gheewala, S. H. (2009). ‘Estimation of construction waste
generation and management in Thailand’. Waste Management Vol. 29, p. 731-738
Konstantinou, T. & Knaack, U. (2012). ‘An Integrated Refurbishment Design Process to
Energy Efficiency’. Faculty of Architecture, Department of AE+T, Delft University of
Technology Julianalaan 134, 2628 BL, Delft, the Netherlands
Koskela, L. (1992). ‘Application of the New Production Philosophy to Construction’.
Technical Report # 72. Center for Integrated Facility Engineering. Department of Civil
Engineering. Stanford University, pp75
REFERENCES
310
Kothari, C. R. (2004). ‘Research Methodology: Methods and Techniques’. Second
Edition. New Age International Ltd Publishers
Kourmpanis, B.; Papadopoulos, A.; Moustakas, K..; Stylianou, M.; Haralambous, K. J.
and Loizidou, M. (2008). ‘Preliminary study for the management of construction and
demolition waste’. Waste Management & Research Vol. 26, p. 267–275
Kubba, S. (2009). ‘LEED Practices, Certification, and Accreditation Handbook, 1st
Edition’. Publisher: Butterworth-Heinemann
Kubba, S. (2011). ‘Green Construction Project Management and Cost Oversight’.
Publisher: Architectural Press
Kucukvar, M.; Egilmez, G. & Tatari, O. (2016). ‘Life Cycle Assessment and
Optimization-Based Decision Analysis of Construction Waste Recycling for a LEED-
Certified University Building’. Sustainability 2016, Vol. 8, No. 89;
doi:10.3390/su8010089
Kulatunga, U.; Amaratunga, D.; Haigh, R. and Rameezdeen, R. (2006). ‘Attitudes and
perceptions of construction workforce on construction waste in Sri Lanka’. Management
of Environmental Quality: An International Journal Vol. 17, No. 1, p. 57-72
Kumar, V.; Bee, D. J.; Shirodkar, P. S.; Tumkor, S.; Bettig, B. P. and Sutherland, J. W.
(2005). ‘Towards Sustainable “Product and Material Flow” Cycles: Identifying Barriers to
Achieving Product Multi-Use and Zero Waste’. 2005 ASME International Mechanical
Engineering Congress and Exposition November 5-11, 2005, Orlando, Florida USA
Kumara, T. D. W. (2009). ‘Construction & Demolition Waste Management Practices of
Building Projects In Sri Lanka’. Dissertation for Master of Business Administration,
REFERENCES
311
Department of Management of Technology, University of Moratuwa, Sri Lanka. Link:
http://dl.lib.mrt.ac.lk/bitstream/handle/123/1266/94840.pdf?sequence=1
Kuslyaykina, D. (2013). ‘Exploratory Study of Waste Generation and Waste
Minimization in Sweden’. Master’s Thesis, Department of Earth Sciences, Uppsala
University
Lai, F. J. and W. Stange (2009). ‘Using Value-at-Risk for integrated project risk
evaluation’. Project Evaluation Conference, Melbourne, Vic
Lam, P. T.I.; Chan, E. H.W.; Poon, C.S.; Chau, C.K. & Chun, K.P. (2010). ‘Factors
affecting the implementation of green specifications in construction’. Journal of
Environmental Management Vol. 91, p. 654–661
Landauer, J. & Rowlands, J. (2001). ‘Importance of Philosophy’. Link:
http://www.importanceofphilosophy.com/FiveBranchesMain.html
Landin, A. and Öberg, M. (2014) Productivity and Efficiency in the Development of the
Swedish Construction Sector. American Journal of Industrial and Business
Management, 4, 307-318. Link:
www.scirp.org/journal/PaperDownload.aspx?paperID=47367
Langfield, N. (2011). ‘Building up Zero Waste’. Link:
http://www.resource.uk.com/article/Comment/Building_zero_waste#.UTQk1zBkOSo
(accessed 04 March 2013)
Laurie, A. (2016). ‘Log Pricing Tables’. Laurie Forestry Ltd. Link:
http://www.laurieforestry.co.nz/Pricing-Table
REFERENCES
312
Lawson, R. (2013). ‘The importance of construction sector to the overall economy’.
Wales Business. Link: http://www.walesbusiness.org/2013/08/the-importance-of-
construction-sector-to-the-overall-economy/
Lee, E. G. and D. M. Strang. (2003a). ‘Valuation techniques used in the mining industry
Part one: Cost, market and income approaches’. Link:
http://www.allbusiness.com/mining-extraction/mines-mining/16431294-
1.html#ixzz1b0aWZ5No. Retrieved 20 October, 2013,
Lee, E. G. and D. M. Strang. (2003b). ‘Valuation techniques used in the mining industry
part two: Sensitivity analysis measures risk’. Link: http://www.allbusiness.com/science-
technology/computer-science-computational-research/16555364-
1.html#ixzz1b0bXoH2r. Retrieved 20 October, 2013,
Lee, E. G. and D. M. Strang. (2003c). ‘Valuation techniques used in the mining industry
Part three: Real option valuation approach’. Link: http://www.allbusiness.com/mining-
extraction/mines-mining-metal-ore-gold/16406278- 20131.html#ixzz1b0bwjbAw.
Retrieved 20 October,
Lehmann, S. (2011). ‘Optimizing Urban Material Flows and Waste Streams in Urban
Development through Principles of Zero Waste and Sustainable Consumption’.
Sustainability 2011, Vol. 3, p. 155-183
Lehmann, S. (2011). ‘Resource Recovery and Materials Flow in the City: Zero Waste
and Sustainable Consumption as Paradigms in Urban Development. Sustainable
Development Law & Policy, Vol. 11, Iss. 1, p. 28-38
LePatner, B. B. (2008). ‘The Industry That Time Forgot: What’s wrong with the $1 trillion
construction business?’. Link: http://www.itif.org/files/LePatnerPresentation.pdf
REFERENCES
313
Letendre, E. (2013). Planning for the Effective Reuse of Products in the New Zealand
Building Industry - A Dunedin Case Study (Thesis, Master of Planning). University of
Otago. Retrieved from http://hdl.handle.net/10523/3661
Level (2015). ‘Minimising waste’. Website. Link: http://www.level.org.nz/material-
use/minimising-waste/ Access Date: May, 2015
Levin, H. (2000). ‘Design and Construction of Healthy and Sustainable Buildings’.
Building Ecology Research Group, 2548 Empire Grade, Santa Cruz, CA, 95060 USA
Li, H.; Chen, Z.; Yng, L. and Kong, S. C.W. (2005). ‘Application of integrated GPS and
GIS technology for reducing construction waste and improving construction efficiency’.
Automation in Construction Vol. 14, p. 323–331
Li, J.; Ding, Z.; Mi, X & Wang, J. (2013). ‘A model for estimating construction waste
generation index for building project in China’. Resources, Conservation and
Recycling Vol. 7, p. 20–26
Lingard, H.; Gilbert, G. and Graham, P. (2001). ‘Improving solid waste reduction and
recycling performance using goal setting and feedback’. Construction Management and
Economics, Vol. 19, No. 8, p. 809-817
Lingard, H.; Graham, P. and Smithers, G. (2000). ‘Employee perceptions of the solid
waste management system operating in a large Australian contracting organization:
implications for company policy implementation’. Construction Management and
Economics Vol. 18, No. 4, p. 383-393
Liss, G. (2000). ‘Local government incentives for Zero Waste’. Link:
http://archive.grrn.org/zerowaste/articles/loc_gov_zw_incentives.html
REFERENCES
314
Llatas, C. (2011). ‘A model for quantifying construction waste in projects according to
the European waste list’. Waste Management Vol. 31, p. 1261–1276
Lorenz, D. P.; Truck, S. & Lutzkendorf, T. (2007). ‘Exploring the relationship between
the sustainability of construction and market value: Theoretical basics and initial
empirical results from the residential property sector’. Property Management Vol. 25 No.
2, p. 119-149
Love, P. E. D.; Holt, G. D; Shen, L. Y. and Irani, Z. (2002). ‘Using systems dynamics to
better understand change and rework in construction project management systems’.
International Journal of Project Management Vol. 20, p. 425–436
Lu, W & Yuan H. (2011). ‘A framework for understanding waste management studies in
construction’. Waste Management Vol. 31, p. 1252–1260
Lu, W. and Yuan, H. (2010). ‘Exploring critical success factors for waste management
in construction projects of China’. Resources, Conservation and Recycling Vol. 55, p.
201–208
Lu, W; Yuan H.; Li, J.; Hao, J. J. L.; Mi, X & Ding, Z. (2011). ‘An empirical investigation
of construction and demolition waste generation rates in Shenzhen city, South China’.
Waste Management Vol. 31, p. 680–687
M’Ikiugu, M. M.; Kinoshita, I. & Tashiro, Y. (2012). ‘Urban Green Space Analysis and
Identification of its Potential Expansion Areas’. Procedia - Social and Behavioral
Sciences Vol. 35 p. 449 – 458
REFERENCES
315
M’Ikiugu, M. M.; Wang, Q-N. & Kinoshita, I. (2012). ‘Green Infrastructure Gauge: A tool
for evaluating green infrastructure inclusion in existing and future urban areas’.
Procedia - Social and Behavioral Sciences Vol. 68 p. 815 – 825
MacDonald, G. (2003). ‘Using systematic reviews to improve social care’. SCIE
Reports: No 4. Link: http://www.scie.org.uk/publications/reports/report04.pdf
Mackenzie, W. and N. Cusworth (2006). ‘The Use and Abuse of Feasibility Studies’.
Project Evaluation Conference Melbourne, Vic
Macmillan, F. (2000). ‘Risk, Uncertainty and Investment Decision-Making in the
Upstream Oil and Gas Industry’. Ph. D. Thesis, University of Aberdeen, Aberdeen
Macomber, H. & Barberio, J. (2007). ‘Target-Value Design: Nine Foundational Practices
for Delivering Surprising Client Value’. Lean Project Consulting, Inc.
Manowong, E. (2012). ‘Investigating factors influencing construction waste
management efforts in developing countries: an experience from Thailand’. Waste
Management & Research, Vol. 30, No. 1, p: 56-71
Manzini, F.; Islas, J. & Macías, P. (2011). ‘Model for evaluating the environmental
sustainability of energy projects’. Technological Forecasting & Social Change Vol. 78,
p. 931–944
Maria, A. (1997). ‘Introduction to Modelling and Simulation’. The 1997 Winter Simulation
Conference, Atlanta, GA, USA
Marshall, C. & Rossman, G. B. (2011). ‘Designing Qualitative Research 5th Edition’.
Sage Publishing
REFERENCES
316
Marshall, R. E. & Farahbakhsh, K. (2013). ‘Systems approaches to integrated solid
waste management in developing countries’. Waste Management, Vol. 33, p. 988–1003
Martinez, L. (2009). ‘Why accounting for uncertainty and risk can improve final decision-
making in strategic open pit mine design’. Project Evaluation Conference, Melbourne,
Victoria
Marzouk, M. & Azab, S. (2014). ‘Environmental and economic impact assessment of
construction and demolition waste disposal using system dynamics’. Resources,
Conservation and Recycling Vol. 82, p. 41– 49
Mason, I.G.; Brooking, A.K.; Oberender, A.; Harford, J.M. and Horsley, P.G. (2003).
‘Implementation of a zero waste program at a university campus’. Resources,
Conservation and Recycling, Vol. 38, p. 257-269
Maybee, B. M. (2010). ‘A Risk-based Evaluation Methodology for Underground Mine
Planning’. PhD Thesis, School of Graduate Studies Sudbury, Laurentian University
Maybee, B., et al. (2010). ‘Risk-based decision making within strategic mine planning’.
International Journal of Mining and Mineral Engineering Vol. 2, No. 1
McDonagh, M.; Whiting, P.; Bradley, M.; Cooper, J.; Sutton, A.; Chestnutt, I.; Misso, K.;
Wilson, P.; Treasure, E. and Kleijnen, J. (2007). ‘A Systematic Review of Public Water
Fluoridation’. NHS Centre for Reviews and Dissemination, University of York. Link:
http://www.nhs.uk/Conditions/Fluoride/Documents/crdreport18.pdf
McDonald, B. & Smithers, M. (1998). ‘Implementing a waste management plan during
the construction phase of a project: a case study’. Construction Management and
Economics Vol. 16, No. 1, p. 71-78
REFERENCES
317
McGrath, C. (2001). ‘Waste minimisation in practice’. Resources, Conservation and
Recycling Vol. 32, p. 227 – 238
McKernon, S; Bates, S.; Stoecklein, A.; Maplesden, F. & Bayne, K. (2004). ‘Influencing
People’s Uptake of Sustainability in Housing (CON 1)’. Forest Research
Med ZeroWaste (2011). ‘Zero Waste Systems’ Analysis: Common Report’. Link:
http://www.med-
zerowaste.eu/deliverables/Zero%20Waste%20Systems%20Analysis%20Common%20
Report.pdf
Mell, I. C. (2008). ‘Green Infrastructure: concepts and planning’. FORUM Ejournal ol. 8,
p. 69-80
MetalCorp (2016). ‘Scrap Metal Price - Price List’. Link:
http://www.metalcorp.co.nz/pricelist.php
Metro Vancouver (2011). ‘Zero Waste challenge: Accelerating construction and
demolition waste diversion’. Link:
http://www.metrovancouver.org/region/dialogues/Reports%20and%20Issue%20Summa
ry%20Notes/Constuction-DemolitionWaste-CNE-Summary20110517.pdf (accessed 04
March 2013)
MfE - Ministry for the Environment (2008). ‘Recycling: Cost Benefit Analysis’. Link:
http://www.mfe.govt.nz/publications/waste/recycling-cost-benefit-analysis/5-markets-
and-value-materials
Michigan State University (2013). ‘Taiwan Economy’. Link:
http://globaledge.msu.edu/countries/taiwan/economy. Access date 10/09/2013
REFERENCES
318
Ministry for the Environment (1997). ‘National Waste Data Report’. Link:
http://www.mfe.govt.nz/publications/waste/nat-waste-data-report-may97.pdf (accessed
22 Jan 2013)
Ministry for the Environment (2009). ‘Solid Waste Composition Report’. Link:
http://www.mfe.govt.nz/environmental-reporting/report-cards/waste-
composition/2009/waste-composition.pdf (accessed 22 Jan 2013)
Ministry for the Environment (2010). ‘The waste problem’. Ministry for the Environment
Ministry for the Environment (2012). ‘Solid Waste Indicator Update’. Link:
http://www.mfe.govt.nz/environmental-reporting/waste/solid-waste/quantity.html
(accessed 22 Jan 2013)
Ministry for the Environment (2013). ‘Construction and Demolition Waste’. Link:
http://www.mfe.govt.nz/issues/waste/construction-demo/index.html (accessed 22 Jan
2013)
Ministry for the Environment (2015). ‘Construction and demolition waste: how to
manage responsibly’. Link: http://www.mfe.govt.nz/waste/types-waste/construction-
and-demolition-waste. Access Date: 20/05/2015
Missouri Department of Natural Resources (1998). ‘Construction Waste’. Link:
http://dnr.mo.gov/env/swmp/docs/wcs98constructionwaste.pdf. Access Date:
21/05/2015
Moore, M.; Kazman, R.; Klein, M. & Asundi, J. (2003). ‘Quantifying the Value of
Architecture Design Decisions: Lessons from the Field’. NASA Goddard Space Flight
Center
REFERENCES
319
Mora, E. P. (2007). ‘Life cycle, sustainability and the transcendent quality of building
materials’. Building and Environment Vol. 42, p. 1329–1334
Mortensen Construction (2013). ‘Lean Concepts Across Delivery Methods: Mortenson’s
Lean Journey’. Lean Construction Institute
Mosier, R. (2013). ‘Quantifying Costs and Benefits of Sustainable Projects in the City of
Oklahoma City’. Doctor of Philosophy Dissertation. Department of Engineering,
University of Oklahoma, Norman, Oklahoma, USA
Moutavtchi, V.; Stenis, J.: Hogland, W. & Shepeleva, A. (2010). ‘Solid waste
management by application of the WAMED model’. Journal of Material Cycles and
Waste Management, Vol. 12, p. 169-183. DOI 10.1007/s10163-009-0285-x
Moutavtchi, V.; Stenis, J.: Hogland, W.; Shepeleva, A. & Andersson, H. (2008).
‘Application of the WAMED model to landfilling’. Journal of Material Cycles and Waste
Management, Vol. 10, p. 62-70. DOI 10.1007/s10163-007-0186-9
Moyen, N., et al. (1996). ‘Valuing risk and flexibility’. Resource Policy Vol. 22, p. 63-74
Muijs, D. (2011). ‘Doing Quantitative Research in Education with SPSS 2nd Edition’.
Sage Publishing
Mukherji, M. (2009). ‘Research Methods in Early Childhood’. Unknown Publisher
Murray, P. E. & Cotgrave, A. J. (2007). ‘Sustainability literacy: the future paradigm for
construction education?’. Structural Survey Vol. 25 No. 1, pp. 7-23
Myers, D. (2005). ‘A review of construction companies' attitudes to sustainability’.
Construction Management and Economics, Vol. 23, No. 8, p. 781-785
REFERENCES
320
Nahmens, I. (2009). ‘From Lean to Green Construction: A natural extension’.
Construction Research Congress 2009, Seattle, Washington, April 5-7, 2009
Neale, P.; Thapa, S. & Boyce, C. (2006). ‘Preparing A Case Study: A Guide for
Designing and Conducting a Case Study for Evaluation Input’. Pathfinder International
Tool Series: Monitoring and Evaluation – 1. Pathfinder International
Nembhart, H., Shi, L. and Aktan, M. (2005). ‘A real-options-based analysis for supply
chain decisions’. IIE Transactions Vol. 37, p. 945-956
Nethery, B. (2003). ‘The role of Feasibility Studies in mining ventures’. Conference
Board of Canada: Structuring More Effective Mining Ventures. Vancouver B.C., AMEC
Mining and Metals
Neufville, R. D. (2003). ‘Real Options in Supply Chain Management’. Lecture Notes,
MIT
Neuman, W.L. (1994). ‘Social Research Methods’. Allyn and Bacon, Boston
New Zealand Legislation (2013). ‘Waste Minimisation Act 2008’. Ministry of the
Environment, Link:
http://www.legislation.govt.nz/act/public/2008/0089/latest/DLM999802.html?search=ts_
act_waste_resel&p=1&sr=1 (accessed 22 Jan 2013)
Newman, P. W. G. (1999). ‘Sustainability and cities: extending the metabolism model’.
Landscape and Urban Planning Vol. 44, p. 219-226
New Zealand Brick Distributor (2016). ‘Brick Products’. Link:
http://nzbrickdistributors.co.nz/products/ (accessed 27 May 2016)
REFERENCES
321
Nguyen, U. N. and Schnitzer, H. (2009). ‘Sustainable solutions for solid waste
management in Southeast Asian countries’. Waste Management Vol. 29, p. 1982–1995
Nielson, C.; Wolfe, C. B. & Conine, D. (2009). ‘GREEN BUILDING GUIDE: Design
Techniques, Construction Practices & Materials for Affordable Housing’. Rural
Community Assistance Corporation, 3120 Freeboard Drive, Suite 201, West
Sacramento, California 95691
Nordone, A. J.; White, P. R.; McDougall, F.; Parker, G.; Garmendia, A. and Franke, M.
(2009). ‘Waste management and minimization’. Integrated Waste Management,
Encyclopedia of Life Support Systems (EOLSS)
Nouman, M. (2011). ‘Research Paradigm and Methodologies: Positivism,
Phenomenology, Ontology, Epistemology, Axiology’. Course Material
Novikov, A. M. & Novikov, D. A. (2013). ‘Research Methodology: From Philosophy of
Science to Research Design’. CRC Press, Taylor & Francis Group
Nurminen J & Pongrácz E (2004). ‘Conceptual model of environmental management
system (EMS) of reversed information streams’. Proc. Waste Minimization and
Resources Use Optimization Conference. June 10, 2004, University of Oulu, Finland.
Oulu University Press: Oulu. p. 69-81. Editor: Pongrácz, E.
NZIA - New Zealand Institute of Architects (2007). ‘Guide to Architect’s Charges’. Link:
http://www.saundersarchitects.co.nz/SA/Guide.html
O’Connor, R. & Swain, B. ‘Implementing Lean in construction: Lean tools and
techniques – an introduction’. Transform Business Improvement Ltd & Brian Swain Ltd
REFERENCES
322
Ofori, G. (2000). ‘Greening the construction supply chain in Singapore’. European
Journal of Purchasing & Supply Management Vol. 6, p. 195-206
O'Neil, A. (2011). ‘What is a Project Financial Evaluation?’. Link:
http://www.ehow.com/facts_5030216_project-financial-evaluation.html#ixzz1FtNNyRJZ
<http://www.ehow.com/facts_5030216_project-financial-evaluation.html>. Retrieved
March 3, 2011,
Opdenakker, R. (2006). ‘Advantages and Disadvantages of Four Interview Techniques
in Qualitative Research’. Forum Qualitative Sozialforschung / Forum: Qualitative Social
Research, 7(4), Art. 11, http://nbn-resolving.de/urn:nbn:de:0114-fqs0604118pa
Ortiz, O.; Castells, F. & Sonnemann, G. (2008). ‘Sustainability in the construction
industry: A review of recent developments based on LCA’. Construction and Building
Materials Vol. 23, p. 28–39
Osmani, M. (2011). ‘Construction Waste’. Book section-Chapter 15, ‘Waste: A
Handbook for Management’. Editors: Letcher, T. & Vallero, D.
Osmani, M. (2012). ‘Construction Waste Minimization in the UK: Current Pressures for
Change and Approaches’. Procedia - Social and Behavioral Sciences Vol. 40, p. 37 –
40
Osmani, M.; Glass, J. & Price, A.D.F. (2008). ‘Architects’ perspectives on construction
waste reduction by design’. Waste Management Vol. 28, p. 1147–1158
Oxford Dictionaries (2014). Link: http://www.oxforddictionaries.com/definition/english/-
logy
REFERENCES
323
Paez, O., Salem, S., Solomon, J., & Genaidy, A. (2005). Moving from Lean
manufacturing to Lean Construction: Toward a common Sociotechnological Framework.
Human Factors and Ergonomics in Manufacturing , 15 (2), 233–245.
Palmer (2013). ‘The Faux Zero Waste Movement Is Spreading’. Green Social Thought
62: A Magazine of Synthesis and Regeneration, Fall 2013
Paparone, C. R. (2010). ‘Design and the Prospects of a US Military Renaissance’.
Small Wars Journal, Small Wars Foundation
PBS (2013). ‘San Francisco on Track to Become Zero Waste City’. Link:
http://www.pbs.org/newshour/bb/climate-change/jan-june13/recycling_01-25.html
Peng, C-L.; Scorpio, D. E. and Kibert, C. J. (1997). ‘Strategies for successful
construction and demolition waste recycling operations’. Construction Management and
Economics, Vol. 15, No. 1, p. 49-58
Persaud, I. (2010). ‘Field Study’. Book: ‘Encyclopedia of Research Design’. Editor:
Salkind, N. J. Sage Publishing
Persson, U. & Olander, S. (2004). ‘Methods to Estimate Stakeholder Views of
Sustainability for Construction Projects’. The 21st Conference on Passive and Low
Energy Architecture. Eindhoven, The Netherlands, p. 19 – 22 September 2004
Phillips, P. S.; Tudor, T.; Bird, H. and Bates, M. (2011). ‘A critical review of a key Waste
Strategy Initiative in England: Zero Waste Places Projects 2008–2009’. Resources,
Conservation and Recycling, Vol. 55, p. 335–343
Pietersz, G. (2011). ‘NPV (net present value)’. Link: http://moneyterms.co.uk/npv/
REFERENCES
324
Poli, R. (2010). Book Chapter: ‘Ontology: The Categorial Stance’. Book: ‘Theory and
Applications of Ontology: Philosophical Perspectives’. Editor: Poli, R. & Seibt, J.
Springer Science+Business Media B.V.
Poon, C. S.; Yu, A. T. W. and Jaillon, L. (2004). ‘Reducing building waste at
construction sites in Hong Kong’. Construction Management and Economics, Vol. 22,
No. 5, p. 461-470
Poon, C. S.; Yu, A. T. W. and Ng, L. H. (2001). ‘On-site sorting of construction and
demolition waste in Hong Kong’. Resources, Conservation and Recycling Vol. 32, p.
157 – 172
Poon, C. S.; Yu, A. T. W.; Wong, S. W. and Cheung, E. (2004). ‘Management of
construction waste in public housing projects in Hong Kong’. Construction Management
and Economics, Vol. 22, No. 7, p. 675-689
PwC (2011). ‘Valuing the role of Construction in the New Zealand economy: A report to
the Construction Strategy Group’. Link:
http://www.constructionstrategygroup.org.nz/downloads/PwC%20Report%20-
%20Construction%20Sector%20Analysis%20Final%204%20Oct.pdf
Qureshi, S.; Kazmi, S. J. H. & Breuste, J. H. (2010). ‘Ecological disturbances due to
high cutback in the green infrastructure of Karachi: Analyses of public perception about
associated health problems’. Urban Forestry & Urban Greening Vol. 9, p. 187–198
Rahman, I. A.; Nagapan, S. & Sami, A. (2013). ‘Initial PLS Model of Construction Waste
Factors’. International Conference on Innovation, Management and Technology
Research, Malaysia, 22 – 23 September, 2013
REFERENCES
325
Rajasekar, S.; Philominathan, P. & Chinnathambi, V. (2006). ‘Research Methodology’.
School of Physics, Bharathidasan University, Tiruchirapalli – 620 024, Tamilnadu, India
Rapport F. & Wainwright, P. (2006). Book Section: ‘Phenomenology as a paradigm of
movement’. Book: ‘Qualitative Health Research’, Swansea University, Swansea
Medical School, Swansea, Wales,
Rawlinsons New Zealand Construction Handbook (2013). ‘Quality Commercial and
Industrial Construction’. Rawlinsons Publications, A Division of Rawlinsons Limited,
Level 4, 135 Broadway, Newmarket, Auckland.
Rebeiz, K. S. & Craft, A. P. (1995). ‘Plastic waste management in construction:
technological and institutional issues’. Resources, Conservation and Recycling Vol. 15,
p. 245-257
References
Revell, A. and Blackburn, R. (2007). ‘The Business Case for Sustainability? An
Examination of Small Firms in the UK’s Construction and Restaurant Sectors’. Business
Strategy and the Environment Vol. 16, p. 404–420
Reznick Group (2009). ‘Benefit from “Green” Construction Methods’. Reznick Group
Renewable Energy Practice
Rijsbermana, M. A. & van de Ven, F. H.M. (2000). ‘Different approaches to assessment
of design and management of sustainable urban water systems’. Environmental Impact
Assessment Review Vol. 20, p. 333–345
Rodrigues, A. and Armada, M. J. R. (2007). ‘The valuation of modular projects: A real
options approach to the value of splitting’. Global Finance Journal Vol. 18, p. 205-227
REFERENCES
326
Rose, S. (1998). ‘Valuation of interacting real options in a tollroad infrastructure project’.
The Quarterly Review of Economics and Finance Vol.58, p. 711-725
Rubinstein, L. (2012). ‘Moving towards Zero Waste & Cost Savings – A Roadmap for
Builders & Contractors for Construction & Demolition Projects’. U.S. Environmental
Protection Agency
Samis, M. R., Davis, G. A. and Laughton, D. G. (2007). ‘Using stochastic discounted
cash flow and real option Monte Carlo simulation to analyse the impacts of contingent
taxes on mining projects’. Project Evaluation Conference, Melbourne, Australian
Institute of Mining and Metallurgy
Samis, M., Davis, G. A., Laughton, D. and Poulin, R. (2006). ‘Valuing uncertainty asset
cash flows when there are no options: A real options approach’. Resources Policy Vol.
30, p. 285-298
Šaparauskas, J. & Turskis, Z. (2006). ‘Evaluation of construction sustainability by
multiple criteria methods’. Technological and Economic Development of Economy, Vol.
12, No. 4, p. 321-326
Saunders, J. and Wynn, P. (2004). ‘Attitudes towards waste minimisation amongst
labour only sub-contractors’. Structural Survey Vol. 22, No. 3, p. 148-155
Schilling, J. & Logan, J. (2008). ‘Greening the Rust Belt: A Green Infrastructure Model
for Right Sizing America's Shrinking Cities’. Journal of the American Planning
Association, Vol. 74, No. 4, p. 451-466
Schmitt, T. E. (2014). ‘Survey Questionnaire Methodology and Purpose’. Henry Lester
and Associates Ltd, La Crosse, Wisconsin, USA
REFERENCES
327
Scott, F. (2013). ‘Commercialising Waste: Turning Waste Plasterboard in Christchurch
into a Valuable Resource’. True North Consulting
Seabrooke, W.; Yeung, S. C.W.; Ma, F. M.F. & Li Y. (2004). ‘Implementing sustainable
urban development at the operational level (with special reference to Hong Kong and
Guangzhou)’. Habitat International Vol. 28, p. 443–466
Seadon, J. K. (2010). ‘Sustainable waste management systems’. Journal of Cleaner
Production, Vol. 18, p. 1639-1651
Sealey, B. J.; Phillips, P. S. & Hill G. J. (2001). ‘Waste management issues for the UK
ready-mixed concrete industry’. Resources, Conservation and Recycling 32 p. 321 –
331
Seattle (2013). ‘Resolution Number: 30990’. City of Seattle Legislative Information
Service, Office of the City Clerk, Link: http://clerk.seattle.gov/~scripts/nph-
brs.exe?s1=&s3=30990&s2=&s4=&Sect4=AND&l=20&Sect2=THESON&Sect3=PLUR
ON&Sect5=RESNY&Sect6=HITOFF&d=RESF&p=1&u=%2F~public%2Fresny.htm&r=1
&f=G (accessed 04 March 2013)
Shakantu. M. W. (2005). ‘The sustainability of Building Material and Waste Logistics:
The case of Cape Town’. PhD Thesis, School of the Built and Natural Environment,
Glasgow Caledonian University
Shehata, M. E. & El-Gohary, K. M. (2012). ‘Towards improving construction labor
productivity and projects’ performance’. Alexandria Engineering Journal, Vol. 50, p.
321–33. Link: http://www.sciencedirect.com/science/article/pii/S1110016812000142
REFERENCES
328
Shekdar, A. V. (2009). ‘Sustainable solid waste management: An integrated approach
for Asian countries’. Waste Management Vol. 29, p. 1438-1448
Shen, L. Y.; Tam, V. W. Y.; Tam, C. M. & Drew, D. (2004). ‘Mapping Approach for
Examining Waste Management on Construction Sites’. Journal of Construction
Engineering and Management, pp. 472-481
Shen, Q.; Chen, Q.; Tang, B-s.; Yeung, S.; Hu, Y. & Cheung G. (2009). ‘A system
dynamics model for the sustainable land use planning and development’. Habitat
International Vol. 33, p. 15–25
Skoyles, E. R. and Skoyles, J. (1987). ‘Waste prevention on site’. Mitchell, London.
Smith, A.; McNicol, J. & Finlay, G. ‘Sustainability in the Residential Built Environment
Research Programme 2004-2010’. Landcare Research.
Smith, J. E. and McCardle, K. F. (1996). ‘Valuing Oil Property: integrating option pricing
and decision analysis approaches’. Operations Research Vol. 46, No. 2, p. 198-217
Snow, W. (2001). ‘Zero Waste: The End of the Age of Waste’. Keynote presentation at
the Perth Waste and Recycle Conference 2001, Zero Waste New Zealand Trust
Snyman, J. and Vorster, K. (2010). ‘Towards zero waste: a case study in the City of
Tshwane’. Waste Management & Research, Vol. 29, p. 512-520
Sødal, S., Koekebakker, S. and Aadland, R. (2007). ‘Market switching in shipping —A
real option model applied to the valuation of combination carriers’. Review of Financial
Economics Vol. 17, No. 21, p. 183-203
REFERENCES
329
Sjøholt, Odd. 1998. Fra separate miljøstyring til integrert byggstyring – Prosjektrapport
244 – 1998, Norges byggforskningsinstitutt, Norway – translated using Google
Translate
Soibelman, L. (1993). ‘‘As perdas de materiais na construc¸a˜o de edificac¸o˜es: sua
incideˆncia e seu controle’’ (Material waste in building construction: occurrence and
control). MSc dissertation Federal University of Rio Grande do Sul, Porto Alegre, Brazil
- in Portuguese.
Solís-Guzmán, J.; Marrero, M.; Montes-Delgado, M. V. and Ramírez-de-Arellano, A.
(2009). ‘A Spanish model for quantification and management of construction waste’.
Waste Management Vol. 29, p. 2542–2548
Sowards, D. ‘Lean Construction Practices’. Quality Support Services, Inc.
Spatari, S.; Yu, Z. & Montalto, F. A. (2011). ‘Life cycle implications of urban green
infrastructure’. Environmental Pollution Vol. 159, p. 2174-2179
Spinler, S., Huchzermeier, A. and Kleindorfer, P. R. (2002). ‘An Options Approach to
Enhance Economic Efficiency in a Dyadic Supply Chain’.
Srour, I. M.; Chehab, G. R.; El-Fadel, M. & Tamraz, S. (2013). ‘Pilot-based assessment
of the economics of recycling construction demolition waste’. Waste Management &
Research, Vol. 31, No. 11, p: 1170 –1179
Statistics New Zealand (2015). ‘Enterprises by industry and business type 2000-14’.
Link: http://nzdotstat.stats.govt.nz/wbos/Index.aspx?DataSetCode=TABLECODE7051#
REFERENCES
330
Steffen, A., et al. (2008). ‘Avoiding cost blow-outs and lost time on mining capital
projects through effective project stage gating’. Performance Improvement Group,
Brisbane
Storey, J.; Gjerde, M.; Charleson, A. and Pedersen, M. (2003). ‘The State of
Deconstruction in New Zealand 2003 – Synopsis’. Centre for Building Performance
Research, Victoria University
Symonds Group, Argus, COWI & PRC Bouwcentrum (1999). ‘Construction and
Demolition Waste Management Practices, and Their Economic Impact’. European
Commission
Tam, C. M. & Tam, V. W. Y. (2006). ‘A review on the viable technology for construction
waste recycling’. Resources, Conservation and Recycling Vol. 47, p. 209–221
Tam, C. M.; Tam, V. W. Y. & Tsui, W. S. (2004). ‘Green construction assessment for
environmental management in the construction industry of Hong Kong’. International
Journal of Project Management Vol. 22, p. 563–571
Tam, V. W. Y. & Tam, C.M. (2006). ‘Evaluations of existing waste recycling methods: A
Hong Kong study’. Building and Environment Vol. 41, p. 1649–1660
Tam, V. W. Y. & Tam, C.M. (2008). ‘Waste reduction through incentives: a case study’.
Building Research & Information Vol. 36, No. 1, p. 37-43
Tam, V. W. Y. (2008). ‘On the effectiveness in implementing a waste-management-plan
method in construction’. Waste Management Vol. 28, p. 1072–1080
Tam, V. W. Y. (2010). ‘Rate of Reusable and Recyclable Waste in Construction’.
Second International Conference on Sustainable Construction Materials and
REFERENCES
331
Technologies, June 28-June 30, 2010, Universita Politecnica delle Marche, Ancona,
Italy
Tellis, W. (1997). ‘Introduction to Case Study’. The Qualitative Report, Vol. 3, No. 2.
Link: http://www.nova.edu/ssss/QR/QR3-2/tellis1.html
Teo, M. M. M. & Loosemore, M. (2001). ‘A theory of waste behaviour in the construction
industry’. Construction Management and Economics Vol. 19, No. 7, p. 741-751
Teo, M. M. M.; Loosemore, M.; Marosszeky, M.; Karim K. and Gardner D. (2000).
‘Operatives' attitudes towards waste on construction project’. 16th Annual ARCOM
Conference, 6-8 September 2000, Glasgow Caledonian University. Association of
Researchers in Construction Management, Vol. 2, p. 509-17. Editor:Akintoye, A.
Thomson, D.; Kaka, A.; Pronk, L. & Alalouch, C. (2014). ‘The benefits Quantification
Method: A Practical Approach to Engaging Stakeholders in the Judgement of Benefit
Realisation’. Heriot Watt University
Till, A. (2013). ‘A report on waste in construction and previous research into the
economic feasibility of waste minimisation and zero waste’. Unpublished Master’s
Dissertation. For the Degree of Masters in Engineering Project Management,
Engineering Project Management Programme, School of Engineering, AUT.
Tiwana, A., Wang, J., Keil, M. and Ahluwalia, P. (2007). ‘The bounded rationality bias in
managerial valuation of real options: Theory and evidence from IT projects’. Decision
Sciences Vol. 38, No. 1, p. 157–181
Todorov, V. & Marinova, D. (2011). ‘Modelling sustainability’. Mathematics and
Computers in Simulation Vol. 81, p. 1397–1408
REFERENCES
332
Tommelein, I. D. and Li, A. E. Y. (1999). ‘Just-in-time concrete delivery: locating buffers
in structural steel supply and construction process’. IGLC-7, p. 109-120
Tookey, J. E. (1998). ‘Concurrent engineering in the aerospace industry: a comparative
study of the US and UK aerospace industries’. PhD thesis, University of Bradford, UK,
180- 210
Topal, E. (2008). ‘Evaluation of a mining project using Discounted Cash Flow analysis,
Decision Tree analysis, Monte Carlo simulation and Real Options using and example’.
International Journal of Mining and Mineral Engineering Vol. 1, No. 1
Tran, V. D.; Tookey, J. E. Moore, D. & Seadon, J. (2013). ‘Waste in New Zealand
Construction: Problems, Policy and the Future’. In press
Treloar, G.; Gupta, H.; Love, P. E.D. and Nguyen, B. (2003). ‘An analysis of factors
influencing waste minimisation and use of recycled materials for the construction of
residential buildings’. Management of Environmental Quality: An International Journal
Vol. 14 No. 1, p. 134-145
Trigeorgis, L. (1996). ‘Real Options: Managerial Flexibility and Strategy in Resource
Allocation’. MIT Press
Turner, H. M. & Nye, C. (2007). ‘The Campbell Collaboration: Systematic Reviews and
Implications for Evidence-Based Practice’. Report, National Center for the
Dissemination of Disability Research. Technical Brief No. 16. Link:
http://www.ktdrr.org/ktlibrary/articles_pubs/ncddrwork/focus/focus16/Focus16.pdf
REFERENCES
333
Tzoulas, K.; Korpela, K.; Venn, S.; Yli-Pelkonen, V.; Kazmierczak, A.; Niemela, J. &
James, P. (2007). ‘Promoting ecosystem and human health in urban areas using Green
Infrastructure: A literature review’. Landscape and Urban Planning, Vol. 81, p. 167–178
U.S. Department of the Interior. Bureau of Ocean Energy Management (2011).
‘Economic Analysis Methodology for the 5-Year OCS Oil and Gas Leasing Program for
2012-2017’. BOEM OCS Study 2011-050
Ugwu, O.O.; Kumaraswamy, M.M.; Wong, A. & Ng S.T. (2005). ‘Sustainability appraisal
in infrastructure projects (SUSAIP): Part 2: A case study in bridge design’. Automation
in Construction Vol. 15, p. 229 – 238
UK Government (2015). ‘Construction Infographic’. Link:
https://www.gov.uk/government/uploads/system/uploads/attachment_data/file/229339/c
onstruction-sector-infographic.pdf
UNStats (2015). ‘Environment Glossary - Waste’. Link:
http://unstats.un.org/unsd/environmentgl/gesform.asp?getitem=1178
Valenzuela, D. & Shrivastava, P. (2003). ‘Interview as a Method for Qualitative
Research’.
van der Sloot, H. A.; Comans, R. N. J. & Hjelmar, O. (1996). ‘Similarities in the leaching
behaviour of trace contaminants from waste, stabilized waste, construction materials
and soils’. The Science of the Total Environment, Vol. 178, p. 111-126
Vandermeulen, V.; Verspecht, A.; Vermeire, B.; Van Huylenbroecka, G. & Gellynck, X.
(2011). ‘The use of economic valuation to create public support for green
REFERENCES
334
infrastructure investments in urban areas’. Landscape and Urban Planning Vol.
103, p. 198– 206
Venus, L. Y.H. (2011). ‘Green management practices and firm performance: A case of
container terminal operations’. Resources, Conservation and Recycling Vol. 55, p. 559–
566
Vidalakis, C., Tookey, J. E. and Sommerville, J. (2011). ‘The logistics of construction
supply chains: The builders’ merchant perspective’. Engineering, Construction and
Architectural Management Vol. 18, No. 1, p. 66-81
Voelz, V. A. (2006). ‘Hypothesis Testing’. University of California at San Francisco, San
Francisco, CA 94143
Vrijhoef, R. and Koskela, L. (1999). ‘Roles of supply chain management in
construction’. IGLC-7, p. 133-146
Wahab, A. B. & Lawal, A. F. (2011). ‘An evaluation of waste control measures in
construction industry in Nigeria’. African Journal of Environmental Science and
Technology, Vol. 5, No. 3, p. 246-254
Walls, M. (2004). ‘Combining decision analysis and portfolio management to improve
project selection in the exploration and production firm’. Journal of Petroleum Science &
Engineering Vol. 44, p. 55-65
Wang, J.; Li, S. & Tam, V. W. Y. (2014). ‘Critical factors in effective construction
waste minimization at the design stage: A Shenzhen case study, China’.
Resources, Conservation and Recycling, Vol. 82, p. 1– 7
REFERENCES
335
Wang, J.; Yuan H.; Kang, X. & Lu, W. (2010). ‘Critical success factors for on-site sorting
of construction waste: A china study’. Resources, Conservation and Recycling Vol. 54,
p. 931-936
Wang, Y. (2009). ‘Sustainability in Construction Education’. Journal of Professional
Issues in Engineering Education and Practice Vol. 135, p. 21-30
Wangombe, D. K. (2013). ‘The Philosophy, Ontology, Epistemology And Methodology
Of Research In Corporate Environmental Reporting Behaviour’. The Clute Institute
International Academic Conference, Paris, France
Weathington, B. L., Cunningham, J. L., & Pittenger, D. J. (2010). ‘Research Methods for
the Behavioral and Social Sciences’. John Wiley & Sons, Hoboken, NJ
Weber, R. (2004). ‘Editor's Comments’. MIS Quarterly Vol. 28, No. 1, p. iii-xii
Weber, T.; Sloan, A. & Wolf, J. (2006). ‘Maryland’s Green Infrastructure Assessment:
Development of a comprehensive approach to land conservation’. Landscape and
Urban Planning Vol. 77, p. 94–110
White, N. (2012). ‘2012 Modelling Methodology and Assumptions’. Australian Energy
Market Operator
Whitlock, D. D.; Daigger, G. T. and McCoy, N. (2007). ‘The future of sustainable water
management: using a value chain analysis to achieve a zero waste society’. Water
Environment Federation, WEFTEC®.07
Wibowo, M. A. (2003). ‘The Contribution of the Construction Industry to The Economy
of Indonesia: A Systemic Approach’. Construction Management, Civil Engineering
REFERENCES
336
Department, Diponegoro University, Indonesia. Link:
http://core.ac.uk/download/pdf/11702073.pdf
Willmott Dixon (2010). ‘The Impacts of Construction and the Built Environment’. Briefing
Note 33
Wise (2008). ‘Green Infrastructure Rising: Best practices in stormwater management’.
American Planning Association
Wolf, K. L. 2003 (in press). Ergonomics of the City: Green Infrastructure and Social
Benefits. Engineering Green: Proceedings of the 11th National Urban Forest
Conference. Washington D.C.: American Forests. Editor: Kollin, C.
Wong, E. O.W. and Yip, R. C.P. (2004). ‘Promoting sustainable construction waste
management in Hong Kong’. Construction Management and Economics Vol. 22, No. 6,
p. 563-566
WRAP (2007). ‘Reducing material wastage in construction - Guidance for clients,
contractors and sub contractors on how to deliver good practice in materials
procurement and usage’. Waste & Resources Action Programme (WRAP), The Scottish
Government
WRAP (2009). ‘Procurement requirements for reducing waste to landfill: Model
procurement wording for construction clients and principal contractors to deliver
improved resource efficiency on construction projects’. Waste & Resources Action
Programme (WRAP), The Scottish Government
REFERENCES
337
WRAP (2011). ‘Achieving good practice Waste Minimisation and Management:
Guidance for construction clients, design teams and contractors’. Waste & Resources
Action Programme (WRAP), The Scottish Government
WRAP (2012). ‘Actions to reduce waste in construction projects and minor works’.
Waste & Resources Action Programme (WRAP), The Scottish Government
WRAP (2013). ‘Designing out Waste: A design team guide for buildings’. Waste &
Resources Action Programme (WRAP), The Scottish Government
WRAP (2013). ‘Designing out Waste: A design team guide for civil engineering’. Waste
& Resources Action Programme (WRAP), The Scottish Government
Xie, Y. (2010). ‘A Modified method of Mining Assessment under Uncertainty’. 7th
International Conference on Innovation and Management, Hong Kong, China
Yahya, K and Boussabaine, A. H. (2006). ‘Eco-costing of construction waste’.
Management of Environmental Quality: An International Journal Vol. 17, No. 1, p. 6-19
Yang, M. and Blyth, W. (2007). ‘Modelling investment risks and uncertainties with real
options approach’. International Energy Agency
Ye, G.; Yuan, H.; Shen, L. and Wang, H. (2012). ‘Simulating effects of management
measures on the improvement of the environmental performance of construction waste
management’. Resources, Conservation and Recycling Vol. 62, p. 56–63
Yim, H. L., Lee, S. H., Yoo, S. K. and Kim, J. J. (2011). ‘Zero-cost collar option applied
to materials procurement contracts to reduce price fluctuation risks in construction’.
World Academy of Science, Engineering and Technology Vol. 60, p. 41-46
Yin, R. K. (2004). ‘Case Study Research: Design and Methods’. Sage Publishing
REFERENCES
338
Yin, R. K. (2011). ‘Case Study Research: Design and Methods’. Sage Publishing
Yip, R. C.P. & Poon, C.S. (2009). ‘Cultural shift towards sustainability in the
construction industry of Hong Kong’. Journal of Environmental Management Vol. 90, p.
3616–3628
Yu, A. T. W.; Poon, C. S.; Wong, A.; Yip, R. and Jaillon, L. (2013). ‘Impact of
Construction Waste Disposal Charging Scheme on work practices at construction sites
in Hong Kong’. Waste Management Vol. 33, p. 138–146
Yuan, H. & Shen, L. (2011). ‘Trend of the research on construction and demolition
waste management’. Waste Management Vol. 31, p. 670–679
Yuan, H. (2012). ‘Key indicators for assessing the effectiveness of waste management
in construction projects’.
Yuan, H. (2013). ‘A model for evaluating the social performance of construction waste
management’. Waste Management Vol. 32, p. 1218-1228
Yuan, H. (2013). ‘A SWOT analysis of successful construction waste management’.
Journal of Cleaner Production Vol. 39, p. 1-8
Yuan, H.; Chini, A. R.; Lu, Y. & Shen, L. (2012). ‘A dynamic model for assessing the
effects of management strategies on the reduction of construction and demolition
waste’. Waste Management Vol. 32, p. 521–531
Yuan, H.; Shen, L. Y..; Hao, J. J. L. and Lu, W. S. (2011). ‘A model for cost–benefit
analysis of construction and demolition waste management throughout the waste
chain’. Resources, Conservation and Recycling Vol. 55, p. 604–612
REFERENCES
339
Zainal, Z. (2007). ‘Case study as a research method’. Jurnal Kemanusiaan bil.9, Jun
2007
Zaman, A. U. and Lehmann, S. (2011). ‘Challenges and Opportunities in Transforming
a City into a “Zero Waste City”’. Challenges 2011, Vol. 2, p. 73-93
Zaman, A. U. and Lehmann, S. (2011). ‘Urban growth and waste management
optimization towards zero waste city’. City, Culture and Society Vol. 2, p. 177–187
Zero Waste Alliance (2013). ‘Creating a prosperous and inclusive future without waste’.
Link: http://www.zerowaste.org/
Zhao, W.; Ren, H. and Rotter, V. S. (2011). ‘A system dynamics model for evaluating
the alternative of type in construction and demolition waste recycling center – The case
of Chongqing, China’. Resources, Conservation and Recycling Vol. 55, p. 933–944
Zimina, D. & Pasquire, C. (2012). ‘Last Planner System Insights’. Centre for Lean
Projects, School of Architecture, Design and the Built Environment, Nottingham Trent
University
Zotos, G.; Karagiannidis, A.; Zampetoglou, S.; Malamakis, A.; Antonopoulos, I.-S.;
Kontogianni, S. and Tchobanoglous, G. (2009). ‘Developing a holistic strategy for
integrated waste management within municipal planning: Challenges, policies, solutions
and perspectives for Hellenic municipalities in the zero-waste, low-cost direction’.
Waste Management, Vol. 29, p. 1686–1692

APPENDIX
340
APPENDICES
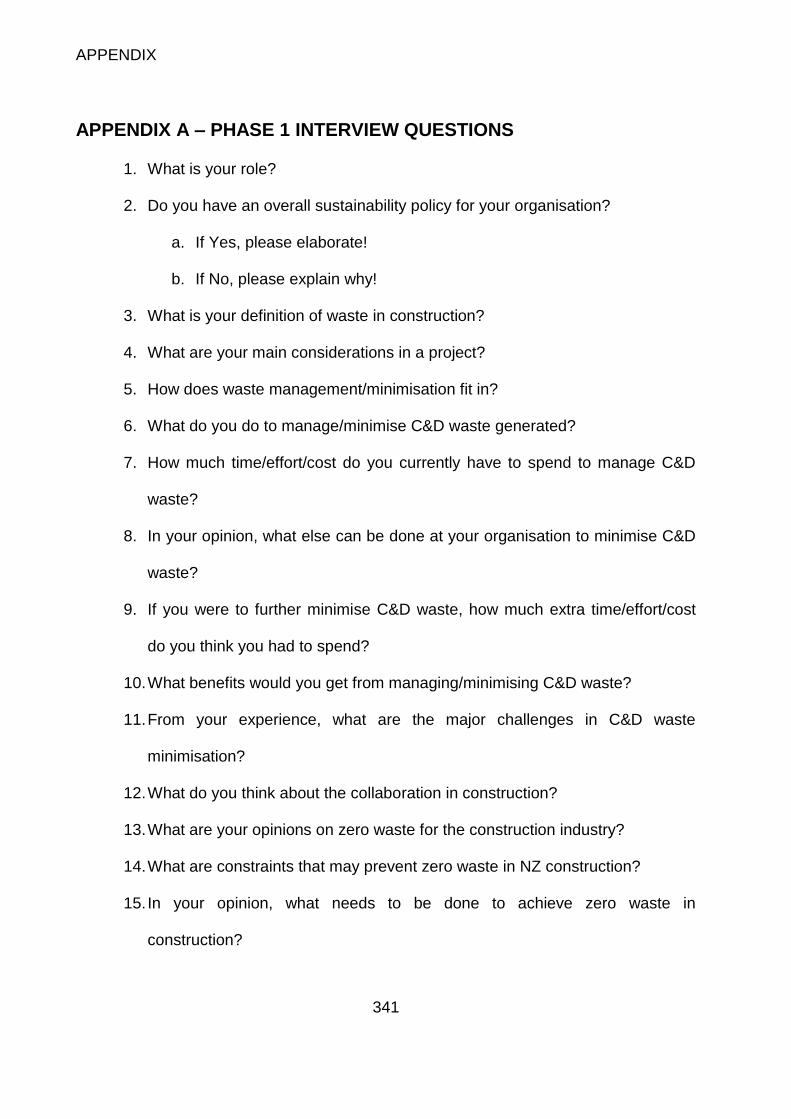
APPENDIX
341
APPENDIX A – PHASE 1 INTERVIEW QUESTIONS
1. What is your role?
2. Do you have an overall sustainability policy for your organisation?
a. If Yes, please elaborate!
b. If No, please explain why!
3. What is your definition of waste in construction?
4. What are your main considerations in a project?
5. How does waste management/minimisation fit in?
6. What do you do to manage/minimise C&D waste generated?
7. How much time/effort/cost do you currently have to spend to manage C&D
waste?
8. In your opinion, what else can be done at your organisation to minimise C&D
waste?
9. If you were to further minimise C&D waste, how much extra time/effort/cost
do you think you had to spend?
10. What benefits would you get from managing/minimising C&D waste?
11. From your experience, what are the major challenges in C&D waste
minimisation?
12. What do you think about the collaboration in construction?
13. What are your opinions on zero waste for the construction industry?
14. What are constraints that may prevent zero waste in NZ construction?
15. In your opinion, what needs to be done to achieve zero waste in
construction?
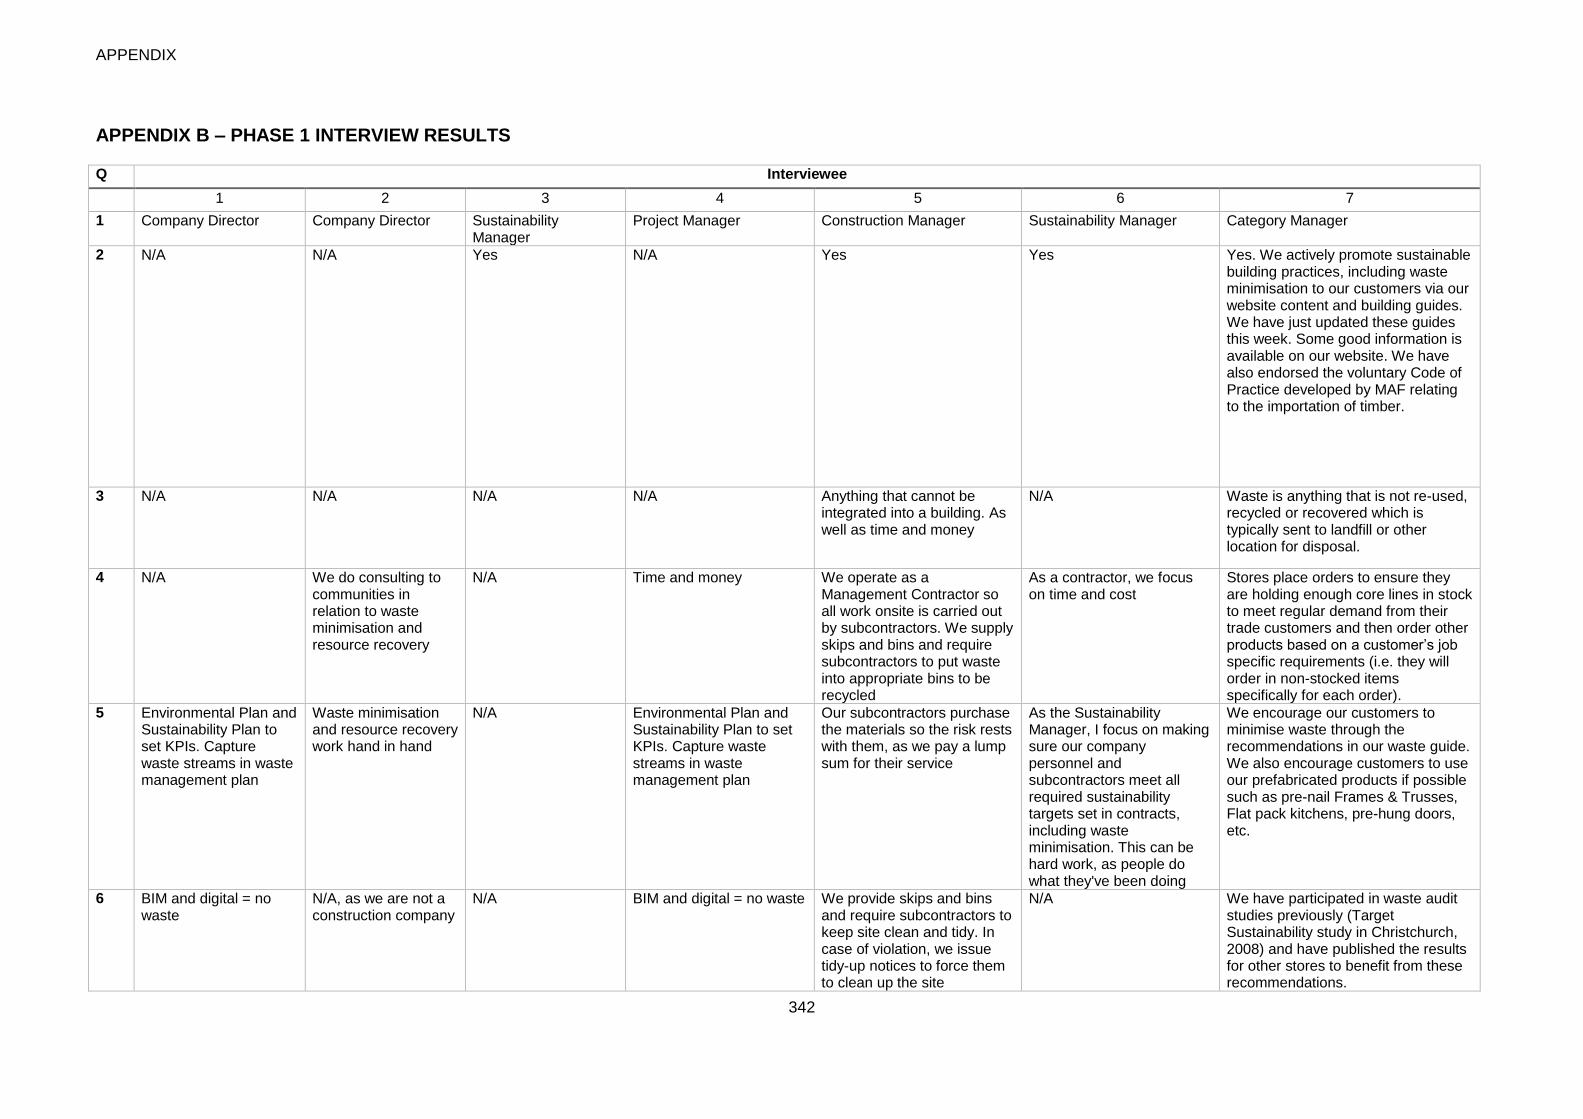
APPENDIX
342
APPENDIX B – PHASE 1 INTERVIEW RESULTS
Q Interviewee
1 2 3 4 5 6 7
1 Company Director Company Director Sustainability Manager
Project Manager Construction Manager Sustainability Manager Category Manager
2 N/A N/A Yes N/A Yes Yes Yes. We actively promote sustainable building practices, including waste minimisation to our customers via our website content and building guides. We have just updated these guides this week. Some good information is available on our website. We have also endorsed the voluntary Code of Practice developed by MAF relating to the importation of timber.
3 N/A N/A N/A N/A Anything that cannot be integrated into a building. As well as time and money
N/A Waste is anything that is not re-used, recycled or recovered which is typically sent to landfill or other location for disposal.
4 N/A We do consulting to communities in relation to waste minimisation and resource recovery
N/A Time and money We operate as a Management Contractor so all work onsite is carried out by subcontractors. We supply skips and bins and require subcontractors to put waste into appropriate bins to be recycled
As a contractor, we focus on time and cost
Stores place orders to ensure they are holding enough core lines in stock to meet regular demand from their trade customers and then order other products based on a customer’s job specific requirements (i.e. they will order in non-stocked items specifically for each order).
5 Environmental Plan and Sustainability Plan to set KPIs. Capture waste streams in waste management plan
Waste minimisation and resource recovery work hand in hand
N/A Environmental Plan and Sustainability Plan to set KPIs. Capture waste streams in waste management plan
Our subcontractors purchase the materials so the risk rests with them, as we pay a lump sum for their service
As the Sustainability Manager, I focus on making sure our company personnel and subcontractors meet all required sustainability targets set in contracts, including waste minimisation. This can be hard work, as people do what they've been doing
We encourage our customers to minimise waste through the recommendations in our waste guide. We also encourage customers to use our prefabricated products if possible such as pre-nail Frames & Trusses, Flat pack kitchens, pre-hung doors, etc.
6 BIM and digital = no waste
N/A, as we are not a construction company
N/A BIM and digital = no waste We provide skips and bins and require subcontractors to keep site clean and tidy. In case of violation, we issue tidy-up notices to force them to clean up the site
N/A We have participated in waste audit studies previously (Target Sustainability study in Christchurch, 2008) and have published the results for other stores to benefit from these recommendations.
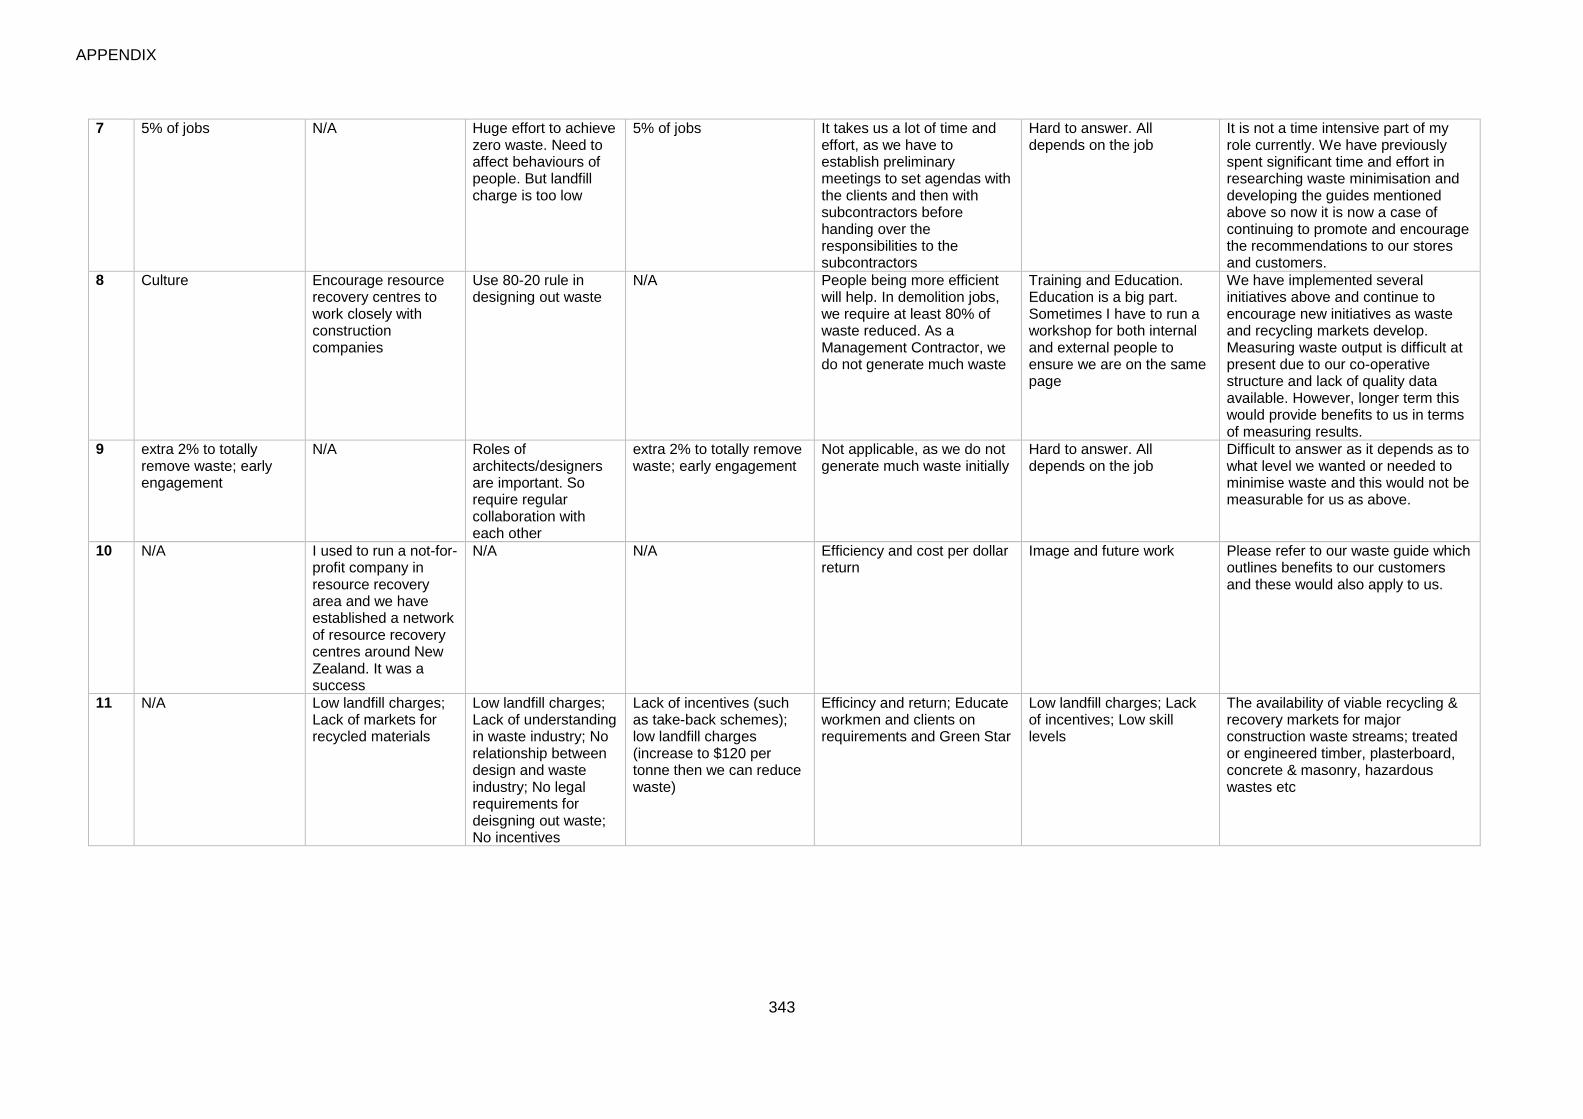
APPENDIX
343
7 5% of jobs N/A Huge effort to achieve zero waste. Need to affect behaviours of people. But landfill charge is too low
5% of jobs It takes us a lot of time and effort, as we have to establish preliminary meetings to set agendas with the clients and then with subcontractors before handing over the responsibilities to the subcontractors
Hard to answer. All depends on the job
It is not a time intensive part of my role currently. We have previously spent significant time and effort in researching waste minimisation and developing the guides mentioned above so now it is now a case of continuing to promote and encourage the recommendations to our stores and customers.
8 Culture Encourage resource recovery centres to work closely with construction companies
Use 80-20 rule in designing out waste
N/A People being more efficient will help. In demolition jobs, we require at least 80% of waste reduced. As a Management Contractor, we do not generate much waste
Training and Education. Education is a big part. Sometimes I have to run a workshop for both internal and external people to ensure we are on the same page
We have implemented several initiatives above and continue to encourage new initiatives as waste and recycling markets develop. Measuring waste output is difficult at present due to our co-operative structure and lack of quality data available. However, longer term this would provide benefits to us in terms of measuring results.
9 extra 2% to totally remove waste; early engagement
N/A Roles of architects/designers are important. So require regular collaboration with each other
extra 2% to totally remove waste; early engagement
Not applicable, as we do not generate much waste initially
Hard to answer. All depends on the job
Difficult to answer as it depends as to what level we wanted or needed to minimise waste and this would not be measurable for us as above.
10 N/A I used to run a not-for-profit company in resource recovery area and we have established a network of resource recovery centres around New Zealand. It was a success
N/A N/A Efficiency and cost per dollar return
Image and future work Please refer to our waste guide which outlines benefits to our customers and these would also apply to us.
11 N/A Low landfill charges; Lack of markets for recycled materials
Low landfill charges; Lack of understanding in waste industry; No relationship between design and waste industry; No legal requirements for deisgning out waste; No incentives
Lack of incentives (such as take-back schemes); low landfill charges (increase to $120 per tonne then we can reduce waste)
Efficincy and return; Educate workmen and clients on requirements and Green Star
Low landfill charges; Lack of incentives; Low skill levels
The availability of viable recycling & recovery markets for major construction waste streams; treated or engineered timber, plasterboard, concrete & masonry, hazardous wastes etc
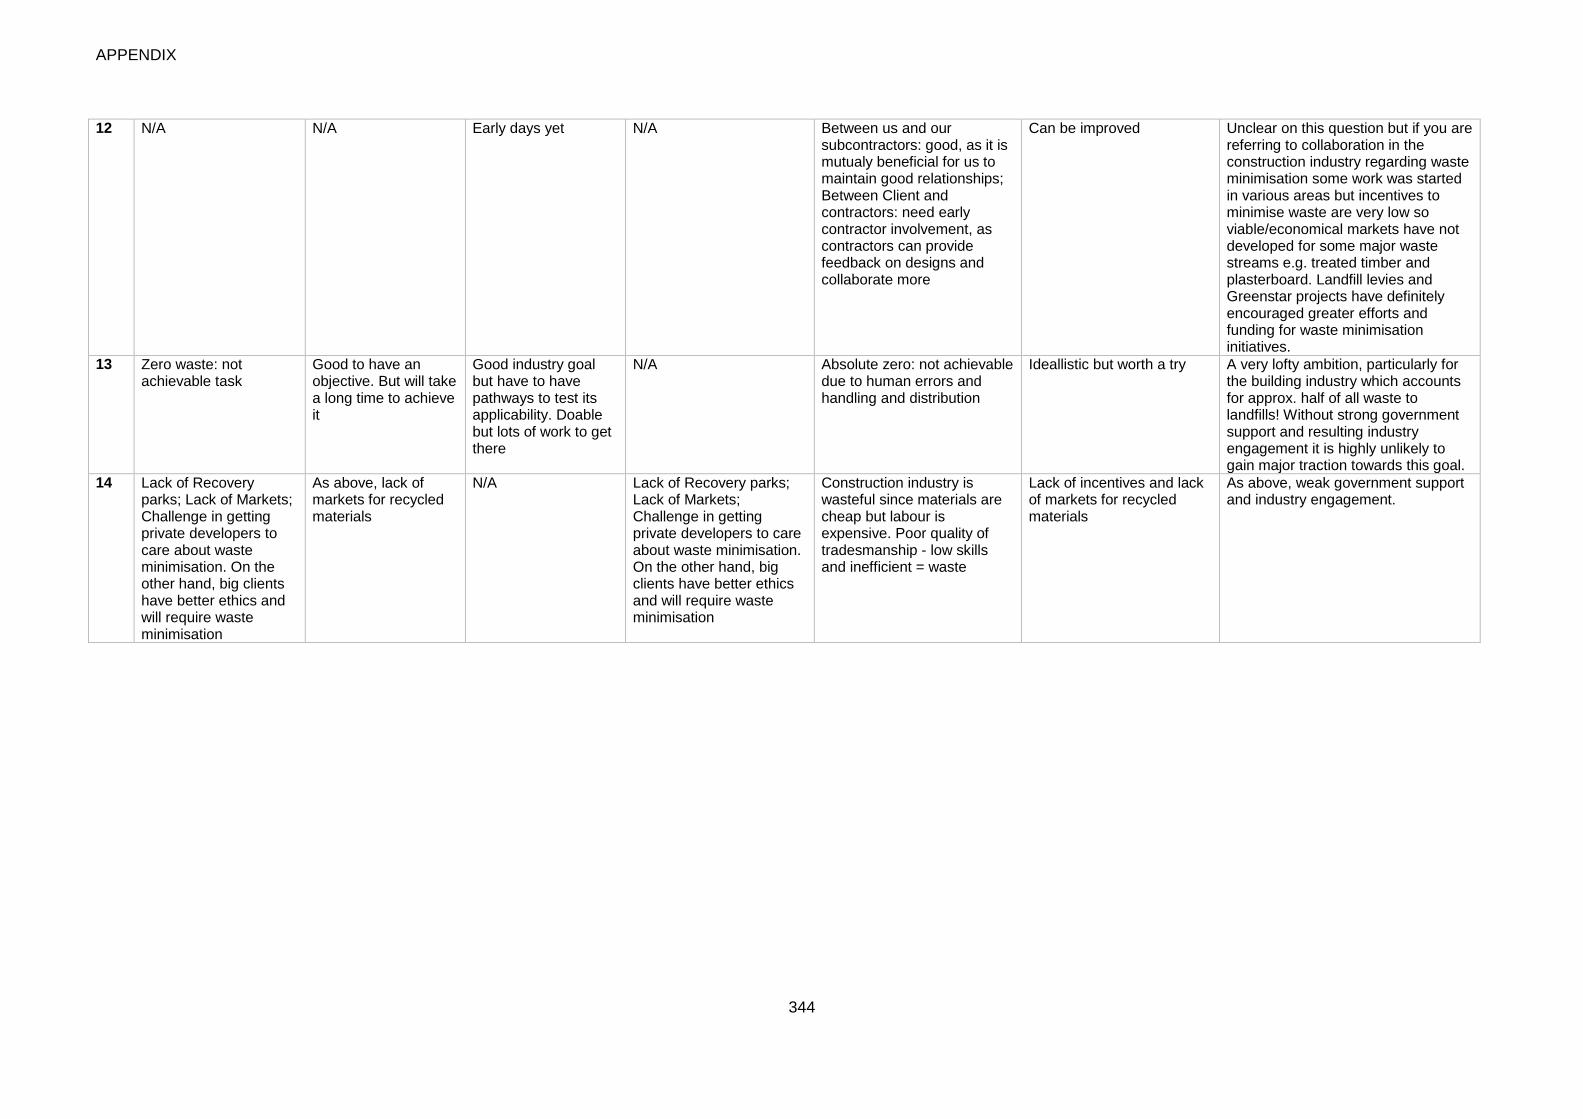
APPENDIX
344
12 N/A N/A Early days yet N/A Between us and our subcontractors: good, as it is mutualy beneficial for us to maintain good relationships; Between Client and contractors: need early contractor involvement, as contractors can provide feedback on designs and collaborate more
Can be improved Unclear on this question but if you are referring to collaboration in the construction industry regarding waste minimisation some work was started in various areas but incentives to minimise waste are very low so viable/economical markets have not developed for some major waste streams e.g. treated timber and plasterboard. Landfill levies and Greenstar projects have definitely encouraged greater efforts and funding for waste minimisation initiatives.
13 Zero waste: not achievable task
Good to have an objective. But will take a long time to achieve it
Good industry goal but have to have pathways to test its applicability. Doable but lots of work to get there
N/A Absolute zero: not achievable due to human errors and handling and distribution
Ideallistic but worth a try A very lofty ambition, particularly for the building industry which accounts for approx. half of all waste to landfills! Without strong government support and resulting industry engagement it is highly unlikely to gain major traction towards this goal.
14 Lack of Recovery parks; Lack of Markets; Challenge in getting private developers to care about waste minimisation. On the other hand, big clients have better ethics and will require waste minimisation
As above, lack of markets for recycled materials
N/A Lack of Recovery parks; Lack of Markets; Challenge in getting private developers to care about waste minimisation. On the other hand, big clients have better ethics and will require waste minimisation
Construction industry is wasteful since materials are cheap but labour is expensive. Poor quality of tradesmanship - low skills and inefficient = waste
Lack of incentives and lack of markets for recycled materials
As above, weak government support and industry engagement.
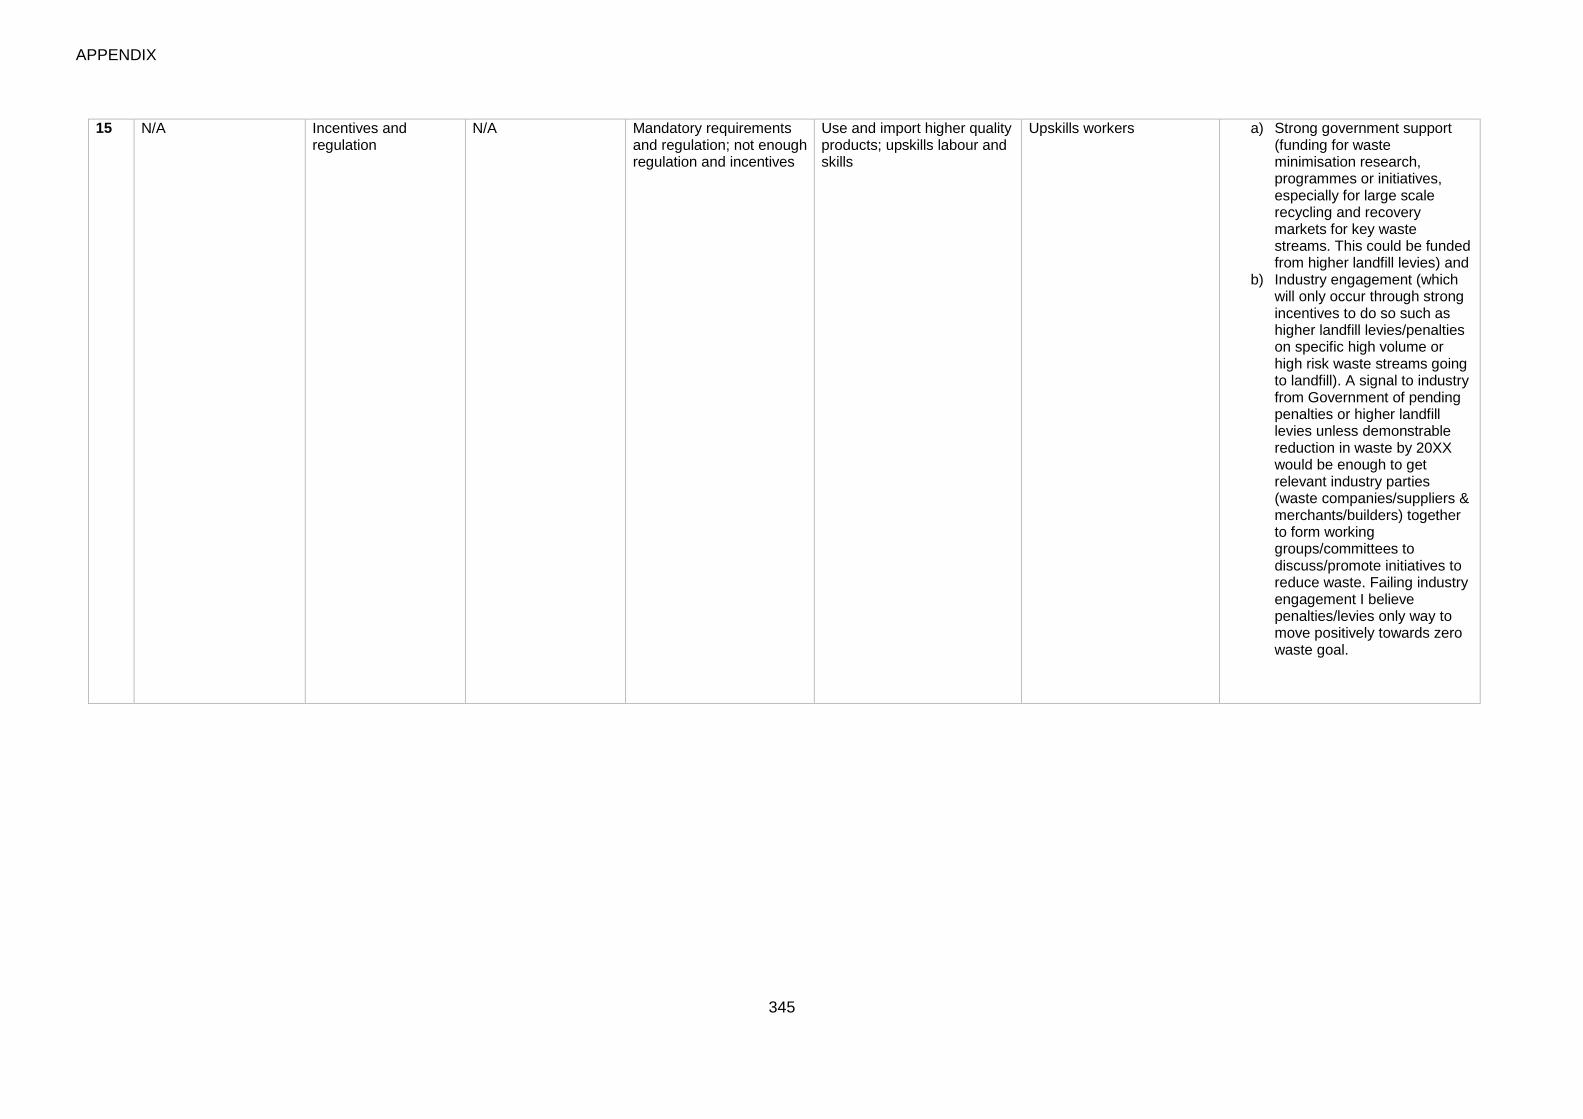
APPENDIX
345
15 N/A Incentives and regulation
N/A Mandatory requirements and regulation; not enough regulation and incentives
Use and import higher quality products; upskills labour and skills
Upskills workers a) Strong government support (funding for waste minimisation research, programmes or initiatives, especially for large scale recycling and recovery markets for key waste streams. This could be funded from higher landfill levies) and
b) Industry engagement (which will only occur through strong incentives to do so such as higher landfill levies/penalties on specific high volume or high risk waste streams going to landfill). A signal to industry from Government of pending penalties or higher landfill levies unless demonstrable reduction in waste by 20XX would be enough to get relevant industry parties (waste companies/suppliers & merchants/builders) together to form working groups/committees to discuss/promote initiatives to reduce waste. Failing industry engagement I believe penalties/levies only way to move positively towards zero waste goal.
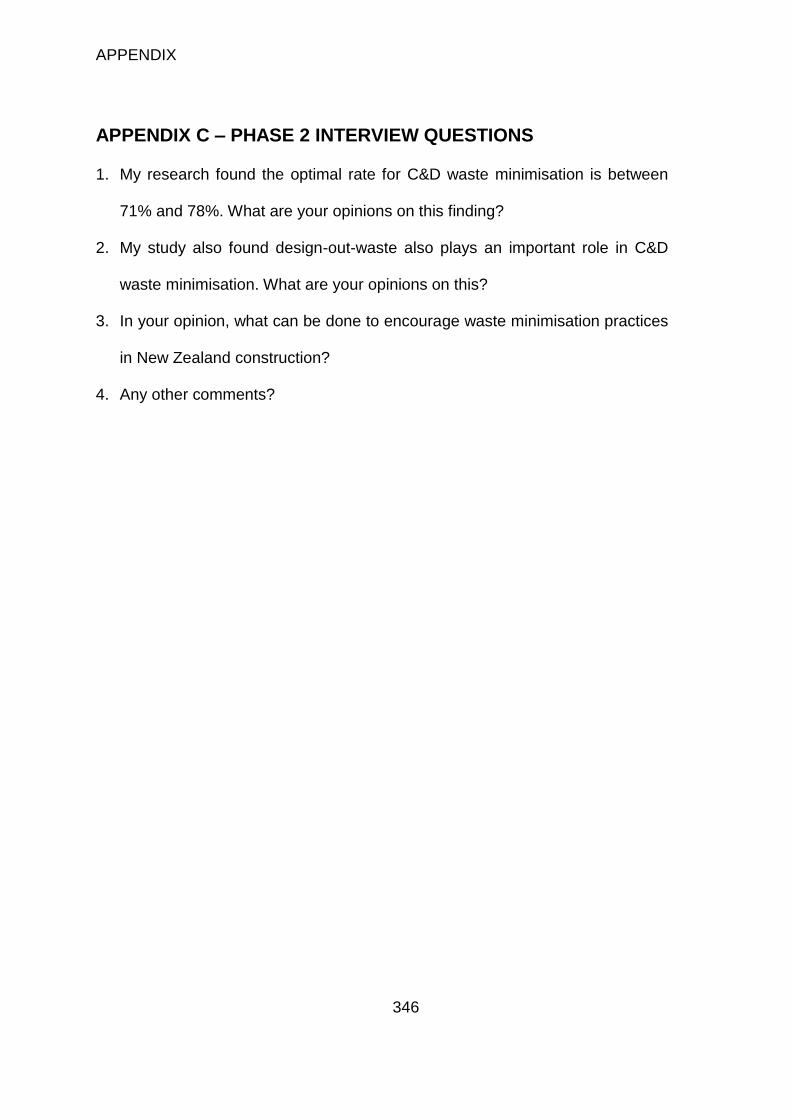
APPENDIX
346
APPENDIX C – PHASE 2 INTERVIEW QUESTIONS
1. My research found the optimal rate for C&D waste minimisation is between
71% and 78%. What are your opinions on this finding?
2. My study also found design-out-waste also plays an important role in C&D
waste minimisation. What are your opinions on this?
3. In your opinion, what can be done to encourage waste minimisation practices
in New Zealand construction?
4. Any other comments?
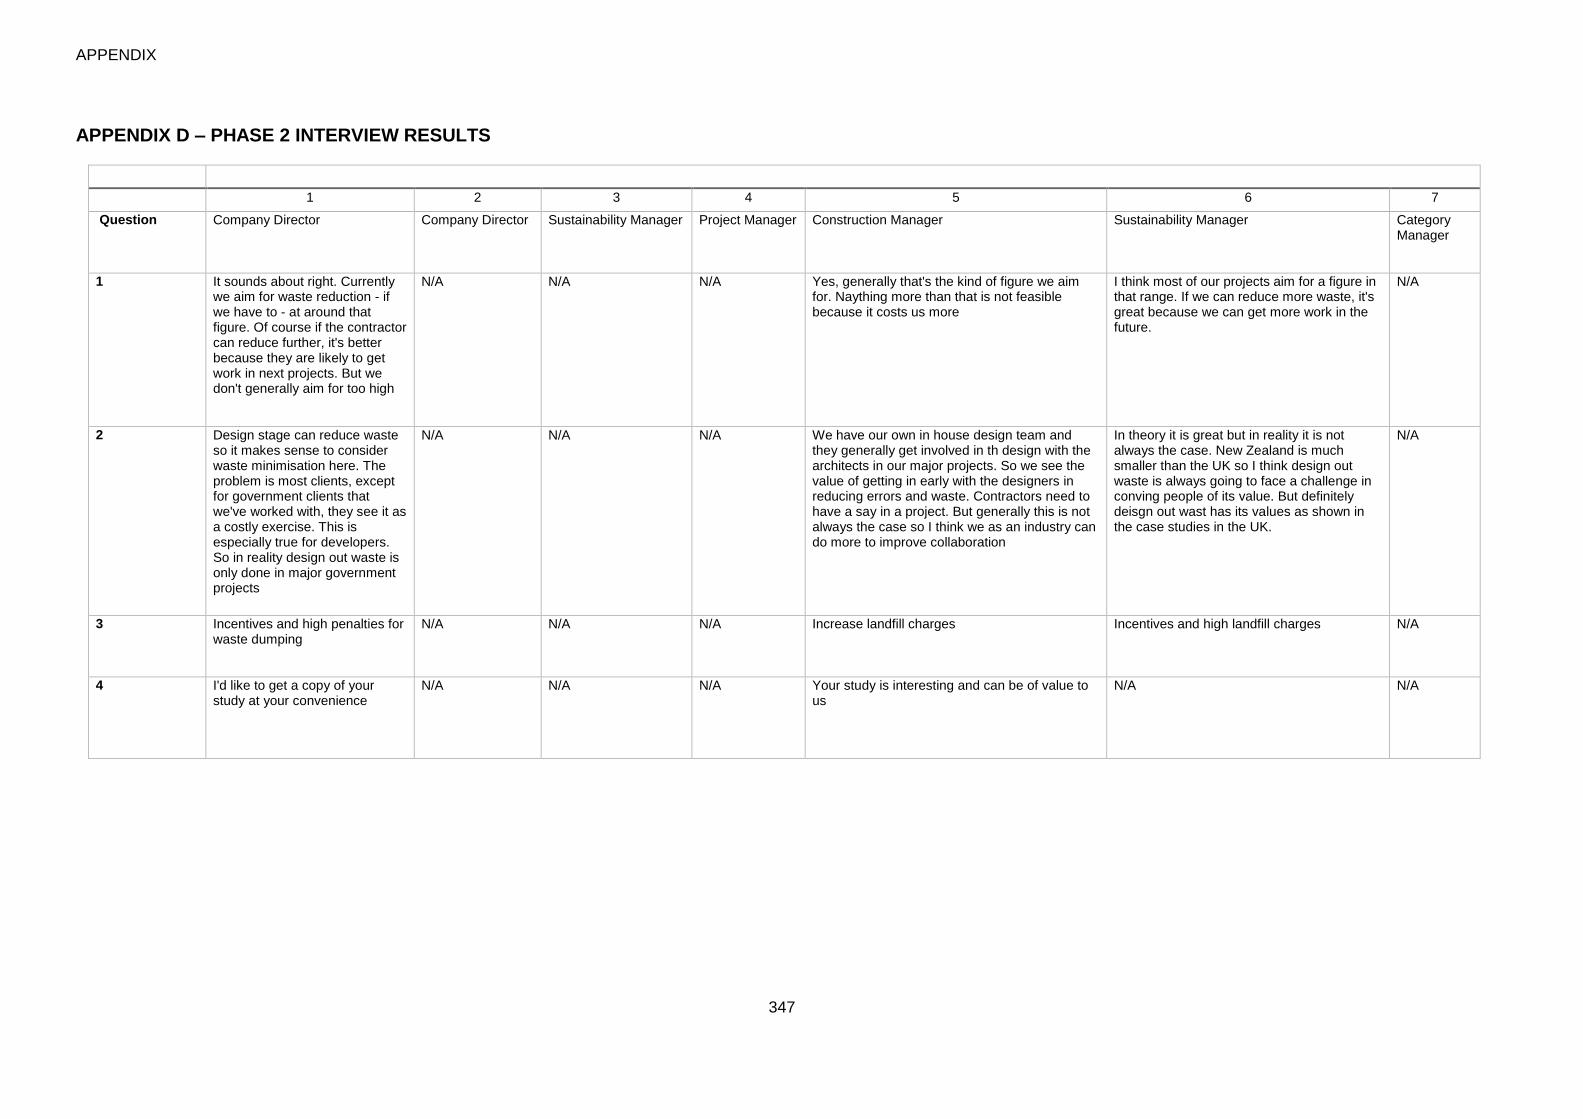
APPENDIX
347
APPENDIX D – PHASE 2 INTERVIEW RESULTS
Q Interviewee
1 2 3 4 5 6 7
Question Company Director Company Director Sustainability Manager Project Manager Construction Manager Sustainability Manager Category Manager
1 It sounds about right. Currently we aim for waste reduction - if we have to - at around that figure. Of course if the contractor can reduce further, it's better because they are likely to get work in next projects. But we don't generally aim for too high
N/A N/A N/A Yes, generally that's the kind of figure we aim for. Naything more than that is not feasible because it costs us more
I think most of our projects aim for a figure in that range. If we can reduce more waste, it's great because we can get more work in the future.
N/A
2 Design stage can reduce waste so it makes sense to consider waste minimisation here. The problem is most clients, except for government clients that we've worked with, they see it as a costly exercise. This is especially true for developers. So in reality design out waste is only done in major government projects
N/A N/A N/A We have our own in house design team and they generally get involved in th design with the architects in our major projects. So we see the value of getting in early with the designers in reducing errors and waste. Contractors need to have a say in a project. But generally this is not always the case so I think we as an industry can do more to improve collaboration
In theory it is great but in reality it is not always the case. New Zealand is much smaller than the UK so I think design out waste is always going to face a challenge in conving people of its value. But definitely deisgn out wast has its values as shown in the case studies in the UK.
N/A
3 Incentives and high penalties for waste dumping
N/A N/A N/A Increase landfill charges Incentives and high landfill charges N/A
4 I'd like to get a copy of your study at your convenience
N/A N/A N/A Your study is interesting and can be of value to us
N/A N/A
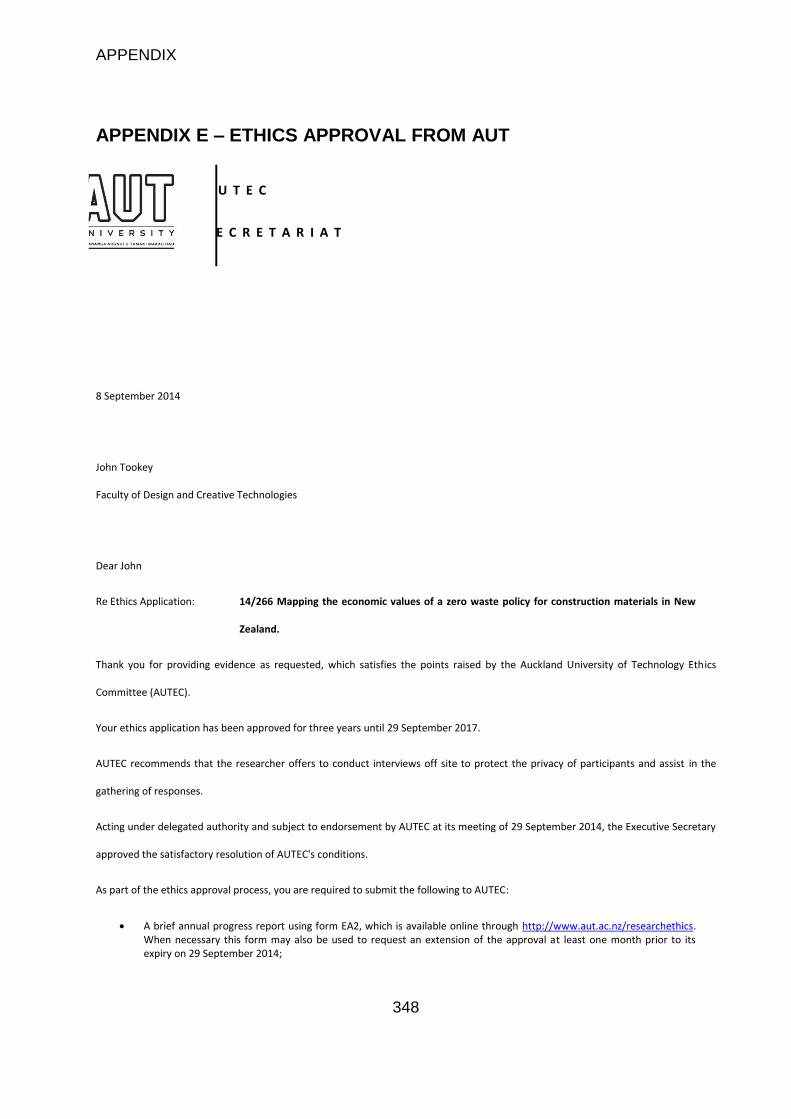
APPENDIX
348
APPENDIX E – ETHICS APPROVAL FROM AUT
A U T E C
S E C R E T A R I A T
8 September 2014
John Tookey
Faculty of Design and Creative Technologies
Dear John
Re Ethics Application: 14/266 Mapping the economic values of a zero waste policy for construction materials in New
Zealand.
Thank you for providing evidence as requested, which satisfies the points raised by the Auckland University of Technology Ethics
Committee (AUTEC).
Your ethics application has been approved for three years until 29 September 2017.
AUTEC recommends that the researcher offers to conduct interviews off site to protect the privacy of participants and assist in the
gathering of responses.
Acting under delegated authority and subject to endorsement by AUTEC at its meeting of 29 September 2014, the Executive Secretary
approved the satisfactory resolution of AUTEC's conditions.
As part of the ethics approval process, you are required to submit the following to AUTEC:
• A brief annual progress report using form EA2, which is available online through http://www.aut.ac.nz/researchethics. When necessary this form may also be used to request an extension of the approval at least one month prior to its expiry on 29 September 2014;
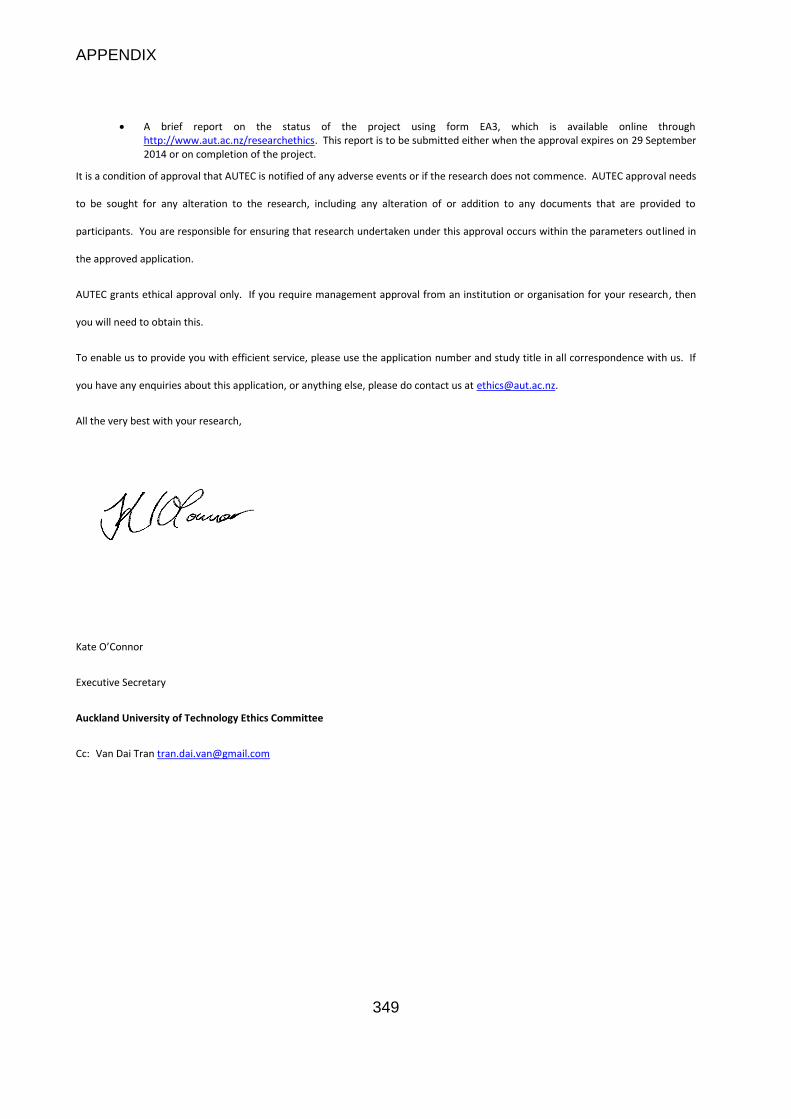
APPENDIX
349
• A brief report on the status of the project using form EA3, which is available online through http://www.aut.ac.nz/researchethics. This report is to be submitted either when the approval expires on 29 September 2014 or on completion of the project.
It is a condition of approval that AUTEC is notified of any adverse events or if the research does not commence. AUTEC approval needs
to be sought for any alteration to the research, including any alteration of or addition to any documents that are provided to
participants. You are responsible for ensuring that research undertaken under this approval occurs within the parameters outlined in
the approved application.
AUTEC grants ethical approval only. If you require management approval from an institution or organisation for your research, then
you will need to obtain this.
To enable us to provide you with efficient service, please use the application number and study title in all correspondence with us. If
you have any enquiries about this application, or anything else, please do contact us at [email protected].
All the very best with your research,
Kate O’Connor
Executive Secretary
Auckland University of Technology Ethics Committee
Cc: Van Dai Tran [email protected]
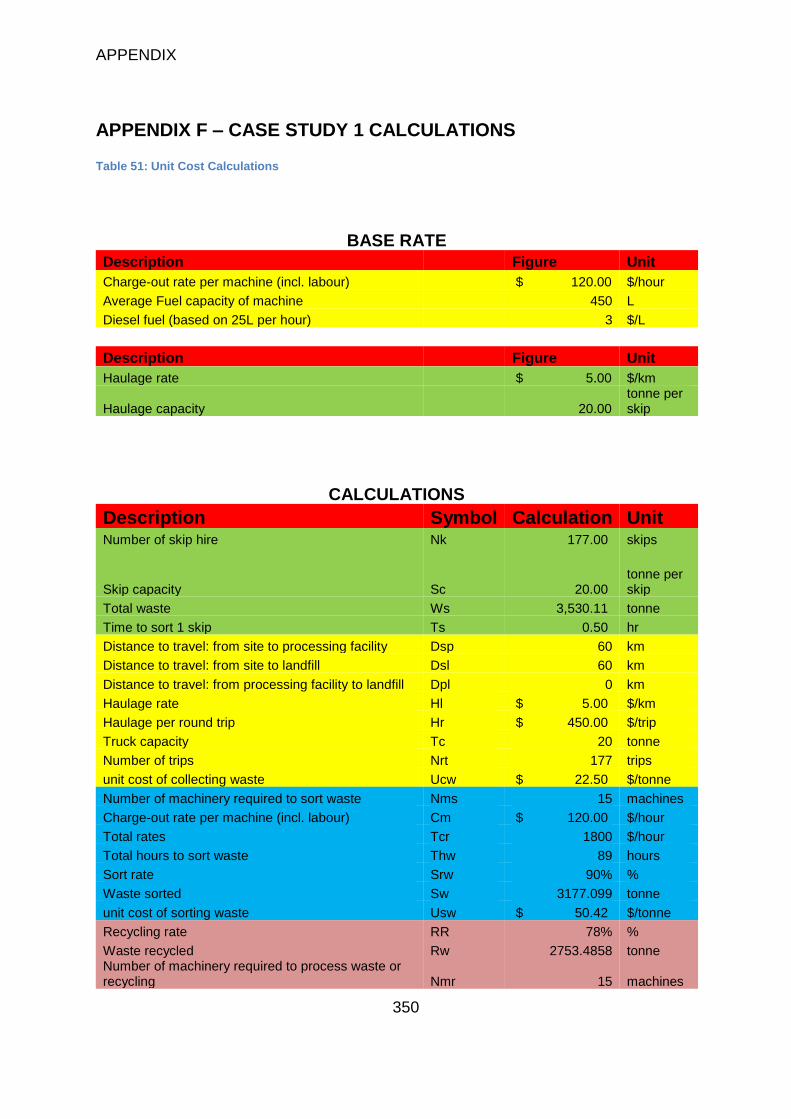
APPENDIX
350
APPENDIX F – CASE STUDY 1 CALCULATIONS
Table 51: Unit Cost Calculations
BASE RATE
Description Figure Unit
Charge-out rate per machine (incl. labour) $ 120.00 $/hour
Average Fuel capacity of machine 450 L
Diesel fuel (based on 25L per hour) 3 $/L
Description Figure Unit
Haulage rate $ 5.00 $/km
Haulage capacity 20.00 tonne per skip
CALCULATIONS
Description Symbol Calculation Unit Number of skip hire Nk 177.00 skips
Skip capacity Sc 20.00 tonne per skip
Total waste Ws 3,530.11 tonne
Time to sort 1 skip Ts 0.50 hr
Distance to travel: from site to processing facility Dsp 60 km
Distance to travel: from site to landfill Dsl 60 km
Distance to travel: from processing facility to landfill Dpl 0 km
Haulage rate Hl $ 5.00 $/km
Haulage per round trip Hr $ 450.00 $/trip
Truck capacity Tc 20 tonne
Number of trips Nrt 177 trips
unit cost of collecting waste Ucw $ 22.50 $/tonne
Number of machinery required to sort waste Nms 15 machines
Charge-out rate per machine (incl. labour) Cm $ 120.00 $/hour
Total rates Tcr 1800 $/hour
Total hours to sort waste Thw 89 hours
Sort rate Srw 90% %
Waste sorted Sw 3177.099 tonne
unit cost of sorting waste Usw $ 50.42 $/tonne
Recycling rate RR 78% %
Waste recycled Rw 2753.4858 tonne Number of machinery required to process waste or recycling Nmr 15 machines
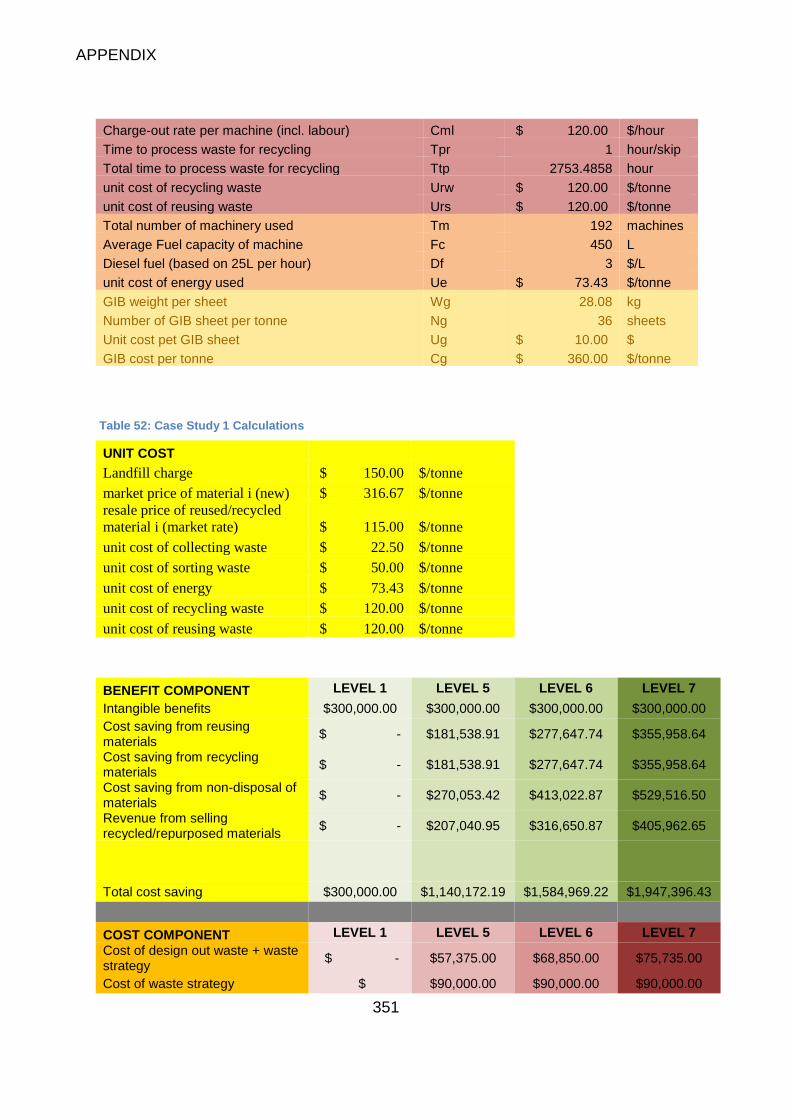
APPENDIX
351
Charge-out rate per machine (incl. labour) Cml $ 120.00 $/hour
Time to process waste for recycling Tpr 1 hour/skip
Total time to process waste for recycling Ttp 2753.4858 hour
unit cost of recycling waste Urw $ 120.00 $/tonne
unit cost of reusing waste Urs $ 120.00 $/tonne
Total number of machinery used Tm 192 machines
Average Fuel capacity of machine Fc 450 L
Diesel fuel (based on 25L per hour) Df 3 $/L
unit cost of energy used Ue $ 73.43 $/tonne
GIB weight per sheet Wg 28.08 kg
Number of GIB sheet per tonne Ng 36 sheets
Unit cost pet GIB sheet Ug $ 10.00 $
GIB cost per tonne Cg $ 360.00 $/tonne
Table 52: Case Study 1 Calculations
UNIT COST Landfill charge $ 150.00 $/tonne market price of material i (new) $ 316.67 $/tonne
resale price of reused/recycled
material i (market rate) $ 115.00 $/tonne
unit cost of collecting waste $ 22.50 $/tonne unit cost of sorting waste $ 50.00 $/tonne
unit cost of energy $ 73.43 $/tonne unit cost of recycling waste $ 120.00 $/tonne
unit cost of reusing waste $ 120.00 $/tonne
BENEFIT COMPONENT LEVEL 1 LEVEL 5 LEVEL 6 LEVEL 7
Intangible benefits $300,000.00 $300,000.00 $300,000.00 $300,000.00
Cost saving from reusing materials
$ - $181,538.91 $277,647.74 $355,958.64
Cost saving from recycling materials
$ - $181,538.91 $277,647.74 $355,958.64
Cost saving from non-disposal of materials
$ - $270,053.42 $413,022.87 $529,516.50
Revenue from selling recycled/repurposed materials
$ - $207,040.95 $316,650.87 $405,962.65
Total cost saving $300,000.00 $1,140,172.19 $1,584,969.22 $1,947,396.43
COST COMPONENT LEVEL 1 LEVEL 5 LEVEL 6 LEVEL 7
Cost of design out waste + waste strategy
$ - $57,375.00 $68,850.00 $75,735.00
Cost of waste strategy $ $90,000.00 $90,000.00 $90,000.00
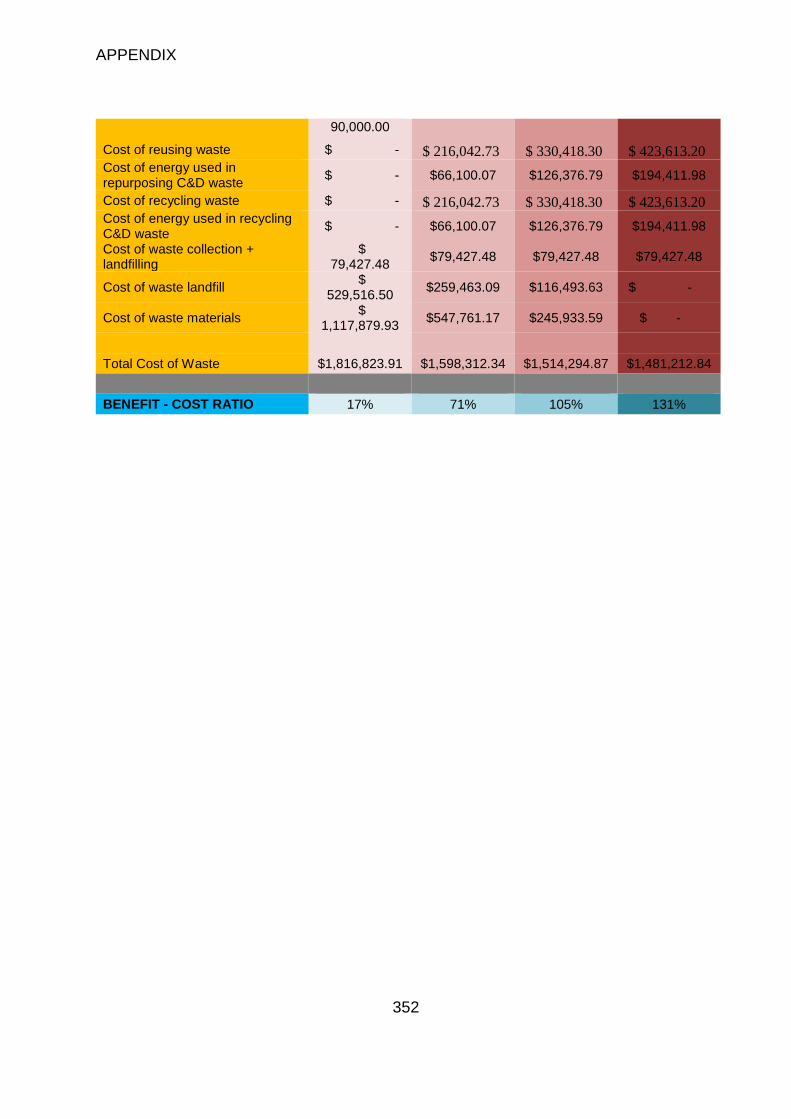
APPENDIX
352
90,000.00
Cost of reusing waste $ - $ 216,042.73 $ 330,418.30 $ 423,613.20 Cost of energy used in repurposing C&D waste
$ - $66,100.07 $126,376.79 $194,411.98
Cost of recycling waste $ - $ 216,042.73 $ 330,418.30 $ 423,613.20 Cost of energy used in recycling C&D waste
$ - $66,100.07 $126,376.79 $194,411.98
Cost of waste collection + landfilling
$ 79,427.48
$79,427.48 $79,427.48 $79,427.48
Cost of waste landfill $
529,516.50 $259,463.09 $116,493.63 $ -
Cost of waste materials $
1,117,879.93 $547,761.17 $245,933.59 $ -
Total Cost of Waste $1,816,823.91 $1,598,312.34 $1,514,294.87 $1,481,212.84
BENEFIT - COST RATIO 17% 71% 105% 131%
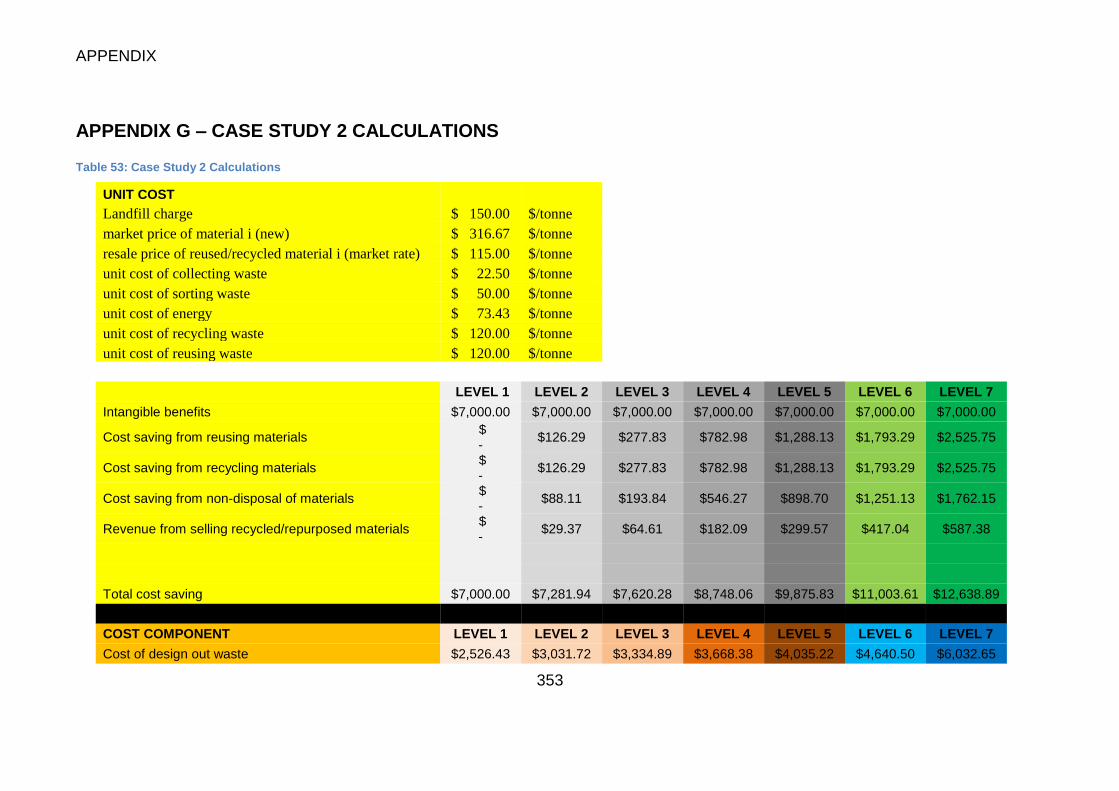
APPENDIX
353
APPENDIX G – CASE STUDY 2 CALCULATIONS
Table 53: Case Study 2 Calculations
UNIT COST Landfill charge $ 150.00 $/tonne market price of material i (new) $ 316.67 $/tonne resale price of reused/recycled material i (market rate) $ 115.00 $/tonne unit cost of collecting waste $ 22.50 $/tonne unit cost of sorting waste $ 50.00 $/tonne unit cost of energy $ 73.43 $/tonne unit cost of recycling waste $ 120.00 $/tonne unit cost of reusing waste $ 120.00 $/tonne
LEVEL 1 LEVEL 2 LEVEL 3 LEVEL 4 LEVEL 5 LEVEL 6 LEVEL 7
Intangible benefits $7,000.00 $7,000.00 $7,000.00 $7,000.00 $7,000.00 $7,000.00 $7,000.00
Cost saving from reusing materials $ -
$126.29 $277.83 $782.98 $1,288.13 $1,793.29 $2,525.75
Cost saving from recycling materials $ -
$126.29 $277.83 $782.98 $1,288.13 $1,793.29 $2,525.75
Cost saving from non-disposal of materials $ -
$88.11 $193.84 $546.27 $898.70 $1,251.13 $1,762.15
Revenue from selling recycled/repurposed materials $ -
$29.37 $64.61 $182.09 $299.57 $417.04 $587.38
Total cost saving $7,000.00 $7,281.94 $7,620.28 $8,748.06 $9,875.83 $11,003.61 $12,638.89
COST COMPONENT LEVEL 1 LEVEL 2 LEVEL 3 LEVEL 4 LEVEL 5 LEVEL 6 LEVEL 7
Cost of design out waste $2,526.43 $3,031.72 $3,334.89 $3,668.38 $4,035.22 $4,640.50 $6,032.65
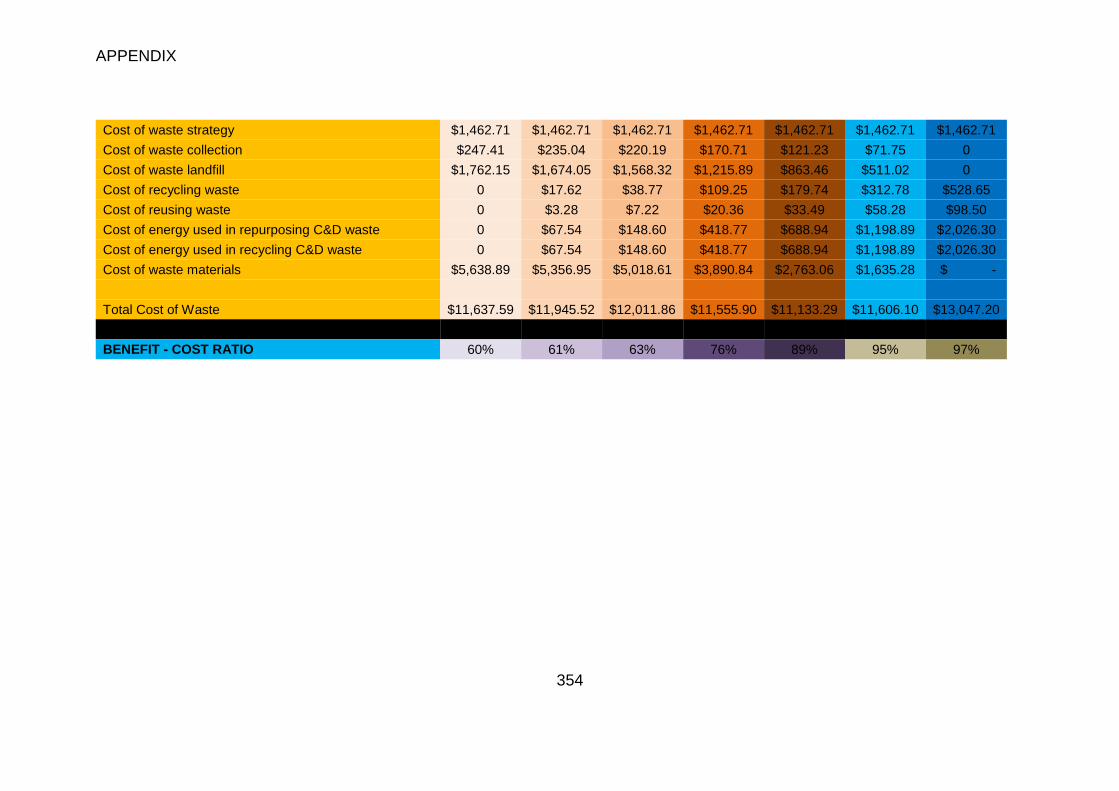
APPENDIX
354
Cost of waste strategy $1,462.71 $1,462.71 $1,462.71 $1,462.71 $1,462.71 $1,462.71 $1,462.71
Cost of waste collection $247.41 $235.04 $220.19 $170.71 $121.23 $71.75 0
Cost of waste landfill $1,762.15 $1,674.05 $1,568.32 $1,215.89 $863.46 $511.02 0
Cost of recycling waste 0 $17.62 $38.77 $109.25 $179.74 $312.78 $528.65
Cost of reusing waste 0 $3.28 $7.22 $20.36 $33.49 $58.28 $98.50
Cost of energy used in repurposing C&D waste 0 $67.54 $148.60 $418.77 $688.94 $1,198.89 $2,026.30
Cost of energy used in recycling C&D waste 0 $67.54 $148.60 $418.77 $688.94 $1,198.89 $2,026.30
Cost of waste materials $5,638.89 $5,356.95 $5,018.61 $3,890.84 $2,763.06 $1,635.28 $ -
Total Cost of Waste $11,637.59 $11,945.52 $12,011.86 $11,555.90 $11,133.29 $11,606.10 $13,047.20
BENEFIT - COST RATIO 60% 61% 63% 76% 89% 95% 97%