Embed Size (px)
Citation preview

DEGREE PROJECT IN REAL ESTATE AND CONSTRUCTION MANAGEMENT MASTER OF SCIENCE, 30 CREDITS, SECOND LEVEL
STOCKHOLM, SWEDEN 2020
ROYAL INSTITUTE OF TECHNOLOGY
DEPARTMENT OF REAL ESTATE AND CONSTRUCTION MANAGEMENT
Evaluating the economic feasibility
of the Passive House in China
Jiaying Chen

Master of Science thesis
Title
Author(s)
Department
Master Thesis number
Supervisor
Keywords
Evaluating the economic feasibility of the
Passive House in China
Jiaying Chen
Real Estate and Construction Management
TRITA-ABE-MBT-20575Berndt Lundgren
Passive House, economic feasibility,
cost benefit analysis
Abstract
The Passive House as a type of energy-efficient and cost-efficiency housing, has been
implemented widely around the world, and made great contribution to energy saving and
environment protection. Although the Passive House requires higher investment in early
stage compared to conventional houses, it has many benefits including improving indoor
climate and saving energy consumption. However, the development of Passive House in
China has been slow due to the lack of information regarding the extra investment and
benefits. To provide a clear insight on how the extra investment and benefits of the Passive
House balance each other, this study establishes an evaluation model to identify and calculate
the additional costs through the life cycle of the Passive House. With the cost and benefit
calculated, we can also analysis the payback period to see how many years it takes to recover
the extra investment. After the model is established, we evaluated a representative Passive
House in Hebei, China. The result showed that the benefits of the extra investment outweigh
the additional costs, and the payback period is approximately 12 years, which is acceptable
for housing projects. The evaluation model not only provides the developers and consumers
a tool to understand the costs and benefits, but also illustrate the economic feasibility of
Passive House in China.

Acknowledgement
Firstly, I would like to thank professor Berndt Lungren and Sviatlana Engerstam for
supporting me through the degree project. They provided lots of helpful suggestions and
always guide me with patience, which is an educational experience and broaden my horizon.
Secondly, I would like to thank my family and my friends for the support during the hard
times. The courage they gave me helped me through the pain and pressure.
Thirdly, I would like to thank students who are the opponents for their patience and kindness
in reading my thesis and giving advices.

Examensarbete
Titel
Författare
Institution
Examensarbete Master nivå
Handledare
Nyckelord
Utvärdera den ekonomiska genomförbarheten
hos Passive House i Kina
Jiaying Chen
Fastigheter och Byggande
TRITA-ABE-MBT-20575Berndt Lundgren
Passivhus, ekonomisk genomförbarhet,
kostnadsnyttoanalys
Sammanfattning
Passivhuset som en typ av energieffektiva och kostnadseffektiva bostäder har implementerats
i hela världen och har bidragit stort till energibesparing och miljöskydd. Även om Passive
House kräver högre investeringar i ett tidigt skede jämfört med konventionella hus, har det
många fördelar inklusive att förbättra inomhusklimatet och spara energiförbrukning.
Utvecklingen av Passive House i Kina har dock varit långsam på grund av bristen på
information om extra investeringar och fördelar. För att ge en tydlig insikt om hur de extra
investeringarna och fördelarna med Passive House balanserar varandra skapar denna studie
en utvärderingsmodell för att identifiera och beräkna extrakostnaderna genom passivhusets
livscykel. Med beräknad kostnad och nytta kan vi också analysera återbetalningsperioden för
att se hur många år det tar att återfå den extra investeringen. Efter att modellen har upprättats
utvärderade vi ett representativt passivhus i Hebei, Kina. Resultatet visade att fördelarna med
extrainvesteringar uppväger extrakostnaderna och återbetalningsperioden är cirka 12 år,
vilket är acceptabelt för bostadsprojekt. Utvärderingsmodellen ger inte bara utvecklarna och
konsumenterna ett verktyg för att förstå kostnaderna och fördelarna utan illustrerar också den
ekonomiska genomförbarheten hos Passive House i Kina.
Contents
1 Introduction ................................................................................................................. 1
1.1 Background .......................................................................................................... 1
1.2 Statement of the problem ...................................................................................... 3
1.3 Research question ................................................................................................. 4
1.4 Purpose of the study ............................................................................................. 4
1.5 Delimitation ......................................................................................................... 4
2 Literature review ......................................................................................................... 5
2.1 What is the Passive House? .................................................................................. 5
2.2 Energy efficiency of the Passive House ................................................................ 6
2.3 Cost efficiency of the Passive House .................................................................... 7
2.4 The Passive House in China ................................................................................. 9
2.5 Summary .............................................................................................................. 9
3 Theory ....................................................................................................................... 10
3.1 Life cycle of a project ......................................................................................... 10
3.2 Life cycle cost (LCC) analysis ............................................................................ 10
3.3 Increment benefit of the additional cost .............................................................. 11
4 Method ...................................................................................................................... 12
4.1 Research approach .............................................................................................. 12
4.1.1 Cost benefit analysis .................................................................................... 12
4.1.2 Quantitative and qualitative combined approach .......................................... 12
4.1.3 Comparative analysis .................................................................................. 12
4.1.4 Case study ................................................................................................... 13
4.2 Validity and reliability ........................................................................................ 13
4.3 Research design .................................................................................................. 14
5 Results ...................................................................................................................... 14
5.1 The additional cost and increment benefit identification and calculation ............. 14
5.1.1 The principle of identifying increment benefit ............................................. 14
5.1.2 Calculation of the life-cycle additional cost of the Passive House ................ 15
5.1.3 Identification and calculation of life-cycle increment benefit of the Passive
House 19
5.2 The model of increment benefit analysis ............................................................. 22
5.2.1 Parameter setting ......................................................................................... 22
5.2.2 NPV analysis of additional cost and increment benefit ................................ 23
5.3 Case study .......................................................................................................... 24
5.3.1 Project overview.......................................................................................... 24
5.3.2 Calculation of the additional cost ................................................................. 24
5.3.3 Calculation of the increment benefit ............................................................ 27
5.3.4 Analysis of the increment benefit ................................................................ 28
6 Discussion ................................................................................................................. 30
6.1 The potential costs saving in the future ............................................................... 30
6.2 Limitation of this study....................................................................................... 31
6.3 Payback period analysis ...................................................................................... 31
7 Conclusion ................................................................................................................ 32
Reference ......................................................................................................................... 33

List of Figures
Figure 1 Newly built Passive Houses in 2010-2019 (source: passivehouse-database.org) ... 2
Figure 2 Newly built Passive Houses in 2010-2019 by location (source: passivehouse-
database.org) ...................................................................................................................... 3
Figure 3 Payback period of the project (i=8%) ................................................................. 30
Figure 4 Variation of payback period to discount rate (i=6%, 8% and 10%) ..................... 31
List of Tables
Table 1 Different methods for dividing life cycle of a project .......................................... 10
Table 2 The composition of Passive House LCC ............................................................. 11
Table 3 Costs of insulation materials for the Passive House ............................................. 16
Table 4 Costs of ventilation system of the Passive House ................................................ 17
Table 5 Price of common movable shading ...................................................................... 18
Table 6 GHG coefficient of air pollutant .......................................................................... 21
Table 7 Costs of air pollution treatment ........................................................................... 21
Table 8 The additional costs in design stage .................................................................... 24
Table 9 Additional costs in energy-saving technologies ................................................... 25
Table 10 Additional costs in indoor environment ............................................................. 25
Table 11 Additional costs in construction management .................................................... 25
Table 12 The additional costs of the Passive House ......................................................... 26
Table 13 The increment benefit of the Passive House ...................................................... 27
Table 14 Present value of additional costs ........................................................................ 28
Table 15 Present value of increment benefits ................................................................... 29
Table 16 Payback period analysis .................................................................................... 29
1
1 Introduction
1.1 Background
Greenhouse gas, represented by carbon dioxide, has been raising the temperature of the world
for many years. Limiting the primary energy consumption and controlling the climate change
have become the consensus of many countries (Anisimova, 2011). Under this consensus, the
Passive House has developed rapidly across the world, especially in Europe, where it started.
The Passive House is a building standard that ensures comfortable indoor environment without
traditional heating and cooling system (Passivhaus Institut, 2019). The passive House
creatively reshapes the relationship among people, buildings and environment (Wall, 2006).
The passive house is an efficient way to reduce energy consumption throughout the building's
life cycle, and minimize greenhouse gas emissions (Schnieders and Hermelink, 2006).
With the continuous growth of population and expanding of construction, China has now
become one of the largest construction markets in the world. The rapid urbanization process
has resulted in a booming housing and infrastructure construction market, but also caused a
notable rise in building energy consumption. According to statistics, in China, building energy
consumption accounts for about 20% of the total energy consumption (Huo et al., 2018). Facing
the severe situation of energy shortage and environmental pollution, energy-efficient buildings
are drawing more and more attention, of which the Passive House is considered seriously by
both the government and developers.
Due to the vast territory of China, climate varies a lot from south to north. Buildings in the north
generate heat from district heating or ground source heat pump (GSHP) to keep the indoor
temperature at around 22℃. In southern China, the climate is warmer compared to the north.
Some area located in the south of the Tropic of Cancer is seldom below 10℃ even in winter.
So, there is merely demand for heating.
However, for southern cities along Yangtze River, the climate is characterized by humid and
cold winter. From the perspective of meteorology, research indicates that apparent temperature
(AT) is negatively correlated to humidity (Nguyen, Schwartz and Dockery, 2014). Take
Shanghai as an example. The average winter temperature in Shanghai is 3℃ to 5℃, but the
humidity is 40% higher than that of northern China. So, in fact, the apparent temperature that
people actually feel in Shanghai is -1℃ to 1 °C. In the northern cities with the same temperature,
district heating has been implemented.
In addition, there are great differences between the building structure in the north and south due
to the climate. Walls in the north are generally thicker with better thermal insulation. In the
south, walls are generally thin and windows are large because ventilation is valued. As a result,
the indoor thermal comfort is hard to maintain in winter by insulation alone due to moisture and
air flow, the most common solution is to use air conditioner (AC) to adjust the indoor
temperature. Using AC for heating increases the consumption of primary energy as well as
household’s expenses. Therefore, more and more people are calling for district heating in recent
year. However, there is no infrastructure prepared for district heating in the south. If district
2
heating is going to be implemented, the urban pipe network will need to be altered, and the
existing building structure will need renovation as well, neither of which is easy.
Beside the feasibility of district heating in the south, the potential impact of district heating on
the environment can be expected from the practice of northern China. According to the report
Toward an Environmentally Sustainable Future: Country Environmental Analysis of the
People's Republic of China, China accounts for seven of the world's top ten air-polluted cities,
of which 6 cities including Beijing are located in the district heating area (Zhang and Crooks,
2012). According to statistics from the Beijing Municipal Bureau of Ecology and Environment,
in 2012, Beijing had seven severe atmospheric pollution above level six, all of which occurred
during the heating season (Beijing Municipal Bureau of Ecology and Environment, 2012). It is
obvious that the emission of district heating could be one of the reasons behind the increased
density of PM2.5 particle.
With the concern of both the individual comfort and environmental sustainability, the
government has been exploring a way to energy-efficient buildings, among which the Passive
House is drawing more attraction in recent year due to the successful implementation in Europe
(Wu and Gong, 2014). In the past two decades, the passive house, as a type of energy-efficient
building with low energy consumption and high comfort, has been widely developed around
the world, especially in European countries (Schnieders and Hermelink, 2006; Miller, Buys and
Bell, 2012; Ridley et al., 2013). China started with the Passive House a bit late, but through
active international communication and cooperation, many world’s leading technologies and
good experience have been learned (Zhang, 2015). There has been 46 Passive Houses built in
China since 2010, when the Passive House is initially introduced in Shanghai Expo (Passive
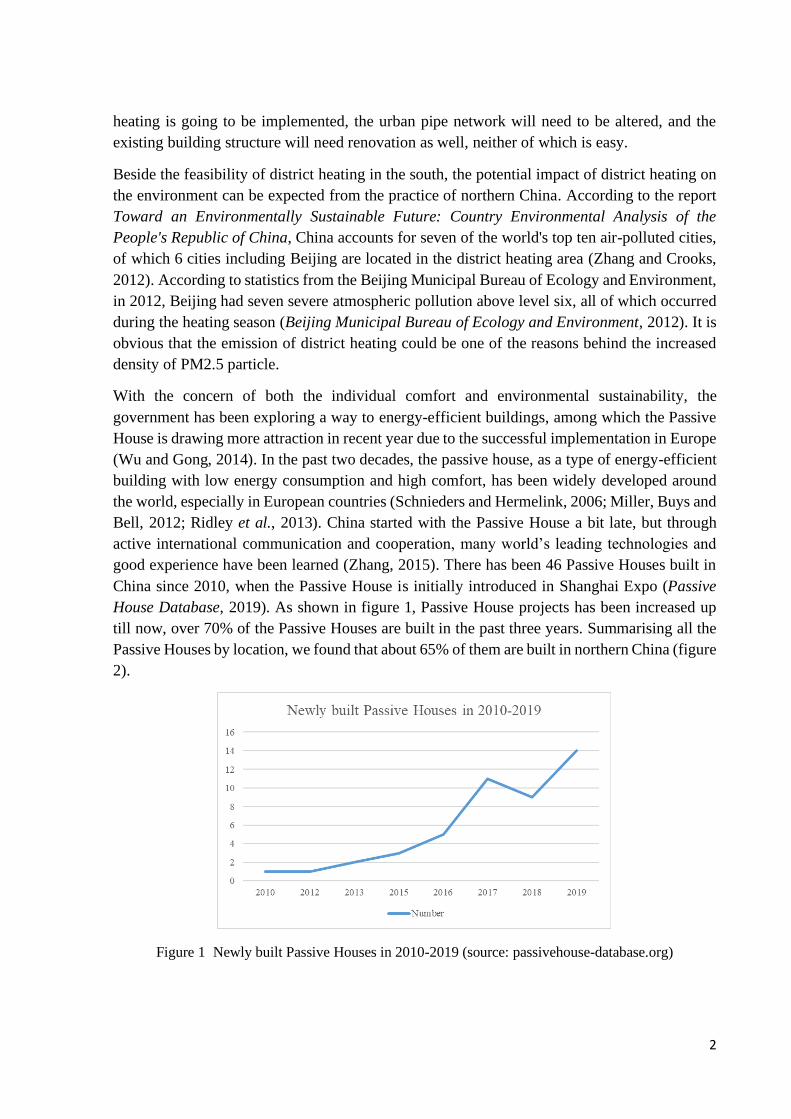
House Database, 2019). As shown in figure 1, Passive House projects has been increased up
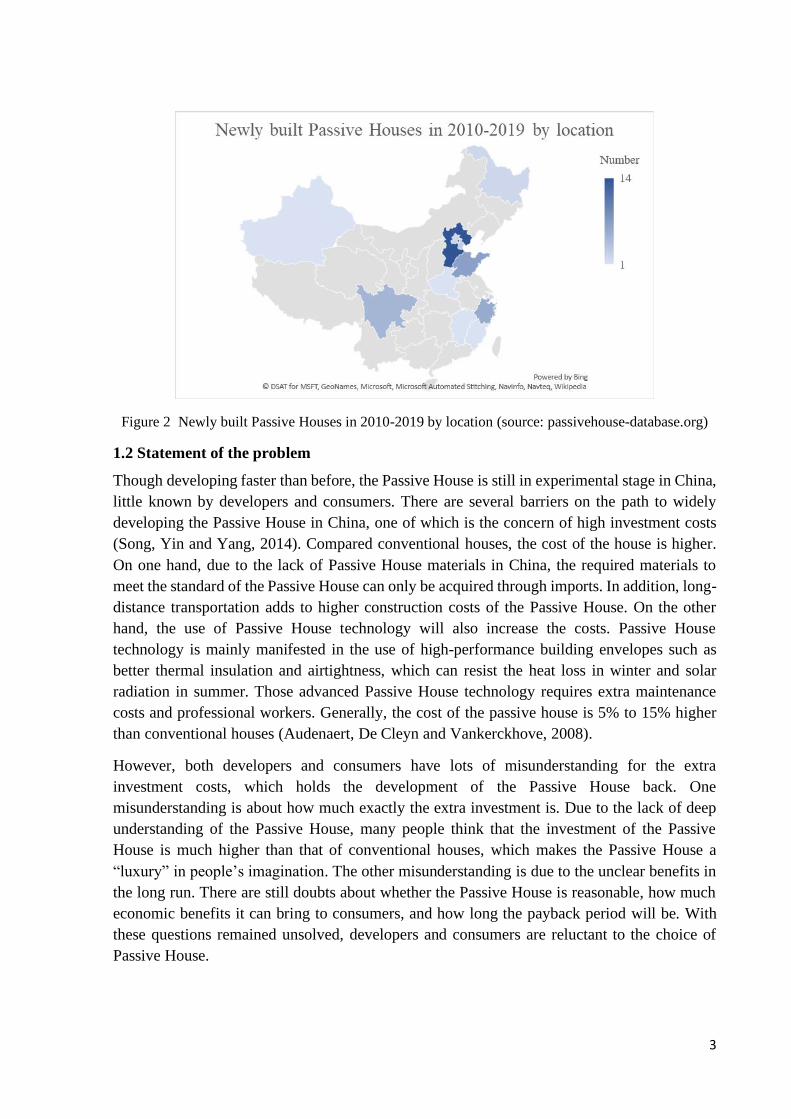
till now, over 70% of the Passive Houses are built in the past three years. Summarising all the
Passive Houses by location, we found that about 65% of them are built in northern China (figure
2).
Figure 1 Newly built Passive Houses in 2010-2019 (source: passivehouse-database.org)
3
Figure 2 Newly built Passive Houses in 2010-2019 by location (source: passivehouse-database.org)
1.2 Statement of the problem
Though developing faster than before, the Passive House is still in experimental stage in China,
little known by developers and consumers. There are several barriers on the path to widely
developing the Passive House in China, one of which is the concern of high investment costs
(Song, Yin and Yang, 2014). Compared conventional houses, the cost of the house is higher.
On one hand, due to the lack of Passive House materials in China, the required materials to
meet the standard of the Passive House can only be acquired through imports. In addition, long-
distance transportation adds to higher construction costs of the Passive House. On the other
hand, the use of Passive House technology will also increase the costs. Passive House
technology is mainly manifested in the use of high-performance building envelopes such as
better thermal insulation and airtightness, which can resist the heat loss in winter and solar
radiation in summer. Those advanced Passive House technology requires extra maintenance
costs and professional workers. Generally, the cost of the passive house is 5% to 15% higher
than conventional houses (Audenaert, De Cleyn and Vankerckhove, 2008).
However, both developers and consumers have lots of misunderstanding for the extra
investment costs, which holds the development of the Passive House back. One
misunderstanding is about how much exactly the extra investment is. Due to the lack of deep
understanding of the Passive House, many people think that the investment of the Passive
House is much higher than that of conventional houses, which makes the Passive House a
“luxury” in people’s imagination. The other misunderstanding is due to the unclear benefits in
the long run. There are still doubts about whether the Passive House is reasonable, how much
economic benefits it can bring to consumers, and how long the payback period will be. With
these questions remained unsolved, developers and consumers are reluctant to the choice of
Passive House.
4
1.3 Research question
Therefore, the research questions can be summarized as follows:
1. How much is the benefit compared to the additional cost?
2. To what extent can the additional costs be recovered by the benefits?
3. Is the Passive House economically viable in China?
1.4 Purpose of the study
Although the extra investment cost of the Passive House seems uncompetitive, in the long run,
the additional investment costs can be recovered in the foreseeable period by reducing energy
expenses (Audenaert, De Boeck and Roelants, 2010). In addition to energy savings, there are
many other benefits generated from the process of construction and operation of the Passive
House.
Many researchers in Europe have analysed the economic performance of the Passive House
using local projects. However, only few of them presented the detailed quantification results to
show how much the extra investment costs and benefits are. On the other hand, since the Passive
House is climate dependent, the data of other countries can not be used for evaluating the
economic performance of the Passive House in China. However, research about economic
feasibility is hardly found, quantification of extra investment costs and benefits still remain
blank. This study will contribute to filling the gap on lack of quantitative evaluation for the
economic feasibility of the Passive House.
In this paper, the balance between additional costs and economic benefits will be analysed to
evaluate the economic viability of the Passive House in China. The factors that generate extra
costs will be identified and the extra costs will be calculated in detail. Also, the benefits of the
extra costs will be quantified to be compared with. The model of comparing extra costs and
benefits can be applied to actual Passive House projects to evaluate their economic viability
and profitability. By quantifying and comparing the benefits and extra costs, the advantages of
the Passive House will be clearer for consumers. The results could also provide insight as well
as suggestions for the housing market on developing and evaluating Passive Houses.
1.5 Delimitation
This research is limited in China. Despite the fact that the Passive House is climate dependent,
all the calculation and analysis in this research is based on China’s market and regulation.
Different countries and regions have distinct climate and regulations, it’s hard to have a general
evaluation standard for all Passive Houses. Therefore, the evaluation model as a result of this
research is only suitable for China.
The Passive House is the target of analysis, which means many Passive-House specific factors
were taken into account. The evaluation model in this research is not simply a common model
for all houses. The Passive House distinguishes itself with conventional houses in heating,
cooling and ventilation. The structure, materials, even household appliances used in Passive
Houses are very different, so, the Passive House should not be evaluated with general standard.
5
In the contrary, the model for evaluating the Passive House is not applicable for other type of
houses.
The economic performance is the focus of this research. The economic viability of the Passive
House is what we are trying to figure out, rather than technical feasibility. There have been
many Passive House projects built successfully in China, which means that it shouldn’t be a
problem for China to apply the technologies of the Passive House. However, there are still many
cities don’t any experience in the Passive House. Some special geographical conditions and
climate might need different design strategies. Therefore, even in China, the Passive House
could vary from place to place. Thus, the technical consideration of the Passive House is not
discussed in this research.
In previous studies, the researches regarding the economic performance of the Passive House
usually divided the projects to two types, they are newly built Passive House and Passive House
renovation. Since the Passive House has just started for ten years, the focus is still on newly
built Passive Houses. Therefore, we only consider the case of newly built Passive House,
renovation is not taken into account.
2 Literature review
2.1 What is the Passive House?
The concept of Passive House was proposed by Bo Adamson in Sweden and Feist in Germany
in 1988. The Passive House is a type of building that maintains the high level of indoor thermal
comfort with minimum energy consumption (Dorer, Haas and Feist, 2005). The purpose of the
Passive House is to limit the utilization of conventional heating and cooling system so that the
primary energy consumption as well as greenhouse gas emission would decrease (Audenaert,
De Cleyn and Vankerckhove, 2008).
The Passive House is not only a type of house, but also a design strategy. As the Passive House
Institute defined, a Passive House should have the following characteristic (Schnieders and
Hermelink, 2006):
- Space heating demand: < 15 kWh/(m2yr)
- Heating load: < 10 W/m2
- Air change rate: < 0.6 h-1 @50 Pa
- Total primary energy demand for domestic hot water and appliance: < 120 kWh/(m2a)
To achieve these targets, several typical energy-efficient measures are implemented in the
Passive House. Since heating accounts for the largest part of energy consumption, increasing
heating efficiency is the major goal. Improved insulation and airtightness of envelope,
elimination of thermal bridges and triple glazing window well protect the heat from leakage.
Proper orientation ensures the house can be heated by sun in winter and protected from sun in
summer. Heat recovery ventilation provide indoor climate with fresh air without letting the heat
out (Feist et al., 2005).
6
2.2 Energy efficiency of the Passive House
The considerable energy saving of the Passive House can be largely credited to thermal
insulation. Aksoy (2012) analysed the relation between energy saving and thickness of wall.
He found that energy saving can range from 18% to 78% for different thickness. It’s obvious
that increasing thickness would result in higher costs. So, the payback period of insulation
ranges from 1.69 years to 2.89 years.
The energy efficiency has been studied by comparison between the Passive House and
conventional houses. Liang et al. (2017) compared a conventional house with a Passive House
in UK. They found that the Passive House can maintain a warmer indoor temperature by
consuming only about one third of the primary energy used by the conventional house. To
reveal the energy efficiency of the Passive House further, the authors implemented the Passive-
House renovation on the conventional house by simulation. The results showed that energy
consumption was reduced significantly.
A research in Sweden showed that the operation phase accounts for the largest part of primary
energy use of a house, no matter if it is a conventional house or a passive house. With the
material remained the same, the passive house cuts the green house gas (GHG) emission of the
conventional house by 51%, with slightly increased GHG emission in production phase of 4%
(Dodoo et al., 2019).
In the report Passive Houses in Sweden: From Design to Evaluation of Four Demonstration
Projects, four passive house projects are analysed, three of which are apartment buildings. Data
of the project in Alingsås showed that the energy use was decreased by 60% after being
renovated to passive house standard. The rent of passive houses is higher than conventional
houses, but the improved service and indoor comfort made the price acceptable, as many tenants
said when being interviewed (Janson, 2010).
Passive Houses are climate-dependent, they have different performances under distinct climate.
Some researchers ran a simulation to analysed how the Passive House works in the cold weather
in Norway. They found that the Passive House depends strongly on the local climate. The
distinct space heating load between different locations can be 2.5 times. The lowest annual
space heating load in this research occurred in Oslo, which is even 3 times higher than the value
of Zurich. It is obvious climate has great impact on the Passive House (Dokka and Andresen,
2006).
In a research paper, the Passive House and the conventional house are compared regarding life-
cycle performance. The data showed that there is a major decrease in energy demand for space
heating of 68%, which accounts for the largest part of energy saving in the Passive House. The
results indicated that the difference between the heating system of the Passive House and the
conventional house which takes the credit for the energy efficiency of the Passive House
(Dahlstrøm et al., 2012).
In Romania, the Passive House saves even 84% more heating energy, more than 50% primary
energy demand, than local energy efficient design. The investment in the Passive house is about
27% higher than in conventional energy efficient houses in Romania. The authors also found
that the life cycle costs depend on energy price (D Dan et al., 2016).
7
A research done by Dodoo et al. (2010) showed that a renovation to Passive House standard
increases the primary energy use in construction phase, but the extra energy consumption would
be recovered within four years after the house is operating. The authors also found that the
primary energy saving is larger when the original house adopted electric heating.
2.3 Cost efficiency of the Passive House
Hyland and his colleagues (2013) confirmed that there is price premium in energy efficient
properties, which means consumers value the energy efficiency of properties. In addition,
buyers of properties are willing to pay more than tenants are. In this research, the costs of
technical input or renovation investment are not taken into account. The authors addressed that
energy efficiency would not only save energy costs but also raise the value of properties.
Banfi and his team (Banfi et al., 2008) also studied the extent to which consumers would be
attracted by benefit of energy-saving houses and purchase them. The authors concluded that
house owners or tenants tend to accept the higher price for houses with energy-efficient
measures. Meanwhile, the costs of improving energy efficiency is lower than the value that
people are willing to pay. Although the researchers may overestimate consumers’ willing to
pay, it is still economically viable to develop or purchase energy-efficient houses.
Many researcher concluded that to achieve the energy-saving goals, there are two main factors
in Passive-House design, they are insulation and airtightness, which generally refer to thickness,
materials of walls and types of windows (Persson, Roos and Wall, 2006; Citherlet and Defaux,
2007; Koroneos and Kottas, 2007; Utama and Gheewala, 2008). So, when comparing the costs
of Passive Houses and conventional houses, the parameters of walls and windows should be
considered.
Kiss investigated the transaction costs in Passive House renovation, he founds that transaction
costs of Passive-House renovation is higher than that of conventional renovation, which is
because people are not familiar the concept and technologies (Kiss, 2016).
Badescu found different optimal economical space heating solution for different operation
period, depending on how long the system is going to be used (Badescu, 2007). This indicates
that when building a new Passive House or making Passive-House renovation, the operation
time should be considered.
Saari and colleagues tried to find alternative design for a detach house in Finland to see how its
energy efficiency can be improved and how the life-cycle costs can be minimized. They found
that the payback period varied with the change of real interest rate and energy price growth rate
(Saari et al., 2012).
Tokarik and Richman analysed an as-built Toronto house to find out how the life cycle costs
could have been optimized (Tokarik and Richman, 2016). They found that investment in
passive energy efficiency improvement is attractive only when the discount rate is low and fuel
price faces major increase.
Galvin took a different perspective when studying economic viability of passive house. Rather
than model-based approach, he used reality-based and subjectivist approach to investigate if the
Passive House is a good idea for investors. He offered a decision-making process where

8
investors choose the figure for parameters, like their best guess about fuel price and expected
discount rate (Galvin, 2014).
Audenaert and his colleagues compared three different building types, which are standard house,
the low-energy house and the passive house. They analysed the energy costs and cash flow to
see their profitability. They suggested that government should aid with subsidies to make
passive house more attractive to investors (Audenaert, De Cleyn and Vankerckhove, 2008).
Ekström and his colleagues (2018) compare cost efficiency of renovating an old single-family
house to three different level, including the Passive House level. The results indicate that for
different reference houses, the Passive-House renovation reduces the energy use by about 65%
and bought energy by 90%, which is especially beneficial when energy price is growing
potentially. The authors also evaluated the energy costs when applying different heating
systems, the annual energy costs of Passive-House renovation is about 33% to 46% less than
that of renovating the original house to building regulation level. However, the high investment
cost is also an inevitable problem in Passive-House renovation.
Schnieders and Hermelink (2006) analysed over 100 dwellings and proved that the Passive
House is sustainable and viable both ecologically and economically. In their research, the costs
of energy saved are calculated. Compared to the costs of conventional dwellings, Passive
Houses save 6.2 Cent/kWh in heating. This saving would be even more attractive under the
situation where energy price is increasing. Also, the authors expected the investment costs of
the passive house will decrease in the future with scale production.
Polish researchers used life cycle costs (LCC) method to analysed different energy saving
installation alternatives. They found that although traditional installation has very low
investment costs, it generates highest operation costs in the long run compared to other
installation alternatives. The life cycle costs are lowest when the heat is generated from solar
panel and the rainwater is collected for non-potable uses. This passive house design reduced
energy and water consumption as well as GHG emission (Stec et al., 2017).
The extra investment costs of the Passive House include improving insulation in the wall,
ground and roof, windows, ventilation system, heating distribution system, etc. The triple
glazing windows in the Passive house cost 48% more than typical windows in the conventional
house, but the costs will decrease if the scale production comes to realize. The heating
distribution system in the Passive house costs 75% less than in the conventional house, which
is due to the considerable reduction in peak heating load and the amount of radiator in the house
(Feist et al., 2005).
The extra costs of the Passive House also include the test for air tightness, which is unnecessary
for the conventional house. The average total construction cost is approximately 980 Euro/m2.
The extra costs of the Passive House in this research vary from 6808 Euro to 10258 Euro,
depending on the house type, which account for about 12.6% of the pure construction costs. If
the house was constructed according to the Passive House standard only, the proportion would
be around 8.5%. The extra costs in this project are higher because the solar thermal system is
installed, which is not included in the Passive House standard (Feist et al., 2005).

9
Adrian et al. (2014) performed a life-cycle analysis on a specific project in Romania. They use
the data to create an economic model of the houses. They concluded that the additional
investment of energy-efficient measures compared to standard houses can be recovered within
16 to 33 years, depending on different economic scenarios. With the best expectation of
economic conditions, the payback period would be the shortest among all scenarios.
Researchers in Belgium compared passive house with standard house to find out the difference
in economic viability. They found that investments in insulation is profitable through the life
cycle and it can be recovered within 10 years (Audenaert, De Boeck and Roelants, 2010).
Another group of Belgian researchers study specifically about the economic performance of
heating system in passive houses by using cost-benefit analysis. They concluded that the
Passive House is efficient both economically and environmentally under the scenarios with low
discount rate and increasing energy price (Georges et al., 2012)
2.4 The Passive House in China
Schnieders et al. (Schnieders, Feist and Rongen, 2015) simulated different Passive Houses in
distinct location across the world and concluded that the Passive House can be implemented in
almost everywhere in the world without limiting the design, but the details should be altered
corresponding to local climate and other specific condition. Shanghai is also discussed in this
research; the humidity is considered to be a major concern in design. The heating demand of
Shanghai is the lowest among four reference cities that need heating in winter, and the cooling
demand is moderate in all six cities. However, the dehumidification demand is the second
highest, which means dehumidification should be the focus of Passive House design. The
overall energy saving compared to conventional house in Shanghai is about 87%.
2.5 Summary
According to existing studies, the Passive House has proved its efficiency in saving energy.
Compared to conventional houses, the energy demand and greenhouse gas emission is reduced
considerably, and the indoor temperature is well maintained at the same time. Among all the
energy savings, space heating accounts for the largest part. One of the reasons behind the low
energy consumption of the Passive House is its climate dependency. The design and
performance of the Passive House vary with the change of location and climate. Though saving
energy during operation stage, the Passive House increases the energy uses in construction. But
the extra energy consumption can be offset by the energy saving in operation.
The energy efficiency of the Passive House requires extra investment, since it is achieved by
superior performance of thermal insulation, windows, ventilation with heat recovery, etc. Some
researchers have investigated the payback period and benefit of the extra investment. The
payback period could change with the variation of interest rate and energy price. Most of the
researchers agree that the Passive House is more attractive when the interest rate is low and
energy price is increasing. The extra investment will result in higher price or rent, but it was
found that the performance of the Passive House is satisfying for consumers and the price
premium will be acceptable. The extra investment was estimated to be recovered within 30
years. The Passive House is economically viable according to many successful experiences in
as-built projects in Europe. However, studies regarding the Passive House are scarcely found
in China, not to mention researches about economic feasibility. Also, the exact benefits and

10
extra investment of the Passive House are not well sorted and located in the life cycle of a house,
which makes the Passive House “abstract” for developers and consumers.
3 Theory
3.1 Life cycle of a project
The life cycle theory was first used in product manufacturing, and has been widely applied in
many fields, such as politics, economy, and society. Just like the process “from cradle to grave",
a product has its own life cycle from being produced to sold. At the beginning, materials are
obtained, through the process of manufacturing and assembling, the target product is made and
then transported, sold. Finally, the product is retired as it wears out (Hertwich, 2005).
By introducing the life cycle theory into the construction industry, buildings are regarded as
unique products. The costs and benefits are analysed comprehensively from the aspect of life
cycle. Relevance and coordination between things are valued in order to optimize the plan as
well as benefits. Currently, the standard of dividing life cycle in construction industry of China
varies according to different purposes, which is presented in table 1.
Table 1 Different methods for dividing life cycle of a project
Dividing standard Work involved
Three-stages Planning, design and construction stage
Four-stages Planning, design, construction and operation stage
Five-stages Planning, design, construction, operation and disposal stage
Six-stages (for
quantity survey and
cost measurement)
Investment estimation, preliminary design budgeting, construction
drawing budgeting, bidding, construction, completion settlement and
account stage
This research aims to explore the extra costs and cost benefits of a Passive House, where
detailed identification and classification of different costs are necessary. Therefore, the five-
stages dividing standard is used to divide the entire life cycle of a Passive House into planning
stage, design stage, construction stage, operation stage and disposal stage.
3.2 Life cycle cost (LCC) analysis
The definition of LCC was first given by the US Department of Defense: LCC is the discounted
costs generated within a certain period when a single building or construction project was
owned, operated, maintained (Sherif and Kolarik, 1981). Subsequently, many researchers gave
different definitions according to different research objects. Fabrycky and Blanchard (1991)
believes that LCC occurs from project planning to the end when the project is scrapped, and
different costs are generated at different stages. Alting (1993) divides the LCC into company
cost, users cost and society cost according to different participants. The time they appear is
different, and the content involved is also distinct. Dimtri et al. (2005) proposed that LCC is the
cumulative discounted value of the costs incurred during planning, design, construction and
renovation of a project.
According to previous research of LCC and the characteristic of the Passive House, the
composition of LCC of the Passive House is summarized, as shown in Table 2.

11
Table 2 The composition of Passive House LCC
Stage Company cost Users costs Society cost
Planning Market research, feasibility
study
Design and
preparation
Survey, design, bidding, land,
qualification application,
upfront costs, etc.
Construction
Equipment, construction,
installation, management,
labour, financial expenses, etc.
Municipal
administration,
environment
Operation and
maintenance Maintenance costs
Energy consumption,
appliance
depreciation and
replacement
Municipal
administration,
environment
Disposal and
demolition Recycling, scrapping
Municipal
administration,
environment
3.3 Increment benefit of the additional cost
The increment benefit of the Passive House is generated in comparison. Under the same laws,
regulations, building codes and production level, the extra investment, which occurs at all stages
of the life cycle compared to the reference house, is what we refer to as the additional cost of
the Passive House. When analysing the additional cost of the Passive House, the general energy-
saving building is introduced as the reference building. It refers to the building with normal
residential functions, the energy consumption of which is reduced by using some eco-friendly
materials. In contrast, the Passive House adopts passive technologies and high-performance
materials to meet the requirement of energy saving and indoor comfort. The part of cost that is
higher than the general construction cost is considered to be the additional cost of the Passive
House, which mainly includes the design, consulting and certification costs in early stage,
technical cost and management cost in construction, and various expenses incurred during the
operation and maintenance phase.
The increment benefit in this research is the benefit generated from extra investment on the
Passive House. When the extra technologies, materials and services are invested, the cost
benefit will change. The difference between the cost benefit of the Passive House and the
reference house is the increment benefit. The increment benefit of the Passive House can be
divided into two parts: direct and indirect benefit. Direct benefit mainly refers to the economic
benefit of the Passive House, which is reflected in energy, water, material and land saving. The
actual value of the direct benefit can be determined by calculating the corresponding parameters.
On the other hand, indirect benefit mainly includes social benefit and environmental benefit,
they the positive impact on people and environment from the Passive House. The indirect
benefit is generally difficult to measure in quantitative way, so it needs to be analysed through
the combination of qualitative and quantitative method. By combining the direct benefit and
the indirect benefit, the life-cycle comprehensive increment benefit of the Passive House is
obtained.

12
4 Method
4.1 Research approach
4.1.1 Cost benefit analysis
The model of CBA (cost-benefit analysis) will be used as the main theory in this study,
accompanied by life-cycle costs analysis. The concept of CBA was firstly put out by Jules
Dupuit in 1848, and was formalized later by Alfred Marshall (Pearce, 1998). Jules Dupuit
initially used this method by calculating the "social rate of return for projects such as road or
bridge construction". CBA has been used to measure the social benefits in many infrastructure
projects ever since. After second World War, the topic of "improving government efficiency"
was under lot of pressure, and people were looking for ways to ensure that public funds were
effectively utilized for major public investments. This led to the start of a fusion of new welfare
economics, which is actually cost-benefit analysis. The development of CBA has been through
much fluctuation since the 1960s, but it has become the major method to evaluate public
projects in nowadays.
Pearce and his colleagues (2006) link the sustainability with CBA for the first time in their
publication, which is very suitable for this research. Therefore, the improved theory of CBA
will guild the analysis of economic feasibility of passive house. This book highlights that it is
not efficient to make sustainability a goal of macroeconomic development. Since CBA is
capable of managing project portfolios, which might end up in a meaningless situation where
the negative effect on the environment of a project is compensated by the positive effect of
another one. Instead, the approach of “weak sustainability” is put forward to solve the problem.
It focuses on assets check for individual project, therefore compensates for the weakness of
traditional CBA, which is that too little wealth is left for next generation (Pearce, Atkinson and
Mourato, 2006). The concept of sustainable CBA method is in line with environmental
problems, the core of which is to create a sustainable world for future generations.
4.1.2 Quantitative and qualitative combined approach
The application of the combination of qualitative and quantitative approaches avoids the
excessively subjective conclusions caused by purely qualitative analysis or quantitative analysis,
and ensures the reliability and validity of the research results. This paper determines the
influence factors of additional costs and its efficiency of the Passive House through qualitative
analysis approach, and quantitatively analyses the cost-effectiveness by calculating the
distinction between additional costs and savings.
4.1.3 Comparative analysis
The comparative analysis approach is widely used. It is an analysis approach by comparing a
certain parameter with its corresponding evaluation standard, or comparing the distinct parts
between the same type of things. This research compares the cost efficiency and energy
efficiency incurred in the life cycle of the Passive House and general energy-saving buildings,
so as to evaluate the extra costs and savings of the Passive house and if the savings worth the
additional investment.
13
4.1.4 Case study
Case study is a research approach to improve the understanding of a phenomenon in real-life
context, the analysis of which is carried out on the basis of theory developed prior to the case
study. The purpose of case study is to develop or test the theory. Case plays a distinctive role
in evaluation research, the most important application is to explain the rationale behind the
observed phenomenon (Yin, 2009).
According to Yin’s theory about case study, a single-case study is not as unreliable as some
critics said. The generalization of single-case study is analytic-based, rather than statistical-
based. Many researchers have tried to cover broader theories from single-case studies. There
are five rationales for single-case design, one of which is a representative or typical case. For
example, Robert and Helen Lynd studied a small town in America as a “average town” to
demonstrate an important development in the history of America (Yin, 2009).
The Passive House has been proved to be economically viable according to many researches.
In this thesis, this phenomenon is observed and studied in the real-life context of China. Theory
to evaluate the economic feasibility of the Passive House is developed before the case study.
According to Yin’s theory about designing single-case study, the third rationale for single case
is a representative case (Yin, 2009). Thus, a Passive House project in Hebei was chosen as the
typical Passive House in China to test the evaluation theory, in order to find out the extent of
economic viability. The Passive House project selected in the case study located in the province
with most Passive House in China, the type is residential building, it can be considered as a
representative Passive House for this study. The result of evaluation should explain the average
performance of Passive House in China.
By using the process in this research to calculate the additional costs and savings of the selected
as-built project over the entire life cycle, the cost-effectiveness and economic viability of the
project will be analysed and discussed. This process also can be used to verify whether the
approach of evaluating the cost efficiency of the Passive Buildings based on life-cycle costs is
feasible.
4.2 Validity and reliability
Cost-benefit analysis has been implemented in public projects since 1960s, it is considered as
an efficient tool to evaluate a project and make good investment choice (Kirkpatrick and Weiss,
1996). In China, cost-benefit analysis is widely used in power grid planning, infrastructure
projects, housing projects, etc. Cost-benefit analysis as an appraisal approach has been proved
to be suitable for public projects, especially for those newly introduced and lack of experience,
like Passive House. Evaluating the Passive House projects with cost benefit analysis ensures
the consistency with other energy-efficient housing projects in China, which makes it easy to
be compared with.
Case study in this thesis is used to test the model proposed for evaluation. A representative
Passive House project is selected to be evaluated. The single-case study is carried out because,
currently China is still lack of experience in Passive House, the total number of built Passive
House projects is only 46, most of which are residential buildings. The selected project locates
in the province where accounts for the largest part of the as-built Passive House. It is also a
14
sample project supported by government. Therefore, we consider the project as representative,
and informative enough to reflect the average level of Passive House in China. Thus, the cost
benefit analysis and case study used in this thesis is valid and reliable.
4.3 Research design
In the context of the development of China's construction industry, this research bases on life-
cycle costs analysis and identifies the additional costs and increment benefit of the Passive
House at different phases. The research is divided into the following four parts:
• Theoretical research on cost-effectiveness of the Passive House. In this part, the key
concept and main technologies of the Passive House as well as LCC and cost efficiency
theory are further studied, the composition of life-cycle cost is identified. This research
is carried out on the basis of these theories.
• Identification and calculation of additional cost and increment benefit factors. The life
cycle of the Passive House is divided into four stages: planning, design, construction
and operation. The additional cost and increment benefit are identified in every stage, a
process is created to estimate the life cycle increment benefit.
• Research on cost-benefit analysis model of the Passive House. According to the
principles of engineering economics, the additional costs and increment incurred during
the entire life cycle are discounted to the initial stage of the project and the
corresponding net present value (NPV) is obtained. A cost-benefit analysis model is
established to quantitatively analyse the incremental costs and its cost benefits of the
Passive House the relation between.
• Real project case study. A specific Passive House project is selected as the research
object. By applying the analysis model proposed in this research to the project, the
economic benefits of the project are analysed, and the rationality and validity of the
model is in turn verified.
5 Results
5.1 The additional cost and increment benefit identification and calculation
5.1.1 The principle of identifying increment benefit
1) Life cycle principle
The increment cost benefit analysis of the Passive House aims at reliable and valid
results to promote the development of the Passive House in China. The costs and
benefits should be investigated based on life cycle theory. Comprehensive analysis of
all costs and benefits generated from different stages from planning to disposal should
be performed, and then studied at a certain point in time.
2) With and without comparison principle
The identification of additional costs and increment benefits should not be aimless and
arbitrary, a specific reference house is necessary. The reference house in this research
is the general energy-saving building. By analysing the technology, material and service
in the life cycle of Passive House which are different from in the reference house, the

15
actual effects under scenarios with and without these differences are compared and
quantified.
3) Relevance effect principle
When analysing increment benefits, not only the direct and internal benefits should be
considered, such as the economic benefits of energy saving and material saving, but also
the indirect and invisible benefits, which refers to social benefits and environmental
benefits that improve people’s life and environment.
5.1.2 Calculation of the life-cycle additional cost of the Passive House
1) Additional costs C1 in planning stage
The main work involved in planning phase is to conduct feasibility studies on the project
to evaluate the viability of different plans from the aspects of technology, economy and
policy. Compared to general energy-saving buildings, the Passive House are closely
related to the local climate and environment (Schnieders, Feist and Rongen, 2015).
Therefore, in order to maximize the energy efficiency of the Passive House, detailed
investigation and analysis on climate and environment is needed. At the same time,
experts must be invited to demonstrate the construction plan from technical and
economic aspects. Therefore, the additional costs of the passive building in the planning
stage is mainly consist of the environmental survey fee Csurvey and consulting fee
Cconsulting. The formula is expressed as:
C1 = Csurvey + Cconsulting (1)
2) Additional costs C2 in design stage
The design stage is the core stage that determines the performance of the final product
of the construction. With the cooperation of the professional design team, the building
is displayed and simulated through drawings or models. At this stage, the cost of the
Passive House increases mainly in three aspects: the increase in design costs, the cost
of assistant software simulation and the cost of obtaining the Passive House certification.
Since the Passive House is greatly dependent on the environment, it’s important to suit
the Passive House design to the local climate. Special design is hence needed to meet
the requirements of the Passive House standards, which makes the participation of
professional teams essential. This part of the increased design cost is referred to as
additional design cost of the Passive House Cdesign.
The design stage also involves optimization of the scheme to ensure that the building
meets the certification standards for the Passive House. Software like designPH are
necessary to simulate the building environment and calculate the energy consumption.
By building models in software, the light, wind and thermal environment around the
building are simulated and the performance of the building is tested so as to optimize
the design and construction plan. The additional cost of the simulation and software use
is denoted as Csimulation.
The most authoritative Passive House certification is the PHI certification, now a PHI
certification center has also been established in China. According to the requirements
of the Passive House certification, the cost is mainly composed of three parts:

16
registration fee, operation icon fee and icon design fee (Bastian, Zeno; Arnautu, Dragos;
Schneieders, Dr. Jurgen; KaufmannDr. Berthold; Mikeska, Tomas; Peper, Søren;
Radeva, 2018). The overall expenses on certification is denoted as Ccertification.
To sum up, the additional costs of the Passive House in design stage can be express as:
C2 = Cdesign + Csimulation + Ccertification (2)
3) Additional costs C3 in construction stage
An important factor that effect the choice to buy a house or not is the selling price.
Compared with general energy-saving buildings, the Passive House have always been
considered as expensive houses that ordinary people cannot afford. The increase in
construction costs has actually led to higher house prices, and results in reluctant
behaviour of consumers. This part analyses the reasons behind the higher costs from
three aspects: energy-saving technology, indoor environment and construction
management.
• Additional costs C31 in energy-saving technology
a. Envelope insulation
The Passive House has quite a high standard for insulation, which is
implemented on the roof, exterior walls and basement, etc. By conducting the
market survey, the price of several insulation materials is shown in Table 3. The
reference to compare with is the price of the most commonly used polystyrene
board with the same thickness. By calculate the actual amount of insulation, and
the difference between the cost of insulation material for the Passive House and
for the conventional house, the additional costs of insulation can be determined.
Cinsulation can be calculated with formula 3:
𝐶𝑖𝑛𝑠𝑢𝑙𝑎𝑡𝑖𝑜𝑛 = (𝑉1 − ��) × ∆𝑆 (3)
Where 𝑉1 is the price of insulation material of the Passive House, �� is the price
of insulation material of conventional energy-saving buildings, and ∆𝑆 is the
total area covered by insulation.
Table 3 Costs of insulation materials for the Passive House
Type of insulation materials Average price
(Yuan/m2) Price composition
Rockwool (200 mm) 300 Labour, materials
and machinery
costs are included Polyethylene foam (200 mm) 420
Extruded polystyrene (200 mm) 550
b. Solution to thermal bridge
The thermal bridge should generally be eliminated in the design stage, because
it would be more difficult to deal with during construction. The main reasons for
the thermal bridge during the construction stage are insulation penetration
caused by component installation and insulation dislocation resulted from
mistakes in construction. To handle the thermal bridge problem, infrared
imaging will be used to find energy weak points, and detailed measures will be
taken according to specific condition. So, the additional cost spent in handling
thermal bridge is given by Cthermalbridge.
17
c. Solution to airtightness
The reasons for the substandard airtightness mainly lie in design stage and
construction stage. The air leakage points can be found by hands, candles or leak
detectors. The gaps between various wire boxes and component joints embedded
in the middle are repaired in time, and the cost is recorded as the incremental
cost of airtightness treatment. Cracked block walls and gaps at the joints of
components should be mended promptly. The cost spent in airtightness is
denoted as Cairtightness.
d. Use of renewable energy
The most commonly used renewable energy includes solar energy, wind energy
and geothermal energy. To use these energy, corresponding energy collectors
are needed. By installing solar panels on the roof, solar energy can be converted
to electricity. In the Passive House, this part of electricity is often used to provide
domestic hot water. In some regions with geothermal resources, ground source
heat pumps (GSHP) is buried underground and connected to household
appliance, which maintains the indoor temperature and provides hot water. The
technologies above are rarely used in conventional energy-saving buildings,
since they are supported by considerable labour and machinery costs, which is
the additional cost of renewable energy utilization in the Passive House, denoted
as Cutilization.
Above all, the additional costs of energy-saving strategies can be summarized as
following:
C31 = Cinsulation + Cthermalbridge + Cairtightness + Cutilization (4)
• Additional costs C32 in indoor environment
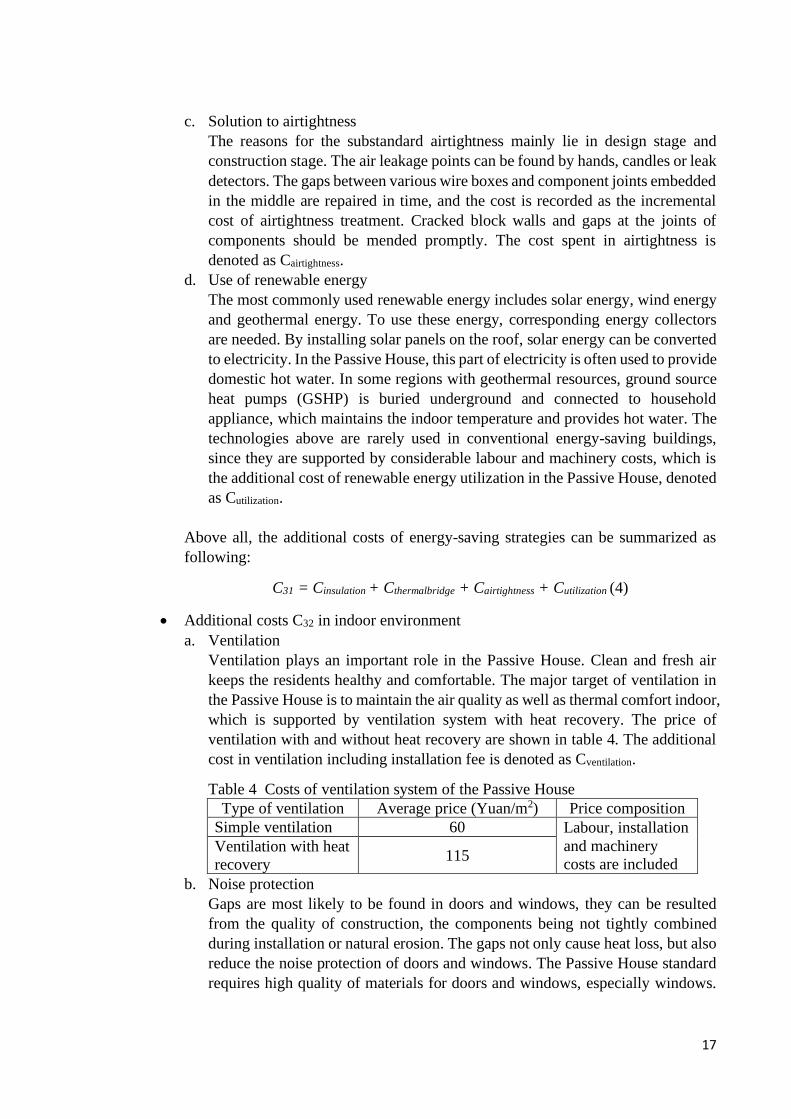
a. Ventilation
Ventilation plays an important role in the Passive House. Clean and fresh air
keeps the residents healthy and comfortable. The major target of ventilation in
the Passive House is to maintain the air quality as well as thermal comfort indoor,
which is supported by ventilation system with heat recovery. The price of
ventilation with and without heat recovery are shown in table 4. The additional
cost in ventilation including installation fee is denoted as Cventilation.
Table 4 Costs of ventilation system of the Passive House
Type of ventilation Average price (Yuan/m2) Price composition
Simple ventilation 60 Labour, installation
and machinery
costs are included Ventilation with heat
recovery 115
b. Noise protection
Gaps are most likely to be found in doors and windows, they can be resulted
from the quality of construction, the components being not tightly combined
during installation or natural erosion. The gaps not only cause heat loss, but also
reduce the noise protection of doors and windows. The Passive House standard
requires high quality of materials for doors and windows, especially windows.
18
Triple-glazed windows are hence installed in the Passive House, which prevent
the indoor from noise and heat loss. The additional cost compared to
conventional doors and windows is denoted as Cnoise, which mainly includes the
difference in the price of materials.
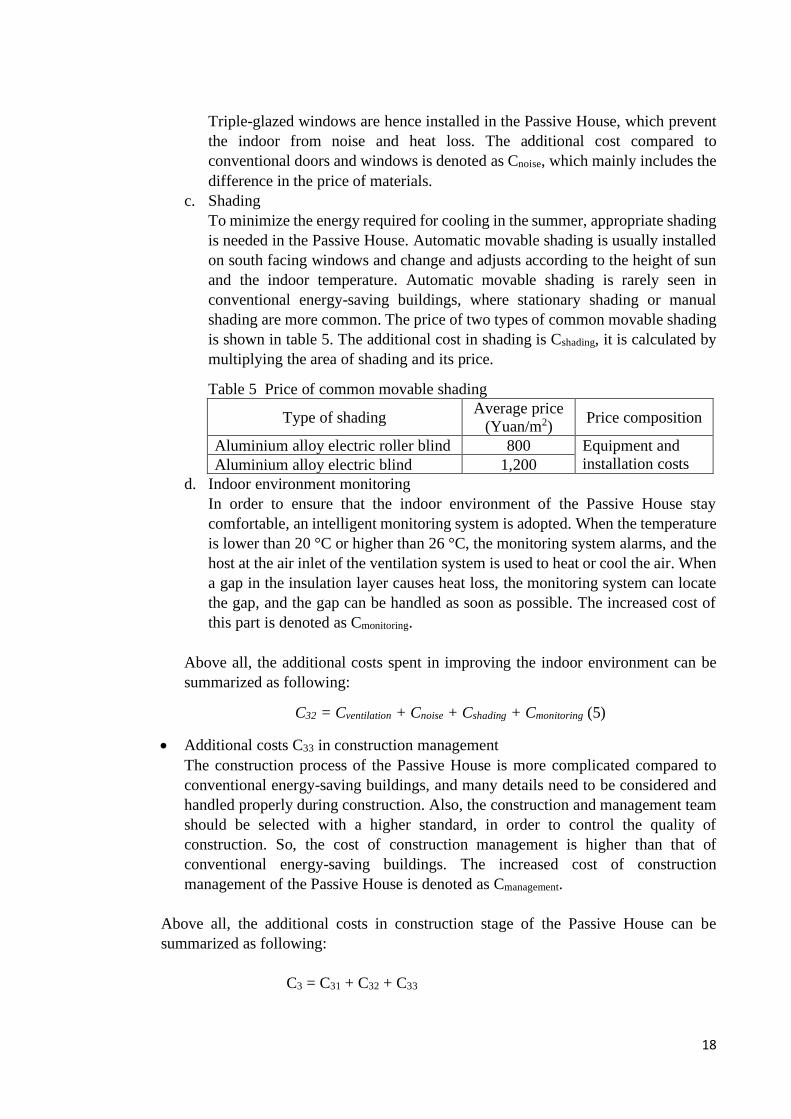
c. Shading
To minimize the energy required for cooling in the summer, appropriate shading
is needed in the Passive House. Automatic movable shading is usually installed
on south facing windows and change and adjusts according to the height of sun
and the indoor temperature. Automatic movable shading is rarely seen in
conventional energy-saving buildings, where stationary shading or manual
shading are more common. The price of two types of common movable shading
is shown in table 5. The additional cost in shading is Cshading, it is calculated by
multiplying the area of shading and its price.
Table 5 Price of common movable shading
Type of shading Average price
(Yuan/m2) Price composition
Aluminium alloy electric roller blind 800 Equipment and
installation costs Aluminium alloy electric blind 1,200
d. Indoor environment monitoring
In order to ensure that the indoor environment of the Passive House stay
comfortable, an intelligent monitoring system is adopted. When the temperature
is lower than 20 °C or higher than 26 °C, the monitoring system alarms, and the
host at the air inlet of the ventilation system is used to heat or cool the air. When
a gap in the insulation layer causes heat loss, the monitoring system can locate
the gap, and the gap can be handled as soon as possible. The increased cost of
this part is denoted as Cmonitoring.
Above all, the additional costs spent in improving the indoor environment can be
summarized as following:
C32 = Cventilation + Cnoise + Cshading + Cmonitoring (5)
• Additional costs C33 in construction management
The construction process of the Passive House is more complicated compared to
conventional energy-saving buildings, and many details need to be considered and
handled properly during construction. Also, the construction and management team
should be selected with a higher standard, in order to control the quality of
construction. So, the cost of construction management is higher than that of
conventional energy-saving buildings. The increased cost of construction
management of the Passive House is denoted as Cmanagement.
Above all, the additional costs in construction stage of the Passive House can be
summarized as following:
C3 = C31 + C32 + C33

19
= Cinsulation + Cthermalbridge + Cairtightness + Cutilization
+ Cventilation + Cnoise + Cshading + Cmonitoring
+ Cmanagement (6)
4) Additional costs C4 in operation stage
During the life cycle of a building, operation accounts for the largest part of time.
Compared to various additional measures taken in the construction stage, the major
factor that increase the cost during the operation stage is the regular repair and
replacement of equipment, such as replacing the filter in the ventilation system timely
to avoid shortage or pollution of fresh air supply driven by blocked filter mesh.
• Additional cost in equipment repair
During the operation stage, the performance of equipment will inevitably decline
due to long-term wear and tear or other external effect. Therefore, regular check and
repair are necessary. For example, solar power generation devices require inspection
once a month, and the accumulator should be replaced every 1 to 2 years; the
ventilation system generally needs to be inspected once every 3 to 6 months to clean
the air inlet and filter; the maintenance of the envelope includes damage and erosion
on the insulation, and gaps in the doors and windows. The additional cost spent in
repair is Crepair.
• Additional cost in equipment replacement
When the equipment’s service life expires, it needs to be replaced in time. The
service life of solar power modules is about 20 years; the service life of the
ventilation system is generally about 15 years; the service life of the ground source
heat pump (GSHP) is 10 to 15 years, ranging according to the degree of maintenance.
The expenses of replacing the equipment in the Passive House consist the additional
cost Creplacement.
Above all, the additional cost in operation stage can be summarized as following:
C4 = Crepair + Creplacement (7)
In summary, the additional cost of the Passive House can be expressed as:
C = C1 + C2 + C3 + C4 (8)
5.1.3 Identification and calculation of life-cycle increment benefit of the Passive House
1) Composition of increment benefit
After decades of development and research, the benefits of the Passive House are
becoming increasingly obvious from the perspective of life cycle. The benefits can be
analysed from three aspects: economic benefits, environmental benefits, and social
benefits.
• Economic benefits
Compared to conventional energy-saving buildings, the economic benefits of the
Passive House are mainly reflected in the construction stage and operation stage.
Since the Passive House does not require traditional heating, cooling, humidification,
etc., the equipment and materials for those services are reduced during the
construction stage. During the operation stage, most of the primary energy use is
20
replaced by renewable energy, which saves a lot of energy cost. From the
perspective of life cycle, energy savings bring great economic benefits. Meanwhile,
the government's subsidy can also offset part of the additional cost.
• Environmental benefits
The Passive House benefits the environment from two aspect: reduce greenhouse
gas emission, and less construction waste due to extension of life span. On one hand,
primary energy consumption is optimized in the Passive House, and it is expected
to be zero in the future. As a result, the greenhouse gas emission declines to a very
low extent. On the other hand, the quality requirements of the Passive House are
strict. The damage to the structure of the building during operation is smaller than
the life span of the building will be longer than that of conventional energy-saving
buildings, reducing the environmental pollution caused by the construction waste.
• Social benefits
Social benefits can be divided into macro and micro benefits. From a macro
perspective, the promotion and implementation of the Passive House raise people’s
consciousness of the importance of environment and energy, thus stimulating the
development of other energy-saving industries. The Passive House also changes the
life style, accelerating the goal of sustainable development of China. From a
microscopic perspective, the Passive House creates a more comfortable indoor
environment with constant temperature and humidity, which improves the quality
of life for people.
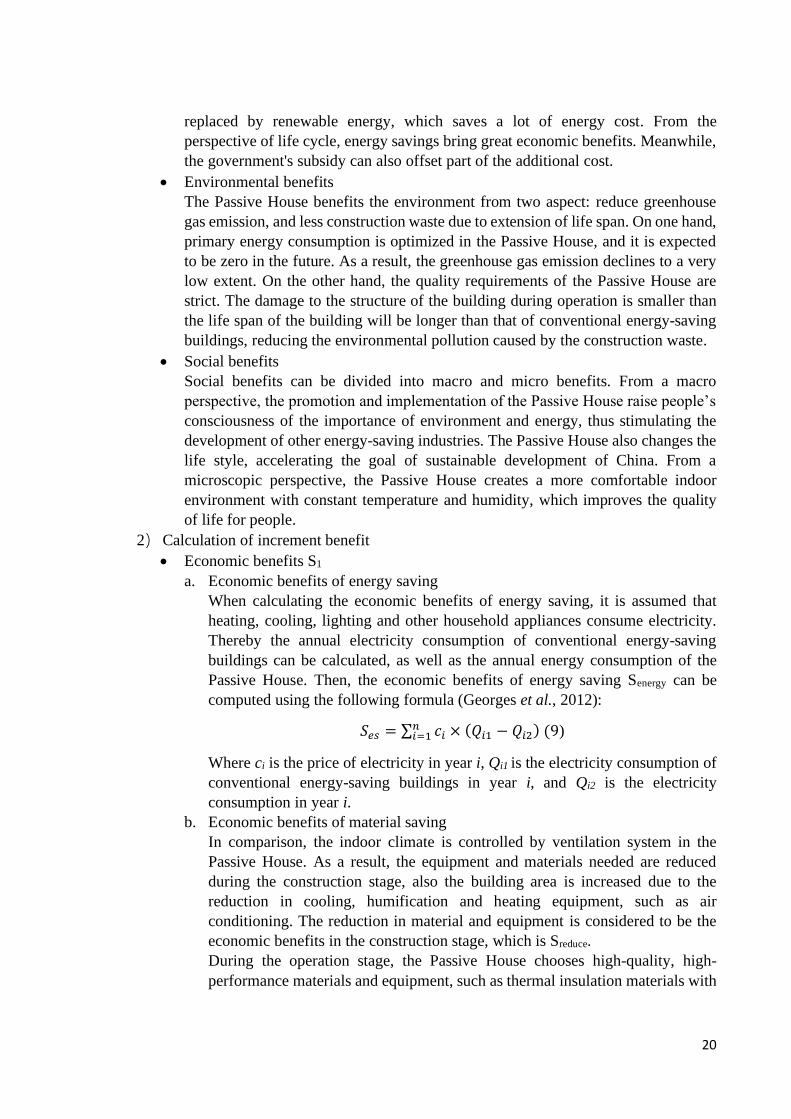
2) Calculation of increment benefit
• Economic benefits S1
a. Economic benefits of energy saving
When calculating the economic benefits of energy saving, it is assumed that
heating, cooling, lighting and other household appliances consume electricity.
Thereby the annual electricity consumption of conventional energy-saving
buildings can be calculated, as well as the annual energy consumption of the
Passive House. Then, the economic benefits of energy saving Senergy can be
computed using the following formula (Georges et al., 2012):
𝑆𝑒𝑠 = ∑ 𝑐𝑖𝑛𝑖=1 × (𝑄𝑖1 − 𝑄𝑖2) (9)
Where ci is the price of electricity in year i, Qi1 is the electricity consumption of
conventional energy-saving buildings in year i, and Qi2 is the electricity
consumption in year i.
b. Economic benefits of material saving
In comparison, the indoor climate is controlled by ventilation system in the
Passive House. As a result, the equipment and materials needed are reduced
during the construction stage, also the building area is increased due to the
reduction in cooling, humification and heating equipment, such as air
conditioning. The reduction in material and equipment is considered to be the
economic benefits in the construction stage, which is Sreduce.
During the operation stage, the Passive House chooses high-quality, high-
performance materials and equipment, such as thermal insulation materials with
21
high fire resistance, corrosion resistance, and sound absorption, and doors and
windows with good airtightness, durability, and sound insulation. In the long run,
the implementation of high-performance materials reduces the waste of
materials as well as the waste of energy due to the tear and wear of materials and
equipment. The economic benefit of using these high-performance materials is
denoted as Suse.
Therefore, the economic benefits of material saving are summarized as
following equation:
Sms = Sreduce + Suse (10)
c. Economic benefits of subsidies
With the increasing awareness of the importance of developing the Passive
House in recent years, the Chinese government is actively publishing various
incentive policies. In 2019, the State Council introduced a Passive House
incentive policy, which has been implemented in various places. In 2016, Hebei
Province introduced an incentive policy. For newly-built Passive House, the
reward is 10 yuan/m2, the Passive House renovation project is subsidized by 600
yuan/m2; at the same time, the reserve price of land sale enjoys a discount of
200,000 yuan per mu, as well as the priority for bidding. The benefits obtained
from the subsidies are denoted as Ssubsidies.
Above all, the economic benefits of the Passive House can be summarized as:
S1 = Ses + Sms + Ssubsidies (11)
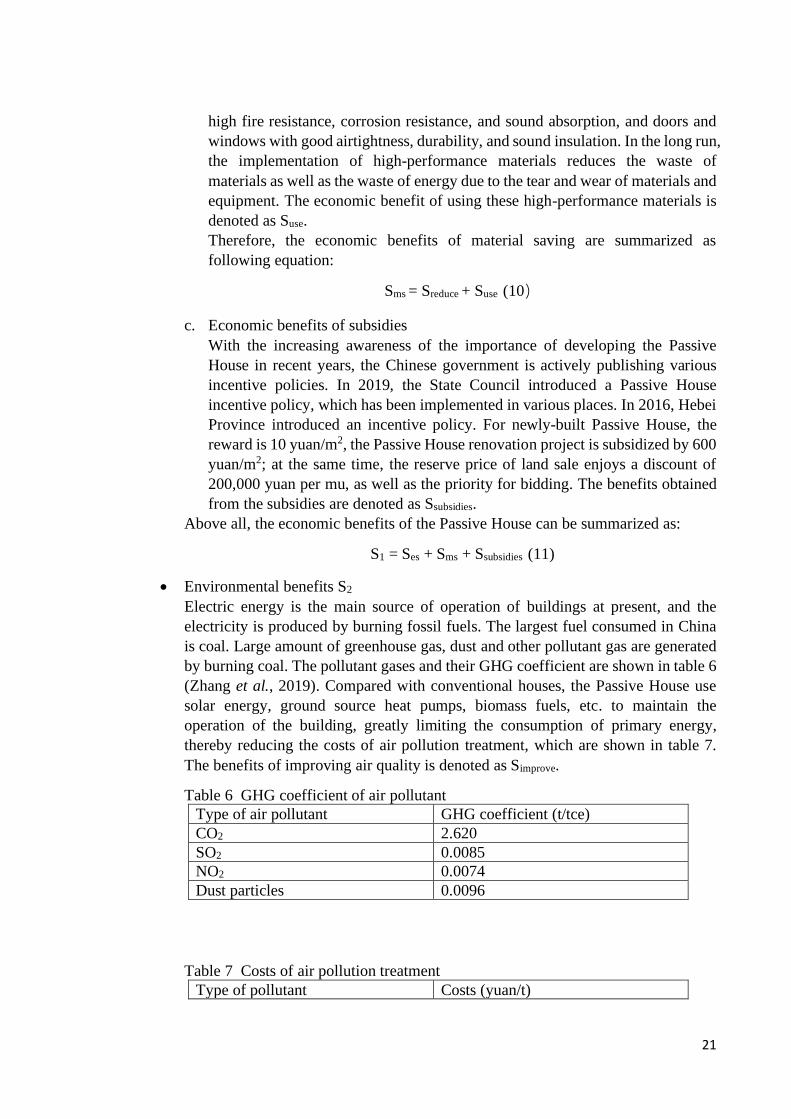
• Environmental benefits S2
Electric energy is the main source of operation of buildings at present, and the
electricity is produced by burning fossil fuels. The largest fuel consumed in China
is coal. Large amount of greenhouse gas, dust and other pollutant gas are generated
by burning coal. The pollutant gases and their GHG coefficient are shown in table 6
(Zhang et al., 2019). Compared with conventional houses, the Passive House use
solar energy, ground source heat pumps, biomass fuels, etc. to maintain the
operation of the building, greatly limiting the consumption of primary energy,
thereby reducing the costs of air pollution treatment, which are shown in table 7.
The benefits of improving air quality is denoted as Simprove.
Table 6 GHG coefficient of air pollutant
Type of air pollutant GHG coefficient (t/tce)
CO2 2.620
SO2 0.0085
NO2 0.0074
Dust particles 0.0096
Table 7 Costs of air pollution treatment
Type of pollutant Costs (yuan/t)

22
CO2 390
SO2 20000
NO2 632
Dust particles 275
For every unit (kW•h) of electricity produced, 0.0004 tons of coal are needed. So,
Simprove can be calculated as:
Simprove = ∆Q × 0.0004 × (2.620 × CCO2+ 0.0085 × CSO2
+ 0.0074 × CNO2+
0.0096 × CDust) (12)
Where ∆𝑄 is the annual electricity saved of the Passive House, 𝐶𝐶𝑂2, 𝐶𝑆𝑂2
, 𝐶𝑁𝑂2 and
𝐶𝐷𝑢𝑠𝑡 are treatment costs of CO2, SO2, NO2 and Dust particles namely.
• Social benefits S3
The construction and operation of a Passive House can benefit the society in many
aspects. For example, the widely use of the Passive House will stimulate the
development of energy-saving industries, which also accelerate the development of
new energy and the exploration and innovation of high-performance building
materials. The change in people’s life style and consciousness is also an impact of
the Passive House. However, the benefits of the impacts above is difficult to measure
quantitively. So, they are not considered in this research.
5.2 The model of increment benefit analysis
5.2.1 Parameter setting
• Life span for calculation (T)
When calculating the additional cost and increment benefit, the construction period
shall be based on the actual construction period of the project. In order to better
reflect the economic efficiency, the service life of conventional energy-saving
buildings is used as the operation period of the Passive House, that is, T = 50 years.
• Present value (PV)
Present value refers to the value of the future cash flow converted to a benchmark
point in time to reflect the potential value of the investment. The basis of the cost-
benefit analysis is that the time points at which the funds occur must be the same.
This research discounts the additional cost and increment benefit to the starting point
of life cycle, on which the comparison and analysis base.
• Discount rate (i)
To calculate the present value of future cash flow, the discount rate is necessary.
The discount rate used in this research is the social discount rate (SDR). The social
discount rate is the society’s estimate of the time value of capital, and is the standard
for the rate of return on capital investment required from the perspective of national
economy. In the national economic evaluation of projects, the social discount rate is
mainly used as the discount rate when calculating the net present value (Armitage,
2017).
As the discount rate between different time-values of project cost benefits, the social
discount rate reflects the time preference for social cost-effectiveness. To a certain
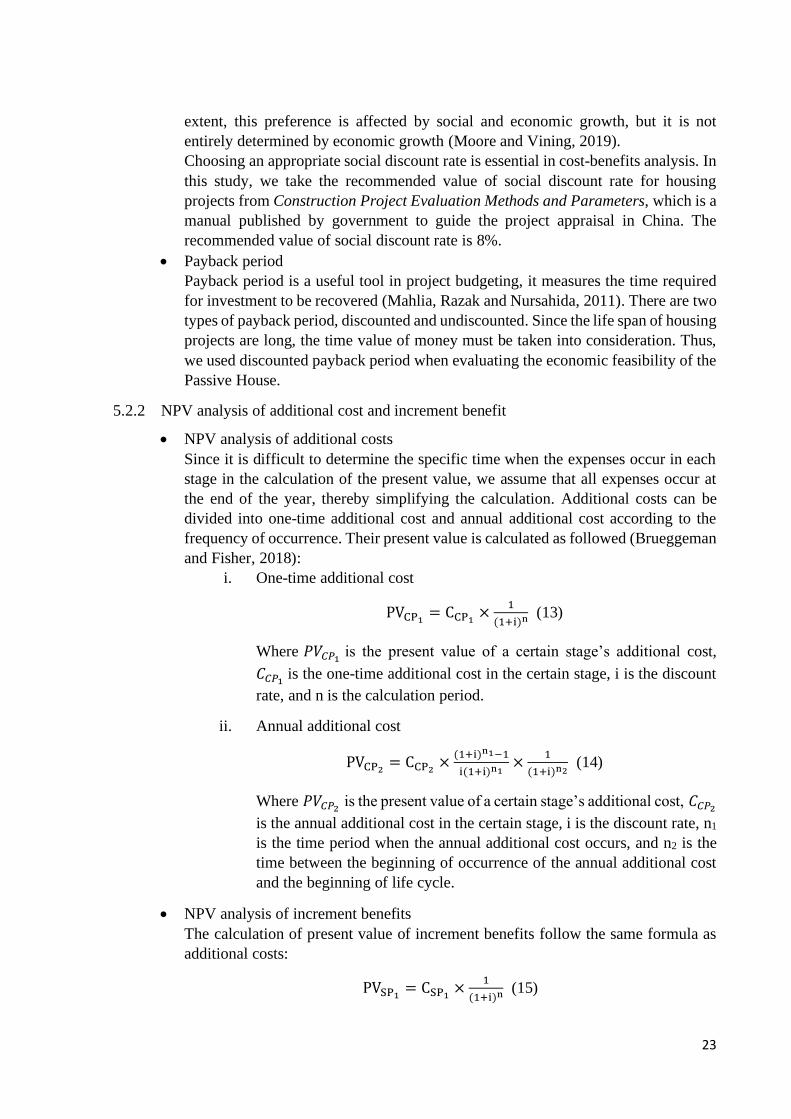
23
extent, this preference is affected by social and economic growth, but it is not
entirely determined by economic growth (Moore and Vining, 2019).
Choosing an appropriate social discount rate is essential in cost-benefits analysis. In
this study, we take the recommended value of social discount rate for housing
projects from Construction Project Evaluation Methods and Parameters, which is a
manual published by government to guide the project appraisal in China. The
recommended value of social discount rate is 8%.
• Payback period
Payback period is a useful tool in project budgeting, it measures the time required
for investment to be recovered (Mahlia, Razak and Nursahida, 2011). There are two
types of payback period, discounted and undiscounted. Since the life span of housing
projects are long, the time value of money must be taken into consideration. Thus,
we used discounted payback period when evaluating the economic feasibility of the
Passive House.
5.2.2 NPV analysis of additional cost and increment benefit
• NPV analysis of additional costs
Since it is difficult to determine the specific time when the expenses occur in each
stage in the calculation of the present value, we assume that all expenses occur at
the end of the year, thereby simplifying the calculation. Additional costs can be
divided into one-time additional cost and annual additional cost according to the
frequency of occurrence. Their present value is calculated as followed (Brueggeman
and Fisher, 2018):
i. One-time additional cost
PVCP1= CCP1
×1
(1+i)n (13)
Where 𝑃𝑉𝐶𝑃1 is the present value of a certain stage’s additional cost,
𝐶𝐶𝑃1 is the one-time additional cost in the certain stage, i is the discount
rate, and n is the calculation period.
ii. Annual additional cost
PVCP2= CCP2
×(1+i)n1−1
i(1+i)n1×
1
(1+i)n2 (14)
Where 𝑃𝑉𝐶𝑃2 is the present value of a certain stage’s additional cost, 𝐶𝐶𝑃2
is the annual additional cost in the certain stage, i is the discount rate, n1
is the time period when the annual additional cost occurs, and n2 is the
time between the beginning of occurrence of the annual additional cost
and the beginning of life cycle.
• NPV analysis of increment benefits
The calculation of present value of increment benefits follow the same formula as
additional costs:
PVSP1= CSP1
×1
(1+i)n (15)

24
Where 𝑃𝑉𝑆𝑃1 is the present value of a certain stage’s increment benefits, 𝐶𝑆𝑃1
is the
one-time increment benefits in the certain stage.
PVSP2= CSP2
×(1+i)n1−1
i(1+i)n1×
1
(1+i)n2 (16)
Where 𝑃𝑉𝑆𝑃2 is the present value of a certain stage’s increment benefits, 𝐶𝑆𝑃2
is the
annual increment benefits in the certain stage.
5.3 Case study
5.3.1 Project overview
This research chooses a Passive House project in Hebei to conduct a case study. This project is
located in Songlindian, Zhuozhou City, Hebei Province, and location belongs to cold area where
the average temperature in coldest month ranges from -10 ℃ to 0 ℃. The total construction
area of the project is 5796.92 m2, of which the office building and the apartment building
accounts for 3934.88 m2 and 1862.04 m2 each. The structure is the steel frame, using reinforced
concrete as load bearing structure, and filled with aerated concrete blocks. Construction started
in August 2013, completed and put into use in March 2015.
5.3.2 Calculation of the additional cost
After collecting the relevant data, the additional cost and increment benefit of the project are
measured in accordance with national standards and policy requirements. The reference object
to compare with the Passive House is the conventional energy-saving buildings built in similar
period in the area.
• Additional costs in planning stage
By comparing the additional cost of the planning stage from the two aspects of the
preliminary survey and consultation costs, it is found that the preliminary survey cost
of the project does not increase compared with the conventional energy-saving buildings.
While the consultation cost 80,000 yuan more. The additional cost of the planning stage
is:
C1 = Csurvey + Cconsulting = 80,000
• Additional costs in design stage
The design of the Passive House is the key to the energy efficiency of the building.
Therefore, the design cost of the Passive House is higher. Compared with the
conventional energy-saving buildings, the increased design cost of this project is 2.5
yuan/m2. Consulting the relevant professional, the simulation expense is 2 yuan/m2. The
certification cost of the Passive House includes three parts: the registration fee is 1,000
yuan, the icon design fee is 90,000 yuan, and the operation icon fee is 200,000 yuan, for
a total cost of 300,000 yuan. The additional costs in design stage are summarized in
table 8.
Table 8 The additional costs in design stage
Additional cost per
m2 (yuan/m2)
Area (m2) Additional cost
(yuan)
Design cost 2.5 5796.92 14,492
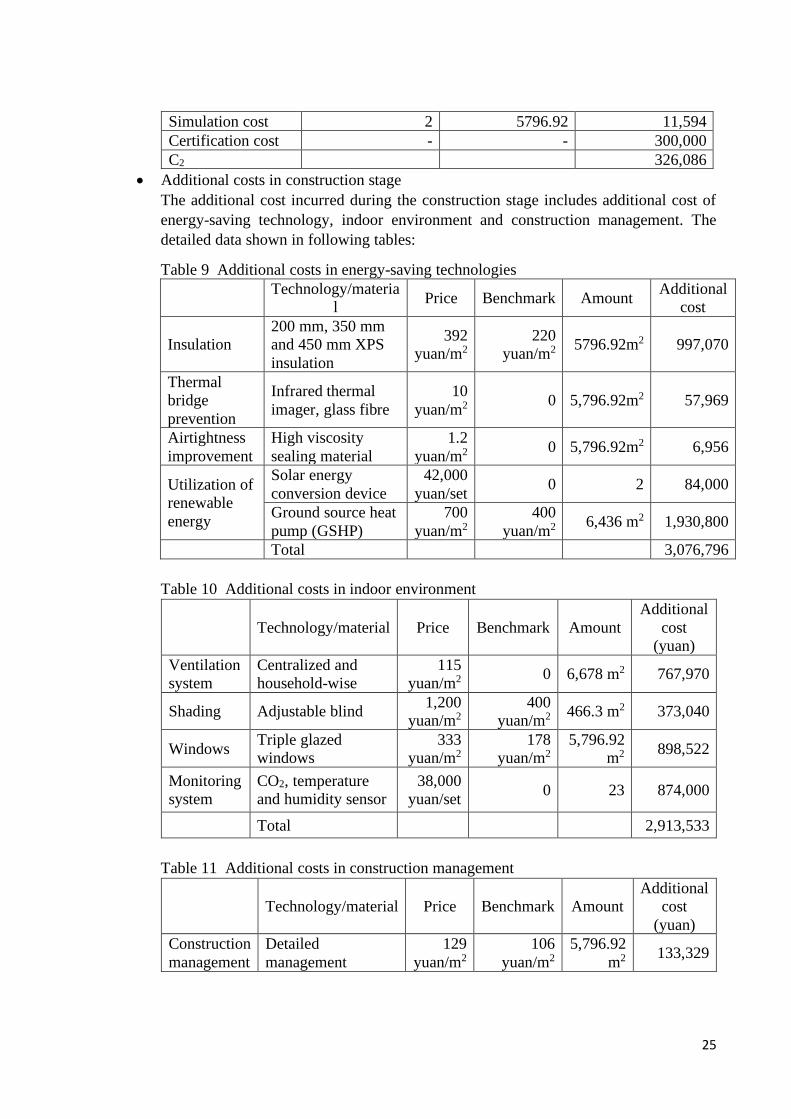
25
Simulation cost 2 5796.92 11,594
Certification cost - - 300,000
C2 326,086
• Additional costs in construction stage
The additional cost incurred during the construction stage includes additional cost of
energy-saving technology, indoor environment and construction management. The
detailed data shown in following tables:
Table 9 Additional costs in energy-saving technologies
Technology/materia
l Price Benchmark Amount
Additional
cost
Insulation
200 mm, 350 mm
and 450 mm XPS
insulation
392
yuan/m2
220
yuan/m2 5796.92m2 997,070
Thermal
bridge
prevention
Infrared thermal
imager, glass fibre
10
yuan/m2 0 5,796.92m2 57,969
Airtightness
improvement
High viscosity
sealing material
1.2
yuan/m2 0 5,796.92m2 6,956
Utilization of
renewable
energy
Solar energy
conversion device
42,000
yuan/set 0 2 84,000
Ground source heat
pump (GSHP)
700
yuan/m2
400
yuan/m2 6,436 m2 1,930,800
Total 3,076,796
Table 10 Additional costs in indoor environment
Technology/material Price Benchmark Amount
Additional
cost
(yuan)
Ventilation
system
Centralized and
household-wise
115
yuan/m2 0 6,678 m2 767,970
Shading Adjustable blind 1,200
yuan/m2
400
yuan/m2 466.3 m2 373,040
Windows Triple glazed
windows
333
yuan/m2
178
yuan/m2
5,796.92
m2 898,522
Monitoring
system
CO2, temperature
and humidity sensor
38,000
yuan/set 0 23 874,000
Total 2,913,533
Table 11 Additional costs in construction management
Technology/material Price Benchmark Amount
Additional
cost
(yuan)
Construction
management
Detailed
management
129
yuan/m2
106
yuan/m2
5,796.92
m2 133,329
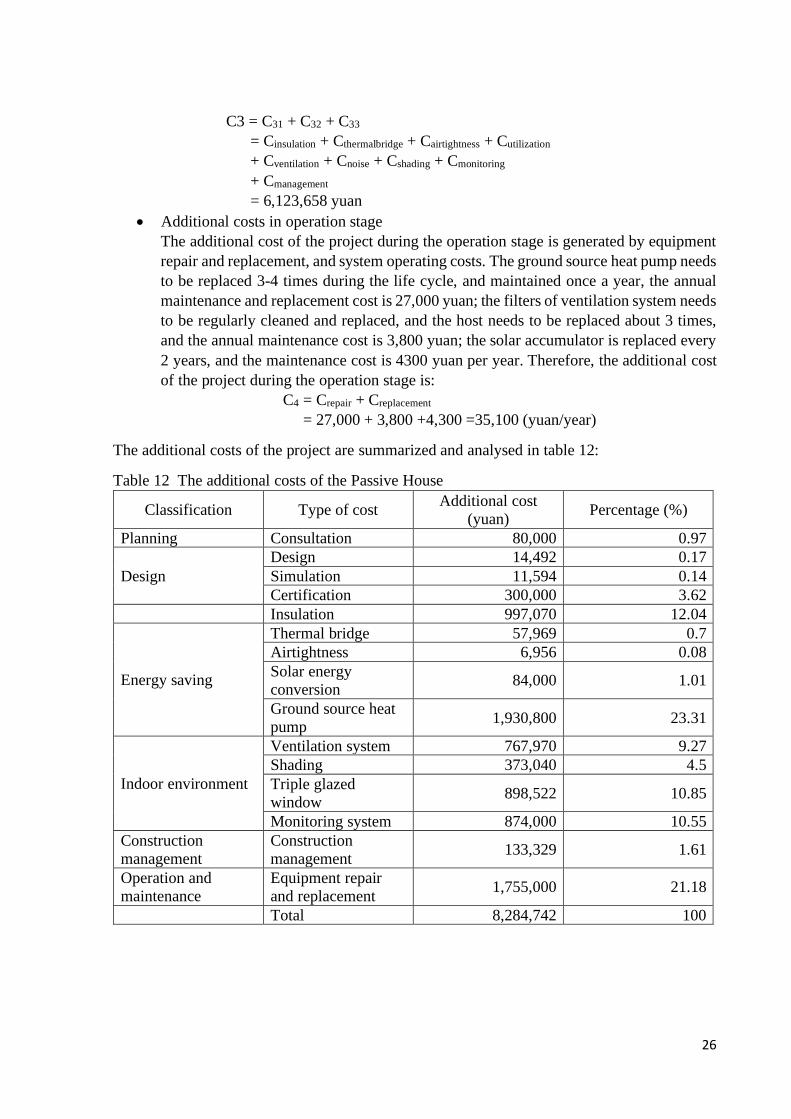
26
C3 = C31 + C32 + C33
= Cinsulation + Cthermalbridge + Cairtightness + Cutilization
+ Cventilation + Cnoise + Cshading + Cmonitoring
+ Cmanagement
= 6,123,658 yuan
• Additional costs in operation stage
The additional cost of the project during the operation stage is generated by equipment
repair and replacement, and system operating costs. The ground source heat pump needs
to be replaced 3-4 times during the life cycle, and maintained once a year, the annual
maintenance and replacement cost is 27,000 yuan; the filters of ventilation system needs
to be regularly cleaned and replaced, and the host needs to be replaced about 3 times,
and the annual maintenance cost is 3,800 yuan; the solar accumulator is replaced every
2 years, and the maintenance cost is 4300 yuan per year. Therefore, the additional cost
of the project during the operation stage is:
C4 = Crepair + Creplacement
= 27,000 + 3,800 +4,300 =35,100 (yuan/year)
The additional costs of the project are summarized and analysed in table 12:
Table 12 The additional costs of the Passive House
Classification Type of cost Additional cost
(yuan) Percentage (%)
Planning Consultation 80,000 0.97
Design
Design 14,492 0.17
Simulation 11,594 0.14
Certification 300,000 3.62
Insulation 997,070 12.04
Energy saving
Thermal bridge 57,969 0.7
Airtightness 6,956 0.08
Solar energy
conversion 84,000 1.01
Ground source heat
pump 1,930,800 23.31
Indoor environment
Ventilation system 767,970 9.27
Shading 373,040 4.5
Triple glazed
window 898,522 10.85
Monitoring system 874,000 10.55
Construction
management
Construction
management 133,329 1.61
Operation and
maintenance
Equipment repair
and replacement 1,755,000 21.18
Total 8,284,742 100

27
5.3.3 Calculation of the increment benefit
• Economic benefits
a. Increment benefits of energy saving
This project decreases the annual energy consumption by 92% compared to the
conventional energy-saving buildings. Therefore, 127.25 kWh/m2a of electricity is
saved in this project, the price of electricity is 0.8 yuan/kWh. The increment benefit
of energy saving is:
𝑆𝑒𝑠 = ∑ 𝑐𝑖
𝑛
𝑖=1
× (𝑄𝑖1 − 𝑄𝑖2) = 127.25 × 5,796.92 × 0.8
= 590,126.456 (yuan/year)
b. Increment benefits of material saving
The benefit of materials saving is reflected in the reduction of heating,
humidification and dust removal equipment during the construction stage, the
reduction of a small amount of decorative materials, and reduced waste of materials.
Since this part of the increment benefit calculation is complex, according to
experience, the cost of materials accounts for 40% to 80% of the total investment,
and the economic benefit of material saving is generally 4.5% of the material cost.
It is known that the total investment cost of the project is 48 million yuan. Therefore,
the comprehensive economic benefits of material saving are:
Sms = 48,000,000 × 0.6 × 0.045 =1,296,000 yuan
• Environmental benefits
The reduction of CO2 emission is the most direct benefit that the Passive House brings
to the environment. According to the evaluation by professional, compared to the
conventional energy-saving buildings, the coal consumption per square meter is reduced
by 34.8kg/m2, the building area is 5796.92 m2. The environmental benefits can be
calculated with previous formula:
𝑆𝑖𝑚𝑝𝑟𝑜𝑣𝑒 = 34.8 × 5,796.92 ÷ 1,000 × (2.620 × 𝐶𝐶𝑂2+ 0.0085 × 𝐶𝑆𝑂2
+
0.0074 × 𝐶𝑁𝑂2+ 0.0096 × 𝐶𝐷𝑢𝑠𝑡)
= 201.733 × (1,021.8 + 170 + 4.6768 + 2.64)
= 262,313 (𝑦𝑢𝑎𝑛)
The overall increment benefits of this project are summarized in table 13:
Table 13 The increment benefit of the Passive House
Classification Type of benefit Increment benefits
(yuan/year) Percentage (%)
Economic benefits Energy saving 590,126 62.33
Material saving 25,920 2.74
Environmental
benefits
Air quality
improvement 262,313 27.71
Total 946,752 100
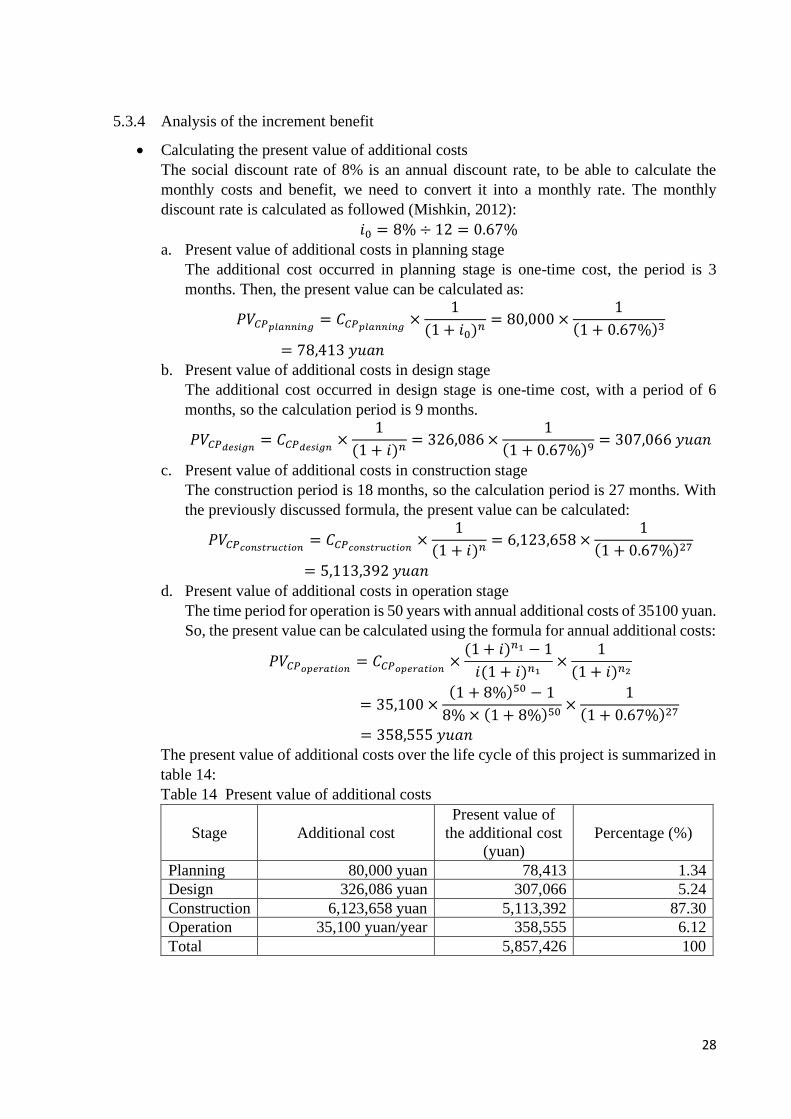
28
5.3.4 Analysis of the increment benefit
• Calculating the present value of additional costs
The social discount rate of 8% is an annual discount rate, to be able to calculate the
monthly costs and benefit, we need to convert it into a monthly rate. The monthly
discount rate is calculated as followed (Mishkin, 2012):
𝑖0 = 8% ÷ 12 = 0.67%
a. Present value of additional costs in planning stage
The additional cost occurred in planning stage is one-time cost, the period is 3
months. Then, the present value can be calculated as:
𝑃𝑉𝐶𝑃𝑝𝑙𝑎𝑛𝑛𝑖𝑛𝑔= 𝐶𝐶𝑃𝑝𝑙𝑎𝑛𝑛𝑖𝑛𝑔
×1
(1 + 𝑖0)𝑛= 80,000 ×
1
(1 + 0.67%)3
= 78,413 𝑦𝑢𝑎𝑛
b. Present value of additional costs in design stage
The additional cost occurred in design stage is one-time cost, with a period of 6
months, so the calculation period is 9 months.
𝑃𝑉𝐶𝑃𝑑𝑒𝑠𝑖𝑔𝑛= 𝐶𝐶𝑃𝑑𝑒𝑠𝑖𝑔𝑛
×1
(1 + 𝑖)𝑛= 326,086 ×
1
(1 + 0.67%)9= 307,066 𝑦𝑢𝑎𝑛
c. Present value of additional costs in construction stage
The construction period is 18 months, so the calculation period is 27 months. With
the previously discussed formula, the present value can be calculated:
𝑃𝑉𝐶𝑃𝑐𝑜𝑛𝑠𝑡𝑟𝑢𝑐𝑡𝑖𝑜𝑛= 𝐶𝐶𝑃𝑐𝑜𝑛𝑠𝑡𝑟𝑢𝑐𝑡𝑖𝑜𝑛
×1
(1 + 𝑖)𝑛= 6,123,658 ×
1
(1 + 0.67%)27
= 5,113,392 𝑦𝑢𝑎𝑛
d. Present value of additional costs in operation stage
The time period for operation is 50 years with annual additional costs of 35100 yuan.
So, the present value can be calculated using the formula for annual additional costs:
𝑃𝑉𝐶𝑃𝑜𝑝𝑒𝑟𝑎𝑡𝑖𝑜𝑛= 𝐶𝐶𝑃𝑜𝑝𝑒𝑟𝑎𝑡𝑖𝑜𝑛
×(1 + 𝑖)𝑛1 − 1
𝑖(1 + 𝑖)𝑛1×
1
(1 + 𝑖)𝑛2
= 35,100 ×(1 + 8%)50 − 1
8% × (1 + 8%)50×
1
(1 + 0.67%)27
= 358,555 𝑦𝑢𝑎𝑛
The present value of additional costs over the life cycle of this project is summarized in
table 14:
Table 14 Present value of additional costs
Stage Additional cost
Present value of
the additional cost
(yuan)
Percentage (%)
Planning 80,000 yuan 78,413 1.34
Design 326,086 yuan 307,066 5.24
Construction 6,123,658 yuan 5,113,392 87.30
Operation 35,100 yuan/year 358,555 6.12
Total 5,857,426 100

29
• Calculating the present value of increment benefits
a. Present value of increment benefits in construction stage
The expenses saved in material are one-time increment benefits, the present value
can be calculated as:
𝑃𝑉𝑆𝑃𝑐𝑜𝑛𝑠𝑡𝑟𝑢𝑐𝑡𝑖𝑜𝑛= 𝐶𝐶𝑃𝑐𝑜𝑛𝑠𝑡𝑟𝑢𝑐𝑡𝑖𝑜𝑛
×1
(1 + 𝑖)𝑛= 1,296,000 ×
1
(1 + 0.67%)27
= 1,082,189 𝑦𝑢𝑎𝑛
b. Present value of increment benefits in operation stage
The economic, environmental and social benefits are generated during operation
stage, which lasts for 50 years. So, the present value is computed as:
𝑃𝑉𝑆𝑃𝑜𝑝𝑒𝑟𝑎𝑡𝑖𝑜𝑛= 𝐶𝑆𝑃𝑜𝑝𝑒𝑟𝑎𝑡𝑖𝑜𝑛
×(1 + 𝑖)𝑛1 − 1
𝑖(1 + 𝑖)𝑛1×
1
(1 + 𝑖)𝑛2
= 920,832 ×(1 + 8%)50 − 1
8% × (1 + 8%)50×
1
(1 + 0.67%)27
= 9,406,512 yuan
The present value of increment benefits over the life cycle of this project is summarized
in table 15:
Table 15 Present value of increment benefits
Stage Increment benefits
Present value of
the additional cost
(yuan)
Percentage (%)
Construction 1,296,000 yuan 1,082,189 10.06
Operation 946,752 yuan/year 9,406,512 89.94
Total 10,488,701 100
• Payback period analysis
Through all the calculation above, we know that the present value of additional costs
and increment benefits is 5,857,426 and 10,488,701 yuan namely. Apparently, the
increment benefit is larger than the additional cost. However, the payback period should
not be too long, otherwise it would not be considered as efficient.
Since the additional costs mostly occur in construction period, we regarded them as a
one-time investment in the beginning by discounting all the additional costs. Assuming
that the benefits generated from construction period happen at the end of construction,
which is also the start of operation, we started to discount the increment benefits from
Year 2.4. The increment benefits analysis is summarized in table 16.
Table 16 Payback period analysis
Year Additional cost/Annual increment benefit Balance of additional costs
0 -¥5,857,426.00 -¥5,857,426.00
2.4 ¥1,082,189.08 -¥4,775,236.92
3.4 ¥709,704.78 -¥4,065,532.14
4.4 ¥655,053.70 -¥3,410,478.44
5.4 ¥604,611.05 -¥2,805,867.39
6.4 ¥558,052.76 -¥2,247,814.63
7.4 ¥515,079.70 -¥1,732,734.93

30
8.4 ¥475,415.80 -¥1,257,319.13
9.4 ¥438,806.23 -¥818,512.90
10.4 ¥405,015.80 -¥413,497.10
11.4 ¥373,827.41 -¥39,669.70
12.4 ¥345,040.69 ¥305,371.00
Figure 3 Payback period of the project (i=8%)
At the end of Year 12.4, the balance of additional costs turns to positive, which means
the extra investment will be recovered by then. By calculating the time when the balance
is 0, we know that the payback period is approximated 11.5 year, which is 9 years after
the Passive House start operating. The payback period is shorter than most cases in
previous literature. Therefore, this project can be considered as cost efficient and
economically viable.
6 Discussion
6.1 The potential costs saving in the future
In the analysis of additional costs, it is found that the construction stage accounts for about 87%
of the extra investment, among which the costs of insulation, ground source heat pump,
equipment maintenance are the most expensive. The high expenses of Passive House materials
and technologies are basically due to the underdeveloped market. China has just started to
explore the way to developing the Passive House in recent year, so some of the technologies
and materials are still dependent on importing, which resulted in the high costs of construction.
But the price can be expected to decrease if the Passive House is widely implemented in China
in the future.
The project selected for the case study is located in north of China, where the climate is cold in
winter and hot in summer. So, the energy demand is higher in this project. If the Passive House
is built in southern area, like along Yangtze River, where the winter is not very cold but need
heating, in this case, the costs of ground source heating may be saved, while the costs of
dehumidification would rise. The design strategies of the Passive House should change with
different climate. Therefore, more real Passive House project in different location needs to be
investigated to create a broader understanding of the viability of the Passive House.
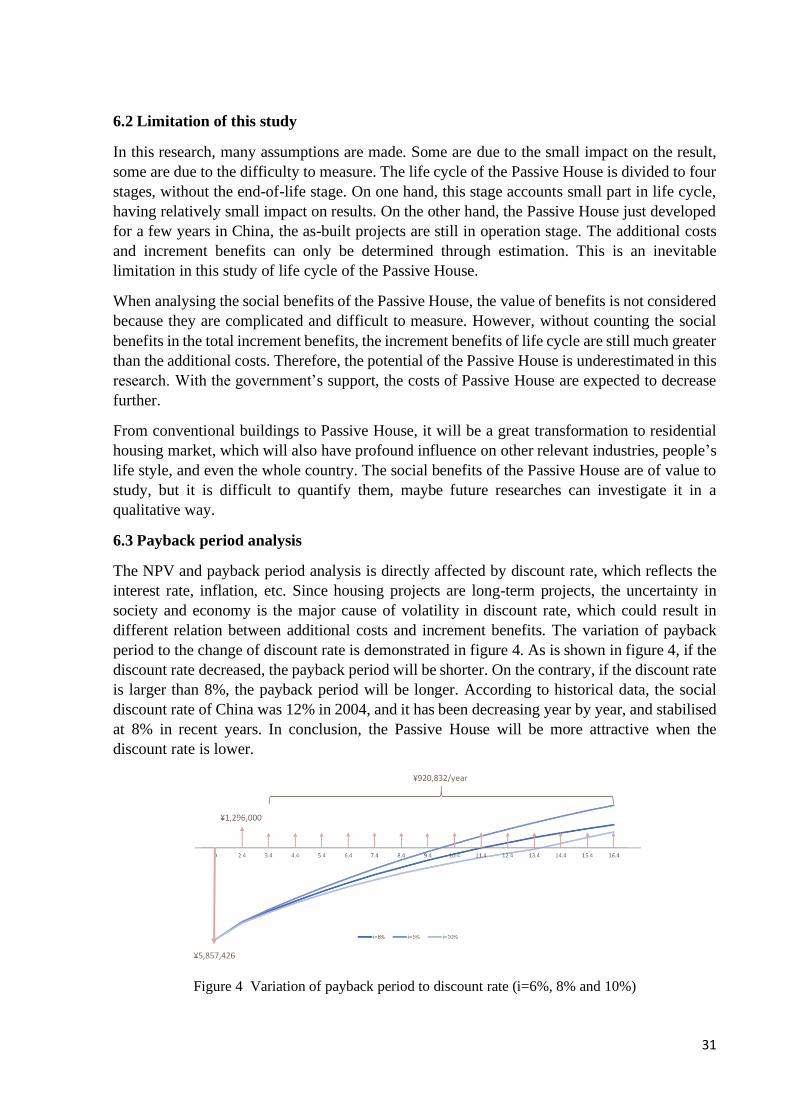
31
6.2 Limitation of this study
In this research, many assumptions are made. Some are due to the small impact on the result,
some are due to the difficulty to measure. The life cycle of the Passive House is divided to four
stages, without the end-of-life stage. On one hand, this stage accounts small part in life cycle,
having relatively small impact on results. On the other hand, the Passive House just developed
for a few years in China, the as-built projects are still in operation stage. The additional costs
and increment benefits can only be determined through estimation. This is an inevitable
limitation in this study of life cycle of the Passive House.
When analysing the social benefits of the Passive House, the value of benefits is not considered
because they are complicated and difficult to measure. However, without counting the social
benefits in the total increment benefits, the increment benefits of life cycle are still much greater
than the additional costs. Therefore, the potential of the Passive House is underestimated in this
research. With the government’s support, the costs of Passive House are expected to decrease
further.
From conventional buildings to Passive House, it will be a great transformation to residential
housing market, which will also have profound influence on other relevant industries, people’s
life style, and even the whole country. The social benefits of the Passive House are of value to
study, but it is difficult to quantify them, maybe future researches can investigate it in a
qualitative way.
6.3 Payback period analysis
The NPV and payback period analysis is directly affected by discount rate, which reflects the
interest rate, inflation, etc. Since housing projects are long-term projects, the uncertainty in
society and economy is the major cause of volatility in discount rate, which could result in
different relation between additional costs and increment benefits. The variation of payback
period to the change of discount rate is demonstrated in figure 4. As is shown in figure 4, if the
discount rate decreased, the payback period will be shorter. On the contrary, if the discount rate
is larger than 8%, the payback period will be longer. According to historical data, the social
discount rate of China was 12% in 2004, and it has been decreasing year by year, and stabilised
at 8% in recent years. In conclusion, the Passive House will be more attractive when the
discount rate is lower.
Figure 4 Variation of payback period to discount rate (i=6%, 8% and 10%)
32
On the other hand, energy price also has great impact on the economic viability because energy
saving accounts for the largest part of the benefits of the Passive House. As previous studies
indicated, the Passive House is more attractive when the interest rate is low and energy price is
increasing (Badea et al., 2014; D. Dan et al., 2016). To further understand how the volatility in
energy price and discount rate affect the economic feasibility, sensitivity analysis is needed
regarding the cost efficiency of the Passive House.
7 Conclusion
This research bases on the life cycle theory, dividing the life cycle of a Passive House to four
stages. The additional costs and increment benefits are identified in detail through the life cycle.
In case study, the costs and benefits were estimated according to China’s regulations, standards
and policies. On the basis of the calculation, the corresponding evaluation indicators and model
are established, which can be used to evaluate the economic feasibility in a comprehensive and
reliable way.
After all the theoretical discussions, the evaluation model is implemented on an as-built Passive
House project. The increment benefits are about twice of the additional costs, which means the
benefits generated from operation is larger than extra investment. The payback period is about
12 years, which is shorter than payback periods indicated in other researches. The NPV and
payback period analysis clearly shows that the Passive House not only improve the quality of
life, but also has positive impact on economy, environment and society. The most important is,
the Passive House is economically feasible from the perspective of investment. The evaluation
model proposed in this thesis could be a useful tool for developers and consumers to understand
the benefit of the Passive House.
Through the analysis, it’s clear that the Passive House requires large investment in early stage
compared to conventional building. It starts to generate extra benefits from the beginning of
operation stage. Not only can the extra investment costs be recovered, also additional benefits
are generated from many aspects.

33
Reference
Aksoy, U. T. (2012) ‘A numerical analysis for energy savings of different oriented and
insulated walls in the cold climate of Turkey - Simulation-based study’, Energy and
Buildings. Elsevier B.V., 50, pp. 243–250. doi: 10.1016/j.enbuild.2012.03.050.
ALTING and L. (1993) ‘Life-Cycle Design of Products : A New Opportunity for
Manufacturing Enterprises’, Concurrent Engineering. John Wiley & Sons, pp. 1–17.
Anisimova, N. (2011) ‘The capability to reduce primary energy demand in EU housing’,
Energy and Buildings. Elsevier B.V., 43(10), pp. 2747–2751. doi:
10.1016/j.enbuild.2011.06.029.
Armitage, S. (2017) ‘Discount rates for long-term projects: the cost of capital and social
discount rate compared’, European Journal of Finance. Routledge, 23(1), pp. 60–79. doi:
10.1080/1351847X.2015.1029591.
Audenaert, A., De Boeck, L. and Roelants, K. (2010) ‘Economic analysis of the profitability
of energy-saving architectural measures for the achievement of the EPB-standard’, Energy.
Elsevier Ltd, 35(7), pp. 2965–2971. doi: 10.1016/j.energy.2010.03.031.
Audenaert, A., De Cleyn, S. H. and Vankerckhove, B. (2008) ‘Economic analysis of passive
houses and low-energy houses compared with standard houses’, Energy Policy, 36(1), pp. 47–
55. doi: 10.1016/j.enpol.2007.09.022.
Badea, A. et al. (2014) ‘A life-cycle cost analysis of the passive house “pOLITEHNICA”
from Bucharest’, Energy and Buildings. Elsevier Ltd, 80, pp. 542–555.
Badescu, V. (2007) ‘Economic aspects of using ground thermal energy for passive house
heating’, Renewable Energy, 32(6), pp. 895–903. doi: 10.1016/j.renene.2006.04.006.
Banfi, S. et al. (2008) ‘Willingness to pay for energy-saving measures in residential
buildings’, Energy Economics, 30(2), pp. 503–516. doi: 10.1016/j.eneco.2006.06.001.
Bastian, Zeno; Arnautu, Dragos; Schneieders, Dr. Jurgen; KaufmannDr. Berthold; Mikeska,
Tomas; Peper, Søren; Radeva, G. ; (2018) ‘Building Certification Guide’, p. 75.
Beijing Municipal Bureau of Ecology and Environment (2012). Available at:
http://sthjj.beijing.gov.cn/ (Accessed: 2 May 2020).
Brueggeman, W. B. and Fisher, J. D. (2018) Real estate finance and investments.
Citherlet, S. and Defaux, T. (2007) ‘Energy and environmental comparison of three variants
of a family house during its whole life span’, Building and Environment, 42(2), pp. 591–598.
doi: 10.1016/j.buildenv.2005.09.025.
Dahlstrøm, O. et al. (2012) ‘Life cycle assessment of a single-family residence built to either
conventional- or passive house standard’, Energy & Buildings. Elsevier B.V., 54, pp. 470–
479. doi: 10.1016/j.enbuild.2012.07.029.
Dan, D et al. (2016) ‘Energy for Sustainable Development Passive house design — An ef fi
cient solution for residential buildings in Romania’, Energy for Sustainable Development.
International Energy Initiative, 32, pp. 99–109. doi: 10.1016/j.esd.2016.03.007.
Dan, D. et al. (2016) ‘Passive house design-An efficient solution for residential buildings in

34
Romania’, Energy for Sustainable Development. Elsevier B.V., 32, pp. 99–109. doi:
10.1016/j.esd.2016.03.007.
Dodoo, A. et al. (2019) Strategies for energy and resource efficient building systems
Strategies for energy and resource efficient building systems.
Dodoo, A., Gustavsson, L. and Sathre, R. (2010) ‘Resources , Conservation and Recycling
Life cycle primary energy implication of retrofitting a wood-framed apartment building to
passive house standard’, ‘Resources, Conservation & Recycling’. Elsevier B.V., 54(12), pp.
1152–1160. doi: 10.1016/j.resconrec.2010.03.010.
Dokka, T. and Andresen, I. (2006) ‘Passive Houses in Cold Norwegian Climate’, 10th
International Passive House Conference, pp. 1–6. Available at:
papers2://publication/uuid/26F46CAC-21E7-4C9F-B14C-2261302180DE.
Dorer, V., Haas, A. and Feist, W. (2005) ‘Re-inventing air heating : Convenient and
comfortable within the frame of the Passive House concept’, 37, pp. 1186–1203. doi:
10.1016/j.enbuild.2005.06.020.
Ekström, T., Bernardo, R. and Blomsterberg, Å. (2018) ‘Cost-effective passive house
renovation packages for Swedish single-family houses from the 1960s and 1970s’, Energy
and Buildings. Elsevier B.V., 161, pp. 89–102. doi: 10.1016/j.enbuild.2017.12.018.
Fabrycky, W. and Blanchard, B. (1991) ‘Life-cycle cost and economic analysis’. Available at:
http://www.academia.edu/download/50837572/life-cycle-cost-and-economic-analysis-wolter-
j-fabrycky-benjamin-s-blanchard-15360.pdf (Accessed: 11 April 2020).
Feist, W. et al. (2005) Climate Neutral Passive House Estate in Hannover-Kronsberg:
Construction and Measurement Results. Available at: www.proKlima-hannover.de
(Accessed: 10 May 2020).
Galvin, R. (2014) ‘Are passive houses economically viable? A reality-based, subjectivist
approach to cost-benefit analyses’, Energy and Buildings. Elsevier B.V., 80, pp. 149–157.
doi: 10.1016/j.enbuild.2014.05.025.
Georges, L. et al. (2012) ‘Environmental and economic performance of heating systems for
energy-efficient dwellings: Case of passive and low-energy single-family houses’, Energy
Policy. Elsevier, 40(1), pp. 452–464. doi: 10.1016/j.enpol.2011.10.037.
Hertwich, E. G. (2005) ‘Life cycle approaches to sustainable consumption: A critical review’,
Environmental Science and Technology, 39(13), pp. 4673–4684. doi: 10.1021/es0497375.
Huo, T. et al. (2018) ‘China’s energy consumption in the building sector: A Statistical
Yearbook-Energy Balance Sheet based splitting method’, Journal of Cleaner Production.
Elsevier Ltd, 185, pp. 665–679. doi: 10.1016/j.jclepro.2018.02.283.
Hyland, M., Lyons, R. C. and Lyons, S. (2013) ‘The value of domestic building energy
efficiency - evidence from Ireland’, Energy Economics. Elsevier B.V., 40, pp. 943–952. doi:
10.1016/j.eneco.2013.07.020.
Janson, U. (2010) Passive houses in Sweden From design to evaluation of four demonstration
projects.
Kirkpatrick, C. H. and Weiss, J. (1996) Cost-benefit analysis and project appraisal in

35
developing countries. Available at: https://books.google.se/books?hl=zh-
CN&lr=&id=HQH8KPoM30EC&oi=fnd&pg=PR7&dq=cost+benefit+analysis+project&ots=
NK7NQ0CdkY&sig=ktl-mF4q6Ote84vHxxUN5_MMxXA&redir_esc=y#v=onepage&q=cost
benefit analysis project&f=false (Accessed: 20 May 2020).
Kiss, B. (2016) ‘Exploring transaction costs in passive house-oriented retrofitting’, Journal of
Cleaner Production. Elsevier Ltd, 123, pp. 65–76. doi: 10.1016/j.jclepro.2015.09.035.
Koroneos, C. and Kottas, G. (2007) ‘Energy consumption modeling analysis and
environmental impact assessment of model house in Thessaloniki-Greece’, Building and
Environment, 42(1), pp. 122–138. doi: 10.1016/j.buildenv.2005.08.009.
Liang, X. et al. (2017) ‘Comparison of building performance between Conventional House
and Passive House in the UK’, in Energy Procedia. Elsevier Ltd, pp. 1823–1828. doi:
10.1016/j.egypro.2017.12.570.
Mahlia, T. M. I., Razak, H. A. and Nursahida, M. A. (2011) ‘Life cycle cost analysis and
payback period of lighting retrofit at the University of Malaya’, Renewable and Sustainable
Energy Reviews. Elsevier Ltd, pp. 1125–1132. doi: 10.1016/j.rser.2010.10.014.
Miller, W., Buys, L. and Bell, J. (2012) ‘Performance evaluation of eight contemporary
passive solar homes in subtropical Australia’, Building and Environment. Pergamon, 56, pp.
57–68. doi: 10.1016/j.buildenv.2012.02.023.
Mishkin (2012) The Economics of Money, Banking and Financial Markets,12th Edition by
Frederic S. Mishkin, Antimicrobial Agents and Chemotherapy. doi:
10.1017/CBO9781107415324.004.
Moore, M. and Vining, A. (2019) ‘The Social Rate of Time Preference and the Social
Discount Rate’, SSRN Electronic Journal. Elsevier BV. doi: 10.2139/ssrn.3297241.
Nguyen, J. L., Schwartz, J. and Dockery, D. W. (2014) ‘The relationship between indoor and
outdoor temperature, apparent temperature, relative humidity, and absolute humidity’, Indoor
Air, 24(1), pp. 103–112. doi: 10.1111/ina.12052.
Passive House Database (2019). Available at: https://passivehouse-
database.org/index.php?lang=en#s_509b852f9878b5dc8f01807a5d191ae6 (Accessed: 3 May
2020).
Passivhaus Institut (2019). Available at: https://passivehouse.com/ (Accessed: 2 May 2020).
Persson, M. L., Roos, A. and Wall, M. (2006) ‘Influence of window size on the energy
balance of low energy houses’, Energy and Buildings, 38(3), pp. 181–188. doi:
10.1016/j.enbuild.2005.05.006.
Ridley, I. et al. (2013) ‘The monitored performance of the first new London dwelling certified
to the Passive House standard’, Energy & Buildings. Elsevier B.V., 63, pp. 67–78. doi:
10.1016/j.enbuild.2013.03.052.
Saari, A. et al. (2012) ‘Financial viability of energy-efficiency measures in a new detached
house design in Finland’, Applied Energy. Elsevier Ltd, 92, pp. 76–83. doi:
10.1016/j.apenergy.2011.10.029.
Schnieders, J., Feist, W. and Rongen, L. (2015) ‘Passive Houses for different climate zones’,
36
Energy & Buildings. Elsevier B.V., 105, pp. 71–87. doi: 10.1016/j.enbuild.2015.07.032.
Schnieders, J. and Hermelink, A. (2006) ‘CEPHEUS results: Measurements and occupants’
satisfaction provide evidence for Passive Houses being an option for sustainable building’,
Energy Policy, 34(2 SPEC. ISS.), pp. 151–171. doi: 10.1016/j.enpol.2004.08.049.
Sherif, Y. S. and Kolarik, W. J. (1981) ‘Life cycle costing: Concept and practice’, Omega,
9(3), pp. 287–296. doi: 10.1016/0305-0483(81)90035-9.
Song, Q., Yin, B. and Yang, L. (2014) ‘Obstacles and countermeasures for the development
of passive architecture in China’, Construction Economy. Available at:
http://www.cnki.com.cn/Article/CJFDTotal-JZJJ201401002.htm (Accessed: 3 May 2020).
Stec, A. et al. (2017) ‘Evaluating the financial efficiency of energy and water saving
installations in passive house’, E3SWC, 22, p. 00168. doi: 10.1051/E3SCONF/20172200168.
Tokarik, M. S. and Richman, R. C. (2016) ‘Life cycle cost optimization of passive energy
efficiency improvements in a Toronto house’, Energy and Buildings. Elsevier B.V., 118, pp.
160–169. doi: 10.1016/j.enbuild.2016.02.015.
Utama, A. and Gheewala, S. H. (2008) ‘Life cycle energy of single landed houses in
Indonesia’, Energy and Buildings, 40(10), pp. 1911–1916. doi:
10.1016/j.enbuild.2008.04.017.
Val, D. V. and Stewart, M. G. (2005) ‘Decision analysis for deteriorating structures’,
Reliability Engineering and System Safety, 87(3), pp. 377–385. doi:
10.1016/j.ress.2004.06.006.
Wall, M. (2006) ‘Energy-efficient terrace houses in Sweden: Simulations and measurements’,
Energy and Buildings, 38(6), pp. 627–634. doi: 10.1016/j.enbuild.2005.10.005.
Wu, Y. and Gong, Y. (2014) ‘Research of Passive House energy saving potential in hot
summer & cold winter zones’, Building Energy & Environment, 33(3), pp. 35–37. Available
at: http://en.cnki.com.cn/Article_en/CJFDTotal-JZRK201403010.htm (Accessed: 3 May
2020).
Yin, R. K. (2009) ‘Case study research: Design and methods’, SAGA publications. Fourth
Edi.
Zhang, L. et al. (2019) A dataset of CO2 emission factors in UNFCCC Annex I countries from
1990 to 2016, Science Data Bank.
Zhang, Q. and Crooks, R. (2012) Toward an environmentally sustainable future : country
environmental analysis of the People’s Republic of China. Asian Development Bank.
Zhang, X. (2015) ‘Passive housing: The inevitable housing development trend’, Eco-city and
Green Building. Available at: http://en.cnki.com.cn/Article_en/CJFDTotal-
DNGN201501027.htm (Accessed: 3 May 2020).