Embed Size (px)
Citation preview
Evaluating Financial Institution Financial Condition
NCLGIA Summer Conference 2014
The NC Capital Management Trust
K. Lee CarterGary Porter
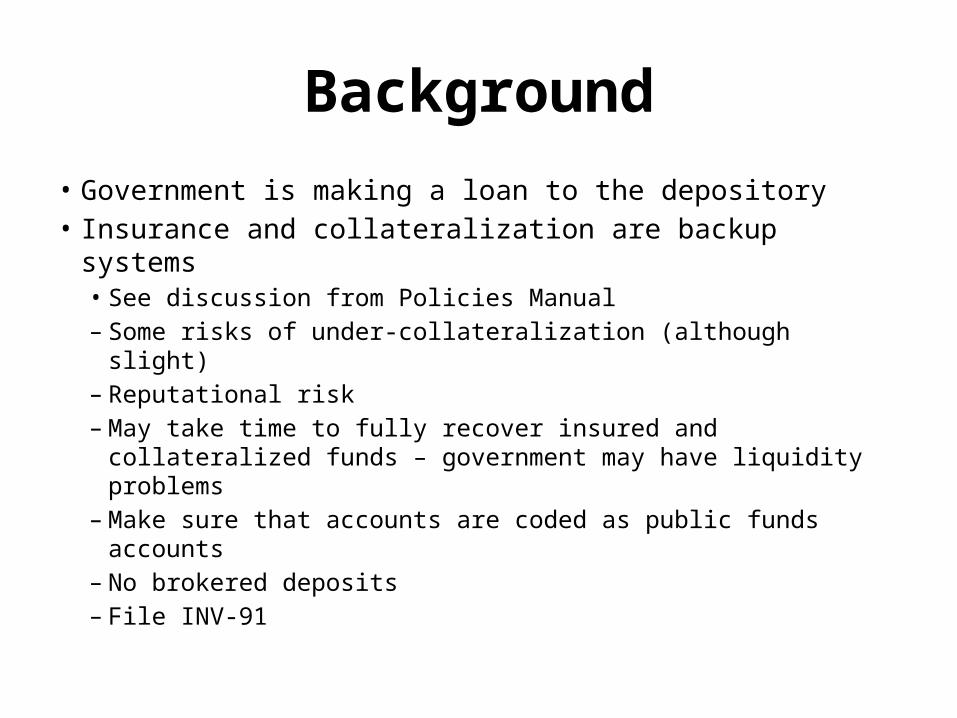
Background
• Government is making a loan to the depository• Insurance and collateralization are backup systems
• See discussion from Policies Manual– Some risks of under-collateralization (although slight)– Reputational risk – May take time to fully recover insured and collateralized
funds – government may have liquidity problems– Make sure that accounts are coded as public funds
accounts– No brokered deposits– File INV-91
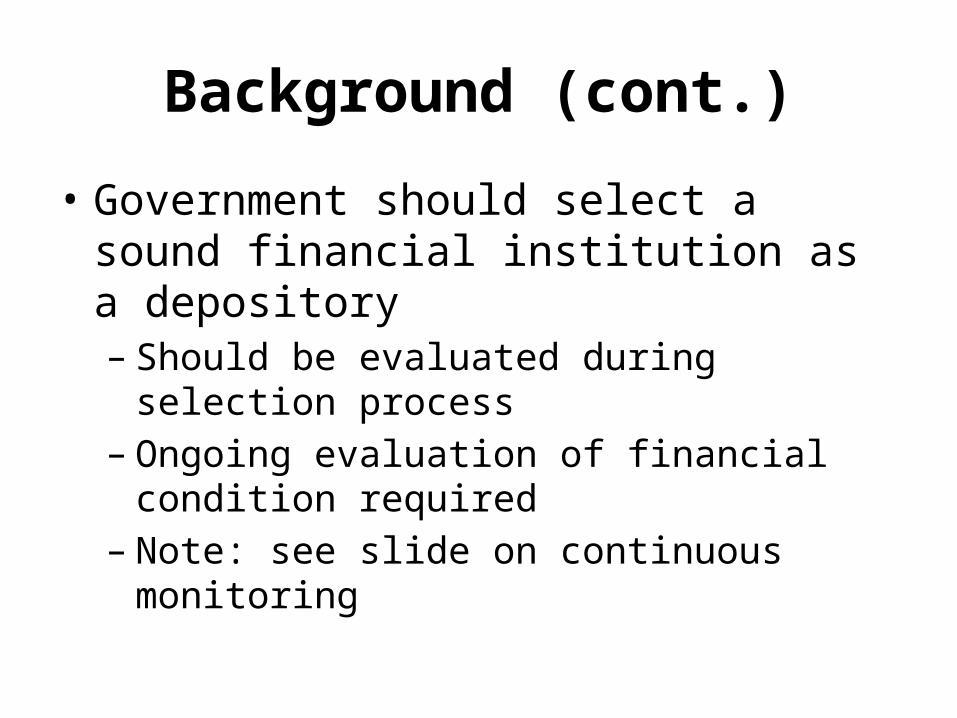
Background (cont.)
• Government should select a sound financial institution as a depository– Should be evaluated during selection process– Ongoing evaluation of financial condition required– Note: see slide on continuous monitoring

b. Financial Criteria Periodically, concern is raised by units of government concerning the financial soundness of banks and savings institutions. This concern may arise because of changes in economic conditions or from unsound banking practices. It is important that the units assess the financial strength of the institutions with which they regularly transact business.
To that end, the staff of the Department of State Treasurer has outlined various methods of analysis to help units obtain a better understanding of the financial position of banks and savings institutions. The areas that will be covered are merely guidelines and do not represent an all-inclusive analysis of a particular institution. These are presented in Exhibit D – Guidelines for Evaluation of the Soundness of a Financial Institution.
Department of State Treasurer – Policy Manual for Local Governments Section 30: Cash and Investments Part II – Procurement of Banking Services
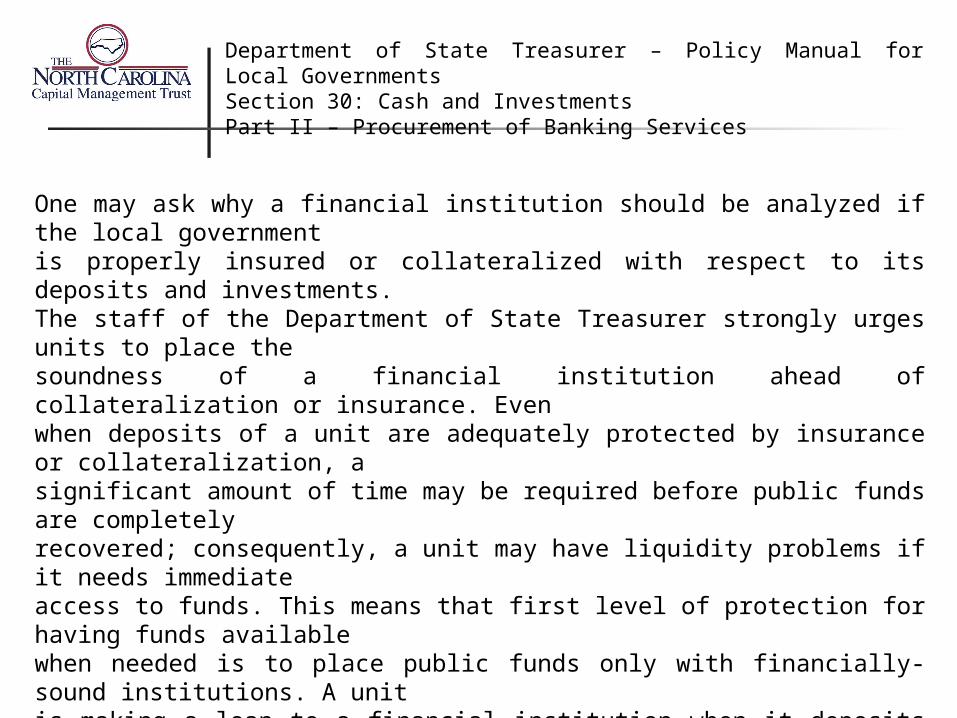
One may ask why a financial institution should be analyzed if the local government is properly insured or collateralized with respect to its deposits and investments. The staff of the Department of State Treasurer strongly urges units to place the soundness of a financial institution ahead of collateralization or insurance. Even when deposits of a unit are adequately protected by insurance or collateralization, a significant amount of time may be required before public funds are completely recovered; consequently, a unit may have liquidity problems if it needs immediate access to funds. This means that first level of protection for having funds available when needed is to place public funds only with financially-sound institutions. A unit is making a loan to a financial institution when it deposits funds and should ensure that all financial institutions utilized are financially sound.
Department of State Treasurer – Policy Manual for Local Governments Section 30: Cash and Investments Part II – Procurement of Banking Services

Department of State Treasurer – Policy Manual for Local Governments Section 30: Cash and Investments Part II – Procurement of Banking Services
6. Continuous Monitoring of Safety and Soundness of Financial Partners
After a bank is selected, the contract awarded and transition completed, it is important to continue to monitor both performance under the terms of the contract and the safety and soundness of banks and other financial institutions transacting business with the unit. An evaluation of the financial condition should be performed no less frequently than annually and quarterly evaluation is encouraged.
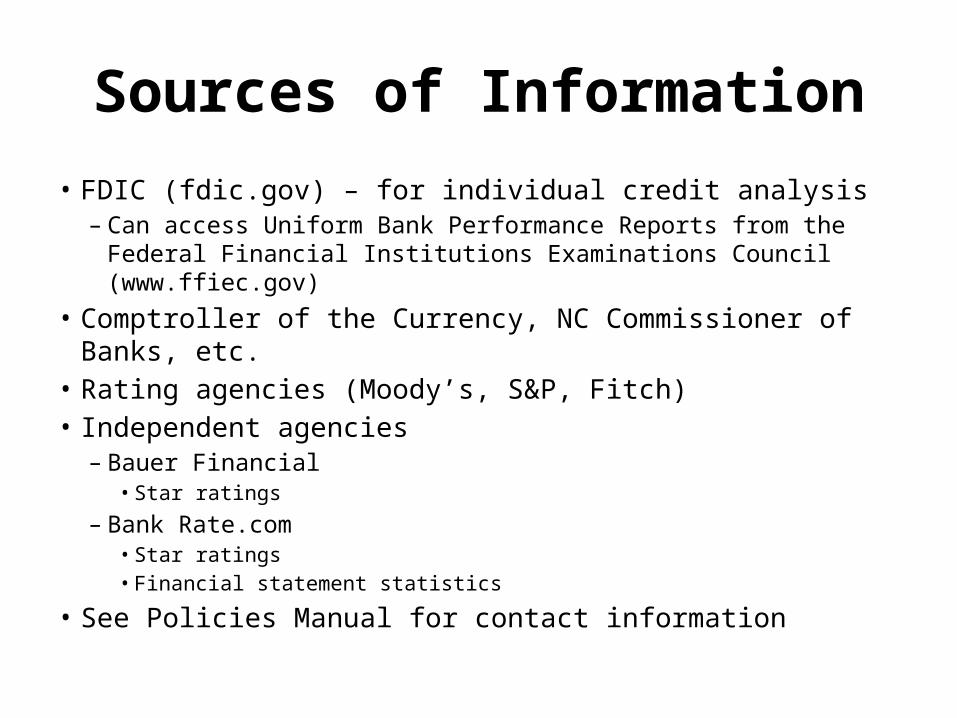
Sources of Information
• FDIC (fdic.gov) – for individual credit analysis– Can access Uniform Bank Performance Reports from the Federal
Financial Institutions Examinations Council (www.ffiec.gov)• Comptroller of the Currency, NC Commissioner of Banks, etc.• Rating agencies (Moody’s, S&P, Fitch)• Independent agencies
– Bauer Financial• Star ratings
– Bank Rate.com• Star ratings• Financial statement statistics
• See Policies Manual for contact information

LGC’s Recommended Objectives
• Capital adequacy• Earnings• Problem loan experience• Liquidity
• Look at trend analysis over a multi-year period

Trend Analysis
• Growth in equity (hopefully from profit)• Earnings growth• Growth in problem loans• Asset Growth

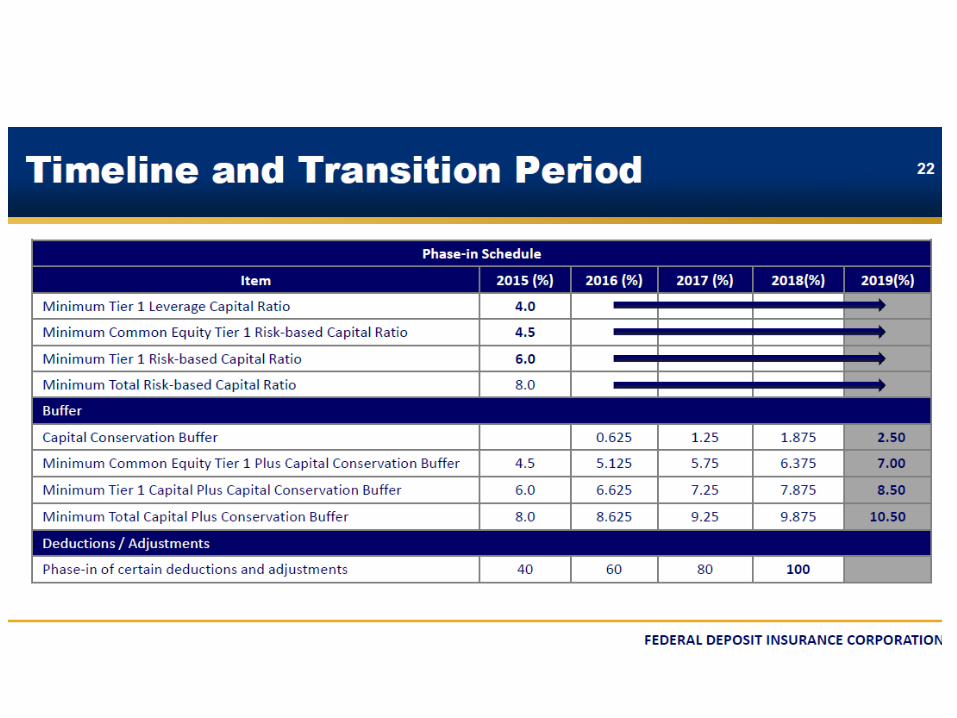
Ratio Analysis• Capital Adequacy – Banks are highly levered
– Tier One Risk-Based Capital to Risk-Weighted Assets①• Adequately-capitalized - >= 6%• Well-capitalized - >=8%
– Total Risk-Based Capital to Risk-Weighted Assets②• Adequately-capitalized - >= 8%• Well-capitalized - >=10%
– Tier One Leverage Ratio③• Adequately-capitalized - >=4%• Well-capitalized - >=5%
– Common Equity Tier One Risk-Based Capital Ratio• Adequately-capitalized - >=4.5%• Well-capitalized - >= 6.5%
– Cash Dividends to Net Income – Dividend Payout Ratio④


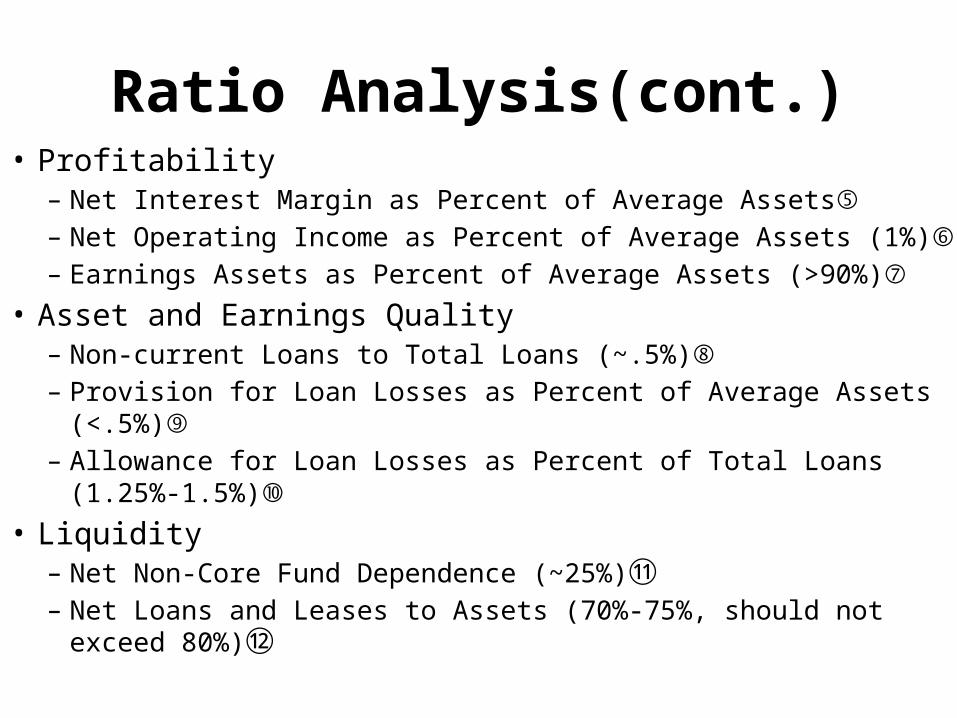
Ratio Analysis(cont.)• Profitability
– Net Interest Margin as Percent of Average Assets⑤– Net Operating Income as Percent of Average Assets (1%)⑥– Earnings Assets as Percent of Average Assets (>90%)⑦
• Asset and Earnings Quality– Non-current Loans to Total Loans (~.5%)⑧– Provision for Loan Losses as Percent of Average Assets (<.5%)⑨– Allowance for Loan Losses as Percent of Total Loans (1.25%-1.5%)⑩
• Liquidity– Net Non-Core Fund Dependence (~25%)⑪– Net Loans and Leases to Assets (70%-75%, should not exceed
80%)⑫
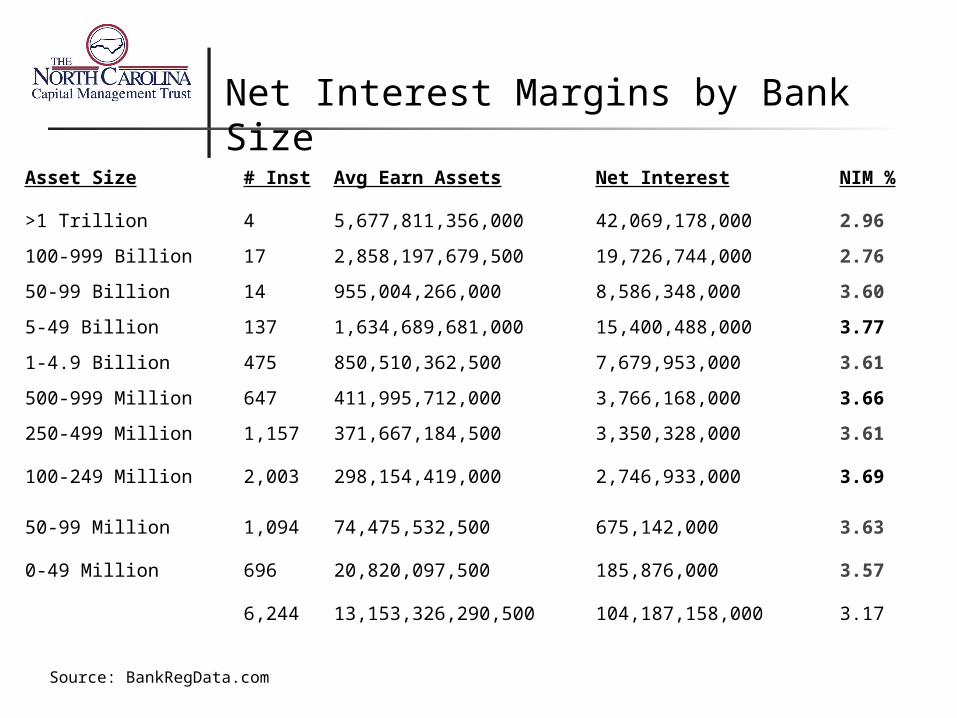
Asset Size # Inst Avg Earn Assets Net Interest NIM %
>1 Trillion 4 5,677,811,356,000 42,069,178,000 2.96
100-999 Billion 17 2,858,197,679,500 19,726,744,000 2.76
50-99 Billion 14 955,004,266,000 8,586,348,000 3.60
5-49 Billion 137 1,634,689,681,000 15,400,488,000 3.77
1-4.9 Billion 475 850,510,362,500 7,679,953,000 3.61
500-999 Million 647 411,995,712,000 3,766,168,000 3.66
250-499 Million 1,157 371,667,184,500 3,350,328,000 3.61
100-249 Million 2,003 298,154,419,000 2,746,933,000 3.69
50-99 Million 1,094 74,475,532,500 675,142,000 3.63
0-49 Million 696 20,820,097,500 185,876,000 3.57
6,244 13,153,326,290,500 104,187,158,000 3.17
Source: BankRegData.com
Net Interest Margins by Bank Size
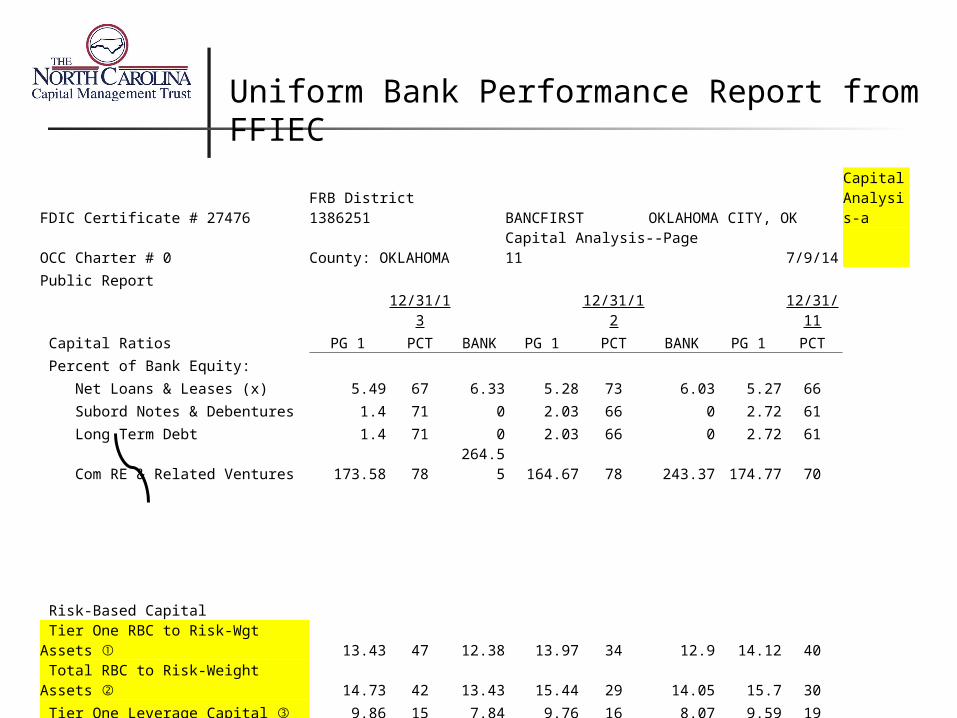
FDIC Certificate # 27476 FRB District 1386251 BANCFIRST OKLAHOMA CITY, OKCapital Analysis-a
OCC Charter # 0 County: OKLAHOMA Capital Analysis--Page 11 7/9/14
Public Report
12/31/13 12/31/12 12/31/11
Capital Ratios PG 1 PCT BANK PG 1 PCT BANK PG 1 PCT
Percent of Bank Equity:
Net Loans & Leases (x) 5.49 67 6.33 5.28 73 6.03 5.27 66
Subord Notes & Debentures 1.4 71 0 2.03 66 0 2.72 61
Long Term Debt 1.4 71 0 2.03 66 0 2.72 61
Com RE & Related Ventures 173.58 78 264.55 164.67 78 243.37 174.77 70
Risk-Based Capital
Tier One RBC to Risk-Wgt Assets ① 13.43 47 12.38 13.97 34 12.9 14.12 40
Total RBC to Risk-Weight Assets ② 14.73 42 13.43 15.44 29 14.05 15.7 30
Tier One Leverage Capital ③ 9.86 15 7.84 9.76 16 8.07 9.59 19
Other Capital Ratio:
Def Tax Asset to T1 Cap 3.85 32 1.23 2.77 43 0.79 2.55 42
Uniform Bank Performance Report from FFIEC
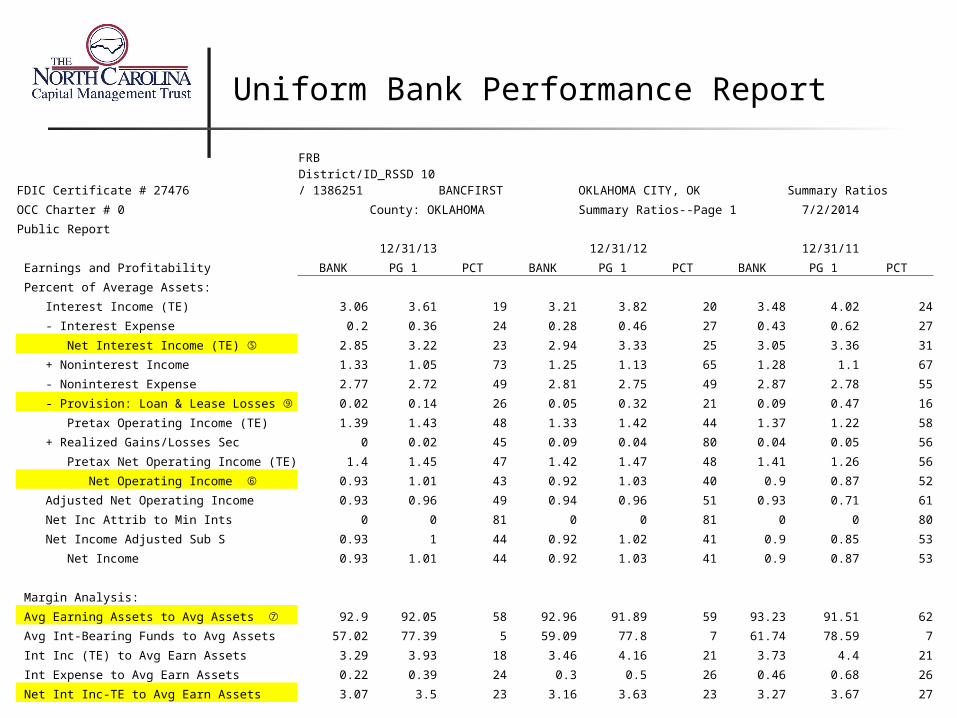
Uniform Bank Performance Report
FDIC Certificate # 27476FRB District/ID_RSSD 10 / 1386251 BANCFIRST OKLAHOMA CITY, OK Summary Ratios
OCC Charter # 0 County: OKLAHOMA Summary Ratios--Page 1 7/2/2014
Public Report
12/31/13 12/31/12 12/31/11
Earnings and Profitability BANK PG 1 PCT BANK PG 1 PCT BANK PG 1 PCT
Percent of Average Assets:
Interest Income (TE) 3.06 3.61 19 3.21 3.82 20 3.48 4.02 24
- Interest Expense 0.2 0.36 24 0.28 0.46 27 0.43 0.62 27
Net Interest Income (TE) ⑤ 2.85 3.22 23 2.94 3.33 25 3.05 3.36 31
+ Noninterest Income 1.33 1.05 73 1.25 1.13 65 1.28 1.1 67
- Noninterest Expense 2.77 2.72 49 2.81 2.75 49 2.87 2.78 55
- Provision: Loan & Lease Losses ⑨ 0.02 0.14 26 0.05 0.32 21 0.09 0.47 16
Pretax Operating Income (TE) 1.39 1.43 48 1.33 1.42 44 1.37 1.22 58
+ Realized Gains/Losses Sec 0 0.02 45 0.09 0.04 80 0.04 0.05 56
Pretax Net Operating Income (TE) 1.4 1.45 47 1.42 1.47 48 1.41 1.26 56
Net Operating Income ⑥ 0.93 1.01 43 0.92 1.03 40 0.9 0.87 52
Adjusted Net Operating Income 0.93 0.96 49 0.94 0.96 51 0.93 0.71 61
Net Inc Attrib to Min Ints 0 0 81 0 0 81 0 0 80
Net Income Adjusted Sub S 0.93 1 44 0.92 1.02 41 0.9 0.85 53
Net Income 0.93 1.01 44 0.92 1.03 41 0.9 0.87 53
Margin Analysis:
Avg Earning Assets to Avg Assets ⑦ 92.9 92.05 58 92.96 91.89 59 93.23 91.51 62
Avg Int-Bearing Funds to Avg Assets 57.02 77.39 5 59.09 77.8 7 61.74 78.59 7
Int Inc (TE) to Avg Earn Assets 3.29 3.93 18 3.46 4.16 21 3.73 4.4 21
Int Expense to Avg Earn Assets 0.22 0.39 24 0.3 0.5 26 0.46 0.68 26
Net Int Inc-TE to Avg Earn Assets 3.07 3.5 23 3.16 3.63 23 3.27 3.67 27
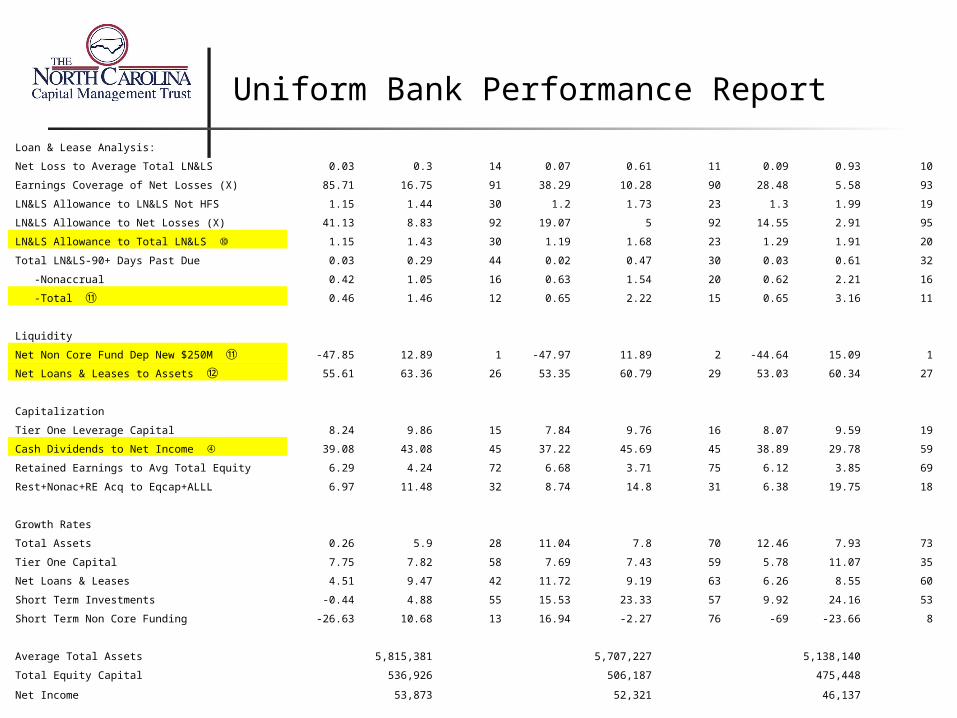
Uniform Bank Performance Report
Loan & Lease Analysis:
Net Loss to Average Total LN&LS 0.03 0.3 14 0.07 0.61 11 0.09 0.93 10
Earnings Coverage of Net Losses (X) 85.71 16.75 91 38.29 10.28 90 28.48 5.58 93
LN&LS Allowance to LN&LS Not HFS 1.15 1.44 30 1.2 1.73 23 1.3 1.99 19
LN&LS Allowance to Net Losses (X) 41.13 8.83 92 19.07 5 92 14.55 2.91 95
LN&LS Allowance to Total LN&LS ⑩ 1.15 1.43 30 1.19 1.68 23 1.29 1.91 20
Total LN&LS-90+ Days Past Due 0.03 0.29 44 0.02 0.47 30 0.03 0.61 32
-Nonaccrual 0.42 1.05 16 0.63 1.54 20 0.62 2.21 16
-Total ⑪ 0.46 1.46 12 0.65 2.22 15 0.65 3.16 11
Liquidity
Net Non Core Fund Dep New $250M ⑪ -47.85 12.89 1 -47.97 11.89 2 -44.64 15.09 1
Net Loans & Leases to Assets ⑫ 55.61 63.36 26 53.35 60.79 29 53.03 60.34 27
Capitalization
Tier One Leverage Capital 8.24 9.86 15 7.84 9.76 16 8.07 9.59 19
Cash Dividends to Net Income ④ 39.08 43.08 45 37.22 45.69 45 38.89 29.78 59
Retained Earnings to Avg Total Equity 6.29 4.24 72 6.68 3.71 75 6.12 3.85 69
Rest+Nonac+RE Acq to Eqcap+ALLL 6.97 11.48 32 8.74 14.8 31 6.38 19.75 18
Growth Rates
Total Assets 0.26 5.9 28 11.04 7.8 70 12.46 7.93 73
Tier One Capital 7.75 7.82 58 7.69 7.43 59 5.78 11.07 35
Net Loans & Leases 4.51 9.47 42 11.72 9.19 63 6.26 8.55 60
Short Term Investments -0.44 4.88 55 15.53 23.33 57 9.92 24.16 53
Short Term Non Core Funding -26.63 10.68 13 16.94 -2.27 76 -69 -23.66 8
Average Total Assets 5,815,381 5,707,227 5,138,140
Total Equity Capital 536,926 506,187 475,448
Net Income 53,873 52,321 46,137
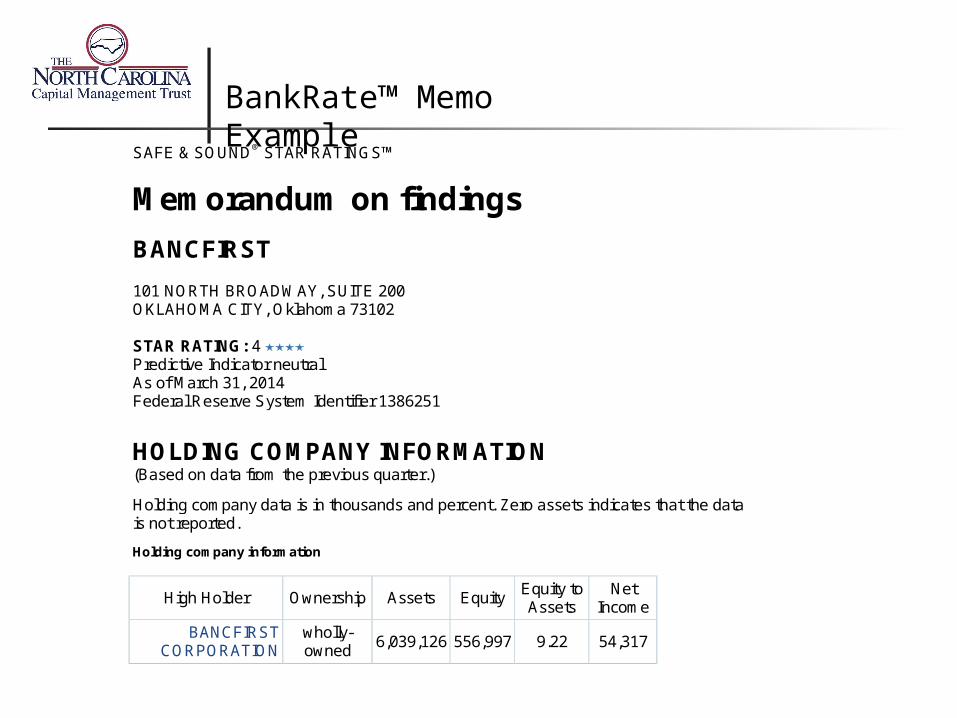
SAFE & SOUND® STAR RATINGS™
Memorandum on findings
BANCFIRST
101 NORTH BROADWAY, SUITE 200 OKLAHOMA CITY, Oklahoma 73102 STAR RATING: 4 Predictive Indicator neutral As of March 31, 2014 Federal Reserve System Identifier 1386251
HOLDING COMPANY INFORMATION (Based on data from the previous quarter.)
Holding company data is in thousands and percent. Zero assets indicates that the data is not reported.
Holding company information
High Holder Ownership Assets Equity Equity to Assets
Net Income
BANCFIRST CORPORATION
wholly-owned
6,039,126 556,997 9.22 54,317
BankRate™ Memo Example
INTRODUCTION
U.S. commercial banks are chartered under either federal or state jurisdiction for the purposes of accepting funds for deposit and extending loans to either individual or business borrowers. Banks are subject to credit, interest rate, and operational risk, and, because of both their public purpose and their importance to the nation’s economy, banks become the object of intense regulatory scrutiny.
U.S. thrift institutions are chartered under either federal or state jurisdiction for the primary purpose of utilizing deposited funds to issue loans secured by real estate. Currently, real estate-backed loans account for approximately 43% of total thrift industry assets, and one-to-four family residential mortgages comprise nearly 63% of the industry’s real estate loan portfolio. Thrift institutions are subject to credit, interest rate, and operational risk, and, during the last twenty years, thrifts have made great strides toward reducing historic mismatches between asset and liability maturities.
The Bankrate proprietary commercial bank rating model analyzes capitalization, asset quality, earnings, and liquidity and produces composite and component "Star" ratings that can be used as a measure of the rated entity's financial safety and soundness. Additionally, early warning components of the model highlight operating characteristics of immediate concern and recommended follow-up actions. "The analyses are not adjusted for TARP funding and those institutions receiving funds may receive ratings that would differ were the TARP funds adjusted out of the analyses. You can check whether or not this institution has received TARP funding and whether or not they have paid it back at http://bailout.propublica.org/main/list/index."
BankRate™ Memo Example
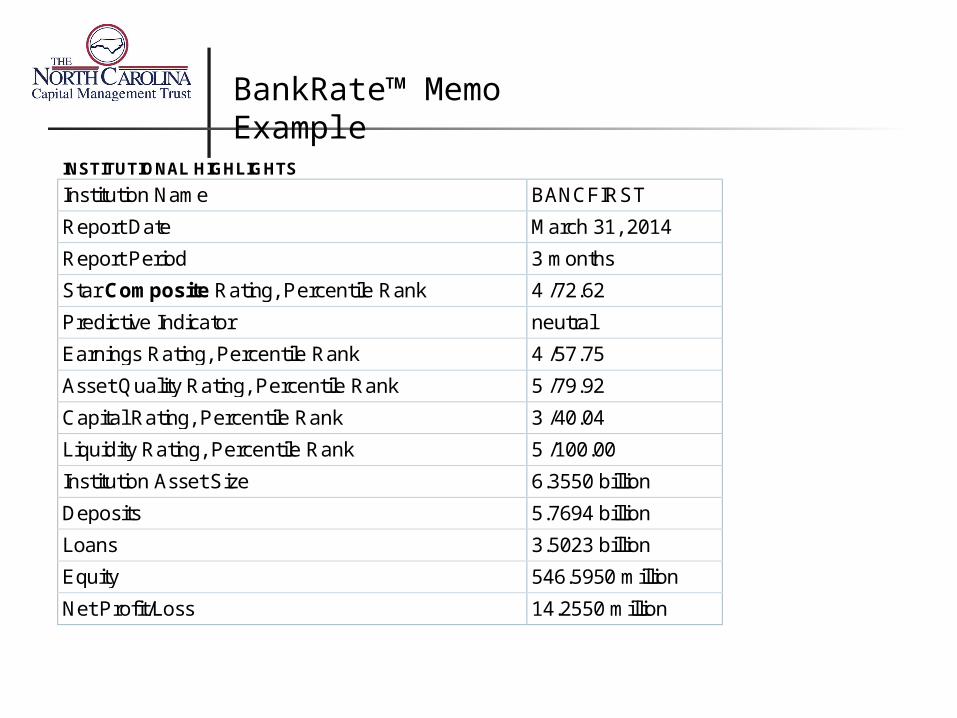
INSTITUTIONAL HIGHLIGHTS
Institution Name BANCFIRST
Report Date March 31, 2014
Report Period 3 months
Star Composite Rating, Percentile Rank 4 /72.62
Predictive Indicator neutral
Earnings Rating, Percentile Rank 4 /57.75
Asset Quality Rating, Percentile Rank 5 /79.92
Capital Rating, Percentile Rank 3 /40.04
Liquidity Rating, Percentile Rank 5 /100.00
Institution Asset Size 6.3550 billion
Deposits 5.7694 billion
Loans 3.5023 billion
Equity 546.5950 million
Net Profit/Loss 14.2550 million
BankRate™ Memo Example
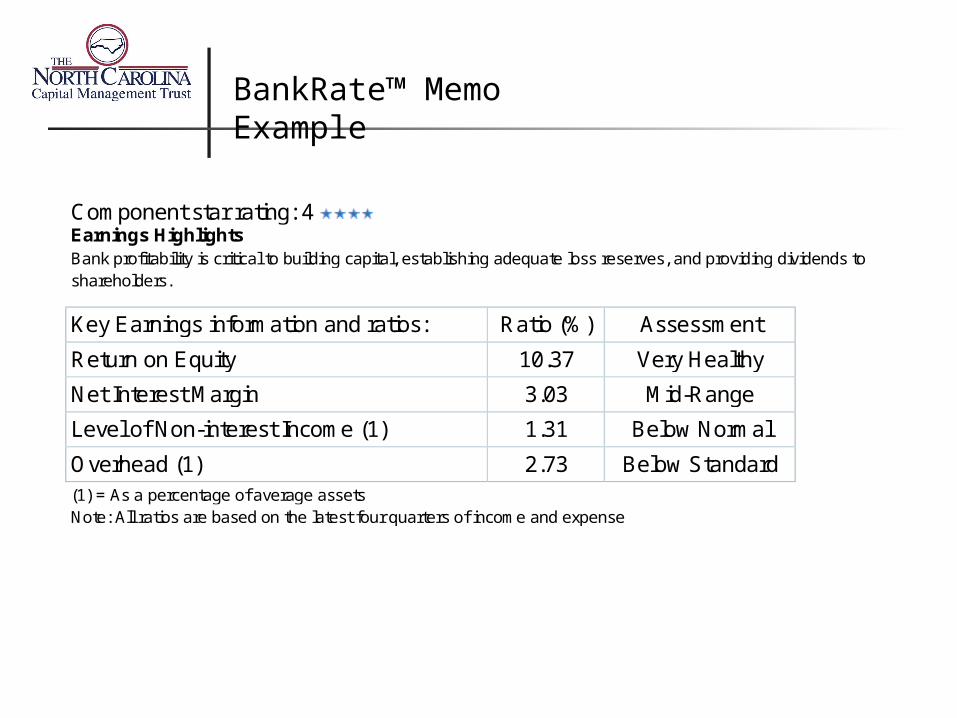
Component star rating: 4 Earnings Highlights Bank profitability is critical to building capital, establishing adequate loss reserves, and providing dividends to shareholders.
Key Earnings information and ratios: Ratio (%) Assessment
Return on Equity 10.37 Very Healthy
Net Interest Margin 3.03 Mid-Range
Level of Non-interest Income (1) 1.31 Below Normal
Overhead (1) 2.73 Below Standard (1) = As a percentage of average assets Note: All ratios are based on the latest four quarters of income and expense
BankRate™ Memo Example

Component star rating: 5 Asset quality highlights Asset quality is a major determinant of the viability of any banking institution. Poor asset quality will have a very direct impact upon the other components and bank regulators invest substantial amounts of time and resources in gauging the quality of a bank's loans and investments.
Key Asset Quality information and ratios:
Ratio (%)
Assessment
Nonperforming Asset Ratio (2) 4.11 Relatively Low
Loss Reserve Coverage (3) 237.73 Much Better Than
Normal
Loan Yield 5.04 Conservative
Asset Growth Rate 10.43 Normal (2) = Nonperforming Assets/Equity plus Loss Reserves (3) = Loan Loss Reserves/Nonperforming Loans
BankRate™ Memo Example
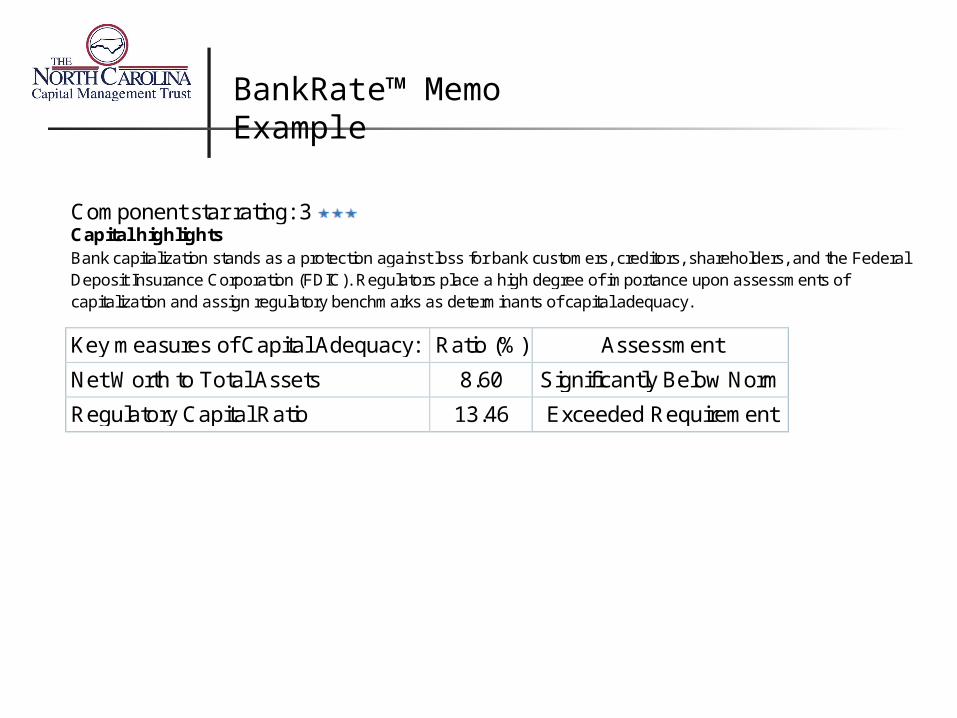
Component star rating: 3 Capital highlights Bank capitalization stands as a protection against loss for bank customers, creditors, shareholders, and the Federal Deposit Insurance Corporation (FDIC). Regulators place a high degree of importance upon assessments of capitalization and assign regulatory benchmarks as determinants of capital adequacy.
Key measures of Capital Adequacy: Ratio (%) Assessment
Net Worth to Total Assets 8.60 Significantly Below Norm
Regulatory Capital Ratio 13.46 Exceeded Requirement
BankRate™ Memo Example
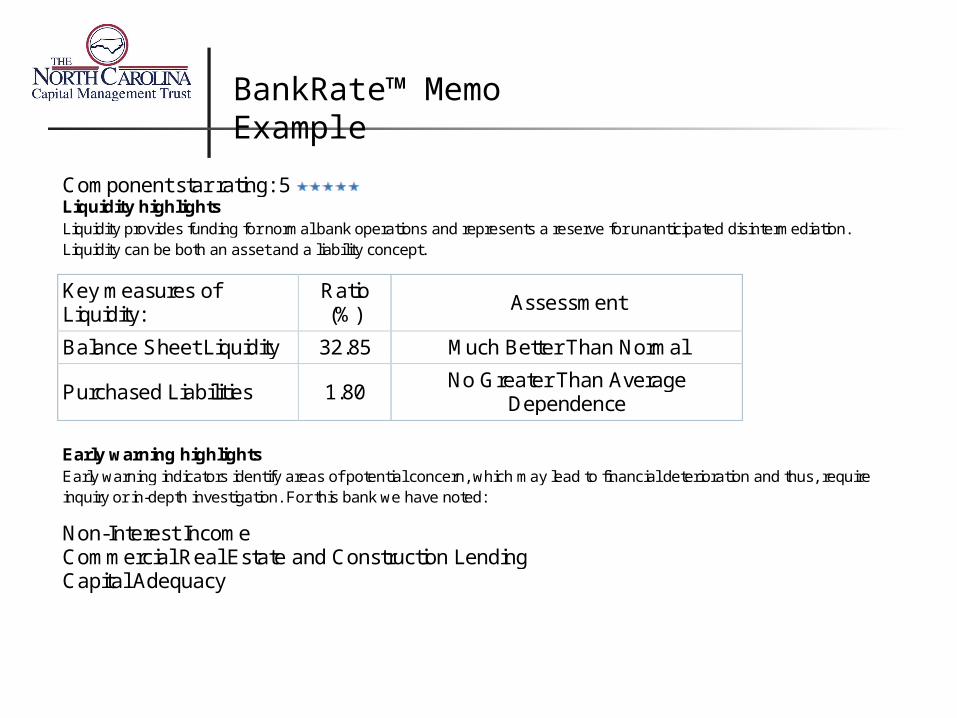
Component star rating: 5 Liquidity highlights Liquidity provides funding for normal bank operations and represents a reserve for unanticipated disintermediation. Liquidity can be both an asset and a liability concept.
Key measures of Liquidity:
Ratio (%)
Assessment
Balance Sheet Liquidity 32.85 Much Better Than Normal
Purchased Liabilities 1.80 No Greater Than Average
Dependence
Early warning highlights Early warning indicators identify areas of potential concern, which may lead to financial deterioration and thus, require inquiry or in-depth investigation. For this bank we have noted:
Non-Interest Income Commercial Real Estate and Construction Lending Capital Adequacy
BankRate™ Memo Example

Institution Commentary
OVERVIEW of Institution BANCFIRST is a state chartered banking institution, which, as of March 31, 2014, reported $6.3550 billion in total assets. At that date, loans and deposits held by the bank amounted to $3.5023 billion and $5.7694 billion, respectively. The bank's March 31, 2014 equity base of $546.5950 million produced an Equity/Assets ratio of 8.60%, as of that date.
COMPOSITE SUMMARY Bankrate believes that, as of March 31, 2014, this bank exhibited a sound condition, characterized by normal overall, sustainable profitability, a very high measure of asset quality, mid-range capitalization and ample liquidity.
EARNINGS ANALYSIS For the twelve months ended March 31, 2014, the bank recorded net income of $55.3210 million. The bank experienced a return on average assets (ROA) of 0.93% over the latest four quarters. Year earlier twelve month results amounted to a net income of $50.6480 million, or a 0.88% ROA over the most recent four quarters at that time. An ROA of at least 1.0% is deemed satisfactory in accordance with banking industry standards, and the industry's annualized ROA for the twelve months of 2014 was approximately 1.00% for commercial banks and 1.11% for thrift institutions.
We have concluded that for the four quarters ending March 31, 2014, the bank achieved a very healthy return on equity. We deem net interest margin to have been mid-range. Noninterest income was below normal, and management should be questioned as to the outlook for this source of revenue. We also observed overhead ratios that were below standard, a sign of good expense control. Importantly, net interest margins, noninterest income components, and overhead expense levels represent operating factors that combine to impact overall operating results. We have also noted that the bank's profitability improvement between the twelve months ended March 31 , 2013 and the twelve months ended March 31 , 2014 well exceeded the banking industry peer comparison
BankRate™ Memo Example
ASSET QUALITY ANALYSIS The bank revealed, as previously stated, a very high measure of asset quality. Our conclusion with respect to asset quality incorporates our analysis of data depicting regional economic conditions as well as our computations of a relatively low March 31, 2014 nonperforming asset ratio, much better than normal reserve coverage for nonperforming loans; and apparently acceptable quality, or no greater than average, holdings of commercial real estate and construction loans, two categories that can intensify credit risk.
Commercial real estate and construction loans should be examined for:
Loan underwriting and appraisal standards that differ from normal bank guidelines. Loan-to-value benchmarks deemed not in conformance with prudent underwriting
requirements. Speculative construction activity. The deferral of interest payments during construction periods. The funding of the entire amount of construction costs and land valuation.
BankRate™ Memo Example
CAPITAL ANALYSIS For the one year period ended March 31, 2014, the bank reported a better than normal rate of growth in equity capital. Balance sheet structural changes, through the one year period of time ended March 31, 2014, have somewhat improved the bank's capital position. Our analytical methodology does take into account the quantity, quality, and durability of net worth, and, as set forth above, we have determined, based upon our series of tests, that the bank demonstrates mid-range capitalization. We have calculated the bank's March 31, 2014 Total Risk-Based Capital position, a computation used by industry regulators, and have concluded that this bank exceeded the requirement, set by regulation, for this test. Notwithstanding any of the information contained within this section, we believe, based upon our analysis of net worth to total assets, that the institution should consider plans for enhancing reported capitalization.
LIQUIDITY ANALYSIS As of March 31, 2014, the bank displayed Much Better Than Normal balance sheet liquidity and a No Greater Than Average Dependence upon wholesale, or non-core liabilities, which include all borrowings, such as Federal Home Loan Bank Advances, and CD's greater than $250,000.
Accounting principles require some securities to be categorized as "Available-for-Sale." Changes in market value of these securities are reflected through the GAAP (Generally Accepted Accounting Principles) net worth of the institution. Based upon the bank's present balance sheet, changes in the value of the current level of securities reported as "Available-for-Sale" might not have a substantial impact upon future net worth of the bank.
BankRate™ Memo Example
Bauer Financial Star Ratings