Embed Size (px)
Citation preview

Copyright (c) 2013 IEEE. Personal use is permitted. For any other purposes, permission must be obtained from the IEEE by emailing [email protected].
This article has been accepted for publication in a future issue of this journal, but has not been fully edited. Content may change prior to final publication.
TIP-09564-2012
1
Abstract—Illumination estimation is an important component
of color constancy and automatic white balancing. A number of methods of combining illumination estimates obtained from multiple subordinate illumination estimation methods now appear in the literature. These combinational methods aim to provide better illumination estimates by fusing the information embedded in the subordinated solutions. The existing combinational methods are surveyed and analyzed here with the goals of determining: (1) the effectiveness of the fusing illumination estimates from multiple subordinate methods, (2) the best method of combination, (3) the underlying factors that affect the performance of a combinational method, and (4) the effectiveness of combination for illumination estimation in multiple-illuminant scenes. The various combinational methods are categorized in terms of whether or not they require supervised training and whether or not they rely on high-level scene content cues (e.g., indoor versus outdoor). Extensive tests and enhanced analyses using 3 data sets of real-world images are conducted. For consistency in testing, the images were labeled according to their high-level features (3D stages, indoor/outdoor) and this label data is made available on-line. The tests reveal that the trained combinational methods (direct combination by support vector regression in particular) clearly outperform both the non-combinational methods and those combinational methods based on scene content cues.
Index Terms—Illumination estimation, color constancy,
automatic white balance, committee-based
I. INTRODUCTION he output from any color imaging device is affected by three factors: the spectrum of the light incident on the scene,
the surface reflectance of the object, and the sensor sensitivity functions of the camera [1, 2]. Therefore, the same surface under a different light will usually result in a different image color. In contrast, humans perceive colors as being relatively stable across changes in the illumination [3, 4]. Computational color constancy aims to provide the same sort of color stability in the context of machine vision. For computational color constancy, the crucial step is to determine the color of the light illuminating the scene.
A. Related Work The computational color constancy problem is generally
formulated as: given an image under illumination of unknown
Bing Li, Weihua Xiong, Weiming Hu are with the Institute of Automation, Chinese Academy of Sciences, Beijing, China (e-mail: [email protected], [email protected], [email protected] ).
Brian Funt is with the School of Computing Science, Simon Fraser University, Vancouver, China. (e-mail: [email protected])
color, predict what the image of the same scene would be if taken under a canonical illuminant of known color [7]. The canonical illuminant can be chosen as any ‘white’ illuminant such as CIE D65 or equal-energy white. Implicit in this statement of the color constancy problem is the common assumption that there is only a single color or spectrum of light illuminating the scene. The irradiance of the light incident at any point may vary, but not its relative spectral power distribution. In addition, this paper only focuses on diffuse-based color constancy that assumes input images have only diffuse reflection components. Dichromatic-based color constancy [6, 54], which assumes images have both diffuse and specular reflection components, is not considered here.
Most color constancy can be divided into two major steps [8, 9]: (1) estimating the color of the illumination, and (2) adjusting the image colors based on the difference between the estimated and canonical light sources. The latter step is usually addressed by a scaling of the R, G, and B channels that is often referred to as a von Kries or a diagonal transformation [10]. The first step represents an ill-posed problem and cannot be solved without additional constraints or assumptions. The second step is also ill-posed, but in a different sense. As Logvinenko [5] points out, due to metamerism, a given color stimulus under one illuminant potentially can become any of the colors in its metamer mismatch volume, so the prediction cannot be made uniquely.
During the past decades, both the scientific community and the imaging industry have contributed to the development of different types of illumination estimation methods. The majority of them involve a single strategy for computing what the illuminant’s color is likely to be. Recently, however, various methods [11, 12, 13, 14, 15, 16, 17] that estimate the illuminant using multiple strategies and then combine the resulting estimates in some way have been proposed. The estimates are combined by a ‘committee’ [14] that either returns a weighted combination of the estimates, or alternatively selects just one as the most appropriate. The term ‘combinational method’ will be used to refer to an illumination estimation method based on combining illumination estimates from other illumination estimation algorithms. The term ‘unitary method’ will be used to refer to a traditional illumination estimation algorithm that uses a single strategy rather than a combination of strategies.
There have been several performance comparisons made of the various unitary methods. The first large comparison of illumination estimation methods is that of Barnard et al. [1, 2]. They evaluate five unitary methods—Grey World [18], White
Evaluating Combinational Illumination Estimation Methods on Real-World Images
Bing Li, Weihua Xiong, Weiming Hu and Brian Funt
T

Copyright (c) 2013 IEEE. Personal use is permitted. For any other purposes, permission must be obtained from the IEEE by emailing [email protected].
This article has been accepted for publication in a future issue of this journal, but has not been fully edited. Content may change prior to final publication.
TIP-09564-2012
2
Patch [19], Gamut Mapping [20], Color-by-Correlation [21] and Neural Networks-based method [22]—on a set of synthesized image data as well as a set of 321 indoor images captured in a laboratory setting. Hordley et al. [23] suggest a different way of analyzing the performance of such algorithms. Agarwal et al. [24] survey the recent progress in color constancy and examine its applications to video tracking, but without any comparison of the methods to one another. Hordley [8] discusses five algorithms. Gijsenij et al. [25] propose a ‘Perceptual Euclidean Distance’ (PED) measure for evaluating color constancy performance. The measure is based on psychophysical experiments comparing the error in the illumination estimates to the error perceived by human subjects. Vazquez et al. [26] evaluate three different illumination estimation methods through a number of psychological experiments conducted with 10 naive observers. The most recent color constancy survey presented by Gijsenij et al. [27] provides a good survey of unitary methods, but only a limited comparison of combinational methods.
B. Our Work The research literature has primarily focused on evaluating
unitary methods [1, 2, 8, 9] with only a little attention paid to the evaluation of combinational methods. This paper fills that gap and provides a quantitative comparison of the prevailing combinational methods—both to one another and to the various unitary methods. The contributions of this paper can be summarized as follows:
It reviews and categorizes the existing unitary and combinational illumination estimation methods based on their underlying assumptions. The proposed categories and subcategories are valuable in analyzing the current trends in illumination estimation research.
It provides a comprehensive comparison of combinational methods on 3 real-world image sets using 4 different error measures. The large scale of the comparison based, as it is, on such a wide variety of different images from different cameras taken by different people in different environments and evaluated with the different error measures makes the conclusions more reliable and more applicable to practical applications than previous studies. In addition, the evaluation includes results for scenes having multiple light sources.
It validates the conclusions using consistency analysis based on ranking theories [18, 19] to find high consistencies both among different error measurements and among different image sets. This has not been done in the context of color constancy research before.
Based on the results of the comparisons, it investigates the underlying mechanisms of the different combinational methods and determines some of the underlying factors that affect the illumination estimation performance. Understanding such factors indicates potential directions for future research.
II. REVIEW OF COMBINATIONAL METHODS Illumination estimation methods generally are based on the assumption that the camera’s response ( ) ( )T= R, G,Bf x is modeled as:
( ) ( ) ( , ) ( )e s dω
λ λ ρ λ λ= ∫f x x (1)
where x is the spatial image location, λ is wavelength, ω is visible spectrum, ( )e λ is the spectral power distribution of light source, ( , )s λx is the surface spectral reflectance at x , and ( ) ( ( ), ( ), ( ))TR G Bρ λ λ λ λ= is the camera spectral sensitivity function. Generally, it is assumed that the scene is illuminated by a single light source. Reflected by an ideal white surface, the color of the illumination is ( , , ) ( ) ( )TR G B = e d
ω
λ ρ λ λ∫ . (2)
The corresponding chromaticity components are / ( )r R R G B= + + , / ( )g G R G B= + + and / ( )b B R G B= + + . Because 1b r g= − − , only 2 of the 3
components are required, however, in many circumstances it is helpful to represent the third component explicitly. For a given ( , , )TR G B , we will refer to ( , )Tr g=c as its ‘rg-chromaticity’ or simply ‘chromaticity’ and ( , , )Tr g b=e as its ‘3D-chromaticity’. Let 1 2{ , ,...}E = c c be estimates of the illumination chromaticity obtained from E unitary methods. Combinational methods
combine the estimates 1 2{ , ,...}E = c c into a single, final estimate. Combinational methods can be classified into two basic categories—direct combination (DC) and guided combination (GC). DC methods calculate an estimate directly as a weighted combination of the given estimates. GC methods, on the other hand, use attributes of the image content—for example, whether the image is of an indoor or an outdoor scene [11], or whether its 3D scene geometry [12] has a certain structure—to guide the selection of the estimate or estimates to use. DC methods can be further partitioned into two classes: supervised combination (SC) and unsupervised combination (UC). In an SC method, the relative weightings, with which estimates from the unitary methods are to be combined, are first learned during a supervised training phase. A UC method, on the other hand, directly combines the estimates without prior training.
A. Unsupervised Combination (UC) UC methods [13, 14] are based on predefined schemes for
combining estimates. 1) Simple Averaging (SA)
Simple averaging [14] is the simplest combinational scheme. The combinational estimate is given by
| |
1/ | |E
e iiE
== ∑c c (3)
2) Nearest2 (N2) The Nearest2 algorithm [13] first finds the two estimates that
are closest to one another and then returns their mean. In other words, the combination is based on the pair of estimates that are most in agreement. The combinational estimate is
, ;( ) / 2, s.t. ( , ) min ( , )e n m n m i ji j i j
d d≠
= + =c c c c c c c , (4)

Copyright (c) 2013 IEEE. Personal use is permitted. For any other purposes, permission must be obtained from the IEEE by emailing [email protected].
This article has been accepted for publication in a future issue of this journal, but has not been fully edited. Content may change prior to final publication.
TIP-09564-2012
3
where ()d represents the Euclidean distance between two chromaticities. 3) Nearest-N% (N-N%)
The Nearest-N% combination [13] returns the mean of all estimates for which the distance between any pair of them is below (100+ N )% of that between the two closest ones. It is formulated as:
'2
100, ' { | , ( ), s.t. ( , ) }| ' | 100
iiE
e i j i j NearestNwhere E E i j d d
E∈ +
= = ∃ ∈ ≠ ≤∑c
cc c c c c (5)
where 2Nearestd is the distance of the two closest estimates as for Nearest2. 4) No-N-Max (NNM)
The No-N-Max method [13] returns the mean value of the estimates excluding the N estimates having the highest distance from the other estimates. Let iD denote the sum of the
distances from estimate ic to all the other estimates
1,2,..,| |;( , )i i j
j E j iD d
= ≠
= ∑ c c . Reorder the estimates 1 2 | |, ,..., Ec c c as
1 2 | |, ,...,
Eq q qc c c such that 1 2 | |
...Eq q qD D D< < < . The No-N-Max
method’s estimate is then | |
1
| |i
E Nqi
e E N
−
==−
∑ cc (6)
5) Median (MD) Bianco et al. [13] propose a ‘Median’ combinational strategy
that selects the estimate having the smallest total distance from all the others. It corresponds to the first element,
1qc , of the
reordered sequence of the No-N-Max method. It might be more appropriately named the ‘Minimum’ method, but for consistency we continue to refer to it as the ‘Median’ method.
B. Supervised Combination (SC) All Supervised Combination (SC) approaches include
parameters whose values are determined through supervised training. The SC methods differ in the type of training and in the way the parameters are applied to combine unitary method estimates into a combinational estimate. Three SC methods are considered: Least Mean Squares, Extreme Learning Machine, and Support Vector Regression. 1) Least Mean Squares Based Combination (LMS)
The Least Mean Squares based combinational strategy (LMS) of Cardei et al. [14] estimates the illumination chromaticity as a linear combination of the available unitary estimates. Least mean squares, which is an adaptive algorithm using a gradient-based method of steepest decent, is used in a training phase to determine the weight matrix W of the linear combination. Given estimates 1 2 | |[ , ,..., ]T
E=V c c c , the final
illumination chromaticity estimate is e = ×c W V . (7)
2) Extreme Learning Machine Based Combination (ELM) The Extreme Learning Machine based combinational strategy
(ELM) proposed by Li et al. [15] uses the Extreme Learning Machine algorithm on a single-hidden-layer, feed-forward neural network. In many cases, Extreme Learning Machine has
been shown to work better than traditional back-propagation in terms of the level of generalization and learning speed [30]. The network architecture has L nodes in a single hidden layer. The inputs to the neural network are the estimates
1 2 | |[ , ,..., ]TE=V c c c . The network combines the inputs into a
final estimate of the illumination chromaticity. 3) Support Vector Regression Based Combination (SVRC)
Support vector regression is a general technique that estimates a continuous-valued function by introducing structural risk minimization into the regression that encodes the fundamental interrelation between a given input and corresponding output in the training data [63]. Support vector regression was first employed for illumination estimation method as a unitary method by Xiong et al. [31], and will be referred to as SVRU. Support vector regression can also be employed as part of a combinational strategy, which will be referred to as SVRC [15]. The inputs and outputs for SVRC are the same as those for ELM. Given an estimate vector
1 2 | |[ , ,..., ]TE=V c c c , SVRC determines two regression functions
( )rf V and ( )gf V mapping it to the illumination chromaticity r
and g . For example ( )rf V can be formulated as: ( ) , . . ,r r r r rf b s t r b ε= • + − • + ≤V W V W V (8)
where support vector regression is used to find parameters rW
and rb such that ( )rf V deviates at most by ε ( 0ε > ) from the true (measured) illumination chromaticity component r for all training samples. The optimization of Eq. (8) can be solved by quadratic programming methods [63]. Given the regression functions ( )rf V and ( )gf V and a test image with
estimate vector oV , illumination chromaticity is estimated as
( )r or f= V and ( )g og f= V .
C. Guided Combination (GC) Guided combination (GC) uses features of the image content,
such as texture [16], 3D scene geometry [12], and whether it is of an indoor versus outdoor scene [11] as a means of deciding on how to combine the available unitary estimates in order to obtain a final estimate of the illumination. 1) Natural Image Statistics Guided Combination (NIS)
The idea of using natural image statistics to guide the combination is proposed by Gijsenij et al. [16]. In this method, an image is characterized in terms of several statistical measures that are used to select the most appropriate unitary method and then that method’s estimate is returned. The Weibull parameterization [32] is used to determine measures of grain size (texture) and contrast. Given a training set of images and associated true illumination chromaticities, the NIS combinational method is trained as follows:
Step 1: For each training image I convert it to opponent color space [33] and then compute a six-dimensional Weibull parameter feature vector 6
i Rχ ∈ . Step 2: Label the image
iI in the training set with the unitary method that gives the best estimate of the true illumination. Specifically,

Copyright (c) 2013 IEEE. Personal use is permitted. For any other purposes, permission must be obtained from the IEEE by emailing [email protected].
This article has been accepted for publication in a future issue of this journal, but has not been fully edited. Content may change prior to final publication.
TIP-09564-2012
4
, (9)
where AΓ is the angular error (see Section 4.2 below) between
the illuminant’s 3D-chromaticity ( )j ie estimated by the thjcandidate unitary method, and the actual illuminant 3D-chromaticity ( )a ie .
Step 3: Apply a Mixture of Gaussians (MoG) classifier to the training data. The MoG describes the likelihood of image statistics iχ being observed given label iτ as the weighted
sum of k Gaussian distributions: | |
1( | ) ( , , )E
i i m i m mmp Gχ τ α χ µ
== ∑∑ (10)
where mα are positive weights satisfying | |
11E
mmα
==∑ , and
( , , )m mG µ• ∑ are Gaussians with mean mµ and variance m∑ . The parameters of the model are learned through training using the Expectation Maximization algorithm. To estimate the illuminant of a given test image once training is complete, the MoG classifier is applied to select the unitary method that maximizes the posterior probability, which is then used to estimate the illuminant. 2) Image Classification Guided Combination (IC)
The basic idea of the image classification guided combination (IC) [60] is also to select the best unitary illumination estimation method for each image based on its content-related features by a decision forest [60]. The two differences between IC and NIS are image features and classifier used.
In the IC algorithm, in order to describe the image content, Bianco et al [60] consider two groups of features: general-purpose features and problem-dependent features. The general-purpose features include a color histogram (27 dimensions), an edge direction histogram (18 dimensions), an edge strengths histogram (5 dimensions), statistics on the wavelet coefficients (20 dimensions), and color moments (6 dimensions). The problem-dependent features include the number of different colors (1 dimensions), the clipped color components (8 dimensions), and the cast indexes (2 dimensions). For each image
iI , we can concatenate these values into an 87-dimensional feature vector 87
i Rη ∈ . After obtaining the feature vector iη and the best estimate
label iτ for each image iI , the IC method uses a decision forest to learn a classifier for selecting the best unitary method. The decision forest [61] is composed of several classification and regression trees (CART) that are built using different bootstrap replicates of the training set. The best unitary method oτ of the test image
oI with feature vector oη is predicted by majority vote on the output of the trees in the forest. Let ( )k oT η be the
output label of the thk tree of the forest ( )oF η then the final output of the forest can be formulated as:
0 | |( ) arg max{ }, { ( ) | ( ) 0 | |}o o j j k i k i
j EF Tr where Tr T T j j Eτ η η η
< ≤= = = = < ≤ (11)
where jTr is the set of CART trees whose output labels are the
thj candidate unitary method. 3) Indoor-Outdoor Classification Guided Combination (IO)
Bianco et al. [11] propose using knowledge as to whether an image is of an indoor versus an outdoor scene as a method of choosing the most appropriate unitary method. To determine the image’s scene type it is analyzed in terms of a set of low-level features based on color, texture, and edge distribution. These features are organized in a feature vector and fed into a decision forest [34] for indoor-outdoor classification. Then the best unitary method is selected for each scene category according to its performance on the training set. For a test image, the best unitary method is assigned to it according to its corresponding scene category. 4) 3D Scene Geometry Guided Combination (SG) Lu et al. [12] use 3D scene geometry to model an image in terms of different geometrical regions and depth layers. These models are used to select the best unitary method. Typical 3D scene geometries, called stages, are proposed by Nedovic et al. [35]. Each stage has a certain depth layout, and 13 different stages are used in Lu’s method [12]. The 3D scene geometry contains a wide range of scene categories with depth information that can be inferred from image statistics [36]. Although some attributes that are sensitive to depth, such as signal-to-noise and scale, are not inherently correlated with the illumination, they have been found to influence the accuracy of the illuminant estimate [16]. The SG method selects a unitary method for the image as a whole according to its stage category, and also assigns a unitary method to each image region. The multiple estimates obtained from these unitary methods applied to these regions are then averaged to produce a final estimate of the image’s overall illumination. 5) High-Level Visual Information Guided Combination (HVI)
Weijer et al. [17] propose using high-level visual information to improve illuminant estimation. Several unitary methods are applied to compute a set of possible illuminants. For each of them, a color-corrected image is evaluated on the likelihood of its semantic content. The illuminant resulting in the most likely semantic composition of the image is selected as the final illuminant color.
Given the probability ( | )iP c f of an illuminant ic for an image data f , the estimated illuminant ec for the scene is the most likely illuminant as determined by: arg max log( ( | ))
ie i
EP
∈=
cc c f (12)
Assuming ( , )iTrs = wf c f to be the diagonal color transformation function [10] that transforms the image f under illuminant ic as if it were taken under white light wf , where w indicates the white illumination. Then, the probability that the image f is taken under illuminant ic is equal to the
probability that the transformed image wf is taken under a white illuminant: ( | ) ( | ) ( | ) ( )iP P P P= ∝w wc f w f f w w (13)

Copyright (c) 2013 IEEE. Personal use is permitted. For any other purposes, permission must be obtained from the IEEE by emailing [email protected].
This article has been accepted for publication in a future issue of this journal, but has not been fully edited. Content may change prior to final publication.
TIP-09564-2012
5
TABLE 1 THE CLASSIFICATION OF THE COMBINATIONAL METHODS. Method
DC
UC
Simple Average (SA) [14] Nearest 2 (N2) [13] Nearest N% (N-N%) [13] No-N-Max (NNM) [13] Median (MD) [13]
SC Least Mean Square based combination (LMS) [14] Extreme Learning Machine based combination (ELM) [15] Support Vector Regression based combination (SVRC) [15]
GC /
Natural Image Statistics based combination (NIS) [16] Image Classification Guided combination (IC) [60] Indoor-Outdoor Classification guided combination (IO) [11] 3D Scene Geometry guided combination (SG) [12] High-Level Visual Information Guided combination (HVI) [17]
In order to obtain the probability value, Weijer et al. [17] use Probabilistic Latent Semantic Analysis (pLSA) [59] for image semantic analysis. Given a set of images
1 2{ , ,..., }NF = f f f each described in a visual vocabulary 1 2{ , ,..., }MVC v v v= , the words are taken to be generated by latent topics
1 2{ , ,..., }KZ z z z= . If we assume a uniform distribution over the illuminants ( )P w then according to the pLSA model, Eq. (13) can be rewritten as:
11 1
( | ) ( | ) ( | ) ( | ) ( | )M M K
m m k kkm m
P P P v P v z P z== =
∝ = = ∑∏ ∏w w w ww f f w f f (14)
The distributions of ( | )kP z wf and ( | )m kP v z can be estimated using the Expectation Maximization (EM) algorithm [59] on the training set with known illuminants.
Table 1 lists all the combinational methods mentioned in this paper and their categories.
III. UNITARY METHODS For completeness, some unitary illumination estimation
methods (i.e., traditional, non-combinational, single-strategy methods) are included here for comparison. The unitary methods can be further classified into Unsupervised Unitary (UU) and Supervised Unitary (SU) [37]. UU methods such as White Patch [19] and Grey World [18] predict the illumination chromaticity based on some general assumptions about the relationship between image colors and the illuminant. SU methods, such as the Neural Network-based approach (NN) [22], Spatio-Spectral Statistics-based method (SSS) [62] and Color by Correlation [21], include two steps: the first being to establish a statistical model describing the relationship between the image colors and the illuminant color via learning, and the second being to predict the illumination for a given test image using the learned model.
The Grey Edge framework [38] describes a class of UU methods and, as such, is especially useful as a means of generating sets of unitary estimates that can be combined by the various combinational methods. Analogous to the Grey World hypothesis, Weijer et al. [38] proposed the Grey Edge hypothesis: the average of local spatial differences in reflectance is achromatic. In practice, the spatial differences are computed via convolution with a derivative operator at a given scale.
Under the diagonal model of illumination change, changes in
TABLE 2: THE CLASSIFICATION OF THE UNITARY METHODS. Method
UU
White Patch (WP) [19] Grey World (GW) [18] Shades of Grey (SoG) [39] Grey Edge ( ) [38]
SU
Bayesian color constancy (BCC) [40,41,42] Color Constancy using a Neural Network (NN) [22] Color Constancy using Support Vector Regression (SVRU)[31] Color Constancy with Spatio-Spectral Statistics (SSS) [62] Gamut Mapping (GM) [20] Derivative Structures based Gamut Mapping (DGM) [43]
the chromaticity of the illuminant are reflected as differential scales of the respective RGB color channels. Since scaling a function results in an equal scaling of its derivative, it is intuitively clear that the channel-by-channel spatial derivatives of a color image contain information about the chromaticity of the illuminant. The Grey Edge method estimates the illuminant in terms of the amount of the ratios of the channel-by-channel spatial derivatives differ from unity. One possible reason that estimating the illuminant based on the Grey Edge method is more effective than the Grey World method is that it is less susceptible to being misled by large areas of uniform color. Weijer et al. [38] extended the Grey Edge method to a Grey Edge framework including higher-order derivatives and introduce the Minkowski family norm as:
1/
, ,( )ppn
n pn d k
σσ
∂ = ∂ ∫
f x x ex
(15)
where Gσ σ= ⊗f f denotes convolution of the image with a Gaussian filter Gσ of standard deviation σ , p is the Minkowski norm value, k is a scaling, and , ,n p σe is the resulting illuminant estimate. For the 0 th -order derivative, Grey Edge becomes Shades of Grey, which includes White Patch and Grey World as special cases [39]. The methods defined by different choices of the parameters ,n p and σ are denoted as , ,GEn p σ .
IV. EXPERIMENTAL SETTING Each method is tested on 3 different real-world image sets and the errors in the illumination estimates are compared. The following sections describe the image sets and the error measures.
A. Image Data Sets A total of 1,913 images are included in the 3 image sets. We
manually labeled each of these images with its 3D stages and indoor/outdoor classification, and these labels are used in the SG and IO combinational methods. The database of labels is made available on-line at ‘www.cs.sfu.ca/~colour/data/’. Following Nedovic et al. [35], the 15 typical 3D stages: sky+bkg+grd (sbg), bkg+grd (bg), sky+grd (sg), grd (g), nodepth (n), grd+Tbkg(LR) (gtl), grd+Tbkg(RL) (gtr), Tbkg(LR) (tl), Tbkg(RL) (tr), tbl+Prs+bkg (tpb), 1sd+wall(LR) (wl), 1sd+wall(RL) (wr), corner (ce), corridor (cd), and prs+bkg (pb) are used. 1) The Gehler-Shi Image Set
The first real-world image set considered is the one provided
, ,GEn p σ
Copyright (c) 2013 IEEE. Personal use is permitted. For any other purposes, permission must be obtained from the IEEE by emailing [email protected].
This article has been accepted for publication in a future issue of this journal, but has not been fully edited. Content may change prior to final publication.
TIP-09564-2012
6
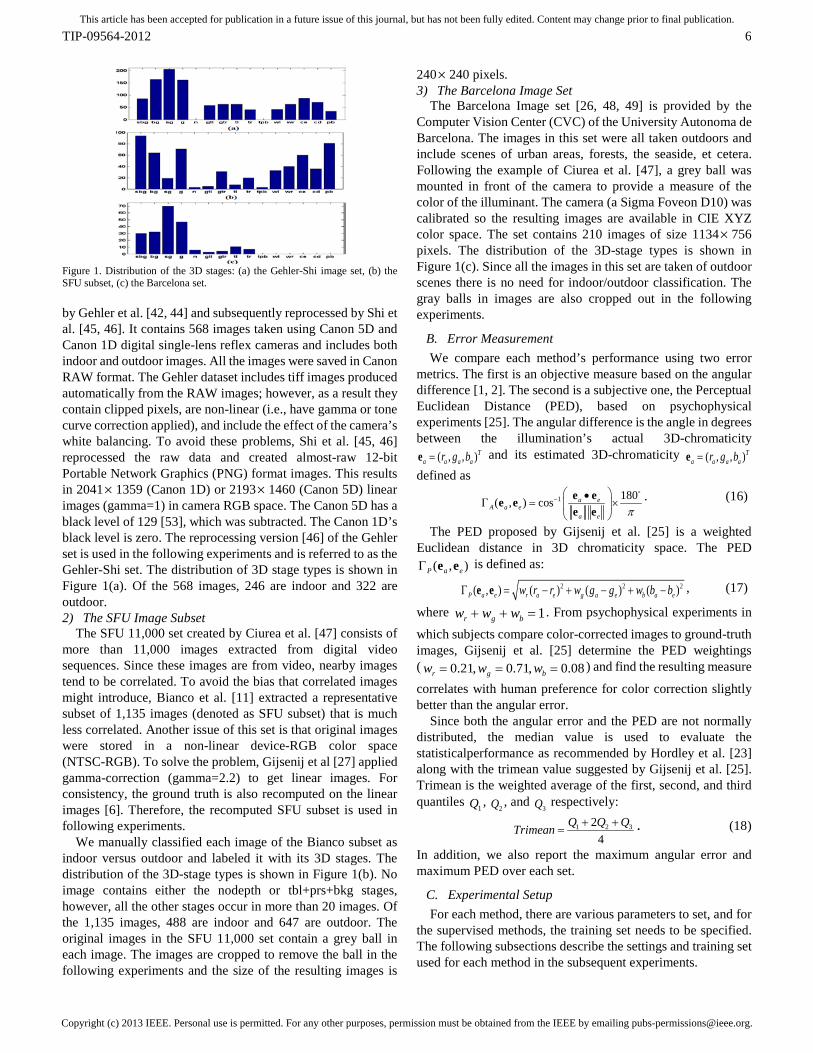
Figure 1. Distribution of the 3D stages: (a) the Gehler-Shi image set, (b) the SFU subset, (c) the Barcelona set. by Gehler et al. [42, 44] and subsequently reprocessed by Shi et al. [45, 46]. It contains 568 images taken using Canon 5D and Canon 1D digital single-lens reflex cameras and includes both indoor and outdoor images. All the images were saved in Canon RAW format. The Gehler dataset includes tiff images produced automatically from the RAW images; however, as a result they contain clipped pixels, are non-linear (i.e., have gamma or tone curve correction applied), and include the effect of the camera’s white balancing. To avoid these problems, Shi et al. [45, 46] reprocessed the raw data and created almost-raw 12-bit Portable Network Graphics (PNG) format images. This results in 2041 × 1359 (Canon 1D) or 2193 × 1460 (Canon 5D) linear images (gamma=1) in camera RGB space. The Canon 5D has a black level of 129 [53], which was subtracted. The Canon 1D’s black level is zero. The reprocessing version [46] of the Gehler set is used in the following experiments and is referred to as the Gehler-Shi set. The distribution of 3D stage types is shown in Figure 1(a). Of the 568 images, 246 are indoor and 322 are outdoor. 2) The SFU Image Subset
The SFU 11,000 set created by Ciurea et al. [47] consists of more than 11,000 images extracted from digital video sequences. Since these images are from video, nearby images tend to be correlated. To avoid the bias that correlated images might introduce, Bianco et al. [11] extracted a representative subset of 1,135 images (denoted as SFU subset) that is much less correlated. Another issue of this set is that original images were stored in a non-linear device-RGB color space (NTSC-RGB). To solve the problem, Gijsenij et al [27] applied gamma-correction (gamma=2.2) to get linear images. For consistency, the ground truth is also recomputed on the linear images [6]. Therefore, the recomputed SFU subset is used in following experiments.
We manually classified each image of the Bianco subset as indoor versus outdoor and labeled it with its 3D stages. The distribution of the 3D-stage types is shown in Figure 1(b). No image contains either the nodepth or tbl+prs+bkg stages, however, all the other stages occur in more than 20 images. Of the 1,135 images, 488 are indoor and 647 are outdoor. The original images in the SFU 11,000 set contain a grey ball in each image. The images are cropped to remove the ball in the following experiments and the size of the resulting images is
240 × 240 pixels. 3) The Barcelona Image Set
The Barcelona Image set [26, 48, 49] is provided by the Computer Vision Center (CVC) of the University Autonoma de Barcelona. The images in this set were all taken outdoors and include scenes of urban areas, forests, the seaside, et cetera. Following the example of Ciurea et al. [47], a grey ball was mounted in front of the camera to provide a measure of the color of the illuminant. The camera (a Sigma Foveon D10) was calibrated so the resulting images are available in CIE XYZ color space. The set contains 210 images of size 1134 × 756 pixels. The distribution of the 3D-stage types is shown in Figure 1(c). Since all the images in this set are taken of outdoor scenes there is no need for indoor/outdoor classification. The gray balls in images are also cropped out in the following experiments.
B. Error Measurement We compare each method’s performance using two error
metrics. The first is an objective measure based on the angular difference [1, 2]. The second is a subjective one, the Perceptual Euclidean Distance (PED), based on psychophysical experiments [25]. The angular difference is the angle in degrees between the illumination’s actual 3D-chromaticity
( , , )Ta a a ar g b=e and its estimated 3D-chromaticity ( , , )T
a a a ar g b=e defined as 1 180( , ) cos a e
A a ea e π
− •Γ = ×
e ee ee e
. (16)
The PED proposed by Gijsenij et al. [25] is a weighted Euclidean distance in 3D chromaticity space. The PED
( , )P a eΓ e e is defined as:
2 2 2( , ) ( ) ( ) ( )P a e r a e g a e b a ew r r w g g w b bΓ = − + − + −e e , (17)
where 1r g bw w w+ + = . From psychophysical experiments in
which subjects compare color-corrected images to ground-truth images, Gijsenij et al. [25] determine the PED weightings ( 0.21, 0.71, 0.08r g bw w w= = = ) and find the resulting measure
correlates with human preference for color correction slightly better than the angular error.
Since both the angular error and the PED are not normally distributed, the median value is used to evaluate the statisticalperformance as recommended by Hordley et al. [23] along with the trimean value suggested by Gijsenij et al. [25]. Trimean is the weighted average of the first, second, and third quantiles
1Q , 2Q , and
3Q respectively:
1 2 324
Q Q QTrimean + += . (18)
In addition, we also report the maximum angular error and maximum PED over each set.
C. Experimental Setup For each method, there are various parameters to set, and for
the supervised methods, the training set needs to be specified. The following subsections describe the settings and training set used for each method in the subsequent experiments.

Copyright (c) 2013 IEEE. Personal use is permitted. For any other purposes, permission must be obtained from the IEEE by emailing [email protected].
This article has been accepted for publication in a future issue of this journal, but has not been fully edited. Content may change prior to final publication.
TIP-09564-2012
7
1) SFU 321 Dataset for Parameter Selection The performance of some supervised methods in this paper,
such as SVRU, SVRC, ELM etc., depends on the choice of parameters. As described in more detail below, given a (finite) set of parameter settings from which to choose, each method is run using each possible choice and its performance evaluated via 3-fold cross validation on Barnard’s [50, 51] 321 image set (SFU 321 set). The parameter choice yielding the best performance is then used in all subsequent tests. The SFU 321 set includes 30 scenes under 11 different light sources taken with the SONY DXC-930, and are linear (gamma=1.0) with respect to scene radiance. 2) Experimental Setup for UU
The two UU methods White Patch and Grey World are the only ones having no parameters. For SoG, we set 6p = [39]. For the Grey Edge framework, we use 0,1,2n = so as to get Grey Edge algorithms of order 0, 1, and 2, respectively. For each order, we set the parameters, as summarized in Table 3, based on those Weijer et al. [38] report as performing best. The source code for these UU methods is provided by Weijer [55]. 3) Experimental Setup for SU For the SU methods, the choices are more complicated. Most of the SU methods use binarized chromaticity histograms, so the first issue is the choice of bin size. For 2D binarized chromaticity histograms, the rg-chromaticity space is divided into 50 50× bins. For 3D binarized histogram, 15 bins on the intensity component (R+G+B) is also added to resulting 50 50 15× × bins. For the BCC method, the Gehler version [42, 56] that includes the parameter λ is used here. Values of λ were selected from {0.001,0.1,1,2,5, }λ ∈ ∞ and then the corresponding BCC performance was evaluated using 3-fold cross validation on the SFU 321 set. The λ leading to the best BCC performance was chosen and used for all the subsequent experiments.
For SSS, we use the second derivative Gaussian filters at three different scales (1, 2 and 4) to extract spatio-spectral features [62]. The illumination prior is also considered for SSS in the following experiments. The source code is from Chakrabarti et al. [62, 64].
For NN, the neural network architecture and parameters are set following Cardei et al. [22]. The first hidden layer contains 200 neurons and the second layer 40 neurons. The activation function for each neuron is the sigmoid function.
For SVRU, both 2D and 3D binarized hisogram are used and denoted as SVRU(2D) and SVRU(3D), respectively. The kernels are the linear kernel and the radial basis function kernel (RBF). The optimal Kernel and corresponding parameters ,C γ are selected from {0.005,0.01,0.1,1,2,5,10}C ∈ ,
{0.025,0.05,0.1,0.2,1,2,5,10,20,50}γ ∈ and evaluated using 3-fold cross validation on the SFU 321 set.
The DGM gamut mapping method includes the computation of derivatives. Results are provided below using 1st-order derivatives in x and y (DGMx and DGMy), the gradient ( DGM∇
), 2nd-order derivatives (DGMxx, DGMxy, DGMyy,), and the Laplacian ( DGM∇∇
) using the code provided by Gijsenij
TABLE 3. PARAMETERS USED FOR DIFFERENT METHODS Method Parameter Setting
UU
SoG
SU
BCC 1λ =
SVRU(2D) r : RBF Kernel, 1, 0.025C γ= =
g : RBF Kernel, 0.1, 0.025C γ= =
SVRU(3D) r : Linear Kernel, 0.01C =
g : Linear Kernel, 0.01C =
SC
ELM 30L =
SVRC_L r : Linear Kernel, 2C =
g : Linear Kernel, 5C =
SVRC_R r : RBF Kernel, 1, 1C γ= =
g : RBF Kernel, 1, 1C γ= =
[57]. The resulting parameter settings for each SU method are then used in all subsequent testing as shown in Table 3. 4) Unitary Method Set for Combination
To test and compare the various combinational methods, we require a common set of candidate unitary methods to obtain the illumination estimates
1 2{ , ,...}E = c c for combination. Using the Grey Edge framework [38], a set of unitary methods is easily enumerated [12, 16]. We choose 6 representative unsupervised unitary methods 0,13,2 1,1,6 2,1,5{GW,SoG,WP,GE ,GE ,GE } that are widely used in combinational methods [16, 60] and 6 representative supervised unitary methods {BCC, NN, SVRU(2D), SVRU(3D), SSS, GM} for combination. Since the GM and DGM have comparable performance according to the results in [27] and in Section 5 below, GM was selected as representative of the gamut mapping-based methods. Hence, we have 12 unitary methods as a candidate set
0,13,2 1,1,6 2,1,5{GW,SoG, WP,GE ,GE ,GE ,BCC, NN, SVRU(2D), SVRU(3D), SSS, GM}US =
for combination in the following experiments. 5) Experimental Setup for the DC methods
For the UC methods, SA, N2, and MD have no parameters. However, for N-N%, there is the choice of N , which is set as 10 (N-10%) or 30 (N-30%). For No-N-Max, it is tested with
1N = (N1M) and 3N = (N3M). In terms of the SC methods, LMS has no parameters. For ELM, the number of neurons L in the hidden layer is selected from {10,20,30,...,100}L = using 3-fold cross validation on the SFU 321 set. The sigmoid function outperforms other activation functions for ELM [15] and is therefore used as its activation function in the experiments. For SVRC, both the Linear Kernel and Radial Basis function (RBF) are selected as the kernels for SVR in accordance with Li’s investigation [15]. We denote the SVRC with linear and RBF kernels as SVRC_L and SVRC_R, respectively. The best choice of parameters ,C γ is also selected from {0.005,0.01,0.1,1,2,5,10}C ∈ ,
{0.025,0.05,0.1,0.2,1,2,5,10,20,50}γ ∈ by evaluating the resulting performance using 3-fold cross validation on the SFU 321 set [15]. The parameter settings for SC methods are summarized in Table 3.
6p =0,13,2GE 0, 13, 2n p σ= = =
1,1,6GE 1, 1, 6n p σ= = =2,1,5GE 2, 1, 5n p σ= = =

Copyright (c) 2013 IEEE. Personal use is permitted. For any other purposes, permission must be obtained from the IEEE by emailing [email protected].
This article has been accepted for publication in a future issue of this journal, but has not been fully edited. Content may change prior to final publication.
TIP-09564-2012
8
TABLE 4. PERFORMANCE COMPARISON OF ALL METHODS ON THE GEHLER-SHI IMAGE SET. BOLD FONT INDICATES THE COLUMN MINIMUM. THE DO NOTHING (DN) METHOD ALWAYS ESTIMATES THE ILLUMINANT AS BEING WHITE (R=G=B). MED: MEDIAN ERROR, TRI: TRIMEAN ERROR.
Method Angular Error (Degrees) PED 100× Med Tri max Med Tri max
UU
DN 4.80 7.53 37.0 2.05 3.06 15.6 GW 3.63 3.93 24.8 1.67 1.77 11.7 SoG 4.48 5.20 36.2 2.22 2.79 22.2 WP 9.15 9.48 50.4 5.02 5.71 33
3.90 4.76 36.7 1.82 2.56 20.5 3.28 3.54 17.8 1.47 1.61 10.1 3.35 3.62 17.5 1.53 1.66 10.9
SU
BCC 5.14 5.55 37.5 2.58 2.71 16.8 NN 3.77 4.06 46.8 1.78 1.94 20.2 SVRU(2D) 5.15 5.39 28.5 2.33 2.47 14.2 SVRU(3D) 3.23 3.35 24.2 1.52 1.60 11.6 SSS 3.24 3.46 17.9 2.09 2.12 9.40 GM 3.98 4.53 28.8 1.99 2.47 12.8 DGMx 3.83 4.33 31.4 1.90 2.25 25.6 DGMy 4.01 4.59 32.8 1.93 2.29 21.7
4.03 4.52 31.2 1.91 2.25 16.8 DGMxx 4.22 4.94 30.1 2.19 2.66 15.4 DGMxy 4.42 4.97 38.3 2.36 2.68 18.9 DGMyy 4.09 4.88 37.0 1.97 2.54 20.4
4.25 4.85 30.4 2.07 2.54 16.7
UC
SA 6.09 6.1 17.7 2.86 2.87 8.19 N2 3.00 3.22 24.0 1.32 1.46 13.7 N-10% 2.98 3.21 24.4 1.33 1.46 13.8 N-30% 2.95 3.20 24.4 1.33 1.45 13.8 N1M 3.51 3.87 17.2 1.76 1.96 7.82 N3M 3.26 3.54 17.2 1.54 1.73 8.02 MD 4.86 5.02 20.7 2.20 2.28 8.67
SC
LMS 2.51 2.67 14.4 1.20 1.36 9.08 ELM 2.37 2.63 29.0 1.22 1.35 13.3 SVRC_L 2.24 2.45 16.4 1.15 1.33 10.2 SVRC_R 1.97 2.36 14.1 0.984 1.16 8.23
GC
NIS 3.12 3.34 24.2 1.45 1.59 13.4 IC 2.75 2.93 25.8 1.33 1.43 12.7 IO 2.97 3.23 24.8 1.39 1.5 12.4 SG 3.15 3.46 36.7 1.45 1.65 20.2 HVI 3.06 3.38 24.8 1.50 1.67 11.7
6) Experimental Setup for GC For the GC methods, annotated images are required for training. Although ideally the annotations would be provided automatically, for the purpose of comparing the GC methods with the other combinational methods, the images were annotated by hand in terms of their indoor/outdoor type and 3D stages. SG is applied to the whole image without segmentation [12]. For IO, the class-dependent algorithm [11] is used without automatic parameter tuning. For the3D method, if some 3D stage types are found in too few images (less than 10 in the following experiments) in the training set then during testing we average the candidate estimates rather than selecting a single optimal one. The code for NIS is provided by Gijsenij [58]. For IC, according to the settings of Bianco et al [60], we set 30 classification and regression trees (CART) in the decision forest and the class correlation is also considered. For HVI, according to the code provided by Weijer et al. [17, 65], 1000 color words, 750 shape words and 8 position bins are used to generate 30 topics via the pLSA model for the image’s content description. The combination of bottom-up and top-down processing, which achieves the best performance in [17], is adopted as the final combinational strategy.
TABLE 5. PERFORMANCE RANKING OF THE METHODS BASED ON THE FOUR DIFFERENT ERROR MEASURES REPORTED IN TABLE 4 ALONG WITH THE MEAN OF THE RESULTING RANKS WITHIN EACH CATEGORY. RM: RANK BY MEDIAN ERROR, RT: RANK BY TRIMEAN ERROR, M: MEAN RANK.
Method Angular Based Rank PED Based Rank RM M RT M RM M RT M
UU
GW 19
23.2
19
23.7
17
21
17
23.3
SoG 30 31 30 33 WP 35 35 35 35
22 25 20 29 16 15 12 12 17 17 15 14
SU
BCC 32
24.2
33
23.8
33
25.0
32
24. 2
NN 20 20 19 18 SVRU(2D) 33 32 31 26 SVRU(3D) 13 11 14 11 SSS 14 13 27 20 GM 23 23 25 25 DGMx 21 21 21 21 DGMy 24 24 23 24
25 22 22 22 DGMxx 27 28 28 30 DGMxy 29 29 32 31 DGMyy 26 27 24 28
28 26 26 27
UC
SA 34
17.3
34
17.0
34
16.7
34
16.1
N2 9 8 5 7 N-10% 8 7 7 8 N-30% 6 6 8 6 N1M 18 18 18 19 N3M 15 16 16 16 MD 31 30 29 23
SC
LMS 4
2.50
4
2.50
3
2.50
4
2.50 ELM 3 3 4 3 SVRC_L 2 2 2 2 SVRC_R 1 1 1 1
GC
NIS 11
9.00
10
10.0
11
9.80
10
10.4 IC 5 5 6 5 IO 7 9 9 9 SG 12 14 10 13 HVI 10 12 13 15
V. EXPERIMENTAL RESULTS In this section, all the unitary and combinational methods are
tested on 3 real-world image sets. Performance is evaluated in terms of both the angular and PED error measures.
A. Results on the Gehler-Shi Image Set The first experiment is with the Gehler-Shi image set. The images in the set are named in the sequence in which they were taken. As a result, neighboring images in the sequence are more likely than others to be of similar scenes. To ensure that the scenes from the training set and the test set have no overlap, we ordered all the images by their filenames, divided the resulting list in 3 and conducted cross validation using these 3 folds. Each of the first two subsets includes 189 images and the remaining one includes 190 images.
Tables 4 and 5 show the overall performance. The UU methods except WP perform similarly, with the UC methods showing slight improvement over the UU and SU methods. However, the SC methods are clearly better with the least error. The median angular error of SVRC_R is 1.97, which is the best overall. Table 5 lists the rankings based on trimean and median errors of each method as well as mean ranking of each class. As a group, the SC methods occupy the best 4 positions (lowest
0,13,2GE1,1,6GE2,1,5GE
DGM∇
DGM∇∇
0,13,2GE1,1,6GE2,1,5GE
DGM∇
DGM∇∇

Copyright (c) 2013 IEEE. Personal use is permitted. For any other purposes, permission must be obtained from the IEEE by emailing [email protected].
This article has been accepted for publication in a future issue of this journal, but has not been fully edited. Content may change prior to final publication.
TIP-09564-2012
9
TABLE 6. COMPARISON OF PERFORMANCE OF ALL METHODS ON THE SFU SUBSET. BOLD FONT INDICATES COLUMN MINIMUM.
Method Angular Error (Degrees) PED 100× Med Tri max Med Tri max
UU
DN 14.6 14.8 41.6 5.89 6.09 22.2 GW 10.8 11.3 56.4 5.43 5.74 32.2 SoG 10.4 10.6 46.8 4.99 5.02 21.4 WP 10.3 11.3 39.6 4.75 5.08 20.4
10.6 10.9 50.5 5.13 5.21 20.7 9.15 9.70 54.0 4.52 4.71 28.6 9.55 9.89 51.9 4.52 4.70 27.2
SU
BCC 10.1 10.6 41.5 4.35 4.69 19.6 NN 9.75 10.2 48.9 4.55 4.79 21.5 SVRU(2D) 11.8 12.7 36.6 5.10 5.46 19.3 SVRU(3D) 8.39 8.74 47.0 4.10 4.22 20.3 SSS 8.74 9.20 51.4 4.39 4.60 27.1 GM 12.0 12.7 43.9 5.67 6.06 24.6 DGMx 10.9 11.5 63.8 5.24 5.56 39.9 DGMy 11.2 11.6 62.5 5.11 5.41 37.8
10.4 11.0 43.6 5.09 5.26 23.0 DGMxx 11.7 12.3 46.2 5.45 5.76 30.3 DGMxy 12.0 12.4 51.1 5.58 5.78 27.4 DGMyy 11.2 11.8 48.5 5.07 5.45 24.2
11.0 11.6 52.4 4.98 5.28 23.6
UC
SA 8.95 9.20 42.7 4.07 4.22 18.3 N2 9.25 9.83 50.8 4.41 4.61 26.9 N-10% 9.14 9.76 50.5 4.32 4.56 27.2 N-30% 9.27 9.83 50.5 4.33 4.55 20.7 N1M 9.07 9.40 43.2 4.21 4.34 18.4 N3M 8.95 9.33 43.7 4.20 4.36 18.7 MD 8.80 9.17 45.8 4.09 4.27 19.8
SC
LMS 7.41 7.74 47.6 3.47 3.66 20.9 ELM 7.32 7.69 45.4 3.45 3.64 19.7 SVRC_L 7.73 8.20 48.6 3.69 3.87 21.4 SVRC_R 6.81 7.45 53.6 3.33 3.59 25.5
GC
NIS 7.58 8.25 56.4 3.86 4.07 32.0 IC 7.05 7.63 40.7 3.62 3.85 27.0 IO 7.70 8.16 56.4 3.84 4.05 32.2 SG 8.80 9.18 48.8 4.24 4.47 22.8 HVI 7.30 7.90 56.4 3.59 3.96 32.0
ranks) with an average rank of 2.5. The GC methods, especially IC method, outperform UC, UU and SU. UC methods have slightly better rankings than UU and SU. The performance and ranking of UU and SU are comparable.
B. Results on the SFU Subset The second test is with the SFU subset [11]. The SFU subset contains 15 groups of images taken in different places. Following the scheme of Gijsenij et al. [16], to ensure that the training and testing subsets are truly distinct, the 1,135 images are partitioned into 15 subsets based on geographical location. One subset is used for testing and the other 14 are used for training. This procedure is repeated 15 times with different test set selection. Tables 6 and 7 show the results based on this 15-fold cross-validation.
As with the previous experiments, there is a clear advantage to using the SC methods, particularly SVRC_R. Methods from the GC category achieve much better rankings here than on the Gehler-Shi set because the larger training set sizes result in higher accuracy in selecting the best unitary method. In particular, the IC method is ranked 2 by angular error and 5 by median PED error. The UC methods also outperform the UU and SU methods, and still have poorer performance than the GC methods.
TABLE 7. PERFORMANCE RANKING OF THE METHODS BASED ON THE 4 DIFFERENT ERROR MEASURES REPORTED IN TABLE 6 ALONG WITH THE MEAN OF THE RESULTING RANKS WITHIN EACH CATEGORY.
Method Angular Based Rank PED Based Rank RM M RT M RM M RT M
UU
GW 27
23.0
27
22.7
32
25.2
32
24.2
SoG 25 23 25 23 WP 23 26 23 24
26 24 30 25 17 16 21 21 20 20 20 20
SU
BCC 22
26.0
22
26.3
17
25.8
19
26.2
NN 21 21 22 22 SVRU(2D) 33 34 28 30 SVRU(3D) 9 9 11 10 SSS 10 13 18 17 GM 34 35 35 35 DGMx 28 28 31 31 DGMy 30 29 29 28
24 25 27 26
DGMxx 32 32 33 33 DGMxy 35 33 34 34 DGMyy 31 31 26 29
29 30 24 27
UC
SA 14
15.3
12
15.0
9
13.4
9
13.4
N2 18 18 19 18 N-10% 16 17 15 16 N-30% 19 19 16 15 N1M 15 15 13 12 N3M 13 14 12 13 MD 12 10 10 11
SC
LMS 5
4.5
4
3.75
3
3.00
3
2.75 ELM 4 3 2 2 SVRC_L 8 7 6 5 SVRC_R 1 1 1 1
GC
NIS 6
5.80
8
6.40
8
7.60
8
7.80 IC 2 2 5 4 IO 7 6 7 7 SG 11 11 14 14 HVI 3 5 4 6
C. Results on the Barcelona Set The final test is on the Barcelona set. As with the SFU set,
the Barcelona set contains 3 groups of images taken in different places. The data set is partitioned into 3 folds based on location for 3-fold cross-validation. The median, trimean, and maximum values of the angular and PED errors are listed in Table 8. Table 9 shows their rankings and also provides average ranks of the methods within each category.
Table 9 shows that the SC methods are clearly the best with average rank of 5.0 (median angular), 6.50 (trimean angular), 4.75(median PED), and 5.0(trimean PED). From Table 8, SVRC_R still achieves the lowest median angular error (2.52) and median PED error (1.21) as well as much lower trimean errors. A very interesting phenomenon in this set is that the UC methods obviously outperform the GC methods. This result is completely different from the previous two experiments. This probably is because there are only 210 images in the set and so only about 140 images are available for training in each cross-validation. It is difficult for GC methods to learn an effective classifier with which to select one of the 12 unitary methods given very few training images. The SC methods, however, still perform well even when given a small training set. The essence of the GC methods is multi-class classification,
0,13,2GE1,1,6GE2,1,5GE
DGM∇
DGM∇∇
0,13,2GE1,1,6GE2,1,5GE
DGM∇
DGM∇∇

Copyright (c) 2013 IEEE. Personal use is permitted. For any other purposes, permission must be obtained from the IEEE by emailing [email protected].
This article has been accepted for publication in a future issue of this journal, but has not been fully edited. Content may change prior to final publication.
TIP-09564-2012
10
TABLE 8. COMPARISON OF PERFORMANCE OF ALL METHODS ON THE BARCELONA IMAGE SET. BOLD FONT INDICATES COLUMN MINIMUM.
Method Angular Error (Degrees) PED 100× Med Tri max Med Tri max
UU
DN 4.01 4.20 13.0 2.27 2.31 6.30 GW 4.61 4.57 26.4 2.19 2.20 13.2 SoG 3.76 3.89 18.5 2.02 2.00 8.64 WP 4.60 4.46 19.6 2.78 2.69 8.72
3.7 3.69 17.7 2.01 2.02 8.4 3.91 4.26 17.4 1.93 2.04 8.37 4.66 4.78 16.2 2.20 2.28 7.85
SU
BCC 4.09 4.17 22.7 2.05 2.06 10.4 NN 4.47 4.64 26.9 2.36 2.4 12.9 SVRU(2D) 3.39 3.70 16.2 1.66 1.78 7.13 SVRU(3D) 3.08 3.38 19.0 1.50 1.63 8.5 SSS 4.23 4.35 23.3 2.10 2.20 11.5 GM 4.19 4.59 90.2 2.19 2.41 171 DGMx 5.91 6.14 48.3 3.45 3.50 34.6 DGMy 6.19 6.44 33.4 3.56 3.64 19.1
5.81 5.95 17.6 3.23 3.37 10.1 DGMxx 5.79 6.32 36.3 3.16 3.41 21.8 DGMxy 5.84 6.14 36.6 3.10 3.20 22.1 DGMyy 6.07 6.04 34.7 3.26 3.40 20.1
5.40 5.47 17.7 2.93 2.93 9.78
UC
SA 2.81 2.89 33.3 1.40 1.46 17.1 N2 3.58 3.74 19.3 1.85 1.89 8.61 N-10% 3.53 3.69 19.6 1.84 1.89 8.72 N-30% 3.54 3.74 19.6 1.88 1.91 8.72 N1M 2.85 2.91 15.7 1.38 1.41 7.51 N3M 2.83 2.93 15.7 1.40 1.47 7.51 MD 3.08 3.06 16.9 1.45 1.49 8.06
SC
LMS 3.68 3.80 27.0 1.80 1.82 11.3 ELM 2.68 2.97 20.5 1.42 1.54 10.9 SVRC_L 2.69 2.85 17.3 1.25 1.35 7.71 SVRC_R 2.52 2.93 15.9 1.21 1.40 7.05
GC
NIS 4.10 4.23 23.3 1.94 2.03 11.5 IC 3.55 3.75 21.7 1.83 1.90 9.37 IO 4.17 4.40 23.3 2.13 2.23 11.5 SG 4.27 4.63 19.0 2.20 2.28 8.87 HVI 4.23 4.34 26.4 2.11 2.12 13.2
which is easily affected by having too small a training set, while the essence of the SC methods is regression, which turns out not to be so affected by the size of the training set. Section 6.4 includes a more detailed discussion of this topic.
D. Efficiency Comparison The relative efficiency of the combinational methods is
measured in terms of the average computational time per image of the SFU subset [11]. The code of each combinational method is implemented in Matlab7.14 and is run on an Intel Core i7-2600 3.40GHz with 4 GB RAM. Since the supervised methods involve training that can be carried out in manner of offline, training time is not considered. Furthermore, considering that all these combinational methods share the same unitary methods, the computation time of these unitary methods is also ignored. The average test time per image for each combinational method is listed in Table 10.
According to Table 10, the UC methods are the fastest, with SA requiring only 65 10−× s per image. The SC methods are significantly faster than the GC ones. SVRC_R, which had the best ranking in terms of accuracy above, requires only
42.51 10−× s per image, which is fast enough for real-time applications. Although the RBF nonlinear kernel is used in
TABLE 9. PERFORMANCE RANKING OF THE METHODS BASED ON THE FOUR DIFFERENT ERROR MEASURES REPORTED IN TABLE 8 ALONG WITH THE MEAN OF THE RESULTING RANKS WITHIN EACH CATEGORY. RBYM: RANK BY MEDIAN ERROR, RBYT: RANK BY TRIMEAN ERROR.
Method Angular Based Rank PED Based Rank RM M RT M RM M RT M
UU
GW 27
21.5
24
19.8
23
21.2
22
20.5
SoG 16 16 18 15 WP 26 23 28 28
15 9 17 16 17 19 15 18 28 28 26 24
SU
BCC 18
25.8
17
25.6
19
25.5
19
25.7
NN 25 27 27 26 SVRU(2D) 9 11 9 9 SVRU(3D) 7 8 8 8 SSS 22 21 20 21 GM 21 25 24 27 DGMx 33 33 34 34 DGMy 35 35 35 35
31 30 32 31
DGMxx 30 34 31 33 DGMxy 32 32 30 30 DGMyy 34 31 33 32
29 29 29 29
UC
SA 4
8.14
2
7.43
4
8.29
4
7.86
N2 13 12 13 11 N-10% 10 10 12 12 N-30% 11 13 14 14 N1M 6 3 3 3 N3M 5 5 5 5 MD 8 7 7 6
SC
LMS 14
5.00
15
6.50
10
4.75
10
5.00 ELM 2 6 6 7 SVRC_L 3 1 2 1 SVRC_R 1 4 1 2
GC
NIS 19
19.6
18
20.0
16
19.0
17
19.6 IC 12 14 11 13 IO 20 22 22 23 SG 24 26 25 25 HVI 23 20 21 20
SVRC_R, the dimension of the input vector
1 2 | |[ , ,..., ]TE=V c c c is
only 24, so speed is not compromised. Compared with UC and SC methods, the GC methods are slow because they are based on extracting a high-dimensional set of image features. HVI, for example, requires a more than 1000-dimensional feature vector with the result that it takes 2.53s per image.
VI. EXPERIMENTAL RESULTS ANALYSIS
A. Consistency Analysis In the above evaluation, the methods are ranked using 4 different error statistics on 3 different image sets. It is natural to ask whether or not the rankings are consistent across the different sets and across the different error measures. These questions can be addressed using ranking correlation which involves the Kendal-tau distance between two ranking lists [28, 29] and is defined as follows. Let π and θ be two full lists of numbers from{1,2,..., }n representing rankings. The Kendal-tau K -distance of π and θ , denoted ( , )K π θ , is the number of
pairs ( , )i j , , {1,2,..., }i j n∈ , such that i jπ π< but i jθ θ> .
Therefore, the K -distance counts the number of times the two
0,13,2GE1,1,6GE2,1,5GE
DGM∇
DGM∇∇
0,13,2GE1,1,6GE2,1,5GE
DGM∇
DGM∇∇

Copyright (c) 2013 IEEE. Personal use is permitted. For any other purposes, permission must be obtained from the IEEE by emailing [email protected].
This article has been accepted for publication in a future issue of this journal, but has not been fully edited. Content may change prior to final publication.
TIP-09564-2012
11
lists differ in their rankings. Clearly, ( 1)0 ( , )2
n nK π θ −≤ ≤ .
Analogous to the definition of the Kendall coefficient of rank correlation [52], we measure the consistency between two ranking lists in terms of their K -distance as:
2 ( , )( , ) 1( 1)
KConn n
π θπ θ ×= −
× −. (19)
( , ) [0,1]Con π θ ∈ and larger values of ( , )Con π θ imply a greater consistency between the two ranking lists.
Figure 2 shows the 3 confusion matrices representing the ranking consistencies among the 4 different error statistics (median angular, trimean angular, median PED, trimean PED) for each of the 3 image sets. All the consistencies are high, with the mean value (excluding the consistencies of a measure with itself) always being above 0.94. It is particularly interesting that the rankings derived from the angular and PED rankings are so similar.
Figure 3 shows the ranking consistency across the different image sets and corresponding mean consistency values (excluding the consistency of an image set with itself). Although the consistencies between the image set pairs are slightly lower than those in Figure 2, the consistency is nonetheless still quite clear with the mean values being 0.71 and above.
B. Comprehensive Performance Comparison The clear consistency of the ranking lists across error
statistics and image sets shown in Figures 2 and 3 indicates that the rankings are basically consistent, and also suggests that it should be safe to make generalizations about the performance of the various methods based on the rankings given in Tables 4, 6 and 8.
One conclusion that can be drawn—perhaps not surprisingly—is that combinational methods irrespective of their combining strategies generally tend to work better than all the unitary methods. The experimental results on the 3 image sets all validate this point.
However, the combining strategy does matter. In particular, methods from the SC category outperform those from both the UC and GC categories. This is particularly true for the SVRC_R, SVRC_L and ELM methods. Furthermore, in terms of rankings, SVRC_R is consistently ranked number 1 by all 4 error measures on all 3 image sets, with the exception of the trimean angular error (rank 4) and trimean PED error (rank 2) on the Barcelona set. The ELM and SVRC_L also consistently rank well.
The mean rankings of the GC methods range from 6 to 20, which is low enough to indicate that higher-level image content-related features are useful in estimating the illuminant, but they are not perfect. These GC methods require automatic scene content classification and understanding, which is in itself a difficult problem.
Figure 2. Consistency between the statistical error measures represented in terms of a confusion matrix for each image set: (a) Gehler-Shi image set, (b) SFU subset, (c) Barcelona set. MA: Median Angular, TA: Trimean Angular, MP: Median PED, TP: Trimean PED.
Figure 3. Consistency between the rankings from the different image sets represented in terms of a confusion matrix for each error measure: (a) median of angular errors, (b) trimean angular errors, (c) median of PEDs, and (d) trimean of PEDs. G-S: Gehler-Shi set, SFU: SFU subset, BAR: Barcelona Set.
C. Comparison Between UC and SC The UC and SC methods aim to find a function ()Reg
mapping the estimates of unitary methods 1 2 | |[ , ,..., ]T
E=V c c c
to the true illumination chromaticity c of an image. It can be formulated as: ( )Reg=c V , (20) where the outputs of ()Reg are continuous values, so the essence of the UC and SC methods is regression. The difference between them is that the UC methods predefine a simple linear regression function ()Reg , whereas, the SC methods learn the linear/non-linear regression function ()Reg via machine learning technique. Since it is very difficult (or even impossible) for any predefined simple linear regression function always to correctly reflect the underlying relationship between V and c for every image set, the UC methods generally do not perform as well as the SC methods.
D. Comparison Between SC and GC In contrast to the SC and UC methods, the goal of the GC
methods is to find a classification function ()Cls that can select the most appropriate unitary method τ from a given set of candidate unitary methods based on features ξ of the image. In
TABLE 10. COMPUTATION TIME IN SECONDS PER IMAGE FOR THE VARIOUS COMBINATIONAL METHODS Category UC ( 410−× ) SC ( 410−× ) GC Method SA N2 N-N% NNM MD LMS ELM SVRC_L SVRC_R NIS IC IO SG HVI
Time (sec) 0.05 0.12 0.21 0.14 0.07 0.37 1.13 1.22 2.51 0.26 0.17 0.24 0.27 2.53 Mean 0.12 1.31 0.69
Copyright (c) 2013 IEEE. Personal use is permitted. For any other purposes, permission must be obtained from the IEEE by emailing [email protected].
This article has been accepted for publication in a future issue of this journal, but has not been fully edited. Content may change prior to final publication.
TIP-09564-2012
12
TABLE 11. PERFORMANCE OF THE GC METHOD WHEN IT ALWAYS MAKES THE OPTIMAL CHOICE OF UNITARY METHOD
Image Set Angular Error (Degrees) PED 100× Median Trimean Max Median Trimean Max
Gehler-Shi 0.82 0.83 8.21 0.49 0.55 28.1 SFU subset 2.33 2.52 30.1 1.34 1.46 15.3 Barcelona 0.95 0.87 8.93 0.54 0.58 4.69
other words,
( ), where {GW,SoG, WP,...},Clsτ ξ τ= ∈ (21) where τ is a method label and the output of ()Cls is discrete label value. As such, the GC methods can be viewed as classification methods.
Consider the ideal situation in which we obtain a perfectly accurate regression function ()Reg and a perfectly accurate classification function ()Cls . In this idea case, the angular errors of the SC methods will be 0, while the angular errors of the GC methods generally not be 0, since they are determined by the selected unitary method and it is unlikely to make a perfect estimate. Table 11 lists the angular errors of the GC methods for this ideal situation, where the best unitary method is chosen for each input image. The angular errors are still much larger than 0. For the SFU subset, the median angular error of 2.33 is still significant. This ideal case test shows that the performance of the GC methods is largely decided by performance of the best unitary method available for each image. In comparison, the regression-based SC methods incorporate a re-estimation step that combines the individual estimates and thereby greatly reduces the bias present in even the best unitary method. Therefore, from the viewpoint of objective function, the SC methods generally perform better and are more stable than the GC methods.
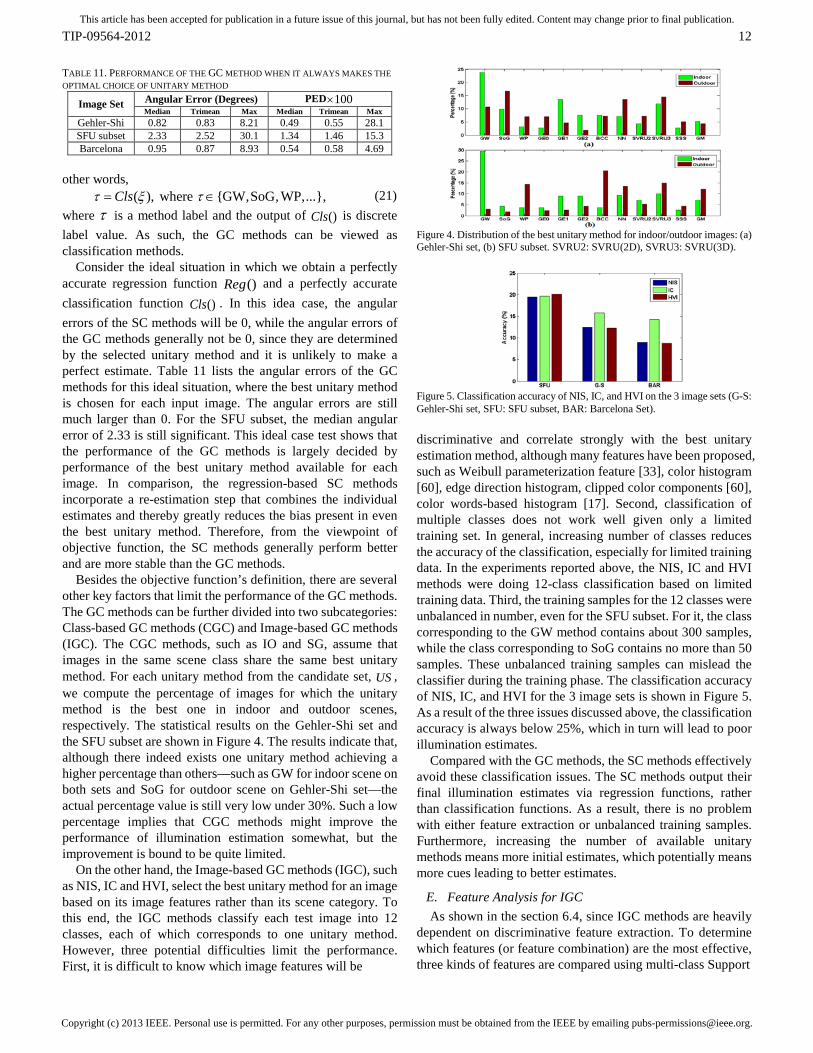
Besides the objective function’s definition, there are several other key factors that limit the performance of the GC methods. The GC methods can be further divided into two subcategories: Class-based GC methods (CGC) and Image-based GC methods (IGC). The CGC methods, such as IO and SG, assume that images in the same scene class share the same best unitary method. For each unitary method from the candidate set, US , we compute the percentage of images for which the unitary method is the best one in indoor and outdoor scenes, respectively. The statistical results on the Gehler-Shi set and the SFU subset are shown in Figure 4. The results indicate that, although there indeed exists one unitary method achieving a higher percentage than others—such as GW for indoor scene on both sets and SoG for outdoor scene on Gehler-Shi set—the actual percentage value is still very low under 30%. Such a low percentage implies that CGC methods might improve the performance of illumination estimation somewhat, but the improvement is bound to be quite limited.
On the other hand, the Image-based GC methods (IGC), such as NIS, IC and HVI, select the best unitary method for an image based on its image features rather than its scene category. To this end, the IGC methods classify each test image into 12 classes, each of which corresponds to one unitary method. However, three potential difficulties limit the performance. First, it is difficult to know which image features will be
Figure 4. Distribution of the best unitary method for indoor/outdoor images: (a) Gehler-Shi set, (b) SFU subset. SVRU2: SVRU(2D), SVRU3: SVRU(3D).
Figure 5. Classification accuracy of NIS, IC, and HVI on the 3 image sets (G-S: Gehler-Shi set, SFU: SFU subset, BAR: Barcelona Set). discriminative and correlate strongly with the best unitary estimation method, although many features have been proposed, such as Weibull parameterization feature [33], color histogram [60], edge direction histogram, clipped color components [60], color words-based histogram [17]. Second, classification of multiple classes does not work well given only a limited training set. In general, increasing number of classes reduces the accuracy of the classification, especially for limited training data. In the experiments reported above, the NIS, IC and HVI methods were doing 12-class classification based on limited training data. Third, the training samples for the 12 classes were unbalanced in number, even for the SFU subset. For it, the class corresponding to the GW method contains about 300 samples, while the class corresponding to SoG contains no more than 50 samples. These unbalanced training samples can mislead the classifier during the training phase. The classification accuracy of NIS, IC, and HVI for the 3 image sets is shown in Figure 5. As a result of the three issues discussed above, the classification accuracy is always below 25%, which in turn will lead to poor illumination estimates.
Compared with the GC methods, the SC methods effectively avoid these classification issues. The SC methods output their final illumination estimates via regression functions, rather than classification functions. As a result, there is no problem with either feature extraction or unbalanced training samples. Furthermore, increasing the number of available unitary methods means more initial estimates, which potentially means more cues leading to better estimates.
E. Feature Analysis for IGC As shown in the section 6.4, since IGC methods are heavily
dependent on discriminative feature extraction. To determine which features (or feature combination) are the most effective, three kinds of features are compared using multi-class Support

Copyright (c) 2013 IEEE. Personal use is permitted. For any other purposes, permission must be obtained from the IEEE by emailing [email protected].
This article has been accepted for publication in a future issue of this journal, but has not been fully edited. Content may change prior to final publication.
TIP-09564-2012
13
Figure 6. Feature comparison for best unitary method classification in IGC.
Figure 7. The median angular errors of the combinational methods applied to indoor versus outdoor scenes: (a) Gehler-Shi set, (b) SFU subset. Vector Machines (SVM). Besides the Weibull parameterization feature (denoted as ‘W’) [33] and the content-related features used in IC [60] (denoted as ‘C’), the tests also include the SIFT descriptors [67] as a feature. After extracting dense SIFT descriptors for each image, we construct a 100 visual word vocabulary in the Bag-of-Words framework using K-means [68]. Given this vocabulary, each image is represented as a 100-dimensional histogram of visual words (denoted as ‘S’).
The SFU subset is used for evaluating and comparing the three types of features. Considering the problem of an unbalanced number of training samples discussed above, we sort the 12 unitary methods in term of decreasing sample number and then select only the top u unitary methods as the candidate set for IGC. The accuracy of classification for the resulting u classes ( 3,6,12u = ) using the SVM classifier via 15-fold cross-validation on the SFU subset is shown in Figure 6.
From Figure 6 it is clear that the Weibull parameterization feature and content-related features [60] lead to better classifications than the SIFT descriptor. The ‘W+C’ combination is the best feature and outperforms all the other features. Even so, its performance is not good enough, especially for more than 3 classes. Consequently, discovering more discriminative features is important for any future improvement of ICG methods.
VII. SCENE CLASSIFICATION FOR COMBINATION Since indoor and outdoor scenes and their respective illuminants are quite different, we investigate how the scene category affects the performance of each combinational method. The performance results reported in Section 5 are for the image set as a whole. Here we report the performance on indoor and outdoor images separately. Note that the estimates of each method are the same as those in Section 5, only the statistical analysis is different here. Since the Barcelona set has no indoor
Figure 8. Performance of the combinational methods based on either the UU set
or the SU set of unitary methods. (a) Gehler-Shi set, (b) SFU subset, (c) Barcelona set.
Figure 9. Performance as a function of the number of unitary methods for four unitary methods. (a) Average median angular error over 10 repeats. (b) Minimum median angular error over 10 repeats. images, it is excluded from further consideration here. The images in the other two sets are divided into indoor and outdoor subsets. The results for each combinational method are also divided into two corresponding subsets, and the median angular error for each combinational method is computed separately for each subset and plotted in Figure 7.
As can be seen from Figure 7, for the SC (LMS, ELM SVRC_L, SVRC_R) and GC (NIS, IC, SG, HVI) methods, the median angular error for indoor scenes is generally larger than for outdoor scenes. This difference is mainly due to the uneven number of images in the indoor and outdoor subsets, with the ratio being about 1:1.3. Since both SC and GC are supervised methods, the imbalance in the training sets inevitably biases their predictions. However, the IO method is not affect by the imbalance because it processes the indoor and outdoor images separately. Similarly, the unsupervised UC methods are not affected either. So it is difficult to get a fair result if we apply a unified combinational model on both indoor and outdoor images simultaneously. A good alternative is to use different combinational schemes for indoor and outdoor images.
VIII. UNITARY METHOD SETTING FOR COMBINATION The combinational methods rely on using estimates provide by a given set of unitary methods. Two questions arise. Are UU methods or SU methods more useful? And how does the number of available methods affect the resulting performance?
A. Performance Comparison using UU or SU for Combination
To establish whether estimates from UU versus SU methods are more useful for combination, we divided the set of unitary
Copyright (c) 2013 IEEE. Personal use is permitted. For any other purposes, permission must be obtained from the IEEE by emailing [email protected].
This article has been accepted for publication in a future issue of this journal, but has not been fully edited. Content may change prior to final publication.
TIP-09564-2012
14
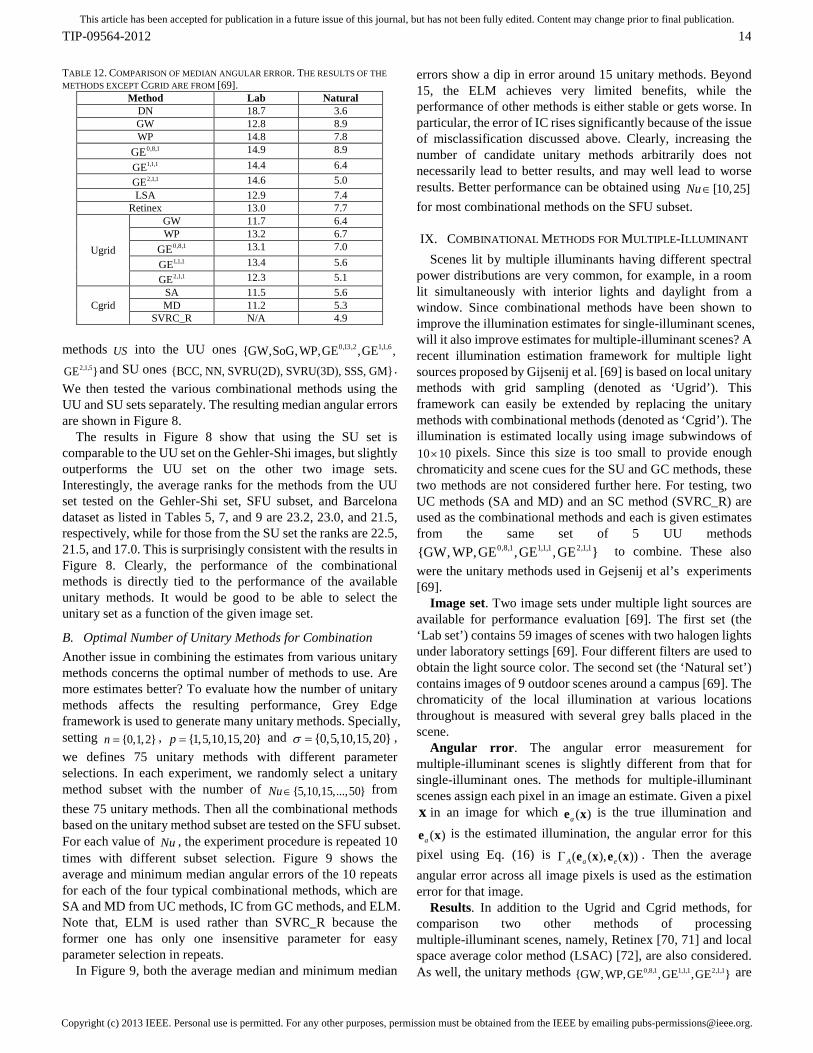
TABLE 12. COMPARISON OF MEDIAN ANGULAR ERROR. THE RESULTS OF THE METHODS EXCEPT CGRID ARE FROM [69].
Method Lab Natural DN 18.7 3.6 GW 12.8 8.9 WP 14.8 7.8
0,8,1GE 14.9 8.9 1,1,1GE 14.4 6.4 2,1,1GE 14.6 5.0
LSA 12.9 7.4 Retinex 13.0 7.7
Ugrid
GW 11.7 6.4 WP 13.2 6.7
0,8,1GE 13.1 7.0 1,1,1GE 13.4 5.6 2,1,1GE 12.3 5.1
Cgrid SA 11.5 5.6 MD 11.2 5.3
SVRC_R N/A 4.9 methods US into the UU ones 0,13,2 1,1,6{GW,SoG,WP,GE ,GE ,
2,1,5GE }and SU ones {BCC, NN, SVRU(2D), SVRU(3D), SSS, GM}. We then tested the various combinational methods using the UU and SU sets separately. The resulting median angular errors are shown in Figure 8.
The results in Figure 8 show that using the SU set is comparable to the UU set on the Gehler-Shi images, but slightly outperforms the UU set on the other two image sets. Interestingly, the average ranks for the methods from the UU set tested on the Gehler-Shi set, SFU subset, and Barcelona dataset as listed in Tables 5, 7, and 9 are 23.2, 23.0, and 21.5, respectively, while for those from the SU set the ranks are 22.5, 21.5, and 17.0. This is surprisingly consistent with the results in Figure 8. Clearly, the performance of the combinational methods is directly tied to the performance of the available unitary methods. It would be good to be able to select the unitary set as a function of the given image set.
B. Optimal Number of Unitary Methods for Combination Another issue in combining the estimates from various unitary methods concerns the optimal number of methods to use. Are more estimates better? To evaluate how the number of unitary methods affects the resulting performance, Grey Edge framework is used to generate many unitary methods. Specially, setting {0,1,2}n = , {1,5,10,15,20}p = and {0,5,10,15,20}σ = , we defines 75 unitary methods with different parameter selections. In each experiment, we randomly select a unitary method subset with the number of {5,10,15,...,50}Nu ∈ from these 75 unitary methods. Then all the combinational methods based on the unitary method subset are tested on the SFU subset. For each value of Nu , the experiment procedure is repeated 10 times with different subset selection. Figure 9 shows the average and minimum median angular errors of the 10 repeats for each of the four typical combinational methods, which are SA and MD from UC methods, IC from GC methods, and ELM. Note that, ELM is used rather than SVRC_R because the former one has only one insensitive parameter for easy parameter selection in repeats.
In Figure 9, both the average median and minimum median
errors show a dip in error around 15 unitary methods. Beyond 15, the ELM achieves very limited benefits, while the performance of other methods is either stable or gets worse. In particular, the error of IC rises significantly because of the issue of misclassification discussed above. Clearly, increasing the number of candidate unitary methods arbitrarily does not necessarily lead to better results, and may well lead to worse results. Better performance can be obtained using [10,25]Nu ∈ for most combinational methods on the SFU subset.
IX. COMBINATIONAL METHODS FOR MULTIPLE-ILLUMINANT Scenes lit by multiple illuminants having different spectral
power distributions are very common, for example, in a room lit simultaneously with interior lights and daylight from a window. Since combinational methods have been shown to improve the illumination estimates for single-illuminant scenes, will it also improve estimates for multiple-illuminant scenes? A recent illumination estimation framework for multiple light sources proposed by Gijsenij et al. [69] is based on local unitary methods with grid sampling (denoted as ‘Ugrid’). This framework can easily be extended by replacing the unitary methods with combinational methods (denoted as ‘Cgrid’). The illumination is estimated locally using image subwindows of 10 10× pixels. Since this size is too small to provide enough chromaticity and scene cues for the SU and GC methods, these two methods are not considered further here. For testing, two UC methods (SA and MD) and an SC method (SVRC_R) are used as the combinational methods and each is given estimates from the same set of 5 UU methods
0,8,1 1,1,1 2,1,1{GW, WP,GE ,GE ,GE } to combine. These also were the unitary methods used in Gejsenij et al’s experiments [69].
Image set. Two image sets under multiple light sources are available for performance evaluation [69]. The first set (the ‘Lab set’) contains 59 images of scenes with two halogen lights under laboratory settings [69]. Four different filters are used to obtain the light source color. The second set (the ‘Natural set’) contains images of 9 outdoor scenes around a campus [69]. The chromaticity of the local illumination at various locations throughout is measured with several grey balls placed in the scene.
Angular rror. The angular error measurement for multiple-illuminant scenes is slightly different from that for single-illuminant ones. The methods for multiple-illuminant scenes assign each pixel in an image an estimate. Given a pixel x in an image for which ( )ae x is the true illumination and
( )ae x is the estimated illumination, the angular error for this pixel using Eq. (16) is ( ( ), ( ))A a eΓ e x e x . Then the average angular error across all image pixels is used as the estimation error for that image.
Results. In addition to the Ugrid and Cgrid methods, for comparison two other methods of processing multiple-illuminant scenes, namely, Retinex [70, 71] and local space average color method (LSAC) [72], are also considered. As well, the unitary methods 0,8,1 1,1,1 2,1,1{GW,WP,GE ,GE ,GE } are

Copyright (c) 2013 IEEE. Personal use is permitted. For any other purposes, permission must be obtained from the IEEE by emailing [email protected].
This article has been accepted for publication in a future issue of this journal, but has not been fully edited. Content may change prior to final publication.
TIP-09564-2012
15
also directly applied to the images in the two sets. For the Natural set, we used images from the Barcelona set for training SVRC_R in Cgrid, since they are captured outdoors using the same Sigma SD10 camera with Foveon X3 sensor. For Lab set, the Cgrid method based on SVRC_R is not considered since there is no training set with the same single lighting conditions as under the laboratory setting.
The median angular errors of all the methods are given in Table 12. Cgrid methods based on the combinational methods outperform all the other methods on the Lab set. The performance of Cgrid based on SA and MD is comparable to that of Ugrid methods on the Natural set. Cgrid based on SVRC_R is better than the other methods on the Natural set. On the Natural set, the best performance is with the Do Nothing (DN) method. Unfortunately, there is only a very small variation in the illumination across the 9 images in this data set [69]. However, for the 4 images for which the illumination is not white, Cgrid using SVRC_R is better than DN. Since the number of test images is relatively small, it is difficult to draw any strong conclusions. However, directly applying combinational methods under the Cgrid framework may help in multiple-illuminant scenes.
X. CONCLUSION Based on the consistency of the overall ranking of the methods across different error measures and image sets as shown in Figures 2 and 3 and the subsequent analysis, we can safely draw a number of conclusions about combinational versus unitary methods for illumination estimation. First, the results show that combinational methods generally work better than any unitary method on its own. Of the combinational methods, the SC ones—SVRC with RBF kernel in particular—are the best on each of the 3 image sets. The GC ones outperform the UC ones on the two larger sets, but not on the smaller Barcelona set. Although the UC methods do not perform quite as well as the SC and GC methods, they have the advantage that they are simpler, efficient and do not require training. A second conclusion is that the success of the guided combination methods shows that high-level analysis of image content does provide cues that can improve overall performance. However, compared with the supervised combination methods, the guided combination performance is hampered by the fact that they utilize indirect objective functions, require effective extraction of image features, involve multi-class classification and depend on a balanced training set. In terms of image features to use in guided combination, we revealed SIFT features to be unsuitable, and that a combination of Weibull features and the content-based features introduced by Bianco et al. [60] to be most effective for guided combination.
A third conclusion is that the combinational methods clearly depend upon the accuracy of the unitary methods whose results they combine. Having a sufficient number of unitary methods available is crucial; however, increasing the number arbitrarily does necessarily help. Testing showed that the best results were obtained when there were approximately 20 estimates from unitary methods available for to combine.
The final conclusion is that when tested on scenes with multiple light sources, combinational methods continue to outperform unitary methods, although not by a large amount of improvement.
According to the analysis and experimental results, we can obtain an observation that none of the combinational methods tested in this paper worked best on both the indoor image sets and the outdoor ones, although several of the direct combination (DC) methods worked well on one type or the other. This leads us to propose an alternative method that adds an extra meta-layer of guidance in order to choose the appropriate direct combination method to apply as a function of the scene type. This so-called scene-classification-guided direct combination is an interesting future research direction.
ACKNOWLEDGEMENTS This work was supported by the National Nature Science Foundation of China (No. 61005030, 60935002 and 60825204) and Chinese National Programs for High Technology Research and Development (863 Program) (No.2012AA012503 and No. 2012AA012504), as well as the Natural Sciences and Engineering Research Council of Canada.
REFERENCES [1] K. Barnard, V. Cardei, and B. Funt, “A comparison of computational
color constancy algorithms-part 1: Methodology and experiments with synthesized data”. IEEE TIP, 11(9): 972-983, 2002.
[2] K. Barnard, L. Martin, A. Coath, and B. Funt, “Comparison of computational color constancy algorithms-part 2: Experiments with Image Data”. IEEE TIP, 11(9): 985-996, 2002.
[3] J. J. McCann, S. P. McKee, and T. H. Taylor, “Quantitative Studies in Retinex Theory: A Comparison between Theoretical Predictions and Observer Responses to the ‘Color Mondrian’”. Vision Research, 16(5): 445-458, 1976.
[4] D. A. Brainard, and B. A. Wandell, “Asymmetric color matching: how color appearance depends on the illuminant”. Journal of the Optical Society of America A, 9 (9): 1433-1448, 1992.
[5] A. D. Logvinenko, “An object-color space”. Journal of Vision, 9(11):5, 2009.
[6] G. D. Finlayson and G. Schaefer, “Solving for Color Constancy Using a Constrained Dichromatic Reflection Model,” IJCV, 42(3):127–144, 2001.
[7] G. D. Finlayson, S. D. Hordley, and R. Xu, “Convex programming colour constancy with a diagonal-offset model”. IEEE ICIP, 948–951, 2005.
[8] S. D. Hordley, “Scene Illuminant Estimation: Past, Present, and Future”. Color Research and Application, 31(4): 303-314, 2006.
[9] G. D. Finlayson, M. S. Drew, and B. Funt, “Color Constancy: Generalized Diagonal Transforms Suffice”. Journal of the Optical Society of America A, 11(11): 3011-3019, 1994.
[10] J. Von Kries, “Influence of adaptation on the effects produced by luminous stimuli”. Sources of color vision. Cambridge: MIT Press, 1970.
[11] S. Bianco, G. Ciocca, C. Cusano, and R. Schettini, “Improving Color Constancy using Indoor-outdoor Image Classification”. IEEE TIP, 17(12): 2381-2392, 2009.
[12] R. Lu, A.Gijsenij, T. Gevers, V. Nedovic, and D. Xu, “Color Constancy using 3D Scene Geometry”. ICCV, 1749-1756, 2009.
[13] S. Bianco, F. Gasparini, and R. Schettini, “Consensus-based framework for illuminant chromaticity estimation”. Journal of Electronic Imaging, 17(2): 023013, 2008.
[14] V. Cardei, and B. Funt, “Committee-based color constancy”. In Proceeding of IS&T/SID Color Imaging Conference (CIC), 311-313, 1999.
[15] B. Li, W. Xiong, and D. Xu, “A Supervised Combination Strategy for Illumination Chromaticity Estimation”. ACM TAP, 8(1):5, 2010.
[16] A. Gijsenij, and T. Gevers, “Color Constancy using Natural Image Statistics and Scene Semantics”. IEEE TPAMI, 33(4): 687 - 698, 2011.

Copyright (c) 2013 IEEE. Personal use is permitted. For any other purposes, permission must be obtained from the IEEE by emailing [email protected].
This article has been accepted for publication in a future issue of this journal, but has not been fully edited. Content may change prior to final publication.
TIP-09564-2012
16
[17] J. van de Weijer, C. Schmid, and J. Verbeek, “Using High-Level Visual Information for Color Constancy”. ICCV, 1-8, 2007.
[18] G. Buchsbaum, “A spatial processor model for object colour perception”. J. Frank. Inst., 310(1): 1-26, 1980.
[19] E. H. L and, “The retinex theory of color vision”. Sci. Amer., 237(6): 108–128, 1977.
[20] D. A. Forsyth, “A novel algorithm for color constancy”. IJCV, 5(1):5–36, 1990.
[21] G. D. Finlayson, S. D. Hordley, and P. Hubel, “Color by correlation: A simple unifying framework for color constancy”. IEEE TPAMI, 22(11): 1209–1221, 2001.
[22] V. Cardei, B. Funt, and K. Barnard, “Estimating the Scene Illumination Chromaticity Using a Neural Network”. Journal of the Optical Society of America A, 19(12): 2374-2386, 2002.
[23] S. D. Hordley, and G. D. Finlayson, “Reevaluation of color constancy algorithm performance”. Journal of the Optical Society of America A, 23(5):1008-1020, 2006.
[24] V. Agarwal, B. R. Abidi, A. Koschan, and M.A. Abidi, “An Overview of Color Constancy Algorithms”. Journal of Pattern Recognition Research, 1(1): 42-54, 2006.
[25] A. Gijsenij, T. Gevers, and M. Lucassen, “A Perceptual analysis of distance measures for color constancy algorithms”. Journal of the Optical Society of America A, 26(10): 2243-2256, 2009.
[26] J. Vazquez-Corral, C. Alejandro Párraga, M. Vanrell, and R. Baldrich, “Color Constancy algorithms: psychophysical evaluation on a new dataset”. Journal of Imaging Science and Technology, 53(3):031105-031109, 2009.
[27] A. Gijsenij, T. Gevers, and J. van de Weijer, “Computational Color constancy: Survey and Experiments”. IEEE TIP, 20(9): 2475 – 2489, 2011.
[28] C. Dwork, R. Kumar, M. Naor, and D. Sivakumar, “Rank Aggregation Methods for the Web”. WWW, 613-622, 2001.
[29] N. Ailon, M. Charikar, and A. Newma, “Aggregating Inconsistent Information: Ranking and Clustering”. Journal of the ACM, 55(5):23, 2008.
[30] G. B. Huang, Q. Y. Zhu, and C. K. SIEW, “Extreme Learning Machine: Theory and Applications”. Neurocomputing, 70(1-3): 489-501, 2006.
[31] W. Xiong, and B. Funt, “Estimating Illumination Chromaticity via Support Vector Regression”. Journal of Imaging Science and Technology, 50(4): 341-348, 2006.
[32] J. M. Geusebroek, and A. W. M. Smeulders, “A six stimulus theory for stochastic texture”. IJCV, 62(1-2): 7–16, 2005.
[33] D. L. Ruderman, T. W. Cronin, and C. C. Chiao, “Statistics of cone responses to natural images: implications for visual coding”. Journal of the Optical Society of America A, 15(8): 2036–2045, 1998.
[34] L. Breiman, J. H.Friedman, R. A. Olshen, and C. J. Stone, “Classification and Regression Trees”. New York: Wadsworth and Brooks/Cole, 1984.
[35] V. Nedovic, A.W.M. Smeulders, A. Redert, and J. M. Geusebroek, “Stages as models of scene geometry”. IEEE TPAMI, 32(9): 1673-1687, 2010.
[36] V. Nedovic, A.W.M. Smeulders, A. Redert, and J. M. Geusebroek, “Depth information by stage classification”. ICCV, 1-8, 2007.
[37] W. Xiong, “Separating Illumination From Reflectance In Color Imagery”. PhD thesis, Simon Fraser University, Canada, 2007.
[38] J. van de Weijer, T. Gevers, and A. Gijsenij, “Edge based Color Constancy”. IEEE TIP, 16(9): 2207-2214, 2007.
[39] G. Finlayson, and E. Trezzi, “Shades of gray and colour constancy”. In Proc. IS&T/SID 12th Color Imaging Conf., 37–41, 2004.
[40] D. H. Brainard, W. T. Freeman, “Bayesian color constancy”. Journal of the Optical Society of America A, 14(7): 1393-1411, 1997.
[41] C. Rosenberg, T. Minka, and A. Ladsariya, “Bayesian Color Constancy with Non-Gaussian Models”. NIPS, 2003.
[42] P. V. Gehler, C.Rother, A. Blake, and T. Minka, “Bayesian Color Constancy Revisited”. CVPR, 1-8, 2008.
[43] A. Gijsenij, T.Gevers, , and J. van de Weijer, “Generalized Gamut Mapping using Image Derivative Structures for Color Constancy”. IJCV, 86(2-3): 127–139, 2010.
[44] http://www.kyb.mpg.de/bs/people/pgehler/colour/index.html [45] B. Funt, and L. Shi, “MaxRGB Reconsidered”. Journal of Imaging
Science and Technology. (in press) [46] L. Shi, and B. Funt, “Re-processed Version of the Gehler Color
Constancy Dataset of 568 Images”. http://www.cs.sfu.ca/~colour/data/ [47] F. Ciurea, and B. Funt, “A large image database for color constancy
research”. In Proceeding of the IS&T 11th Color Imaging Conference, 160-164, 2003.
[48] C. A. Parraga, J. Vazquez-Corral, and M. Vanrell, “A new cone activation-based natural images dataset”. Perception, 36: 180-180. 2009
[49] http://www.cvc.uab.es/color_calibration/Database.html [50] K. Barnard, L. Martin, B. Funt, and A. Coath, “A Data Set for Colour
Research”, Color Research and Application, 27(3):147-151, 2002. [51] http://www.cs.sfu.ca/~colour/data/colour_constancy_test_images/index.
html [52] A.V. Prokhorov, “Kendall coefficient of rank correlation”. In Hazewinkel,
Michiel, Encyclopedia of Mathematics, Springer, 2001. [53] L. Shi, W. Xiong, and B. Funt, “Illumination estimation via thin-plate
spline interpolation”. Journal of the Optical Society of America A, 28(5): 940- 948, 2011.
[54] R. T. Tan, K. Nishino and K. Ikeuchi, “Color constancy through inverse-intensity chromaticity space”, Journal of the Optical Society of America A, 21 (3): 321-334, 2004.
[55] http://cat.uab.es/~joost/code/ColorConstancy.zip [56] http://people.kyb.tuebingen.mpg.de/pgehler/colour/index.html [57] http://www.science.uva.nl/~gijsenij/downloads/gamut_mapping.zip [58] http://www.science.uva.nl/~gijsenij/downloads/cc_using_nis.zip [59] T. Hofmann, “Probabilistic latent semantic indexing”. ACM SIGIR,
50–57, 1999. [60] S. Bianco, G. Ciocca, C. Cusano, and R. Schettini, “Automatic color
constancy algorithm selection and combination”, Pattern Recognition, 43(3): 695-705, 2009.
[61] R. Schettini, C. Brambilla, C. Cusano, and G. Ciocca, “Automatic classification of digital photographs based on decision forests”, International Journal of Pattern Recognition and Artificial Intelligence, 18 (5): 819–845, 2004.
[62] A. Chakrabarti, K. Hirakawa, and T. Zickler, “Color Constancy with Spatio-Spectral Statistics”, IEEE TPAMI, 34(8): 1509-1519, 2012.
[63] A. J. Smola, and B. Schölkopf, “A Tutorial on Support Vector Regression”, Journal Statistics and Computing, 14(3):199-222, 2004.
[64] http://vision.seas.harvard.edu/colorconstancy/ [65] http://cat.cvc.uab.es/~joost/code/semantic_cc.zip [66] http://colorconstancy.com/ [67] D. G. Lowe, “Distinctive image features from scale-invariant key points”.
IJCV, 60(2):91–110, 2004. [68] F. F. Li, “Bag-of-Words model”. Tutorial. In CVPR, 2007. [69] A. Gijsenij, R. Lu and T. Gevers, “Color Constancy for Multiple Light
Sources”, IEEE TIP, 21(2):697–707, 2012. [70] E. H. Land, “The retinex theory of color vision,” Scientific American,
237(6): 108–128, 1977. [71] B. Funt, F. Ciurea, and J. McCann, “Retinex in matlab”, Journal of
Electronic Imaging, 13(1): 48–57, 2004. [72] M. Ebner, “Color constancy based on local space average color”,
Machine Vision and Applications, 20(5): 283–301, 2009.
Bing Li received the PhD degree from the Department of Computer Science and Engineering, Beijing Jiaotong University, China, in 2009. Currently, he is an assistant professor in the Institute of Automation, Chinese Academy of Sciences. His research interests include color constancy, visual saliency and web content mining. Weihua Xiong received the Ph.D. degree from the Department of Computer Science, Simon Fraser University, Canada, in 2007. His research interests include color science, computer vision, color image processing, and stereo vision. Weiming Hu received the PhD degree from the Department of Computer Science and Engineering, Zhejiang University, in 1998. Currently, he is a professor in the Institute of Automation, Chinese Academy of Sciences. His research interests include visual surveillance, and filtering of Internet objectionable information.
Brian Funt received his Ph.D. in computer science from the University of British Columbia, Vancouver, BC, Canada, in 1976. He is a Professor with the School of Computing Science, Simon Fraser University, Vancouver, where he has been since 1980. His research interests include color constancy, metamerism, color calibration, spectral printing, quaternion color representation, and illumination estimation.