Embed Size (px)
Citation preview

Evaluating CERES angular distribution models for snow using
surface reflectance observations from the East Antarctic Plateau
Stephen R. Hudson,1 Seiji Kato,2 and Stephen G. Warren3
Received 10 June 2009; revised 14 September 2009; accepted 17 September 2009; published 3 February 2010.
[1] Clouds and the Earth’s radiant energy system (CERES) is a satellite-based remotesensing system designed to monitor the Earth’s radiation budget. In this paper we examineuncertainties in the angular distribution models (ADMs) used by CERES over permanentlysnow covered surfaces with clear skies. These ADMs are a key part of the CERES dataprocessing algorithms, used to convert the observed upwelling radiance to an estimate of theupwelling hemispheric flux. We model top-of-atmosphere anisotropic reflectance factorsusing an atmospheric radiative transfer model with a lower boundary condition based onextensive reflectance observations made at Dome C, Antarctica. The model results andsubsequent analysis show that the CERES operational clear-sky permanent-snow ADMsare appropriate for use over Dome C, with differences of less than 5% between the modelresults and the ADMs at most geometries used by CERES operationally. We show thatthe uncertainty introduced into the flux estimates through the use of the modeled radiancesused in the ADM development is small when the fluxes are averaged over time and space.Finally, we show that variations in the angular distribution of radiance at the top of theatmosphere due to atmospheric variability over permanently snow covered regions arein most cases unlikely to mask the real variations in flux caused by these atmosphericvariations.
Citation: Hudson, S. R., S. Kato, and S. G. Warren (2010), Evaluating CERES angular distribution models for snow using surface
reflectance observations from the East Antarctic Plateau, J. Geophys. Res., 115, D03101, doi:10.1029/2009JD012624.
1. Introduction
[2] Clouds and the Earth’s radiant energy system (CERES)is a suite of satellite-based instruments designed to monitorthe Earth’s radiation budget [Wielicki et al., 1996]. Thesuccessor to the Earth Radiation Budget Experiment (ERBE),CERES is designed to double the accuracy of the ERBEobservations through the use of improved instruments andanalysis techniques. Data products produced by the CERESteam include the observed broadband solar, window long-wave, and broadband longwave radiances, along with manyderived products, including fluxes in the three channels at thetop of the atmosphere (TOA) and the surface.[3] CERES consists of five instruments on three satellites,
and a sixth instrument to be placed on the satellite that will belaunched for the NPOESS (National Polar-Orbiting Opera-tional Environmental Satellite System) preparatory project(NPP). Two of the satellites, Aqua and Terra, each have twoinstruments on board. These two are polar-orbiting satellites,so they frequently observe the East Antarctic Plateau. In
addition to the broadband radiance observations from theCERES instruments, the CERES algorithms make use ofspectral observations from the Moderate Resolution ImagingSpectroradiometer (MODIS), which also flies on Aqua andTerra, to determine the scene type over CERES footprints,such as cloud fraction, optical thickness, and droplet size.[4] One of the primary goals of the CERES experiment is
to determine the TOA radiation budget of all regions of theplanet. To do this the CERES-observed instantaneous radi-ances must be converted to estimates of the instantaneousupwelling flux. Doing this conversion requires an angulardistribution model (ADM) that predicts the upwelling flux,given the radiance at any one viewing angle. These ADMswere developed by combining all radiance observationsmade over a given surface type, with a given cloud fraction,and calculating the average radiance in each viewing anglebin as a function of solar zenith angle [Loeb et al., 2005].[5] In this paper we use a parameterization of surface
reflection developed for the East Antarctic Plateau alongwith an atmospheric radiative transfer model to assess theuncertainty associated with the shortwave ADMs used byCERES for clear-sky, permanently snow covered scenes.These ADMs are described in detail by Kato and Loeb[2005]. We also examine how the atmosphere modifies theangular distribution of reflected radiance between the surfaceand TOA, and how variations in atmospheric properties mayaffect the TOA radiance field, introducing errors into theestimated fluxes.
JOURNAL OF GEOPHYSICAL RESEARCH, VOL. 115, D03101, doi:10.1029/2009JD012624, 2010ClickHere
for
FullArticle
1Norwegian Polar Institute, Tromsø, Norway.2Climate Science Branch, NASA Langley Research Center, Hampton,
Virginia, USA.3Department of Atmospheric Sciences, University of Washington,
Seattle, Washington, USA.
Copyright 2010 by the American Geophysical Union.0148-0227/10/2009JD012624$09.00
D03101 1 of 9
[6] The main quantity considered in this paper is the aniso-tropic reflectance factor, defined as
R q�; qv;fð Þ ¼ pIr q�; qv;fð ÞR 2p0
R p=20
Ir q�; qv;fð Þ cos qv sin qv dqv df; ð1Þ
where Ir is the radiance reflected into the viewing zenith angleqv and relative azimuth angle f, with solar zenith angle q
�.
The denominator in equation (1) is the reflected flux. CERESis a broadband instrument, so the quantities are integratedover the solar spectrum. The CERES ADMs consist of esti-mates of R(q
�, qv, f) made by averaging Ir over bins in q�
, qv,and f. Using these ADMs, a reflected flux can be estimatedfrom a CERES radiance observation using
Fr ¼pIr q�; qv;fð ÞR q�; qv;fð Þ : ð2Þ
The uncertainty in the ADMs is important since the relativeerror of the derived flux (Fr) is equal to the relative differencebetween the actual value of R and the ADM estimate of R.
2. Model
[7] The model results presented in this paper come fromSBDART, a package for modeling radiative transfer in theatmosphere [Ricchiazzi et al., 1998]. SBDART is builtaround the plane-parallel radiative transfer model DISORT[Stamnes et al., 1988] and uses the band models developedfor LOWTRAN 7 for atmospheric gaseous absorption.[8] The model was modified to use the parameterizations
for the bidirectional reflectance of snow from the work ofHudson et al. [2006] to determine the bidirectional reflec-tance factor (BRF; equal to R times the albedo) of the surface.These parameterizations were developed from extensiveradiance measurements made from 32 m above the surfaceat Dome C Station, Antarctica (75�S, 123�E, 3200 m).Because these parameterizations do not cover all wave-lengths or incidence angles, certain assumptions and exten-sions had to be made since CERES observes the full solarspectrum and the model must be able to calculate the BRF forall incidence angles to handle diffuse incidence. Threeassumptions regarding the variation of R with incidenceangle were made for all wavelengths: R for incident zenithangles greater than 86.6� is equal to the parameterized R for86.6�; R for an incidence angle of 0� is equal to 1 at allviewing angles (isotropic reflectance); R for incidence anglesbetween 0� and 51.6� is the linear interpolation, in cosine ofthe incidence angle, between the isotropic reflection at 0� andthe parameterized R at 51.6�. At visible wavelengths R is notfar from isotropic even at q
�= 51.6�, while at longer wave-
lengths there is very little diffuse incidence, so little errorshould result from the interpolation. All wavelengths be-tween 0.2 and 0.8 mm use R(l = 0.8 mm) to avoid the effect ofdiffuse radiation in the observations, as discussed in section5.3 of Hudson et al. [2006].[9] Hudson et al. [2006] did not provide parameterizations
valid for R at all wavelengths and incidence angles; noparameterization was provided for wavelengths with albedoless than 0.15 or between 0.27 and 0.47 for any incidenceangles, nor for wavelengths with albedo between 0.15 and
0.27 for incidence angles greater than 75�. For wavelengthswith albedo between 0.27 and 0.47, R was determined with anew parameterization developed with the same method usedbyHudson et al. [2006], but with their data fromwavelengths1.39 to 1.51 mm. Interpolation in a lookup table of R(q� =82.6�) as a function of albedo was used to find R for allincidence angles greater than 75� at wavelengths with albedo(a) between 0.15 and 0.27. For wavelengths with albedo lessthan 0.15,Rwas set to the parameterized values ofR at albedoequal to 0.15 if the incidence angle was less than 75�, or toR(a = 0.15, q� = 82.6�) if the incidence angle was greaterthan 75�.[10] The parameterization requires knowledge of the sur-
face albedo under diffuse illumination at all wavelengthsbeyond 0.95 mm, but the albedo at Dome C was measuredonly at wavelengths out to 2.4 mm. To estimate the albedo atother wavelengths, SBDARTwas used to model the spectralalbedo of a snowpack consisting of a 0.25 mm layer of 40 mmice spheres above a semi-infinite layer of 90 mm ice spheres(the sizes that resulted in a best fit to the observed albedobetween 0.35 and 2.4mm, as described in section 4 ofHudsonand Warren [2007]) at wavelengths from 0.2 to 10 mm undera cloud that diffused the solar beam. These albedo valueswere used in the parameterization at wavelengths where thealbedo was not observed.[11] The assumptions listed above allow the parameter-
izations to be extended to provide R for all necessary wave-lengths and incidence angles, but DISORT needs the BRF,not R; the two differ by a factor of the surface albedo. Inthis case the surface albedo that is used should vary withincidence angle; this variation is especially important atnear-infrared wavelengths. A table of albedo as a functionof solar zenith angle (q� = 0�, 1�, 2�, . . ., 89�) and wavelength(l = 0.2 mm � 1.016n, n = 0, 1, 2, . . ., 250) was calculatedwith SBDART for the same snowpack as above, but withno atmosphere or cloud. Bilinear interpolation could thenbe used to determine the albedo at any wavelength between0.2 and 10 mm and any incidence angle. For the work in thispaper, comparing values of R, for which the normalization bythe reflected flux removes the effect of albedo bias, smallerrors in the magnitude of the spectral albedo are not veryimportant, so long as the spectral shape is correct.[12] At this point the model can estimate the BRF of the
surface at all necessary wavelengths and incidence angles.The importance of many of the assumptions and estimatesthat went into the model is diminished by the fact that most ofthem primarily affect wavelengths longer than 1.4 mm, wherethere is less incident solar radiation than at shorter wave-lengths and where the snow has a low albedo (generally lessthan 0.3); about 85% of the incident solar flux and 94% to98% of the reflected solar flux (depending on q
�) at the TOA
over Dome C is at wavelengths shorter than 1.4 mm.[13] Below 28 km, the temperature, pressure, and water
vapor profiles used as input to SBDARTwere specified as themean of 47 radiosoundings conducted at Dome C duringJanuary 2004 [Gettelman et al., 2006]. Ozone concentrationat all heights, and all quantities above 28 km, was taken fromthe summertime South Pole model atmosphere of Waldenet al. [1998], who used ozonesonde data for ozone concen-trations below 30 km, and various satellite data for allquantities above 30 km. No aerosols were used in the model;the mean observed clear-sky aerosol optical thickness at
D03101 HUDSON ET AL.: EVALUATION OF CERES SNOW ADM
2 of 9
D03101
Dome C during summer 2003–2004 was 0.02 at 0.44 mmand 0.007 at 0.87 mm [Six et al., 2005]. Running the modelwith a layer of stratospheric aerosols with optical depth 0.02at 0.55 mm resulted in reflected flux calculations that differfrom the standard model by 0.008% at q� = 59� and by 0.13%at q� = 80�, and resulted in reflected radiance calculations thatdiffer from the standardmodel by less than 1% at q� = 59� andby less than 4.5% at q� = 80�, for qv � 70� (those mostimportant to CERES). Radiance differences exceed 10% atlarge qv in the forward-reflected direction.[14] The model was run, with thermal emission turned
off, over the wavelength range 0.2 to 10 mm, with a wave-length interval of 0.02 times the current wavelength, resultingin 196 wavelengths, more closely spaced at shorter wave-lengths, where the majority of the reflected energy is.DISORT was run with 24 streams and with its intensity cor-rection algorithm turned on [Nakajima and Tanaka, 1988].[15] The wavelength range 0.2 to 10 mm was chosen to
allow a comparison with the most widely used CERESshortwave products, which are based on the ‘‘unfiltered’’radiances. The unfiltering process, described by Loeb et al.[2001], converts the measured radiance, which is affectedby instrument filtering and thermal emission, to the totalupwelling solar flux at all wavelengths. This is stated mostclearly in the document describing the CERES SSF dataproduct [Geier et al., 2003], where the following is written onpage 46: The unfiltered shortwave radiance ‘‘is an estimate ofthe solar radiance at all wavelengths reflected back into spaceand contains no thermal radiance. . . .It is a spectrally inte-grated radiance that is intended to represent the radiance ofreflected sunlight. In other words, the SWunfiltered radianceis the radiance we would observe if we had a spectrally flatchannel that passed all the reflected sunlight and thatremoved any thermal emission from the Earth and the Earth’satmosphere. Frequently, in informal discussion, we incor-rectly refer to the SW unfiltered radiance as a broadbandradiance covering the spectral interval from 0 to 5 mm.’’[16] The model was run and output saved at the bin-center
angles used in the CERES ADMs (q� = 1�, 3�, 5�, . . ., 89�;qv = 2.5�, 7.5�, 12.5�, . . ., 87.5�; f = 2.5�, 7.5�, 12.5�, . . .,177.5�), and the comparisons were then made directly.
3. Comparison with Angular Distribution Models
[17] The CERES team has developed two sets of ADMsfor clear-sky observations over permanently snow coveredsurfaces: a bright permanent-snow ADM and a dark perma-nent-snow ADM [Kato and Loeb, 2005]. This brightnessdistinction was made to try to account for some of the snow-property changes that can affect the distribution of reflectedradiance. MODIS 0.645 mm reflectance observations nearnadir during the 2-yr period of the ADM development dataset were used to classify permanent-snow regions as bright ordark, on the basis of whether their monthly mean reflectancewas greater or less than the mean reflectance from permanentsnow (the evaluation was done as a function of solar zenithangle).Operationally, the CERES algorithms choose the brightor dark ADM on the basis of which one more closelymatches the observation. The main difference between thetwo ADMs is their albedo.[18] Each ADMprovides the average TOA albedo as a func-
tion of solar zenith angle and the TOA R as a function of solar
zenith angle and viewing angles. They were developed usingall clear-sky permanent-snow scenes observed by CERES,mostly the Greenland and Antarctic ice sheets. In this sectionthey are compared with the TOA modeled R over Dome C.Since data from lower-elevation sites with more precipitablewater and from locations and times with varying ozoneconcentrations were included in the ADM development, anexact match between the ADMs and the model should not beexpected; nevertheless, the ADMs are used over Dome C, sothese comparisons provide a useful estimate of their uncer-tainty. We expect that the agreement of R above differentregions should be better than the agreement of radiances, andwe show in section 5 that the variation in R caused byvariations in precipitable water and ozone amount is small.[19] Comparisons of R are shown in Figure 1. This figure
shows the modeled values of R at two solar zenith angles andthe difference between the values of R from the ADMs andthe values of R from the model. Plots at other solar zenithangles show similar results. These plots show that, despite thedifferent regions included in the CERES ADM development,the ADMs appear to be appropriate for use over Dome C.[20] Most CERES observations that are used operationally
are made with qv < 70�. At these angles, the differencesbetween R from the CERES ADMs and R from the Dome-Cmodel are mostly smaller than 5%. Larger errors, mostlynegative, are found at large qv, possibly because of includingobservations over moister atmospheres, since increasedwater vapor concentrations would reduce R more at largeqv, where the atmospheric path length is longer. These dif-ferences could also be due to other spatial or temporal vari-ability, or to procedures used in the ADM development, inwhich viewing angles without data were filled with modelresults, which we investigate in section 4. Alternatively, theycould represent error in the Dome-C model.
4. Estimate of the Flux Error Caused by theModeled Radiance in Solar Avoidance Angles
[21] As described by Loeb et al. [2005] and Kato and Loeb[2005], CERES ADMs depend on scene type. Cloud fractionand cloud properties derived from MODIS are used to iden-tify the scene type over a CERES footprint. At CERESviewing zenith angles greater than 75� around 90� relativeazimuth angle, however, collocation of MODIS radiancewith CERES footprints is not available. In addition, becauseCERES instruments avoid observing the direct solar beam,they do not scan beyond a viewing zenith angle of approx-imately 60� near 0� relative azimuth angle when the solarzenith angle is large. CERES radiances for use in buildingADMs are, therefore, not available for these viewing angles.The Greenland Ice Sheet extends to nearly 60�N and, there-fore, experiences a minimum solar zenith angle of about 37�;the rest of Greenland and Antarctica, which include most ofthe permanent-snow scenes, lie farther poleward, so obser-vations of permanent-snow scenes with q
�< 40� are unusual.
For q�> 50�, Figure 2 shows that the solid angle subtended
by the area of missing observed radiances slightly increaseswith solar zenith angle. The fraction of the solid angle withno CERES radiances subtended in the upper hemisphere is,however, less than 10% for all solar zenith angles of interestover clear-sky permanent-snow scenes except for the brightsnow surface scene with solar zenith angle 89�.
D03101 HUDSON ET AL.: EVALUATION OF CERES SNOW ADM
3 of 9
D03101
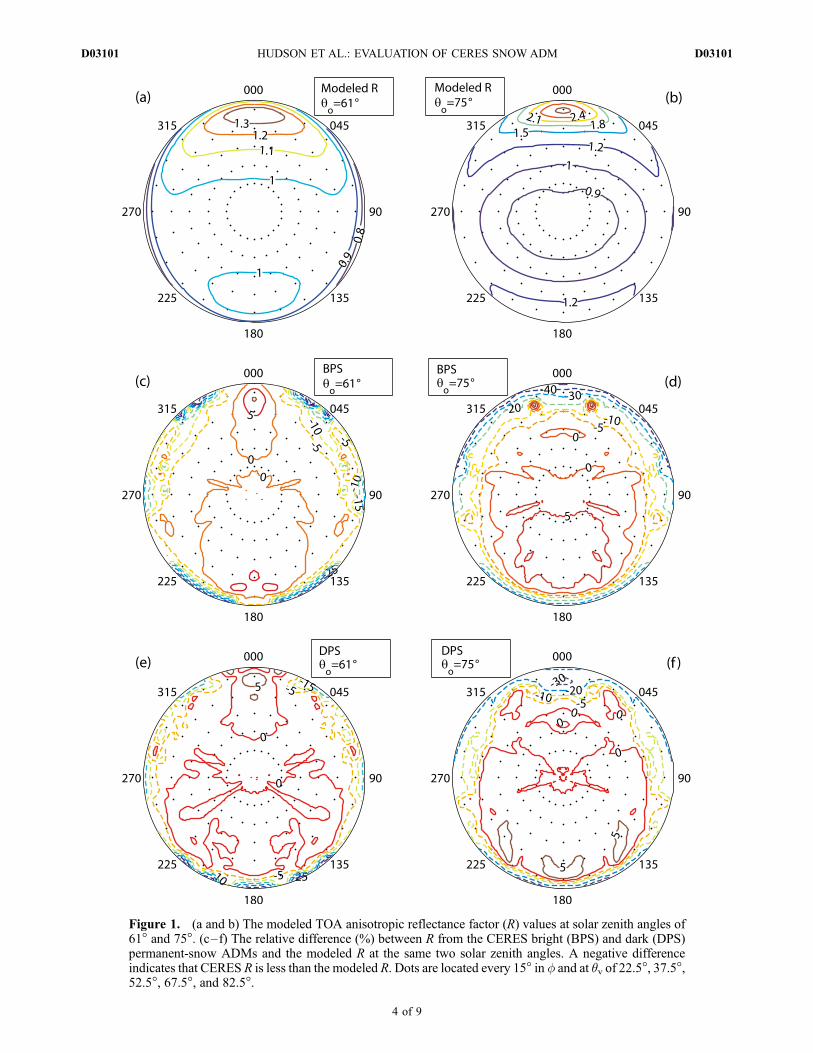
Figure 1. (a and b) The modeled TOA anisotropic reflectance factor (R) values at solar zenith angles of61� and 75�. (c–f) The relative difference (%) between R from the CERES bright (BPS) and dark (DPS)permanent-snow ADMs and the modeled R at the same two solar zenith angles. A negative differenceindicates that CERES R is less than the modeled R. Dots are located every 15� in f and at qv of 22.5�, 37.5�,52.5�, 67.5�, and 82.5�.
D03101 HUDSON ET AL.: EVALUATION OF CERES SNOW ADM
4 of 9
D03101

[22] Even though fluxes are not estimated from angleswhere CERES radiances are not used in ADMs, missingobserved CERES radiances affect the flux in the followingway. In the process of building CERES ADMs, the denom-inator of the right side of equation (1) is the mean flux(hereinafter ADM flux) �F computed by integrating the meanradiance �I over the hemisphere for a given scene type. Theintegration requires filling radiances at angles where CERESobservations are not available. As described by Loeb et al.[2005] and Kato and Loeb [2005], modeled radiances wereused at these angles. The error in themodeled radiance affectsthe anisotropic factor in equation (1), and subsequently affectsthe flux estimate from equation (2) where I is the instanta-neous CERES observed radiance.[23] Because of the small water vapor amount and small
aerosol loadings over Antarctica, the largest uncertainty inmodeling the clear-sky TOA radiance over permanent-snowsurfaces is in the surface boundary condition, namely, thesurface BRF. Note that the surface BRF parameterizationsdiscussed in section 2 were not available when the CERESpermanent-snow ADMs were developed. The snow surfaceBRF is difficult to model because of the existence of large-scale surface roughness caused by sastrugi [e.g.,Warren et al.,1998; Leroux and Fily, 1998]. Using a smooth surface packedwith snow grains leads to a large error in modeling the snowsurface BRF compared to observed surface BRF [e.g., Jinand Simpson, 1999]. Because the effect of large-scale surfaceroughness was neglected in modeling radiances over snowsurfaces and because those radiances were used to fillradiances at angles with no CERES radiances for the CERESoperational ADMs, the effect of modeling error in the fluxestimate needs to be evaluated.[24] The good agreement shown in section 3 between our
model and the CERES ADMs indicates that the parameter-ized R used as the boundary condition in the model used inthis paper represents the mean anisotropic factor of Antarcticpermanent-snow surfaces. We can therefore use the aniso-tropic factors computed from surface BRF observations overDome C to test the error caused by the modeled radiance used
in nonobserved angles for CERES operational clear-skypermanent-snow ADMs (hereinafter ADMed3).[25] To test the error, we built clear-sky permanent-snow
ADMs by filling nonobserved angles with modeled radiancescomputed with the surface boundary condition constrainedwith observed surface BRF measurements over Dome C(hereinafter ADMfill). Following Loeb et al. [2005], we usedonly the shape of the modeled radiance as a function of angle.Figure 3 shows the relative difference of the ADM albedos,(afill � aed3)/aed3, where afill and aed3 are the ADM albedofrom ADMfill and from ADMed3, respectively. For q� < 80�,the error in the ADM albedo is less than 1% for both brightand dark snow. Larger values occur for q� > 80�.[26] For climate studies, instantaneous fluxes are spatially
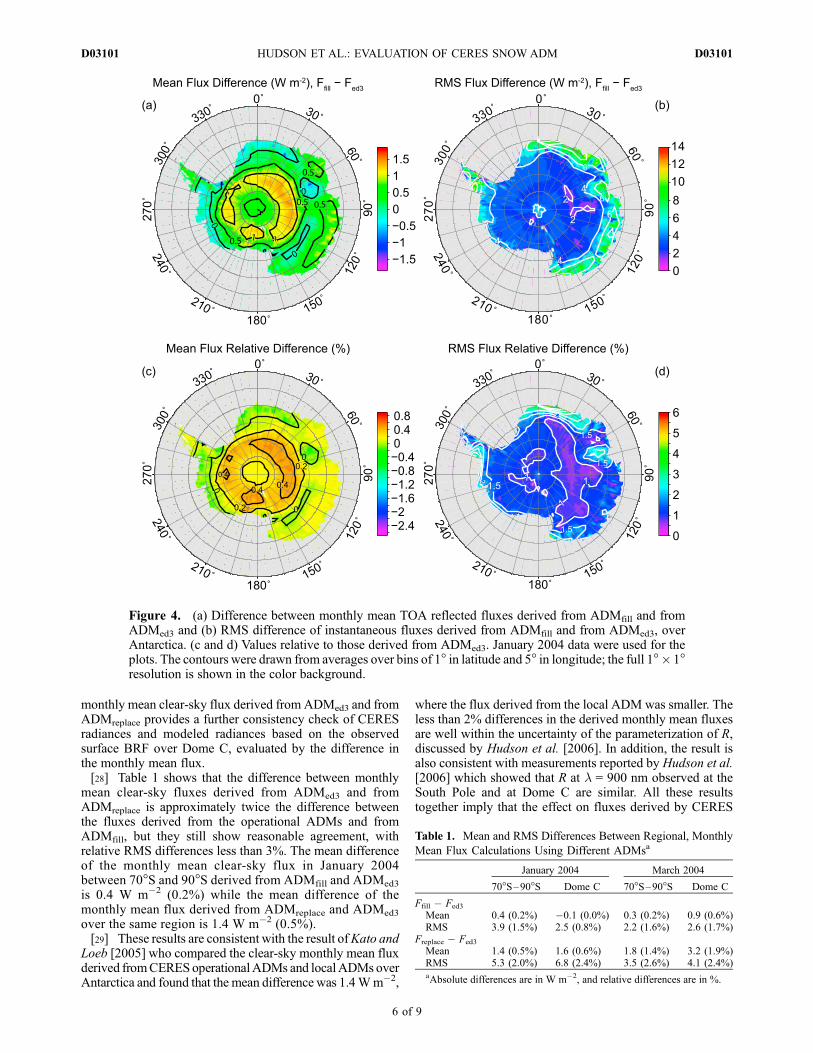
and temporally averaged. Because the solar zenith angle anda CERES instrument viewing geometry over a 1� � 1� areachange over the course of a month, and the sign of the errorshown in Figure 3 changes with solar zenith angles between75� and 85�, we expect the error in the monthly mean fluxaveraged over a 1� � 1� area to be smaller than the instan-taneous flux error. To assess the error in the 1� � 1� griddedmonthly mean clear-sky flux, we apply both ADMed3 andADMfill to CERES data taken over Antarctica in January andMarch 2004. We then compare fluxes derived from the twosets of ADMs averaged over a month and over 1�� 1� areas.As shown in Figure 4a, the error in the gridded monthly meanflux in January is everywhere less than 1.5 W m�2, whichcorresponds to approximately 0.5% of the mean reflectedshortwave flux. The differences, averaged over the region70�S to 90�S and over the Dome C region (74�S–76�S,120�E–125�E), are shown in Table 1.[27] For a further comparison of the monthly mean flux
error over 1� � 1� areas, we built another set of clear-skypermanent-snow ADMs using no CERES data, using only thereflectance model based on Dome-C surface measurementsfor all angles (hereinafter ADMreplace). The comparison of the
Figure 2. Fraction of the solid angle for which CERESradiances were available for building clear-sky bright-snow(solid line) and dark-snow (dotted line) ADMs as a functionof solar zenith angle.
Figure 3. Relative difference in mean albedo (‘‘ADMalbedo’’) between (1) CERES clear-sky permanent-snowADMs (ADMed3) and (2) ADMs with missing observedradiances filled by modeled radiances constrained with sur-face BRF measurements over Dome C (ADMfill), as a func-tion of solar zenith angle. The relative difference is definedas (ADMfill � ADMed3)/ADMed3.
D03101 HUDSON ET AL.: EVALUATION OF CERES SNOW ADM
5 of 9
D03101
monthly mean clear-sky flux derived from ADMed3 and fromADMreplace provides a further consistency check of CERESradiances and modeled radiances based on the observedsurface BRF over Dome C, evaluated by the difference inthe monthly mean flux.[28] Table 1 shows that the difference between monthly
mean clear-sky fluxes derived from ADMed3 and fromADMreplace is approximately twice the difference betweenthe fluxes derived from the operational ADMs and fromADMfill, but they still show reasonable agreement, withrelative RMS differences less than 3%. The mean differenceof the monthly mean clear-sky flux in January 2004between 70�S and 90�S derived from ADMfill and ADMed3
is 0.4 W m�2 (0.2%) while the mean difference of themonthly mean flux derived from ADMreplace and ADMed3
over the same region is 1.4 W m�2 (0.5%).[29] These results are consistent with the result ofKato and
Loeb [2005] who compared the clear-sky monthly mean fluxderived fromCERESoperationalADMs and localADMs overAntarctica and found that the mean difference was 1.4Wm�2,
where the flux derived from the local ADM was smaller. Theless than 2% differences in the derived monthly mean fluxesare well within the uncertainty of the parameterization of R,discussed by Hudson et al. [2006]. In addition, the result isalso consistent with measurements reported by Hudson et al.[2006] which showed that R at l = 900 nm observed at theSouth Pole and at Dome C are similar. All these resultstogether imply that the effect on fluxes derived by CERES
Figure 4. (a) Difference between monthly mean TOA reflected fluxes derived from ADMfill and fromADMed3 and (b) RMS difference of instantaneous fluxes derived from ADMfill and from ADMed3, overAntarctica. (c and d) Values relative to those derived from ADMed3. January 2004 data were used for theplots. The contours were drawn from averages over bins of 1� in latitude and 5� in longitude; the full 1��1�resolution is shown in the color background.
Table 1. Mean and RMS Differences Between Regional, Monthly
Mean Flux Calculations Using Different ADMsa
January 2004 March 2004
70�S–90�S Dome C 70�S–90�S Dome C
Ffill � Fed3
Mean 0.4 (0.2%) �0.1 (0.0%) 0.3 (0.2%) 0.9 (0.6%)RMS 3.9 (1.5%) 2.5 (0.8%) 2.2 (1.6%) 2.6 (1.7%)
Freplace � Fed3
Mean 1.4 (0.5%) 1.6 (0.6%) 1.8 (1.4%) 3.2 (1.9%)RMS 5.3 (2.0%) 6.8 (2.4%) 3.5 (2.6%) 4.1 (2.4%)aAbsolute differences are in W m�2, and relative differences are in %.
D03101 HUDSON ET AL.: EVALUATION OF CERES SNOW ADM
6 of 9
D03101
both due to the filling of missing angles in the ADMs usingmodel results and due to the spatial variability of the aniso-tropic factor of the Antarctic snow surface is small whenaveraged over time.[30] Although the fluxes derived from applying ADMed3
and ADMreplace to the same radiances agree to within a fewWm�2, this reflects only the fact that the angular distributionof radiance in the CERES ADMs agrees fairly well with thedistribution in the model; it does not show anything about theabsolute accuracy of the CERES-observed or modeled fluxesor radiances.
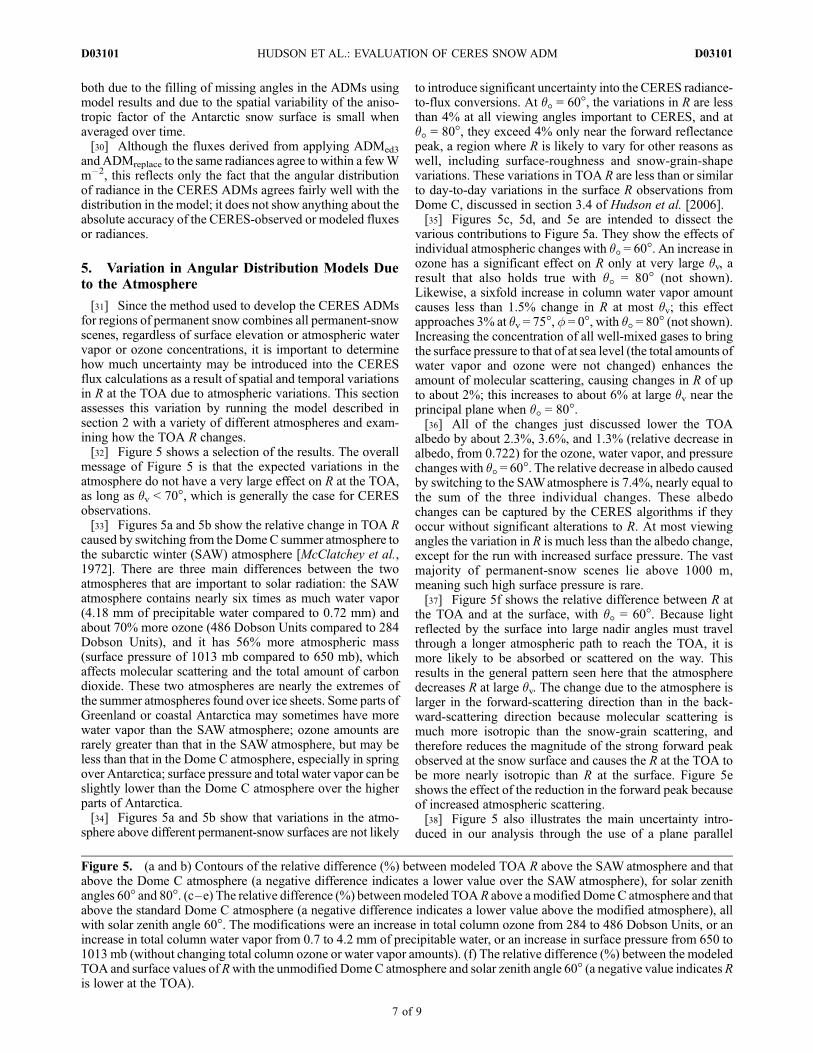
5. Variation in Angular Distribution Models Dueto the Atmosphere
[31] Since the method used to develop the CERES ADMsfor regions of permanent snow combines all permanent-snowscenes, regardless of surface elevation or atmospheric watervapor or ozone concentrations, it is important to determinehow much uncertainty may be introduced into the CERESflux calculations as a result of spatial and temporal variationsin R at the TOA due to atmospheric variations. This sectionassesses this variation by running the model described insection 2 with a variety of different atmospheres and exam-ining how the TOA R changes.[32] Figure 5 shows a selection of the results. The overall
message of Figure 5 is that the expected variations in theatmosphere do not have a very large effect on R at the TOA,as long as qv < 70�, which is generally the case for CERESobservations.[33] Figures 5a and 5b show the relative change in TOA R
caused by switching from the Dome C summer atmosphere tothe subarctic winter (SAW) atmosphere [McClatchey et al.,1972]. There are three main differences between the twoatmospheres that are important to solar radiation: the SAWatmosphere contains nearly six times as much water vapor(4.18 mm of precipitable water compared to 0.72 mm) andabout 70% more ozone (486 Dobson Units compared to 284Dobson Units), and it has 56% more atmospheric mass(surface pressure of 1013 mb compared to 650 mb), whichaffects molecular scattering and the total amount of carbondioxide. These two atmospheres are nearly the extremes ofthe summer atmospheres found over ice sheets. Some parts ofGreenland or coastal Antarctica may sometimes have morewater vapor than the SAW atmosphere; ozone amounts arerarely greater than that in the SAW atmosphere, but may beless than that in the Dome C atmosphere, especially in springover Antarctica; surface pressure and total water vapor can beslightly lower than the Dome C atmosphere over the higherparts of Antarctica.[34] Figures 5a and 5b show that variations in the atmo-
sphere above different permanent-snow surfaces are not likely
to introduce significant uncertainty into the CERES radiance-to-flux conversions. At q� = 60�, the variations in R are lessthan 4% at all viewing angles important to CERES, and atq� = 80�, they exceed 4% only near the forward reflectancepeak, a region where R is likely to vary for other reasons aswell, including surface-roughness and snow-grain-shapevariations. These variations in TOA R are less than or similarto day-to-day variations in the surface R observations fromDome C, discussed in section 3.4 of Hudson et al. [2006].[35] Figures 5c, 5d, and 5e are intended to dissect the
various contributions to Figure 5a. They show the effects ofindividual atmospheric changes with q� = 60�. An increase inozone has a significant effect on R only at very large qv, aresult that also holds true with q� = 80� (not shown).Likewise, a sixfold increase in column water vapor amountcauses less than 1.5% change in R at most qv; this effectapproaches 3% at qv = 75�, f = 0�, with q� = 80� (not shown).Increasing the concentration of all well-mixed gases to bringthe surface pressure to that of at sea level (the total amounts ofwater vapor and ozone were not changed) enhances theamount of molecular scattering, causing changes in R of upto about 2%; this increases to about 6% at large qv near theprincipal plane when q� = 80�.[36] All of the changes just discussed lower the TOA
albedo by about 2.3%, 3.6%, and 1.3% (relative decrease inalbedo, from 0.722) for the ozone, water vapor, and pressurechanges with q� = 60�. The relative decrease in albedo causedby switching to the SAWatmosphere is 7.4%, nearly equal tothe sum of the three individual changes. These albedochanges can be captured by the CERES algorithms if theyoccur without significant alterations to R. At most viewingangles the variation in R is much less than the albedo change,except for the run with increased surface pressure. The vastmajority of permanent-snow scenes lie above 1000 m,meaning such high surface pressure is rare.[37] Figure 5f shows the relative difference between R at
the TOA and at the surface, with q� = 60�. Because lightreflected by the surface into large nadir angles must travelthrough a longer atmospheric path to reach the TOA, it ismore likely to be absorbed or scattered on the way. Thisresults in the general pattern seen here that the atmospheredecreases R at large qv. The change due to the atmosphere islarger in the forward-scattering direction than in the back-ward-scattering direction because molecular scattering ismuch more isotropic than the snow-grain scattering, andtherefore reduces the magnitude of the strong forward peakobserved at the snow surface and causes the R at the TOA tobe more nearly isotropic than R at the surface. Figure 5eshows the effect of the reduction in the forward peak becauseof increased atmospheric scattering.[38] Figure 5 also illustrates the main uncertainty intro-
duced in our analysis through the use of a plane parallel
Figure 5. (a and b) Contours of the relative difference (%) between modeled TOA R above the SAW atmosphere and thatabove the Dome C atmosphere (a negative difference indicates a lower value over the SAW atmosphere), for solar zenithangles 60� and 80�. (c–e) The relative difference (%) betweenmodeled TOAR above amodified Dome C atmosphere and thatabove the standard Dome C atmosphere (a negative difference indicates a lower value above the modified atmosphere), allwith solar zenith angle 60�. The modifications were an increase in total column ozone from 284 to 486 Dobson Units, or anincrease in total column water vapor from 0.7 to 4.2 mm of precipitable water, or an increase in surface pressure from 650 to1013 mb (without changing total column ozone or water vapor amounts). (f) The relative difference (%) between the modeledTOA and surface values of Rwith the unmodified Dome C atmosphere and solar zenith angle 60� (a negative value indicates Ris lower at the TOA).
D03101 HUDSON ET AL.: EVALUATION OF CERES SNOW ADM
7 of 9
D03101
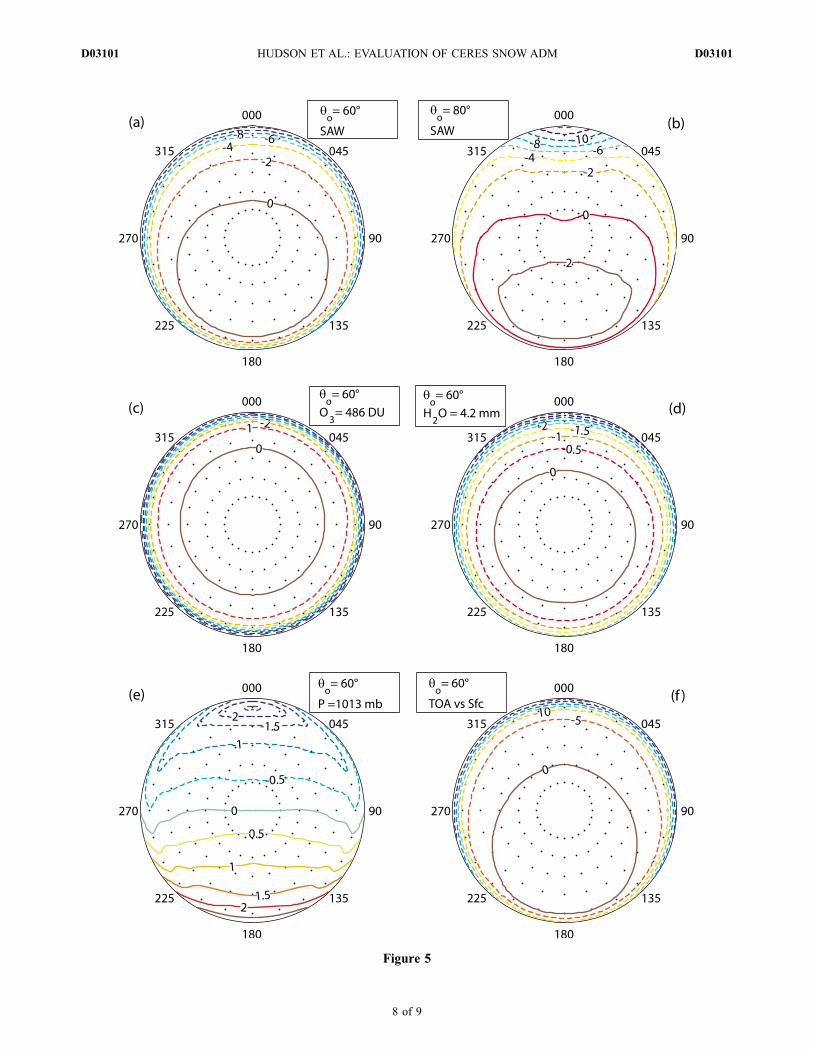
Figure 5
D03101 HUDSON ET AL.: EVALUATION OF CERES SNOW ADM
8 of 9
D03101
model: too much absorption of light reflected into largeviewing zenith angles. Most of the plots in Figure 5 show asharp decrease in R at qv > 80�. Some of this reduction is realdue to a longer path length through the atmosphere, but thepath length is overestimated by the plane-parallel model,enhancing the reduction. Since the important comparisonswith the CERES ADMs are at qv < 70�, this uncertainty doesnot cause significant problems in this work.
6. Summary
[39] The parameterizations ofHudson et al. [2006] providea realistic lower boundary condition for use in modelingradiative transfer at solar wavelengths over the East AntarcticPlateau. Here they have been extended to cover the full solarspectrum, allowing for the calculation of reflected solarradiance and flux.[40] The CERES ADMs for permanent-snow scenes were
compared with the model results. The angular distribution ofthe reflected radiance in the ADMs was compared with themodel by comparing patterns of R. These comparisonsshowed that the CERES permanent-snow ADMs are appro-priate for use over Dome C, with their values of R differingfrom the modeled values by less than 5% at most geometries.[41] The uncertainty introduced into the ADMs by filling
angles without CERES observations using radiances mod-eled with a plane-parallel snow surface was examined byrecreating the ADMs using the Dome Cmodeled radiances tofill these angles. Also a new set of ADMs was created usingonly the Dome C model results. While these changes cancause significant instantaneous changes in flux estimates,the monthly mean, area-averaged changes in flux estimatescaused by using the different ADMs are generally less than2%.[42] Finally, the effect of the atmosphere and of variations
in the atmosphere on TOA R was examined through model-ing results. While the atmosphere significantly alters R fromthe values seen at the surface, especially at large qv, expectedvariability in atmospheric properties over permanently snowcovered areas does not cause large changes to TOA R. Thisresult shows that the choice to combine all permanently snowcovered regions in the development of the ADMs may notlimit the accuracy of the CERES fluxes.
[43] Acknowledgments. We thank Richard Brandt, Bruce Wielicki,Norman Loeb, Tom Charlock, and Zhonghai Jin for useful discussions andtwo anonymous reviewers for their helpful comments. This research wassupported by National Science Foundation grants OPP-00-03826 and ANT-06-36993. Hudson also received funding from the Norwegian ResearchCouncil through its IPY program and the project iAOOS Norway (grantnumber 176096/S30).
ReferencesGeier, E. B., R. N. Green, D. P. Kratz, P. Minnis, W. F. Miller, S. K. Nolan,and C. B. Franklin (2003), Clouds and the Earth’s Radiant Energy System(CERES) Data Management System Single Satellite Footprint TOA/Surface Fluxes and Clouds (SSF) Collection Document Release 2 Version1, NASA Langley Res. Cent., Hampton, Va. (Available at http://science.larc.nasa.gov/ceres/collect_guide/pdf/SSF_CG_R2V1.pdf)
Gettelman, A., V. P. Walden, L. M. Miloshevich, W. L. Roth, and B. Halter(2006), Relative humidity over Antarctica from radiosondes, satellites,and a general circulation model, J. Geophys. Res., 111, D09S13,doi:10.1029/2005JD006636.
Hudson, S. R., and S. G. Warren (2007), An explanation for the effect ofclouds over snow on the top-of-atmosphere bidirectional reflectance,J. Geophys. Res., 112, D19202, doi:10.1029/2007JD008541.
Hudson, S. R., S. G. Warren, R. E. Brandt, T. C. Grenfell, and D. Six(2006), Spectral bidirectional reflectance of Antarctic snow: Measure-ments and parameterization, J. Geophys. Res., 111, D18106,doi:10.1029/2006JD007290.
Jin, Z., and J. J. Simpson (1999), Bidirectional anisotropic reflectance ofsnow and sea ice in AVHRR channel 1 and 2 spectral regions: Part I.Theoretical analyses, IEEE Trans. Geosci. Remote Sens., 37, 543–554,doi:10.1109/36.739110.
Kato, S., and N. G. Loeb (2005), Top-of-atmosphere shortwave broadbandobserved radiance and estimated irradiance over polar regions fromClouds and the Earth’s Radiant Energy System (CERES) instrumentson Terra, J. Geophys. Res., 110, D07202, doi:10.1029/2004JD005308.
Leroux, C., and M. Fily (1998), Modeling the effect of sastrugi on snowreflectance, J. Geophys. Res., 103, 25,779 – 25,788, doi:10.1029/98JE00558.
Loeb, N. G., K. J. Priestley, D. P. Kratz, E. B. Geier, R. N. Green, B. A.Wielicki, P. O’Rawe Hinton, and S. K. Nolan (2001), Determination ofunfiltered radiances from the Clouds and the Earth’s Radiant Energysystem instrument, J. Appl. Meteorol., 40, 822–835, doi:10.1175/1520-0450(2001)040<0822:DOURFT>2.0.CO;2.
Loeb, N. G., S. Kato, K. Loukachine, and N. Manalo-Smith (2005), Angu-lar distribution models for top-of-atmosphere radiative flux estimationfrom the Clouds and the Earth’s Radiant Energy System instrument onthe Terra satellite: Part I. Methodology, J. Atmos. Oceanic Technol.,22(4), 338–351, doi:10.1175/JTECH1712.1.
McClatchey, R. A., R. W. Fenn, J. E. A. Selby, F. E. Volz, and J. S. Garing(1972), Optical Properties of the Atmosphere, 3rd ed., Environ. Res.Pap., 411, Air Force Cambridge Res. Lab., Bedford, Mass.
Nakajima, T., and M. Tanaka (1988), Algorithms for radiative intensitycalculations in moderately thick atmospheres using a truncation approx-imation, J. Quant. Spectrosc. Radiat. Trans., 40(1), 51–69.
Ricchiazzi, P., S. Yang, C. Gautier, and D. Sowle (1998), SBDART: Aresearch and teaching software tool for plane-parallel radiative transferin the Earth’s atmosphere, Bull. Am. Meteorol. Soc., 79(10), 2101–2114,doi:10.1175/1520-0477(1998)079<2101:SARATS>2.0.CO;2.
Six, D., M. Fily, L. Blarel, and P. Goloub (2005), First aerosol opticalthickness measurements at Dome C (East Antarctica), summer season2003–2004, Atmos. Environ., 32, 5041–5050, doi:10.1016/j.atmosenv.2005.05.010.
Stamnes, K., S.-C. Tsay, W. Wiscombe, and K. Jayaweera (1988), Numeri-cally stable algorithm for discrete-ordinate-method radiative transfer inmultiple scattering and emitting layered media, Appl. Opt., 27(12),2502–2509.
Walden, V. P., S. G. Warren, and F. J. Murcray (1998), Measurements of thedownward longwave radiation spectrum over the Antarctic Plateau andcomparisons with a line-by-line radiative transfer model for clear skies,J. Geophys. Res., 103, 3825–3846, doi:10.1029/97JD02433.
Warren, S. G., R. E. Brandt, and P. O’Rawe Hinton (1998), Effect of surfaceroughness on bidirectional reflectance of Antarctic snow, J. Geophys.Res., 103, 25,789–25,807, doi:10.1029/98JE01898.
Wielicki, B. A., B. R. Barkstrom, E. F. Harrison, R. B. Lee III, G. L. Smith,and J. E. Cooper (1996), Clouds and the Earth’s Radiant Energy System(CERES): An Earth Observing System experiment, Bull. Am. Meteorol.Soc., 77(5), 853–868.
�����������������������S. R. Hudson, Norwegian Polar Institute, Polar Environmental Centre,
N-9296 Tromsø, Norway. ([email protected])S. Kato, Climate Science Branch, NASA Langley Research Center, Mail
Stop 420, Hampton, VA 23681-2199, USA. ([email protected])S. G. Warren, Department of Atmospheric Sciences, University of
Washington, Box 351640, Seattle, WA 98195-1640, USA. ([email protected])
9 of 9
D03101 HUDSON ET AL.: EVALUATION OF CERES SNOW ADM D03101