Embed Size (px)
Citation preview

Eindhoven University of Technology
MASTER
Evaluating business process performance based on process mininganalyzing process mining output to evaluate and interpret the performance of businessprocesses
van den Ingh, L.O.
Award date:2016
Link to publication
DisclaimerThis document contains a student thesis (bachelor's or master's), as authored by a student at Eindhoven University of Technology. Studenttheses are made available in the TU/e repository upon obtaining the required degree. The grade received is not published on the documentas presented in the repository. The required complexity or quality of research of student theses may vary by program, and the requiredminimum study period may vary in duration.
General rightsCopyright and moral rights for the publications made accessible in the public portal are retained by the authors and/or other copyright ownersand it is a condition of accessing publications that users recognise and abide by the legal requirements associated with these rights.
• Users may download and print one copy of any publication from the public portal for the purpose of private study or research. • You may not further distribute the material or use it for any profit-making activity or commercial gain

‘s-Hertogenbosch, May 2016
EVALUATING BUSINESS PROCESS
PERFORMANCE BASED ON PROCESS
MINING
Analyzing process mining output to evaluate and interpret the performance of
business processes
Master thesis
L.O. van den Ingh
BEng Business Engineering
Student identity number 0634906
in partial fulfilment of the requirements for the degree of
Master of Science in Operations Management and Logistics
Supervisors:
Dr. Ir. H. Eshuis, TU/e, IS
Dr. S.E.C. Gelper, TU/e, ITEM
R. Dingemans MSc, SAP Nederland B.V.

TUE. School of Industrial Engineering.
Series Master Theses Operations Management and Logistics
Subject headings: process mining, performance measurement, process performance frameworks

I
Abstract
Process mining provides fact-based insight into how business processes have been executed. It has been
an academic research area for about a decade but is a fairly new technique for businesses to analyze
their processes. Currently, evaluating overall performance of a business process based on process
mining has not been addressed in scientific research. This Master thesis focuses on how to measure and
evaluate overall performance based on process mining, by using the Devil’s quadrangle.

II
Management Summary
Process mining provides fact-based insight into how business processes have been executed, based on
source tables from information systems. Currently, it is possible to analyze how processes were
executed and to measure performance on specific performance indicators, e.g. throughput time.
However, evaluating overall performance of a business process based on process mining has not been
addressed in scientific research. Therefore, this Master thesis focuses on how to measure and evaluate
overall performance of a process based on process mining. The research was conducted according to
the design science methodology, and consisted of three parts: first a thorough problem investigation
was executed, then a solution was designed and finally, the design was validated.
Background
This Master thesis project was executed within the department of Business Transformation Services
(BTS) of SAP in The Netherlands and used Celonis as process mining software to analyze raw data
from multiple customers. As the available data came from Purchase to Pay (P2P) processes, the research
focused on evaluating P2P processes. The goal was to provide a tool that enables BTS consultants to
evaluate process performance in a consistent and easy manner.
The research started with a literature review on existing performance measurement frameworks, which
yielded in selection of the Devil’s quadrangle as performance measurement framework to measure
process performance. The framework consists of four performance dimensions: time, quality, cost, and
flexibility. For each dimension, a high score indicates high performance, so for quality and flexibility a
high value translates into respective high quality and high flexibility while for time and cost, a high
value translates into high performance, i.e. highly time efficient and highly cost efficient. An appealing
property of the Devil’s quadrangle is that the performance on all dimensions can be visualized in a
quadrangle that shows the strengths and weaknesses of a process in one image. The total surface of this
quadrangle is difficult to improve; so when improving performance of one dimension, at least one other
dimension has to suffer from this, hence the name the Devil’s quadrangle, referring to this tradeoff.
Operationalization of the Devil’s quadrangle
Next, the four dimensions of the Devil’s quadrangle were operationalized using performance measures
that can be calculated by Celonis. To do so, two brainstorm sessions with BTS consultants were held,
leading to a list of in total 60 relevant performance indicators for P2P process performance. This list
was validated as being exhaustive by a P2P expert and subsequently checked with Celonis consultants
to ensure if all performance indicators could be calculated in Celonis, and if the necessary data was in
fact available (i.e. stored in a source table). As a final step, the performance indicators were tested
against the source tables that were available for analysis, and only those performance indicators that
could be calculated from the available tables were included in the final list of so called identified
performance indicators.
The values for the identified performance indicators were calculated for the five most occurring and
representative variants from each data set. These values, combined with a graphical representation of
the process variant, were used to create a survey for each company. Consultants that were involved with
proof of concepts at that specific company were asked to rate the performance on each dimension, for
all variants individually. Data from four companies was analyzed by a total of seven consultants. Next,
a regression analysis on the survey results was executed, aimed at finding a model to predict
performance for each dimension, based on a subset of the identified performance indicators. For each
dimension, the three models with the highest explanatory power (adjusted R2) were selected.

III
A fifth dataset, from another company, was used to validate these models. Again, values for all
identified performance indicators, for the five most occurring and representative variants, were
extracted and analyzed in the same survey that was used before. This validation survey was completed
by two consultants and their assessment was used to test the external validity, to find the model with
the highest predictive power. To do so, the expected value and corresponding 95%-confidence interval
were calculated for each process and for each model. For each dimension, the model with the lowest
mean absolute prediction error (MAPE) and highest number of observations within the confidence
interval was selected as the best model for predicting performance. This proved the external validity.
The ideal quadrangle
A separate analysis was executed to find how the Devil’s quadrangle should be shaped for an ideal P2P
process. A choice-based conjoint analysis was designed and 13 consultants completed the created
choice tasks, from which the ideal shape for the Devil’s quadrangle (ideal quadrangle) could be
identified. The relative importance (expressed as utility) of the dimensions are shown in table I.
Although the relative importance for cost is higher than the importance for time, the importance is so
close that both time and cost are the dimensions that should have the highest performance. Then, quality
is the most important and finally, flexibility is the least important dimension. The shape of the ideal
quadrangle is visualized in figure I. This ideal quadrangle can be used to see whether processes are
over- or underperforming on each dimension.
Figure I: Ideal shape of the Devil's quadrangle for a P2P process
Table I: Importance of the dimensions
Dimension Utility
Cost 31,188
Time 30,168
Quality 25,457
Flexibility 13,186
Framework to operationalize performance measurement
Based on the results from the steps undertaken, an operationalized frameworks was designed. This
section describes both the conceptual framework and the applied framework for a P2P process, which
is represented graphically in figure II. The conceptual design consists of four parts: a list with
performance indicators that significantly predict performance, segmented per dimension. Secondly,
these performance indicators serve as input for formulas that calculate the performance on a certain
dimension. The calculated performance for all dimensions is then used to visualize the Devil’s
quadrangle for that process variant. Finally, the ideal shape of the Devil’s quadrangle (which is process-
specific) is shown, and is designed in the same way as the visualized quadrangle for the process variants,
which makes it easy to compare the actual process with the ideal shape.
In the applied design for a P2P process, this conceptual design was translated into the following
framework: in Celonis, the significant performance indicators were programmed on a dashboard, so the
Quality
Time
Flexibility
Cost

IV
values a process variant scores on these measures can be seen automatically. Next, an Excel-tool was
designed that combines the last three parts of the framework: it allows users to enter the values of the
significant performance indicators for the process variants, and automatically calculates the
performance for each dimension. It also visualizes the quadrangle for each dimension, and it shows the
shape of the ideal quadrangle. In the validation phase, external validity and usability were tested, and
the applied framework showed to be a valid solution to the problem statement.
Figure II: Schematic overview of the operationalized framework, both conceptual and applied
Academic relevance
In prior research, the Devil’s quadrangle already proved to be a useful tool to measure performance,
e.g. in a process redesign-context. The research described in this thesis has shown that it is also possible
to measure process performance based on process mining output by using the Devil’s quadrangle. It
was applied to P2P process data and showed to provide a valid assessment of performance. A generic
process performance measurement framework was not created because each process-type (e.g. P2P)
has process-specific performance indicators, or stated otherwise, performance is always subject to
context. Therefore, a process-specific performance measurement framework was developed. The
research methodology that was followed can be used to operationalize the Devil’s quadrangle for
different processes, e.g. accounts receivable, in the future. To do so, the research methodology should
be executed with a focus on that specific process; so a list with performance indicators for that specific
process needs to be created and data from that specific process needs to be analyzed to come up with a
process-specific framework.
Applied to a P2P process
3. Excel tool
calculating
performance and
visualizing Devil’s
quadrangle
Conceptual
4. Visualized ideal
quadrangle
4. Visualized ideal
quadrangle for a P2P
process
2. Values of
performance
indicators per process
variant
3. Calculated
performance and
visualized Devil’s
quadrangle
1. Performance
measures significantly
predicting
performance
1. List with significant
performance
indicators
2. Celonis dashboard
automatically
calculating significant
performance measures

V
Preface
This Master thesis is the result of 8 months of research on process mining, process performance, and
the intriguing world where business and IT meet.
I would not have been able to complete my master thesis project without the help and guidance of a lot
of people, and therefore I would like to take the time to thank them (again). Richard hired me based on
a phone interview while I was studying in Australia, and while we both did not know what project
would be beneficial to the both of us, we came up with a plan within an hour, the very plan that I
executed in the past months and is the subject of this thesis. Richard, thank you for letting me get to
know the great world of SAP, for your guidance, and giving me the opportunity to use all resources as
if I were a regular member of the BTS team, and your valuable input during the last 8 months.
Next, I would like to thank Rik Eshuis for guiding me in my Master studies for about two years,
especially during my master thesis project. Your constructive feedback, flexibility to let me find my
own project and letting me execute it in my way, quick response on any e-mail and your keen eye for
detail are all very much appreciated and lead to this thesis. Sarah Gelper, as my second assessor, pointed
me in the right direction to run the analyses that answered all questions on this research and even though
the main subject was without her field of expertise, helped by linking the statistical parts to the research
to find a usable outcome, and of course for
Next to my supervisors, I would like to thank everyone that helped me during my project. I could not
have completed my research without the response in the brainstorms and surveys, without help to get
the systems up and running and of course without the coffee breaks, lunches and every other small
distraction while executing my project and writing yet another chapter of my thesis. Everyone working
on the sixth, thanks!
Celonis helped me by allowing me to use their software, train me to install and run process mining
analyses and provided valuable input to my research, and were always willing to answer yet another
question on how to calculate that specific measure. Thanks to everyone in Munich, especially Bastian,
Bettina, Matthias, Remy and Steffen.
Last, but definitely not least, I would like to thank everyone that contributed in making my time as a
student unforgettable. All of my friends for the good times and making memories that will last forever.
My parents for giving me freedom to deviate a little from the standard study path, supporting me
whenever I needed it and always being prepared to proofread any of my reports. And finally my
girlfriend for all her support, especially during the last few months.
Lucas van den Ingh
‘s Hertogenbosch, May 2016

VI
Table of contents
Abstract .................................................................................................................................................... I
Management Summary .......................................................................................................................... II
Preface ................................................................................................................................................... V
Table of contents ................................................................................................................................... VI
List of figures ...................................................................................................................................... VII
List of tables ....................................................................................................................................... VIII
1. Introduction ..................................................................................................................................... 1
SAP BTS ................................................................................................................................. 1
Process mining ........................................................................................................................ 1
Motivation ............................................................................................................................... 3
Problem statement ................................................................................................................... 4
Research scope ........................................................................................................................ 5
Research questions .................................................................................................................. 7
Report structure ....................................................................................................................... 7
2. Performance measurement .............................................................................................................. 8
Performance measurement systems ........................................................................................ 8
The Devil’s quadrangle ......................................................................................................... 13
Conclusion ............................................................................................................................ 14
3. Research methodology .................................................................................................................. 15
Problem investigation ........................................................................................................... 15
Solution design ...................................................................................................................... 16
Design validation .................................................................................................................. 17
Conclusion ............................................................................................................................ 17
4. Performance indicators that indicate process performance ........................................................... 18
Operationalization of the dimensions ................................................................................... 18
Which performance indicators significantly predict performance? ...................................... 20
Conjoint analysis provides insight into ideal quadrangles .................................................... 28
Conclusion ............................................................................................................................ 29
5. Design of the operationalized framework ..................................................................................... 31
Framework requirements ...................................................................................................... 31
Shape of the quadrangle for an ideal processes .................................................................... 32
Framework for measuring and comparing performance ....................................................... 32
Conclusion ............................................................................................................................ 35
6. Validation and verification............................................................................................................ 36
Validation of the framework ................................................................................................. 36
Verification of the framework ............................................................................................... 37

VII
Veracity and validity of the framework ................................................................................ 38
Conclusion ............................................................................................................................ 40
7. Conclusion and discussion ............................................................................................................ 41
Summary ............................................................................................................................... 41
Academic relevance .............................................................................................................. 42
Limitations ............................................................................................................................ 43
Further research .................................................................................................................... 43
Bibliography ......................................................................................................................................... 45
Appendix A: Literature review on performance measurement systems ............................................... 47
Appendix B: Design Science according to Wieringa ............................................................................ 80
Appendix C: Details on brainstorm sessions ........................................................................................ 81
Appendix D: Performance indicators .................................................................................................... 82
Appendix E: Overview of SAP tables and their relevant fields ............................................................ 84
Appendix F: Prerequisite steps for process mining .............................................................................. 85
Appendix G: Company and variant information ................................................................................... 87
Appendix H: Preview of a survey ......................................................................................................... 90
Appendix I: Conjoint-choice tasks ........................................................................................................ 94
Appendix J: Regression results and diagnostics ................................................................................... 97
Appendix K: External validation ........................................................................................................ 110
List of figures
Figure 1: Preview of Celonis output ....................................................................................................... 2
Figure 2: P2P process with four execution variants ................................................................................ 3
Figure 3: Cause-effect analysis with scope ............................................................................................. 6
Figure 4: The Devil's quadrangle .......................................................................................................... 14
Figure 5: Celonis dashboard presenting scores on all identified performance indicators ..................... 22
Figure 6: Possible unfinished execution variant ................................................................................... 23
Figure 7: Overview of case coverage per selected variant plus the cumulative coverage .................... 24
Figure 8: Example of a conjoint choice task ......................................................................................... 28
Figure 9: Ideal shape of the quadrangle for a P2P process ................................................................... 32
Figure 10: Schematic overview of the operationalized framework, both conceptual and applied ....... 33
Figure 11: Preview of the Celonis dashboard ....................................................................................... 34
Figure 12: Preview of the Excel-tool to visualize processes ................................................................. 34
Figure 13: Updated Excel tool .............................................................................................................. 39
Figure 14: Updates Celonis dashboard ................................................................................................. 39
Figure 15: Ideal shape ........................................................................................................................... 41

VIII
List of tables
Table 1: Common attributes in performance measurement systems..................................................... 13
Table 2: Identified, measureable performance indicators ..................................................................... 20
Table 3: Final list of identified, measureable performance indicators .................................................. 21
Table 4: The 3 best models for time ..................................................................................................... 27
Table 5: The 3 best models for cost ...................................................................................................... 27
Table 6: The 3 best models for quality ................................................................................................. 27
Table 7: The 3 best models for flexibility ............................................................................................. 27
Table 8: Importances of the dimensions ............................................................................................... 28
Table 9: Significant performance indicators for each dimension ......................................................... 29
Table 10: Validation data ...................................................................................................................... 36
Table 11: Significant performance indicators in the validated models ................................................. 40

1
1. Introduction
This thesis describes research that was executed to answer the question how to measure process
performance based on process mining output. As process mining is rapidly becoming a more popular
process analysis technique for business, the question how process mining can be used to assess process
performance becomes relevant. Since existing literature does not address this question, this research
contributes to both business and academic research. It aims at moving process mining from a descriptive
to a prescriptive process analysis technique.
The research was executed at SAP in The Netherlands, in close cooperation with Celonis, a German
Process Mining company. This chapter describes the research environment, an introduction to process
mining, the motivation, problem statement, research scope, the resulting research questions, and the
structure of the thesis.
SAP BTS
SAP SE is a multinational enterprise software developer that was founded in 1972 in Waldorf, Germany.
SAP SE is one of the biggest software companies worldwide, and is most well-known for their ERP
software solutions. Globally, over 75.000 people from over 120 nationalities are employed in 191
countries. These employees serve almost 300.000 customers in 25 industries. 98 of the 100 globally top
valued brands use SAP, and 74% of all transaction’s revenue worldwide ‘touches’ an SAP system. In
2014 SAP SE’s revenue was €17,6 billion, an increase of 4% compared to 2013. SAP’s global brand is
ranked as 25th in terms of brand value worldwide.
This research is executed within the department of Business Transformation Services (BTS) of SAP
Nederland B.V. (SAP NL), the Dutch office of SAP SE that is located in ‘s-Hertogenbosch. SAP NL is
a sales/consulting office that has about 550 employees. BTS helps customers in improving efficiency
of their processes, while using SAP software. The BTS NL team consists of 17 consultants and one
managing consultant. The consultants are located in The Netherlands and work on projects throughout
Europe (although mostly in The Netherlands) almost exclusively for multinationals. BTS’ main focus
is on optimizing processes with existing software and helping SAP customers to innovate and transform
their processes, e.g. by moving to the cloud or becoming a digital enterprise. Process mining is a
valuable way to create insight into business processes and is therefore an interesting subject for BTS.
So far, some BTS consultants have received training on how to analyze processes with process mining
tool Celonis, and multiple process mining projects have been executed at customers by BTS consultants,
but a framework to evaluate performance is missing.
Process mining
“Process mining techniques are able to extract knowledge from event logs commonly available in
today’s information systems. These techniques provide new means to discover, monitor, and improve
processes in a variety of application domains.” (van der Aalst et al., 2012). In other words: process
mining shows how processes have been executed, based on event logs from information systems. The
analyses can be used to monitor but also improve processes. Process mining includes various
techniques, e.g. process discovery (the process mining technique that creates process models based on
event logs) and conformance checking (comparing a predefined model with event logs).
Because companies want to know how processes have actually been executed, the data extraction is not
done from the data warehouse, since this data could be modified and therefore not veracious, but from

2
source tables from (ERP)-systems, storing transactional data.
These tables can be analyzed by process mining software,
which automatically creates process models based on that
data. Figure 1 shows the output of process mining that was
done for a purchase-to-pay (P2P) process.
Process mining allows analysts to zoom in on specific
processes, select specific process steps, time periods or
suppliers, and even selecting specific cases and analyze their
paths and performance indicators, e.g. throughput time. A
prerequisite for process mining is that event logs should store
transactional data including timestamp, or with an alternative
field that can be used to track the order in which activities
have been executed.
Various definitions of process mining can be found in
academic literature. The Process Mining Manifesto by van der
Aalst et al. (2012) aims to guide researchers and practitioners
that use process mining and to increase the maturity of process
mining to make it a more powerful tool for designing,
controlling and supporting operational business processes.
The manifesto was created by prominent researchers and
practitioners of 53 universities and companies working on
process mining. Therefore, the definition of process mining that was presented in the manifesto will be
used as the general definition in this research. This definition is “techniques, tools, and methods to
discover, monitor and improve real processes (i.e., not assumed processes) by extracting knowledge
from event logs commonly available in today’s (information) systems.”. The definition of process
mining that is being used within SAP and Celonis differs slightly from this definition and incorporates
some features of data mining as well. Data mining is defined as “the analysis of (often large) data sets
to find unsuspected relationships and to summarize the data in novel ways that are both understandable
and useful to the data owner” (van der Aalst et al., 2012).
SAP defines process mining with Celonis as follows: “Celonis Process Mining . . . is used to retrieve,
visualize and analyze real time business processes from transactional data stored by an ERP system. It
helps the users to create detailed process analysis by providing maximum transparency to the business
process used. It uses the SAP HANA technology as the analytical backbone. Raw data from the ERP is
transformed into a specified target structure on a regular basis and is used by the Celonis solution.”1
Celonis defines process mining as follows: “Celonis Process Mining allows you to analyze your
business processes in real time and achieve the maximum level of transparency for your business
operations. Process Mining . . . knows, analyzes and visualizes all of the process data saved in your IT
systems. Displaying the data according to their chronological order enables you to see exactly how
your business processes have been executed. Quickly detect weaknesses and potential for improvement
and get to the root of every single problem identified. Celonis Process Mining provides – down to single
case level – all the necessary information for the efficient implementation of optimization measures.
Due to the incredible transparency provided by Celonis Process Mining, the success of these measures
can be reviewed at once!” (Celonis)
1 Source derived from SAP intranet, not publicly available.
Figure 1: Preview of Celonis output
3
Deduced from the definitions stated above, the following definition will be used within this research:
“Process mining refers to discovering and monitoring processes by analyzing raw data with Celonis,
and creating insight in how business processes have actually been executed (i.e. no assumed process
executions). It summarizes and visualizes data in ways that are both understandable and useful for the
data owner. This creates a maximum level of transparency on top level while also allowing a drill down
to single case level.”
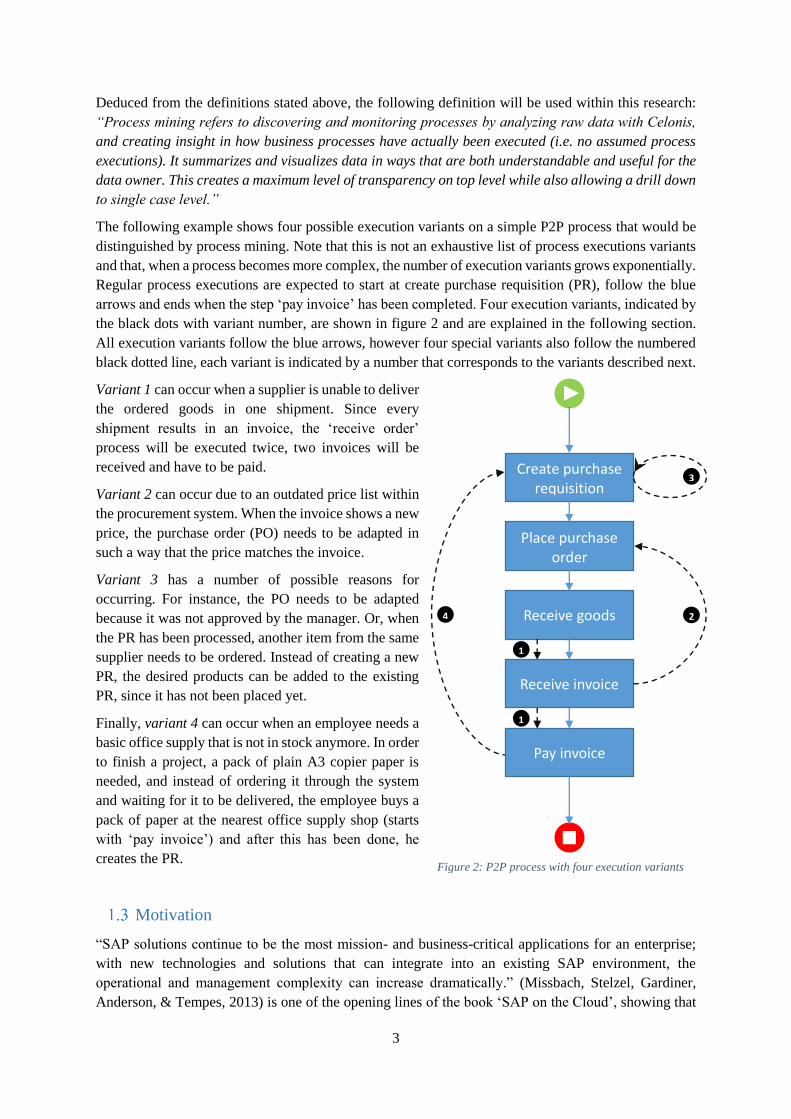
The following example shows four possible execution variants on a simple P2P process that would be
distinguished by process mining. Note that this is not an exhaustive list of process executions variants
and that, when a process becomes more complex, the number of execution variants grows exponentially.
Regular process executions are expected to start at create purchase requisition (PR), follow the blue
arrows and ends when the step ‘pay invoice’ has been completed. Four execution variants, indicated by
the black dots with variant number, are shown in figure 2 and are explained in the following section.
All execution variants follow the blue arrows, however four special variants also follow the numbered
black dotted line, each variant is indicated by a number that corresponds to the variants described next.
Variant 1 can occur when a supplier is unable to deliver
the ordered goods in one shipment. Since every
shipment results in an invoice, the ‘receive order’
process will be executed twice, two invoices will be
received and have to be paid.
Variant 2 can occur due to an outdated price list within
the procurement system. When the invoice shows a new
price, the purchase order (PO) needs to be adapted in
such a way that the price matches the invoice.
Variant 3 has a number of possible reasons for
occurring. For instance, the PO needs to be adapted
because it was not approved by the manager. Or, when
the PR has been processed, another item from the same
supplier needs to be ordered. Instead of creating a new
PR, the desired products can be added to the existing
PR, since it has not been placed yet.
Finally, variant 4 can occur when an employee needs a
basic office supply that is not in stock anymore. In order
to finish a project, a pack of plain A3 copier paper is
needed, and instead of ordering it through the system
and waiting for it to be delivered, the employee buys a
pack of paper at the nearest office supply shop (starts
with ‘pay invoice’) and after this has been done, he
creates the PR.
Motivation
“SAP solutions continue to be the most mission- and business-critical applications for an enterprise;
with new technologies and solutions that can integrate into an existing SAP environment, the
operational and management complexity can increase dramatically.” (Missbach, Stelzel, Gardiner,
Anderson, & Tempes, 2013) is one of the opening lines of the book ‘SAP on the Cloud’, showing that
Figure 2: P2P process with four execution variants
Create purchase requisition
Place purchase order
Receive goods
Receive invoice
Pay invoice
1
1
2
3
4

4
process mining is more relevant than ever and can be extremely helpful in gaining insight into the large
number of complex processes. With Celonis, SAP offers their customers a great opportunity to create
more insight into their processes. Literature confirms this claim: “Through the application of process
mining, valuable evidence-based insights can be obtained about business processes in organizations”
(Suriadi, Ouyang, van der Aalst, & ter Hofstede, 2015). Currently, a lot of the potential valuable data
that process mining has to offer, is not being used due to a lack of tools to interpret this data. Various
customers have enquired about evaluation of process performance and, more specific, performance
related to process mining, at SAP. Since competitors offer process mining tools as well, SAP needs to
be able to give high quality answers to their current customers to stay ahead of the competition. Apart
from this, SAP is moving their product portfolio to the cloud, they are currently undergoing a transition
from on premise products to Software-as-a-Service (SaaS). For SaaS, standardized processes with a low
degree of variance and customization are preferred over customer specific processes. These problem
clues all lead back to the research problem, that process mining currently cannot be used to evaluate
process performance except from personal, and therefore subjective, interpretation by a BTS consultant.
Therefore, SAP benefits from the results of this research.
Literature research done by Adriansyah (2014) shows that there is no approach that addresses the issue
of measuring performance of systems where processes have to deal with variation. This is a
conformation of the statement “existing approaches to project performance information onto process
models are limited to models at relatively low levels of abstraction.” (Adriansyah, 2009). This confirms
the academic relevance of this research. Chapter 2 gives an overview of the current performance
measurement frameworks and their applicability, indicating the academic relevance of this research.
Problem statement
Companies are constantly trying to improve their business processes to stay, or get, on top in their
markets. Process mining is one of the methods that is being used to analyze current processes and to
improve them. BTS consultants are asked by customers to define a good process, or the best process
possible. This question can be asked after process mining has been applied, so based on the process
paths that are produced, or as a more general question. Although this sounds like an easy question,
answering this question is very difficult. Answering which process is the fastest or has fewest rework
is relatively easy but the best process is characterized by a combination of different performance
indicators, e.g. processing time, quality and costs. Currently, a tool and methodology for including the
interaction between all performance indicators in answering which process is best, is missing. This is a
problem for BTS, as they are unable to address customer needs, and thus an indirect problem for SAP
customers. Therefore, BTS needs a tool that enables them to evaluate process performance better, based
on which they can give high quality advice, from which the customers will eventually benefit too.
This research focusses on the question triggered by the process mining results. Currently, if the customer
asks the question which of the process paths that was mined by Celonis is best, the consultant mainly
uses his experience to answer the question. He might compare the process paths that appear with process
sequences from the SAP process library, an internal SAP collection of best practice process sequences,
to determine which of the best practice processes is most suitable for the customer. This indicates a
number of problems while answering the question in the current way:
A lot of valuable information is left out of consideration, since the answer can be either based
on one of the performance indicators (e.g. throughput time or costs) which ignores the rest of
the available information, or a general answer is given, leaving the detailed data out of scope.
This is partly due to the fact that it is unknown which performance indicators need to be

5
considered. The best process is characterized by a combination of performance indicators and
is therefore extremely difficult to distinguish without making use of any tools. Therefore, the
current answer is not of the desired level of quality according to BTS.
The answer will vary, depending on the consultant assessing the different process paths. Since
every consultant has his own expertise and experience, they focus on different aspects, leading
to different answers. This is the only way to assess a process since there are no references or
benchmarks available. SAP wishes to deliver an SAP answer that is consistent, no matter who
provides the answer.
When using SAP’s process libraries in answering the question, two problems are present. First,
finding a best practice process that closely resembles the concerning process (and is therefore
applicable for answering that question) can be time-consuming since there are multiple process
libraries and there is no systematic search method. Next to that, the process libraries only
describe process sequences, so information on values that certain performance indicators should
have, is missing in the libraries. This problem will not be addressed in the research since the
focus is not on improving this current library.
The current situation was analyzed and this resulted in a number of problems. These problems are
represented graphically in a cause-effect diagram (figure 3), that also depicts the scope of the research.
Based on these analyses, the following problem statement was defined:
Research scope
Because of the limited time frame for this research, and limited data availability, the research scope had
to be defined to ensure a research that could be executed properly while taking the time and means
available into account.
The cause-effect diagram in figure 3 was explained in section 1.4, and shows the scope of the research.
As the research focusses on how process mining can be used to assess process performance, the main
issues are related to interpretation of process measures and inconsistency. These two causes were
marked as the main causes by multiple consultants. The process library is currently not suited to assist
in assessing performance and could be included in further research, as described in section 7.4, but was
excluded as the time did not allow for researching all three causes.
Celonis’ analyses provide data that can be used to give high quality advice. BTS is currently unable
to use this data in a desired way, so BTS lacks tools to evaluate and draw conclusions on processes
based on more than one performance indicator. BTS therefore needs a tool to utilize the available
data to its maximum extent, in order to deliver high quality and consistent answers, based on a well-
grounded framework.

6
Figure 3: Cause-effect analysis with scope
As datasets that were available for analysis were all coming from P2P processes, this research has
focused on measuring performance of P2P processes. However, the research was designed in such a
way that it can easily be repeated to measure performance of different process types. The actions that
should be taken to do so are stated in section 7.4 (further research).
Celonis Process Mining
As SAP has partnered with Celonis, a Munich-based process mining company that creates process
mining software and offers process mining services (PoC’s, training, and implementation), Celonis
Process Mining will be used as process mining software in this research. Since data cannot be mined
by any other tool due to strict regulations regarding confidentiality, the generalizability of the solution
cannot be tested by using other process mining tools. This research focused solely on the usage of
Celonis at SAP customers, and all datasets are sets of source tables from SAP systems.
Celonis was designed to be used by process owners or process experts working at an SAP customer.
When Celonis is configured, it allows easy and fast extraction of event logs from the source tables, that
can be mined automatically through the Celonis software. Raw data tables can be added as well, e.g. a
table with vendor master data to get additional vendor information in an analysis, allowing the user to
drill down to vendors from a specific country. There are three user types in Celonis: a viewer who needs
a three hour training to be able to view analyses, an analyst that needs a two day training to learn how
to analyze data and create dashboards, and a data scientist that needs to be trained for four days, after
which he is able to perform the technical implementation of Celonis within his company. This is an
advantage Celonis has over competing tools (e.g. Deloitte’s Process X-Ray) that can only be used by
consultants and not by the customer himself. Celonis is also capable of retrieving data from source
tables from various systems instantaneously, while competitor’s tools have a delay of about a week
before data becomes available, due to necessary data extraction. Celonis is a web based application,
allowing users to access Celonis through their web browser.
Celonis is able to analyze any process that has transactional tables containing time stamps. It uses
process discovery, resulting in process execution variants that follow exactly one unique execution path,

7
i.e. rerunning or skipping one process step results in a different process variant. Figure 5 (page 23)
shows how the addition of an activity, or double activity execution, leads to a new variant.
Research questions
In order to solve the problems stated in the previous subsections, the following research questions and
design problems had to be addressed:
1. How can the dimensions of the Devil’s quadrangle2 be operationalized to allow BTS consultants
to evaluate P2P process execution paths using data from Celonis’ analyses better than they
currently can?
2. What performance indicators significantly predict the performance of a P2P process execution
path?
3. Design the shape of the Devil’s quadrangle for a high performing P2P process.
4. Design a framework in which the values for the significant performance indicators for a high
performing P2P process are represented and used to calculate the performance per dimension,
and a tool that visualizes the shape of the quadrangle per execution variant.
5. Does the tool support BTS consultants in evaluating the performance of P2P process execution
paths qualitatively and consistently, and does it improve speed of evaluation?
Report structure
This report is structured as follows: chapter 2 describes the theoretical background of the research:
various performance measurement systems are described. The results of this chapter will be used as
input for the research, the research methodology that was followed is described in chapter 3. Chapter 4
contains the problem analysis phase of the project and answers research questions 1 and 2 in
respectively section 4.1 and 4.2. Chapter 5 describes the design of the operationalized framework and
ideal quadrangle, and by doing so answers research questions 3 and 4 in respectively section 5.1 and
5.2. In chapter 6 the validation and verification of the designed framework is described and research
question 5 is answered and finally chapter 7 concludes the research and presents a discussion.
2 The Devil’s quadrangle was selected as the performance measurement framework to be operationalized in the
literature review that is summarized in chapter 2, and used as a starting point in the research.

8
2. Performance measurement
This section describes theoretical background of performance measurement, one of the main
components of this research. It forms a starting point for the remainder of the research, as the outcome
of this chapter is a performance measurement framework that was operationalized, so it can evaluate
process performance based on process mining. Based on this framework, the research methods and
project plan were designed and therefore this chapter precedes the research methodology.
This chapter commences with a summary of the literature review that was performed as preparation of
this thesis, on various performance measurement frameworks for different organizational levels, after
which a more detailed description and motivation of the performance measurement framework that was
operationalized is given.
Performance measurement systems
This section describes a number of performance measurement systems that are used to measure
performance on different organizational levels. The findings are based on a literature review that
researched 10 performance measurement systems. For the full study, see Appendix A.
In section 2.1.1, an introduction of performance and performance measurement is given. In the
subsequent sections, performance measurement systems on strategic-, business unit-, and process-level
are discussed and in the final section a conclusion on the similarities, differences and key characteristics
of performance measurement systems is drawn, and the performance measurement framework that is
most suited to use in this research is selected.
2.1.1 Performance and performance measurement
Before searching for performance measurement, a definition of performance needs to be found. The
article by Lebas (1995) on performance measurement and performance management was selected, as it
comes from a journal with a high ISI JCR impact factor (2,75), and the article has been cited 670 times3.
Lebas states that performance is hard to define, as it is always subjective. He presents a definition of a
performing business, that is maintained throughout this research: “a performing business is one that will
achieve the objectives set by the managing coalition, not necessarily one that has achieved the
objectives” (Lebas, 1995). This indicates that performing is about being capable to meet (future)
objectives rather than solely about past achievements. As measures can only be about the past, this past
performance should serve as input for a causal model to evaluate the future. This model should capture
low-level measures as soon as they become available and use them to predict performance of high-level
performance measures. The low-level performance indicators (e.g. average order handling time) are
referred to as leading indicators, while the high-level performance indicators (e.g. net profit) are called
lagging indicators.
Based on this definition of performance, the literature research focused on describing performance
measurement systems for measuring performance on three organizational levels, the differences and
similarities between the different levels, and the characteristics a performance measurement system
should have.
3 According to Google scholar on April 29, 2016
9
2.1.2 Performance measurement on strategic level
Three performance measurement frameworks that measure performance on strategic level are
discussed. Although the goal of the research is not to measure performance on a strategic level but
rather on a lower level, these renowned and widely used systems offer some interesting insights into
what characteristics a performance measurement system should have, that were kept in mind during the
execution of this research.
The Balanced Scorecard
The balanced scorecard was introduced by Kaplan and Norton (1992) and is one of the most, if not the
most well-known performance measurement frameworks that has been used for over two decades by
companies of all sizes and in all kind of sectors. The balanced scorecard focusses on both financial and
operational measures, with the operational measures divided the following three areas: customer
perspective, innovation and learning perspective, and internal business perspective. The financial
perspective reflects the results of past actions while the operational measures are drivers for future
financial performance. The scorecard bundles various elements that together present all dimensions that
influence past and future performance. It shifts the view from the traditional control-centered to strategy
and vision-centered and by doing so, it helps companies in looking and moving forward.
Strategic Measurement Analysis Reporting Technique (SMART)
Cross and Lynch (1988) introduce SMART to solve four issues managers face regarding performance
measurement. The basis for the SMART control system is the so called performance pyramid that links
strategy to operations through three intermediate levels. The top level of the pyramid (the vision)
represents senior management, the second level consists of objectives for each business unit, the third
level represents tangible operating objectives for each business operating system in the company. The
fourth level consists of four ‘pillars’: quality, delivery, process and cost. These four pillars rest on top
of operations, the bottom layer.
Implementing SMART takes longer than comparable systems but the investment will pay itself off
according to the authors, who predict the following long-term benefits: an improved mindset, improved
organizational priorities and a shift in view on ROI, from financial to more qualitative benefits.
SMART distinguishes itself from other performance measurement systems as it is driven by strategy,
making it a business wide decision support system. It also allows companies to measure progress on
strategic objectives and allows for continuous adjustments to updated needs and it encourages
continuous improvement. The authors conclude by stating that every stakeholder, from suppliers to
customers and from operations to C-level, will benefit from implementing SMART.
The Results and determinants framework
A performance measurement system that measures performance over six dimensions is the Results and
determinants framework by Brignall, Fitzgerald, Johnston, and Silvestro (1991). It was designed
specifically for the service industry. The result-part consists of the dimensions competitiveness and
financial performance, the determinants-part consists of quality of service, flexibility, resource
utilization and innovation. Each dimension has its own performance indicators. The authors state that
the performance measures a company uses should be balanced over the different dimensions.
Companies should combine feed forward and feedback controls which is analogue to using both leading
and lagging indicators.
The performance measurement is subject to the environment, which is the why of performance
measurement. The strategy tells what to measure and the type of business determines how performance
10
should be measured. Information needed to measure performance differs per organizational level, so
there is no such thing as universal, enterprise-wide performance measures.
Similarities in performance measurement systems on strategic level
All strategic performance measurement systems agree that performance measures should derive from
strategy. Traditionally, measures are lagging as traditional performance measurement has its roots in
periodical (mostly financial) reporting, but all systems agree that lagging and leading indicators should
be combined to be able to improve processes and be able to influence future performance.
2.1.3 Performance measurement on business unit-level
This section describes four performance measurement systems on business unit-level (or operational
level). The systems do not focus solely on strategic or process performance, but aim to capture
performance throughout various organizational levels. Because of this property, these systems could be
of interest when measuring process performance and provide a useful link to more high-level
performance measures.
Performance measurement matrix
The performance measurement matrix by Keegan, Eiler, and Jones (1989) focusses on four types of
measures that, when combined, should provide an exhaustive view on operational performance. The
matrix consists of two axes: cost versus non cost and internal versus external. External measures can be
used to compare your performance to competitors’ performance, internal measures compare
performance with previous periods and budgets. Each company needs to populate the four matrix-areas
with company- and industry specific measures, update them to ensure they remain relevant, and ensure
no obsolete or inconsistent performance indicators are present.
The researchers conclude with four key principles for any performance measurement system: measures
should derive from strategy, they should be hierarchical and integrated across business functions,
support the multidimensional environment (so populate all areas), and be based on a thorough
understanding of cost.
Performance prism
Adams and Neely (2002) introduce the Performance prism as a second generation performance
measurement and management framework. It is motivated by the finding that companies should not
focus solely on financial performance measures, and consists of five facets: stakeholder satisfaction,
strategy, process, capabilities, and stakeholder contribution. The key difference with so called first
generation performance frameworks is that it focusses on all stakeholders instead of just management.
It is aimed at aligning all organizational parts with the company’s strategy, which should result in all
managers having the same higher goal. Leading indicators are a key factor in achieving this goal. The
main takeaway of this system is that it helps companies in measuring performance from different
perspectives, but with one aligned goal: creating stakeholder satisfaction.
Integrated performance measurement system
The Integrated performance measurement system was developed to be able to support change processes
within organizations. It is designed to integrate four organizational levels: corporate, business unit,
business process and activity level. Bititci, Carrie, and McDevitt (1997) designed the system because
financial measures are not supporting change processes, and business are failing to integrate quality-
oriented performance measures. The system is introduced as an enabler for performance management
that integrates e.g. strategy, accounting and innovation.

11
Each level within the system is connected to the external environment and the levels above and below,
and consists of five factors: stakeholders, control measures, environmental positioning, improvement
objectives, and internal measures. The following concepts are integrated in the framework: policy
deployment, competitive criteria and benchmarking, process orientation, normative planning, and
activity monitoring. This system is described on a very high conceptual level, when it is applied in the
right manner it should improve efficiency and effectiveness of the organization-wide performance
management process.
Dynamic performance measurement system
Based on a study that examined seven performance measurement systems, the dynamic performance
measurement system is introduced by Bititci, Turner, and Begemann (2000). The system combines
elements of those seven systems into the following requirements: it should continuously monitor
developments and changes in both internal and external environment, combine that information with
objectives and priorities coming from higher level systems to set internal objectives, and ensure that
internal measures stay up-to-date.
The system should be seen as a pyramid of sub-systems, in which the business-level is the top, below
multiple business units are present, each having a number of business processes. As these subsystems
should be integrated, the levels should be linked closely. This should facilitate management of causal
relationships between various performance measures from different levels. The system should also be
able to quantify the causal relationships between local and strategic performance measures. A number
of requirements for the IT platform are stated, that are needed to realize a truly dynamic performance
measurement system.
When checking the requirements stated against the researched systems, the review mechanism is the
unique factor that is absent in all systems. The main conclusion is that, although existing systems do
not meet all requirements stated, current knowledge and technology should be sufficiently mature to
create dynamic performance measurement systems.
Similarities in performance measurement systems on business unit-level
All systems described in this section have their respective characteristics but the common ground on
these systems is that a performance measurement systems should always include leading and lagging
indicators, measure performance on multiple dimensions (the bare minimum is two dimensions:
financial and non-financial), and link performance from strategic level down to operational level.
2.1.4 Performance measurement on process level
This section describes three different performance measurement frameworks on the lowest
organizational level, the business process (or workflow) level and concludes with a comparison of
these systems.
The Devil’s quadrangle
Despite its curious name, the Devil’s quadrangle that was introduced by Brand and Van der Kolk (1995)
provides an interesting insight into performance as it incorporates the tradeoff that has to be made
between different performance dimensions. The framework states that process performance should be
measured on four axes: quality, time, cost and flexibility. A high value on these axes indicates high
performance on that dimension, so concerning time and cost, a high value indicates respectively a high
time efficient and cost efficient process, while for flexibility and quality, a high value means that the
process is highly flexibility and has high quality. The name of the framework is deduced from the
tradeoff that has to be made whenever optimizing a process. It is impossible to have a high score on all
12
dimensions, so a choice has to be made regarding to what dimension should be increased and what
dimension has to suffer from that increase.
Process performance measurement system (PPMS)
PPMS was introduced by Kueng (2000) because no existing performance measurement system was able
to integrate business process improvement and process measurement. He states that existing systems
do not pay enough attention to non-financial measures and therefore he proposes the PPMS that fulfills
two criteria: it is focused on business processes and takes both quantitative and qualitative aspects into
account. Based on a number of existing systems, the following three requirements are stated: it should
capture performance-relevant information from business processes, use this data to compare against
targets and historical values and communicate the results to the stakeholders.
Performance indicators need to be selected and tested against the requirements, and acceptance of these
indicators needs to be ensured, and the process team needs to establish a common goal or direction.
Creating a list of relevant performance indicators is a time-consuming process but will eventually lead
to better results. Data collection for these performance indicators should be made easy, e.g. by a
dashboard in an information system. A PPMS will not improve performance by itself but when it is
combined with a social transformation there is significant room for improvement.
Process performance measurement
Leyer, Heckl, and Moormann (2015) introduce Process performance measurement by stating that
process control consists of three parts: measurement, analysis and improvement. There is no universal
measurement method, the measurement system has to be selected based on external environment,
strategy and the process model. Performance measures are divided into four categories: quality, time,
cost and flexibility. Each category should contain measures that are linked to the company’s strategy.
Based on these performance measures an in-depth analysis should be performed, which forms the basis
for improving processes.
Similarities in performance measurement systems on process level
The performance measurement systems on the process level show similarities regarding the use of
leading indicators, using multiple dimensions to measure performance and that measures are always
subject to the business environment, including strategy. As the aim of this research is measuring process
performance, a performance measurement system from this section had to be selected, what is done in
section 2.1.5.
2.1.5 Characteristics of performance measurement systems and usability in process
mining
An overview of the common attributes the performance measurement systems on the same
organizational level have is shown in table 1. A tick-mark in the checkbox indicates that all systems
agree on including this attribute, a blank checkbox indicates that there is some disagreement on
including this attribute. It shows that the differences are small, but when applying the systems on various
organizational levels differences in applying the system will come to light.

13
Table 1: Common attributes in performance measurement systems
Attribute
Organizational level Lea
din
g i
nd
icat
ors
Mu
ltip
le d
imen
sio
ns
Fin
anci
al
and
no
n-
fin
anci
al
Str
ateg
y d
riv
en
Strategic
Business unit
Process
As process mining in this research context is focused on analyzing performance on process level, the
frameworks on process level were investigated in more detail to find the most suited performance
measurement system to use in this research. Since integrating the performance measurement framework
into existing systems is outside the research scope, the Devil’s quadrangle’s low complexity is an
advantage. In the research by Jansen-Vullers, Loosschilder, Kleingeld, & Reijers (2007), six different
performance measurement systems are discussed. They conclude that the dimensions of the Devil’s
quadrangle are most suitable for measuring performance, and operationalize these dimensions in a
qualitative case study. Various other sources confirm the usability of the Devil’s quadrangle, e.g.
Limam-Mansar and Reijers (2005), Jansen-Vullers, Kleingeld, and Netjes (2008) and Dumas, La Rosa,
Mendling, and Reijers (2013). Therefore, the Devil’s quadrangle will be used to evaluate the
performance of the process mining results. In section 2.2, a more detailed explanation of the Devil’s
quadrangle is presented.
The Devil’s quadrangle
In the previous section, the Devil’s quadrangle was introduced. Its characteristics and reported
appliances, proving both value and usability, motivate the choice to use the Devil’s quadrangle as the
performance measurement framework to measure process performance. This section presents a more
elaborate explanation of the framework and its applicability.
The Devil’s quadrangle (figure 4) consists of the dimensions time, quality, costs, and flexibility. The
quadrangle is named after the trade-off that has to be made when designing a process. It is not possible
to maximize all four the criteria, therefore a choice has to be made regarding what dimension should be
maximized. This choice is directed by the strategy and focus of the organization. No matter what
dimension is maximized, the total surface remains unchanged. This means that an increase in one
dimension, will result in a decrease in at least one other dimension. Improving all dimensions is only
possible when the total surface is increased. In order to do so, the process needs to be redesigned (Brand
& Van der Kolk, 1995).

14
The following definition of the dimensions of the Devil’s quadrangle is based on the research by Jansen-
Vullers et al. (2008):
Time is both a source of competitive advantage and a fundamental performance measure.
Analyzing performance on this dimension can be done by looking at lead time and throughput
time (consisting of service time, queue time, wait time, move time and setup time).
Cost is related to time, since time costs money (manual labor has an hourly rate, machine labor
has costs from e.g. machine depreciation and power consumed). Cost are also closely related
to quality, since poor quality causes costly rework, and to flexibility since a rigid process results
in a costly process execution. In the study, a distinction is made between running costs,
inventory costs, transport costs, administrative costs and resource utilization costs.
Quality can be considered as either external or internal quality. External quality indicates the
customer’s perception of quality, whereas internal
quality is seen from within the manufacturer’s side.
o Customer satisfaction is the most important
measure for external quality. This satisfaction
can be regarding the product (i.e. the output)
or the process leading to the product. Product
quality takes product performance,
conformance and serviceability into account.
Process quality considers information ability
and bureaucratic language simplification.
o The quality of the workflow, as seen from an operator’s point of view, is internal
quality. Job characteristics indicate high internal quality, additionally group and leader
factors influence motivation and job satisfaction.
Flexibility is the ability to react to changes. This dimension can be identified for individual
resources, individual tasks and for the process as a whole. Five types of flexibility are stated:
mix flexibility, labor flexibility, routing flexibility, volume flexibility and process modification
flexibility.
Operationalization of the dimensions is the most difficult for both quality dimensions since the large
number of factors influencing the quality perception, and the fact that it is more subject to opinion-
rather than fact-based measures.
Conclusion
Of the performance measurement systems that have been researched, the Devil’s quadrangle appears to
be the best framework to measure performance based on process mining. The Devil’s quadrangle is
therefore selected as the framework that is used throughout the research. To make it possible to measure
process performance with the Devil’s quadrangle, it had to be operationalized. This is one of the main
activities that was executed, and is described in the remainder of this thesis.
high flexibility
Short throughput time low cost
high quality
Figure 4: The Devil's quadrangle
15
3. Research methodology
This research was conducted based on design science. Design science in Information Systems (IS)
research was introduced by Hevner et al. (2004), who describe the design process as being “a sequence
of expert activities that produces an innovative product.”, and that IS research addresses problems
characterized by complex interactions between components of the problem and its solution. These
statements match the problem statement and research goals of this research. The usability of design
science is confirmed by Wieringa’s view that “Design problems call for a change in the real world . . .
A solution is a design, and there are usually many different solutions . . . These are evaluated by their
utility with respect to the stakeholder goals, and there is not one single best solution.” (Wieringa, 2014).
Finally, Van Aken et al. (2007) state that “Design-focused business problem solving deals with
improvement problems, not with pure knowledge problems.”, which makes this methodology an
excellent choice for this research. Appendix B shows an elaborate description of design science.
This chapter describes how the research was conducted and what activities were performed in what
phase. This plan was designed at the beginning of the research, but as new insights and results came to
light, was adapted in such a way that the research questions could be answered taking results from all
previous activities into account. This follows the statement by Van Aken et al. (2007): “Design-oriented
means that activities are controlled through a sound project plan. The plan is not a fixed contract but
this means that you look before you leap. The project plan can be adapted when new insights become
available.”
The practical problem in this research, as stated in section 1.4, is the inability to evaluate performance
of process execution paths that are distinguished and visualized by process mining. The activities that
were executed will be explained in detail in the remainder of this chapter, based on the design cycle by
Wieringa (2014), so starting with the problem investigation, secondly the solution design and finally
the design validation.
Problem investigation
The first part of this phase, the problem definition, was executed and resulted in the choice for design
science. The resulting problem definition is described in chapter 1. The activities undertaken to analyze
and diagnose the problem are described in the following section. The problem analysis and diagnosis
consists of two sub phases: to answer the first research question, the first phase in which performance
indicators for each dimension of the Devil’s quadrangle were identified was executed. To answer the
second research question, the activities in the second phase were executed. The exact steps that were
undertaken to answer the first two research questions are described in detail below while the results can
be found in chapter 4.
The first research question, focused on how the Devil’s quadrangle can be operationalized to measure
process mining performance, was answered by the following activities: first, a list of performance
indicators for each dimension of the Devil’s quadrangle had to be created. The performance indicators
were identified in brainstorm sessions and later validated. The result of this phase provides the answer
to the first research question. The following activities were executed in this step:
i. Two brainstorm sessions with five selected BTS consultants were held in order to
determine which performance indicators could represent the four dimensions of the
Devil’s quadrangle. The output of these sessions is a list of performance indicators per
dimension.

16
ii. The output of the brainstorms was discussed with Celonis, to create a list of
performance indicators that could actually be measured in Celonis, i.e. performance
indicators that can be calculated for process variants in Celonis.
iii. The list was validated with a highly experienced P2P consultant from BTS to test
whether the list covered all important P2P performance indicators or was missing
certain aspects.
iv. Based on these two validation steps, the list with performance indicators that represents
P2P process performance was reported. The performance indicators are segmented per
dimension (from now on referred to as ‘the identified performance indicators’).
Next, a phase focusing on which of the identified performance indicators significantly predict the
performance of a P2P process was executed. First data had to be collected and mined, after which
consultants assessed the performance of selected execution variants. The response from consultants was
analyzed in a regression analysis that lead to models that calculate performance, for each dimension.
Additionally, a separate conjoint analysis was executed to find out what shape the Devil’s quadrangle
should have for a well performing process. The exact activities executed were:
v. For each data set (a set of source tables coming from one specific company), the tables
that were needed to run Celonis process mining and calculate the identified
performance indicator were prepared for mining.
vi. The identified performance indicators needed to be displayed in Celonis so that the
values for these performance indicators can be extracted for each variant.
vii. For each data set, a survey containing the most occurring representative variants had to
be created. This was used to let consultants assess the performance of the different
process execution variants.
viii. Before handing the surveys over to the consultants that were involved with the proof
of concepts (PoCs), and are therefore familiar with the specific processes within that
company, they received an explanation of the Devil’s quadrangle and the specific
application of the framework in this research. Next, the survey was handed over and
introduced in detail.
ix. A regression analysis was applied to analyze the surveys responses, in order to find
models that can translate a number of performance indicators into the expected
performance of a process on each dimension. The results answer research question two
and serve as input for the solution design.
x. All consultants involved in the project so far (during the brainstorm, validation of the
list or by responding to the survey) were sent a list with ten choice tasks. These choice
tasks served as an input for the conjoint analysis that was executed subsequently. The
results serve as input for the solution design as well.
Solution design
In this phase, two designs were realized: first, the ideal shape of the Devil’s quadrangle for a high
performing P2P process. Additionally, the framework that displays the significant performance
indicators, and translates this into performance of the dimensions, and visualizes this performance was
designed. As the designed solution should enable BTS consultants to evaluate the performance of
processes, requirements had to be gathered before the solution could be designed. The following
activities were executed in this phase:

17
i. The requirements for the framework were collected from all stakeholders, this served
as important input for the remainder of the design phase.
ii. Based on the results of the conjoint analysis, the shape of the ideal quadrangle was
identified and designed.
iii. The performance indicators that have significant impact on performance were
positioned in the framework, leading to a provisional framework ready for validation.
iv. A tool that visualizes the Devil’s quadrangle for each execution variant, based on values
of the performance indicators placed in the framework, had to be designed. The ideal
quadrangle was added to this framework as well, allowing for a visual comparison of
the variants with the ideal process.
v. The previous steps were documented in such a way that the requirements of the
framework were met, and the tool could be used by a BTS consultant with basic Celonis
knowledge.
Design validation
This phase focused on validating the findings from the first two phases of the Design cycle. The
framework was validated on both external validity, by testing whether the performance as calculated by
the framework matched the assessment by BTS consultants, and verified against the requirements stated
in the design phase. The validation was done using the practitioners that have participated in the research
before, but with different data (i.e. different mined process paths) to minimize under or over fitting. The
validation follows Technical Action Research (TAR), which is presented by Wieringa (2014), who
describes this method as being suited to test a new artifact in the real world by using it to solve a real-
world problem. It is a form of validation research, done in the field with an artifact that is still under
development and only being used in the research context. In this way, the artifacts properties can be
tested under real-world conditions.
To verify whether, and to what extent, the tool supports BTS consultants in evaluating the performance
of P2P process execution paths qualitatively and consistently, and improves speed of evaluation, the
following activities were executed. Wieringa’s (2014) checklists concerning validity of measurement
design, validity of description design, internal validity and external validity were used as a guide. The
following exact steps were executed:
i. Interviews with BTS consultants were held to determine aspects the usability of the
solution, i.e. testing whether the framework meets the requirements that were stated.
ii. The solution was applied to a new data set to test external accuracy, and to confirm
validity of description design.
iii. The results of the validation were analyzed and used to adjust the tool.
iv. The usability of the updated tool was tested again, to find whether the usability
improved.
Conclusion
This chapter described how the research has been executed. The activities that were undertaken were
based on design science, a proven research methodology in information systems research. As discussed
in section 7.4, the activities described in this chapter can be repeated to measure performance of other
processes, by changing the focus from P2P to the process type of interest.
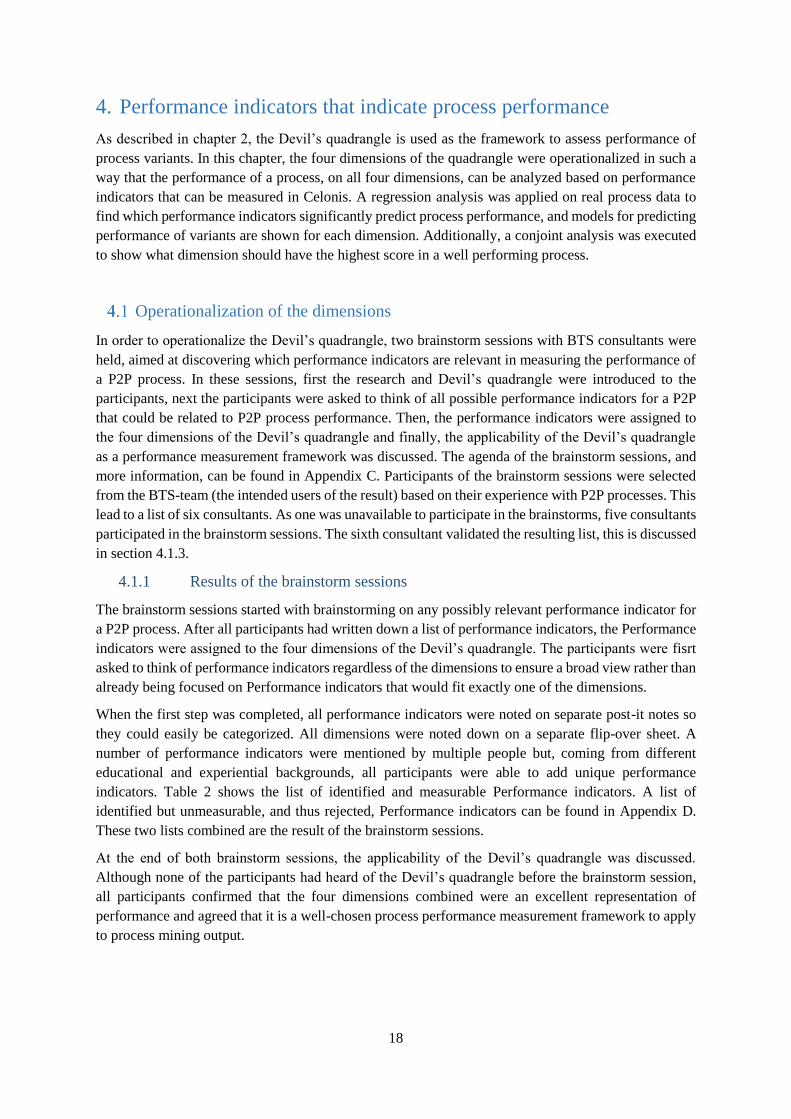
18
4. Performance indicators that indicate process performance
As described in chapter 2, the Devil’s quadrangle is used as the framework to assess performance of
process variants. In this chapter, the four dimensions of the quadrangle were operationalized in such a
way that the performance of a process, on all four dimensions, can be analyzed based on performance
indicators that can be measured in Celonis. A regression analysis was applied on real process data to
find which performance indicators significantly predict process performance, and models for predicting
performance of variants are shown for each dimension. Additionally, a conjoint analysis was executed
to show what dimension should have the highest score in a well performing process.
Operationalization of the dimensions
In order to operationalize the Devil’s quadrangle, two brainstorm sessions with BTS consultants were
held, aimed at discovering which performance indicators are relevant in measuring the performance of
a P2P process. In these sessions, first the research and Devil’s quadrangle were introduced to the
participants, next the participants were asked to think of all possible performance indicators for a P2P
that could be related to P2P process performance. Then, the performance indicators were assigned to
the four dimensions of the Devil’s quadrangle and finally, the applicability of the Devil’s quadrangle
as a performance measurement framework was discussed. The agenda of the brainstorm sessions, and
more information, can be found in Appendix C. Participants of the brainstorm sessions were selected
from the BTS-team (the intended users of the result) based on their experience with P2P processes. This
lead to a list of six consultants. As one was unavailable to participate in the brainstorms, five consultants
participated in the brainstorm sessions. The sixth consultant validated the resulting list, this is discussed
in section 4.1.3.
4.1.1 Results of the brainstorm sessions
The brainstorm sessions started with brainstorming on any possibly relevant performance indicator for
a P2P process. After all participants had written down a list of performance indicators, the Performance
indicators were assigned to the four dimensions of the Devil’s quadrangle. The participants were fisrt
asked to think of performance indicators regardless of the dimensions to ensure a broad view rather than
already being focused on Performance indicators that would fit exactly one of the dimensions.
When the first step was completed, all performance indicators were noted on separate post-it notes so
they could easily be categorized. All dimensions were noted down on a separate flip-over sheet. A
number of performance indicators were mentioned by multiple people but, coming from different
educational and experiential backgrounds, all participants were able to add unique performance
indicators. Table 2 shows the list of identified and measurable Performance indicators. A list of
identified but unmeasurable, and thus rejected, Performance indicators can be found in Appendix D.
These two lists combined are the result of the brainstorm sessions.
At the end of both brainstorm sessions, the applicability of the Devil’s quadrangle was discussed.
Although none of the participants had heard of the Devil’s quadrangle before the brainstorm session,
all participants confirmed that the four dimensions combined were an excellent representation of
performance and agreed that it is a well-chosen process performance measurement framework to apply
to process mining output.

19
4.1.2 Validation of measurability performance indicators
The list with identified Performance indicators was discussed with Celonis and all performance
indicators were marked to be either available, possible to be made available, or unavailable. Appendix
D gives an overview of the excluded Performance indicators, in which the exclusion reasons ‘Data not
available in SAP systems’ and ‘Calculation not possible in Celonis’ (due to the process mining
techniques that are being used) stem from this phase. Note that there is one other category of exclusion
reasons, this category is explained in section 4.2. The list with measurable Performance indicators is
represented in table 2.
4.1.3 Validation of the list
In an interview with a BTS consultant with a vast amount of experience and expertise in P2P processes,
the list with performance indicators in table 2 was validated. He confirmed completeness of the list,
stating that all Performance indicators that are currently regarded as important by practitioners in the
P2P-field were present on the list, and a number of currently unused but interesting and potentially
important Performance indicators was present as well. He also confirmed the Devil’s quadrangle as a
suitable process performance measurement framework both for P2P processes, and business processes
in general.
4.1.4 Performance indicators representing process performance
A list of performance indicators that operationalize the Devil’s quadrangle and represent process
performance is shown in table 2 (page 20). This list is the answer to research question 1. In the following
steps of the problem investigation phase, scores on these Performance indicators from multiple
processes were gathered, rated and analyzed to find out what Performance indicators significantly
predict process performance.
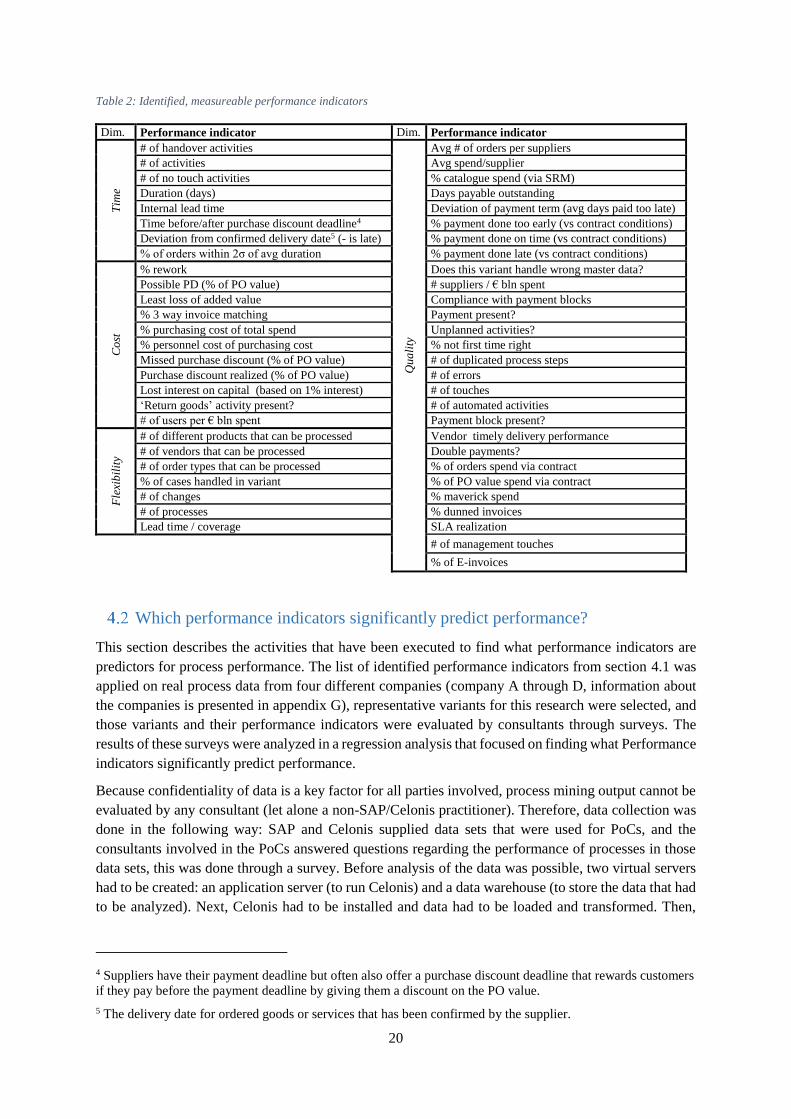
20
Table 2: Identified, measureable performance indicators
Dim. Performance indicator Dim. Performance indicator
Tim
e
# of handover activities
Qu
ali
ty
Avg # of orders per suppliers
# of activities Avg spend/supplier
# of no touch activities % catalogue spend (via SRM)
Duration (days) Days payable outstanding
Internal lead time Deviation of payment term (avg days paid too late)
Time before/after purchase discount deadline4 % payment done too early (vs contract conditions)
Deviation from confirmed delivery date5 (- is late) % payment done on time (vs contract conditions)
% of orders within 2σ of avg duration % payment done late (vs contract conditions)
Co
st
% rework Does this variant handle wrong master data?
Possible PD (% of PO value) # suppliers / € bln spent
Least loss of added value Compliance with payment blocks
% 3 way invoice matching Payment present?
% purchasing cost of total spend Unplanned activities?
% personnel cost of purchasing cost % not first time right
Missed purchase discount (% of PO value) # of duplicated process steps
Purchase discount realized (% of PO value) # of errors
Lost interest on capital (based on 1% interest) # of touches
‘Return goods’ activity present? # of automated activities
# of users per € bln spent Payment block present?
Fle
xib
ilit
y
# of different products that can be processed Vendor timely delivery performance
# of vendors that can be processed Double payments?
# of order types that can be processed % of orders spend via contract
% of cases handled in variant % of PO value spend via contract
# of changes % maverick spend
# of processes % dunned invoices
Lead time / coverage SLA realization
# of management touches
% of E-invoices
Which performance indicators significantly predict performance?
This section describes the activities that have been executed to find what performance indicators are
predictors for process performance. The list of identified performance indicators from section 4.1 was
applied on real process data from four different companies (company A through D, information about
the companies is presented in appendix G), representative variants for this research were selected, and
those variants and their performance indicators were evaluated by consultants through surveys. The
results of these surveys were analyzed in a regression analysis that focused on finding what Performance
indicators significantly predict performance.
Because confidentiality of data is a key factor for all parties involved, process mining output cannot be
evaluated by any consultant (let alone a non-SAP/Celonis practitioner). Therefore, data collection was
done in the following way: SAP and Celonis supplied data sets that were used for PoCs, and the
consultants involved in the PoCs answered questions regarding the performance of processes in those
data sets, this was done through a survey. Before analysis of the data was possible, two virtual servers
had to be created: an application server (to run Celonis) and a data warehouse (to store the data that had
to be analyzed). Next, Celonis had to be installed and data had to be loaded and transformed. Then,
4 Suppliers have their payment deadline but often also offer a purchase discount deadline that rewards customers
if they pay before the payment deadline by giving them a discount on the PO value.
5 The delivery date for ordered goods or services that has been confirmed by the supplier.
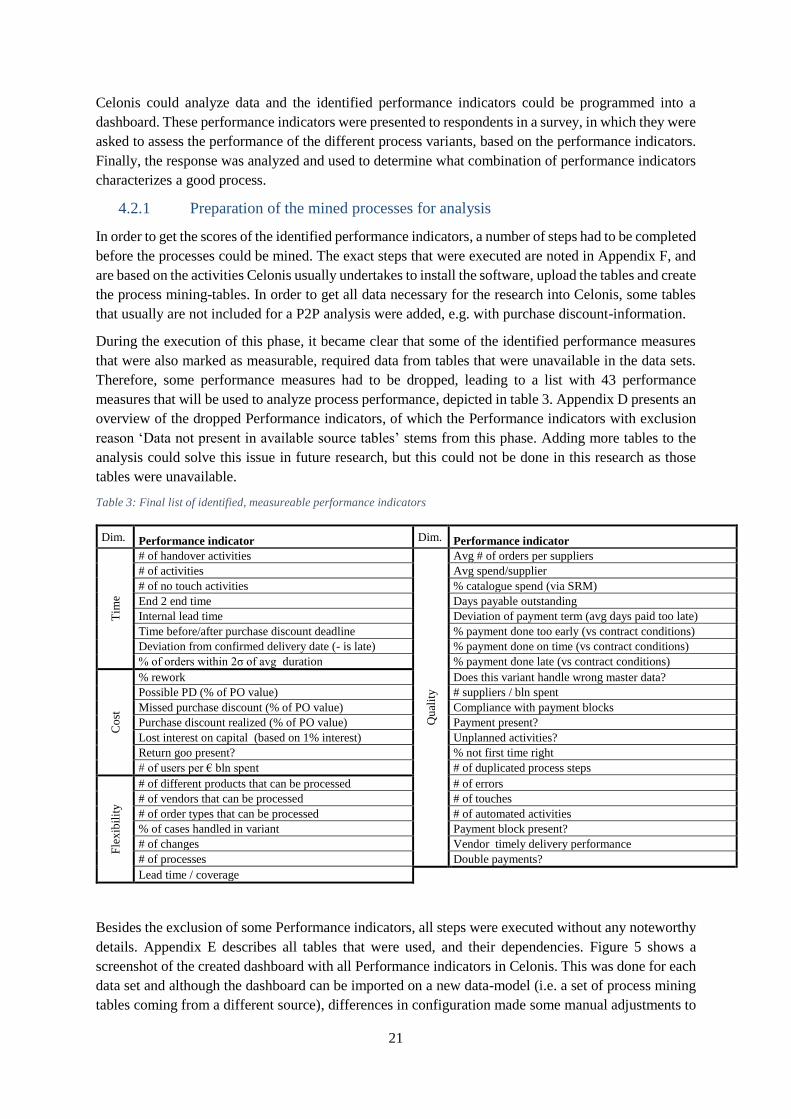
21
Celonis could analyze data and the identified performance indicators could be programmed into a
dashboard. These performance indicators were presented to respondents in a survey, in which they were
asked to assess the performance of the different process variants, based on the performance indicators.
Finally, the response was analyzed and used to determine what combination of performance indicators
characterizes a good process.
4.2.1 Preparation of the mined processes for analysis
In order to get the scores of the identified performance indicators, a number of steps had to be completed
before the processes could be mined. The exact steps that were executed are noted in Appendix F, and
are based on the activities Celonis usually undertakes to install the software, upload the tables and create
the process mining-tables. In order to get all data necessary for the research into Celonis, some tables
that usually are not included for a P2P analysis were added, e.g. with purchase discount-information.
During the execution of this phase, it became clear that some of the identified performance measures
that were also marked as measurable, required data from tables that were unavailable in the data sets.
Therefore, some performance measures had to be dropped, leading to a list with 43 performance
measures that will be used to analyze process performance, depicted in table 3. Appendix D presents an
overview of the dropped Performance indicators, of which the Performance indicators with exclusion
reason ‘Data not present in available source tables’ stems from this phase. Adding more tables to the
analysis could solve this issue in future research, but this could not be done in this research as those
tables were unavailable.
Table 3: Final list of identified, measureable performance indicators
Dim. Performance indicator Dim. Performance indicator
Tim
e
# of handover activities
Qu
alit
y
Avg # of orders per suppliers
# of activities Avg spend/supplier
# of no touch activities % catalogue spend (via SRM)
End 2 end time Days payable outstanding
Internal lead time Deviation of payment term (avg days paid too late)
Time before/after purchase discount deadline % payment done too early (vs contract conditions)
Deviation from confirmed delivery date (- is late) % payment done on time (vs contract conditions)
% of orders within 2σ of avg duration % payment done late (vs contract conditions)
Co
st
% rework Does this variant handle wrong master data?
Possible PD (% of PO value) # suppliers / bln spent
Missed purchase discount (% of PO value) Compliance with payment blocks
Purchase discount realized (% of PO value) Payment present?
Lost interest on capital (based on 1% interest) Unplanned activities?
Return goo present? % not first time right
# of users per € bln spent # of duplicated process steps
Fle
xib
ilit
y
# of different products that can be processed # of errors
# of vendors that can be processed # of touches
# of order types that can be processed # of automated activities
% of cases handled in variant Payment block present?
# of changes Vendor timely delivery performance
# of processes Double payments?
Lead time / coverage
Besides the exclusion of some Performance indicators, all steps were executed without any noteworthy
details. Appendix E describes all tables that were used, and their dependencies. Figure 5 shows a
screenshot of the created dashboard with all Performance indicators in Celonis. This was done for each
data set and although the dashboard can be imported on a new data-model (i.e. a set of process mining
tables coming from a different source), differences in configuration made some manual adjustments to
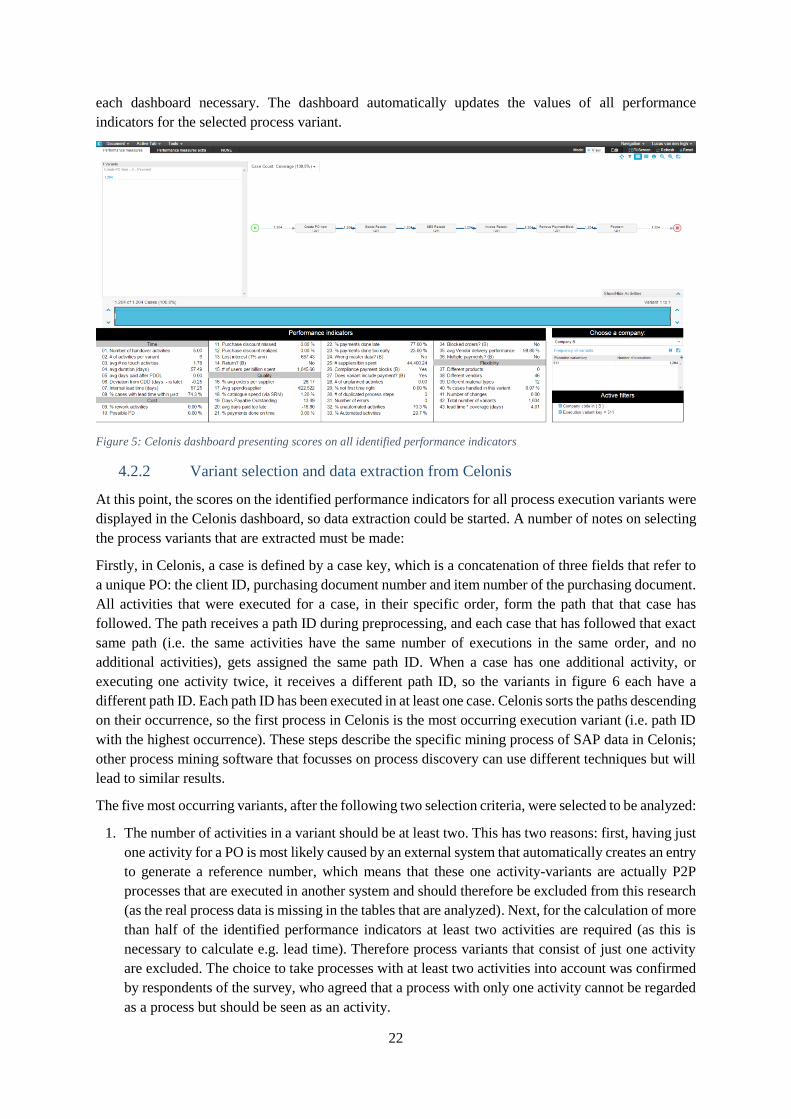
22
each dashboard necessary. The dashboard automatically updates the values of all performance
indicators for the selected process variant.
Figure 5: Celonis dashboard presenting scores on all identified performance indicators
4.2.2 Variant selection and data extraction from Celonis
At this point, the scores on the identified performance indicators for all process execution variants were
displayed in the Celonis dashboard, so data extraction could be started. A number of notes on selecting
the process variants that are extracted must be made:
Firstly, in Celonis, a case is defined by a case key, which is a concatenation of three fields that refer to
a unique PO: the client ID, purchasing document number and item number of the purchasing document.
All activities that were executed for a case, in their specific order, form the path that that case has
followed. The path receives a path ID during preprocessing, and each case that has followed that exact
same path (i.e. the same activities have the same number of executions in the same order, and no
additional activities), gets assigned the same path ID. When a case has one additional activity, or
executing one activity twice, it receives a different path ID, so the variants in figure 6 each have a
different path ID. Each path ID has been executed in at least one case. Celonis sorts the paths descending
on their occurrence, so the first process in Celonis is the most occurring execution variant (i.e. path ID
with the highest occurrence). These steps describe the specific mining process of SAP data in Celonis;
other process mining software that focusses on process discovery can use different techniques but will
lead to similar results.
The five most occurring variants, after the following two selection criteria, were selected to be analyzed:
1. The number of activities in a variant should be at least two. This has two reasons: first, having just
one activity for a PO is most likely caused by an external system that automatically creates an entry
to generate a reference number, which means that these one activity-variants are actually P2P
processes that are executed in another system and should therefore be excluded from this research
(as the real process data is missing in the tables that are analyzed). Next, for the calculation of more
than half of the identified performance indicators at least two activities are required (as this is
necessary to calculate e.g. lead time). Therefore process variants that consist of just one activity
are excluded. The choice to take processes with at least two activities into account was confirmed
by respondents of the survey, who agreed that a process with only one activity cannot be regarded
as a process but should be seen as an activity.

23
2. Since the available data sets are all covering a relative small time period (between 6 and 15
months), they include a relative large number of ‘open cases’, i.e. cases that are ‘unfinished’ since
one or more activities (e.g. payment) possibly took place outside the extracted date range. In order
to filter these ‘unfinished’, and therefore unrepresentative, variants from the variants that will be
analyzed, the spread of the execution of the last activity over time was analyzed for both the entire
dataset and the cases in every execution variant. Figure 6 shows a possibly unfinished variant (I)
with two variants (II) and (III) that could both have been the execution path if data over a longer
time period had been mined, but this does not necessarily have to be the case. Therefore, the spread
of the last executed activity for each variant was analyzed and compared to the spread of last
activity executions in the entire dataset. Cases that had relatively 50% of last activities executed
more in the last 2 months of a data set were marked as unfinished and therefore excluded. Appendix
G further elaborates on this selection step by showing the details on included and excluded variants
for each data set.
(I) (II) (III)
Figure 6: Possible unfinished execution variant
There are two reasons for choosing the most occurring variants: first, since these processes occur
regularly, the assessors have a deeper understanding of that variant than of an exception that might
occur once a year, and are therefore better able to quantify the performance of that variant. The fact that
respondents state that the most occurring processes are the ‘right’ processes, or valid variants of
processes as they should occur, confirms this choice. Second, a general way of assessing process
performance is sought after, and focusing on exceptions can influence the results drastically, as the
results should help consultants in assessing the most occurring variants, regardless of exceptions are
positive (a very well performing variant) or negative (an extremely poor performing variant). On the
other hand, this means that the findings in this research will be less applicable when assessing the

24
performance of exceptions, but this is an acceptable limitation as it improves the usability on the most
frequently occurring processes.
Figure 7 displays the coverage of the selected variants graphically, with variant 1 being the most
frequent occurring select variant, variant 2 the second most occurring selected variant, etc. The final
column shows the cumulative coverage of the selected variants, e.g. for Company A the coverage of
the selected variants is 59,50%.
Figure 7: Overview of case coverage per selected variant plus the cumulative coverage
The extraction of the performance measures had to be done by me manually. Scores on the dashboard
had to be copied into a spreadsheet manually. The data in this spreadsheet was used as data source for
both the surveys and the regression analysis that was executed to find the relation between the different
performance measures and the score on their respective dimensions. Therefore, these manual steps had
to be performed with great caution, as a mistyped number can have a significant influence on the results.
Next to the values of the performance measures, an image of each visualized process was downloaded
so it could be added to the survey. The design of the surveys is described in section 4.2.4.
4.2.3 Company demographics
Since processes are industry specific and subject to compliancy-regulations from their specific
geographical region, company demographics have to be collected and included in the analysis. Since
the anonymity of companies providing data needs to be guaranteed, not too many demographics can be
used as this could lead to traceability of sources. The following demographics were recorded:
1. Region, this can influence the way business processes are executed (especially P2P processes)
by e.g. specific tax rules.
2. Industry, the way processes are executed depends on the type of industry, because of some
industry-specific regulations or industry-specific processes.
3. The operations strategy of the corresponding process.
4. The type of sourcing the process handles, direct or indirect materials. Direct materials are used
to produce a product (e.g. raw materials) or service while indirect materials only support this
process (e.g. printer supplies).
All these demographics were coded into dummy variables and added to the regression, to find out
whether they have any significant influence on the performance of a process.
0,00%
10,00%
20,00%
30,00%
40,00%
50,00%
60,00%
Executionvariant 1
Executionvariant 2
Executionvariant 3
Executionvariant 4
Executionvariant 5
Cumulativecoverage
Coverage of selected variants
Company A
Company B
Company C
Company D
Company E(validation)

25
4.2.4 Survey to link process mining output to dimension scores
In this step, the mined processes were assessed by consultants that have executed the PoCs and are
therefore familiar with the company and the specific process where the data comes from. All the selected
participants have broad experience in P2P processes, and therefore their response is regarded as equally
important.
The assessment was done through a survey that included the following aspects:
1. Introduction of the Devil’s quadrangle to ensure all assessors have an equal understanding of
the framework and to minimize interpretation bias.
2. For each process variant (the survey includes 5 variants) a graphical representation of the
process and the score of all performance measures for that particular variant are shown.
3. Fields in which the assessors can note the score they give a variant, for all four dimensions.
These fields are used as the dependent variable in the subsequent analyses.
The surveys were either handed over personally, with an explanation and walk-through of the survey,
or sent to the assessors by email, with an introduction and the statement that whenever anything in the
survey is unclear, the assessor is requested to clarify this issue before proceeding with the survey. A
preview of a survey can be found in Appendix H.
Respondents were asked to rank the performance on all four dimensions on a ratio scale, ranging from
1 to 10, in which 1 represented a very low performance on a dimension, and 10 the best possible
performance. Next to the identified performance indicators that were shown per dimension, the survey
contained a graphical representation of the process variant, showing which activities in what order were
executed. A set of dummy variables was created to include all aspects of the visualized process in the
analysis. A metric measurement scale was preferred over a nonmetric measurement scale since a
regression analysis can only be executed with a metric dependent variable, because a quantitative
assessment of the dimensions needs to be made. Metric measurement scales are described by Hair,
Black, Babin, and Anderson (2014) as scales that “provide the highest level of measurement precision,
permitting nearly any mathematical operation to be performed”. There are two types of metric
measurement scales: ratio scales and interval scales. Since ratio scales cannot go negative, and thus
have an absolute zero point, they provide the highest possible measurement precision and allow for all
mathematical operations. Therefore, this measurement scale was selected.
Data from four companies was available to be researched, and for all but one company two consultants
that worked on the PoC were willing to participate in the research, leading to seven participants. All
surveys that were sent out, were returned with all questions answered.
4.2.5 Regression analysis to find which performance indicators significantly
correlate with performance
To find which of the performance indicators from table 3 are significant predictors of performance, and
how these performance indicators are related to performance, a regression analysis was ran in SPSS
(version 23). These significant performance indicators, combined with the theoretical grounding of the
performance indicators for their specific dimension, lead to models that calculate the performance on
the different dimensions. The analysis assessed data from seven surveys, all consisting of five variants,
resulting in 35 observations.
The information that was used in the analysis consisted of two parts: a dimension specific part,
consisting of the identified performance indicators for that dimension, and a generic part, containing

26
company demographics and information on the activities that are executed in that variant (dummy
variables for each activity, since the respondents could see these activities on the image they had to be
included in the analysis). The regression was performed in SPSS, and the models were created by
different methods of adding variables: Enter, Stepwise, Forward and Backward, with the specific and
generic performance indicators divided into two so called ‘blocks’. Since the specific performance
indicators are based on previous research steps, all methods are suitable for the specific block. For the
generic block, all methods but Enter were used as a theoretical reason for including these indicators was
not present.
Note that there are also indicators that significantly influence performance but were not identified in
the brainstorm sessions. These performance indicators are all dummy variables for activities that are
present in the visualized processes that were shown on the survey, e.g. when the ‘Create PR’-activity is
present in a process variant, this dummy variable has value 1; otherwise it’s value is 0.
For each dimension the three best models (based on the highest Adjusted R2) are shown. Model 1 gives
the best model to explain the assessment of each dimension, and is therefore chosen to be used in the
remaining steps. A more extensive output and interpretation of the statistical analysis is shown in
appendix J. Tables 4 through 7 show the models of respectively time, cost, quality and flexibility
dimension. The following example illustrates how the tables should be interpreted: for each
performance indicator present in a model, a B is shown, which is the coefficient of that performance
indicator in that model. The constant is obviously not influenced by the process, but the other Bs should
be multiplied by the value for that performance indicator, for that specific process variant. Whenever a
grey cell appears in a model, this indicates that the performance indicator that is greyed out, is not
present in that particular model. So, the assessment of the time dimension according to model 1 consists
of a constant with value 10,032 minus 0,04998 times the end to end time (in days), minus 0,0004 times
the number of execution variants minus 0,000054 times the average PO value (in €).
The checklist for internal validity and assumptions regarding generalizability shown in Appendix J was
used to check whether the models meet all statistical assumptions. For time and flexibility, all models
meet all requirements, so the selected model is the model with the highest Adjusted R2. For both cost
and quality, the first two models have a centered leverage value well above the threshold. This indicates
that there is at least one very influential case in these models Therefore, model three is selected for these
dimensions. The selected models are marked by being bold.
As can be seen, none of the models contain any dummy variables on company demographics, indicating
that the demographics do not significantly influence the performance of one of the dimensions. In
section 4.4, the formulas that can be used to calculate performance for each dimension are stated. In the
validation stage (described in chapter 6), the 95% confidence interval for each model will be used to
test whether the models are capable of giving a valid assessment of the dimensions. Refer to appendix
J for the confidence intervals.
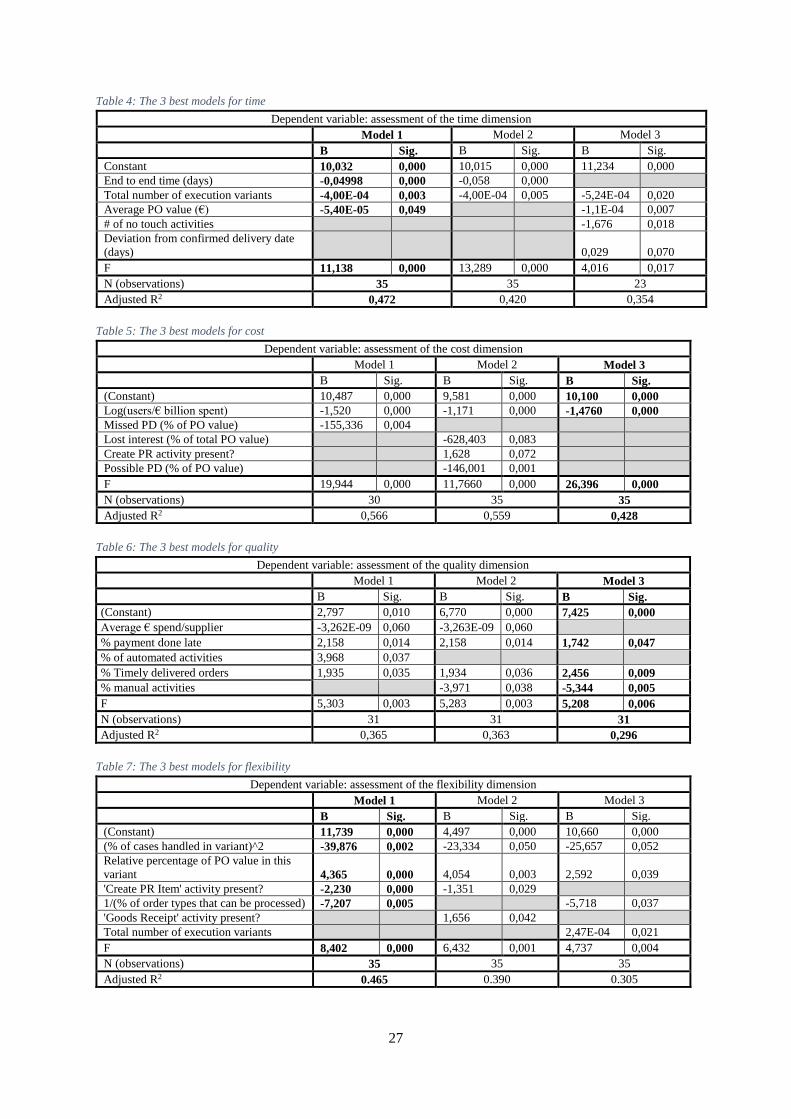
27
Table 4: The 3 best models for time
Dependent variable: assessment of the time dimension
Model 1 Model 2 Model 3
B Sig. B Sig. B Sig.
Constant 10,032 0,000 10,015 0,000 11,234 0,000
End to end time (days) -0,04998 0,000 -0,058 0,000
Total number of execution variants -4,00E-04 0,003 -4,00E-04 0,005 -5,24E-04 0,020
Average PO value (€) -5,40E-05 0,049 -1,1E-04 0,007
# of no touch activities -1,676 0,018
Deviation from confirmed delivery date
(days) 0,029 0,070
F 11,138 0,000 13,289 0,000 4,016 0,017
N (observations) 35 35 23
Adjusted R2 0,472 0,420 0,354
Table 5: The 3 best models for cost
Dependent variable: assessment of the cost dimension
Model 1 Model 2 Model 3
B Sig. B Sig. B Sig.
(Constant) 10,487 0,000 9,581 0,000 10,100 0,000
Log(users/€ billion spent) -1,520 0,000 -1,171 0,000 -1,4760 0,000
Missed PD (% of PO value) -155,336 0,004
Lost interest (% of total PO value) -628,403 0,083
Create PR activity present? 1,628 0,072
Possible PD (% of PO value) -146,001 0,001
F 19,944 0,000 11,7660 0,000 26,396 0,000
N (observations) 30 35 35
Adjusted R2 0,566 0,559 0,428
Table 6: The 3 best models for quality
Dependent variable: assessment of the quality dimension
Model 1 Model 2 Model 3
B Sig. B Sig. B Sig.
(Constant) 2,797 0,010 6,770 0,000 7,425 0,000
Average € spend/supplier -3,262E-09 0,060 -3,263E-09 0,060
% payment done late 2,158 0,014 2,158 0,014 1,742 0,047
% of automated activities 3,968 0,037
% Timely delivered orders 1,935 0,035 1,934 0,036 2,456 0,009
% manual activities -3,971 0,038 -5,344 0,005
F 5,303 0,003 5,283 0,003 5,208 0,006
N (observations) 31 31 31
Adjusted R2 0,365 0,363 0,296
Table 7: The 3 best models for flexibility
Dependent variable: assessment of the flexibility dimension
Model 1 Model 2 Model 3
B Sig. B Sig. B Sig.
(Constant) 11,739 0,000 4,497 0,000 10,660 0,000
(% of cases handled in variant)^2 -39,876 0,002 -23,334 0,050 -25,657 0,052
Relative percentage of PO value in this
variant 4,365 0,000 4,054 0,003 2,592 0,039
'Create PR Item' activity present? -2,230 0,000 -1,351 0,029
1/(% of order types that can be processed) -7,207 0,005 -5,718 0,037
'Goods Receipt' activity present? 1,656 0,042
Total number of execution variants 2,47E-04 0,021
F 8,402 0,000 6,432 0,001 4,737 0,004
N (observations) 35 35 35
Adjusted R2 0.465 0.390 0.305

28
Conjoint analysis provides insight into ideal quadrangles
To find out what values a well performing P2P process variant should have on the dimensions of the
Devil’s quadrangle, a conjoint analysis was executed. This is an analysis that provides insight in the
preference a respondent has for a certain attribute (dimension), as well as the preferred level of that
attribute, according to Hair et al. (2014). There are three types of conjoint analysis: choice based
conjoint, traditional conjoint and adaptive choice. Choice base conjoint can handle a maximum of six
attributes and has the advantage over other conjoint techniques that it creates a realistic choice task
(thanks to a ‘no choice’ option) and can measure the interaction effect between attributes (Hair et al.,
2014), and is therefore the conjoint type that was chosen.
Respondents can answer up to 30 choice tasks, when answering more than 30 tasks the quality of the
answer decreases according to Hair et al. (2014). As the aim of the research was to find the preferred
ratio between the different dimensions, the conjoint analysis used a scale of 1-3 for each dimension
(translated into a low, average and high performance on a dimension), that provides sufficient insight
in this preference. The choice based conjoint-tool in software package XLSTAT-Premium6 was used to
generate the profiles and corresponding choice tasks, and to analyze the response, which showed the
importance of each dimension. The software generated 10 choice tasks that had to be assessed by the
participants, well below the stated upper limit.
The respondents of the choice tasks were selected based on their earlier involvement of this research,
as SAP consultants with knowledge about P2P processes previously participated in one of the
brainstorm sessions or contributed by answering the survey about process performance. Consultants
from Celonis that have broad experience in P2P processes and had received an introduction of the
Devil’s quadrangle also responded to the choice tasks, leading to a group of 13 respondents that have
an understanding of the Devil’s quadrangle. Figure 8 shows an example of a conjoint task, appendix I
shows the complete set of choice tasks as they were send to the respondents by email, with the following
introduction:
“In the appendix you’ll find 10 graphs (named comparison 1 through 10), all indicating 3 possible
shapes of the Devil’s quadrangle. Your assignment is to pick the quadrangles (they’re named profile 1,
2 and 3) that represents a well performing P2P process, and note the number of that profile in the table
below. When multiple shapes represent a good process, pick the one that represents the best process.
There is also a no choice-option, when you think none of the profiles represent a well performing
process, please enter 0 in the choice column.”
Figure 8: Example of a conjoint choice task
6 https://www.xlstat.com/en/solutions/premium
Time
Cost
Quality
Flexibility
Profile 1
Profile 2
Profile 3
Table 8: Importances of the dimensions
Dimension Utility Importance
Cost 31,188 High
Time 30,168 High
Quality 25,457 Medium
Flexibility 13,186 Low

29
The XLSTAT conjoint-tool was used to analyze the responses and find the preferences for the
dimensions. As a goodness-of-fit measure, Nagelkerke’s R² was used. Since a conjoint analysis is an
adapted regression, and this research is opinion-based, this value should again be higher than 0,25. The
value for Nagelkerke’s R2 from the analyzed data is 0,292, so above the threshold. The utilities per
dimensions shown in table 8 are normalized, meaning they add up to 100. I can conclude that cost is
the most important factor with an importance of 31%, time has an importance of 30%, quality of 26%
and flexibility has the lowest importance; 13%. Although the relative importance for cost is higher than
the importance for time, the importance is so close that both time and cost are the dimensions that should
have the highest performance, as one additional respondent could make time more important than cost.
The distance both dimensions have from quality is high enough so that I conclude that there is a
difference between the first two dimensions and quality. So, quality is the next most important and
finally, flexibility is the least important dimension. In chapter 5, these results are translated into the
ideal shape for a P2P process.
Conclusion
In this chapter, the first two research questions have been answered, and data-collection for the ideal
shape of the Devil’s quadrangle has been executed. The performance indicators that represent
performance of a P2P process are different for each dimension on the Devil’s quadrangle. The answer
to research question 1 is the list with performance indicators for each dimension shown in table 2.
Research question 2, focused on finding performance indicators that are significant predictors of
performance for their dimension, was also answered. The answer showed how the significant
performance indicators predict performance in the models that were created. The best models, coming
described in tables 4 through 7, are translated into formulas 1 through 4, that calculate the expected
performance per dimension. In table 9, the performance indicators that are present in the formulas are
shown, as well with an abbreviation that was used for readability reasons.
Table 9: Significant performance indicators for each dimension
Dim. Performance indicator Abbreviation (used in formulas below)
Time Duration (days) E2E
Cost # of users per € bln spent7 Users_BLN
Quality
% payment done late (vs contract conditions) Paym_Late
% of manual executed activities Manual
Vendor timely delivery performance Vend_Perf
Flexibility % cases handled7 Cases
% of order types that can be processed7 Orders
Other
Relative percentage of PO value in this variant Rel_PO
Total number of execution variants VAR
Average PO value (€) Avg_PO_val
‘Create PR’ activity present? Cr_PR
7 To calculate the performance of a dimension, this performance indicator has to undergo a mathematical transformation.
The formula used to calculate performance shows the specific transformation.

30
This chapter has shown that the Devil’s quadrangle can be operationalized to measure process
performance, and which performance indicators are significantly predictors for performance, and has
therefore answered research question 1 and 2. In the following chapters, the results from these analyses
are used to design the framework that assists BTS consultants in assessing process performance.
4.4.1 Limitations due to decisions made
In this chapter, two decisions that influence the outcome has been made. First, by choosing to select the
most occurring executions variants, the research provides a framework that is less suited to assess the
performance of exceptions. Since assessing the performance of the most common variants is desired
over assessing the performance of variants that occur infrequently, this limitation does not influence the
stated goals.
For the conjoint analysis, the value for Nagelkerke’s R² is above the threshold for this type of analysis
but this value could be increased by analyzing a larger number of responses. As generating more
response was not feasible within this research, I will continue with the relative small (but: large enough
to draw a significant conclusion) value. Improving the number of responses could increase the value
for R2, resulting in a better model.
𝐸(𝑇𝑖𝑚𝑒) = 10.032 − 0.04998 ∗ 𝐸2𝐸 − 0.0004 ∗ 𝑉𝐴𝑅 − 0.000054 ∗ 𝐴𝑣𝑔_𝑃𝑂_𝑉𝑎𝑙 (Formula 1)
𝐸(𝐶𝑜𝑠𝑡) = 10.100 − 1.476 ∗ log(𝑈𝑠𝑒𝑟𝑠_𝐵𝐿𝑁) (Formula 2)
𝐸(𝑄𝑢𝑎𝑙𝑖𝑡𝑦) = 7.425 + 1.742 ∗ 𝑃𝑎𝑦𝑚_𝐿𝑎𝑡𝑒 − +2.456 ∗ 𝑉𝑒𝑛𝑑_𝑃𝑒𝑟𝑓5.344 ∗ 𝑀𝑎𝑛𝑢𝑎𝑙 (Formula 3)
𝐸(𝐹𝑙𝑒𝑥𝑖𝑏𝑖𝑙𝑖𝑡𝑦) = 11.739 − 39.876 ∗ 𝐶𝑎𝑠𝑒𝑠2 + 4.365 ∗ 𝑅𝑒𝑙_𝑃𝑂 − 2.23 ∗ 𝐶𝑟_𝑃𝑅 −7.207
𝑂𝑟𝑑𝑒𝑟𝑠 (Formula 4)

31
5. Design of the operationalized framework
In this chapter, the findings from the previous steps are used to design an operationalized framework.
Both the shape that the Devil’s quadrangle should have for a well performing process, and the
framework that measures the performance of a process variant are described in this chapter, answering
research question 3 and 4. This chapter starts with a definition of the requirements for the framework,
after which the two designs are realized.
Framework requirements
Before the actual designs could be created, the requirements for the framework had to be stated. This
was an essential step, as the designs are based on these requirements. Collection of the requirements
was done based on interviews and discussions with intended users of the framework, so BTS
consultants. Based on the information gathered, a first version of the list of requirements was drafted.
This list was discussed and adjusted by input from BTS consultants, leading to the final requirements
that are shown in the text box below:
The result of this research must be a tool that is useful for BTS consultants, i.e. by using the tool,
BTS consultants must be able to help their customers better than they currently can. Since all
processes have their respective characteristics, the tool should not be a general answer but specified
for P2P processes. More precisely, the tool has to meet the following requirements:
1. Per processes, the performance indicators that operationalize the dimensions of the Devil’s
quadrangle need to be shown, giving consultants insight in which performance indicators
influence the performance on each dimension for the concerning process. It should also give
the performance on the dimensions and visualize that performance in a Devil’s quadrangle.
2. It should show the ideal shape (i.e. the desired values for the four dimensions) of the Devil’s
quadrangle so the shape of process paths can be compared with the shape of an ideal
process.
As can be seen in the requirements stated above, the emphasis of this research is on describing the
characteristics of a good process and to show what performance indicators indicate such a process.
The main goal is to create knowledge and a theoretical background rather than automated process
performance evaluation. Since companies are able to measure values for basically any desired
performance indicator, and already do so on various performance dashboards, the solution should
deliver a high-level performance evaluation by presenting the values for the dimensions of the
Devil’s quadrangle and the performance indicators that influence those dimensions.
The tool should consist of the following parts:
- A visualization of the ideal Devil’s quadrangle.
- For each performance dimension, there should be a list of performance indicators that
significantly influence the performance of the variant.
- A model based on the regression analysis should calculate the performance on each
dimension, using the significant performance indicators.
- It should show the shape of the Devil’s quadrangle of the process that is assessed, based on
the performance on each dimension, in an effortless way. To do so, a tool that automatically
generates the quadrangle for each execution variant needs to be designed. This shape can
then be used to compare a process with the ideal shape.
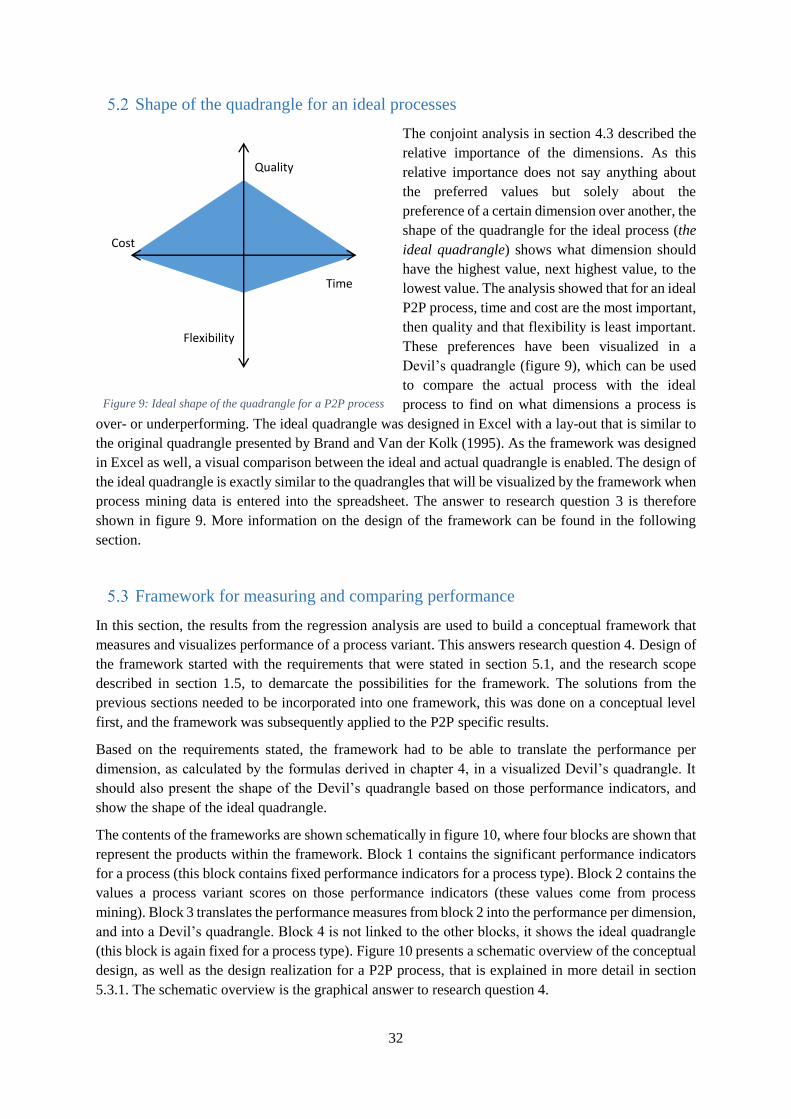
32
Shape of the quadrangle for an ideal processes
The conjoint analysis in section 4.3 described the
relative importance of the dimensions. As this
relative importance does not say anything about
the preferred values but solely about the
preference of a certain dimension over another, the
shape of the quadrangle for the ideal process (the
ideal quadrangle) shows what dimension should
have the highest value, next highest value, to the
lowest value. The analysis showed that for an ideal
P2P process, time and cost are the most important,
then quality and that flexibility is least important.
These preferences have been visualized in a
Devil’s quadrangle (figure 9), which can be used
to compare the actual process with the ideal
process to find on what dimensions a process is
over- or underperforming. The ideal quadrangle was designed in Excel with a lay-out that is similar to
the original quadrangle presented by Brand and Van der Kolk (1995). As the framework was designed
in Excel as well, a visual comparison between the ideal and actual quadrangle is enabled. The design of
the ideal quadrangle is exactly similar to the quadrangles that will be visualized by the framework when
process mining data is entered into the spreadsheet. The answer to research question 3 is therefore
shown in figure 9. More information on the design of the framework can be found in the following
section.
Framework for measuring and comparing performance
In this section, the results from the regression analysis are used to build a conceptual framework that
measures and visualizes performance of a process variant. This answers research question 4. Design of
the framework started with the requirements that were stated in section 5.1, and the research scope
described in section 1.5, to demarcate the possibilities for the framework. The solutions from the
previous sections needed to be incorporated into one framework, this was done on a conceptual level
first, and the framework was subsequently applied to the P2P specific results.
Based on the requirements stated, the framework had to be able to translate the performance per
dimension, as calculated by the formulas derived in chapter 4, in a visualized Devil’s quadrangle. It
should also present the shape of the Devil’s quadrangle based on those performance indicators, and
show the shape of the ideal quadrangle.
The contents of the frameworks are shown schematically in figure 10, where four blocks are shown that
represent the products within the framework. Block 1 contains the significant performance indicators
for a process (this block contains fixed performance indicators for a process type). Block 2 contains the
values a process variant scores on those performance indicators (these values come from process
mining). Block 3 translates the performance measures from block 2 into the performance per dimension,
and into a Devil’s quadrangle. Block 4 is not linked to the other blocks, it shows the ideal quadrangle
(this block is again fixed for a process type). Figure 10 presents a schematic overview of the conceptual
design, as well as the design realization for a P2P process, that is explained in more detail in section
5.3.1. The schematic overview is the graphical answer to research question 4.
Figure 9: Ideal shape of the quadrangle for a P2P process
Quality
Time
Flexibility
Cost

33
Figure 10: Schematic overview of the operationalized framework, both conceptual and applied
5.3.1 Applying the framework to a P2P process
The conceptual framework described before was now applied on P2P process specific measures. Figure
10 shows how the conceptual blocks are translated into the P2P specific measurement framework. Block
1 consists of the list with significant performance indicators for a P2P process. In block 2, these values
are programmed into a Celonis-dashboard that automatically calculates how a process scores on these
performance indicators. The values from block 2 are then copied into block 3, that calculates the
performance on each dimension, based on the models for performance that were created in chapter 4,
and visualizes overall performance in a Devil’s quadrangle. Block 4 contains the shape of the ideal
quadrangle, which was designed based on the conjoint analysis.
The choices made in this design process were the following: as it is currently impossible to create a
visualized Devil’s quadrangle in Celonis, a dashboard that presents the scores of a process on the
significant performance indicators for each dimension was designed. A separate Excel-sheet was
designed to calculate the scores for the dimensions and to visualize the performance of the variants.
This spreadsheet also contains the shape of the ideal process. A preview of the Celonis-dashboard and
Excel-tool are shown in respectively figure 11 and 12. The dashboard automatically calculates the
values for all performance indicators as soon as a variant is selected. In order to obtain the scores for
each dimension and the graphical quadrangles, the values from the dashboard have to be typed into the
sheet manually. This should obviously be done with great caution to avoid typos.
When the dashboard is loaded in Celonis, the values for the most occurring variants need to be entered
into the sheet that will automatically visualize the quadrangles based on these values. The grey boxes
serve as input cells, the other cells are protected to avoid unintentional changes to the tool. The ideal
quadrangle, as designed in section 5.2, is shown on the left side of the tool, and can be used to compare
the performance of the different variants. In figure 12, variant 3 and 4 most closely resemble the ideal
shape and could therefore be identified as being the closest to ideal. Again, note that this comparison
does not take the values of the dimensions into account, e.g. variant 2 has higher values on three out of
four dimensions but a shape that deviates from the ideal quadrangle. Therefore, there is still room for
interpretation.
The dashboard that was created can be uploaded to any P2P-dataset in Celonis. When this is done, the
user should check whether the naming conventions used for the different tables match with the table
names that were used to design the dashboard. How to do this is covered in the basic Celonis training
that any BTS consultant that works with Celonis has completed.
Applied to a P2P process
3. Excel tool
calculating
performance and
visualizing Devil’s
quadrangle
Conceptual
4. Visualized ideal
quadrangle
4. Visualized ideal
quadrangle for a P2P
process
2. Values of
performance
indicators per process
variant
3. Calculated
performance and
visualized Devil’s
quadrangle
1. Performance
measures significantly
predicting
performance
1. List with significant
performance
indicators
2. Celonis dashboard
automatically
calculating significant
performance measures

34
Figure 11: Preview of the Celonis dashboard
Figure 12: Preview of the Excel-tool to visualize processes
Ideal shape Variant 1 Variant 2 Variant 3 Variant 4 Variant 5
Cost 8,6 10,5 7,1 8,4 10,1
LOG(Users per €bln spent) 1,00 0,50 100 15 1
Time 7,9 8,3 10,0 9,7 9,8
Duration (days) 54,00 44,00 18 22 17,44
Quality 3,4 7,6 5,0 9,0 10,0
% payments done late 18% 1% 12% 30% 99%
% unautomated activities 90% 10% 70% 25% 10%
Vendor delivery performance 18% 30% 45% 97% 55%
Flexibility 10,1 9,2 2,8 9,1 11,3
Case coverage 7% 5% 3% 2% 1%
% of order types 51% 13% 3% 20% 15%
Other
Relative percentage of PO value in this variant 27% 32% 6% 14% 21%
Total number of execution variants 2514 2514 2514 2514 2514
Average PO value (€) 8.514,00€ 10.000,00€ 1.858,00€ 4.235,00€ 6.583,00€
‘Create PR’ activity present? 1 1 1 1 0
Performance evaluation for P2P processes
Quality
Time
Flexibility
Cost
35
Conclusion
This chapter described the design of the ideal quadrangle and the conceptual and P2P-framework to
analyze performance, based on the requirements stated in section 5.1. The realized framework should
enable BTS consultants to measure the performance of any mined P2P process while the conceptual
framework can be used to measure performance of any process, based on process mining. In chapter 6,
the usability and veracity of this design is validated.
5.4.1 Limitations
As stated in this chapter, the values need to be typed into Excel manually. Naturally, it would be faster
and less error prone, and therefore preferred to be able to create the quadrangles in Celonis. As realizing
this falls outside the research scope, it was not done although this results in an obvious limitation.
Since the conjoint analysis resulted in only the preference for a dimension scoring higher than the other
dimensions, the shape of the ideal quadrangle only represents the order of the dimensions for ideal
performance and not the ratio. This makes the ideal quadrangle useful to compare performance with the
desired situation but less of a prescriptive tool, as it does not explain what exact value an ideal P2P
process should have on each dimension.
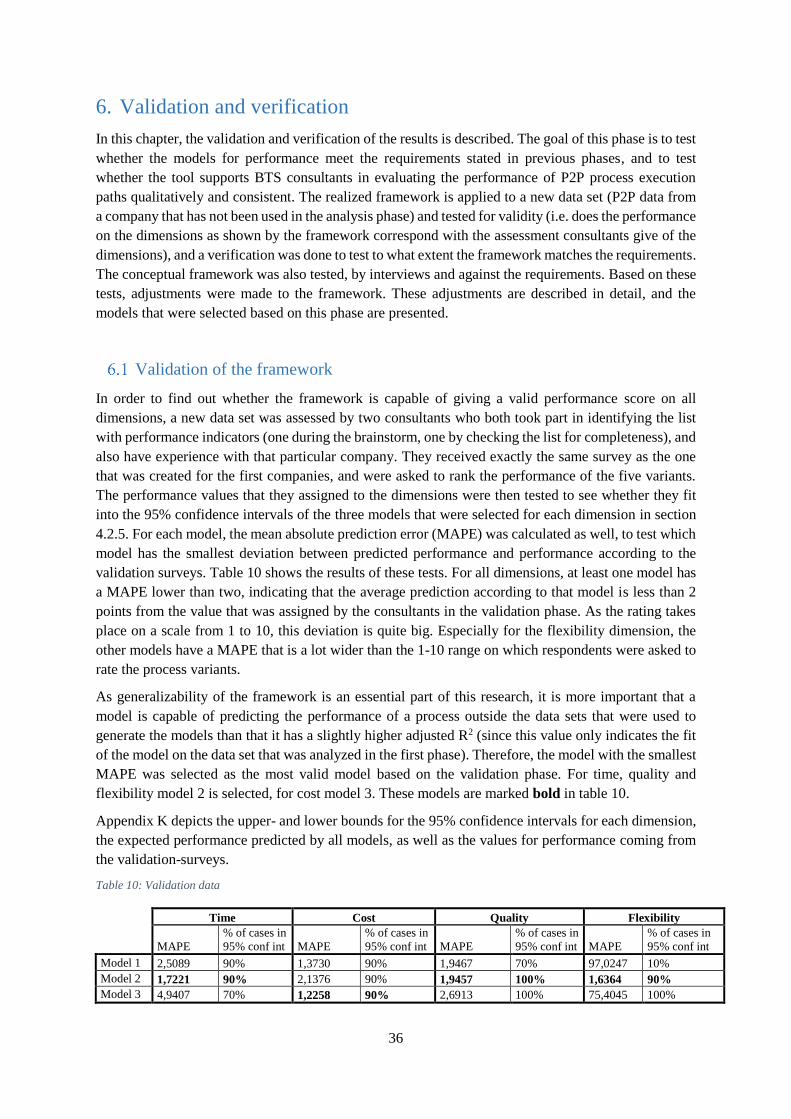
36
6. Validation and verification
In this chapter, the validation and verification of the results is described. The goal of this phase is to test
whether the models for performance meet the requirements stated in previous phases, and to test
whether the tool supports BTS consultants in evaluating the performance of P2P process execution
paths qualitatively and consistent. The realized framework is applied to a new data set (P2P data from
a company that has not been used in the analysis phase) and tested for validity (i.e. does the performance
on the dimensions as shown by the framework correspond with the assessment consultants give of the
dimensions), and a verification was done to test to what extent the framework matches the requirements.
The conceptual framework was also tested, by interviews and against the requirements. Based on these
tests, adjustments were made to the framework. These adjustments are described in detail, and the
models that were selected based on this phase are presented.
Validation of the framework
In order to find out whether the framework is capable of giving a valid performance score on all
dimensions, a new data set was assessed by two consultants who both took part in identifying the list
with performance indicators (one during the brainstorm, one by checking the list for completeness), and
also have experience with that particular company. They received exactly the same survey as the one
that was created for the first companies, and were asked to rank the performance of the five variants.
The performance values that they assigned to the dimensions were then tested to see whether they fit
into the 95% confidence intervals of the three models that were selected for each dimension in section
4.2.5. For each model, the mean absolute prediction error (MAPE) was calculated as well, to test which
model has the smallest deviation between predicted performance and performance according to the
validation surveys. Table 10 shows the results of these tests. For all dimensions, at least one model has
a MAPE lower than two, indicating that the average prediction according to that model is less than 2
points from the value that was assigned by the consultants in the validation phase. As the rating takes
place on a scale from 1 to 10, this deviation is quite big. Especially for the flexibility dimension, the
other models have a MAPE that is a lot wider than the 1-10 range on which respondents were asked to
rate the process variants.
As generalizability of the framework is an essential part of this research, it is more important that a
model is capable of predicting the performance of a process outside the data sets that were used to
generate the models than that it has a slightly higher adjusted R2 (since this value only indicates the fit
of the model on the data set that was analyzed in the first phase). Therefore, the model with the smallest
MAPE was selected as the most valid model based on the validation phase. For time, quality and
flexibility model 2 is selected, for cost model 3. These models are marked bold in table 10.
Appendix K depicts the upper- and lower bounds for the 95% confidence intervals for each dimension,
the expected performance predicted by all models, as well as the values for performance coming from
the validation-surveys.
Table 10: Validation data
Time Cost Quality Flexibility
MAPE
% of cases in
95% conf int MAPE
% of cases in
95% conf int MAPE
% of cases in
95% conf int MAPE
% of cases in
95% conf int
Model 1 2,5089 90% 1,3730 90% 1,9467 70% 97,0247 10%
Model 2 1,7221 90% 2,1376 90% 1,9457 100% 1,6364 90%
Model 3 4,9407 70% 1,2258 90% 2,6913 100% 75,4045 100%

37
6.1.1 Conclusion
This section has shown that the models that were created for each dimension are capable of predicting
performance for a dimension, which proves the external validity. Because this validation consists of 10
observations, the expected number of observations outside the confidence interval is 0,5 observation,
so both null or one observation outside the confidence interval meet the expectation, translating to 90%
or 100% of observations within the confidence interval. The selected models all have 90% or 100% of
cases within the confidence interval, so they meet the expectation. Since the 95% confidence intervals
are quite wide, the MAPE was used as an extra prediction-accuracy measure, and this showed that the
average prediction by the selected models is less than two points (on a 1-10 scale) from the assessed
value. Model 3 for the cost dimension is the most accurate predictor of all models, with a MAPE of
only 1,23.
By adding more data to the analysis, confidence intervals will narrow down and the prediction error is
expected to be smaller, i.e. the models are expected to be better predictors of performance. This is
discussed in more detail in section 7.4 (further research).
Verification of the framework
The verification of the framework was done based on the requirements that were stated in section 5.1
to find whether the framework that was designed can actually be used by BTS consultants to assess
performance. The requirements are stated below, with per requirement an indication of whether it was
met or not.
In order to find out whether the framework is usable and helps consultants in assessing process
performance, the consultants that completed the validation-surveys measured the time it took to do so.
Both consultants stated that they used approximately 20 minutes to assess the five variants. While using
the framework, a consultant is able to assess the performance of a number of process variants by
analyzing the visualized quadrangles and by looking at the significant performance indicators, within a
matter of minutes.
The following conservative assumption is made: the time used to complete a survey equals the time a
consultant needs to assess the execution variants in the ‘traditional’ way. This assumption is justified
by taking the following three aspects into account: first, the fact that when a process is analyzed using
process mining in the traditional way, generally more than five process variants are evaluated. Next to
that, performance indicators have to be looked up, or made up, and programmed into a dashboard.
Finally, as became apparent during the brainstorm sessions, no consultant used all of the 43 identified
performance indicators to assess performance but used his own subset of performance measures, so this
aspect would actually enable him to assess performance faster as soon as he has created a dashboard
with relevant performance indicators.
The usability of the significant performance indicators per dimension, the Celonis dashboard and Excel-
tool were confirmed by multiple consultants as being helpful in assessing performance and creating
insight into what performance indicators are truly important. Next to that, the Devil’s quadrangle was
repeatedly confirmed as being an excellent tool to assess process performance, especially linked to
process mining, by SAP consultants, Celonis data scientists and even Celonis’ CEO. Especially the
visualization of the quadrangle, that provides a multidimensional view on performance and includes the
interaction between the different dimensions is said to be an extremely useful improvement.

38
The following list presents a clear overview of the requirements with a statement of whether they were
met, and an explanation motivating this conclusion:
The framework should show the ideal shape of the Devil’s quadrangle. Since the Excel-tool
that was designed shows the ideal quadrangle, this requirement is met.
For each dimension, a list with performance indicators that are significant predictors for
performance has to be presented. This list is present in the framework (and can be seen both in
the Celonis-dashboard and the Excel-tool), the framework satisfies this requirement.
For each dimension, a model that calculates performance on each dimension (so the Beta-values
for the significant performance indicators) have to be shown. The formulas presented show the
Betas for the performance indicators, and they are integrated in the Excel-tool. During the
validation it became apparent that adding the formulas for performance into the tool would
improve the usability, therefore the formulas were added and, after this step, this requirement
is met.
The framework has to show the shape of the Devil’s quadrangle for each variant. The Excel-
tool shows the quadrangle automatically based on the performance per dimension, so this
requirement is met.
Veracity and validity of the framework
During the validation, for each dimension a model with an MAPE of less than 2.0 was found. As stated
before this is still quite a large value regarding the 1-10 range that was used to assess performance. The
models with the lowest MAPE per dimension all have at least 90% of the predicted values in the 95%
confidence interval. Since there are only ten observations analyzed per model, the expected number of
observations outside the confidence interval would be 0,5; so zero or one observation outside the
interval both meet the expected value. Since the models all have a sufficient internal consistency, as
described in section 4.2.5, the models with the lowest MAPE are chosen as the models best suited to
predict performance.
The models in formula 5 through 8 represent the model with the highest external validity, and are the
preferred models based on this phase. They are also the final models from this research. Table 11 gives
an overview of the significant performance indicators according to these models, as well as the
abbreviations used in the formulae.
An overview of the updated Excel-tool is given in figure 13, the updated Celonis-dashboard is shown
in figure 14.

39
Figure 13: Updated Excel tool
Figure 14: Updates Celonis dashboard
Ideal shape Variant 1 Variant 2 Variant 3 Variant 4 Variant 5
Cost 8,6 10,5 7,1 8,4 10,1
LOG(Users per €bln spent) 1,00 0,50 100 15 1
Time 5,9 8,3 10,0 9,7 9,8
Duration (days) 54,00 44,00 18 22 17,44
Quality 4,0 7,6 5,0 9,0 10,0
% payments done late 18% 1% 12% 30% 99%
% unautomated activities 90% 10% 70% 25% 10%
Avg spend per supplier 2.469,06€ 900,00€ 55,74€ 465,85€ 526,64€
Vendor delivery performance 18% 30% 45% 97% 55%
Flexibility 2,5 9,2 2,8 9,1 11,3
Case coverage 7% 5% 3% 2% 1%
% of order types 51% 13% 3% 20% 15%
Other
Relative percentage of PO value in this variant 27% 32% 6% 14% 21%
Total number of execution variants 2514 2514 2514 2514 2514
Average PO value (€) 8.514,00€ 10.000,00€ 1.858,00€ 4.235,00€ 6.583,00€
Goods Receipt' activity present? 1 1 1 1 1
‘Create PR’ activity present? 1 1 1 1 0
Formula's for performance:
Performance evaluation for P2P processes
Quality
Time
Flexibility
Cost

40
Table 11: Significant performance indicators in the validated models
Dim. Performance indicator Abbreviation (used in formulas below)
Time Duration (days) E2E
Cost # of users per € bln spent8 Users_BLN
Quality
% payment done late (vs contract conditions) Paym_Late
% of manual executed activities Manual
Vendor timely delivery performance Vend_Perf
Average spend per supplier Avg_Sup
Flexibility % cases handled8 Cases
Other
Relative percentage of PO value in this variant Rel_PO
Total number of execution variants VAR
‘Goods receipt’ activity present? Goods
‘Create PR’ activity present? Cr_PR
𝐸(𝑇𝑖𝑚𝑒) = 10.015 − 0.058 ∗ 𝐸2𝐸 − 0.0004 ∗ 𝑉𝐴𝑅 (Formula 5)
𝐸(𝐶𝑜𝑠𝑡) = 10.100 − 1.476 ∗ log(𝑈𝑠𝑒𝑟𝑠_𝐵𝐿𝑁) (Formula 6)
𝐸(𝑄𝑢𝑎𝑙𝑖𝑡𝑦) = 6,770 − 3,263𝐸−09 ∗ 𝐴𝑣𝑔_𝑆𝑢𝑝 + 2,158 ∗ 𝑃𝑎𝑦𝑚_𝐿𝑎𝑡𝑒 + 1,934 ∗ 𝑉𝑒𝑛𝑑_𝑃𝑒𝑟𝑓 − 3,971 ∗ 𝑀𝑎𝑛𝑢𝑎𝑙 (Formula 7)
𝐸(𝐹𝑙𝑒𝑥𝑖𝑏𝑖𝑙𝑖𝑡𝑦) = 4,497 − 23,334 ∗ 𝐶𝑎𝑠𝑒𝑠2 + 4.054 ∗ 𝑅𝑒𝑙_𝑃𝑂 − 1,351 ∗ 𝐶𝑟𝑃𝑅 − 1,656 ∗ 𝐺𝑜𝑜𝑑𝑠 (Formula 8)
Conclusion
During the validation phase, some small adjustments had to be made to let the P2P framework meet the
requirements. The conceptual framework met all requirements, and remained unchanged. This indicates
that the designed solution helps BTS consultants in assessing performance of processes. Furthermore,
the fact that I was able to create models that are accurate enough to place 90% or 100% of the validation-
cases in the 95% confidence interval, and also have a relatively low MAPE, shows that the framework
not only meets the requirements regarding usability, but is also able to give a valid performance
assessment.
6.4.1 Limitations
As stated before, the confidence intervals for the various models are quite wide. Also, the MAPE is
relatively high. So, although the models can significantly predict performance, there is room for
improvement. The most straight forward way to improve accuracy and narrow down the confidence
intervals is by assessing more data.
After the framework was updated, based on the validation, it could not be validated again, as no more
data was available and the time did not allow extra data collection. As described before, the restricted
amount of available data is a limitation in this research, since a single additional data set could again
change the model that is best, as happened in this chapter.
8 To calculate the performance of a dimension, this performance indicator has to undergo a mathematical transformation.
The formula used to calculate performance shows the specific transformation.

41
7. Conclusion and discussion
This research was introduced by the question ‘how can overall process performance be evaluated, based
on process mining?’. In order to answer this question, five research questions where stated. These
research questions have been answered in chapters 4 through 6. In order to draw a conclusion over the
full research, I first check whether the results answer the research questions and draw a conclusion
based on the results, subsequently I will explain the academic relevance of the results, after which the
limitations and possibilities for further research are discussed.
Summary
This report describes how the dimensions of the Devil’s quadrangle can be used to measure overall
process performance. Chapter 2 motivated the choice for the Devil’s quadrangle and showed that
existing performance measurement systems agree that low-level performance indicators enable
companies to influence future performance. With process mining, performance indicators on the lowest
possible level can be measured, and this research has shown how these indicators influence performance
of a process. The models that calculate performance for each dimension use both lagging and leading
indicators to measure performance, which was another lessons learned from the literature research.
The first research question for this research was “How can the dimensions of the Devil’s quadrangle be
operationalized to allow BTS consultants to evaluate P2P process execution paths using data from
Celonis’ analyses better than they currently can?”. This question was answered with the list with
performance indicators shown in table 2, of which the majority was P2P specific. Some generic
performance indicators, e.g. average lead time, or the case coverage for an execution variant, were
included in the list as well.
The second research question, “What performance indicators significantly predict the performance of
a P2P process execution path?”, was answered based on the regression analysis that was executed
based on process data and survey results. After the validation phase, the final models were selected.
Formulas 5 through 8 describe these models, which can be translated into the following: the
performance of the cost dimension is negatively influenced by both the duration of the process and the
total number of different execution variants. Cost is negatively influenced by the number of different
users per billion € spent in a variant. Quality is negatively influenced by the average order value per
supplier and the percentage of manually executed activities, and positively influenced by the percentage
of payments that was done late and the timely delivery performance. Finally, flexibility is negatively
influenced by the case coverage of a variant and the presence of the ‘Create PR’ activity and ‘Goods
Receipt’ activity, and positively influenced by the relative PO value for that variant.
The first design problem, “Design the shape of the Devil’s quadrangle for
a high performing P2P process.” was solved with figure 15 as solution.
The ideal shape of the Devil’s quadrangle has been identified and
visualized in the same tool that calculates the performance of each
dimension, based on the significant performance indicators. Since no
significant differences between the various foci was found, this is the ideal
shape for all foci.
The second design problem was “Design a framework in which the values
for the significant performance indicators for a high performing P2P process are represented and a
Figure 15: Ideal shape
Quality
Time
Flexibility
Cost

42
tool that visualizes the shape of the quadrangle and shows scores on the performance indicators for
each analyzed process.” and was solved as well, with the framework that was adjusted somewhat in
the validation phase, but consists of all elements that were stated in the requirements, and is capable of
giving a valid assessment of performance. This design consists of two parts: a conceptual framework
and a realization of that conceptual framework, made for P2P processes.
To validate the findings, research question 5 was defined: “Does the tool support BTS consultants in
evaluating the performance of P2P process execution paths qualitatively and consistently, and does it
improve speed of evaluation?” The designed framework and ideal quadrangle described in chapter 5
have shown to be a valid solution to the problem statement in the validation stage described in chapter
6, i.e. it enables BTS consultants to evaluate the performance of P2P processes based on more than one
performance indicator, and through the visualized quadrangle per process variant it shows the
interaction between the different dimensions. The idealized quadrangle allows BTS consultants to
evaluate whether the performance of a variant is right on each dimension compared to how it should be
according to a number of P2P professionals. Next to that, it has shown that it takes less time to interpret
the results from the framework than the traditional performance assessment based on process mining.
Finally, the problem statement that was defined in section 1.4 was “Celonis’ analyses provide data that
can be used to give high quality advice. BTS is currently unable to use this data in a desired way, so
BTS lacks tools to evaluate and draw conclusions on processes based on more than one performance
indicator. BTS therefore needs a tool to utilize the available data to its maximum extent in order to
deliver high quality and consistent answers based on a well-grounded framework.”. Since all research
questions have been answered, the designed framework is a solution for the problem that was described.
The key take away from this research is that it is able to measure the performance of mined process
execution variants by using an operationalized version of the Devil’s quadrangle. For each dimension,
at least one valid model that can calculate performance was created, which shows that the methodology
that was used to create these models was a good choice. The fact that there is room for improvement to
create models that are more statistically significant and have smaller confidence intervals is not due to
the research design but is caused by the relatively small amount of data that was analyzed (due to
availability). By executing the activities described in chapters 4.2 through 6 with additional data, the
predictive accuracy and internal consistency is most likely to increase, resulting in a framework that is
even more capable of calculating the performance. This might also result in an updated set of significant
performance indicators.
Academic relevance
Next to the practical benefits for SAP BTS, this research has shown how the Devil’s quadrangle can be
applied on process mining, to get an insight into the overall performance of execution variants. Although
business process redesign and process mining have quite some common characteristics, applying the
Devil’s quadrangle to process mining has not been described in academic literature before. The effects
of business process redesign have been qualitatively evaluated using the Devil’s quadrangle by Reijers
and Limam-Mansar (2005), their study focusses on relative improvement on the dimensions rather than
assessing overall performance.
Therefore, the conceptual framework provides new insight into how overall process performance can
be assessed based on process mining, by using the Devil’s quadrangle. The validation of the conceptual
framework, as well as the validated applied P2P-framework have shown that this research presents a
valid framework to measure overall performance.
43
Limitations
One of the major limitations is the absence of data needed to calculate a number of unidentified
performance measures. It is hard to tell whether the missing performance indicators would have been
significant predictors, but having to drop 25% of the identified performance indicators is definitely a
limitation. Without these performance indicators, significant models have been created but the dropped
performance indicators could have improved the models, although it is hard to say which performance
indicators, and how.
Another limitation is that the relative small number of data sources made it impossible to distinguish
differences between direct or indirect processes, different countries or different industries. There might
not be a difference between all of those demographics, but in order to give a meaningful answer to this,
more data sources would be very helpful. Having more data available for analysis could also positively
influence the internal and external validity of the models that were created in the regression.
Regarding the models for all dimensions, the relative low adjusted R2–values and high MAPEs indicate
that there is ample room for improvement, although the results are currently already statistically
significant.
Further research
The research that was performed solely focused on creating a conceptual framework and applying that
conceptual framework for P2P processes. Although the same methodology can be used to operationalize
other processes, the focus on P2P makes it unsuited to measure performance of other types of processes.
A general framework to measure process performance is not that interesting, since it would most likely
omit process-specific details, so it is more interesting to repeat the research for different types of
processes, e.g. accounts receivable. To do so, the methodology and activities that were designed and
executed in this very research can be used to generate frameworks for other types of processes. The
research questions should be adjusted to the respective process and the activities described in chapters
4 through 6 all have to be executed with a focus on process specific data.
Magdalene-Glissmann and Ludwig (2013) propose a model that places performance indicators in
multiple layers, which is something that could be interesting in this research as well, as performance
indicators on different levels can be calculated. The advantage of such a model is that it shows the
relationship between the performance indicators, and thus how a high-level performance indicator is
influenced by lower-level indicators. Examining the relationship between the identified performance
indicators could lead to a layered model for each dimension, creating more insight into process
performance, and showing exactly which performance indicators are under- or over performing.
Increasing response for both conjoint analysis and the survey, and including more company data in the
analysis would lead to more accurate models, with higher predictive power and smaller 95% confidence
intervals. This could simply be done by repeating the steps described in sections 4.2 and 4.3 with new
data and sending surveys to more respondents. Of course the respondents need to have sufficient
knowledge about the processes within the company that provided data, so it is impossible to send out
unlimited surveys. The conjoint analysis that lead to the ideal quadrangle has a relatively low
Nagelkerke’s R2 but as it is above the threshold it does show that P2P experts agree on which dimension
should have highest performance in a P2P process. Especially since only 13 respondents participated in
establishing this ideal quadrangle, an increased population of respondents is most likely to increase the
value of Nagelkerke’s R2, i.e. it increases the amount of variance explained by the model. Respondents
do not have to have company-specific knowledge to participate, only knowledge on P2P processes and

44
about the Devil’s quadrangle is required to provide useful input, therefore this seems to be an easy step
that would yield in valuable insight.
Adding more source tables to the analyses would have led to shorter list of dropped variables. The
performance indicators that were dropped because the tables were unavailable can be added when new
data sets are acquired. For the measures that were dropped because this information could not be found
in source tables (e.g. extra time stamps to calculate touch time) or because Celonis is currently unable
to calculate these measures (e.g. the difference in duration between a first and second activity
execution), more research could be done into getting these measures into the analysis and test whether
they significantly correlate with performance.
Now, performance has been assessed as multidimensional and this seems to be a good way as a single
performance indicator does not provide sufficient insight into overall performance. More research could
be executed to find whether the surface of the Devil’s quadrangle, or e.g. the total absolute deviation
from the ideal quadrangle, would be an interesting performance measure.
As shown in figure 3, the SAP process library was left out of scope in this research. An interesting next
step would be to see to what extent, and how, the results from this research could be linked to, or
included in, the existing SAP process library.
45
Bibliography
Adams, C., & Neely, A. (2002). Prism reform (pp. 28). London: Chartered Institute of Management
Accountants.
Adriansyah, A. (2009). Performance analysis of business processes from event logs and given process
models. (Master's Thesis ), Technische Universiteit Eindhoven, Eindhoven.
Adriansyah, A. (2014). Aligning observed and modeled behavior. (PhD Thesis), Technische
Universiteit Eindhoven.
Aken, J. E. v., Berends, H., & Bij, H. v. d. (2007). Problem Solving in Organizations: New York:
Cambridge University Press.
Bititci, U. S., Carrie, A. S., & McDevitt, L. (1997). Integrated performance measurement systems: a
development guide. International Journal of Operations & Production Management, 17(5),
522-534. doi:10.1108/01443579710167230
Bititci, U. S., Turner, T., & Begemann, C. (2000). Dynamics of performance measurement systems.
International Journal of Operations & Production Management, 20(6), 692-704.
Brand, N., & Van der Kolk, H. (1995). Werkstroomanalyse en -ontwerp : het logistiek vriendelijk
ontwerpen van informatiesystemen. Deventer: Kluwer Bedrijfswetenschappen.
Brignall, T. J., Fitzgerald, L., Johnston, R., & Silvestro, R. (1991). Performance Measurement in
Service Businesses. Management Accounting, 69(10), 34.
Celonis. What is process mining?
Cross, K. F., & Lynch, R. L. (1988). The “SMART” way to define and sustain success. National
Productivity Review, 8(1), 23-33.
Dumas, M., La Rosa, M., Mendling, J., & Reijers, H. A. (2013). Fundamentals of Business Process
Management. Berlin: Springer.
Field, A. (2009). Regression. In: Discovering statistics using SPSS (Vol. 3rd, pp. 197-263). London:
Sage.
Hair, J. F., Black, W. C., Babin, B. J., & Anderson, R. E. (2014). Conjoint Analysis Multivariate Data
Analysis, Seventh Edition (Pearson New International Edition ed., pp. 341-415): Pearson
Education.
Hevner, A. R., March, S. T., Park, J., & Ram, S. (2004). Design Science in Information Systems
Research. MIS Quarterly, 28(1), 75-105. doi:10.2307/25148625
Jansen-Vullers, M. H., Kleingeld, P. A. M., & Netjes, M. (2008). Quantifying the Performance of
Workflows. Information Systems Management, 25(4), 332-343.
doi:10.1080/10580530802384589
Jansen-Vullers, M. H., Loosschilder, M. W. N. C., Kleingeld, P. A. M., & Reijers, H. A. (2007).
Performance Measures to evaluate the impact of Best Practices. Paper presented at the
Proceedings of Workshops and Doctoral Consortium of the 19th International Conference on
Advanced Information Systems Engineering (BPMDS workshop).
Kaplan, R. S., & Norton, D. P. (1992). The Balanced Scorecard-Measures That Drive Performances.
Harvard Business Review, 70(1), 71-79.
Keegan, D. P., Eiler, R. G., & Jones, C. R. (1989). Are Your Performance Measures Obsolete?
Management Accounting, 70(12), 45.
Kueng, P. (2000). Process performance measurement system: a tool to support process-based
organizations. Total Quality Management, 11(1), 67-85.

46
Lebas, M. J. (1995). Performance measurement and performance management. International Journal
of Production Economics, 41(1-3), 23-35. doi:10.1016/0925-5273(95)00081-X
Leyer, M., Heckl, D., & Moormann, J. (2015). Process Performance Measurement. In J. vom Brocke
& M. Rosemann (Eds.), Handbook on Business Process Management 2 (pp. 227-241):
Springer Berlin Heidelberg.
Limam-Mansar, S., & Reijers, H. A. (2005). Best practices in business process redesign: validation of
a redesign framework. Computers in Industry, 56(5), 457-471.
doi:http://dx.doi.org/10.1016/j.compind.2005.01.001
Magdalene-Glissmann, S., & Ludwig, H. (2013, 27-31 May 2013). Value cost impact analysis:
Estimating the IT cost impact of business developments. Paper presented at the Integrated
Network Management (IM 2013), 2013 IFIP/IEEE International Symposium on.
Missbach, M., Stelzel, J., Gardiner, C., Anderson, G., & Tempes, M. (2013). SAP on the Cloud:
Springer.
Reijers, H. A., & Limam-Mansar, S. (2005). Best practices in business process redesign: an overview
and qualitative evaluation of successful redesign heuristics. Omega, 33(4), 283-306.
doi:10.1016/j.omega.2004.04.012
Suriadi, S., Ouyang, C., van der Aalst, W. M. P., & ter Hofstede, A. H. M. (2015). Event interval
analysis: Why do processes take time? Decision Support Systems, 79, 77-98.
doi:http://dx.doi.org/10.1016/j.dss.2015.07.007
van der Aalst, W., Adriansyah, A., de Medeiros, A., Arcieri, F., Baier, T., Blickle, T., . . . Wynn, M.
(2012). Process Mining Manifesto. In F. Daniel, K. Barkaoui, & S. Dustdar (Eds.), Business
Process Management Workshops (Vol. 99, pp. 169-194): Springer Berlin Heidelberg.
Wieringa, R. J. (2014). Design Science Methodology for Information Systems and Software
Engineering (Vol. 2014). Berlin Heidelberg: Springer Berlin Heidelberg.

47
Appendix A: Literature review on performance measurement systems
LITERATURE REVIEW
Performance measurement systems on different organizational levels
Author:
Lucas van den Ingh
(0634906)
Supervisor:
Dr. Ir. H. Eshuis
March 2016

48
1. Introduction
“Measurement is the first step that leads to control and eventually to improvement. If you can’t
measure something, you can’t understand it. If you can’t understand it, you can’t control it. If you
can’t control it, you can’t improve it” (Harrington)
Let’s put this quote into practice by turning it around: as companies work on improving their processes
(e.g. to become more cost efficient, reduce waste, or be more agile), process control is necessary. To
control your processes, you need to understand them, and to understand how your processes work, you
should be able to measure their performance.
This literature review focusses on performance measurement systems on various levels. As will be
described in section 2.1, the initial subject was performance measurement based on process mining
output, i.e. how you can assess the performance of a process based on measures that can be extracted
from applying process mining on event logs. Since not sufficient literature to devote a literature review
on this subject could be found, the focus of this review shifted to performance measurement systems on
different levels within an organization. It describes a number of existing performance measurement
systems and presents an overview of measurement systems designed for performance measurement on
three different levels (strategic, business unit and process), plus their respective characteristics,
advantages and pitfalls. In most cases the research that is discussed includes a case study, the execution
and results of these case studies are also included in the review to shows in what sectors the systems
have been applied, and how.
1.1 Performance
First, a definition of performance is needed. I use Lebas’ (1995) research on performance measurement
and performance management, that states that performance, especially related to management, is about
the future. First he elaborates on why and what to measure, next on why people want to measure.
Performance is not absolute but rather subject to context in terms of users and purpose. Therefore, why
you want to measure needs to be defined in order to know what to measure. What you want to measure
is subject to the purpose of the measurement, which indicates that these two questions are difficult to
separate. Lebas states that there are at least five reasons for measuring performance, and that for each
reason measures must be created. Regarding what to measure, Lebas presents a research on performance
measures used to evaluate performance in different maintenance depots of the US Department of
Defense (US DoD) to illustrate that even within the department, different performance measures are
used. Just one out of five US DoD services uses ‘defense system availability’ as a performance measure,
while everyone in the defense business is aware that this is the ultimate goal and therefore ultimate
definition of performance. The other services use surrogate measures, illustrating that there is no
agreement on what performance is.
A definition of a performing business is proposed: “a performing business is one that will achieve the
objectives set by the managing coalition, not necessarily one that has achieved the objectives.” (Lebas,
1995). So performance is about the capability to meet future objectives, as the future value of certain
criteria. Since measures can, by definition, only be about the past, a solution must be found to use past
data to evaluate the future. To do so, it requires stable causal models in which measures capture elements
as soon as possible so that any extrapolations are more responsive to changes in causal relationships.
Later on I will refer to this phenomenon as leading indicators.
The objectives that a performing firm achieve consist of three elements: targets to be reached, elements
of time and ways to get there. This indicates that the definition of performance depends on the causal
model linking inputs and outcomes. Performance is something each firm, stakeholder and even
organizational actor defines, it is never objective.
The importance of causal models is explained with an example: the traditional view limits to net income.
Net income is the result of both revenue and costs. However, sales are the result of a number of elements
like customer satisfaction, quality, delivery and costs. Costs are the result of processes that are
influenced by elements like training of personnel and relationships with suppliers. This shows that
49
income can be used as a performance measure, but that there is a number of layers influencing
performance, that all have their respective performance measures. A low-level performance indicator
can be used to predict performance of high-level performance measures, e.g. low quality leads to low
customer satisfaction, which leads to lower revenue, which results in a lower net income.
Lebas also discusses Activity Based Costing (ABC) and its contribution to performance management,
since information from the model feeds into the managerial information system that processes it and
translates it into a performance dashboard, allowing managers to react as soon as the dashboard
indicates that this is necessary.
The article concludes by reaffirming that performance measurement and performance management are
inseparable, although other research found that measurement is secondary to management, and only by
combining measurement and management, a performing business can be created. This statement lead
to the distinction between performance measurement systems on three different organizational levels,
as they all have their respective management levels.
1.2 Research questions
Section 1.1 presented a motivation and introduction for this literature review and leads to two research
questions that will be answered in this review:
1. What performance measurement systems are present for different measurement levels?
2. What shared attributes are included in performance measurement systems for a specific level?
3. What characteristics should a performance measurement system have?
1.3 Report structure
This report is structured as follows: Chapter 2 explains the review methodology. Chapter 3 gives an
overview of performance measurement systems at enterprise level, chapter 4 presents the performance
measurement systems at business unit level and chapter 5 discusses the performance measurement
systems at process level. Chapter 6 combines and compares the findings from chaps 3 to 5.

50
2. Review methodology
This research is designed on the literature review protocol by Randolph (2009), who introduces six
characteristics, known as Cooper’s Taxonomy of Literature Reviews. For each characteristic, the
applicable categories for this literature review will be stated in the remainder of this section.
The first characteristic is the focus of a review. In this case, the review is outcomes-oriented since it
identifies a lack of information on a certain topic, but also deals with theories, since it shows that the
reviewed performance measurement systems are currently not applicable to certain levels. Randolph
states that “an outcomes-oriented review may also deal with theories related to the phenomenon being
investigated and introduce the practical application of the knowledge that will ultimately be gained from
the dissertation”, an exact match of this literature review and the MTP that will be conducted
subsequently. Next, the goal of a review is discussed. The goal of this literature review is to create an
overview and understanding of the currently available performance measurement systems and their
attributes, and to justify the MTP adds knowledge to the currently unaddressed appliance of
performance measurement systems on process mining output that will be conducted afterwards. The
perspective of the research is a neutral representation, as it is a qualitative research that aims at providing
insight in existing performance measurement systems and their similarities and differences. The
coverage can be characterized as exhaustive with selective citation, as the review aims at giving an
exhaustive overview since the research should cover at least 25 high quality articles, but not to review
every high quality article that concerns performance measurement systems. The organization is
methodological, it describes the existing systems ordered by level of process they measure rather than
e.g. chronologically. Finally, the audience is the university supervisor but also the company supervisors
and other stakeholders in the project, as it justifies the solution and presents them an overview of the
existing systems, and places the chosen system in perspective. Next to that, it can serve as a source for
fellow students.
The following sections describe the search strategy that was used, and the selection criteria that resulted
in the articles that have been used in this review.
2.1 Search strategy
The start of this research started with the question how performance measurement could be done based
on process mining results. The literature search with both ‘performance measurement’ and ‘process
mining’ as key words yielded exactly one result in Focus (the TU/e library search engine), the article
by Pika et al. (2014) on analyzing resource behavior using event logs. Other search engines yielded the
following results: no results in Inspec, no results in Web of Science and three results in Scopus: Pika et
al. (2014) and two new results: articles by Jouck & Depaire (2014) and Tang, Chen, & Lu (2006). The
article by Jouck & Depaire addresses evaluating the performance of process discovery techniques rather
than the performance of the mined process. Tang, Chen & Lu (2006) propose a process mining based
Business Process Optimization (BPO) architecture. This architecture contains a specific adapter layer
that can be used for the extraction of information from Enterprise Resource Planning (ERP)-systems
and Workflow Management Systems (WfMS) since it contains knowledge of which event logs and
attributes have to be accessed. Information from interviews and observations can be coupled to evaluate
the mined business processes. So called delta analyses can be carried out to identify mismatches with
best-practice models. These evaluations can be used to optimize processes, which shows the links
between process mining and continuous monitoring and optimization of business processes.
Since the search for performance measurement combined with process mining wasn’t very fruitful, it
was widened to performance measurement systems in general, focusing on different levels within
companies: strategic, business unit- and process level. Therefore, the following search term was used
to find the first articles:
The following search term, or combination of search terms, were used to search the title and key words
in Focus, Inspec, Web of Science and Scopus:
“business performance measurement”

51
“business process” AND “performance measurement”
“business process” AND “performance measurement systems”
“business process performance”
"business process redesign" AND "performance measurement"
“performance measurement research”
“process performance management”
“process performance measurement”
This resulted in a first set of articles, the second set of articles was obtained by looking up references in
the first set of articles (as described by Randolph (2009)). Naturally, the selection steps described below
on these articles as well.
The first article that was found was on the evolution of performance measurement research (Neely,
2005). It states that “the performance measurement research community still appears to draw on a
relatively limited set of influential works.” (Neely, 2005), confirming the relatively low number of
articles resulting from this search.
2.2 Article selection
The selection of articles was done in two phases, after which the final article list was established. The
selection steps are described in detail below to ensure that “two people, given the same set of articles,
would identify virtually the same subset of articles” (Randolph, 2009).
2.2.1 First selection
Criteria for including articles are derived from Randolph (2009) and Vanwersch et al. (2011). The
literature selection was done in two steps: first a selection was made based on metadata and
subsequently the articles were included or excluded based on their content.
This research only included studies that meet the following criteria, which are an adaption of the
selection criteria listed by Randolph (2009) and Vanwersch et al. (2011):
1. The article was written in either English or Dutch;
2. The source is either a journal with an ISI JCR Impact Factor of over 0.5, the proceeding of
a conference with an acceptance rate lower than 25%, or a book article; and
3. The article was not focused solely on a particular industry (e.g. healthcare);
4. The system or research that is described should be post 19809.
By not selecting articles based on their number of citations but selecting articles from journals with a
high citation index, the risk that occurs when only choosing articles with a high number of citations
(which can lead to only choosing ‘old’ publications while ‘new’ publications might be of equal or even
higher quality, but are too recent to already have a high number of citations) is avoided.
2.2.2 Final selection
Of the articles that remained after the first selection step, the abstracts and conclusions were read, to
find out whether a study was in fact interesting for this review. As the research focusses on the
characteristics of performance measurement systems on three different levels, the research should
describe a performance measurement system at one of those levels. Next to that, if the subject of a study
was a performance measurement system that was described in a study that was already included, the
second article was excluded. Appendix A1 presents an overview of the selected articles that met the
stated criteria.
9 This criterion is derived from Neely (2005), who states that from the 1980s balanced performance measurement systems
have been developed, and that systems from before 1980 solely focused on financial measures to assess performance.

52
3. Performance measurement on strategic level
This chapter starts with an approach to compare the performance of firms in different sectors, then
discusses a number of performance measurement systems that measure at enterprise level, and
concludes with an overview of similarities and differences between these systems.
3.1 Comparing performance of firms from different sectors
Research focused on comparing the performance of different SMEs was done by Bititci et al. (2013).
The majority of research has been focused on particular processes such as supply chain or
manufacturing performance without regarding a firm’s overall performance but “there is no informed
scientific debate as to which measures are appropriate and how these measures should be combined and
used in order to compare the business performance of different firms operating in different sectors,
whilst accounting for the industry specific factors” (Bititci et al., 2013). This issue is most prominent
for SMEs thanks to their greater diversity.
In order to come up with a solution, first a literature review was done which yielded in nine key
performance measures that require an approach for accounting for intersectorial differences to enable
the assessment of SME’s overall performance. They present four guidelines for assessing and
comparing performances across different firms. First, balance financial and non-financial measures.
Next, take the contextual and environmental conditions of a firm into account when assessing a firm’s
performance. Also ensure that the research is based on a time series. Last, include lagging and leading
measures. Lagging indicators are easy to measure but hard to improve, e.g. net profit over the past fiscal
year. Leading indicators are harder to measure but easier to improve, e.g. budget spent on innovation in
the ongoing fiscal year.
The performance of 37 SMEs with between 100 and 250 employees were measured according to the
rating scale in table A1. They rate each of the nine indicators from 1 (well below average in sector) to
5 (well above average in sector), and give an example to illustrate the use of their scale: “Company A,
operating in a high growth sector, with a revenue growth of 20% may be growing slightly above its
sector average and would score 4. Company B, operating in a mature sector, with a revenue growth of
5% may be growing significantly above its sector average would score 5.” (Bititci et al., 2013).
Well below
average in
sector
Below
average in
sector
Average
in sector
Above
average in
sector
Well above
average in
sector
Lag
gin
g i
nd
icat
ors
Revenue growth 1 2 3 4 5
Market share growth 1 2 3 4 5
Cash flow growth 1 2 3 4 5
Value added productivity growth (gross
profir/total number of FTE)
1 2 3 4 5
Lea
din
g
ind
icat
ors
Customer satisfaction 1 2 3 4 5
New value streams 1 2 3 4 5
Investments: R&D, new processes, skills,
strategic assets, intellectual properties
1 2 3 4 5
Employee satisfaction and morale 1 2 3 4 5
Table A1: Approach to compare performance (Bititci et al., 2013)
The final step of the comparison is grouping firms according to their performance. Three categories are
created: high, medium and low performing firms. These categories are made based on various
(statistical) analytical techniques, that mostly agree with each other. The simplest is the following: the
score on each performance indicator are summed up for each firm. Firms with a score of 20 or higher
are placed in the high performing group, firms with a score between 10 and 20 are classified as medium
performers and firms with a performance score less than 10 are classified as low performing firms.

53
The research concludes that lagging indicators are the most relevant for comparing firms. This conflicts
with views from e.g. Buytendijk (2005) and Smith & Proctor (2013), who state that leading performance
measures are more important than lagging measures, but Bititci et al. explain that this finding was not
unexpected since the research focusses on comparing past results rather than future performance. The
only promising leading PI is customer satisfaction but since companies failed to measure this PI, it is
omitted with the other leading indicators. This leads to a list of 5 lagging indicators that can be brought
down to a list of three and even to a single performance indicator (profitability), as shown in table A2.
The final remark is that even though the focus of this research was on SMEs, the researchers argue that
their findings could be relevant for firms of all sizes, especially when comparing performance when
sectorial differences make a comparison on actual performance values (e.g. turnover) meaningless.
Table A2: Performance indicators by Bititci et al. (2013)
Profitability
Value-added productivity
Cash flow
Revenue
Market share
Profitability
Value-added productivity
Cash flow
Profitability
3.2 The Balanced Scorecard
Kaplan and Norton (1992) describe that in the competitive environment companies find themselves in,
traditional performance measures can be misleading when aiming at continuous improvement and
innovation. They found that executives make decisions based on both financial and operational
measures, and introduce the Balanced Scorecard, a set of financial and operational measures. The
operational measures are divided into three areas: customer perspective, innovation and learning
perspective, and internal business perspective. The financial perspective reflects the result of actions
that have already been taken while the operational perspectives are drivers for future financial
performance. These perspective all have a basic question they answer, as shown in table A3.
Table A3: Questions for all perspectives of the Balanced Scorecard
The scorecard brings together various elements that might seem unrelated but together they present all
dimensions that are influencing past and future financial performance. The scorecard helps companies
in keeping their list of performance measures concise rather than having an endless list of measures that
makes you lose overview of what’s important.
Perspective Question
Financial How do we look to shareholders?
Customer How do customers see us?
Internal business What must we excel at?
Innovation and learning Can we continue to improve and create value?

54
The BSC puts strategy and vision of a company at the center, rather
than the traditional view that control should be placed centrally. The
authors state that “the balanced scorecard helps managers
understand many interrelationships . . . The balanced scorecard
keeps companies looking – and moving – forward instead of
backward” (Kaplan & Norton, 1992), or, put differently, the BSC
aids in learning how to make the complex relationship between
finance and operations more insightful. Figure A1 shows an
example a BSC in practice.
3.3 Strategic measurement analysis reporting
technique (SMART)
An approach to measure performance on a strategic level is
proposed by Cross & Lynch (1988): the strategic measurement
analysis reporting technique (SMART). SMART should solve four
major complaints from managers:
1. Unless performance measures were specifically directed to
strategies, they were yielding either irrelevant or misleading information.
2. Measures tracked each dimension of performance in isolation without seeing the bigger picture.
3. Traditional performance measures did not take requirements and perspectives of customers
(both internal and external) into account.
4. Bottom line measures (e.g. profitability) were only reported over a past period and therefore
did not allow for corrections and remedial actions.
SMART provides means to address the following items:
Measure departments and functions on how they contribute, both separately and together, in
meeting the company’s strategic missions.
Linking operations to strategic goals
Integrating financial and non-financial information
Focusing all activities on the future requirements of the business, as dictated by the customer
Changing performance, incentive and rewards systems as necessary
Clarify measures of strategic importance
Build consensus horizontally across functional or department lines
Institute measurements at operational level in each department that enable managers to prepare
reports on strategic health of the business
Figure A2 depicts the performance pyramid that serves as the basis for the SMART control system. The
four levels link strategy and operations. The top level (the vision) represents the corporate senior
management, which forms the corporate strategy. At the second level, objectives for each business unit
are defined in terms of market and financial measures, and strategies to meet these objectives are stated.
The third level represents tangible operating objectives and priorities for each Business Operating
System (BOS) within the company. The fourth level needs to be defined for each BOS and can translate
strategic direction into department action. The four pillars (or: criteria) that are found in fourth level are
defined as follows:
Quality means translating the voice of the customer into company requirements at each stage,
from concept to delivery.
Figure A1: Example of a balanced scorecard
(Kaplan & Norton, 1992)

55
Delivery has two aspects: quantity and timeliness. Both aspects should meet customer
expectations.
Process time refers to the time it takes to deliver the product or service from the time it is
requested at that department.
Cost can also be regarded as waste. It is viewed in terms of excess money spent to achieve the
three aspects stated above. At BOS level, the main cost objective is to improve productivity by
reducing overall costs.
Cross & Lynch (1988) state that the four criteria are seldom equally important at any point in time. Over
time, the importance of the criteria can change, e.g. due to competition.
Figure A2: The performance pyramid (Cross & Lynch, 1988)
The conceptual framework was implemented at a BOS from Wang Laboratories, an American computer
manufacturer. By negotiating and compromising, team members defined realistic, workable and
mutually accepted performance indicators to optimize the workflow. Three months after
implementation, 20% of the performance measures were eliminated and a significant amount of their
measures were redefined and new measures were established. The implementation of SMART took
longer than other approaches but it will repay itself. Managers noted short-term benefits, even before
data of the new measures was reported, interdepartmental service improved. The following long-term
benefits are expected by management:
1. Mindset will change from vertical hierarchy to integrated supplier-customer networks
2. New organizational alignments and priorities may emerge
3. Priorities of information systems will change to meet new information needs
4. The basis for investment justification will change from ROI to include a more qualitative
statement.
SMART has a number of advantages over other performance measurement systems. Since SMART is
driven by strategy, it serves as a business wide decision support system, something e.g. an accounting
system cannot do. Next to that, SMART combines a control system with strategic planning, enabling a
company to not only measure past performance but also measure progress of strategic objectives. It also
allows for continuous adjustment to future needs and encourages continuous improvement. SMART is
not just a quality program, it also adds operational performance criteria and provides a mechanism to
evaluate the trade-offs among all four criteria.
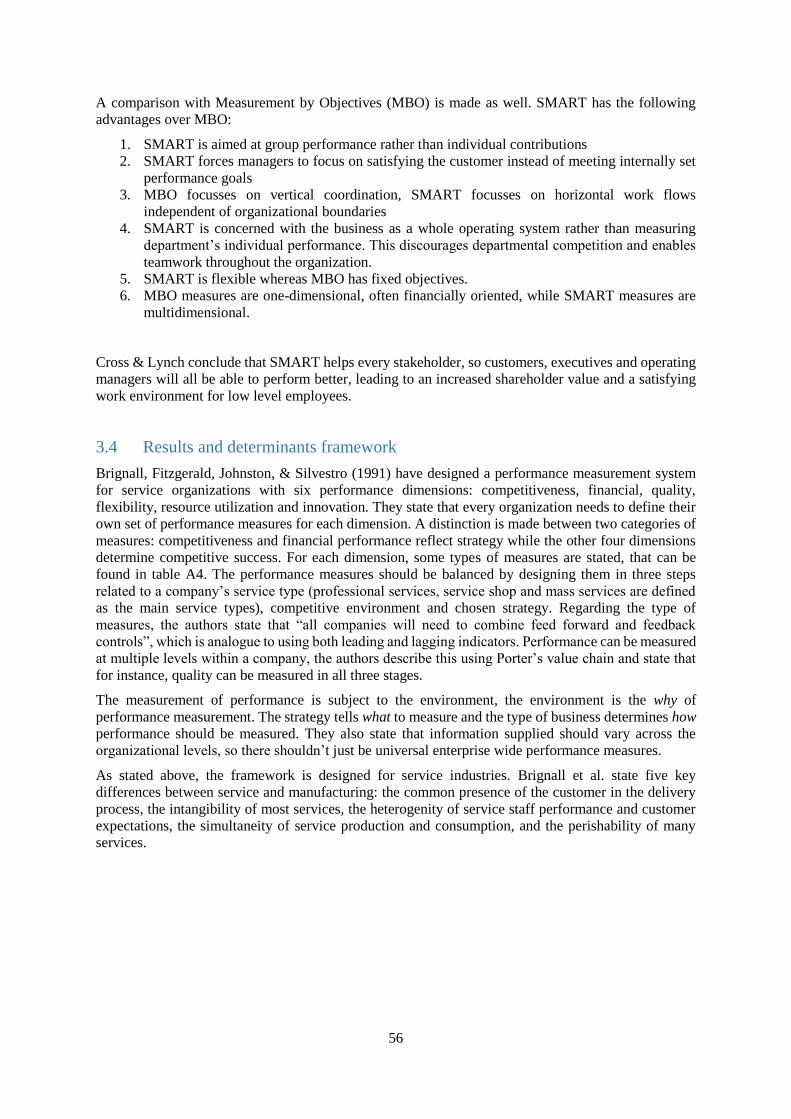
56
A comparison with Measurement by Objectives (MBO) is made as well. SMART has the following
advantages over MBO:
1. SMART is aimed at group performance rather than individual contributions
2. SMART forces managers to focus on satisfying the customer instead of meeting internally set
performance goals
3. MBO focusses on vertical coordination, SMART focusses on horizontal work flows
independent of organizational boundaries
4. SMART is concerned with the business as a whole operating system rather than measuring
department’s individual performance. This discourages departmental competition and enables
teamwork throughout the organization.
5. SMART is flexible whereas MBO has fixed objectives.
6. MBO measures are one-dimensional, often financially oriented, while SMART measures are
multidimensional.
Cross & Lynch conclude that SMART helps every stakeholder, so customers, executives and operating
managers will all be able to perform better, leading to an increased shareholder value and a satisfying
work environment for low level employees.
3.4 Results and determinants framework
Brignall, Fitzgerald, Johnston, & Silvestro (1991) have designed a performance measurement system
for service organizations with six performance dimensions: competitiveness, financial, quality,
flexibility, resource utilization and innovation. They state that every organization needs to define their
own set of performance measures for each dimension. A distinction is made between two categories of
measures: competitiveness and financial performance reflect strategy while the other four dimensions
determine competitive success. For each dimension, some types of measures are stated, that can be
found in table A4. The performance measures should be balanced by designing them in three steps
related to a company’s service type (professional services, service shop and mass services are defined
as the main service types), competitive environment and chosen strategy. Regarding the type of
measures, the authors state that “all companies will need to combine feed forward and feedback
controls”, which is analogue to using both leading and lagging indicators. Performance can be measured
at multiple levels within a company, the authors describe this using Porter’s value chain and state that
for instance, quality can be measured in all three stages.
The measurement of performance is subject to the environment, the environment is the why of
performance measurement. The strategy tells what to measure and the type of business determines how
performance should be measured. They also state that information supplied should vary across the
organizational levels, so there shouldn’t just be universal enterprise wide performance measures.
As stated above, the framework is designed for service industries. Brignall et al. state five key
differences between service and manufacturing: the common presence of the customer in the delivery
process, the intangibility of most services, the heterogenity of service staff performance and customer
expectations, the simultaneity of service production and consumption, and the perishability of many
services.
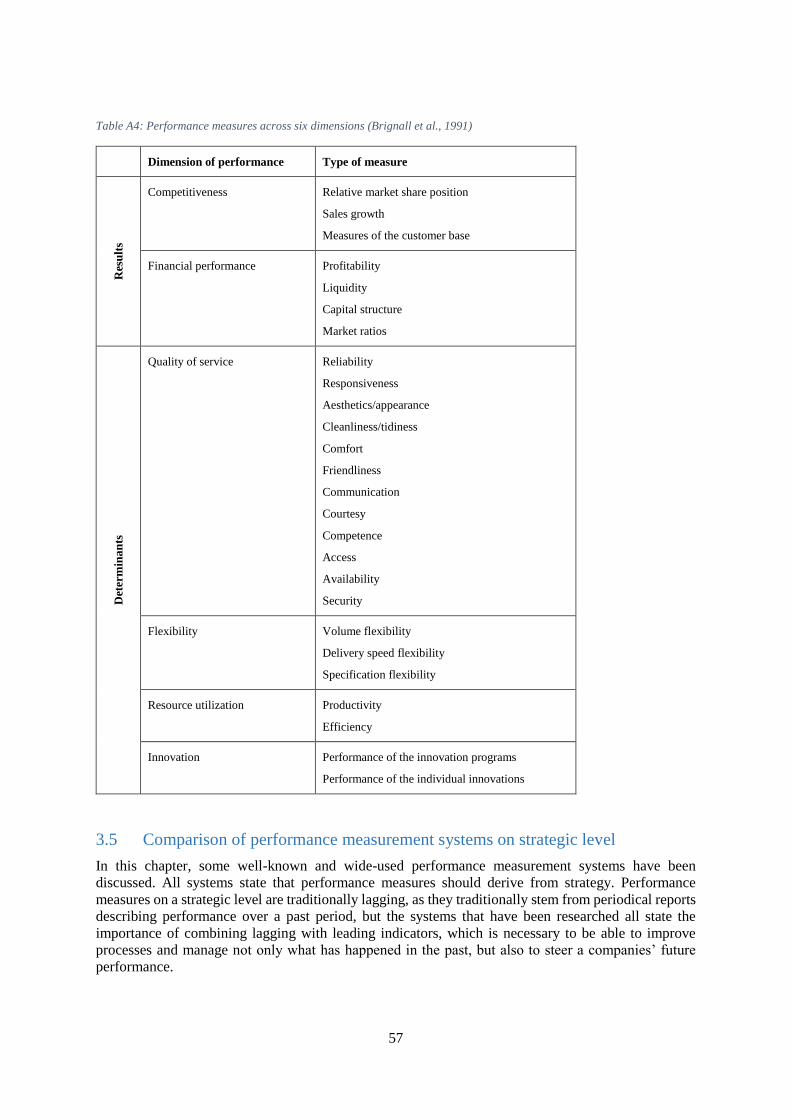
57
Table A4: Performance measures across six dimensions (Brignall et al., 1991)
Dimension of performance Type of measure
Res
ult
s
Competitiveness Relative market share position
Sales growth
Measures of the customer base
Financial performance Profitability
Liquidity
Capital structure
Market ratios
Det
erm
ina
nts
Quality of service Reliability
Responsiveness
Aesthetics/appearance
Cleanliness/tidiness
Comfort
Friendliness
Communication
Courtesy
Competence
Access
Availability
Security
Flexibility Volume flexibility
Delivery speed flexibility
Specification flexibility
Resource utilization Productivity
Efficiency
Innovation Performance of the innovation programs
Performance of the individual innovations
3.5 Comparison of performance measurement systems on strategic level
In this chapter, some well-known and wide-used performance measurement systems have been
discussed. All systems state that performance measures should derive from strategy. Performance
measures on a strategic level are traditionally lagging, as they traditionally stem from periodical reports
describing performance over a past period, but the systems that have been researched all state the
importance of combining lagging with leading indicators, which is necessary to be able to improve
processes and manage not only what has happened in the past, but also to steer a companies’ future
performance.

58
4. Frameworks for analyzing performance on business unit-level
This chapter describes performance measurement frameworks that measure performance on a business
unit-level (also referred to as operational level by some sources). The motivation for grouping these
performance measurement systems is that they do not solely focus on enterprise performance or on the
performance of business processes, but try to capture the performance at various levels within an
organization.
4.1 Performance measurement
matrix
Keegan et al. (1989) introduce the
performance measurement matrix (figure
A3), which focusses on four types of
performance measures that should provide
an exhaustive view on performance on
operational level. They remark that external
measures deserve special attention as these
can be used to monitor your position
compared to your competitors, while
internal measures mostly compare
performance to the previous period and/or
budget.
They introduce their matrix by stating that
performance measures must become more
specific and must encompass shorter
planning horizons as they extend down
through an organization. Many companies have too many performance indicators, more specific: too
many obsolete and inconsistent performance indicators. The indicators that are depicted in figure A3
are just examples and the four areas should be populated with performance measures that are relevant
to the specific company and industry you are analyzing. Also make sure that your performance
indicators remain relevant.
They conclude with repeating and emphasizing four principles for performance measurement:
1. Performance measures guide management action, so they should derive from strategy.
2. Performance measures are hierarchical and integrated across business functions, the integrated
measures are the most difficult to identify.
3. Performance measures must support the multidimensional environment, i.e. each of the four
quadrants is important.
4. Performance measures must be based on a thorough understanding of cost.
4.2 The Performance Prism
Adams & Neely (2002) state that solely focusing on financial performance measurement is the thing
not to do when a business is facing tough times as a motivation of their Performance Prism, a so called
second generation performance measurement and management framework. The Performance Prism
consists of five facets: stakeholder satisfaction, strategy, processes, capabilities and stakeholder
contribution. It is depicted in figure A4.
The main advantage it has over previous systems is that it applies to all stakeholders within an
organization, e.g. top management, employees, suppliers and shareholders. The performance prism is
Figure A3: Performance measurement matrix (Keegan, Eiler, & Jones, 1989)
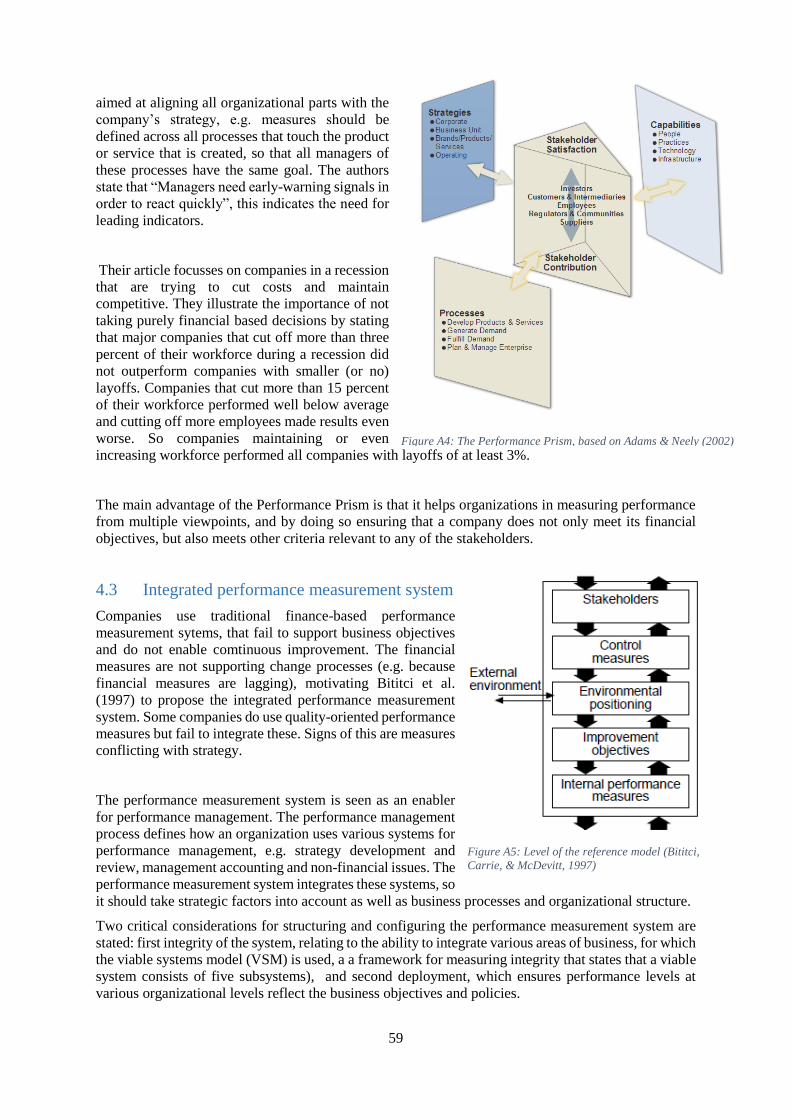
59
aimed at aligning all organizational parts with the
company’s strategy, e.g. measures should be
defined across all processes that touch the product
or service that is created, so that all managers of
these processes have the same goal. The authors
state that “Managers need early-warning signals in
order to react quickly”, this indicates the need for
leading indicators.
Their article focusses on companies in a recession
that are trying to cut costs and maintain
competitive. They illustrate the importance of not
taking purely financial based decisions by stating
that major companies that cut off more than three
percent of their workforce during a recession did
not outperform companies with smaller (or no)
layoffs. Companies that cut more than 15 percent
of their workforce performed well below average
and cutting off more employees made results even
worse. So companies maintaining or even
increasing workforce performed all companies with layoffs of at least 3%.
The main advantage of the Performance Prism is that it helps organizations in measuring performance
from multiple viewpoints, and by doing so ensuring that a company does not only meet its financial
objectives, but also meets other criteria relevant to any of the stakeholders.
4.3 Integrated performance measurement system
Companies use traditional finance-based performance
measurement sytems, that fail to support business objectives
and do not enable comtinuous improvement. The financial
measures are not supporting change processes (e.g. because
financial measures are lagging), motivating Bititci et al.
(1997) to propose the integrated performance measurement
system. Some companies do use quality-oriented performance
measures but fail to integrate these. Signs of this are measures
conflicting with strategy.
The performance measurement system is seen as an enabler
for performance management. The performance management
process defines how an organization uses various systems for
performance management, e.g. strategy development and
review, management accounting and non-financial issues. The
performance measurement system integrates these systems, so
it should take strategic factors into account as well as business processes and organizational structure.
Two critical considerations for structuring and configuring the performance measurement system are
stated: first integrity of the system, relating to the ability to integrate various areas of business, for which
the viable systems model (VSM) is used, a a framework for measuring integrity that states that a viable
system consists of five subsystems), and second deployment, which ensures performance levels at
various organizational levels reflect the business objectives and policies.
Figure A5: Level of the reference model (Bititci,
Carrie, & McDevitt, 1997)
Figure A4: The Performance Prism, based on Adams & Neely (2002)
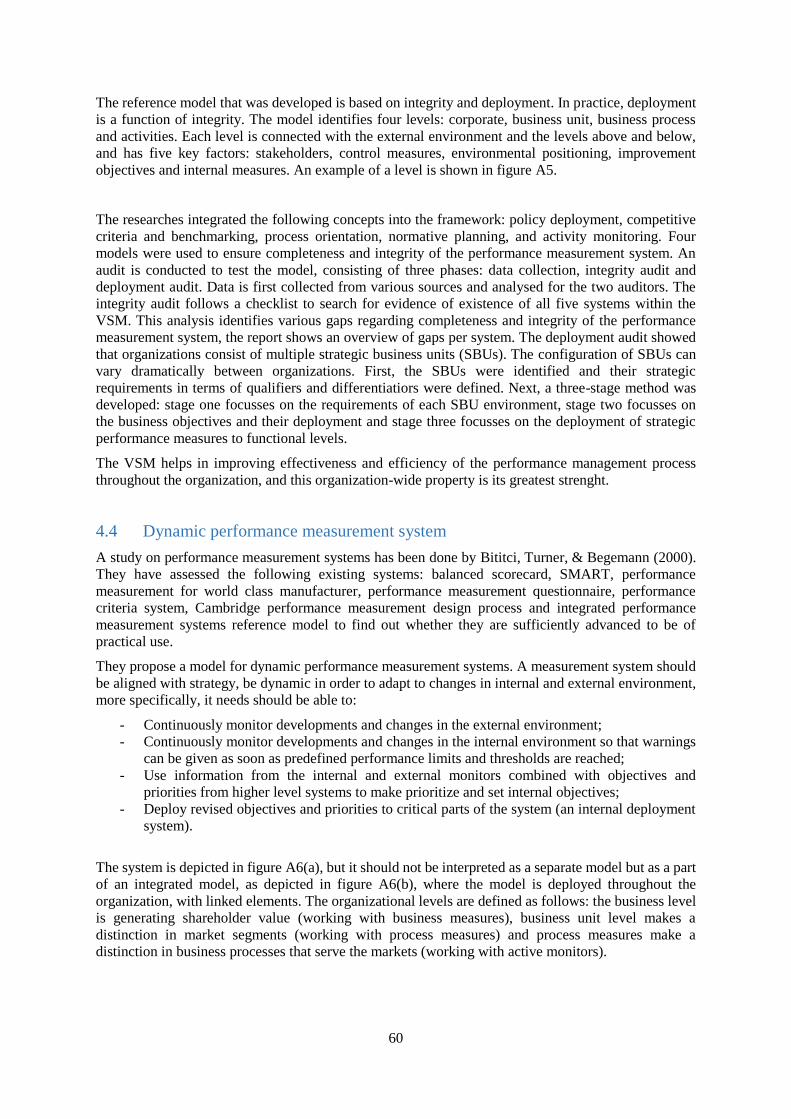
60
The reference model that was developed is based on integrity and deployment. In practice, deployment
is a function of integrity. The model identifies four levels: corporate, business unit, business process
and activities. Each level is connected with the external environment and the levels above and below,
and has five key factors: stakeholders, control measures, environmental positioning, improvement
objectives and internal measures. An example of a level is shown in figure A5.
The researches integrated the following concepts into the framework: policy deployment, competitive
criteria and benchmarking, process orientation, normative planning, and activity monitoring. Four
models were used to ensure completeness and integrity of the performance measurement system. An
audit is conducted to test the model, consisting of three phases: data collection, integrity audit and
deployment audit. Data is first collected from various sources and analysed for the two auditors. The
integrity audit follows a checklist to search for evidence of existence of all five systems within the
VSM. This analysis identifies various gaps regarding completeness and integrity of the performance
measurement system, the report shows an overview of gaps per system. The deployment audit showed
that organizations consist of multiple strategic business units (SBUs). The configuration of SBUs can
vary dramatically between organizations. First, the SBUs were identified and their strategic
requirements in terms of qualifiers and differentiatiors were defined. Next, a three-stage method was
developed: stage one focusses on the requirements of each SBU environment, stage two focusses on
the business objectives and their deployment and stage three focusses on the deployment of strategic
performance measures to functional levels.
The VSM helps in improving effectiveness and efficiency of the performance management process
throughout the organization, and this organization-wide property is its greatest strenght.
4.4 Dynamic performance measurement system
A study on performance measurement systems has been done by Bititci, Turner, & Begemann (2000).
They have assessed the following existing systems: balanced scorecard, SMART, performance
measurement for world class manufacturer, performance measurement questionnaire, performance
criteria system, Cambridge performance measurement design process and integrated performance
measurement systems reference model to find out whether they are sufficiently advanced to be of
practical use.
They propose a model for dynamic performance measurement systems. A measurement system should
be aligned with strategy, be dynamic in order to adapt to changes in internal and external environment,
more specifically, it needs should be able to:
- Continuously monitor developments and changes in the external environment;
- Continuously monitor developments and changes in the internal environment so that warnings
can be given as soon as predefined performance limits and thresholds are reached;
- Use information from the internal and external monitors combined with objectives and
priorities from higher level systems to make prioritize and set internal objectives;
- Deploy revised objectives and priorities to critical parts of the system (an internal deployment
system).
The system is depicted in figure A6(a), but it should not be interpreted as a separate model but as a part
of an integrated model, as depicted in figure A6(b), where the model is deployed throughout the
organization, with linked elements. The organizational levels are defined as follows: the business level
is generating shareholder value (working with business measures), business unit level makes a
distinction in market segments (working with process measures) and process measures make a
distinction in business processes that serve the markets (working with active monitors).

61
(a) The dynamic performance measurement
systems model
(b) the integrated model
Figure A6: The dynamic performance measurement systems model and perspective (Bititci et al., 2000)
Based on this model, more detailed requirements specifications for the framework and for an IT
platform were defined in a series of workshops. Next to the four attributes stated before, the framework
should meet the following requirements:
- It should facilitate the management of causal relationships between various performance
measures;
- It should be able to quantify the causal relationships in order to quantify criticality and
priorities;
- It should ensure maintaining gains made by improvement efforts, by using local performance
measures;
- It should allow for identification of performance limits and thresholds to be able to provide
early warnings of potential performance issues.
For the IT platform, the following requirements were identified:
- The platform should provide an executive information system that not just serves as a means to
maintain the performance measurement system;
- It must be able to accommodate and incorporate all requirements of the framework that have
been stated above;
- The platform should be integrated within existing systems;
- It needs to be capable of handling rules to facilitate performance management, e.g. raising alarm
signals when processes don’t meet predefined performance levels.
The existing performance measurement systems that were stated in the introduction of the article have
been assessed to see if all the framework requirements are met. Most framework meet most
requirements but the ‘review mechanism’ requirement is not met by any system.
The article presents the applicability of the dynamic performance measurement system in a case study
and then draws the following conclusions: this model has a broader view than other systems as it
includes the complete lifecycle of performance measurement into one model where others don’t. It also
incorporates a control loop for corrective action, which seems similar to statistical process control (SPC)
but is more complex due to the multiple interrelated performance measures, where SPC works with
only one, unrelated, measure.
The main conclusion is that although existing systems don’t meet all requirements for a dynamic
performance measurement system, the current knowledge and technology appears to be mature enough
to create dynamic performance measurement systems, except for research on the review mechanism.

62
4.5 Comparison of performance measurement systems on business unit level.
This chapter described four performance measurement systems that measure performance on business
unit level, or on multiple levels throughout an organization. The four systems have their own respective
characteristics and their own specific foci, but all systems focus on both leading and lagging indicators
and the use of multiple dimensions to measure performance, every system explicitly mentions the use
of both financial and non-financial indicators.

63
5. Performance measurement on process level
This chapter describes performance measurement systems that measure performance on process level.
A number of articles the performance of workflows rather than processes. A definition of a workflow is
“The workflow describes process or simply workflow is a special kind of business process. Often the
use of the terms "business process" and "workflow" is mixed up, either in the sense that they are
explicitly used as synonyms or that they are presented side by side without any distinctive comments.”
(Reijers, 2003a, p. 18). This chapter focusses on processes and treats workflows as synonyms of
processes, since workflows are a specific type of process but appear in the same organizational level.
This chapter will conlude with a comparison of the performance measurement systems on processes
that have been discussed.
5.1 The Devil’s Quadrangle
Four dimensions of performance are presented in the Devil’s
quadrangle by Brand & Van der Kolk (1995): time, quality,
costs and flexibility. The quadrangle is named after the trade-
off that has to be made when designing a process. It is not
possible to maximize all four the criteria, therefore a choice
has to be made regarding what dimension should be
maximized. This choice is directed by the strategy and focus
of the organization. No matter what dimension is mazimized,
the total surface remains unchanged. This means that an
increase in one dimension, will result in a decrease in at least
one other dimension. Improving all dimensions is only
possible when the total surface is increased. In order to do so,
the process needs to be redesigned (Brand & Van der Kolk, 1995). Figure A7 shows an example of a
quadrangle of a process with short throughput time and high quality but relative low flexibility and high
cost. The next three subsections describe first the operationalization of the framework, then the
application in a quantitative study and finally the application in a qualitatitve study.
5.1.1 Operationalization of the Devil’s quadrangle
Jansen-Vullers et al. (2007) research focusess on evaluating the impact of best practice heuristics on
processes. They state that a method to quantify the impact of heuristcs is unadressed in prior research.
They aim to quantify the impact of redesign best practices on as many dimensions as possible. In order
to do so, they assessed the applicability of six existing performance measurement systems (Performance
pyramid, Performance measurement matrix, Results/determinants matrix, Balanced scorecard, Devil’s
quadrangle, and Performance prism) and concluded that the dimensions of Devil’s quadrangle are
“suitable for measuring the performance of a workflow. The dimensions cover the concept of
performance and the other performance measurement systems do not provide additional relevant
dimensions” (Jansen-Vullers et al., 2007). In the remainder of their research, they operationalize the
four dimensions of the Devil’s quadrangle into performance measures based on more literature research.
For the time dimension, they have defined all measures shown in figure A8 and present a definition of
each measure.
Performance measures for the cost dimension are the following, that have been defined as well: Running
costs (consisting of labor costs, machinery costs and training costs), inventory costs, transport costs and
administrative costs. A remark is made that the costs can be categorized as either constant or variable
costs.
In the quality dimension, a distinction can be made between external and internal quality. Internal
quality is the quality of internal processes, as seen by an employee. External quality measures quality
as perceived by the customer of both the product and process. For internal quality, the following
measures are defined: skill variety, task identity, task significance, autonomy, feedback, and co-worker
relations. External quality is measured by the following performance measures: quality of output,
high flexibility
Short throughput time low cost
high quality
Figure A7: The Devil's quadrangle

64
consisting of performance, conformance and serviceability, and quality of the process, consisting of
information on application, bureaucratic language simplification and information availability.
The flexibility dimension has the following performance measures: mix flexibility (for resources, tasks
and the workflow), labor flexibility (for resources and the workflow), routing flexibility, volume
flexibility and process modification flexibility.
The researchers conclude their article by stating that little quantitative data is available to truly predict
the impact of applying best practices, since studies that provide quantitative data all have a limited
scope. They state that calculating the scores on the measures for time and costs are quite straightforward
while the measures for quality, e.g. feedback, are impossible to quantify exactly, but a simulation study
can give helpful insights. For flexibility, the proposed measures can all be implemented except for
modification flexibility, and the authors expect changes in measures to accurately represent what will
happen in practice.
Figure A8: performance measures for the time dimension (Jansen-Vullers et al., 2007)
Reijers (2003b) discusses the impact of thirty workflow redesign heuristics from various sources using
the for that specific heuristic relevant dimensions of the Devil’s quadrangle. He omitted some heuristics
that focus on a more strategic level and are therefore less suited to be analyzed on a workflow level.
This again illustrates that a significant difference approach is necessary to measure performance on
different levels within organizations. As this article is one of the main sources for Jansen-Vullers et al.
(2007) to operationalize the Devil’s quadrangle, all of the performance measures Reijers states for each
dimension is in accordance with the performance measures by Jansen-Vullers but naturally not all
measures by Jansen-Vullers are present in Reijer’s measures.
5.1.2 Quantifying the Performance of Workflows
The quantification of performance of workflowsis discussed in (Jansen-Vullers, Kleingeld, & Netjes,
2008). They compare the same performance measurement systems as is done in the research by Jansen-
Vullers et al. (2007) and again conclude that the Devil’s quadrangle is the most complete and suited
performance measurement system. For quality, a more explicit distinction is made between internal and

65
external quality in the introduction and motivation of the Devil’s quadrangle. An extensive definition
of all dimensions is given in Appendix A2.
The article starts with description of the generalized quantification approach that is executed, starting
with an eight step redesign quantification plan:
1. The project is defined.
2. A model of the original situation that can be used as a starting point for the simulations is
created in CPN tools.
3. The model is validated by comparing outcomes with the outcomes of mathematical queuing
models and 95% confidence intervals are established.
4. A redesign of the original model is created.
5. Design of the experiments, consisting of the following sub steps:
a. Introducing variations to test the impact of a best practice in different settings
b. Defining what combinations of variants are used
c. Calculating the warm-up period of the model to become steady state
d. Determining the run length, taking into account that the warm-up period has to be
subtracted from the run length to get the effective run length for data collection.
e. Calculating the number of replications to improve reliability of results.
6. The simulation runs are executed, so both the original and redesigned models are created and
simulated and all results are recorded.
7. The analysis of the results, starting with a comparison between different model variants, this
creates the basis of the analysis. Next, a thorough statistical analysis is executed.
8. Based on the analysis, final conclusions are drawn.
Next, the impact of the following three best practices was quantified, leading to the following
conclusions:
Parallel best practice, in which tasks may be executed in parallel: this best practice significantly
decreases lead time and WIP costs. For lead time, a specific parallel execution (ABD-DEF)
lead to a significantly higher decrease in lead time than the other combinations. The researchers
remark that the observed decrease only holds for processes with a low arrival rate.
Knockout best practice, consisting of three possible redesigns:
o Swapping tasks rule, in which the order in which conditions are checked can be chosen.
This redesign leads to lower costs, increased labor and volume flexibility but does not
lead to a lead time reduction.
o Combining tasks rule, in which two tasks are executed by the same resource class. This
leads to a shorter lead time and in some cases also reduces WIP costs and labor and
volume flexibility. Internal quality is expected to remain at the same level.
o Parallel tasks rule, which puts as many tasks as possible in parallel. This redesign
assumes that combining tasks or swapping tasks is not possible. It decreases lead time
and reduces WIP costs. Optimal results are achieved when 1) service times of the
parallel tasks are approximately equal, 2) parallel reject probabilities are small 3)
arrival rates are low and 4) none of the resources is overloaded. When one of these
conditions is not satisfied, the positive impact decreases. This redesign negatively
impacts external quality, process modification flexibility but increases internal
flexibility.
Triage best practice, which divides a task into multiple alternative tasks. This best practice lead
to lower utilization and higher volume flexibility, while decreasing labor flexibility and
increasing labor costs. In models with a low arrival rate, lead time and WIP costs decrease but
this advantage decreases and can even become negative when arrival rates increase. External

66
quality increases but internal quality increases. When replacing two or more tasks with one
general tasks (the opposite of the situation stated above), the opposite results are achieved.
26 more best practices are mentioned in the appendix of the article, that can be analyzed in the same
manner as the three best practices described above, so using the Devil’s quadrangle.
This study gives a strong example of how to apply the dimensions of the Devil’s quadrangle to
quantitatively analyze the impact of best practices on process level.
5.1.3 Qualitative evaluation of successful redesign heuristics
This literature study focusses on the performance of evolving processes. Reijers & Liman Mansar
(2005) discuss a number of best practices and compare the impact of these best practices on the four
dimensions of the Devil’s quadrangle. Their research focusses on 1) defining a framework for BPR
implementation and 2) identifying the best practices in BPR implementation. A BPR framework based
on multiple existing frameworks is introduced, that will be used to classify the BPR best practices.
The best practices (29 in total) are grouped in 7 different orientation focused categories, based on the
BPR framework: customers, business process operation, business process behavior, organization,
information, technology, and external environment. For each best practice a definition is given, plus the
impact that the best practice will have on the performance. This effect is represented both descriptive
and visual, as the article shows the Devil’s quadrangle for each best practice next to a ‘neutral effect’,
which conveniently shows on which dimension a certain best practice improves or decreases.
This study shows how to apply the dimensions of the Devil’s quadrangle to qualitatively assess the
impact of best practices on process level, and how to compare the impact of various best practices.
5.2 Process performance measurement system (PPMS)
Kueng (2000) proposes a framework for conceptualizing and developing a process performance
measurement system (PPMS). As a motivation, Kueng states that business process improvement and
process management systems are currently being used, but most enterprise lack an integrated and
holistic system to measure business process performance on a regular basis. This is illustrated by the
following statement: “An important characteristic of BSC is that the tool is focused on corporations or
organizational units such as strategic business units, not on business processes. It looks at business
processes only as far as they have a great impact on customer satisfaction and achieve an organization’s
financial objectives.” (Kueng, 2000).
Kueng states that traditional systems still mainly rely on financial measures while non-financial aspects
play a marginal role, and that traditional systems fail to relate performance to the processes and to make
a distinction between control and improvement. There have already been approaches to solve these
issues, which are stated by Kueng. Then, a new approach is proposed; a system that fulfils two criteria:
a focus on business processes and taking both quantitative and qualitative aspects into account. The
proposed system is based on a number of existing performance measurement systems and approaches
and has three requirements:
1. It should gather performance-relevant data of the business processes through a set of indicators;
2. Use this performance data to compares current value against historical values and targets;
3. Communicate the results to the concerning stakeholders.
The PPMS should provide the following advantages to implementing businesses:
- Communicate the direction of the business in operational terms rather than vague vision and
mission statements.
- It gives an understanding on how business processes perform so you can improve them, by
providing insights that were barely visible without a PPMS
- All information systems within an organizations produce various reports, therefore managers
are overwhelmed with data from different sources. Using a PPMS, the number of reports can
be drastically reduced since it offers process-oriented and goal-directed information.
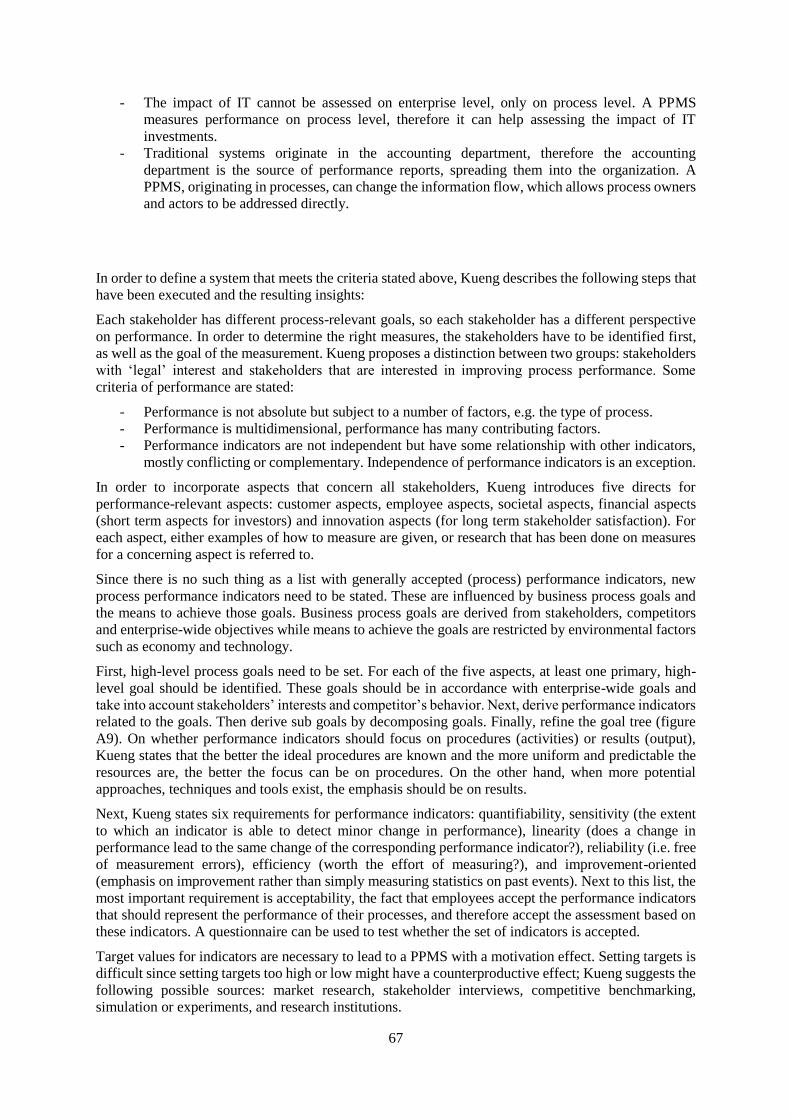
67
- The impact of IT cannot be assessed on enterprise level, only on process level. A PPMS
measures performance on process level, therefore it can help assessing the impact of IT
investments.
- Traditional systems originate in the accounting department, therefore the accounting
department is the source of performance reports, spreading them into the organization. A
PPMS, originating in processes, can change the information flow, which allows process owners
and actors to be addressed directly.
In order to define a system that meets the criteria stated above, Kueng describes the following steps that
have been executed and the resulting insights:
Each stakeholder has different process-relevant goals, so each stakeholder has a different perspective
on performance. In order to determine the right measures, the stakeholders have to be identified first,
as well as the goal of the measurement. Kueng proposes a distinction between two groups: stakeholders
with ‘legal’ interest and stakeholders that are interested in improving process performance. Some
criteria of performance are stated:
- Performance is not absolute but subject to a number of factors, e.g. the type of process.
- Performance is multidimensional, performance has many contributing factors.
- Performance indicators are not independent but have some relationship with other indicators,
mostly conflicting or complementary. Independence of performance indicators is an exception.
In order to incorporate aspects that concern all stakeholders, Kueng introduces five directs for
performance-relevant aspects: customer aspects, employee aspects, societal aspects, financial aspects
(short term aspects for investors) and innovation aspects (for long term stakeholder satisfaction). For
each aspect, either examples of how to measure are given, or research that has been done on measures
for a concerning aspect is referred to.
Since there is no such thing as a list with generally accepted (process) performance indicators, new
process performance indicators need to be stated. These are influenced by business process goals and
the means to achieve those goals. Business process goals are derived from stakeholders, competitors
and enterprise-wide objectives while means to achieve the goals are restricted by environmental factors
such as economy and technology.
First, high-level process goals need to be set. For each of the five aspects, at least one primary, high-
level goal should be identified. These goals should be in accordance with enterprise-wide goals and
take into account stakeholders’ interests and competitor’s behavior. Next, derive performance indicators
related to the goals. Then derive sub goals by decomposing goals. Finally, refine the goal tree (figure
A9). On whether performance indicators should focus on procedures (activities) or results (output),
Kueng states that the better the ideal procedures are known and the more uniform and predictable the
resources are, the better the focus can be on procedures. On the other hand, when more potential
approaches, techniques and tools exist, the emphasis should be on results.
Next, Kueng states six requirements for performance indicators: quantifiability, sensitivity (the extent
to which an indicator is able to detect minor change in performance), linearity (does a change in
performance lead to the same change of the corresponding performance indicator?), reliability (i.e. free
of measurement errors), efficiency (worth the effort of measuring?), and improvement-oriented
(emphasis on improvement rather than simply measuring statistics on past events). Next to this list, the
most important requirement is acceptability, the fact that employees accept the performance indicators
that should represent the performance of their processes, and therefore accept the assessment based on
these indicators. A questionnaire can be used to test whether the set of indicators is accepted.
Target values for indicators are necessary to lead to a PPMS with a motivation effect. Setting targets is
difficult since setting targets too high or low might have a counterproductive effect; Kueng suggests the
following possible sources: market research, stakeholder interviews, competitive benchmarking,
simulation or experiments, and research institutions.

68
When the previous steps have been executed, data on performance must be gathered. This can be done
in three ways: observations, subjective methods (e.g. interviewing), and database analysis. Since
performance indicators belong to various dimensions, using multiple data sources is necessary to obtain
a complete view on the current level of performance. The PPMS combines the data from various sources
and translates it into the defined measures for process performance.
Information technology enables calculation of current values and comparison against targets, historical
values and to identify trends. Results of these analyses, including gaps between targets and current
performance, should be communicated throughout the organization. However, ERP systems have three
drawbacks: they are generic systems that cannot be easy modified, they are dedicated to collecting and
storing data and less suited to measure e.g. innovation. Finally, since ERP systems consist of multiple
modules, making local modifications (to measure certain indicators) is almost impossible. Therefore, a
PPMS should be a separate information system, loosely coupled to other information systems so it can
benefit from the data collection of those information systems but can also cope with dynamic change.
Regarding elicitation of the performance indicators, Kueng concludes that managers tend to define
performance indicators for which data is easily available. Therefore, it is important to verify the selected
indicators by the stated quality criteria. Creating a set of performance indicators is time-consuming but
will eventually lead to a deeper, more customer-oriented understanding. Highly detailed performance
are usually regarded as valuable but they are very sensitive to the slightest process modification.
On the use of PPMS, the following conclusions are drawn: first, data collection must be made as easy
as possible. Next, the acceptance of the chosen indicators is crucial. The process team should establish
a common understanding of goals, objectives and values. Finally, a PPMS does not improve processes
or competitiveness itself but when used in combination with a social transformation (i.e. embedding the
usage of the PPMS within your organization) it has a significant potential for improvement.
The following general conclusions are stated: the role of a business process manager (or owner) is
crucial in deploying a PPMS effectively. For the implementation project of a PPMS, a sponsor from
senior management is indispensable and cross-departmental communication is absolutely necessary.
The key lessons from this article are that process performance measurement is an absolute necessity
for a process-oriented organization. Performance indicators are process-specific so a standard set of
performance indicators will not result in a successful PPMS. A PPMS does not improve a business
process but gives a clear direction to identify and improve weaknesses and to evaluate the impact of
process changes.
69
Figure A9: Example of a goal and performance indicator tree (Kueng, 2000)
5.3 Process Performance Measurement
“Measuring performance is a precondition for analyzing and subsequently improving business
processes” opens the abstract of Leyer, Heckl, & Moormann (2015) and illustrates the relevance of the
article of which the findings will be discussed below.
Process control consists of three parts: measurement, analysis and improvement of processes.
The following steps have to be considered in order to measure processes:
1. How should the measurement be conducted in general? A framework can help in deciding;
2. Identify indicators for measuring process performance;
3. Select data sources to gather the data necessary;
4. Consider implications from business context of the processes in the measurements.
Leyer et al. state that there are two perspectives on performance: productivity, referring to the relation
between input and output, and efficiency, which relates to actual performance versus what the
performance should be. A side note: effectiveness is doing the right thing, efficient can mean doing the
wrong with the output that is expected. Indicators become meaningful when they are compared or
placed in sequence with other performance indicators.
“Process performance measurement entails capturing quantitative and qualitative information about the
process. Subsequently, the measurements can be transformed into performance figures which translate
unfiltered data into information about process performance” (Leyer et al., 2015)
Various measurement procedures, coming from different sources, are discussed. Different measurement
systems place emphasis on different aspects but Leyer et al. conclude that there is no use in designing
a ‘one size fits all’-system, the system has to be designed taking the following aspects into account:
external environment, strategy and process model of the company.
Next, the performance measures need to be selected. To do so, four groups are stated: quality, time,
flexibility and costs. The following measures are proposed for the groups: quality is measured through
customers satisfaction, time is measured based on throughput time, actual processing time, waiting time,
transportation time, and delivery time. Costs are measured by activity-based costs, sub-process costs or
process related costs, or a combination of those measures. Finally, flexibility is measured by indicator

70
regarding the number of products that can be produced in a certain time, or the degree to which the
process can be modified. Note that the indicators that are selected need to be linked to the company’s
strategy and have to link to both business objectives and resources. This will lead to strategic
performance indicators that help senior management in leading a company in the right direction.
Data collection can be done in many ways, e.g. by studying documents, which helps in getting an
understanding of a process, observations, that are independent of observer subjectivity, questionnaires,
which usually involve a high response rate, self-recordings, that can help in determining processing
times, order worksheets can be analyzed for factual data, and estimations, mostly relying on statistical
techniques. The choice of a data source depends on both the purpose of the data collection and the
availability of different data types.
To take the influence of context into account, the influence can be operationalized into contextual
factors. Contextual factors are either environmental factors (industrial conditions and customer
characteristics, e.g. regulations) or internal factors (organizational conditions, e.g. workload in the
process). Both categories have to be used in order to determine whether the existing data is sufficient
or additional data is needed. Influence of the contextual factors can be determined using various
statistical tests, e.g. ANOVA. If significant impact is measured, the impact of contextual factors can be
determined.
Leyer et al. argue that it is most appropriate to use methodologies for performance measurement that
are based on input-output models. Data Envelopment Analysis (DEA), the most popular efficiency
measurement methodology, regards throughput (the process converting input to output) as a black box.
Process mining is proposed to create insight in the process performance,
Since companies overall performance does not reflect efficiency of individual processes, measuring
efficiency should be done on a process level. In general, DEA is used to measure efficiency on
organizational level but it has been applied on process level as well.
A case study at a German bank is presented, where process mining is applied to measure costs and
quality of a loan application process.
Conclusively, the following statements are made: first, when aiming at improving certain business
processes, process performance needs to be analyzed in-depth. To do so, the right criteria have to be
selected, which is a challenge since no meaningful uniform performance measures exist. The paper
showed that both DEA and process mining can be applied to measure the performance of business
processes and that both methods are promising and can lead to successful business process management.
This study gives an insight in which methodologies for performance measurement on process-level are
available and shows how two of these methodologies can be applied to measure performance and
eventually improve business (process) performance.
5.4 Comparison of process performance measurement systems
This section described the Devil’s quadrangle (Brand & Van der Kolk, 1995), the PPMS (Kueng, 2000)
and the specific application of two existing methodologies (DEA and process mining) to measure
process performance (Leyer et al., 2015). Similarities in characteristics of process performance
measurement systems are that all systems use leading indicators, as they consider performance on
process indicators rather than e.g. financial indicators over a past period. All systems emphasize that
performance is multidimensional and therefore needs indicators from various dimensions. Brand & Van
der Kolk (1995) and Leyer et al. (2015) agree on the dimensions that need to be considered, they both
list quality, time, cost and flexibility as the four dimensions or indicator groups that need to be
considered. Next to these similarities, the different studies show that performance measures are always

71
subject to the business environment (factors like process characteristics and strategy). Both Kueng and
Leyer et al. state that measures should be qualitative and quantitative in order to create a holistic
performance evaluation.

72
6. Conclusion
In this chapter, the differences between the systems on different levels are discussed, as well as the
common characteristics for performance measurement systems on those different levels, based on the
literature that has been reviewed. As all performance measurement systems have their respective
strengths and weaknesses, before selecting an appropriate system the environmental context has to be
analyzed so that the most appropriate system can be chosen.
6.1 Attributes per system
Table A5 presents an overview of attributes present in systems that have been analyzed. The systems
have been described in detail in chapters three through five, and the second column shows a summarized
answer to research question one.
Table A5: overview of attributes per performance measurement system
Organizational
level
Attribute
Measurement system Lea
din
g i
nd
icat
ors
Mu
ltip
le d
imen
sio
ns
Fin
anci
al
and
no
n-
fin
anci
al
Str
ateg
y d
riv
en
Strategic Comparing performance of SMEs
(Bititci et al., 2013)
Strategic Balanced scorecard
(Kaplan & Norton, 1992)
Strategic SMART
(Cross & Lynch, 1988)
Strategic Results/Determinants matrix
(Brignall et al., 1991)
Business unit Performance measurement matrix
(Keegan et al., 1989)
Business unit Performance prism
(Adams & Neely, 2002)
Business unit Integrated performance measurement system
(Bititci et al., 1997)
Process Devil’s Quadrangle
(Brand & Van der Kolk, 1995)
Process PPMS
(Kueng, 2000)

73
The answer to research question two can be found in table A6, which shows the agreement between
articles on the same level for the dimensions and shows that performance measurement systems at all
levels should use leading indicators in multiple dimensions. For strategic level, the attributes should be
strategy driven, for business unit level they should be both financial and non-financial, and strategy
driven. Process performance measurement systems should be a combination of financial and non-
financial measures. As not all systems on a certain level agree on what attributes to exclude, the sources
that present the performance measurement systems should be consulted when a system for a specific
context is needed. All sources that provided the systems in this review describe the design and use of
the systems in more detail and are therefore an excellent starting point to find more information on a
particular system.

74
Table A6: Overview of common attributes for performance measurement systems on different levels
Attribute
Organizational level Lea
din
g i
nd
icat
ors
Mu
ltip
le d
imen
sio
ns
Fin
anci
al
and
no
n-
fin
anci
al
Str
ateg
y d
riv
en
Strategic
Business unit
Process
6.2 Lessons learned
In this section, research question three is answered. A first conclusion that can be drawn from all studied
performance measurement systems, is that there is no single indicator for performance. The common
factor in all systems that performance has to be viewed from multiple dimensions, regardless of which
level in the organization you assess. This trend multidimensional view can nowadays even be found in
reporting requirements for companies, for instance in the UK where companies have to release so called
Operating and Financial Reviews (OFR). These OFRs have to report on performance during the
financial year, main trends and factors underlying development, performance and position of the
business, and factors likely to affect a business’ future development, future and position, since 2005
(Neely, 2005).
Performance is not absolute. The perspective of the manager defines what performance measures are
relevant and the means of the measurement define the measures. Therefore, every stakeholders will
have their own set of relevant performance measures. A performance measurement system can assist in
aligning all these unique sets of measures with the organizational objectives.
Another common factor in proposed systems is that relying on just lagging indicators will not get you
there. Lagging and leading indicators should be combined, or even just leading indicators should be
used. This is confirmed by Smith & Proctor (2013) in their article on the Gartner Business Value model
who recommend to use leading indicators rather than lagging indicators. Companies using leading
indicators significantly outperform companies using lagging indicators.
Although some of the articles are from the late 1980’s, recent research by e.g. Leyer et al. (2015) and
Bititci (2013) shows that there is still no system that addresses all the industry’s demands. On a positive
note, the number of performance measurement systems grows, as well as their applicability (mostly
thanks to integration with various enterprise information systems) is increasing, creating more and more
alternatives for companies that are searching for a method to measure and manage their performance.
The systems focusing on a strategic level have a focus on a relative high level of performance and are
therefore less suited to be used in a performance-improving approach. The systems described in chaps
4 and 5 on the other hand do focus on process performance details and therefore help companies in
improving businesses by showing under- or over performance of certain processes.

75
Three more characteristics of good performance measurement systems in general are given by Smith &
Proctor (2013), that provide additional insights into what attributes a performance measurement system
should have and should therefore be taken into consideration when choosing (or designing) a
performance measurement system:
1. Less is more, use no more than 5 to 9 performance indicators at any level;
2. If possible, use industry standard metrics to enable comparison with competitors; and
3. Avoid gaps and overlaps in metrics, try to create a list that is mutually exclusive and collectively
exhaustive.
Literature review bibliography
Adams, C., & Neely, A. (2002). Prism reform (pp. 28). London: Chartered Institute of Management Accountants.
Bai, C., & Sarkis, J. (2014). Determining and applying sustainable supplier key performance indicators. Supply Chain Management, 19(3), 275-291. doi:10.1108/SCM-12-2013-0441
Beamon, B. M. (1999). Measuring supply chain performance. International Journal of Operations and Production Management, 19(3), 275-292. doi:10.1108/01443579910249714
Bititci, U. S., Carrie, A. S., & McDevitt, L. (1997). Integrated performance measurement systems: a development guide. International Journal of Operations & Production Management, 17(5), 522-534. doi:10.1108/01443579710167230
Bititci, U. S., Firat, S. U. O., & Garengo, P. (2013). How to compare performances of firms operating in different sectors? Production Planning and Control, 24(12), 1032-1049. doi:10.1080/09537287.2011.643829
Bititci, U. S., Turner, T., & Begemann, C. (2000). Dynamics of performance measurement systems. International Journal of Operations & Production Management, 20(6), 692-704.
Brand, N., & Van der Kolk, H. (1995). Werkstroomanalyse en -ontwerp : het logistiek vriendelijk ontwerpen van informatiesystemen. Deventer: Kluwer Bedrijfswetenschappen.
Brignall, T. J., Fitzgerald, L., Johnston, R., & Silvestro, R. (1991). Performance Measurement in Service Businesses. Management Accounting, 69(10), 34.
Buytendijk, F. (2005). CPM Helps Build the High-Performance Organization. Retrieved from
Cross, K. F., & Lynch, R. L. (1988). The “SMART” way to define and sustain success. National Productivity Review, 8(1), 23-33.
Harrington, H. J. Retrieved from http://www.goodreads.com/quotes/632992-measurement-is-the-first-step-that-leads-to-control-and
Jansen-Vullers, M. H., Kleingeld, P. A. M., & Netjes, M. (2008). Quantifying the Performance of Workflows. Information Systems Management, 25(4), 332-343. doi:10.1080/10580530802384589
Jansen-Vullers, M. H., Loosschilder, M. W. N. C., Kleingeld, P. A. M., & Reijers, H. A. (2007). Performance Measures to evaluate the impact of Best Practices. Paper presented at the Proceedings of Workshops and Doctoral Consortium of the 19th International Conference on Advanced Information Systems Engineering (BPMDS workshop).
Jouck, T., & Depaire, B. (2014). Generating artificial event logs with sufficient discriminatory power to compare process discovery techniques. Paper presented at the CEUR Workshop Proceedings.
Kaplan, R. S., & Norton, D. P. (1992). The Balanced Scorecard-Measures That Drive Performances. Harvard Business Review, 70(1), 71-79.
76
Keegan, D. P., Eiler, R. G., & Jones, C. R. (1989). Are Your Performance Measures Obsolete? Management Accounting, 70(12), 45.
Kennerley, M., & Neely, A. (2003). Measuring performance in a changing business environment. International Journal of Operations & Production Management, 23(2), 213-229. doi:doi:10.1108/01443570310458465
Kloot, L., & Martin, J. (2000). Strategic performance management: A balanced approach to performance management issues in local government. Management Accounting Research, 11(2), 231-251. doi:10.1006/mare.2000.0130
Kueng, P. (2000). Process performance measurement system: a tool to support process-based organizations. Total Quality Management, 11(1), 67-85.
Lebas, M. J. (1995). Performance measurement and performance management. International Journal of Production Economics, 41(1-3), 23-35. doi:10.1016/0925-5273(95)00081-X
Leyer, M., Heckl, D., & Moormann, J. (2015). Process Performance Measurement. In J. vom Brocke & M. Rosemann (Eds.), Handbook on Business Process Management 2 (pp. 227-241): Springer Berlin Heidelberg.
Limam-Mansar, S., Reijers, H. A., & Ounnar, F. (2009). Development of a decision-making strategy to improve the efficiency of BPR. Expert Systems With Applications, 36(2), 3248-3262. doi:10.1016/j.eswa.2008.01.008
Marchand, M., & Raymond, L. (2008). Researching performance measurement systems: An information systems perspective. International Journal of Operations and Production Management, 28(7), 663-686. doi:10.1108/01443570810881802
Martin, P. R., & Patterson, J. W. (2009). On measuring company performance within a supply chain. International Journal of Production Research, 47(9), 2449-2460. doi:10.1080/00207540701725604
Neely, A. (2005). The evolution of performance measurement research: Developments in the last decade and a research agenda for the next. International Journal of Operations and Production Management, 25(12), 1264-1277. doi:10.1108/01443570510633648
Neely, A., Gregory, M., & Platts, K. (2005). Performance measurement system design: A literature review and research agenda. International Journal of Operations and Production Management, 25(12), 1228-1263. doi:10.1108/01443570510633639
Neely, A., Mills, J., Platts, K., Richards, H., Gregory, M., Bourne, M., & Kennerley, M. (2000). Performance measurement system design: developing and testing a process-based approach. International Journal of Operations & Production Management, 20(10), 1119-1145. doi:10.1108/01443570010343708
Odiorne, G. S. (1987). Measuring the unmeasurable: Setting standards for management performance. Business Horizons, 30(4), 69-75. doi:http://dx.doi.org/10.1016/0007-6813(87)90068-1
Pika, A., Wynn, M. T., Fidge, C. J., ter Hofstede, A. H. M., Leyer, M., & van der Aalst, W. M. P. (2014). An Extensible Framework for Analysing Resource Behaviour Using Event Logs. In M. Jarke, J. Mylopoulos, C. Quix, C. Rolland, Y. Manolopoulos, H. Mouratidis, & J. Horkoff (Eds.), Advanced Information Systems Engineering (Vol. 8484, pp. 564-579). Thessaloniki, Greece: Springer International Publishing.
Randolph, J. J. (2009). A guide to writing the dissertation literature review. Practical Assessment, Research & Evaluation, 14(13), 2.

77
Reijers, H. A. (2003a). Design and control of workflow processes : business process management for the service industry (Vol. 2617). Berlin: Springer.
Reijers, H. A. (2003b). Heuristic Workflow Redesign Design and control of workflow processes: business process management for the service industry (Vol. 2617, pp. 207-243). Berlin: Springer.
Reijers, H. A., & Limam-Mansar, S. (2005). Best practices in business process redesign: an overview and qualitative evaluation of successful redesign heuristics. Omega, 33(4), 283-306. doi:10.1016/j.omega.2004.04.012
Smith, M., & Proctor, P. E. (2013). The Gartner business value model: a framework for measuring business performance. Retrieved from Gartner database website:
Tang, H., Chen, Y., & Lu, J. (2006). Architecture of process mining based business process optimization. Paper presented at the IET Conference Publications, Hangzhou, China.
van der Aalst, W., Adriansyah, A., de Medeiros, A., Arcieri, F., Baier, T., Blickle, T., . . . Wynn, M. (2012). Process Mining Manifesto. In F. Daniel, K. Barkaoui, & S. Dustdar (Eds.), Business Process Management Workshops (Vol. 99, pp. 169-194): Springer Berlin Heidelberg.
Vanderfeesten, I., Reijers, H. A., & van der Aalst, W. M. P. (2008). Evaluating workflow process designs using cohesion and coupling metrics. Computers in Industry, 59(5), 420-437. doi:10.1016/j.compind.2007.12.007
Vanwersch, R. J. B., Shahzad, K., Vanhaecht, K., Grefen, P. W. P. J., Pintelon, L. M., Mendling, J., . . . Reijers, H. A. (2011). Methodological support for business process redesign in health care: a literature review protocol. International Journal of Care Pathways, 15(4), 119-126.

78
Appendix A1: Overview of journal and conference articles with source
Various sources were consulted for this literature review. This appendix presents an overview of the
high-quality sources that have been used, i.e. journal articles from journals with an ISI impact factor of
at least 0.5; conference proceedings from conferences with an acceptance rate not higher than 25% or
book chapters.
Article Journal Impact
factor
1 (Adams & Neely, 2002) Financial management 1,000
2 (Bai & Sarkis, 2014) Supply Chain Management 3,500
3 (Beamon, 1999) International Journal of Operations &
Production Management
1,739
4 (Bititci et al., 1997) International Journal of Operations &
Production Management
1,739
5 (Bititci et al., 2000) International Journal of Operations &
Production Management
1,739
6 (Bititci et al., 2013) Production Planning and Control 1,466
7 (Jansen-Vullers et al., 2008) Information Systems Management 0,580
8 (Kaplan & Norton, 1992) Harvard Business Review 1,574
9 (Kennerley & Neely, 2003) International Journal of Operations &
Production Management
1,739
10 (Kloot & Martin, 2000) Management Accounting Research 2,125
11 (Kueng, 2000) Total Quality Management & Business
Excellence (formerly known as Total
Quality Management)
1,323
12 (Lebas, 1995) International Journal of Production
Economics
2,752
13 (Limam-Mansar, Reijers, & Ounnar, 2009) Expert Systems With Applications 2,240
14 (Marchand & Raymond, 2008) International Journal of Operations and
Production Management
1,739
15 (Martin & Patterson, 2009) International Journal of Production
Research
1,477
16 (Neely, 2005) International Journal of Operations and
Production Management
1,739
17 (Neely, Gregory, & Platts, 2005) International Journal of Operations and
Production Management
1,739
18 (Neely et al., 2000) International Journal of Operations and
Production Management
1,739
19 (Odiorne, 1987) Business Horizons 1,163
20 (Reijers & Limam-Mansar, 2005) Omega - International Journal Of
Management Science
4,376
21 (Vanderfeesten, Reijers, & van der Aalst, 2008) Computers in Industry 1,287
Article Conference Acceptance rate
22 (Jansen-Vullers et al.,
2007)
19th International Conference on Advanced Information
Systems Engineering (CAiSE'07)
13%
23 (Pika et al., 2014) 26th International Conference on Advanced Information
Systems Engineering (CAiSE'14)
18%
Chapter Book
24 (van der Aalst et al., 2012) Business process management workshops
25 (Leyer et al., 2015) Handbook on Business Process Management 2
26 (Brand & Van der Kolk, 1995) Werkstroomanalyse en -ontwerp: het logistiek vriendelijk ontwerpen
van informatiesystemen
27 (Reijers, 2003b) Design and control of workflow processes: business process
management for the service industry

79
Appendix A2: dimensions of the Devil’s quadrangle
This appendix gives the definition of the dimensions of the Devil’s quadrangle as used by Jansen-
Vullers et al. (2008):
Time is both a source of competitive advantage and a fundamental performance measure.
Analyzing performance on this dimension can be done by looking at lead time and throughput
time (consisting of service time, queue time, wait time, move time and setup time).
Cost is related to time, since time costs money (manual labor has an hourly rate, machine labor
has costs from e.g. machine depreciation and power consumed). Cost are also closely related
to quality, since poor quality causes costly rework, and to flexibility since a rigid process results
in a costly process execution. In the study, a distinction is made between running costs,
inventory costs, transport costs, administrative costs and resource utilization costs.
Quality can be considered as either external or internal quality. External quality indicates the
customer’s perception of quality, whereas internal quality is seen from within the
manufacturer’s side.
o Client satisfaction is the most important measure for external quality. This satisfaction
can be regarding the product (i.e. the output) or the process leading to the product.
Product quality takes product performance, conformance and serviceability into
account. Process quality considers information ability and bureaucratic language
simplification.
o The quality of the workflow, as seen from an operator’s point of view, is internal
quality. Job characteristics indicate high internal quality, additionally group and leader
factors influence motivation and job satisfaction.
Flexibility is the ability to react to changes. This dimension can be identified for individual
resources, individual tasks and for the process as a whole. Five types of flexibility are stated:
mix flexibility, labor flexibility, routing flexibility, volume flexibility and process modification
flexibility.
Operationalization of the dimensions is the most difficult for both quality dimensions since the large
number of factors influencing the quality perception, and the fact that it is more subject to subjective
rather than objective measures. Therefore, aspects of the dimension are listed and considered to be
proxies to lower subjectivity in this dimension. An important remark is that the impact cannot be
determined in a simulation model.

80
Appendix B: Design Science according to Wieringa
The structure for solving practical problems is the engineering cycle that is depicted in Figure 16. The
cycle starts with the problem investigation, next a treatment (or: solution) is designed, after which the
design is validated. Wieringa (2014) describes the usage of the engineering cycle to solve practical
problems in the following statement: “Design science research projects do not perform the entire
engineering cycle but are restricted to the design cycle. . . . In design science, only the first three tasks
of the engineering cycle are performed.”
The following checklist, also by Wieringa (2014), summarizes the design cycle. Question marks
indicate questions to be answered, exclamation marks indicate actions to be performed.
Figure 16: the engineering cycle (Wieringa, 2014)
Implementation Evaluation/Problem investigation • Who are the stakeholders? • How (in)different is this project to them? Why? (Reasons) • What are the stakeholder goals? Why? (Reasons) • What conceptual problem frameworks are in use? (Concepts, variables, components, architectures) • What conceptual problem framework will I use? • If an implementation is evaluated, what is the artifact and what is its context? • What are the phenomena? Why do they happen? (Causes, mechanisms, reasons) • What are their effects if nothing would be done about them? Do they contribute or detract from goals?
Solution Design • Specify requirements and context assumptions! • (Requirements x context assumptions) contribute to stakeholder goal? • Available treatments? • Design new ones!
Treatment Validation • (Artifact x context) produce effects? Why? (Mechanisms) What effects are produced by the interaction? How does the artifact respond to stimuli? What performance does it have in this context? • Effects satisfy requirements? Does the stimulus-response behavior satisfy functional requirements? Does the performance satisfy nonfunctional requirements? • (Alternative artifact x context) produce effects? Why? (Mechanisms) [Trade-offs for different artifacts] What effects do similar artifacts have in this context? How does the artifact perform in this context compared to similar artifacts? How do different versions of the same artifact perform in this context? • (Artifact x alternative context) produce effects? Why? (Mechanisms) [Sensitivity for different contexts] What effects are produced by the artifact in different contexts? What happens if the context becomes bigger/smaller? What assumptions does the design of the artifact make about its context?
81
Appendix C: Details on brainstorm sessions
The agenda of both brainstorm sessions was as follows:
1. Introduction of the research project the brainstorm is a part of
2. Introduction of the Devil’s quadrangle as performance measurement framework
3. Identifying performance indicators for P2P processes
4. Assigning performance indicators to the four performance dimensions
5. Evaluating the Devil’s quadrangle as a performance measurement framework
Details:
Brainstorm session 1
Date: Wednesday 18 November 2015
Time: 1 pm – 4 pm
Participants: 3 BTS consultants
Brainstorm session 2
Date: Monday 23 November 2015
Time: 10 am – 12 pm
Participants: 2 BTS consultants
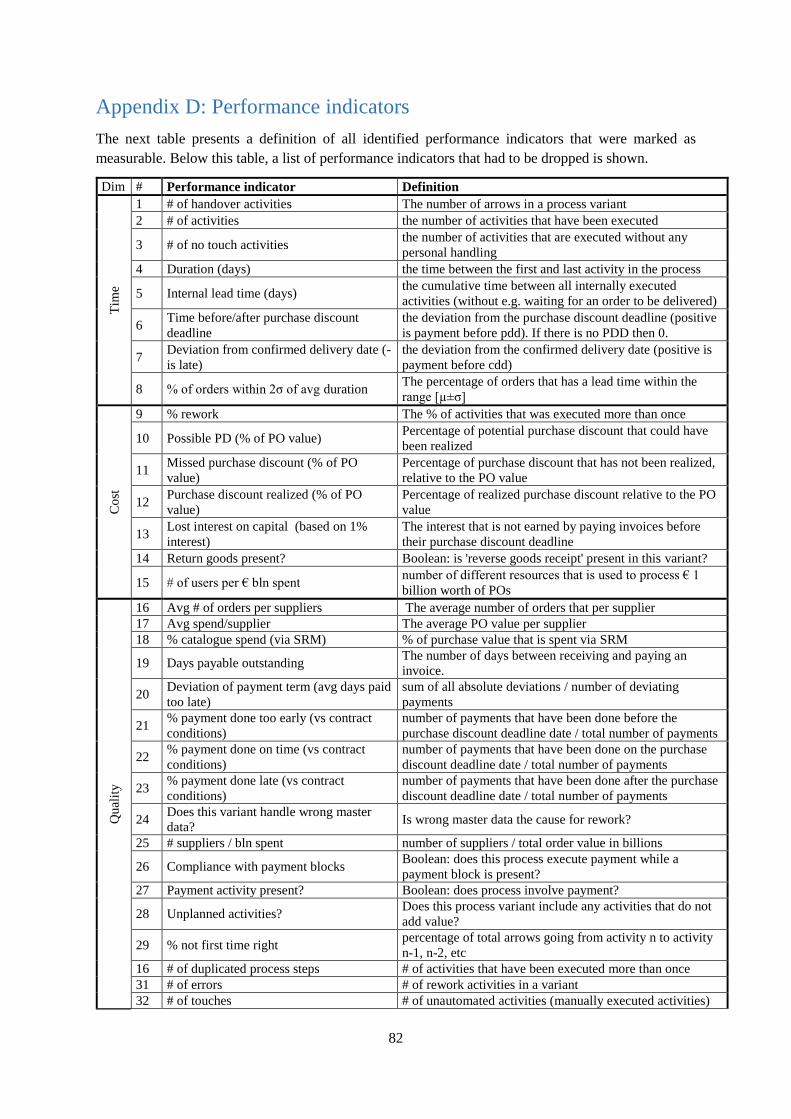
82
Appendix D: Performance indicators
The next table presents a definition of all identified performance indicators that were marked as
measurable. Below this table, a list of performance indicators that had to be dropped is shown.
Dim # Performance indicator Definition
Tim
e
1 # of handover activities The number of arrows in a process variant
2 # of activities the number of activities that have been executed
3 # of no touch activities the number of activities that are executed without any
personal handling
4 Duration (days) the time between the first and last activity in the process
5 Internal lead time (days) the cumulative time between all internally executed
activities (without e.g. waiting for an order to be delivered)
6 Time before/after purchase discount
deadline
the deviation from the purchase discount deadline (positive
is payment before pdd). If there is no PDD then 0.
7 Deviation from confirmed delivery date (-
is late)
the deviation from the confirmed delivery date (positive is
payment before cdd)
8 % of orders within 2σ of avg duration The percentage of orders that has a lead time within the
range [µ±σ]
Co
st
9 % rework The % of activities that was executed more than once
10 Possible PD (% of PO value) Percentage of potential purchase discount that could have
been realized
11 Missed purchase discount (% of PO
value)
Percentage of purchase discount that has not been realized,
relative to the PO value
12 Purchase discount realized (% of PO
value)
Percentage of realized purchase discount relative to the PO
value
13 Lost interest on capital (based on 1%
interest)
The interest that is not earned by paying invoices before
their purchase discount deadline
14 Return goods present? Boolean: is 'reverse goods receipt' present in this variant?
15 # of users per € bln spent number of different resources that is used to process € 1
billion worth of POs
Qu
alit
y
16 Avg # of orders per suppliers The average number of orders that per supplier
17 Avg spend/supplier The average PO value per supplier
18 % catalogue spend (via SRM) % of purchase value that is spent via SRM
19 Days payable outstanding The number of days between receiving and paying an
invoice.
20 Deviation of payment term (avg days paid
too late)
sum of all absolute deviations / number of deviating
payments
21 % payment done too early (vs contract
conditions)
number of payments that have been done before the
purchase discount deadline date / total number of payments
22 % payment done on time (vs contract
conditions)
number of payments that have been done on the purchase
discount deadline date / total number of payments
23 % payment done late (vs contract
conditions)
number of payments that have been done after the purchase
discount deadline date / total number of payments
24 Does this variant handle wrong master
data? Is wrong master data the cause for rework?
25 # suppliers / bln spent number of suppliers / total order value in billions
26 Compliance with payment blocks Boolean: does this process execute payment while a
payment block is present?
27 Payment activity present? Boolean: does process involve payment?
28 Unplanned activities? Does this process variant include any activities that do not
add value?
29 % not first time right percentage of total arrows going from activity n to activity
n-1, n-2, etc
16 # of duplicated process steps # of activities that have been executed more than once
31 # of errors # of rework activities in a variant
32 # of touches # of unautomated activities (manually executed activities)

83
Qu
alit
y
33 # of automated activities # of automatically processed activities
34 Payment block present? Boolean: does this variant include 'set payment block'?
35 Vendor timely delivery performance number of orders that meet CDD / number of orders
36 Double payments? Boolean: does this variant include more than one payment
handling?
Fle
xib
ilit
y
37 % of materials/products processed # of different items that is purchased/total items
38 # of vendors that can be processed # of different vendors that are processed/total vendors
39 # of order types that can be processed # of different document types that are processed/total types
40 % of cases handled in variant number of cases in variant / total number of cases
(=coverage)
41 # of changes number of 'change *' activities
42 # of processes total number of variants
43 Lead time / coverage lead time in days / case coverage of that variant
The following table shows the performance indicators that were identified but are unable to be measured
in Celonis (both currently unavailable and impossible to add to existing analyses within reasonable
efforts).
Dim. Performance indicator Reason for exclusion
Time Time needed to train new employees Data not available in SAP systems
Time to adapt process to organizational
changes
Data not available in SAP systems
Touch time per activity Data not available in SAP systems
Waiting time per handover activity Data not available in SAP systems
Costs Digital costs (TCO system/orders in period) Data not available in SAP systems
Training costs for employees Data not available in SAP systems
Least loss of added value Data not present in available source tables
Cost of IT infrastructure Data not present in available source tables
% 3 way invoice matching Data not present in available source tables
% purchasing cost of total spend Data not present in available source tables
% personnel cost of purchasing cost Data not present in available source tables
Cost per activity Data not available in SAP systems
Quality Education level of employees Data not available in SAP systems
% of orders spend via contract Data not present in available source tables
% of PO value spend via contract Data not present in available source tables
% maverick spend Data not present in available source tables
% dunned invoices Data not present in available source tables
SLA realization Data not present in available source tables
# of management touches Data not present in available source tables
% of E-invoices Data not present in available source tables
% of rework activities with rework duration
longer than original duration
Calculation not possible in Celonis
Flexibility Time to adapt to changes Data not available in SAP systems
Ability to complete process when defects
occur
Data not present in available source tables
# of different processing skills required to
execute a variant
Data not available in SAP systems

84
Appendix E: Overview of SAP tables and their relevant fields Table name SAP short description10 Used for this information/purpose
BKPF Accounting Document Header Invoice information
BSEG Accounting Document Segment Invoice information
CDHDR Change document header Change information
CDPOS Change document items Change information
DD07T Texts for Domain Fixed Values Creation indicator for purchase requisitions
EBAN Purchase Requisition Purchase requisition information
EKBE History per Purchasing Document Event information
EKKO Purchasing Document Header Purchase order information
EKPO Purchasing Document Item Purchase order information
LFA1 Vendor Master Vendor information
MAKT Material Descriptions Material (purchased items) information
RBKP Document Header: Invoice Receipt Invoice receipt information
RSEG Document Item: Incoming Invoice Linking table to avoid many-to-many relationships
T001 Company Codes Names of company codes
T008T Blocking Reason Names in Automatic
Payment Trans.
Indicator for payment block
T023T Material Group Descriptions Material group information
T024 Purchasing Groups Names of purchasing groups
T024E Purchasing Organizations Names of purchasing organizations
T161T Texts for Purchasing Document Types Indicator for origin of PO (e.g. SRM)
TCURR Exchange Rates Convert foreign currencies
TCURX Decimal Places in Currencies Convert foreign currencies
USR02 Logon Data Indicator for user types (e.g. manual/batch/system)
Figure 17: Dependencies between SAP tables
10 From http://www.sapdatasheet.org/, accessed on 29 February 2016

85
Appendix F: Prerequisite steps for process mining
The following plan consisting of 11 steps was executed to move from only having source tables to
have a Celonis installation up and running, with real data, and being able to get values for all the
defined Performance indicators.
1. A HANA data warehouse (for storing the source tables that needs to be mined) and application
server (for running Celonis) had to be created. This was done in an internal Infrastructure-as-a-
service (IaaS) marketplace called Monsoon, similar to e.g. Amazon Warehouse Services.
2. Celonis needed to be installed on the application server. Celonis runs on a local Tomcat server,
which was installed on the application server so that it can be accessed by anyone within the
SAP network and uses the computational power of the server, as running Celonis requires 8
CPUs to run smoothly.
3. The source tables (previously extracted from SAP systems by SAP and Celonis consultants)
had to be uploaded into a HANA data warehouse. Since these tables were extracted in a specific
format, they could be uploaded automatically through a separate tool. This tool also
automatically converted the tables from the extracted table structure into the HANA table
structure, allowing the tables to be edited in SAP HANA Studio, an application that gives access
to the table contents and allows creation, insertion and modification of tables through an SQL
console.
4. Once the tables are in HANA, activity, case and additional tables needed to be created, based
on the source tables that were loaded in step 3. The creation of these tables was done in the
SQL console, by selecting values from different tables to create activity paths and linking
additional information (e.g. vendor data, user-details and payment details). These tables are
used as the basis to mine the processes. The creation of the tables needs to be done manually
via SQL queries, since the configuration of the systems determines which release indicators
and which fields correspond to certain activities. Creating the queries therefore requires
knowledge of the configuration of the ERP system. The SQL queries were standardized for
creating standard activities but to append extra tables and fields, had to be created manually.
5. Once the activity table and case table were created, a preprocessing-procedure was ran. This
procedure created e.g. numerical case- and path keys and is necessary for further analysis.
6. Other tables, containing information about e.g. vendors and invoices had to be created. This
step quite closely resembles the creation of the activity table.
7. Two other procedures needs to be ran: a Meta table-procedure that is necessary to calculate
time-related measures, and a dictionary-procedure that gives the names of tables and columns
an understandable English (or German) label.
8. A duration table needs to be created, containing statistical data about the duration of each
variant, e.g. the standard deviation.
9. The created tables are now ready to be loaded into Celonis. After loading the tables, their
primary key needs to be defined, as well as a unique prefix. In order to link all tables together,
a number of so called foreign keys needs to be defined. Finally, a configuration step in which
the case table, activity table and process table are defined, including their relevant columns, had
to be performed.
10. Now, the process mining analysis could be created. The analysis was created in a so-called
document, containing multiple tabs. Elements on a tab can be linked, in such a way that filtering
on a certain time period in one element automatically makes the other elements display
information containing that filter. Creating elements needs to be done in a user-friendly GUI
that allows you to drag and drop different elements into a tab.

86
11. Finally, the identified performance indicators had to be programmed so that for each process
variant, the scores on these measures can be shown in Celonis. The programming language that
is used is Process Query Language (PQL), a variant of SQL that was created by Celonis.

87
Appendix G: Company and variant information
The companies that were assessed should remain anonymous but as they all have their respective
characteristics that could influence the performance, an anonymized overview of the companies is
presented in the following table.
Company Country Focus Industry Direct/Indirect materials
Company A 2 Quality 1 Direct
Company B 4 Costs 1 Direct
Company C 1 Costs 1 Indirect
Company D 3 Time 2 Indirect
Company E (validation) 1 Quality 1 Direct
As described in section 4.2, not just the five most occurring process variants have been used in the
surveys that were conducted. All variants were tested against two selection criteria: the number of
activities, which was already introduced in section 4.2, and the spread of executions of the last activity
of a variant over time.
The spread of the last executed activities for each variant relative to the total set of activities is the next
selection criterion. The spread of the last executed activity for each variant was analyzed and compared
to the entire dataset. Cases that had relatively more than 50% of last activities executed in the last 2
months of a data set were marked as unfinished and therefore excluded. Since payment terms can be 60
days, a goods receipt-activity in the last 2 months of the data set is likely to have a subsequent payment
activity that might appear outside the date range of the analyzed data set.
The explanation for the increasing percentage of last activity executions for all variants per month is
the following: data extraction was done in such a way that only activities that had a first activity after
the extraction date were included. Therefore, only cases that were both started and completed in the
first month, count for the execution of the first month. Cases that took place in the first and second
month, and had their last execution in the second month count for the second month, and so forth.
This appendix shows tables (see page 90-91) with both the number of activities and the relative number
of last activity executions for the most occurring variants of each company. The excluded variants are
marked in red, as well as the reason for their exclusion. Company A’s dataset included one variant that
had to be excluded because it only consisted of one activity, as shown in table 11. The five most
occurring variants from company B met all requirements and therefore none of them was excluded, see
table 12. For company C, shown in table 13, four variants were excluded since they violate the selection
criteria (one variant consisted of one activity, three variants violate the limit for relative occurrence).
Four variants were dropped from company D’s dataset, all because they violated the relative occurrence-
limit for the last two months, as shown in table 14.
A remark that has to be made is that over 70% of the cases in all data sets end with a payment activity,
which is also the most logical end activity as we are analyzing purchase-to-pay processes. None of the
excluded processes had the payment activity as final activity, but some of the included processes did
not end in the payment activity. This can for instance be explained by paying suppliers periodical, e.g.
every 3 months.

88
Table 12: Selected and excluded variants for company A
Company A
Var 5051 Var 4445 Var 4157 Var 483 Var 129 Var 5848 All variants
# of
activities 4 5 3 4 1 5
oct 4,47% 1,44% 8,31% 2,05% 8,52% 7,25% 4,14%
nov 8,63% 6,63% 7,39% 4,95% 7,06% 9,37% 6,94%
dec 7,68% 7,95% 4,71% 6,44% 4,82% 7,11% 6,48%
jan 3,04% 5,09% 6,56% 5,45% 5,23% 2,80% 4,86%
feb 3,03% 6,19% 6,95% 7,60% 6,56% 3,52% 5,54%
mar 9,67% 8,57% 9,80% 8,93% 8,44% 3,39% 8,27%
apr 10,24% 11,03% 9,03% 10,51% 8,17% 3,80% 8,43%
may 8,60% 8,94% 9,15% 8,86% 8,98% 9,61% 8,73%
jun 10,60% 9,44% 11,29% 10,48% 11,27% 10,86% 10,37%
jul 11,09% 10,03% 9,17% 10,65% 10,21% 14,12% 10,77%
aug 9,28% 8,45% 8,59% 7,98% 10,04% 9,67% 9,38%
sep 9,78% 9,35% 9,03% 10,06% 10,70% 11,06% 10,55%
oct 3,88% 6,87% 0,01% 6,02% 0,01% 7,43% 5,47%
nov 0,00% 0,00% 0,00% 0,00% 0,00% 0,00% 0,09%
Verdict Include Include Include Include Exclude Include
Table 13: Selected and excluded variants for company B
Company B
Var 79 Var 511 Var 1104 Var 37 Var 374 All variants
# of
activities 3 6 5 4 5
Jan 1,09% 0,33% 0,25% 0,59% 1,69% 1,29%
Feb 6,59% 4,98% 1,18% 2,78% 6,78% 4,22%
Mar 5,07% 21,76% 12,27% 15,11% 15,00% 10,63%
Apr 8,54% 20,27% 24,62% 22,11% 18,56% 14,98%
May 13,61% 10,05% 19,16% 18,82% 15,85% 14,73%
Jun 28,24% 26,58% 20,08% 21,43% 23,56% 25,29%
Jul 36,86% 16,03% 22,44% 19,16% 18,56% 28,87%
Verdict Include Include Include Include Include
Table 14: Selected and excluded variants for company C
Company C
Var 6 Var 37
Var
374 Var 277 Var 20 Var 7
Var
511 Var 79 Var 53
All
variants
# of
activities 1 4 5 4 3 2 6 3 5
Jan 8,20% 0,00% 0,34% 0,00% 0,00% 0,00% 0,00% 1,28% 16,67% 2,19%
Feb 9,12% 0,00% 1,55% 0,00% 0,00% 4,26% 2,02% 5,13% 5,56% 3,18%
Mar 10,76% 2,43% 5,00% 0,40% 0,00% 4,26% 12,12% 17,95% 61,11% 5,98%
Apr 11,37% 29,57% 12,93% 0,40% 0,00% 0,71% 14,14% 6,41% 11,11% 11,80%
May 10,76% 31,71% 22,93% 2,37% 0,00% 2,84% 26,26% 7,69% 5,56% 14,90%
Jun 17,11% 18,43% 27,76% 13,04% 11,21% 5,67% 23,23% 20,51% 0,00% 19,42%
Jul 32,68% 17,86% 29,48% 83,79% 88,79% 82,27% 22,22% 41,03% 0,00% 42,54%
Verdict Exclude Include Include Exclude Exclude Exclude Include Include Include

89
Table 15: Selected and excluded variants for company D
Company D
Var 103 Var 737 Var 1 Var 32 Var 18 Var 74 Var 428 Var 645
Var
794
All
variants
# of
activities 4 5 1 5 3 2 2 3 6
Sep 0,00% 0,00% 4,84% 0,00% 0,56% 0,00% 0,11% 0,31% 0,00% 0,52%
Oct 0,85% 0,62% 0,83% 0,00% 11,56% 0,00% 0,00% 0,61% 0,23% 1,09%
Nov 4,85% 3,57% 3,02% 8,16% 12,05% 0,62% 0,56% 1,23% 10,86% 3,65%
Dec 10,45% 5,86% 7,18% 15,55% 7,61% 4,33% 1,02% 5,82% 20,14% 8,11%
Jan 6,47% 14,64% 6,14% 4,84% 6,91% 0,62% 0,79% 0,46% 7,69% 5,95%
Feb 13,16% 16,89% 0,73% 5,10% 10,15% 0,52% 2,26% 0,77% 6,11% 9,86%
Mar 11,43% 8,39% 9,58% 8,67% 10,29% 1,44% 0,45% 3,06% 2,94% 8,02%
Apr 8,43% 8,19% 3,85% 8,86% 9,51% 2,27% 2,15% 1,53% 3,62% 6,22%
May 9,11% 7,34% 4,11% 10,01% 7,89% 4,64% 1,47% 1,99% 10,63% 7,28%
Jun 7,42% 7,96% 4,53% 15,23% 7,96% 2,68% 7,46% 9,80% 5,88% 7,73%
Jul 9,40% 11,96% 17,60% 8,86% 6,84% 15,98% 21,13% 18,22% 7,24% 11,60%
Aug 9,57% 7,84% 10,05% 6,31% 5,57% 17,22% 27,57% 40,74% 6,79% 13,01%
Sep 8,86% 6,75% 27,54% 8,41% 3,10% 49,69% 35,03% 15,47% 17,87% 16,96%
Verdict Include Include Exclude Include Include Exclude Exclude Exclude Include

90
Appendix H: Preview of a survey
COMPANY X
Dear participant,
This survey is part of a research projects that creates knowledge that supports performance evaluation of business
processes, based on mined processes (coming from Celonis Process Mining). This survey helps to build an
understanding of what performance indicators are relevant when assessing the performance of a process. To do
so, the Devil’s quadrangle will be used, which is a performance measurement framework that assesses
performance on four dimensions: cost, flexibility, time and quality. A short introduction of the devil’s quadrangle
is given below:
This framework is based on the four performance dimensions time, cost,
quality and flexibility. Ideally, a business process redesign decreases the
time required to handle a case, it lowers the required cost of executing the
process, it improves the quality of the service delivered, and it increases
the ability of the business process to deal with variation. The interesting
property of this framework is how it expresses that improving a process in
one dimension may have a weakening effect on another. For example, one
may decide to add a reconciliation activity to a business process to improve
the quality of the delivered service. Yet, this may backfire on the timeliness
of the service delivery. The ominous name of the framework refers to the
difficult trade-offs that sometimes have to be made. Awareness of these trade-offs is utterly important for effective
process redesign.11
Values on the measurement scale for each dimension translates into the following performance:
1 5 10
Long lead time and throughput time Short lead time and throughput time
High cost Low cost
Low quality High quality
Low flexibility High flexibility
1. Indicate which operations strategy most closely resembles the company’s operations strategy. An
operations strategy is a plan of action that describes how they will employ their resources in the
production of a product or service.
Time
Cost
Quality
Flexibility
2. Consider the process variants and their respective values on a list of performance indicators, coming
from your own P2P process (on pages 2 and 3), and rate each variant on the four dimensions, on a scale
from 1 to 10 (with 1 being the lowest possible value and 10 being the best possible performance on that
dimension). The mined processes are based on source tables covering 6 productive months.
Please note that:
a. The list continues on page 3.
11 Dumas, M., La Rosa, M., Mendling, J., & Reijers, H. A. (2013). Fundamentals of Business Process Management (pp 258-
259). Berlin: Springer.

91
b. On page 5, an explanation for all the used performance indicators is given.
c. SES is an abbreviation for a service entry sheet, which indicates the delivery of services.
d. Variant 1 might appear to be an incomplete variant (as payment is missing) but occurs frequently
throughout the entire dataset and is therefore a valid execution variant in this research scope.
e. The assessment of each dimension should be given on an absolute scale, so a value of 10 on the quality
dimension should indicate the highest quality possible, not relative to the other variants.
Please contact me if anything is unclear and do not proceed until all ambiguities are clarified.
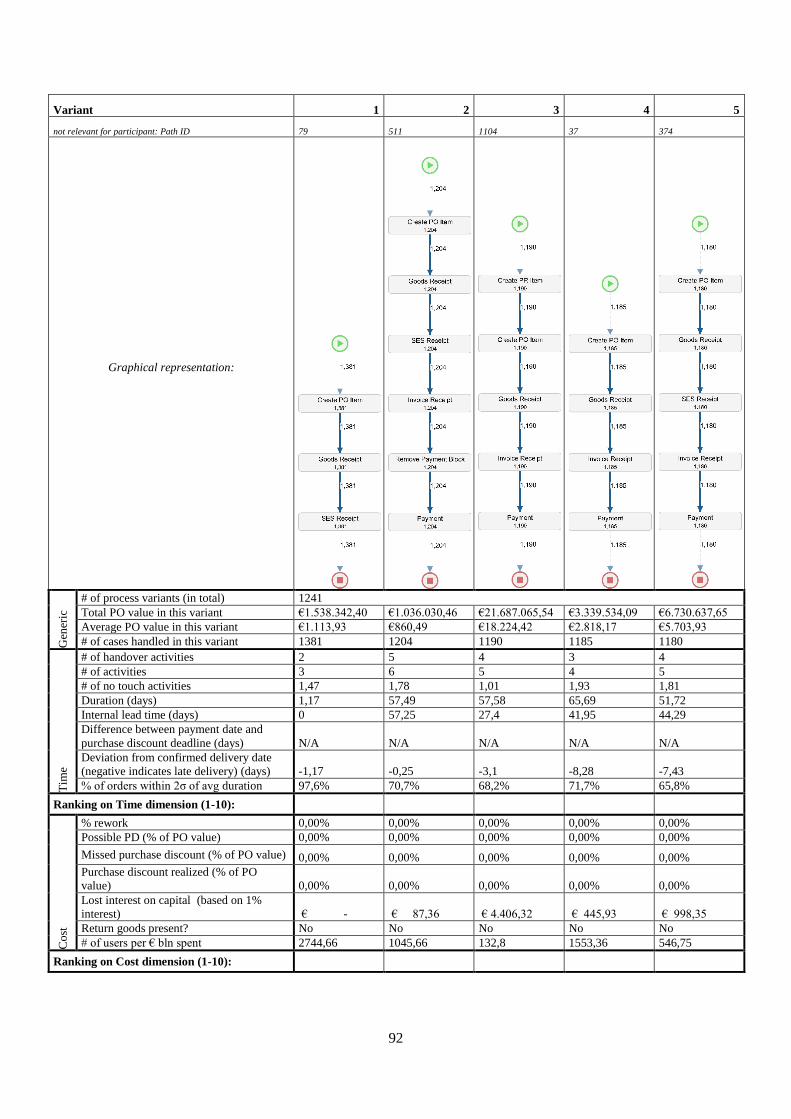
92
Variant 1 2 3 4 5
not relevant for participant: Path ID 79 511 1104 37 374
Graphical representation:
Gen
eric
# of process variants (in total) 1241
Total PO value in this variant €1.538.342,40 €1.036.030,46 €21.687.065,54 €3.339.534,09 €6.730.637,65
Average PO value in this variant €1.113,93 €860,49 €18.224,42 €2.818,17 €5.703,93
# of cases handled in this variant 1381 1204 1190 1185 1180
Tim
e
# of handover activities 2 5 4 3 4
# of activities 3 6 5 4 5
# of no touch activities 1,47 1,78 1,01 1,93 1,81
Duration (days) 1,17 57,49 57,58 65,69 51,72
Internal lead time (days) 0 57,25 27,4 41,95 44,29
Difference between payment date and
purchase discount deadline (days) N/A N/A N/A N/A N/A
Deviation from confirmed delivery date
(negative indicates late delivery) (days) -1,17 -0,25 -3,1 -8,28 -7,43
% of orders within 2σ of avg duration 97,6% 70,7% 68,2% 71,7% 65,8%
Ranking on Time dimension (1-10):
Co
st
% rework 0,00% 0,00% 0,00% 0,00% 0,00%
Possible PD (% of PO value) 0,00% 0,00% 0,00% 0,00% 0,00%
Missed purchase discount (% of PO value) 0,00% 0,00% 0,00% 0,00% 0,00%
Purchase discount realized (% of PO
value) 0,00% 0,00% 0,00% 0,00% 0,00%
Lost interest on capital (based on 1%
interest) € - € 87,36 € 4.406,32 € 445,93 € 998,35
Return goods present? No No No No No
# of users per € bln spent 2744,66 1045,66 132,8 1553,36 546,75
Ranking on Cost dimension (1-10):
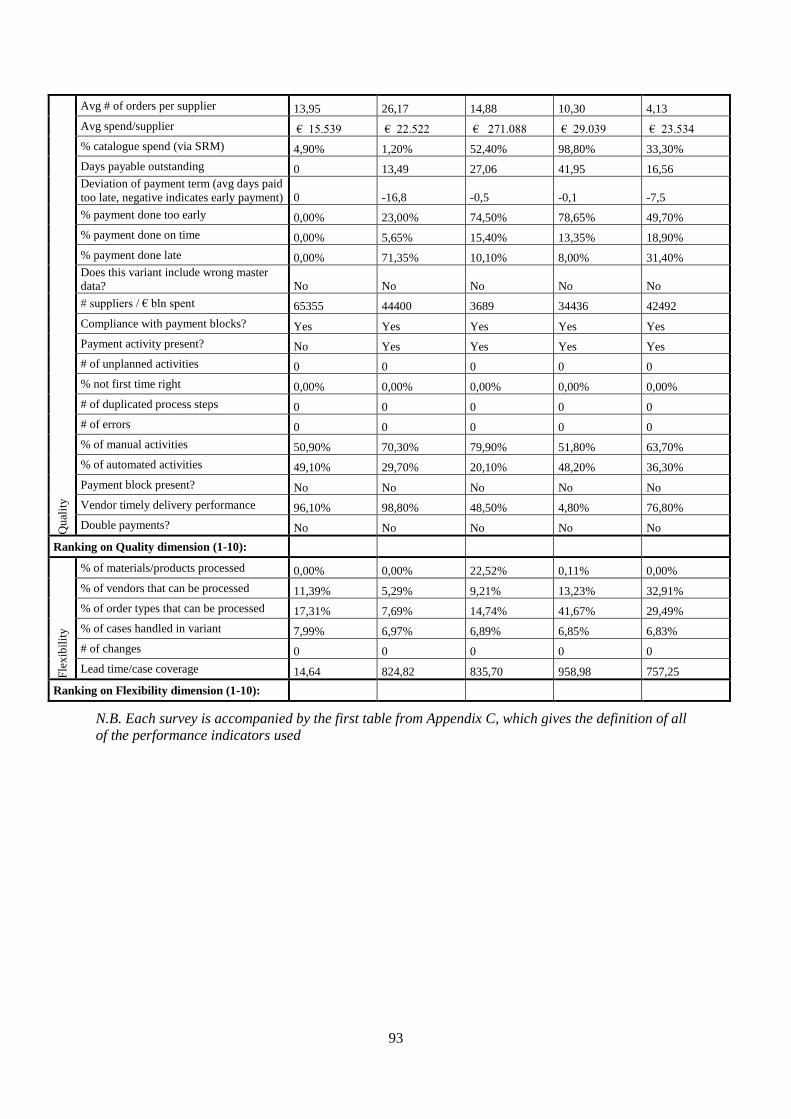
93
Qu
alit
y
Avg # of orders per supplier 13,95 26,17 14,88 10,30 4,13
Avg spend/supplier € 15.539 € 22.522 € 271.088 € 29.039 € 23.534
% catalogue spend (via SRM) 4,90% 1,20% 52,40% 98,80% 33,30%
Days payable outstanding 0 13,49 27,06 41,95 16,56
Deviation of payment term (avg days paid
too late, negative indicates early payment) 0 -16,8 -0,5 -0,1 -7,5
% payment done too early 0,00% 23,00% 74,50% 78,65% 49,70%
% payment done on time 0,00% 5,65% 15,40% 13,35% 18,90%
% payment done late 0,00% 71,35% 10,10% 8,00% 31,40%
Does this variant include wrong master
data? No No No No No
# suppliers / € bln spent 65355 44400 3689 34436 42492
Compliance with payment blocks? Yes Yes Yes Yes Yes
Payment activity present? No Yes Yes Yes Yes
# of unplanned activities 0 0 0 0 0
% not first time right 0,00% 0,00% 0,00% 0,00% 0,00%
# of duplicated process steps 0 0 0 0 0
# of errors 0 0 0 0 0
% of manual activities 50,90% 70,30% 79,90% 51,80% 63,70%
% of automated activities 49,10% 29,70% 20,10% 48,20% 36,30%
Payment block present? No No No No No
Vendor timely delivery performance 96,10% 98,80% 48,50% 4,80% 76,80%
Double payments? No No No No No
Ranking on Quality dimension (1-10):
Fle
xib
ilit
y
% of materials/products processed 0,00% 0,00% 22,52% 0,11% 0,00%
% of vendors that can be processed 11,39% 5,29% 9,21% 13,23% 32,91%
% of order types that can be processed 17,31% 7,69% 14,74% 41,67% 29,49%
% of cases handled in variant 7,99% 6,97% 6,89% 6,85% 6,83%
# of changes 0 0 0 0 0
Lead time/case coverage 14,64 824,82 835,70 958,98 757,25
Ranking on Flexibility dimension (1-10):
N.B. Each survey is accompanied by the first table from Appendix C, which gives the definition of all
of the performance indicators used

94
Appendix I: Conjoint-choice tasks
Choose for each comparison which profile represents a well performing P2P process, and enter
the number of that profile (or a 0 in case no profile performs well) in the table in the e-mail.
Each dimension can have a low, average or high value. A profile with a low value on all
dimensions is not the same as a profile with a high value on all dimensions, even though their
shape is similar (rectangular).
Comparison 1
Comparison 2
Comparison 3
Time
Cost
Quality
Flexibility
Profile 1
Profile 2
Profile 3
Time
Cost
Quality
Flexibility
Profile 1
Profile 2
Profile 3
Time
Cost
Quality
Flexibility
Profile 1
Profile 2
Profile 3
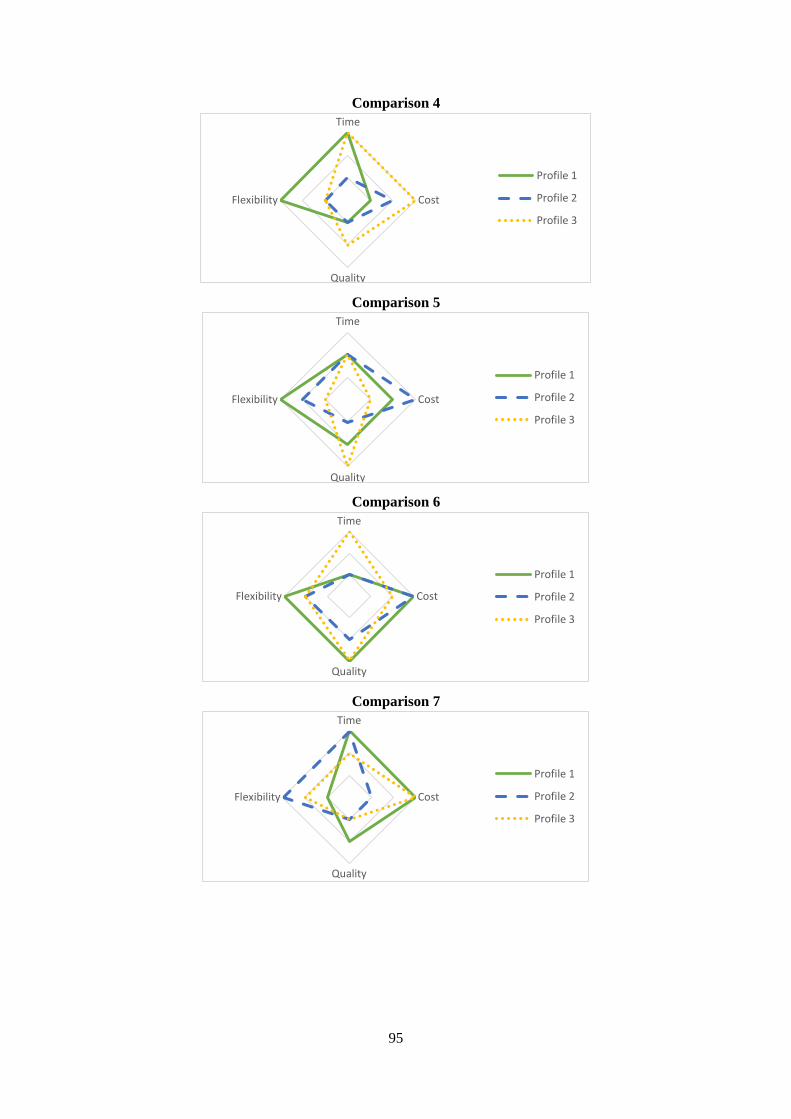
95
Comparison 4
Comparison 5
Comparison 6
Comparison 7
Time
Cost
Quality
Flexibility
Profile 1
Profile 2
Profile 3
Time
Cost
Quality
Flexibility
Profile 1
Profile 2
Profile 3
Time
Cost
Quality
Flexibility
Profile 1
Profile 2
Profile 3
Time
Cost
Quality
Flexibility
Profile 1
Profile 2
Profile 3

96
Comparison 8
Comparison 9
Comparison 10
Time
Cost
Quality
Flexibility
Profile 1
Profile 2
Profile 3
Time
Cost
Quality
Flexibility
Profile 1
Profile 2
Profile 3
Time
Cost
Quality
Flexibility
Profile 1
Profile 2
Profile 3
97
Appendix J: Regression results and diagnostics
This appendix contains more detailed results from the regression for each of the models. Based on these
tables, the models were tested against criteria for internal validity and the assumptions of normality,
heteroscedasticity and linearity stated by Field (2009). More specific, the following measures were
checked:
Adjusted R2 ≥ 0,25;
Significance ≤ 0,10;
VIF < 10 for each factor, average VIF per model ~ 1;
Outliers: ≤5% of cases within 2 and standard deviations ≤ 1% of cases within 2,5 standard
deviations from the predicted value;
Std Residual: absolute value < 3;
Cooks Distance < 1;
Centered Leverage Value: < 3(𝐾+1)
𝑁 with K = the number of predictors and N = the number of
observations;
The histogram should look like a normal distribution;
The dots on the P-P plot should follow the diagonal line;
The scatterplot should look like a random cloud of dots; especially not like a funnel or any non-
linear line; and
The cloud pattern of the residual plots should resemble a linear line.
Any remarkable observations or violations of the list stated above were noted in section 4.2.5 of the
thesis. In the following four subsections, a more elaborate output of the three best models for each
dimension is shown, including all measures necessary to test the all values against the thresholds stated
above.

98
Models for the time dimension
Dependent variable: assessment of the time dimension
Model 1 95,0% Confidence Interval for Model
1
Model 2
95,0%
Confidence Interval for
Model 2
Model 3
95,0%
Confidence Interval for
Model 3
B Sig. VIF Lower Bound
Upper Bound
B Sig. VIF Lower
Bound
Upper
Boun
d
B Sig. VIF Lower Bound
Upper Bound
Constant 10.032 0.000 8,369 11,694 100.015 0.000 8,261
11,742 11,234 0 7,720 14,747
End to end time
(days) -0.50 0.000 1,574 -,073 -,027 -0.058 0.000 1,392 -,081 -,035
Total number of execution
variants 4,00E-04 0.003 1,397 -,001 ,000 -0.0004 0.005 1,392 -,001 ,000
-5,24E-
04 0,02 2,049
-9,56E-
04
-9,20E-
05
Avg PO value -5,40E-05 0.049 1,219 ,000 ,000
-1,10E-04 0,007 1,216
-1,87E-04
-
3,34E-05
# of no touch
activities -1,676 0,018 2,053 -3,031 -0,322
Deviation from CDD 0,029 0,07 1,201 -0,003 0,060
F 11.138 0.000 13.289 0.000 4.016 .017
N (observations) 35 35 23
Adjusted R2 (R2) 0.472 (0,519) 0.42 (0,454) 0,354 (0,472)
Casewise Diagnosticsa
Model Case
Number Case label
Std.
Residual
Assessment
of Time-
dimension
Predicted
Value Residual
1 17 MM_C374 2,621 9 5,04 3,956
18 MM_C511 2,009 8 4,97 3,032
2 17 MM_C374 2,391 9 5,22 3,785
3 14 ML_C79 2,616 9 4,63 4,367
a. Dependent Variable: Assessment of Time-dimension
Residual statistics
Model 1 Model 2 Model 3
Min Max Min Max Min Max
Std. Residual -1,346 2,621 -1,692 2,391 -1,737 2,616
Cook's Distance ,000 ,138 ,000 ,151 ,000 ,504
Centered Leverage Value ,009 ,283 ,004 ,189 ,024 ,300
a. Dependent Variable: Assessment of Time-dimension
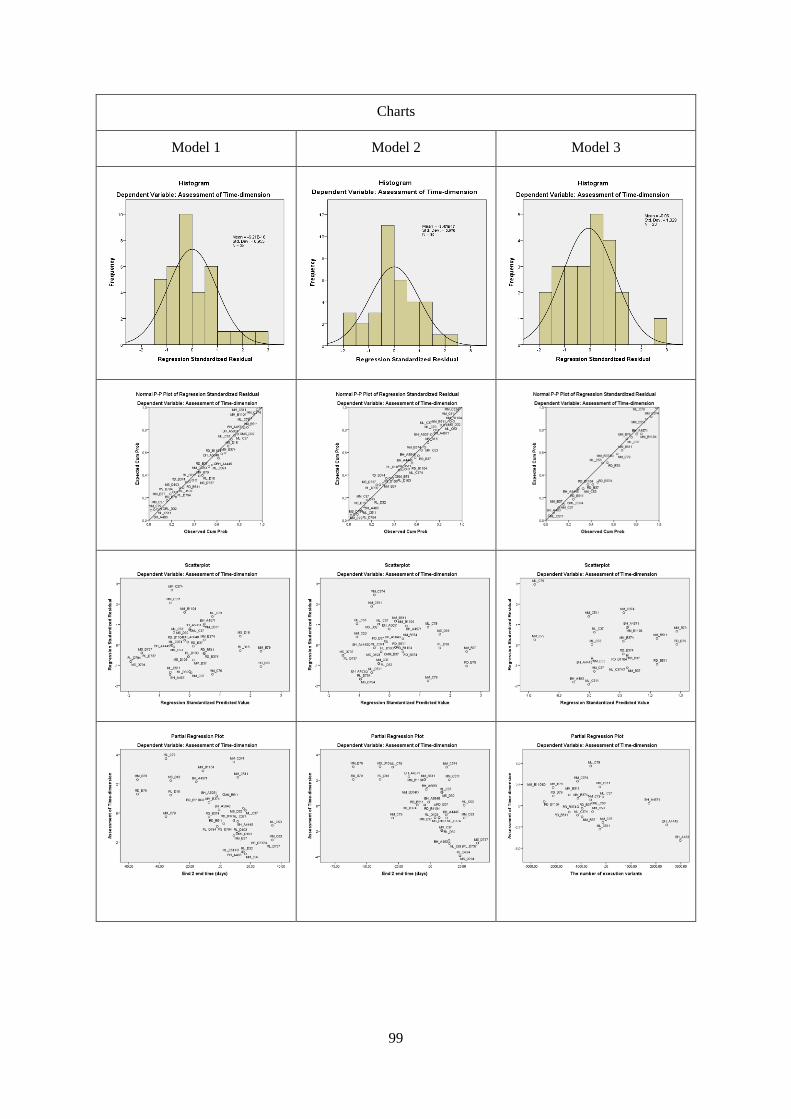
99
Charts
Model 1 Model 2 Model 3

100

101
Models for the cost dimension
Dependent variable: assessment of the cost dimension
Model 1 95,0% Confidence Interval for Model
1
Model 2 95,0% Confidence Interval for Model
2
Model 3
95,0%
Confidence Interval for
Model 3
B Sig. VIF Lower
Bound
Upper
Bound
B Sig. VIF Lower
Bound
Upper
Bound
B Sig. VIF Lower
Bound
Upper
Bound
(Constant) 10,487 ,000 8,701 12,273 9,581 ,000 7,632 11,529 10,100 0 8,066 12,134
log users/bln -1,520 ,000 1,003 -2,077 -,964 -1,171 ,000 1,329 -1,765 -,577 -1,476 0,000 1,000 -2,115 -,837
Missed PD (% of
PO value)
-
155,336 ,004 1,003 -255,316 -55,357
Lost interest (% of
total PO value)
-
628,403 ,083 1,433 -1343,056 86,249
Create PR activity
present? 1,628 ,072 2,254 -,154 3,410
Possible PD (% of
PO value)
-
146,001 ,001 1,962 -231,110 -60,891
F 19,944 0 11,7660 0 26,3960 0
N (observations) 30 35 35
Adjusted R2 (R2) 0,566 (0,596) 0,559 (0,611) 0,428 (0,444)
Casewise Diagnosticsa
Model Case Number Case label Std. Residual
Assessment of Time-
dimension Predicted Value Residual
1
12 ML_C374 -2,295 3 6,53 -3,533
15 ML_C53 2,188 7 3,63 3,368
2 12 ML_C374 -2,177 3 6,38 -3,380
3
15 ML_C53 2,010 7 3,44 3,555
30 BH_A5848 -2,312 2 6,09 -4,091
a. Dependent Variable: Assessment of the cost dimension
Residual statistics
Model 1 Model 2 Model 3
Min Max Min Max Min Max
Std. Residual -2,295 2,188 -2,177 1,822 -2,312 2,010
Cook's Distance ,000 ,207 ,000 ,133 ,000 ,213
Centered Leverage Value ,003 ,695 ,016 ,460 ,000 ,185
a. Dependent Variable: Assessment of the cost dimension

102
Charts
Model 1 Model 2 Model 3

103

104
Models for the quality dimension
Dependent variable: assessment of the quality dimension
Model 1
95,0%
Confidence Interval for Model
1
Model 2 95,0% Confidence Interval for Model
2
Model 3 95,0% Confidence
Interval for Model 3
B Sig. VIF Lower
Bound
Upper
Bound
B Sig. VIF Lower
Bound
Upper
Bound
B Sig. VIF Lower
Bound
Upper
Bound
(Constant) 2,797 0,01 ,727 4,867 6,770 0.000 4,781 8,758
7,42
5
0.00
0 5,466 9,385
Avg
spend/supplier
-3,26E
-09 0,06
1,27
0 ,000 ,000
-3,263E-
09 0,060
1,27
2 ,000 ,000
% payment done late 2,158
0,014
1,076 ,466 3,850 2,158 0,014
1,076 ,464 3,851
1,742
0,047 1,005 ,024 3,460
% of automated
activities 3,968
0,03
7
1,54
0 ,267 7,668
Vendor timely delivery
performance 1,935
0,03
5
1,44
2 ,145 3,726 1,934 0,036
1,44
5 ,141 3,728
2,45
6
0,00
9 1,310
0,66314
9 4,249479
% manual
activities -3,971 0,038
1,543 -7,695 -,247
-
5,344
0,005 1,313 -8,94999 -1,73711
F 5,303 0,00
3
5,2830 0,003 5,20
8
0,00
6
N (observations) 31 31 31
Adjusted R2 (R2) 0,365 (0,449) 0,363 (0,448) 0,296 (0,367)
Casewise Diagnosticsa
Model Case
Number Case label
Std.
Residual
Assessment
of quality
dimension
Predicted
Value Residual
1 9 MM_B37 -2,112 2 4,98 -2,975
2 9 MM_B37 -2,112 2 4,98 -2,978
3 17 MM_C374 2,050 9 5,96 3,039
a. Dependent Variable: Assessment of quality dimension
Residuals Statisticsa
Model 1 Model 2 Model 3
Min Max Min Max Min Max
Std. Residual -2,112 1,937 -2,112 1,933 -1,966 2,050
Cook's Distance ,000 ,108 ,000 ,109 ,000 ,289
Centered Leverage Value ,029 1,088 ,029 1,088 ,028 ,208
a. Dependent Variable: Assessment of the quality dimension

105
Charts
Model 1 Model 2 Model 3

106

107
Models for the flexibility dimension
Dependent variable: assessment of the flexibility dimension
Model 1
95,0%
Confidence Interval for
Model 1
Model 2
95,0%
Confidence Interval for
Model 2
Model 3
95,0%
Confidence Interval for
Model 3
B Sig. VIF Lower
Bound
Upper
Bound
B Sig. VIF Lower
Bound
Upper
Bound
B Sig. VIF Lower
Bound
Upper
Boun
d
(Constant) 11,739 ,000 7,798 15,680 4,497 ,000 2,982 6,012 10,660 0 6,230
15,091
% of cases
handled in variant
Squared -39,876 ,002 1,347
-
63,771 -15,981
-
23,3344
1 ,050 1,129 -46,700 ,031 -25,657 0,052 1,215 -51,522 ,209
Relative
percentage in this
variant (5 variants = 100%) 4,365 ,000 1,347 2,089 6,641 4,054 ,003 1,497 1,491 6,618 2,592 0,039 1,201 ,142 5,042
'Create PR Item'
activity present? -2,23 0 1,344 -3,345 -1,115 -1,35054 ,029 1,363 -2,550 -,151
% of order types that can be
processed INV -7,207 0,005 1,470
-
12,011 -2,403 -5,718 0,037 1,404 -11,071 -0,365
'Goods Receipt'
activity present? 1,65642 ,042 1,193 ,063 3,250
The number of
execution variants
2,47E-
04 0,021 1,047 -0,0005
-
0,000
04
F 8,402 0.000 6,4320 0,001 4,7370 0,004
N (observations) 35 35 35
Adjusted R2 (R2) 0,465 (0,528) 0,390 (0,462) 0,305 (387)
Casewise Diagnosticsa
Model Case Number Case label Std. Residual
Assessment of Time-
dimension Predicted Value Residual
1 -
2 -
3 22 MS_D737 -2,318 5 8,33 -3,325
a. Dependent Variable: Assessment of the flexibility dimension
Residual statisticsa
Model 1 Model 2 Model 3
Min Max Min Max Min Max
Std. Residual -1,946 1,733 -1,608 1,826 -2,318 1,610
Cook's Distance ,000 ,241 ,000 ,236 ,000 ,350
Centered Leverage Value ,023 ,391 ,021 ,387 ,007 ,394
a. Dependent Variable: Assessment of the flexibility dimension

108
Charts
Model 1 Model 2 Model 3

109

110
Appendix K: External validation
In this appendix, data used for validating the different models for each dimension is shown. First, the
table shows the 95% confidence intervals and expected value for three models, for the five process
variants, as well as the performance according to the respondents. From this table, the MAPE was
calculated, as well as the number of responses within the 95% confidence interval for that model. The
results are shown in section 6.1 of the thesis.
Time
Variant 1 Variant 2 Variant 3 Variant 4 Variant 5
L(X)a E(X)b H(X)c L(X) E(X) H(X) L(X) E(X) H(X) L(X) E(X) H(X) L(X) E(X) H(X)
Model 1 0,07 4,64 9,20 -8,96 0,39 9,68 3,98 7,31 10,63 4,02 7,09 10,16 1,39 5,36 9,32
Model 2 0,24 4,41 8,65 2,21 5,66 9,12 5,03 7,68 10,34 3,61 6,67 9,73 1,07 4,84 8,63
Model 3 3,76 8,44 13,14 -12,92 -1,19 10,54 5,18 9,74 14,29 7,52 10,58 13,65 6,89 10,75 14,60
Response 1 5,00 5,00 6,00 8,00 4,00
Response 2 7,00 7,00 1,00 8,00 5,00
Cost
Variant 1 Variant 2 Variant 3 Variant 4 Variant 5
L(X) E(X) H(X) L(X) E(X) H(X) L(X) E(X) H(X) L(X) E(X) H(X) L(X) E(X) H(X)
Model 1 3,34 6,56 9,78 4,39 7,33 10,27 3,22 6,48 9,73 1,88 5,49 9,11 1,38 5,13 8,88
Model 2 2,52 8,00 13,47 3,79 7,07 10,34 2,82 8,12 13,42 1,08 7,08 13,08 1,09 7,00 12,92
Model 3 2,61 6,29 9,97 3,67 7,03 10,39 2,49 6,21 9,93 1,12 5,25 9,38 0,61 4,90 9,18
Response 1 6,00 7,00 6,00 5,00 5,00
Response 2 5,00 5,00 2,00 8,00 6,00
Quality
Variant 1 Variant 2 Variant 3 Variant 4 Variant 5
L(X) E(X) H(X) L(X) E(X) H(X) L(X) E(X) H(X) L(X) E(X) H(X) L(X) E(X) H(X)
Model 1 1,02 4,41 7,79 1,09 4,74 8,39 0,73 2,81 4,90 0,95 3,90 6,85 1,14 4,72 8,30
Model 2 -2,54 4,41 11,36 -2,39 4,74 11,87 -2,88 2,81 8,51 -2,69 3,90 10,50 -2,47 4,72 11,91
Model 3 -3,25 3,57 10,39 -3,18 3,82 10,82 -3,45 2,10 7,65 -3,45 3,01 9,47 -3,43 3,64 10,71
Response 1 6,00 7,00 5,00 7,00 5,00
Response 2 8,00 8,00 1,00 5,00 5,00
Flex
Variant 1 Variant 2 Variant 3 Variant 4 Variant 5
L(X) E(X) H(X) L(X) E(X) H(X) L(X) E(X) H(X) L(X) E(X) H(X) L(X) E(X) H(X)
Model 1 -51,37 -22,40 6,58 -148,71 -81,63 -14,55 -185,74 -104,20 -22,66 -291,63 -167,86 -44,09 -147,74 -81,54 -15,34
Model 2 1,14 6,82 12,50 3,29 6,85 10,41 0,62 3,68 6,74 0,63 5,18 9,73 0,56 3,50 6,44
Model 3 -47,33 -14,49 15,85 -138,33 -63,57 11,20 -169,31 -79,67 9,97 -266,85 -130,14 6,56 -134,20 -61,65 10,90
Response 1 8,00 6,00 5,00 4,00 6,00
Response 2 6,00 7,00 2,00 3,00 8,00
a L(X) = lower bound of the 95% confidence interval for value X; b E(X) = Expected value; c H(X) = Higher bound of the 95% confidence interval for value X