Embed Size (px)
Citation preview

Volume 5 No 2 (2015) | ISSN 2158-8708 (online) | DOI 10.5195/emaj.2015.66 | http://emaj.pitt.edu
Evaluating Banking Profit Performance in Ghana during and post Profit Decline: A Five Step Du-Pont Approach
Baah Aye Kusi University of Ghana, Ghana | e-mail: [email protected]
Kwadjo Ansah-Adu Valley View University, Ghana | e-mail: [email protected]
Albert Agyei Valley View University, Ghana | e-mail: [email protected]
Volume 5 No 2 (2015) | ISSN 2158-8708 (online) | DOI 10.5195/emaj.2015.79 | http://emaj.pitt.edu |
Abstract
In this study we aimed at three objectives. First, identify and rank banks based on a composite score comprising of all five du-pont variables. Second, we identify variables in the five step du-pont set up that are most likely to influence bank ROE during and post profit declining periods. And third, we estimate a model to capture the variables that drive bank ROE during and post profit declining periods. We first establish from our rankings that, foreign banks in Ghana performed better during profit declining periods while the local banks performed better in post profit decline periods using the top ten banks as a benchmark in both periods. Employing Pearson correlation coefficients matrix, we recognized that operating profit margin, asset turnover and leverage were most likely to influence bank ROE in both time periods. We further employ OLS regression and find that bank ROE was impacted by operating profit margin and leverage during profit declining periods and post profit decline while tax effect added up in post profit declining periods.
Keywords: Du-Pont Model, Operating Profit Margin, Asset Turnover, Leverage, Interest Burden, Tax Effect
New articles in this journal are licensed under a Creative Commons Attribution 3.0 United States License.
This journal is published by the University Library System of the University of Pittsburgh as part of its D-Scribe Digital Publishing Program, and is cosponsored by the University of Pittsburgh Press.

Volume 5 No 2 (2015) | ISSN 2158-8708 (online) | DOI 10.5195/emaj.2015.79 | http://emaj.pitt.edu
Baah Aye Kusi, Kwadjo Ansah-Adu, Albert Agyei Emerging Markets Journal | P a g e |29
Evaluating Banking Profit Performance in Ghana during and post Profit Decline: A Five Step Du-Pont Approach
Baah Aye Kusi Kwadjo Ansah-Adu Albert Agyei
1. Introduction
Traditional accounting ratios have gained much popularity among academics and policy makers despite the challenges that confront its usage (Altman, 1968). It is argued that ratio analyses are one dimensional and do not show a holistic picture of the financial health of a business and it is also said to be backward looking as it is computed based on past financial records (see Altman, 1968). Despites these criticism and many more, ratio analysis remains one of the most popular, easy and fastest way among practitioners in assessing the financial health of corporate entities for further evaluation. Gill (1994) argues that the continuous and persistent evaluation of the financial health of corporate entities is imperative for firm stability and success and this can be achieved through the use of the Du-Pont ratio analysis. Hence, the Du-Pont ratio analysis initiated by Donaldson Brown in 1914 has gained much attention among the ratio family as it explains return on equity (ROE) as a function of three ratios overcoming the problem one dimensionality of ratios. The Du-Pont ratio analysis initially explained return on equity to emanate from three (3) sources namely profit margin (PM), asset turnover (ATO) and financial leverage (FL). This decomposition broadly represented operation efficiency, asset utilization and equity multiplier effect (Moyer et al., 2007, Ross et al., 2008).
However, Hawawini and Viallet (1999) presented modification to the Du-Pont model. This modification resulted in the five step Du-Pont which explained ROE as a function of five different ratios that combining to explain ROE in an attempt to overcome the shortcomings of the three step Du-Pont ratio. In the five step Du-Pont ratio analysis, Hawawini and Viallet (1999) admit that annual financial statements of firms are not only useful to managers, but also to creditors and tax agencies in making operational and financial decisions. Hence, the three step
Du-Pont did not capture cost of debts (creditor reward) and tax effects (government reward) as conditions that affect return on equity. These setbacks highlighted above led to the development of an expanded, five-step model of Du-Pont analysis, which breaks down the net profit margin even further to assess the impact of higher borrowing costs associated with increased leverage (Brigham and Houston, 2001).
The five step Du-Pont explains that, where companies have high cost of borrowing, their interest expense on more debt could offset the positive effects of increased leverage. In addition, interest expenses for most companies are non-tax-deductible, so the extended model considers interest charges and the company’s tax burden (Soliman, 2008;
Richardson et al., 2006; Ross et al., 2008; McClure, 2005). We are further fascinated about the five step Du-Pont as it is able to capture both industry and macroeconomic level variables (see Nissim & Penman, 2001; Fairfield and Yohn, 2001; Ge and Soliman 2007). Despite the five step Du-Pont ratio analysis overcoming the challenge of one dimensionality to explain ROE as coming from five different factors, we cite no study that employs the five step Du-Pont ratio analysis in empirical studies. However, we cited some studies that have used the three step Du-Pont ratio analysis in empirical studies (see Moss, Mishra and Dedah, 2009; Moss et al., 2009; Selvarasu et al., 2010; Weeden and Langemeier, 2008). We however cite Liesz (1999) who employed all the five variables in the five step Du-Pont ratio, but substituted equity multiplier with equity turnover.
The Du-Pont ratio analysis is employed to investigate the profitability of banks in Ghana, because ROE which indicates the return to equity holders kept declining from 2003, until it began to rise from 2009 till 2013. Hence, the purpose of this study is in two folds. First, identify and rank banks using the variables of the five step Du-Pont model and second, the study estimates the driver of ROE during its declining and rising periods.
2. The Du-Pont Model
Traditional financial ratios have gained much acceptability among financial analysts, lenders and academic researchers (Osteryoung & Constand, 1992; Devine & Seaton, 1995; or Burson, 1998). However, popularity of the Du-Pont began in 1981 four year after Donaldson Brown was hired by the Du-Pont Corporation. At this period, ROA maximization was the sole aim of financial managers (Blumenthal, 1998). Donaldson Brown identified the mathematical relationship that existed between two commonly computed ratios, namely net profit margin (obviously a profitability from
Volume 5 No 2 (2015) | ISSN 2158-8708 (online) | DOI 10.5195/emaj.2015.79 | http://emaj.pitt.edu
Evaluating Banking Profit Performance in Ghana during and post Profit Decline: A Five Step Du-Pont Approach
Page |30| Emerging Markets Journal
operating activities) and total asset turnover (an efficiency measure), and ROA (net income / sales) x (sales / total assets) = (net income / total assets). Once this was identified, it named the two step Du-Pont and led the improvement of a system of planning and control for all operating decisions in a firm (Blumenthal, 1998). Gitman (1998) suggests that, the sole aim of financial managers was modified and changed from ROA maximization to ROE maximization (that is equity or shareholder value maximization). Hence, the original Du-Pont (ROA) was also modified to suit the corporate goal, shareholder (ROE) maximization. The maximization of shareholder value (ROE ratio) was decomposed as emanating from net operating margin (profit from operating activities), asset turnover (efficient usage of assets) and additional leverage (usage of debts). This was named as the three step Du-Pont and expressed as ROE = (net income / sales) x (sales / total assets) x (total assets / equity). This remained as the most popular Du-Pont model until when the interest of creditors and the tax agencies (government) began a concern for corporate entities. Hence, the three step Du-Pont did not capture the effect of cost of debts (interest burden) and tax effects of a firm (Hawawini and Viallet, 1999). Consequently, the five step Du-Pont model was initiated to capture these effects and was expressed as ROE = (EBIT / sales) x (sales / invested capital) x (EBT / EBIT) x (invested capital / equity) x (EAT / EBT). The five step Du-Pont model argues that ROE is also affected by cost of debts and the tax requirements enforced the domain of the firm (Hawawini and Viallet, 1999).
3. Empirical Review
Penman (2001) shows that, although ROE can be mechanically increased through leverage (assuming positive spread), the increase in the discount rate results in no change in equity value. Fairfield and Yohn (2001) were the first to address the question of future predictive power and found that ATO is positively associated with future changes in return on net operating assets (RNOA), but that level of PM and ATO have no predictive value. This result is intuitive because the levels of PM and ATO are more informative toward a firm’s operating structure or industry membership (Ge and
Soliman 2007). Further, increases in ATO indicate that the firm’s ability to generate sales from a given investment has increased and this is an indicator of future efficiency of generating sales from assets. Thus, this type of increase in profitability tends to persist. Collins (2010) used a general form of the Du-Pont expansion to develop a model of optimal debt, which emphasizes the choice of equity.
In order to effectively evaluate operational managers, Nissim and Penman (2001) suggest using a modified version of the traditional Du-Pont model in order to eliminate the effects of financial leverage and other factors that are not under the control of those managers. Using operating income to sales and asset turnover based on operating assets limits the performance measure of management to those factors over which management has the most control. The modified Du-Pont model has become widely recognized in the financial analysis literature. See, for example, Pratt & Hirst (2008), Palepu & Healy (2008), and Soliman (2008). Liesz (1999) determined that, the failure of small business is always a debate topic by using the financial statement of small firms. OPM, Equity turnover, cost ratio, structure ratio, and tax ratio are considered. Du-Pont techniques have been used. The result shows that, poor financial planning and control rank are the reasons of business failure. Weeden and Langemeier (2008) investigated the performances of different age farmers by using continuous data of 2002 to 2006. Profit margin, asset turnover, financial leverage, ROE and capital gain were considered. T test techniques had been used. The result showed tha,t performance of older farmer was lower than younger farmers. Little et al. (2009) investigated and compared the performance of retail firms by selecting 111 retail firms for years 2006-2009. Retail strategy, recession, differentiation, cost leadership and Du-Pont methods were considered. ANOVA techniques had been used. The result showed that differentiation firms (profit margin is high and asset turnover is low) outperform cost leadership firms (profit is low and asset turnover is high). Moss et al. (2009) investigated the effect of ROE on Agriculture by using USDA data from 1960 to 2004. Profit margin, asset turnover and financial leverage were considered. Correlation techniques had been used. The result showed ROE effect of regional and national level. Selvarasu et al. (2010) investigated those strategies for humanizing the performance of a medium volume Indian Apparel Company by using annual and financial report of 2007. ROE, profit margin, asset turnover and financial leverage were considered. SPM techniques had been used. The result showed that, company success depend upon two things: Increasing sales and decreasing expense. Herciu et al. (2011) found out that, most profitable companies are not necessarily most attractive for investors by using annual reports of 20 companies for 2009. Profit margin, ROE, ROS, ROA, financial leverage and Du-Pont model were considered. Du-Pont model techniques had been used. The result showed that, the ranking relied on factors like ROE,

Volume 5 No 2 (2015) | ISSN 2158-8708 (online) | DOI 10.5195/emaj.2015.79 | http://emaj.pitt.edu
Baah Aye Kusi, Kwadjo Ansah-Adu, Albert Agyei Emerging Markets Journal | P a g e |31
ROS, ROA and financial leverage. Abdoli et al. (2011) investigated the comparison of DEA and Du-Pont model by using 13 financial ratios. AHP, DEA and Du-Pont models were considered. Correlation techniques had been used. The result showed that there is weak correlation between DEA and Du-Pont model. Alaghi (2010) investigated the effect of financial leverage on systematic risk by using data of listed companies of Tehran stock exchange. Financial leverage, capital structure, systematic risk, operating leverage, earnings per share (EPS), and earnings before interest and taxes (EBIT) were considered. Regression techniques had been used. The result emphasized on financial leverage-systematic risk relationship. 4. Methodology
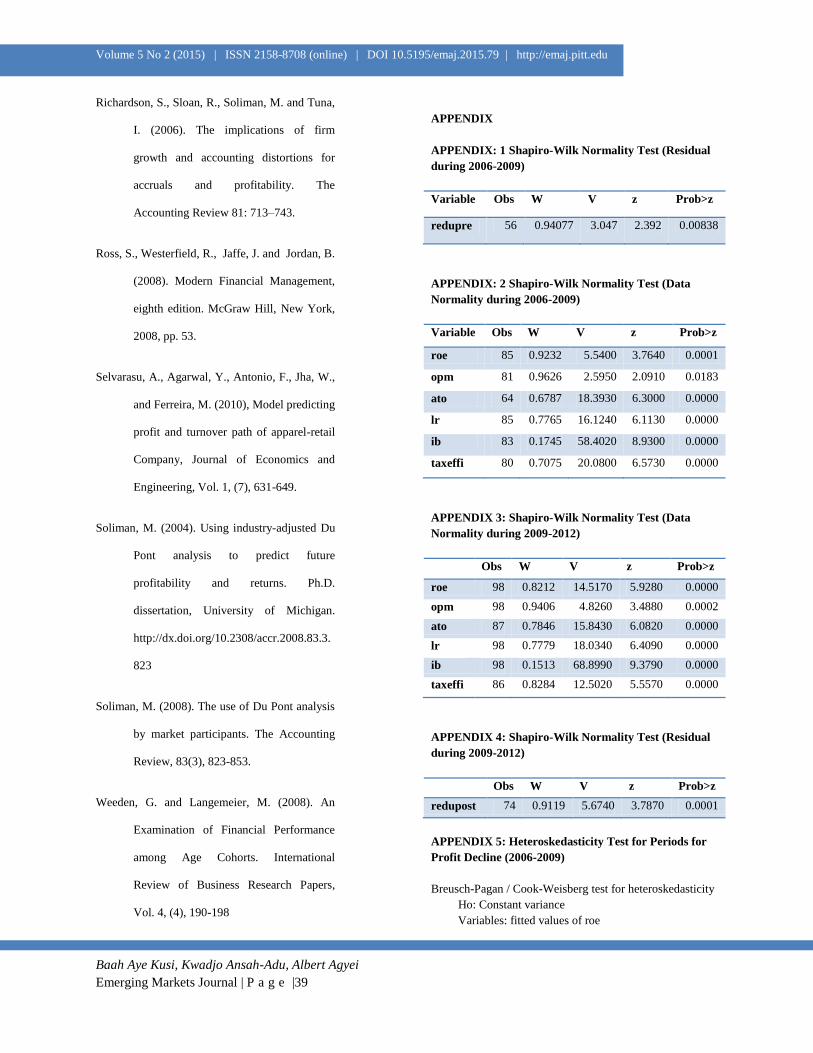
We employ ranking, correlation analysis and Ordinary Least Squares (OLS) regression to achieve the stated objectives of the study. First we rank banks with a composite score by including all five variables of the Du-Pont model. Second, we use the Pearson correlation coefficient matrix to identify which of these variables are most likely to influence ROE for periods before (2006-2009) and after (2009-2012) decline of bank profit. Third, we employ Ordinary least Squares (OLS) to show which variables with the framework of the five step Du-Pont impacts bank return on equity before and after bank profit decline. Concerning our third objective, we test for normality of variable and residuals, multicollinearity, heterskedasticity and autocorrelation. Employing the Shapiro-Wilk normality test (see Appendix 1- 4) with a null hypothesis of non-normal distribution in both variable and residuals, we rejected the null hypothesis of variable normality and residual normality at a p-value of 5% (for both during 2006-2009) and after (2009-2012) ROE decline. We further test for multicollinearity and set the threshold for collinearity to 0.7 following Kennedy (2008). Hence, we find no evidence of multicollinearity in our data for both periods (see Table 2 and Table 3). As further robust check, we use variance inflation factor (VIF) acceptability criteria to access the acceptability of the variables in the model (see Appendix 7 and 8). With a threshold 10 for VIF, none of the variables exceeded the threshold implying that all the variables can be used in the Du-Pont model. With a null hypothesis of consistent variance, we use Breusch-Pagan / Cook-Weisberg test for heteroskedasticity and concluded that models were homoskedastic for periods during profit decline and post profit decline (see Appendix 5 and 6). Finally, we employ the graphical approach to test for the presence of autocorrelation. Wooldridge (2008) suggests that where plotted residuals are vertically plotted, no patterns can be traced through the residuals in the years plotted. This is an
evidence of no autocorrelation. As observed in Appendix 9 and 10, we find evidence of no autocorrelation.
Volume 5 No 2 (2015) | ISSN 2158-8708 (online) | DOI 10.5195/emaj.2015.79 | http://emaj.pitt.edu
Evaluating Banking Profit Performance in Ghana during and post Profit Decline: A Five Step Du-Pont Approach
Page |32| Emerging Markets Journal
DURING PROFIT DECLINE PERIODS
POST PROFIT DECLINE PERIODS
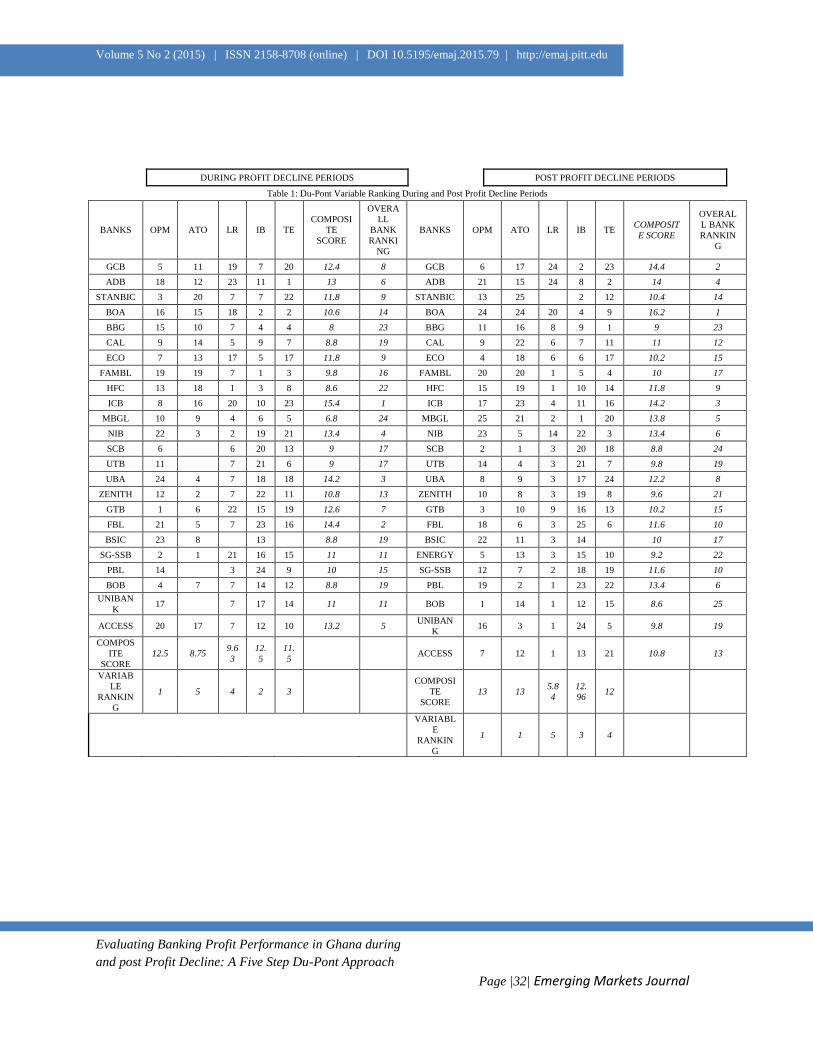
Table 1: Du-Pont Variable Ranking During and Post Profit Decline Periods
BANKS OPM ATO LR IB TE COMPOSI
TE SCORE
OVERALL
BANK RANKI
NG
BANKS OPM ATO LR IB TE COMPOSITE SCORE
OVERALL BANK RANKIN
G
GCB 5 11 19 7 20 12.4 8 GCB 6 17 24 2 23 14.4 2
ADB 18 12 23 11 1 13 6 ADB 21 15 24 8 2 14 4
STANBIC 3 20 7 7 22 11.8 9 STANBIC 13 25
2 12 10.4 14
BOA 16 15 18 2 2 10.6 14 BOA 24 24 20 4 9 16.2 1
BBG 15 10 7 4 4 8 23 BBG 11 16 8 9 1 9 23
CAL 9 14 5 9 7 8.8 19 CAL 9 22 6 7 11 11 12
ECO 7 13 17 5 17 11.8 9 ECO 4 18 6 6 17 10.2 15
FAMBL 19 19 7 1 3 9.8 16 FAMBL 20 20 1 5 4 10 17
HFC 13 18 1 3 8 8.6 22 HFC 15 19 1 10 14 11.8 9
ICB 8 16 20 10 23 15.4 1 ICB 17 23 4 11 16 14.2 3
MBGL 10 9 4 6 5 6.8 24 MBGL 25 21 2 1 20 13.8 5
NIB 22 3 2 19 21 13.4 4 NIB 23 5 14 22 3 13.4 6
SCB 6
6 20 13 9 17 SCB 2 1 3 20 18 8.8 24
UTB 11
7 21 6 9 17 UTB 14 4 3 21 7 9.8 19
UBA 24 4 7 18 18 14.2 3 UBA 8 9 3 17 24 12.2 8
ZENITH 12 2 7 22 11 10.8 13 ZENITH 10 8 3 19 8 9.6 21
GTB 1 6 22 15 19 12.6 7 GTB 3 10 9 16 13 10.2 15
FBL 21 5 7 23 16 14.4 2 FBL 18 6 3 25 6 11.6 10
BSIC 23 8
13
8.8 19 BSIC 22 11 3 14
10 17
SG-SSB 2 1 21 16 15 11 11 ENERGY 5 13 3 15 10 9.2 22
PBL 14
3 24 9 10 15 SG-SSB 12 7 2 18 19 11.6 10
BOB 4 7 7 14 12 8.8 19 PBL 19 2 1 23 22 13.4 6
UNIBANK
17
7 17 14 11 11 BOB 1 14 1 12 15 8.6 25
ACCESS 20 17 7 12 10 13.2 5 UNIBAN
K 16 3 1 24 5 9.8 19
COMPOSITE
SCORE 12.5 8.75
9.63
12.5
11.5
ACCESS 7 12 1 13 21 10.8 13
VARIABLE
RANKING
1 5 4 2 3
COMPOSITE
SCORE 13 13
5.84
12.96
12
VARIABLE
RANKING
1 1 5 3 4

Volume 5 No 2 (2015) | ISSN 2158-8708 (online) | DOI 10.5195/emaj.2015.79 | http://emaj.pitt.edu
Baah Aye Kusi, Kwadjo Ansah-Adu, Albert Agyei Emerging Markets Journal | P a g e |33
5. Empirical Results
Our first objective is to rank the banks in a descending order with a composite score that comprises all five variables of the five step Du-Pont model during and post profit decline in Ghana. We first find the average of each variable for each period, then rank the averages in a descending order. We again find the averages of the ranked values and this gives us the composite score. Hence, we rank the composite score for each bank and variable for the two time periods. We find that the positions of banks changed or varied across the two time periods. For instance, International Commercial Bank (ICB now FBN) was ranked 1st from the composite score during profit declining periods, but ranked 3rd for post profit decline, while Bank of Africa (BOA) ranked 14th during profit declining periods, but ranked 1st for post profit decline periods. From the bottom, Merchant Bank Ghana Limited (MBGL) ranked 24th during profit declining periods, but ranked 5th for post profit decline periods, while Standard Charted Bank (SCB) ranked 17th during profit declining periods, but ranked 24th for post profit decline periods. This implies that the performances of banks are greatly affected by the two periods investigated. We further find that six foreign banks occupied the first ten top ranked positions during profit decline periods while leaving four slots for local banks. However, the ranking changed as seven local banks dominated the top ten banks, ranked after or post profit decline periods. It is interesting to however find that, six banks remained in the top ten ranked banks for both profit decline periods and post profit decline periods. Out of these six banks, three of them, namely International Commercial Bank (ICB), United Bank of Africa (UBA) and Fidelity Bank Limited (FBL) were foreign banks while Ghana Commercial Bank (GCB), National Investment Bank (NIB) and Agricultural Development Bank (ADB) were local banks. Finally, on the part of variables, operating profit margin (OPM) and asset turnover (ATO) ranked 1st and 5th respectively during profit decline periods, implying that OPM and ATO were the highest and lowest variables of the Du-Pont model during profit decline periods. However, OPM and ATO ranked 1st while leverage ranked 5th after or post profit decline.
Table 2: Pearson Correlation Matrix During Profit Decline (2006-2009)
Roe Opm Ato LR IB
Taxe ffi
Roe 1
Opm 0.447***
1
Ato -0.4736***
-0.0509
1
LR 0.6368***
0.1127
-0.6086***
1
IB 0.0041
0.0332
0.0355 -0.0012
1
Taxeffi
0.0731
0.0053
0.0421 0.1273
-0.0948
1
Significant level: 10% (*), 5% (**) and 1% (***) roe= return on equity, opm= operating profit margin, ato= asset turnover, lr= leverage, ib= interest burden, taxeffi= tax effect Table 2 and Table 3 present the Pearson correlation coefficient matrix, which is very important. First of all, it is significant to check multicollinearity during and post periods of profit decline as highlighted in the methodology section. Second, it is important because we employ the Pearson correlation coefficient to identify and detect the variables that are most likely to influence the dependent variable (Dependent Variable: Bank ROE) in either periods in a Du-Pont model.

Volume 5 No 2 (2015) | ISSN 2158-8708 (online) | DOI 10.5195/emaj.2015.79 | http://emaj.pitt.edu
Evaluating Banking Profit Performance in Ghana during and post Profit Decline: A Five Step Du-Pont Approach
Page |34| Emerging Markets Journal
Table 3 Pearson Correlation Matrix During Profit Decline Periods (2009-2012)
Roe Opm Ato LR IB
Taxeffi
Roe 1
Opm 0.469***
1
Ato -0.2588**
0.0681 1
LR 0.2222**
-0.2425**
-0.6694**
1
IB -0.0383
0.1123 0.0842 -0.052
1
Taxeffi
0.1154
-0.1362
-0.0234
0.181*
-0.1291
1
Significant level: 10% (*), 5% (**) and 1% (***) roe= return on equity, opm= operating profit margin, ato= asset turnover, lr= leverage, ib= interest burden, taxeffi= tax effect From Tables 2 and 3, we identify that bank profitability (ROE) is likely to be influenced by operating profit margin (operating activities), asset turnover (asset utilization efficiency) and leverage (usage of debts) for both periods (that is periods during and after ROE decline). However, the level of significance differed across the two time periods. Operating profit margin (opm) was significant in both time periods under 1%, signifying that the core activities of banks have superior influence on their return to shareholders. However, we find asset turnover (ato) and leverage (lr) to be significant under 1% during periods of return on equity decline and under 5% post profit decline. This indicates that leverage and asset turnover were more persistent and robust during periods of profit decline than in post profit decline. These finding are consistent with Herciu et al. (2011) as they also identify that operating profit margin, asset turnover and leverage can significantly influence profitability using the top twenty (20) most profitable companies in the world for 2009.
Concerning our regression estimates below, operating profit margin (opm) is reported to be positively related to bank return on equity in both time periods at 1%
significance level. However, the impact during post profit decline is higher than during profit decline. That is, a unit increase in operating profit margin will lead to a 0.186 and 0.372 unit increase in bank return on equity during profit decline and post profit decline periods respectively. Our finding is consistent with that of Fairfield and Yohn (2001), Nissim and Penman (2001) and Penman and Zhang (2003). However, they argue that operating profit margin is not persistent as higher operating profit margins will attract new entrants while competitors can easily emulate to normalize operating profit margin in the industry. This is so because, operating profit margin is derived from pricing power such as product innovation, product positioning, first mover advantage and brand name recognition which can be easily imitated by competitors and new entrants. As operating profit margin appears to have the greatest impact in both time periods, it implies that bank return on equity in Ghana cannot be persistent as ROE’s highest contributor is
not persistent. We suggest that OPM being significant can be attributed to the integration of information technology as shown by Darmika (2008).
However, asset turnover which is more persistent and accrues from efficient use of resources was not significant and negatively related to ROE in both time periods. From the regression results, we further report that leverage (equity multiplier) is also positively related to ROE in both time periods, but significant at 1% during profit declining periods and 5% in post profit decline periods. This indicates that a unit increase in equity multiplier leads to nearly 0.01 unit increase in ROE in time periods. Our finding support that of Penman (2001) and Modigliani and Miller (1958) who argue a positive relationship between ROE and leverage.

Volume 5 No 2 (2015) | ISSN 2158-8708 (online) | DOI 10.5195/emaj.2015.79 | http://emaj.pitt.edu
Baah Aye Kusi, Kwadjo Ansah-Adu, Albert Agyei Emerging Markets Journal | P a g e |35
6. Conclusion
In this study, we employed the five step Du-Pont model to capture the drivers of bank return to equity holders during periods of declining profits and post profit declining periods. We take advantage of the less used five step Du-Pont model which overcomes the one dimensional problem of other ratios and is able to capture bank specific, industry level and macroeconomic variables. Our Du-Pont set up was able to capture 45% and 42% of the total variation in ROE during profit declining periods and post profit decline respectively. In this study, we find that operating profit margin, asset turnover and leverage are the likely variables in the Du-Pont set up to influence bank return on equity during profit declining periods and post profit decline periods. However, a further analysis through OLS regression revealed that operating profit margin and leverage were positive and significantly persistent during profit declining periods and post profit decline periods. However, positive impact of operating profit margin is not persistent and robust as it can be easily learned by new entrants and copied by existing competitors. However, asset turnover which is expected to be more persistent was not significant in both time periods. Hence, ROE in the banking industry of Ghana cannot be stable. However, we partly attribute the turn of events to the universal banking systems which gives less room for developing core competences and specialties which are unique to banks and are more persistent for industry profit stability. For this reason, we advise that banks focus on effective and
efficient deployment of assets for more persistent influences and stability of bank ROE. We also find that, the tax system helped banks to improve ROE. This means that, banks are able to pass on the cost of corporate tax charged by tax agencies to their client in post profit decline periods. With tax effect being a variable outside the control of bank management, it reechoes the fact that the five step Du-Pont captures industry level and macroeconomic conditions as indicated by Nissim and Penman (2001). This therefore asserts that the use of the five step Du-Pont model is comprehensive enough to capture bank specific, industry level and macroeconomic variables and hence researchers can adapt its use in empirical studies in other industries like construction and manufacturing industries where leverage is high.
Acknowledgement
We wish to express our gratitude to Mrs. Charlotte Abena Frempomaa Mensah of Bank of Ghana for her relentless efforts in assisting us to acquire the needed data for this study.
ROE
During Profit Decline Periods
ROE
Post-Profit Decline Periods
Opm 0.186 0.372 (3.68)*** (6.48)*** Ato -0.115 0.002 (1.65) (0.03) LR 0.008 0.009 (2.73)*** (2.28)** LB 0.001 -0.005 (0.18) (0.74) Taxeff 0.043 0.138 (0.51) (1.71)* _cons 0.024 -0.167 (0.32) (2.27) R2 Adj R2
0.45 0.39
0.42 0.38
N Banks F Test F prob.
56 24
8.14 0.0000
74 25
9.98 0.0000
Volume 5 No 2 (2015) | ISSN 2158-8708 (online) | DOI 10.5195/emaj.2015.79 | http://emaj.pitt.edu
Evaluating Banking Profit Performance in Ghana during and post Profit Decline: A Five Step Du-Pont Approach
Page |36| Emerging Markets Journal
REFERENCES
Alaghi, K. (2010). Financial leverage and
systematic risk. African Journal of
Business Management, Vol.5, (1), 39-43.
Altman E. I. (1968). Financial Ratios,
Discriminant Analysis and the Prediction
of Corporate Bankruptcy. The Journal of
Finance Vol XXIII, NO. 4.
Athanasoglou, P. P., Sophocles, N. B., and Delis,
M. D. (2008). Bank-specific, industry-
specific and macroeconomic
determinants of bank profitability.
International Financial Markets,
Institutions and Money, 18(2), 121-136.
Athanasoglou, P.P., Brissimis, S.N. and Delis,
M.D. (2005). Bank-Specific, Industry-
Specific and Macroeconomic
Determinants of Bank Profitability. Bank
of Greece Working Paper, No. 25.
Blumenthal, R. G. (1998). ‘Tis the gift to be
simple: Why the 80-year-old Du Pont
model still has fans. CFO Magazine,
January, 1998, pp. 1-3.
Burson, R. (1998). Tools you can use for
improved ratio analysis. San Diego
Business Journal, 12/07/98, Vol. 19,
Issue 49, pp. 19-23.
Collins, D., Roman, F., and Chan, H. (2010). An
Empirical Investigation of the
Relationship between Profit Margin
Persistence and Firms’ Choice of
Business Model: Evidence from the US
Airline Industry. Business Lawyer, (54),
921-963.
Conrad, D.A. (2010). Returns on Equity to Not-
For-Profit Hospitals: Theory and
Implementation. International Journal of
Managerial Finance; Emerald Group
Publishing Limited, Vol. 6, (3), 190-219.
Darmika, R. (2008). DuPont analysis of an
information technology enables
competitive advantage. Journal
compilation Blackwell Publishing Ltd,
Vol. 15, (2), 239-250.
Devine, K. and Seaton, L. (1995). An
examination of quarterly financial ratio
stability: implications for financial
decision making. Journal of Applied
Business Research, Winter, 1995, pp. 81-
98.
Escudero, W.S. (2011). CEO Salary and Return
on Equity. “Journal of Finance and
Accountancy”, (61), 7-14.

Volume 5 No 2 (2015) | ISSN 2158-8708 (online) | DOI 10.5195/emaj.2015.79 | http://emaj.pitt.edu
Baah Aye Kusi, Kwadjo Ansah-Adu, Albert Agyei Emerging Markets Journal | P a g e |37
Fairfield, P. and Yohn. T. (2001). Using asset
turnover and profit margin to forecast
changes in profitability. Review of
Accounting Studies (December): 371–
385.
Ge, W., and Soliman, M. (2007). Achieving
competitive advantage through product
differentiation and cost efficiency: A new
approach with new insights.Working
paper, University of Washington.
Gill, J. (1994). Financial Basics of Small
Business Success, Crisp Publications,
1994.
Gitman, L. (1998). Principles of Financial
Management, 8th Edition, Addison
Wesley Publishers, 2000.
Hawawini, G. and Viallet, T. (1999). Finance for
Executives, South-Western College
Publishing, 1999.
Herciu, M., Belascu, L., Ogrean, C. (2011) A
DuPont Analysis of the 20 Most
Profitable Companies in the World.
International Conference on Business and
Economics Research, Vol. 1, 2011, pp.
45-48.
Kose, J., & Yiming, Q. (2003). Incentive features
in CEO compensation in the banking
industry. Federal Reserve Bank of New
York Economic policy review, 9, 1, 107.
Lauzen, L. (1985). Small business failures are
controllable, Corporate Accounting,
Summer, 1985, pp. 34-38.
Liesz, T.J. (2004). Really modified DuPont
analysis: five ways to improve return on
equity. The Economics review, Vol. 81,
(3), 231-243.
Liesz, T. (2002). Really modified Du Pont
analysis: Five ways to improve return on
equity. Proceedings of the SBIDA
Conference. n.p.
Little, P., Little, B. and Coffee, D. (2009).
Evaluating alternative strategies in the
retail industry. Academy of Strategic
Management Journal; Vol. 8, 41-53.
Little, P.L., Mortimer, W.J., Keene, M.A., and
Henderson, L.R. (2009). Evaluating the
effect of recession on retail firms’
strategy using DuPont method. Journal of
Financial and Quantitative analysis, Vol.
38, (1), 1-36.

Volume 5 No 2 (2015) | ISSN 2158-8708 (online) | DOI 10.5195/emaj.2015.79 | http://emaj.pitt.edu
Evaluating Banking Profit Performance in Ghana during and post Profit Decline: A Five Step Du-Pont Approach
Page |38| Emerging Markets Journal
Macay, J. R., & O’Hara, M. (2003). The
corporate governance of banks. Federal
Reserve Bank of New York Economic
policy review, 9, 1, 91-107
Mark, T.S. (2008). The Use of DuPont Analysis
by Market Participants. “The Accounting
Review”, VOL. 83, (3), 307-320.
McClure, B. (2005). ROA and ROE Give Clear
Picture of Corporate Health
http://www.investopedia.com/articles/bas
ics/05/052005.
Mehra, R. (2006). The Equity Premium in India,
Managerial Auditing Journal, Vol. 23,
(8), 744-778.
Mihaela, H., Claudia, O., and Lucian, B. (2011).
A Du Pont Analysis of the 20 Most
Profitable Companies in the World.
International Conference on Business and
Economics Research, vol.1, (2), 87–106.
Modigliani, F., & Miller, M. H. (1958). The cost
of capital, corporation finance and the
theory of investment. The American
economic review, 48(3), 261-297.
Moss, C.B., Mishra, A.K. and Dedah, C. (2000).
Decomposing Agricultural Profitability
Using DuPont Expansion and Thiele’s
Information Approach. Asia Pacific
Journal of Management, (22), 257–283.
Moyer, C., McGuigan, J. and Rao, R. (2007).
Fundamentals of Contemporary Financial
Management. Thomson South-Western,
USA, 2007, pp.113.
Nissim, D., & Penman, S. (2001). Ratio analysis
and valuation: From research to practice.
Review of accounting studies, 6, 109-
154.
http://dx.doi.org/10.1023/A:10113382216
23
Osteryoung, J. and Constand, R. (1992).
Financial ratios in large public and small
private firms, Journal of Small Business
Management, July, 1992, pp. 35-47.
Palepu, K., & Healy, P. (2008). Business analysis
and valuation: Using financial statements
(Fourth edition). Mason, OH: Thomson
Southwestern.
Pratt, J., & Hirst, D. (2008). Financial reporting
for managers: A value-creation
perspective. New York, NY, Wiley.
Volume 5 No 2 (2015) | ISSN 2158-8708 (online) | DOI 10.5195/emaj.2015.79 | http://emaj.pitt.edu
Baah Aye Kusi, Kwadjo Ansah-Adu, Albert Agyei Emerging Markets Journal | P a g e |39
Richardson, S., Sloan, R., Soliman, M. and Tuna,
I. (2006). The implications of firm
growth and accounting distortions for
accruals and profitability. The
Accounting Review 81: 713–743.
Ross, S., Westerfield, R., Jaffe, J. and Jordan, B.
(2008). Modern Financial Management,
eighth edition. McGraw Hill, New York,
2008, pp. 53.
Selvarasu, A., Agarwal, Y., Antonio, F., Jha, W.,
and Ferreira, M. (2010), Model predicting
profit and turnover path of apparel-retail
Company, Journal of Economics and
Engineering, Vol. 1, (7), 631-649.
Soliman, M. (2004). Using industry-adjusted Du
Pont analysis to predict future
profitability and returns. Ph.D.
dissertation, University of Michigan.
http://dx.doi.org/10.2308/accr.2008.83.3.
823
Soliman, M. (2008). The use of Du Pont analysis
by market participants. The Accounting
Review, 83(3), 823-853.
Weeden, G. and Langemeier, M. (2008). An
Examination of Financial Performance
among Age Cohorts. International
Review of Business Research Papers,
Vol. 4, (4), 190-198
APPENDIX APPENDIX: 1 Shapiro-Wilk Normality Test (Residual during 2006-2009)
Variable Obs W V z Prob>z
redupre 56 0.94077 3.047 2.392 0.00838
APPENDIX: 2 Shapiro-Wilk Normality Test (Data Normality during 2006-2009)
Variable Obs W V z Prob>z
roe 85 0.9232 5.5400 3.7640 0.0001
opm 81 0.9626 2.5950 2.0910 0.0183
ato 64 0.6787 18.3930 6.3000 0.0000
lr 85 0.7765 16.1240 6.1130 0.0000
ib 83 0.1745 58.4020 8.9300 0.0000
taxeffi 80 0.7075 20.0800 6.5730 0.0000
APPENDIX 3: Shapiro-Wilk Normality Test (Data Normality during 2009-2012)
Obs W V z Prob>z
roe 98 0.8212 14.5170 5.9280 0.0000
opm 98 0.9406 4.8260 3.4880 0.0002
ato 87 0.7846 15.8430 6.0820 0.0000
lr 98 0.7779 18.0340 6.4090 0.0000
ib 98 0.1513 68.8990 9.3790 0.0000
taxeffi 86 0.8284 12.5020 5.5570 0.0000
APPENDIX 4: Shapiro-Wilk Normality Test (Residual during 2009-2012)
Obs W V z Prob>z
redupost 74 0.9119 5.6740 3.7870 0.0001
APPENDIX 5: Heteroskedasticity Test for Periods for Profit Decline (2006-2009) Breusch-Pagan / Cook-Weisberg test for heteroskedasticity Ho: Constant variance Variables: fitted values of roe

Volume 5 No 2 (2015) | ISSN 2158-8708 (online) | DOI 10.5195/emaj.2015.79 | http://emaj.pitt.edu
Evaluating Banking Profit Performance in Ghana during and post Profit Decline: A Five Step Du-Pont Approach
Page |40| Emerging Markets Journal
chi2(1) = 3.41 Prob > chi2 = 0.0646 APPENDIX 6: Heteroskedasticity Test for Post Decline (2009-2012) Breusch-Pagan / Cook-Weisberg test for heteroskedasticity Ho: Constant variance Variables: fitted values of roe chi2(1) = 0.33 Prob > chi2 = 0.5681 APPENDIX 7: VIF During Periods of Proft Decline (2006-2012)
Variable VIF 1/VIF
lr 1.67 0.600288
ato 1.65 0.604702
taxeffi 1.15 0.865892
opm 1.13 0.884641
ib 1.03 0.972954
Mean VIF 1.33
APPENDIX 8: VIF Post Profit Decline (2009-2012)
Variable VIF 1/VIF
lr 2.23 0.4488
ato 2.01 0.497591
opm 1.24 0.806155
taxeffi 1.08 0.927124
ib 1.05 0.956647
Mean VIF 1.52
APPENDIX 9: Autocorrelation Graph for periods during Profit Decline
APPENDIX 10: Autocorrelation for Post Profit Decline
-.20
.2.4
Res
idua
ls
2006 2007 2008 2009year
-.6-.4
-.20
.2.4
Res
idua
ls
2009 2010 2011 2012year