Embed Size (px)
Citation preview

Evaluating a Tap Water Contamination Incident Attributed to OilContamination by Nontargeted Screening StrategiesBeili Wang, Yi Wan,* Guomao Zheng, and Jianying Hu
Laboratory for Earth Surface Processes, College of Urban and Environmental Sciences, Peking University, Beijing 100871, China
*S Supporting Information
ABSTRACT: The present study applied nontargeted screeningtechniques as a novel approach to evaluate the tap water samplescollected during the “4.11” tap water pollution incident occurred onApril 11, 2014 in Lanzhou in west China. Multivariate analysis (PCAand OPLS-DA) of about 3000 chemical features obtained in extractsof tap water samples by ultrahigh-pressure liquid chromatographyquadrupole time-of-flight mass spectrometry (UPLC-QTOF-MS)analysis showed significantly different chemical profiles in tap waterfrom pollution regions versus reference regions during the event.These different chemical profiles in samples from different regionswere not observed in samples collected during the nonpollutionperiod. The compounds responsible for the differences in profilesbetween regions were identified as naphthenic acids (NAs) andoxidized NAs (oxy-NAs) after the sample extracts underwentbromination to explore saturations, dansylation to identify hydroxylations and corresponding MS/MS mode analysis. Aconsistent finding was further observed in the targeted analysis of NA mixtures, demonstrating that the Lanzhou “4.11” tap waterpollution incident could be attributed to oil spill pollution, and NA mixtures would be a marker for oil contamination. Suchevaluations can help to rapidly discriminate pollution sources in accidental pollution events and contribute to regular watermonitoring management of water safety issues.
■ INTRODUCTION
Recent decades have witnessed a rise in the environmentalawareness of water safety, which is one of the national issuesholding the greatest socio-economic threats to nationalsecurity.1−3 The accidental release of pollutants into theenvironment can result in loss of life and property and severelyaffect the safety of water, especially in countries undergoingrapid industrial and urban development.1,4,5 The number ofwater pollution accidents was reported to be 6677 from 2000 to2008 in China according to the Ministry of EnvironmentalProtection (MEP), and many of these events have threatenedthe public health of local communities.6,7 It is therefore urgentto strengthen the capabilities to monitor and properly judgeevents of accidental pollution.Target screening is currently the main strategy to identify
and quantify pollutants for which standards are available.8−10
To provide maximum selectivity and sensitivity, only character-istic ions or ion transitions of targeted analytes are monitoredin target ion monitoring.3,11−13 However, no preliminaryinformation concerning responsible pollutants was knownwhen the accidents occurred in most pollution events.6,7 Thetarget screening methods were specifically developed for acertain group of substances, and would miss the compoundsthat are not selected at the start of the analyses. For example,unusual odors were reported in river water and tap water onMay 10, 2014 in Jingjiang city, China, and the city had to stop
the supply of tap water for 7 h, but the causes of the accidentwere still not clear even the Chinese MEP continuouslymonitored the water samples in 62 locations along the river for32 h. In contrast, the tentative nontargeted techniques aresuperior for screening of unknown compounds.14−16 Thenontargeted screening is substantially harmonized by research-ers from 18 institutes from 12 European countries recently dueto its ability for identification of a wider range of compounds inwater samples.17 However, identifying the major functionalgroups of unknown compounds based on the high resolutiondata combined with limit fragmentations is a major challengefor clarifying the structures of the nontargeted mass.15,17 Moresuitable for this purpose is chemical derivatizations, since somederivatization regents would specifically react with differentfunctional groups, for example, dansyl chloride could selectivelyreact with hydroxyl groups and generate a collisionalfragmentation of dansyl moiety.18−20 Thus, derivatizationscombined with MS/MS analysis could help identify thestructure of responsible pollutants in the sample extracts.To test the hypothesis about the advantage of nontargeted
screening in water analysis, the proposed nontargeted
Received: November 22, 2015Revised: January 31, 2016Accepted: February 10, 2016Published: February 10, 2016
Article
pubs.acs.org/est
© 2016 American Chemical Society 2956 DOI: 10.1021/acs.est.5b05755Environ. Sci. Technol. 2016, 50, 2956−2963
techniques were applied to evaluate a tap water contaminationincident. On April 11, 2014, the so-called “4.11” tap waterpollution incident occurred in Lanzhou, Gansu province, China,during which the concentrations of benzene (up to 200 μg/L)in the city’s tap water rose to 20 times above the national limitaccording to the city’s environmental protection office. Morethan 800 t of polluted water were supplied before the sourcewas found. We screened all the nontargeted mass in tap watersamples collected during the events and a nonpollution period.The chemical profiles were obtained from sufficiently accuratemass measurements, and thousands of resulting chemicalformulas underwent multivariate analysis to identify theresponsible pollutants. Chemical derivatizations includingbromination and dansylation were applied to identify thesaturation or hydroxylation of the responsible pollutants. Thestructures of the identified pollutants were finally clarifiedtogether with a targeted analysis to reveal the pollution sourcesin the event.
■ MATERIALS AND METHODSSample Collection. On April 11, 2014, concentrations of
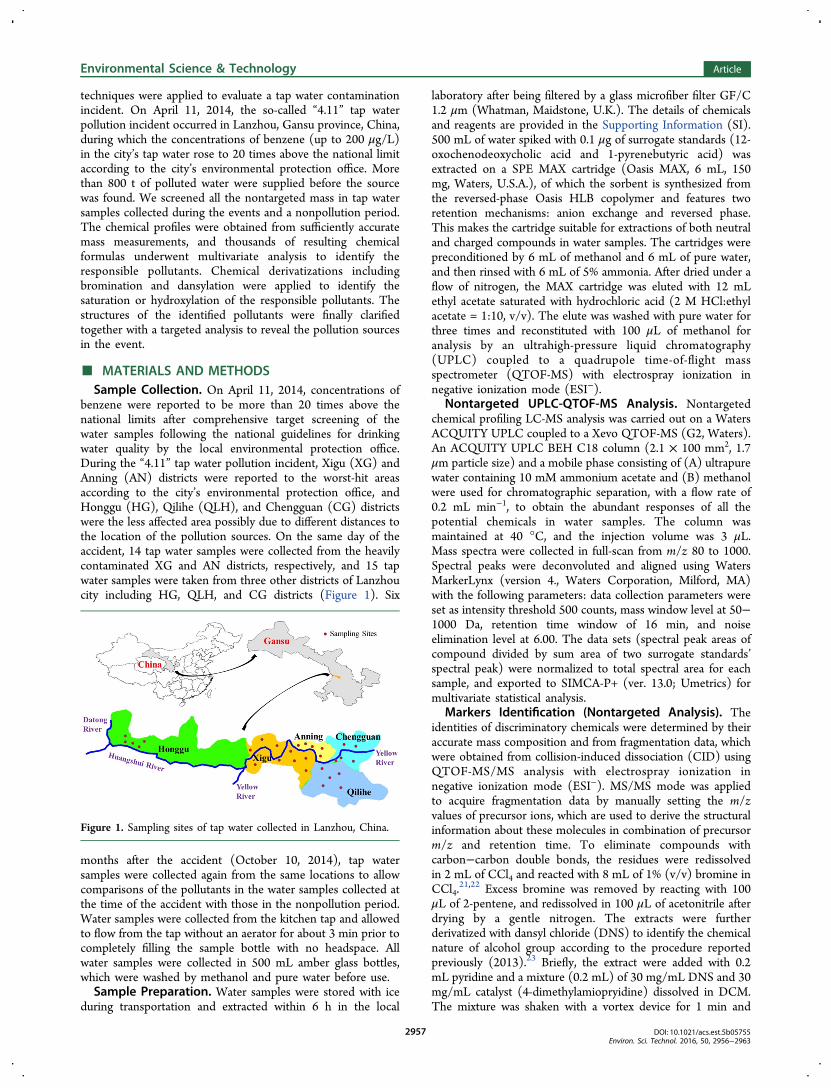
benzene were reported to be more than 20 times above thenational limits after comprehensive target screening of thewater samples following the national guidelines for drinkingwater quality by the local environmental protection office.During the “4.11” tap water pollution incident, Xigu (XG) andAnning (AN) districts were reported to the worst-hit areasaccording to the city’s environmental protection office, andHonggu (HG), Qilihe (QLH), and Chengguan (CG) districtswere the less affected area possibly due to different distances tothe location of the pollution sources. On the same day of theaccident, 14 tap water samples were collected from the heavilycontaminated XG and AN districts, respectively, and 15 tapwater samples were taken from three other districts of Lanzhoucity including HG, QLH, and CG districts (Figure 1). Six
months after the accident (October 10, 2014), tap watersamples were collected again from the same locations to allowcomparisons of the pollutants in the water samples collected atthe time of the accident with those in the nonpollution period.Water samples were collected from the kitchen tap and allowedto flow from the tap without an aerator for about 3 min prior tocompletely filling the sample bottle with no headspace. Allwater samples were collected in 500 mL amber glass bottles,which were washed by methanol and pure water before use.Sample Preparation. Water samples were stored with ice
during transportation and extracted within 6 h in the local
laboratory after being filtered by a glass microfiber filter GF/C1.2 μm (Whatman, Maidstone, U.K.). The details of chemicalsand reagents are provided in the Supporting Information (SI).500 mL of water spiked with 0.1 μg of surrogate standards (12-oxochenodeoxycholic acid and 1-pyrenebutyric acid) wasextracted on a SPE MAX cartridge (Oasis MAX, 6 mL, 150mg, Waters, U.S.A.), of which the sorbent is synthesized fromthe reversed-phase Oasis HLB copolymer and features tworetention mechanisms: anion exchange and reversed phase.This makes the cartridge suitable for extractions of both neutraland charged compounds in water samples. The cartridges werepreconditioned by 6 mL of methanol and 6 mL of pure water,and then rinsed with 6 mL of 5% ammonia. After dried under aflow of nitrogen, the MAX cartridge was eluted with 12 mLethyl acetate saturated with hydrochloric acid (2 M HCl:ethylacetate = 1:10, v/v). The elute was washed with pure water forthree times and reconstituted with 100 μL of methanol foranalysis by an ultrahigh-pressure liquid chromatography(UPLC) coupled to a quadrupole time-of-flight massspectrometer (QTOF-MS) with electrospray ionization innegative ionization mode (ESI−).
Nontargeted UPLC-QTOF-MS Analysis. Nontargetedchemical profiling LC-MS analysis was carried out on a WatersACQUITY UPLC coupled to a Xevo QTOF-MS (G2, Waters).An ACQUITY UPLC BEH C18 column (2.1 × 100 mm2, 1.7μm particle size) and a mobile phase consisting of (A) ultrapurewater containing 10 mM ammonium acetate and (B) methanolwere used for chromatographic separation, with a flow rate of0.2 mL min−1, to obtain the abundant responses of all thepotential chemicals in water samples. The column wasmaintained at 40 °C, and the injection volume was 3 μL.Mass spectra were collected in full-scan from m/z 80 to 1000.Spectral peaks were deconvoluted and aligned using WatersMarkerLynx (version 4., Waters Corporation, Milford, MA)with the following parameters: data collection parameters wereset as intensity threshold 500 counts, mass window level at 50−1000 Da, retention time window of 16 min, and noiseelimination level at 6.00. The data sets (spectral peak areas ofcompound divided by sum area of two surrogate standards’spectral peak) were normalized to total spectral area for eachsample, and exported to SIMCA-P+ (ver. 13.0; Umetrics) formultivariate statistical analysis.
Markers Identification (Nontargeted Analysis). Theidentities of discriminatory chemicals were determined by theiraccurate mass composition and from fragmentation data, whichwere obtained from collision-induced dissociation (CID) usingQTOF-MS/MS analysis with electrospray ionization innegative ionization mode (ESI−). MS/MS mode was appliedto acquire fragmentation data by manually setting the m/zvalues of precursor ions, which are used to derive the structuralinformation about these molecules in combination of precursorm/z and retention time. To eliminate compounds withcarbon−carbon double bonds, the residues were redissolvedin 2 mL of CCl4 and reacted with 8 mL of 1% (v/v) bromine inCCl4.
21,22 Excess bromine was removed by reacting with 100μL of 2-pentene, and redissolved in 100 μL of acetonitrile afterdrying by a gentle nitrogen. The extracts were furtherderivatized with dansyl chloride (DNS) to identify the chemicalnature of alcohol group according to the procedure reportedpreviously (2013).23 Briefly, the extract were added with 0.2mL pyridine and a mixture (0.2 mL) of 30 mg/mL DNS and 30mg/mL catalyst (4-dimethylamiopryidine) dissolved in DCM.The mixture was shaken with a vortex device for 1 min and
Figure 1. Sampling sites of tap water collected in Lanzhou, China.
Environmental Science & Technology Article
DOI: 10.1021/acs.est.5b05755Environ. Sci. Technol. 2016, 50, 2956−2963
2957

incubated at 65 °C for 60 min. The residuals were blown todryness and then dissolved with 0.1 mL of acetonitrile forUPLC-QTOF-MS/MS analysis. UPLC-QTOF-MS/MS anal-ysis was used to characterize the fragmentation pattern of eachmaker feature of interest (as determined by univariate andmultivariate techniques) according to the fragmentation ionsreported in our previous study.23,24 MS/MS was carried out onthe Waters QTOF system described above with a 10−30 Vcollision energy ramp and a 50−1000 Da mass range.Targeted Analysis. To identify and quantify the groups of
identified markers, water samples were measured using thesame LC-MS method with that in nontargeted analysis. Tocorrect for variation between batches in the targeted analysis,quality assurance and quality control (QA/QC) was applied toeach chemical concentration value. Briefly, all equipment wererinsed with acetone and hexane to avoid sample contamination.A procedural blank was incorporated in the analyticalprocedures for every batch of 10 samples, and the total amountof NAs and oxy-NAs in field blank samples were less than 3.5 ±0.4 μg. The efficiencies of the sample preparation procedurewas assessed by analyzing water samples collected from eachdistrict spiked with standard solutions of model NAs and oxy-NAs, of which the detail information was provided in Table S1.The absolute recoveries of model NA and oxy-NA compoundswere 90 ± 25%, 92 ± 19%, 82 ± 18%, 88 ± 24%, and 99 ± 29%in spiked water samples collected from XG, CG, QLH, AN, andHG, respectively (n = 15), of which the recoveries (82−99%)were in the acceptable range for semiquantifications of NAmixtures and the relatively high deviations were possible due tothe poor quantification of TOFMS. Surrogate standards (1-pyrenebutyric acid and 12-oxochenodeoxycholic acid) werespiked to samples prior to extraction to compensate for the lossof target compounds during the extraction process and correctthe variation of instrument response and matrix effect. Theefficiencies of the sample preparation procedure were assessedby analyzing water samples collected from each district spikedwith surrogate standard solutions. Recoveries of 1-pyrenebuty-ric acid and 12-oxochenodeoxycholic acid were 70 ± 25% and75 ± 29% (n = 29) in all analyzed water samples, respectively.The MDLs were 1.2−27 ng/L and 0.05−0.35 ng/L for NAsand oxy-NAs in water samples, respectively. The detailedanalytical information about targeted analysis of PAHs andalkyl-PAHs are provided in the SI.Statistical Analysis. Normalized peak area matrices were
exported to SIMCA-P 13.0 (Umetrics, Umea, Sweden) formultivariate statistical analysis. Spectral regions containingblank water and methanol signals were excluded from theanalysis. Clustering of the samples was assessed using principalcomponent analysis (PCA) to reveal the differences amongsampling districts. Orthogonal partial least-squares-discriminantanalysis (OPLS-DA) was carried out to generate the maximumseparation between the classes of reference regions versuspollution regions. Each OPLS-DA model was evaluated by boththe internal permutation test and external validation test.Unpaired Student’s t tests were employed to ensure that thepolluted markers extracted with holistic OPLS-DA analysiswere significantly differentially expressed between the pollutedand control groups. P value threshold of 0.05 was used todefine the significance.
■ RESULTS AND DISCUSSIONChanges in Chemical Profiles of the Tap Water. The
evolution of HRMS coupled with ultrahigh-pressure liquid
chromatography (UPLC) with superior sensitivity andselectivity has opened up new windows of opportunity forprofiling and identifying the unknown compounds.25−29 Usingthe nontargeted UPLC-QTOF-MS method, 3391 chemicalfeatures were extracted for each water sample. PCA score plotswere used to determine whether the chemical profile in thewater samples from each district were sufficiently unique todistinguish the different polluted regions. As shown in Figure2a, clear separations were observed between the districts of XG
and AN and those of HG, CG, and QLH. This is consistentwith the report by the city’s environmental protection officethat XG and AN districts were the most polluted areas in the“4.11” incident.30 In comparison, the PCA score plotsillustrated no significant differences among the five districtsfor the water samples collected during the nonpollution period(Figure 2b), suggesting that the chemical profiles of the tapwater of the five districts in Lanzhou were generally similar.The results demonstrated that the unknown pollution sourcescaused significantly different chemical profiles in the tap waterfrom XG and AN districts compared with the other districtsduring this event, and the profile would provide importantinformation for clarifying the potential pollution sources.Nontargeted analysis of PCA of the five districts showed
significant differences between the XG and AN districts and theQLH, CG, and HG districts during the pollution period.Therefore, we considered XG and AN as the pollution regionand QLH, CG, and HG districts as the reference region. Toinvestigate the key pollutants in tap water from the pollutedregion, the variances of chemical profiles between the pollutionregion and reference region were examined by supervisedmultivariate OPLS-DA. The OPLS-DA scatter plots showedobvious clustering of tap water samples from the two regionsduring the event (R2 (cum) = 0.993, Q2 (cum) = 0.943, Figure2c), whereas the OPLS-DA model for samples collected in thenonpolluted period showed poor predictive ability (R2 (cum) =0.789, Q2 (cum) = −0.327, Figure 2d). This is consistent withthe PCA results that samples from the pollution and referenceregions can only be separated during the “4.11” tap waterpollution incident. The quality of the OPLS-DA model wasfurther evaluated by a permutation test (with 100 iterations)
Figure 2. Multivariate analysis of untargeted profiling of tap waterextracts. Classes of PCA score plots and OPLS-DA score plots arefrom the polluted period (a, c) and the nonpollution period (b, d),respectively.
Environmental Science & Technology Article
DOI: 10.1021/acs.est.5b05755Environ. Sci. Technol. 2016, 50, 2956−2963
2958

performed in the corresponding PLS-DA model. The Q2 and R2
values in the permutation test for the modeling of samplescollected during the event were higher than the original points,and the regression of the Q2 points intersected the vertical axisbelow zero (Figure S1), strongly indicating that the OPLS-DAmodel was statistically valid. However, the permutation test forthe modeling of samples collected during the nonpollutionperiod showed that the OPLS-DA model was not valid (FigureS1), which is consistent with the poor predictive ability of themodel. To select statistically significant chemicals related to thedifferences between regions during the event, an S-plot wasconstructed on the basis of the validated OPLS-DA model(Figure S2). Variables that are at the edges of the sigmoidalcurve can be considered as suitable targets for investigation asmarkers of exposure, and about 78 peaks responsible for theseparation were considered as potential markers for clarifyingthe pollution sources of the accident.The nontargeted screening via high resolution MS has gained
increasing importance for monitoring unknown organic tracesubstances in water resources.31 Generally, significantly differ-ent chemical profiles were observed among different types ofwater such as drinking water, groundwater, wastewater etc.15,31
In the present study, distinct chemical profiles were firstobserved in tap water samples from different regions in thewater pollution incident, and the difference disappeared duringthe nonpollution period. In most pollution events, nopreliminary information concerning responsible pollutantswas known when the accidents occurred. The traditional targetanalytical methods were specifically developed for a certaingroup of substances, and would miss the compounds that arenot selected at the start of the analyses. In comparison, thenontargeted screening technique could screen all possiblechemicals in the sample extracts and identify the responsiblepollutants based on comparisons between polluted andreference samples. For examples, a suite of polar petroleummakers were identified for indicating the oil spill source basedon the PCA analysis of elemental composition data in oils offuel tanks and environmental field samples.32 In the presentstudy, the nontargeted screening strategies is based on theassumption that no preliminary information concerning thepollution sources was known, and the method provided a newcomprehensive monitoring approach of organic trace sub-stances for source clarifications and/or early warning inaccidental pollution events.Identification of Potential Markers. The identification of
the responsible pollutants for the regional differences is a greatchallenge due to the lack of comprehensive spectral libraries forsoft ionization techniques in contrast with the standards orpublic databases of metabolites such as Metlin, HMDB, andKEGG.15,17 The structures of the nontargeted mass could notbe confirmed only based on the high resolution data combinedwith results of compound database queries (e.g., ChemSpider),and identifying the major functional groups of unknowncompounds is even more difficult. In the present study,potential markers were identified mainly through MSfragmentations and chemical derivatization of the compounds.The molecular formula of the compounds can be roughlydetermined by the accurate molecular weight by HRMS andMS/MS spectra, and chemical derivatizations includingbromination and dansylation were applied to explore thesaturation or hydroxylation of the pollutants.The 78 ions of interest were first lessened to about 52 ions
by Student’s t-test and then identified from their accurate mass
composition and elemental composition. Many structures werepresent in electrospray ionization (ESI) as the [M−H]− ion,and a number of the ions were found to be compounds with themolecular formula of CnH2n+ZOx (e.g., C16H32O2, C18H36O2,C12H24O2, C18H34O2, C13H20O4 C15H22O4, C14H20O5, andC15H22O5), of which the intensities in samples from thepollution region were, on average, 29-fold higher than those insamples from the reference region in the event. Brominationwas first conducted to eliminate compounds with carbon−carbon double bonds, and the variations of peak intensities ofthe CnH2n+ZOx ions between nonbrominated and brominatedsamples ranged from −5.2% to 1.8%, suggesting that thesecompounds contained cyclic structures. The brominatedextracts were further characterized in the QTOF-MS/MSanalysis to investigate their ESI mass spectral fragmentationpathways. As shown in Figure 3 and Table 1, molecular ions
([M−H]−) and [M−H−H2O]− were observed for C16H32O2,
C18H36O2, C12H24O2, and C18H34O2, suggesting that thesecompounds were saturated acids or ring-containing acids(naphthenic acids (NAs)). Two more fragment ions of [M−H−CO2]
− and [M−H−H2O−CO2]− were found for the ions
of the C13H20O4, C15H22O4, C14H20O5, and C15H22O5 species(Figure 3 and Table 1). As shown in Figure S4, neutral loss ofCO2 and H2O moieties were the characteristic massfragmentations for mono-oxidized acids (12-oxochenodeox-ycholic acid and 12-hydroxystearic acid), and four diagnosticfragments were generated by the loss of more H2O or bothCO2 and H2O moieties for 12-oxochenodeoxycholic acid. Thus,neutral losses of the CO2 and H2O moieties were thecharacteristic mass fragmentations for oxidized NAs (oxy-NAs), which is similar to the fragmentation ions of commercialNAs by ESI−-MS/MS analysis reported previously.24,33−36 Theloss of H2O, CO2, and H2CO3 moieties in CnH2n+ZO4 and
Figure 3. MS/MS spectra of NAs with precursor ions of 255 (a) and281 (b), oxy-NAs with precursor ions of 239 (c) and 281 (d) andcorresponding oxy-NAs derivatives with precursor ions of 474 (e) and516 (f) in the extracts of tap water. The proposed structures of e and fare shown in Figure S3.
Environmental Science & Technology Article
DOI: 10.1021/acs.est.5b05755Environ. Sci. Technol. 2016, 50, 2956−2963
2959

CnH2n+ZO5 indicated that these compounds were hydroxylatedNAs or ketonic NAs, not compounds with ester or diacidgroups. Moreover, the retention times of C13H20O4, C15H22O4,C14H20O5, and C15H22O5 were earlier than those of thenonoxidized acids (Table 1), which is consistent with theelution sequence of the oxidized acid and nonoxidized acidsreported previously.23,24 The above results indicated that theseions were possibly NAs and/or oxy-NAs, both solublecomponents of petroleum.To further identify the chemical nature of the oxy-NAs
(hydroxyl or ketone) in the extracts, a derivatization methodwith DNS was applied. DNS is only reactive with hydroxylgroups in optimized derivatization conditions, and derivatizedcompounds were analyzed in positive ion mode, whichexcluded the interferences of acids in the sample extracts. Asshown in Figure S5, ionization and fragmentation of the dansylderivatives of hydroxylated NA standards resulted in proto-nated molecular ions [M+H]+ and produced product ions atm/z 252.0694 and m/z 171.1048. The ion m/z 252.0694 is theprotonated molecular ion of DNS, and the ion m/z 171.1048originates from a cleavage of a CS bond in the dansyl portionof the molecule (Figure S5). Figure 3 and Table 1 show theMS/MS fragment ions of dansyl derivatives from thecorresponding oxy-NAs in the extracts of tap water from thepollution region in the event. The major dansyl derivativeparent and product ions, not observed before derivatization,were similar to the fragmentation pattern of hydroxylated NAstandards. While the reference standards were not commerciallyavailable for these identified compounds, the fragmentationpatterns of the compounds were same with those of standardsof model oxy-NAs before or after the derivatization. The resultsdemonstrated that the C13H20O4, C15H22O4, C14H20O5, andC15H22O5 detected in the sample extracts were mainlycomposed of hydroxylated NAs. This study suggests thatsaturated fatty acids, NAs, and hydroxylated NAs would be thekey pollutants for regional discrimination in the event.
Targeted Analysis of Naphthenic Acids. NA mixturesare a group of chemicals with formula of CnH2n+ZOx (x = 3, 4,5), where “n” is the carbon number, and “Z” refers to thecylinder number. “Z” is zero or a negative, even integer thatspecifies the hydrogen deficiency resulting from ringformation.37−39 NA mixtures are the primary toxic componentsin oil sands process-affected waters produced at the oil sandsextraction plants in northeastern Alberta, Canada.40 Previousstudies have shown that NA mixtures are potential indicatorsfor oil contamination in the aquatic environment because thatthey are polar and soluble components of petroleum and persistin the environment.41 The detection of NA mixtures in thepolluted tap water is consistent with the suspected cause of theevent, i.e., that an oil pipeline near the water plant leaked, whichled to the concentration of benzene exceeding the standard.The concentrations of the NA mixtures were generallysemiquantified based on integration of the hump peak of theNA congeners assuming that the responses for individual NAisomers in the hump peaks were similar because the separationmethod and standards for all of the individual NAs were notavailable.42−45 The peak intensity of the NAs and oxy-NAscould not be automatically integrated by MakerLynx due to thecharacteristic “humps” of the NA mixtures. Therefore, about150 NA congeners were manually integrated and semi-quantified with the method reported previously for furthermultivariate statistical analysis.23
A consistent finding was observed in the nontargeted andtargeted analysis. In the OPLS-DA score plots, tap watersamples collected from the pollution region during the eventcould be clearly separated from those collected from thereference regions (R2 (cum) = 0.89, Q2 (cum) = 0.508), but noobvious separation was observed for samples collected duringthe nonpollution period (R2 (cum) = 0.584, Q2 (cum) =0.0871) (Figure S6). The permutation test also showed thatonly the OPLS-DA model for samples collected during theevent was statistically valid (Figure S7). These results
Table 1. Precursors and MS/MS Fragment Ions of NAs, and oxy-NAs and Their Corresponding Derivatives with DansylChloride Generated in MS/MS Mode of QTOF-MS in Extracts of Tap Water, and the MS/MS Spectra with Precursor Ions of255, 239, and 281 as Shown in Figure 3a
MS/MS MS/MS of dansyl chloride derivatives
compounds mass fragment ions mass fragment ions
precursor ion/RT(min) [M−H]−
[M−H−H2O]
−[M−H−CO2]
−[M−H−H2O−
CO2]−
[M+DNS+H]+ [C12H14NO3S]
+ [C12H13N]+
NAs
C18H34O2 281/13.00281.2479 263.2384 - - - - -
(−0.7 ppm) (3.4 ppm)
C18H36O2 283/13.54283.2635 265.2526 - - - - -
(−0.7 ppm) (−1.9 ppm)
C16H32O2 255/11.20255.2332 237.222 - - - - -
(3.1 ppm) (0.8 ppm)
C12H24O2 199/10.01199.1694 181.16 - - - - -
(−2.0 ppm) (4.4 ppm)
oxy-NAs
C13H20O4 239/4.38239.1278 221.1188 195.139 177.1283 474.1981 252.0676 171.1044
(−2.1 ppm) (4.5 ppm) (2.6 ppm) (2.3 ppm) (6.5 ppm) (−7.1 ppm) (−2.3 ppm)
C15H22O4 265/4.57265.1437 247.1329 221.1539 203.1432 500.2127 252.0698 171.1039
(−1.1 ppm) (−2.0 ppm) (−1.3 ppm) (−2.0 ppm) (4.0 ppm) (1.6 ppm) (−5.3 ppm)
C14H20O5 267/4.38267.1218 249.1114 223.1316 205.1231 502.1918 252.0684 171.1045
(−5.2 ppm) (−5.2 ppm) (−8.1 ppm) (1.0 ppm) (3.8 ppm) (−4.0 ppm) (−1.8 ppm)
C15H22O5 281/4.44281.1388 263.1289 237.1481 219.1398 516.2032 252.0691 171.104
(−0.4 ppm) (2.8 ppm) (−4.2 ppm) (5.9 ppm) (−4.6 ppm) (−1.2 ppm) (−4.7 ppm)aMass errors of fragmentation ions higher than 5 ppm are possible due to the low abundance of the compounds.
Environmental Science & Technology Article
DOI: 10.1021/acs.est.5b05755Environ. Sci. Technol. 2016, 50, 2956−2963
2960

demonstrated that the NA mixture profile from the UPLC-QTOF-MS analysis consistently produced clearly definedgroupings and a highly valid model in OPLS-DA analysis fortap water samples collected during the event. Figure 4 showsthe boxplots of the concentrations of detected NAs and oxy-NAs in tap water samples from the pollution and referenceregions during the event. Concentrations of CnH2n+ZOx with Zvalues of −8 to 0 and x of 2 to 5 in water samples from thepollution region were statistically significantly higher than thosein samples from the reference region. Especially for ions of267.2324 and 281.2481 (one ring) and 219.139, 401.342,171.1021, and 183.1021 (four rings and one hydroxyl),concentrations were below detection limits in samples fromthe reference regions but relatively high in samples from thepollution region (Figure 4). The results together with thenontargeted OPLS-DA analysis confirmed that the “4.11” tapwater pollution incident in Lanzhou could be attributed to oilspill pollution. A previous study also screened elementalcompositions of thousands features by high resolution FT-ICRMS in two tanks of heavy fuel oils and field oil from a rockyshoreline along San Francisco Bay following the M/V CoscoBusan oil spil.32 While O2 species (possible NAs) wereidentified without any structure information and oxygenatedspecies of NAs (possible oxy-NAs) would have to be removedby solid phase extraction prior to instrument analysis, theabundance variations of NAs suggested that future studiesshould investigate the use of NA mixtures as a potential source-specific fingerprint for identification purpose. The present studyidentify O2 species and oxygenated products as the responsiblepollutants for the differences in profiles between regions during
the “4.11” tap water pollution incident in Lanzhou, and clarifiedthese feature to be NAs and oxy-NAs based on the chemicalderivatization and MS/MS analysis. The results is consistentwith the hypothesis of Corilo’s study,32 and demonstrated thatNA mixtures would be a source-specific marker for oilcontamination.Numerous studies have shown that NA mixtures were toxic
to aquatic organisms such as yellow perch embryos, JapaneseMedaka, larval amphibian etc., limited studies is available abouteffects of NAs on mammalian health and development.46,47
Hepatotoxicity as an acute effect was observed in the rat feedwith aqueous solutions containing 550.8 mg/L NAs.47 Andexpression of cardiac specific markers were significantly up-regulated in mouse embryonic stem cells exposed to NAs atconcentrations of 25 μg/L.46 The total concentrations ofdetected NA isomers ranged from 0.08 to 0.7 μg/L in tap watersamples from polluted regions in Lanzhou (Figure 4), whichwere much less than the effect concentrations of NAs in eitherrat or mouse stem cells, suggesting the low risks of dietaryuptake of the contaminants in the accidental pollution event.Targeted analysis of PAHs and alkyl-PAHs were conducted
in the water samples, since residues of PAH mixtures arecommon proxies to detect oil pollution, oil weathering, andsource identification at the oil spill impacted areas.48−51 Asshown in Table S2, the total concentrations of detected PAHsand alkyl-PAHs were in the range of 10.6−28.7 ng/L and 2.8−15.7 ng/L in water samples collected during the pollution andnonpollution periods, respectively. Significantly high concen-trations of PAH mixtures observed in water samples in thepollution events compared with those collected during the
Figure 4. Boxplots of typical identified markers (CnH2n+ZOx with Z of −8 to 0 and x of 2 to 5) in the tap water from the reference region (R) andpolluted region (P) during the events. All of the compounds exhibited statistically significantly higher levels in water samples from the pollutedregion (p < 0.05).
Environmental Science & Technology Article
DOI: 10.1021/acs.est.5b05755Environ. Sci. Technol. 2016, 50, 2956−2963
2961
nonpollution period suggested that oil contamination might bethe cause, which is consistent with the results of NAinvestigations. However, no significant spatial differencescould be found for PAH mixtures during the events, and thiscould be due to the fact that PAH mixtures have many othersources such as forest fires, agricultural burning, coal, andbacteria biosynthesis etc. Thus, compared with suspected targetanalysis, nontargeted screening would help found theresponsible pollutants, which is specifically related to thepollution sources, and contribute to rapidly discriminatepollution sources in accidental pollution events.While benzene is a natural part of crude oil, the presences of
benzene in environment is mostly related to the effluentdischarges of chemistry industrial, since the greatest use ofbenzene is as a building block for making plastics, rubber, resinsand synthetic fabrics.52 Thus, the pollution sources were notclear when benzene, one of the regular monitoring chemicals intap water, was detected with concentrations about 20 timesabove the national limit in Lanzhou. It took a long time for thelocal agency to find an oil leaking site close to the drinkingwater pipe, but no direct evidence between water samples andpollution sources can be provided based on the governmentreport. In the present study, the detection of NA mixtures,identified by a nontargeted analytical strategy and chemicalderivatization, demonstrated the an oil leaking as the majorcause of the event because NAs have unique sources for oilcontamination, providing direct evidence between watersamples and pollution sources. The nontargeted screening byhigh-resolution MS could potentially help to rapidly discrim-inate the regional difference between pollution and referenceareas and determine the actual pollutants responsible forpollution accidents.
■ ASSOCIATED CONTENT
*S Supporting InformationThe Supporting Information is available free of charge on theACS Publications website at DOI: 10.1021/acs.est.5b05755.
Text, figures, and tables addressing (1) chemicals andreagents; (2) sample analysis of PAH mixtures; (3)validation plots from permutation tests for nontargetedOPLS-DA analysis; (4) S-plots of OPLS-DA of watersamples from polluted and reference regions during theevent; (5) proposed structures of some oxy-NAs; (6)MS/MS spectra of oxy-NAs; (7) MS/MS spectra of oxy-NAs derivartized with DNS; (8) the scores plots ofOPLS-DA model for targeted analysis of NAs in watersamples during the events and nonpollution period; (9)validation plots obtained from permutation tests fortargeted OPLS-DA analysis; (10) structure informationon model NA compounds; and (11) levels of PAHs andalkyl-PAHs detected in all water samples (PDF)
■ AUTHOR INFORMATION
Corresponding Author*Tel/fax: 86-10-62759126; e-mail: [email protected](G.Z.).
NotesThe authors declare no competing financial interest.
■ ACKNOWLEDGMENTS
The research is supported by National Natural ScienceFoundation of China (21177003, 21422701), and NationalBasic Research Program of China (2015CB458900).
■ REFERENCES(1) Zhang, X. J.; Chen, C.; Lin, P. F.; Hou, A. X.; Niu, Z. B.; Wang, J.Emergency drinking water treatment during source water pollutionaccidents in China: Origin analysis, framework and technologies.Environ. Sci. Technol. 2011, 45, 161−167.(2) Elad, T.; Almog, R.; Yagur-Kroll, S.; Levkov, K.; Melamed, S.;Shacham-Diamand, Y.; Belkin, S. Online monitoring of water toxicityby use of bioluminescent reporter bacterial biochips. Environ. Sci.Technol. 2011, 45, 8536−8544.(3) Lewellyn, G. T.; Dorman, F.; Westland, J. L.; Yoxtheimer, D.;Grieve, P.; Sowers, T.; Humston-Fulmer, E.; Brantley, S. L. Evaluatinga groundwater supply contamination incident attributed to MarcellusShale gas development. Proc. Natl. Acad. Sci. U. S. A. 2015, 112, 6325−6330.(4) Bridges, O. Double trouble: health risks of accidental sewagerelease. Chemosphere 2003, 52, 1373−1379.(5) Liu, R. Z.; Borthwick, A. G. L.; Lan, D. D.; Zeng, W. H.Environmental risk mapping of accidental pollution and its zonalprevention in a city. Process Saf. Environ. Prot. 2013, 91, 397−404.(6) China Statistic Yearbook 2007; China Statistics Press: Beijing,China, 2008.(7) China Statistic Yearbook 2008; China Statistics Press: Beijing,China, 2009.(8) Pang, L. P.; Wang, W.; Qu, H. Q.; Hu, T.; Zhang, Y. Approach toidentifying a sudden continuous emission pollutant source based onsingle sensor with noise. Indoor Built Environ. 2014, 23, 955−970.(9) Bode, H.; Nusch, E. A. Advanced river quality monitoring in theRUHR basin. Water Sci. Technol. 1999, 40, 145−152.(10) Ren, Z.; Wang, Z. The differences in the behavior characteristicsbetween Daphnia magna and Japanese Madaka in an on-linebiomonitoring system. J. Environ. Sci. 2010, 22, 703−708.(11) Guitart, C.; Frickers, P.; Horrillo-Caraballo, J.; Law, R. J.;Readman, J. W. Characterization of sea surface chemical contami-nation after shipping accidents. Environ. Sci. Technol. 2008, 42, 2275−2282.(12) Martin Peinado, F. J.; Romero-Freire, A.; Garcia Fernandez, I.;Sierra Aragon, M.; Ortiz-Bernad, I.; Simon Torres, M. Long-termcontamination in a recovered area affected by a mining spill. Sci. TotalEnviron. 2015, 514, 219−223.(13) Chandru, K.; Pauzi Zakaia, M.; Anita, S.; Shahbazi, A.; Sakari,M.; Bahry, P. S.; Mohamed, C. A. R. Characterization of alkanes,hopanes, and polycyclic aromatic hydrocarbons (PAHs) in tar-ballscollected from the East Coast of Peninsular Malaysia. Mar. Pollut. Bull.2008, 56, 950−962.(14) Al-Salhi, R.; Abdul-Sada, A.; Lange, A.; Tyler, C. R.; Hill, E. M.The xenometabolome and novel contaminant markers in fish exposedto a wastewater treatment works effluent. Environ. Sci. Technol. 2012,46, 9080−9088.(15) Schymanski, E. L.; Singer, H. P.; Longree, P.; Loos, M.; Ruff,M.; Stravs, M. A.; Vidal, C. R.; Hollender, J. Strategies to characterizepolar organic contamination in wastewater: Exploring the capability ofhigh resolution mass spectrometry. Environ. Sci. Technol. 2014, 48,1811−1818.(16) Peng, H.; Chen, C.; Saunders, D. M. V.; Sun, J. X.; Tang, S.;Codling, G.; Hecker, M.; Wiseman, S.; Jones, P. D.; Li, A.; Rockne, K.J.; Giesy, J. P. Untargeted identification of oragno-brominecompounds in lake sediments by ultrahigh-resolution mass spectrom-etry with the data-independent precursor isolation and characteristicfragment method. Anal. Chem. 2015, 87, 10237−10246.(17) Schymanski, E. L.; Singer, H. P.; Slobodnik, J.; Ipolyi, I. M.;Oswald, P.; Krauss, M.; Schulze, T.; Haglund, P.; Letzel, T.; Grosse, S.;Thomaidis, N. S.; Bletsou, A.; Zwiener, C.; Ibanez, M.; Portoles, T.; deBoer, R.; Reid, M. J.; Onghena, M.; Kunkel, U.; Schulz, W.; Guillon,
Environmental Science & Technology Article
DOI: 10.1021/acs.est.5b05755Environ. Sci. Technol. 2016, 50, 2956−2963
2962

A.; Noyon, N.; Leroy, G.; Bados, P.; Bogialli, S.; Stipanicev, D.;Rostkowski, P.; Hollender, J. Non-target screening with high-resolution mass spectrometry: critical review using a collaborativetrial on water analysis. Anal. Bioanal. Chem. 2015, 407, 6237−6255.(18) Xu, X.; Roman, J. M.; Issaq, H. J.; Keefer, L. K.; Veenstra, T. D.;Ziegler, R. G. Quantitative measurement of endogenous estrogens andestrogen metabolites in human serum by liquid chromatography-tandem mass spectrometry. Anal. Chem. 2007, 79, 7813−7821.(19) Chang, H.; Wan, Y.; Naile, J.; Zhang, X. W.; Wiseman, S.;Hecker, M.; Lam, M. H. W.; Giesy, J. P.; Jones, P. D. Simultaneousquantification of multiple classes of phenolic compounds in bloodplasma by liquid chromatography-electrospray tandem mass spec-trometry. J. Chromat. A 2010, 1217, 506−513.(20) Peng, H.; Hu, K. J.; Zhao, F. R.; Hu, J. Y. Derivatization methodfor sensitive determination of fluorotelomer alcohols in sediment byliquid chromatography-electrospray tandem mass spectrometry. J.Chromat. A 2013, 1288, 48−53.(21) Hardas, N. R.; Adam, R.; Uden, P. C. Alkene determination bybromination and gas chromatography with element-selective atomicplasma spectroscopic detection. J. Chromatogr. A 1999, 844, 249−258.(22) Merlin, M.; Guigard, S. E.; Fedorak, P. M. Detecting naphthenicacids in waters by gas chromatography-mass spectrometry. J.Chromatogr. A 2007, 1140, 225−229.(23) Wang, B. L.; Wan, Y.; Gao, Y. X.; Yang, M.; Hu, J. Y.Determination and Characterization of Oxy-Naphthenic Acids inOilfield Wastewater. Environ. Sci. Technol. 2013, 47, 9545−9554.(24) Wan, Y.; Wang, B. L.; Khim, J. S.; Hong, S.; Shim, W. J.; Hu, J.Y. Naphthenic acids in costal sediments after the Hebei spirit oil spill:a potential indicator for oil contamination. Environ. Sci. Technol. 2014,48, 4153−4162.(25) Ibanez, M.; Sancho, J. V.; McMillan, D.; Rao, R.; Hernandez, F.Rapid non-target screening of organic pollutants in water byultraperformance liquid chromatography coupled to time-of-lightmass spectrometry. TrAC, Trends Anal. Chem. 2008, 27, 481−489.(26) Garcia-Reyes, J. F.; Hernando, M. D.; Molina-Diaz, A.;Fernandez-Alba, A. R. Comprehensive screening of target, non-targetand unknown pesticides in food by LC-TOF-MS. TrAC, Trends Anal.Chem. 2007, 26, 828−841.(27) Chen, Y.; Zhang, N.; Ma, J.; Zhu, Y.; Wang, M.; Wang, X. M.;Zhang, P. A Platelet/CMC coupled with offline UPLC-QTOF-MS/MS for screening antiplatelet activity components from aqueousextract of Danshen. J. Pharm. Biomed. Anal. 2016, 117, 178−183.(28) Tang, Y. N.; Pang, Y. X.; He, X. C.; Zhang, Y. Z.; Zhang, J. Y.;Zhao, Z. Z.; Yi, T.; Chen, H. B. UPLC-QTOF-MS identification ofmetabolites in rat biosamples after oral administration of Dioscoreasaponins: A comparative study. J. Ethnopharmacol. 2015, 165, 127−140.(29) Zhang, H. M.; Li, S. L.; Zhang, H.; Wang, Y.; Zhao, Z. L.; Chen,S. L.; Xu, H. X. Holistic quality evaluation of commercial white and redginseng using a UPLC-QTOF-MS/MS-based metabolomics approach.J. Pharm. Biomed. Anal. 2012, 62, 258−273.(30) Guo, W. Between preventive supervision and relief supervision:from the perspective of water benzene pollution event in Lanzhou city.Environ. Prot. 2014, 13, 26−29.(31) Mueller, A.; Schulz, W.; Ruck, W. K. L.; Weber, W. H. A newapproach to data evaluation in the non-target screening of organictrace substances in water analysis. Chemosphere 2011, 85, 1211−1219.(32) Corilo, Y. E.; Podgorski, D. C.; McKenna, A. M.; Lemkau, K. I.;Reddy, C. M.; Mashall, A. G.; Rodgers, R. P. Oil spill sourceidentification by principal component analysis of electrosprayionization fourier transform ion cyclotron resonance mass spectra.Anal. Chem. 2013, 85, 9064−9069.(33) Wang, X.; Kasperki, K. L. Analysis of naphthenic acids inaqueous solution using HPLC-MS/MS. Anal. Methods 2010, 2, 1715−1722.(34) Hindle, R.; Noetheden, M.; Peru, K.; Headley, J. Quantitativeanalysis of naphthenic acids in water by liquid chromatography-accurate mass time-of-flight spectrometry. J. Chromatogr. A 2013,1286, 166−174.
(35) Shang, D.; Kim, M.; Haberl, M.; Legadins, A. Development of arapid liquid chromatography tandem mass spectrometry method forscreening of trace naphthenic acids in aqueous environments. J.Chromatogr. A 2013, 1278, 98−107.(36) Rudzinski, W. E.; Oehlers, L.; Zhang, Y. Tandem massspectrometric characterization of commercial naphthenic acids and aMaya crude oil. Energy Fuels 2002, 16, 1178−1185.(37) Han, X. M.; Mackinnon, M. D.; Martin, J. W. Estimating the insitu biodegradation of naphthenic acids in oil sands process waters byHPLC/HRMS. Chemosphere 2009, 76, 63−70.(38) Barrow, M. P.; Headley, J. V.; Peru, K. M.; Derrivk, P. J. Datavisualization for the characterization of naphthenic acids withinpetroleum samples. Energy Fuels 2009, 23, 2592−2599.(39) Grewer, D. M.; Young, R. F.; Whittal, R. M.; Fedorak, P. M.Naphthenic acids and other acid-extractables in water samples fromAlberta: what is being measured? Sci. Total Environ. 2010, 408, 5997−6010.(40) Scott, A. C.; Young, R. F.; Fedorak, P. M. Comparison of GC-MS and FTIR methods for quantifying naphthenic acids in watersamples. Chemosphere 2008, 73, 1258−1264.(41) Watson, J. S.; Jones, D. M.; Swannell, R. P. J.; van Duin, A. C. T.Formation of carboxylic acids during aerobic biodegradation of crudeoil and evidence of microbial oxidation of hopanes. Org. Geochem.2002, 33, 1153−1169.(42) Bataineh, M.; Scott, A. C.; Fedorak, P. M.; Martin, J. W.Capillary HPLC/QTOF-MS for characterizing complex naphthenicacid mixtures and their microbial transformation. Anal. Chem. 2006,78, 8354−8361.(43) Holowenko, F. M.; Mackinnon, M. D.; Fedorak, P. M.Characterization of naphthenic acids in oil sands waste waters bygas chromatography-mass spectrometry. Water Res. 2002, 36, 2843−2855.(44) Martin, J. W.; Han, X. M.; Peru, K. M.; Headley, J. V.Comparison of high- and low-resolution electrospray ionization massspectrometry for the analysis of naphthenic acid mixtures in oil sandsprocess water. Rapid Commun. Mass Spectrom. 2008, 22, 1919−1924.(45) Clemente, J. S.; Prasad, N. G. N.; Mackinnon, M. D.; Fedorak,P. M. A statistical comparison of naphthenic acids characterized by gaschromatography-mass spectrometry. Chemosphere 2003, 50, 1265−1274.(46) Mohseni, P.; Hahn, N. A.; Frank, R. A.; Hewitt, L. M.;Hajibabaei, M.; Van Der Kraak, G. Naphthenic acid mixtures from oilsands process-affected water enhance differentiation of mouseembryonic stem cells and affect development of the heart. Environ.Sci. Technol. 2015, 49, 10165−10172.(47) Rogers, V. V.; Wickstrom, M.; Liber, K.; MacKinnon, M. D.Acute and subchronic mammalian toxicity of naphthenic acids from oilsands tailings. Toxicol. Sci. 2002, 66, 347−355.(48) Wang, Z. D.; Fingas, M.; Page, D. S. Oil Spill identification. J.Chromat. A 1999, 843, 369−411.(49) Douglas, G. S.; Bence, A. E.; Prince, R. C.; McMillen, S. J.;Butler, E. L. Environmental stability of selected petroleum hydro-carbon source and weathering ratios. Environ. Sci. Technol. 1996, 30,2332−2339.(50) Boehm, P. D.; Douglas, G. S.; Burns, W. A.; Mankiewicz, P. J.;Page, D. S.; Bence, A. E. Application of petroleum hydrocarbonchemical fingerprinting and allocation techniques after the ExxonValdez oil spill. Mar. Pollut. Bull. 1997, 34, 599−613.(51) Hong, S.; Khim, J. S.; Ryu, J.; Park, J.; Song, S. J.; Kwon, B. −O.; Choi, K.; Ji, K.; Seo, J.; Lee, S.; Park, J.; Lee, W.; Choi, Y.; Lee, L.T.; Kim, C.-K.; Shim, W. J.; Naile, J. E.; Giesy, J. P. Two years after theHebei Spirit oil spill: residual crude-derived hydrocarbons and potentialAhR-mediated activities in coastal sediments. Environ. Sci. Technol.2012, 46, 1406−1414.(52) Health Canada. Guidelines for Canadian drinking water quality,guideline technical document benzene, 2009.
Environmental Science & Technology Article
DOI: 10.1021/acs.est.5b05755Environ. Sci. Technol. 2016, 50, 2956−2963
2963