Embed Size (px)
Citation preview


- 1 -
Evaluate and Control the weld quality, Using Acoustic data and Artificial Neural Network Modeling
Mohsen Ghofrani1, Hamid Shahabi2, Farhad Kolahan3
1M.sc. Student, [email protected] 2Ph.D Student, [email protected] 3Associate Professor, [email protected]
Department of Mechanical Engineering, Ferdowsi University of Mashhad (FUM), 9177948974, Mashhad, Iran,
(Phone: (98) 511 8805075; fax: (+98-511) 8436432)
Abstract The weld quality depends on many factors and parameters such as continuity of the weld, the weld penetration and the absence of defects in the weld. All these parameters have to be after the welding process (Off-line) examined. Since Welding sound signal is an important feedback, In this research it is used as a (On-line) Criterion to determine the weld quality. The purpose of this investigation is to evaluate and control the weld quality using acoustic parameters as input and Weld quality parameter as output in an artificial neural network. For this purpose, acoustic parameters welding process (The difference between the maximum and average sound intensity, The Average of Fast Fourier Transform – FFT coefficients and Standard deviation of FFT coefficients) as inputs and weld quality parameter (the percentage of weld quality) that is given by non-destructive testing and welding inspection, is considered as an output. The selection process for this study is The gas-shielded welding process (MIG), One of the most commonly used types of welding. Acoustic signals is recorded in the laboratory during the welding process. Acoustic parameters of the process is extracted by the signal processing. Weld quality parameter, also by Welding Inspection and Testing the quality of welded joints is determined. Finally, The relationship between acoustic parameters and weld quality parameter can be studied with the help of neural network modeling. After data analysis and prediction models, the results are presented. Keywords: Metal inert gaz (MIG), Acoustic data, Fast Fourier Transform ( FFT), On-line Criterion, Artificial Neural Network (ANN), Signal processing.
1. Introduction Welding is one of the means of production, Its purpose is the permanent connection of engineering materials (metals, ceramics, polymers, composites, etc) to another So that the binding properties of the base material properties. Due to the extensive application in various industries such as steel, automotive, machinery, oil industry, shipbuilding industry, Certain industries Aerospace and Airlines, Various techniques such as non-destructive tests to check the quality of welding is proposed and used [1,2]. At present, evaluation and control of production processes is one of the most common engineering research. So research on weld quality of welding processes is very important to pay special attention to it. The weld quality depends on many factors and parameters such as continuity of the weld, the weld penetration and the absence of defects in the weld. All these parameters have to be after the welding process (Off-line) examined. The purpose of this research to determine the weld quality is to find a (On-line) criterion during welding. In this context, Welding arc sound signal includes information from a wide range of boiling behavior is [3,4]. Features and behavior of the sound spectrum is closely related to the quality and texture of the weld [5]. Professional welders have learned this, by experience and training [6]. They actually listen to the voice signal welding, are set The welding parameters to achieve the desired geometry and quality.

- 2 -
For example, to better understand See the figure 1, Represent two types of welding, High Quality and Low Quality With their audio signal.
(a) (b)
Figure 1: (a) High quality weld, (b) Low quality weld
So in this study as a criterion to determine the weld quality, Welding arc sound is selected. Welding arc sound can be used as a controller for controlling weld quality can be used in the welding process. For this purpose the techniques of signal processing, statistical analysis and soft computing techniques with an artificial neural network will use. 2. Materials and Methods The selection process for this study is The gas-shielded welding process (MIG), One of the most commonly used types of welding. Acoustic signals is recorded in the laboratory during the welding process. Acoustic parameters of the process is extracted by the signal processing. Weld quality parameter, also by Welding Inspection and Testing the quality of welded joints is determined. Finally, The relationship between acoustic parameters and weld quality parameter can be studied with the help of neural network modeling. After data analysis and prediction models, the results are presented. 2.1 The gas-shielded welding process (MIG) In this process, the arc of electrical energy is heat source and shielding gas to protect the electrode tip, the droplet transfer during melting in the arc and molten metal pool against to Atmosphere used. In some processes, the inert gas, and in others, an inactive gas such as carbon dioxide are used. In some processes from a mixture of gases used. In this process, creating an arc, the electrode(welding wire) is constantly melting and is added to the welding area. Proportional to the electrode melting rate, The electrode enter to the weld pool with Certain speed [1,2].(Figure 2)
Figure 2: Schematic of the welding process, (MIG)

- 3 -
Process variables are; Welding current, Welding voltage, Welding speed, The type of electrode and electrode feed rate, Type, purity and pressure of the gas [1].
2.2 signal processing Signal processing is the science that focuses on the analysis of signals. In this study, Welding sound is sampled via a microphone and using the Matlab environment. For each experiment, the signal is processed to obtain the characteristics of the signal. Signal processing task is to identify the characteristics of the signal. For this purpose, characteristics of the signal (The difference between the maximum and average sound intensity, The Average of Fast Fourier Transform – FFT coefficients and Standard deviation of FFT coefficients) is considered as inputs to the neural network. These characteristics are obtained from the signal processing and FFT transform in Matlab software.
2.3 Design of experiments The welding parameters such as welding voltage, wire feed rate and welding speed are most important. For the experiments, four levels for welding voltage[20-24-28-32 (v)] because the most important, three levels for wire feed rate[6-8-10 (m/min)] and three levels for welding speed[145-290-435 (cm/min)] has been considered. According to the number of parameters and their levels, 36 experiments done and the outputs are measured. In table 1, the tests, Acoustic signals and welding shape for each test is shown.
Table 1: Matrix experiments, Acoustic signals and welding shape
Test Voltage(v) Wire feed rate(m/min) Welding speed(cm/min) Acoustic signals Welding shape
1 20 6 145
2 20 6 290
3 20 6 435
4 20 8 145
5 20 8 290
6 20 8 435
… … … … … … … … … … … … 34 32 10 145 35 32 10 290 36 32 10 435
2.4 Artificial Neural Network Modeling
Artificial neural network is the method based on process information and data. The structure of neural network models are derived from human brain and its neurons. The main feature of a neural network is the ability to learn complex relationships between inputs and outputs vectors. These networks of an input layer, one or more intermediate or hidden layer and an output layer are formed [7].

- 4 -
Each layer have small parts that are called neurons. Process information is done by neurons. The number of neurons in the input layer is equal to the number of input parameters and in output layer is equal to the number of output parameters. The intermediate layer, there may be one or more layers and number of neurons in each layer varies. Figure. 3. shows the structure of an artificial neural network.
Figure 3: The structure of an Artificial Neural Network, (ANN)
Neural networks are a mechanism for learning. This mechanism changes the weights of the neural network connections so that desired output are obtained. There are two methods of learning for neural networks, Supervised learning and unsupervised learning. In supervised learning, desired input and output are available. In this method, with enter input to the network and comparing the network output with desired output, the weights are changed until the difference between the network output and the desired output reaches an acceptable level. In order to achieve the objectives of this study using an artificial neural network with Neural Network Toolbox in Matlab. In this neural network, the inputs are acoustic parameters welding process (The difference between the maximum and average sound intensity, The Average of Fast Fourier Transform – FFT coefficients and Standard deviation of FFT coefficients) and the output is the percentage of weld quality. Inputs and output of the neural network, resulting from the experiments are shown in table 2.
Table 2: Inputs and output of the neural network, resulting from the experiments
3. Results and Discussion
In neural network modeling, 29 experiments as the primary data (data_train) and 7 experiments as (data_test) has been considered. Figure. 4. Compared the actual quality of the weld and the quality of the neural network model is obtained. As seen in this figure, data from the neural network model are in good agreement with the actual data. Therefore, a neural network is an appropriate model for evaluating weld quality.
Inputs output Test Average of FFT Std of FFT Max–Average, sound intensity weld quality (%) 1 0.7925 3.1799 0.0714 85 2 0.8263 3.5263 0.0624 90 3 0.8522 3.8725 0.0733 70 4 0.9535 3.5259 0.1598 77 5 1.6976 7.5718 0.0137 60 6 1.7690 7.2572 0.3335 30 … … … … … … … … … … 34 1.0538 4.1079 0.0995 40 35 1.0722 3.8415 0.1167 60 36 1.0193 3.7591 0.1260 50
- 5 -
Figure 4: Compare the Actual quality and ANN prediction of quality
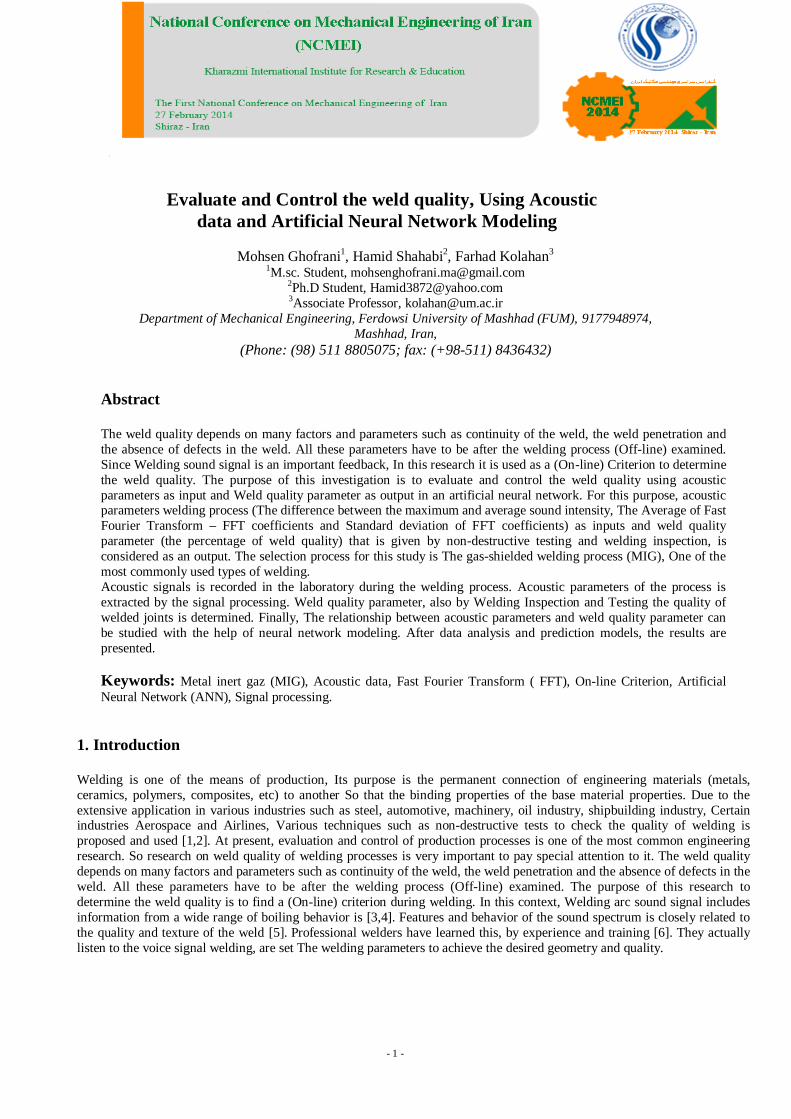
Figure. 5. shows the relationship between the weld quality and (Max-Average) sound intensity. According to this figure, (Max-Average) sound intensity decreases with increasing quality. One characteristic of a good weld is uniform surface. near the maximum sound intensity to the average sound intensity, shows the electric arc energy is more uniform. Therefore, whatever (Max-Average) sound intensity be lower, weld surface more uniform and better quality will be.
Figure 5: Comparison between the weld quality and (Max–Average) sound intensity
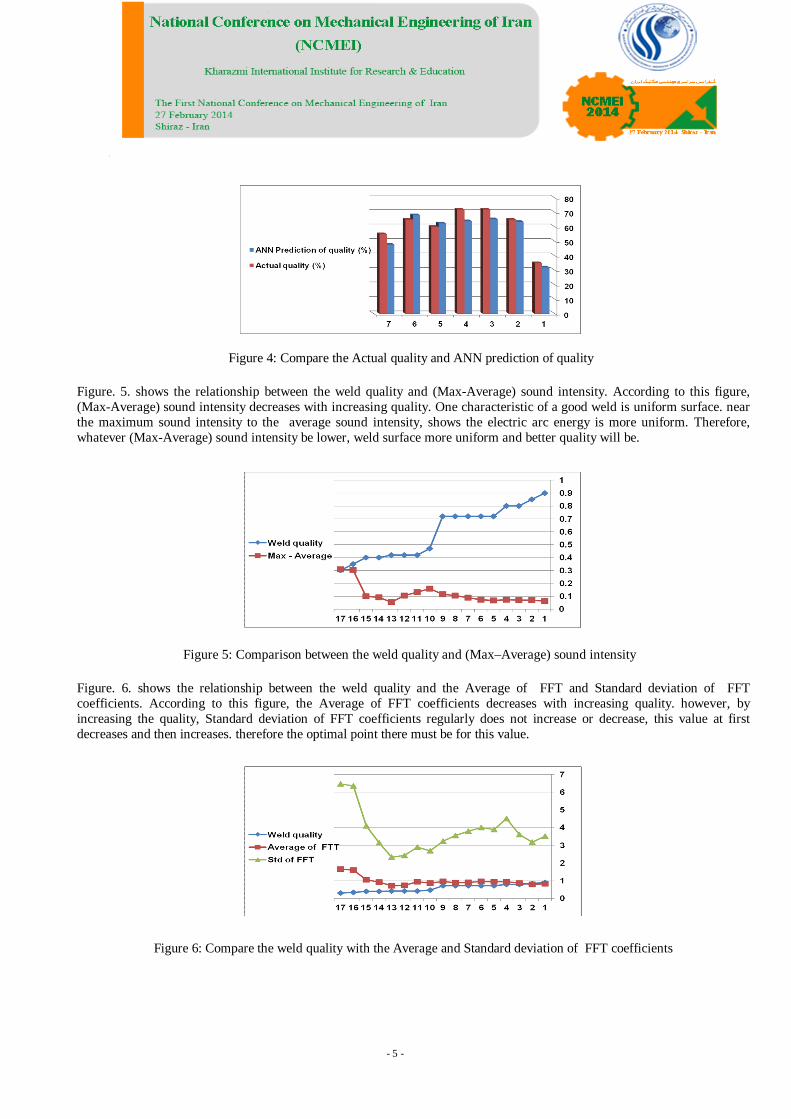
Figure. 6. shows the relationship between the weld quality and the Average of FFT and Standard deviation of FFT coefficients. According to this figure, the Average of FFT coefficients decreases with increasing quality. however, by increasing the quality, Standard deviation of FFT coefficients regularly does not increase or decrease, this value at first decreases and then increases. therefore the optimal point there must be for this value.
Figure 6: Compare the weld quality with the Average and Standard deviation of FFT coefficients

- 6 -
4. Conclusion
an Artificial Neural Network is an appropriate model for evaluating weld quality and using Acoustic data as a (On-line) Criterion to determine the weld quality. the inputs are acoustic parameters welding process (The difference between the maximum and average sound intensity, The Average of Fast Fourier Transform – FFT coefficients and Standard deviation of FFT coefficients) and the output is the percentage of weld quality. data from the neural network model are in good agreement with the actual data. the relationship between the weld quality and (Max-Average) sound intensity is, (Max-Average) sound intensity decreases with increasing quality. whatever (Max-Average) sound intensity be lower, weld surface more uniform and better quality will be. Also, the Average of FFT coefficients decreases with increasing quality. however, by increasing the quality, Standard deviation of FFT coefficients regularly does not increase or decrease, this value at first decreases and then increases, therefore the optimal point there must be for this value. References [1] The book of Welding Technology, Amir Hossein Kokabee, Sharif University Publications. [2] Basics Welding workshop and Welding Technology, Javad Akbari, Kiyanosh Abuali, Darwish Taheri and Mohammed Karami (Shahrab Publications - Ayandesazan). [3] Investigation on Welding Arc Sound (Report1). Arata, Yoshiaki, et al. 1979, Transaction of JWRI, Vol. 8(1), pp. 25-31. [4] The Arc Sound Characteristic On MIG Weld Penetration.Liu, Lijun and Lan, Hu. s.l. : Trans Tech Publications, 2010, Advanced Materials Research, Vols. 97-101, pp. 3948-3951. [5] Investigation on Acoustic Signals for On-line Monitoring of Welding. Lv, Na and Chen, Shanben. s.l. : Springer-Verlag, 2011, Robotic Welding, Inteligence and Automation, Vol. 88, pp. 235-243. [6] Biocybernetic investigations of hand movements of human operator in hand welding. Kralj, V. 1968, IIW/IIS Doc, pp. 212-140-68. [7] Artificial neural network modeling of weld joint strength prediction of a pulsed metal inert gas welding process using arc signals (Sukhomay Pal, Surjya K. Pal, Arun K. Samantaray Department of Mechanical Engineering, Indian Institute of Technology, Kharagpur 721302, India). [8] Investigation on arc sound and metal transfer modes for on-line monitoring in pulsed gas metal arc welding (Kamal Pal, Sandip Bhattacharya, Surjya K. Pal Department of Mechanical Engineering, Indian Institute of Technology Kharagpur, Kharagpur 721302, West Bengal, India). [9] Analysis of arc sound characteristics for gas tungsten argon welding(J.F. Wang, B. Chen, H.B. Chen and S.B. Chen Institute University of Welding Technology, Shanghai Jiao Tong University, Shanghai, People’s Republic of China). [9] Li, C. and Chou, T.W. (2004), International Journal of Solids and Structures 40, 2487–2499. [10] Feasibility study of acoustic signals for on-line monitoring in short circuit gas metal arc welding. Ladislav Grad ( Fotona d.d., Stegne 7, Ljubljana, Slovenia). Janez Grum, Ivan Polajnar, Janez Marko Slabe( Faculty of Mechanical Engineering, University of Ljubljana, Aškerčeva 6, P.O.B. 394, Ljubljana, Slovenia). [email protected].


![One platform Multiple options...GOST Butt weld DIN Butt weld ANSI Butt weld Socket weld Female 1 pipe thread F-con. ) butt weld GOST Butt weld [mm] [in.] D A SOC FTP F G D A SOC FTP](https://img.pdfslide.us/doc/110x75/5fe23d7adfe1ef18be65fa23/one-platform-multiple-options-gost-butt-weld-din-butt-weld-ansi-butt-weld-socket.jpg)
![home [profdoc.um.ac.ir]profdoc.um.ac.ir/articles/a/1030669.pdf · home For Authors Editorial Board current issue All Issues Next issue contact Research for Quality Management:: Asian](https://img.pdfslide.us/doc/110x75/5e0ff97724e9b57ee72fd105/home-home-for-authors-editorial-board-current-issue-all-issues-next-issue-contact.jpg)


![Visual Weld Inspection Guidelines Attachment A - …2].pdf · Visual Weld Inspection Guidelines Attachment A ... approved weld inspector shall document weld inspection results using](https://img.pdfslide.us/doc/110x75/5a78aa797f8b9a21538b97b6/visual-weld-inspection-guidelines-attachment-a-2pdfvisual-weld-inspection.jpg)