Embed Size (px)
Citation preview

EUROPEAN UNION TRADING BLOC: THE EFFECT OF INTEGRATION ON ECONOMIC AND SOCIOECONOMIC FACTORS
Elizabeth Mariotz Assistant Professor of Marketing
Philadelphia University School House Lane and Henry Avenue
Philadelphia, PA 19144 Phone: (215) 951-2712 Fax: (215) 951-2652
Email: [email protected]
D.K. Malhotra Associate Professor of Finance
Philadelphia University School House Lane and Henry Avenue
Philadelphia, PA 19144 Phone: (215) 951-2813
Fax: (215) 951-2652 Email: [email protected]
April 2004
Preliminary Draft For presentation at the International Conference at Port of Spain, Trinidad and Tobago

EUROPEAN UNION TRADING BLOC: THE EFFECT OF INTEGRATION ON ECONOMIC AND SOCIOECONOMIC FACTORS
Abstract

EUROPEAN UNION TRADING BLOC: THE EFFECT OF INTEGRATION ON ECONOMIC AND SOCIOECONOMIC FACTORS
I. BACKGROUND OF TRADING BLOCS
Much has been written in favor of a global economy stating that it provides world
citizens with access to more (and perhaps better) goods and services. It draws people
closer together, and through technology allows for better communication. There is also
another phenomenon to reconcile with and that is regional integration. “Regional
economic integration is the political and economic agreements among countries that give
preference to member countries to the agreement” (Daniels, Radebaugh, Sullivan, 2004,
pp. 204-5). There are four levels of regional economic integration:
• Free Trade Agreement in which countries remove trading barriers among its
members.
• Customs Union in addition to the conditions of FTA include common tariffs
toward non-members.
• Common Market which allows for mobility of resources and production.
• Economic Integration which establishes common economic policies and has
some political integration without countries relinquishing their sovereignty.
In recent years, regional economic integration has grown. There are at least twelve
regional integrated areas in the world with the European Union being the oldest and the
most integrated. The inspiration for a united Europe began shortly after World War II
and became a reality in 1993. It took the commitment and resilience of its people to
achieve this status. It is a work in progress and has set the stage for other regions around
the world.
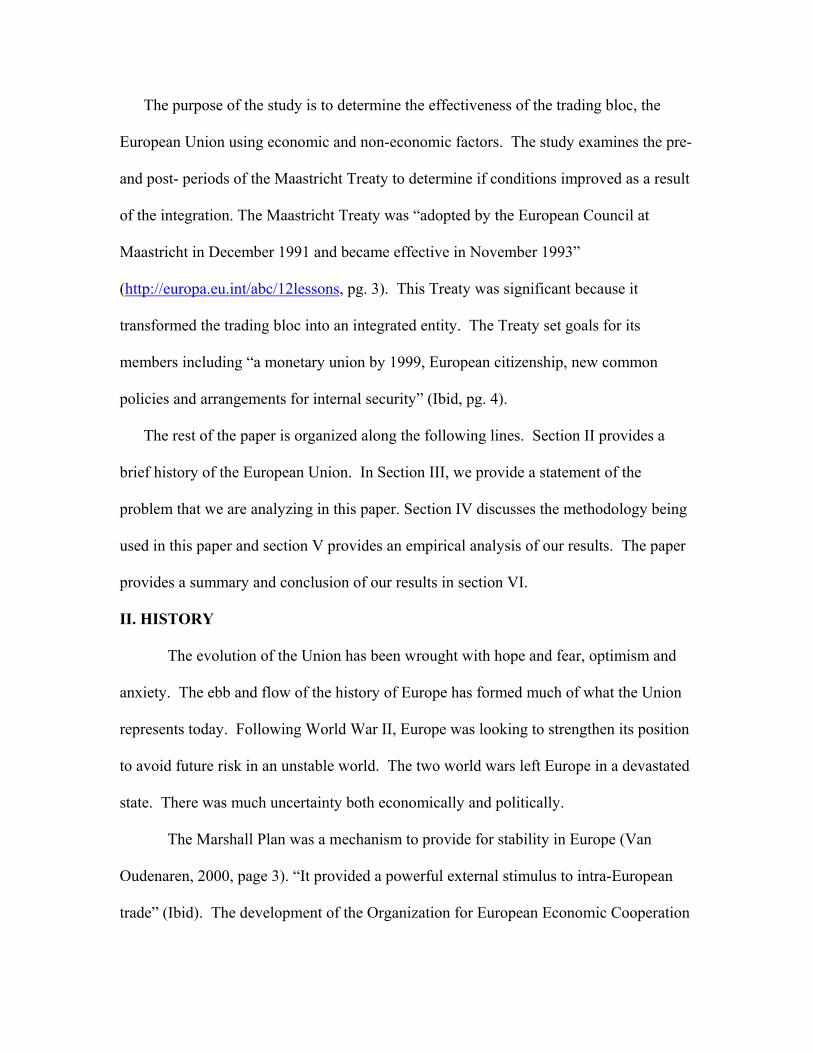
The purpose of the study is to determine the effectiveness of the trading bloc, the
European Union using economic and non-economic factors. The study examines the pre-
and post- periods of the Maastricht Treaty to determine if conditions improved as a result
of the integration. The Maastricht Treaty was “adopted by the European Council at
Maastricht in December 1991 and became effective in November 1993”
(http://europa.eu.int/abc/12lessons, pg. 3). This Treaty was significant because it
transformed the trading bloc into an integrated entity. The Treaty set goals for its
members including “a monetary union by 1999, European citizenship, new common
policies and arrangements for internal security” (Ibid, pg. 4).
The rest of the paper is organized along the following lines. Section II provides a
brief history of the European Union. In Section III, we provide a statement of the
problem that we are analyzing in this paper. Section IV discusses the methodology being
used in this paper and section V provides an empirical analysis of our results. The paper
provides a summary and conclusion of our results in section VI.
II. HISTORY
The evolution of the Union has been wrought with hope and fear, optimism and
anxiety. The ebb and flow of the history of Europe has formed much of what the Union
represents today. Following World War II, Europe was looking to strengthen its position
to avoid future risk in an unstable world. The two world wars left Europe in a devastated
state. There was much uncertainty both economically and politically.
The Marshall Plan was a mechanism to provide for stability in Europe (Van
Oudenaren, 2000, page 3). “It provided a powerful external stimulus to intra-European
trade” (Ibid). The development of the Organization for European Economic Cooperation

(OEEC) in 1948 was formed to “provide a forum in which the member states negotiated
arrangements to lower intra-European trade and currency barriers.” (Ibid) This was the
genesis to integrate Europe. OEEC was very significant as an initial step toward that
integration. It was “established to help members promote production and trade, establish
a multilateral payment system among members(….) study the possibility of custom
unions or free trade areas, reduce barriers to trade, maintain stable currencies, and make
full and effective use of manpower” (gtd. in Archer, 46, 1994: OEEC Convention,
Articles 2-8).
The path that led to the European Union included major developments along the
way. In 1949, the Council of Europe was established “to achieve a greater unity between
its members for the purpose of safeguarding and realizing the ideals and principles which
are their common heritage and facilitating their economic and social progress”, stated in
the Statute of the Council of Europe (gtd. in Van Oudenaren, 2000, page 5). In 1957, the
European Economic Community (EEC) emerged establishing “a large single market that
would ensure the free movement of goods, people, capital and services with a wide
measure of common economic policies” (Costin, 1996, page 14).
In the 1970’s, the EEC recognized a need to coordinate monetary policy. Thus
the European Monetary System (EMS) was established in 1979. It “helped stabilize
exchange rates and encouraged the Community member states to implement strict
policies that allowed them to maintain their mutual solidarity and to discipline their
economies” (http://europa.eu.int/abc/12lessons: Historic Steps, pg. 2).
The EEC came to be known as the European Community which then changed to
what it is called today, the European Union. In the mid 1980’s, the president of the

European Commission, which is a branch of the Union, pursued rigorously, the
establishment of a single market. In February 1986 the Single European Act was signed
moving the EC toward a total integrated body, the European Union.
Ultimately, the success of the Union was the establishment of a common
currency. In the Maastricht Treaty, it stated that “the national currencies will be replaced
by a single European currency—provided the countries concerned meet a number of
economic conditions” (http://europa.eu.int/abc/12lessons: Economic and Monetary
Union and the Euro, pg.1). Criteria included “that the country’s budget deficit cannot
exceed 3% of its gross domestic product (GDP) for more than a short period. Public
borrowing must not exceed 60% of GDP. Prices and interest rates must also remain
stable over a long period, as must exchange rates between the currencies concerned”
(Ibid). The timeline for having a totally integrated currency follows:
January 1994: the European Monetary Institute
June 1997: Stability and Growth Pact
May 1999: Beginning of the Euro
January 2002: Euro coins and notes introduced
(http://europa.eu.int/abc/12lessons: Economic and Monetary Union and the Euro, pp. 1-2)
In 1998, the European Central Bank was established for “setting monetary policy
and managing the exchange –rate system for all of Europe since January 1, 1999”
(Daniels, Radebaugh, Sullivan, 2004, pg. 213).

MEMBERSHIP
The European Union has 15 members with 10 more nations joining it in 2004. The
current members are:
1951: Belgium, France, Germany, Italy, Luxembourg, The Netherlands
1973: Denmark, Ireland, United Kingdom
1980: Greece
1986: Spain, Portugal
1995: Austria, Finland, Sweden
The Enlargement includes the following countries in 2004:
Estonia, Latvia, Lithuania, Poland, Czech Republic, Slovakia, Hungary, Slovenia,
Malta, Cyprus.
It is anticipated that Bulgaria and Romania will become members in 2007.
ECONOMIC SIGNIFICANCE OF THE EUROPEAN UNION
The European Union has a population of 385,400,000, a gross national
income of $8,307,426,000 and a per capita of $23,815 according to the World
Bank Atlas, 2001. (Source cited in chart in Daniels, Radegaugh, Sullivan, 2004,
pg. 212.) With its enlargement it will increase by a population of 75,093, a gross
national income of $329,131,000 and the per capita gross national income of its
new members is $10,795 as stated in the World Bank Atlas, 2001. (Ibid).
The World Bank Atlas, 2001 shows that this compares to the United States
which has a population of 278,230, a gross national income of $8,879,500 and a

per capita of $31,910. (Source cited in chart in Daniels, Radegaugh, Sullivan,
2004, pg. 216.)
III. STATEMENT OF THE PROBLEM
The” idea of a united Europe” was motivated by the desire of a “peaceful ‘United
States of Europe’ inspired by humanistic ideas,” (http://europa.eu.int/abc/12lessons:
Why the European Union) while addressing issues of European safety and security
through economic and social solidarity among the European nations. (Ibid.)
“The European Union has been built to achieve political goals, but its dynamism and
success spring from its economic foundations-the ‘single market’ formed by all the EU
member states, and the single currency (the euro) used by 12 of them.” (Ibid.) “Europe’s
post-industrial societies are becoming increasingly complex. Standards of living have
risen steadily, but there are still gaps between rich and poor and they may widen as
former Communist countries join the EU. That is why it is important for EU member
states to work more closely together on tackling social problems.” (Ibid.)
“In the long run, every EU country benefits from this cooperation. Half a century of
European integration has shown that the whole is greater than the sum of its parts. The
EU as a unit has much more economic, social, technological, commercial and political
‘clout’ than the individual efforts of its member states, even when taken together. There
is added value in acting as one and speaking with a single voice as the European Union.”
(Ibid.)

The study sets out to measure the effectiveness of the integration of Europe by
analyzing both economic and socioeconomic factors. The Maastricht Treaty has been
identified as the determining point because of its significance in transitioning Europe
from a community into a union. The study will compare the two periods: pre-Treaty
1984 -1993 and post-Treaty 1994 -2003.
The European Council established three major criteria for acceptance into the Union.
First, a political criterion: candidate countries must have stable institutions
guaranteeing democracy, the rule of law, human rights and respect for and
protection of minorities. Second, an economic criterion: candidate countries
must have a functioning market economy and be able to cope with competitive
pressure and market forces within the Union. Third, the criterion of being able to
take on the obligations of EU membership, including adherence to the aims of
political, economic and monetary union. This means candidate countries must
adopt the entire body of EU law-known as the acquis communautaire.
(http://eurpoa.eu.int/abc/12lessons: Enlargement pg. 1)
The study will evaluate the progress made by members of the Union by evaluating the
various economic and non-economic factors for each of the 15 states of the union
IV. DATA AND METHODOLOGY
The data for this study is obtained from Countrydata.com. Twenty-two (22)
variables, 11 economic and 11 non-economic, are used to evaluate the impact of
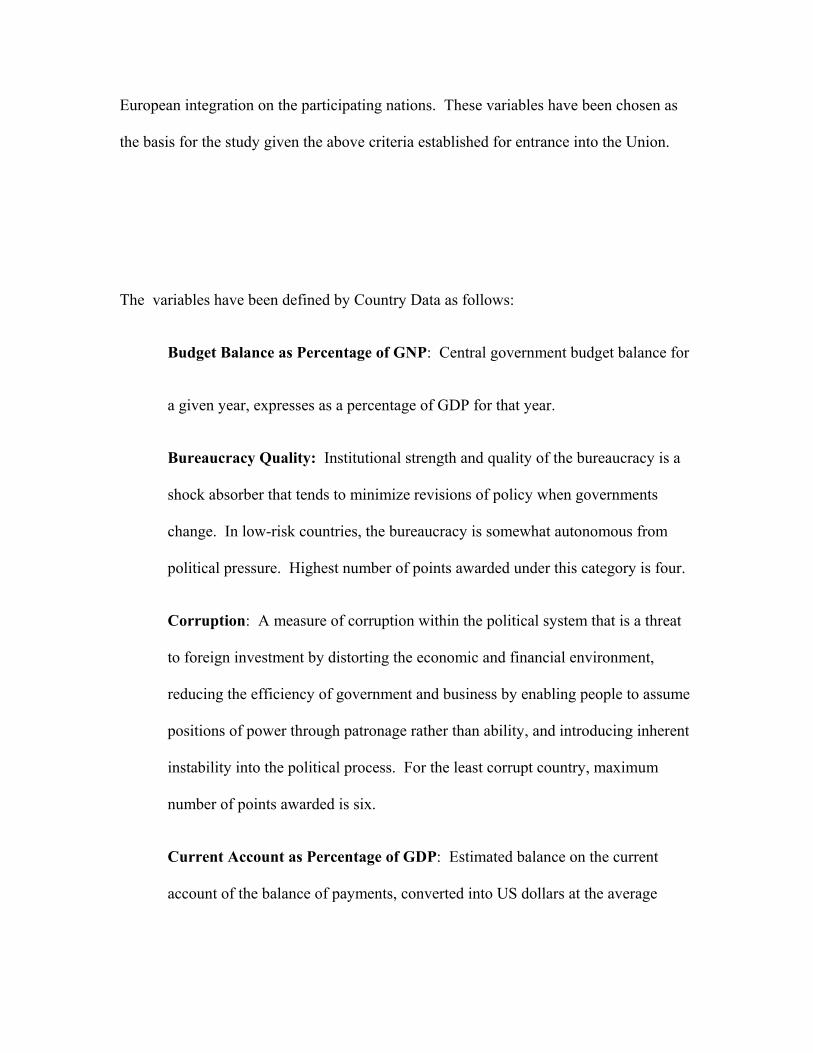
European integration on the participating nations. These variables have been chosen as
the basis for the study given the above criteria established for entrance into the Union.
The variables have been defined by Country Data as follows:
Budget Balance as Percentage of GNP: Central government budget balance for
a given year, expresses as a percentage of GDP for that year.
Bureaucracy Quality: Institutional strength and quality of the bureaucracy is a
shock absorber that tends to minimize revisions of policy when governments
change. In low-risk countries, the bureaucracy is somewhat autonomous from
political pressure. Highest number of points awarded under this category is four.
Corruption: A measure of corruption within the political system that is a threat
to foreign investment by distorting the economic and financial environment,
reducing the efficiency of government and business by enabling people to assume
positions of power through patronage rather than ability, and introducing inherent
instability into the political process. For the least corrupt country, maximum
number of points awarded is six.
Current Account as Percentage of GDP: Estimated balance on the current
account of the balance of payments, converted into US dollars at the average

exchange rate for the year, expressed as a percentage of GDP, converted into US
dollars at the average rate of exchange for the period covered.
Current Account as Percentage of XGS: Estimated balance on the current
account of the balance of payments, converted to US$ at average rate, expressed
as a percentage of total exports of goods and services (XGS), converted into US$
at exchange rate for period covered.
Democratic Accountability: A measure of, not just whether there are free and
fair elections, but how responsive government is to its people. The less
responsive it is, the more likely it will fall. Even democratically elected
governments can delude themselves into thinking they know what is best for the
people, regardless of clear indications to the contrary from the people. Maximum
number of points awarded for a country that has the most democratic
accountability is six.
Economic Risk Rating: This is a means of assessing a country’s current
economic strengths and weaknesses. In general, where strengths outweigh
weaknesses, a country will show low risk and where weaknesses outweigh
strengths, the economic risk will be high. To ensure comparability between
countries, risk components are based on accepted ratios between the measured
data within the national economic/financial structure, and then the ratios are
compared, not the data. Risk points are assessed for each of the component
factors of GDP per head of population, real annual GDP growth, annual inflation
rate, budget balance as a percentage of GDP, and current account balance as a

percentage of GDP. Risk ratings range from a high of 50 (least risk) to a low of 0
(highest risk), though lowest de facto ratings are generally near 15.
Ethnic Tensions: Ethnic Tensions is a measure of the degree of tension
attributable to racial, national, or language divisions. Lower ratings (higher risk)
are given to countries where tensions are high because opposing groups are
intolerant and unwilling to compromise. For the least risky country, the
maximum number of points is six.
Exchange Rate Stability: It is measured by the annual percentage change in the
exchange rate of the national currency against the US dollar (against the euro in
the case of the US).
External Conflict: A measure of the risk to the incumbent government and to
inward investment, ranging from trade restrictions and embargoes through
geopolitical disputes, armed threat, border incursions, foreign-supported
insurgency and full-scale warfare. Twelve points (the highest) are awarded to a
country that is least risky in terms of external conflict.
Financial Risk Rating: It is a means of assessing a country’s ability to pay its
way by financing its official, commercial and trade debt obligations. To ensure
comparability between countries, risk components are based on accepted ratios
between the measured data within the national economic/financial structure, and
then the ratios are compared, not the data. Risk points are assessed for each of the
component factors of foreign debt as a percentage of GDP, foreign debt service as
a percentage of exports of goods and services (XGS), current account as a

percentage of XGS, net liquidity as months of import cover, and exchange rate
stability. Risk ratings range from a high of 50 (least risk) to a low of 0 (highest
risk),, though lowest de facto ratings are generally near 20.
GDP per Head of Population: Gross domestic product per head of population,
converted into US dollars at the average exchange rate for that year.
Government Stability: A measure of the government’s ability to stay in office
and carry out its declared program(s), depending upon such factors as the type of
governance, cohesion of the government and governing parties, approach of an
election, and command of the legislature. Twelve points mean that the country
has the most stable government.
Inflation: Estimated annual inflation rate, expressed as the weighted average of
the Consumer Price Index and calculated as a percentage change.
Internal Conflict: A measure of political violence and its actual or potential
impact on governance, taking into consideration such factors as whether threats
exist, whether they have political objectives, the size and strength of support, and
the geographic nature of the conflict. Twelve points are awarded to the least risk
country.
International Liquidity: Estimated annual net liquidity expressed as months of
cover and calculated as the official reserves of the individual countries, including
their official gold reserves calculated at current free market prices, but excluding
the use of IMF credits and the foreign liabilities of the monetary authorities.

Law and Order: Two measures comprising one risk component. Each sub-
component equals half of the total. The “law” sub-component assesses popular
observance of the law. Maximum of six points are awarded to the country that
has law and order.
Real GDP Growth: Annual change in estimated Gross Domestic Product, at a
constant 1990 prices (for data in the 1990s), of a given country is expressed as a
percentage increase or decrease.
Religious Tensions: A measure of religious tensions arising from the domination
of society and/or governance by a single religious group—or a desire to
dominate—in a way that replaces civil law by religious law, excludes other
religions from the political/social processes, suppresses religious freedom or
expressions of religious identity. The risks involved ranging from inexperienced
people imposing inappropriate policies to civil dissent or civil war. Maximum of
six points are for a country that has the least religious tensions.
Socioeconomic Conditions: Socioeconomic conditions are an estimate of the
general public’s satisfaction or dissatisfaction with the government’s economic
policies, covering a broad spectrum of factors ranging from infant mortality and
medical provision to housing and interest rates. Different weights are applied in
different societies, depending upon the relative political impact. Maximum of
twelve points are awarded to a country that shows maximum general public’s
satisfaction with government’s policies. (Countrydate.com)
V. EMPIRICAL ANALYSIS

Table 1 summarizes the performance of EU 15 countries in terms of economic
variables for the period 1984 and 2003.
<Insert Table 1 about here>
As shown in Table 1, in terms of budget balance as a percentage of GDP, only
Luxembourg, Ireland, and Denmark show a positive number. Other 12 EU member
nations show a negative budget balance as a percentage of GDP with Greece showing an
average deficit of 7.26 percent for the period 1984 to 2003. An examination of the GDP
per capita clearly brings out the diverse nature of the impact of the European Union on
various member states. Luxembourg shows the highest average GDP per head of
$40,439 for the period 1984 to 2003 followed by Finland ($30,897) and Austria
($25,082). Lowest average GDP per capital is being recorded by Portugal ($10069).
Similarly, real GDP growth rates also vary widely across the EU 15 nations with highest
average real GDP growth rate of 6.26 percent being recorded by Italy and with lowest
average real GDP growth rate of 1.46 percent being recorded by Netherlands. Italy also
led EU nations with an average inflation rate of more than 11 percent during 1984 to
2003. Economic risk ratings and financial risk ratings on an average do not differ much
across all the EU 15 nations. Highest average economic risk rating of 40.95 is for
Luxembourg and the lowest average economic risk rating of 33.68 is for Greece. In
terms of average financial risk ratings, Luxembourg leads the EU pack and Greece is
again at the lower end of the ladder. Highest mean political risk is associated with
Greece followed by Spain and Italy. Lowest mean political risk goes to Luxembourg
followed by Finland and Netherlands. UK is the only country among the EU 15 nations
that shows international liquidity of below 1. All other countries show international

liquidity of 2 and above, which their foreign exchange reserve positions are quite
comfortable.
Table 2 summarizes the performance of EU 15 nations in terms of non-economic
variables.
<Insert Table 2 about here>
In terms of socio-economic conditions, on an average Luxembourg enjoys the
highest score of 9.74 followed by Austria and Ireland. Lowest score is for Greece and
Portugal. Bureaucratic quality is highest for Belgium, Denmark, Germany, Netherlands,
Sweden, and UK with the highest possible score of 4. Lowest bureaucratic quality score
goes to Greece and Portugal with a score of 2.65. Least corrupt country is Finland with
the highest possible score of 6 during the period 1984 to 2003. Most corrupt country is
Italy with an average score of 3.55 out of 6. Democratic accountability, on an average, is
quite good and consistent across EU except Greece which has a rating of below 5 on
democratic accountability. EU 15 nations’ performance on ethnic tensions again shows
variations across nations with the highest possible score of 6 out 6 being recorded by
Finland followed closely by Netherlands and Greece. Belgium with an average score
3.35 out of 6 shows the poorest performance on the issue of ethnic tensions followed by
UK with a score of 4.65.
Law and order on an average is quite good across EU 15 nations except for
Germany which records an average score of 3.90 out of 6. Overall composite risk ratings
vary in the range of 76.22 to 90.07. Highest composite ranking is being recorded
Luxembourg and lowest rating goes to Spain.

To evaluate the pre- and post-Maastricht treaty performance of EU 15 nations in
terms of economic and non-economic variables, we divided the sample into two periods:
1984 - 1993 and 1994 – 2003. Table 3 summarizes the comparative performance of EU
15 nations in terms of economic variables during the 1984 – 1993 and 1994 – 2003 time
periods.
<Insert Table 3 about here>
A comparison of 1984 – 1993 and 1994-2003 data shows that all EU 15 countries
show improved performance in terms of budget balance as percentage of GDP.
Improvement in budget balance as a percentage of GDP is statistically significant. Italy
and Greece show significant improvement budget balance as a percentage of GDP. Many
countries show a decline in performance in terms of current account as a percentage of
GDP.
Belgium, Finland, France, Italy, Netherlands, Spain, Sweden, and United
Kingdom show statistically significant improvement in current account as a percentage of
GDP. Austria, Denmark, Greece, Ireland, Portugal register a statistically significant
decline in current account as a percentage of GDP. Germany also shows a decline in
current account, but it is not statistically significant.
Current as a percentage of exports shows improvement for Belgium, Denmark,
Finland, France, Greece, Ireland, Italy, Sweden, and UK. A simple t-test shows that the
improvement in current account as a percentage of exports is statistically significant.
Austria, Germany, Netherlands, and Portugal, and Spain show a decline in current
account balance as a percentage of exports.
Change in exchange rate stability does not show any statistically significant
changes for any of the EU 15 countries. All of the countries show a statistically
significant improvement in GDP per head with the exception of Italy and Sweden. Italy
and Sweden’s exchange improvement in GDP per head is not statistically significant.
During the pre-Maastricht Treaty as well as post-Maastricht Treaty, GDP per head is the
highest for Denmark, closely followed by Sweden and Germany.
All countries except Austria and Germany show a statistically significant increase
in real GDP growth during the post-Maastricht Treaty in contrast to pre-Maastricht
Treaty. Austria and Germany show a decline in real GDP growth rate during the post-
Maastricht Treaty period although the decline is not statistically significant.
Inflation has declined significantly for all the countries except for Netherlands.
Netherlands shows a slight increase in inflation. All EU 15 countries have benefited
through statistically significant improvement in economic risk rating except for Germany
and Netherlands. Germany and Netherlands’s economic risk rating has deteriorated
during the post-Maastricht Treaty. Surprisingly, financial risk rating for all EU 15
countries shows a decline in financial risk rating except for Denmark and Greece. Greece
seems to be the biggest beneficiary in terms of improvement in financial risk rating
during the post-Maastricht Treaty.
Political risk rating has also improved for all countries except for Austria,
Germany, Netherlands, and Sweden. Biggest beneficiary of the political risk rating is
Greece. There is also a decline in the international liquidity of all EU 15 countries during
the post-Maastricht Treaty except for Finland, Germany, Greece, and Sweden.
Table 4 summarizes the comparative performance of EU 15 nations in terms of
non-economic variables during the 1984 – 1993 and 1994 – 2003 time periods.
<Insert Table 4 about here>
In terms of socio-economic conditions, eight countries show improvement and
seven countries show deterioration in the socio-economic conditions during the post-
Maastricht Treaty. There is no change in the bureaucratic quality of six nations. Six
countries report an improvement in bureaucratic quality during the post-Maastricht
Treaty. Three countries: Finland, France, and Italy report deterioration in the
bureaucratic quality during the post-Maastricht Treaty. Twelve out of fifteen nations
show an increase in corruption. Only Greece and Portugal show a decline in corruption,
but the difference is not statistically significant.
France, Germany, and Italy report a statistically significant deterioration in the
democratic accountability of during the post-Treaty period. All other nations either show
no change or an improvement in democratic accountability.
Austria, Denmark, France, Germany, Greece, Netherlands, Sweden show a
deterioration of ethnic tensions in their nations during the post-Treaty period. On the
other hand, Belgium, Ireland, Italy, and UK report an improvement in ethnic relations
within their countries during the post-Treaty period in contrast to the pre-Treaty period.
Eleven out of fifteen nations report an increase in external conflict threat during
the post-Treaty period. Government stability has significantly improved for all the
participating nations during the post-Treaty period in contrast to the pre-Treaty period.
Nine out of fifteen countries report statistically significant improvement in their
internal conflict. There is not much change in the law and order and military in politics

ratings during the post-Treaty period. Only Belgium and Italy report deterioration in
religious tensions within their countries. All other nations either show no change or an
improvement in their rating on religious tensions.
Overall composite risk rating has improved for all nations except for Austria,
Germany, and Netherlands. Austria, Germany, and Netherlands show a statistically
significant decline in their overall composite risk ratings.
VI. SUMMARY AND CONCLUSIONS
This study measures the effectiveness of the integration of Europe by analyzing
both economic and socioeconomic factors. The Maastricht Treaty has been identified as
the determining point because of its significance in transitioning Europe from a
community into a union. The study will compare the two periods: pre-Treaty 1984-1992
and post-Treaty 1993-2003.
The European Council established political, economic, and social criteria for
acceptance into the Union. The study evaluates the progress made by members of the
Union by evaluating the economic and non-economic factors for each of the 15 states of
the union. Twenty-two (22) variables, 11 economic and 11 non-economic, are used to
evaluate the impact of European integration on the participating nations. These variables
have been chosen as the basis for the study given the above criteria established for
entrance into the Union.
We find that on the economic front, member nations have made good progress
during the post-Maastricht Treaty period. However, on the non-economic front, there is
still lot to be done by the member nations. During the post-Maastricht Treaty, many
member nations show deterioration in the performance.

Work Cited
Archer, Clive. Organizing Europe: The Institutions of Integration. London:
Auchland. 1994.
Costin, Harry. Managing in the Global Economy: The European Union. Fort
Worth: The Dryden Press/Harcourt Brace College Publishers. 1996.
Countrydata.com
Daniels, John D.; Radebaugh Lee H.; Sullivan, Daniel P. International Business:
Environments and Operations. Upper Saddle River, New Jersey:
Pearson/Prentice Hall. 2004.
Europa.eu.int/abc/12lessons
Van Ouderaren, John. Uniting Europe: European Integration and the Post-Cold
World War. Lanham: Rowman and Littlefield Publishers, Inc. 2000.