Embed Size (px)
Citation preview
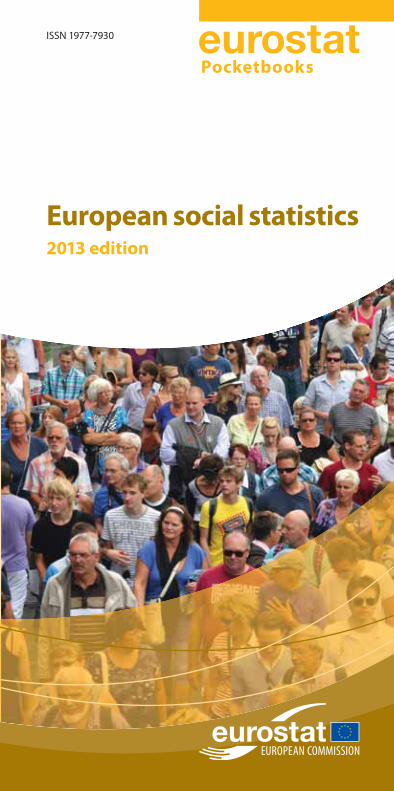
European social statistics
Pocketbooks
European social statistics
2013 edition
The pocketbook European social statistics,
intended for both generalists and specialists,
provides a comparative overview of the social
statistics available in 27 Member States and the
Candidate Countries of the European Union, as
well as in the EFTA states. Different areas of the
social field are described here by a selection of
indicators which are presented in tables and
graphs and accompanied by short commentaries.
This pocketbook may be viewed as an
introduction to European social statistics and
provides guidance to the vast range of data freely
available from the Eurostat website at:
http://ec.europa.eu/eurostat
Euro
pean
social statistics
2013 editio
n
KS
-FP-13
-00
1-E
N-C
ISSN 1977-7930
2013 edition
doi:10.2785/36105

HOW TO OBTAIN EU PUBLICATIONS
Free publications:
http://bookshop.europa.eu);
from the European Union’s representations
http://ec.europa.eu/represent_en.htm);
from the delegations in non-EU countries
http://eeas.europa.eu/delegations/index_en.htm);
by contacting the Europe Direct service
http://europa.eu/europedirect/index_en.htm) or
operators, phone boxes or hotels may charge you).
Priced publications:
http://bookshop.europa.eu).
Priced subscriptions:
http://publications.europa.eu/
others/agents/index_en.htm).
European social statistics
Pocketbooks
2013 edition
Europe Direct is a service to help you find answers to your questions about the European Union.
Freephone number (*):
00 800 6 7 8 9 10 11(*) Certain mobile telephone operators do not allow access
to 00 800 numbers or these calls may be billed.
More information on the European Union is available on the Internet
(http://europa.eu).
Cataloguing data can be found at the end of this publication.
Luxembourg: Publications Office of the European Union, 2013
ISBN 978-92-79-27034-5
ISSN 1977-7930
doi:10.2785/36105
Cat. No KS-FP-13-001-EN-C
Theme: Population and social conditions
Collection: Pocketbooks
© European Union, 2013
Reproduction of content other than photos is authorised, provided that the
source is acknowledged.
Photo credits: © Shutterstock
Reproduction of photos is allowed for non-commercial purposes and within the
sole context of this publication.
Printed in Belgium
PRINTED ON ELEMENTAL CHLORINEFREE BLEACHED PAPER (ECF)
Acknowledgements
The editors of the Eurostat pocketbook would like to thank all those
who were involved in its preparation. The pocketbook could only be
published thanks to the support of the colleagues from the following
units:
F2 Population: Silvia Andueza Robustillo, Alexandros Bitoulas,
Piotr Juchno, Monica Marcu, Marius Negau, Katya Vasileva
F3 Labour market: Eusebio Bezzina, Arturo de la Fuente, Hannah
Kiiver, Sammy Lauritsen, Denis Leythienne, Havard Lien, Nicola
Massarelli, Piotr Ronkowski, Toriya Sghir, Martin Teichgräber
F4 Quality of life: Stephen Clarke, Paulina Hojny, Anna Rybkowska,
Cynthia Tavares †
F5 Education, health and social protection: Lucian Agafitei,
Javier Alcántara, Giuliano Amerini, Gemma Asero, Marta Beck-
Domzalska, Hartmut Buchow, Elodie Cayotte, Bart De Norre,
Sorin-Florin Gheorghiu, Dominique Groenez, Csaba Herbaly,
Jakub Hrkal, Sylvain Jouhette, Ana María Martínez Palou, Luiza
Cristina Munteanu, Ivana Slaharova, Malgorzata Stadnik, Orestis
Tsigkas, Paolo Turchetti, Pascal Wolff
B6 Dissemination: Isabelle Fiasse and Matthias Fritz
Chief Editor
Mariana Kotzeva
Editors
F1 Social statistics — modernisation and coordination: Katarzyna
Kraszewska, Saul Velasco Dujo and Charlotte Mear under coordi-
nation of Bettina Knauth – Head of Unit F1
Data extracted
January to March 2013. The most recent data is available at
http://epp.eurostat.ec.europa.eu/portal/page/portal/statistics/
search_database
Layout production
JOUVE SA, Paris, France
4 European social statistics
For more information please consult
Eurostat
Joseph Bech Building
5, rue Alphonse Weicker
2721 Luxembourg
LUXEMBOURG
Internet: http://ec.europa.eu/eurostat
E-mail: [email protected]
All statements on policies within this publication are given for in-
formation purposes only. They do not constitute an official policy
position of the European Commission and are not legally binding.
To find out more about such policies, consult the European Com-
mission’s website (http://ec.europa.eu).
Table of Contents
5 European social statistics
Table of Contents
Introduction 7
Eurostat 9
A practical guide to accessing European social statistics 10
Statistics Explained 11
1 – Population 13
World population 14
EU population structure and ageing 16
Population change 24
Fertility and mortality 28
Marriages and divorces 34
Migration flows 36
Migration stocks 42
Acquisition of citizenship 48
Asylum 52
Residence permits 58
Household composition 62
2 – Health and safety 67
Healthy life years 68
Health status 72
Determinants of health 76
Causes of death 82
Healthcare 88
Health and safety at work 94
3 – Education and training 103
Pupils and students 104
Tertiary education 108
Educational attainment of the population 114
Foreign language learning 120
Lifelong learning 124
Educational expenditure 128
4 – Labour Market 131
Labour market participation 132
Employment 136
Unemployment 146
Earnings and minimum wages 152
Labour costs 160
Job vacancies 162
Labour market policy 166
Table of Contents
6 European social statistics
5 – Income and living conditions 169
Poverty and social exclusion 170
Monetary poverty 176
Material deprivation and low work intensity 186
Housing conditions 192
6 – Social protection 197
7 – Crime and criminal justice 205
Data coverage, symbols and abbreviations 210
Glossary 213
Annex 1: Europe 2020 targets 241
Introduction
7 European social statistics
Introduction
The pocketbook European Social Statistics provides a com-
parative overview of the social statistics available in Europe. The
most recent data are presented here showing the situation in the
27 Member States and at the European and Euro area levels (EU-27
and EA-17 aggregates) where relevant as well as in EFTA (includ-
ing Iceland, which is also a candidate country) and candidate coun-
tries when available (Montenegro, Croatia (1), the former Yugoslav
Republic of Macedonia, Serbia and Turkey). This pocketbook, in-
tended for both generalists and specialists, is divided into seven
parts.
Each of the seven chapters focuses on an area of social conditions.
Within each chapter, a range of policy-relevant indicators, as well
as more descriptive data, are presented in tables and graphs and
accompanied by a short commentary.
Chapter 1 presents the recent demographic trends in population
growth, fertility, mortality and migration; the chapter also pro-
vides background characteristics on households’ composition;
Chapter 2 covers health issues and presents indicators on healthy
life expectancies, statistics on causes on death, healthcare, and
health and safety at work;
Chapter 3 presents the most recent data on education and training
i.e. school enrolment, tertiary education, foreign language learn-
ing, lifelong learning and educational expenditure;
Chapter 4 provides important indicators related to the labour
market outcomes i.e. employment, unemployment, vacant posts,
wage levels, labour costs;
Chapter 5 covers indicators related to income, poverty and social
exclusion, material deprivation and housing;
Chapter 6 gives an overview on social protection statistics – social
protection expenditure and social protection benefits;
Finally, chapter 7 provides an overview of the most recent crime
and criminal justice statistics.
(1) The EU and Croatian leaders signed Croatia’s EU Accession Treaty on 9 December 2011. Croatia is called thereafter an ‘acceding country’ (instead of a ‘candidate country’). Subject to ratification of the Treaty by all the Member States and Croatia, Croatia will become the EU’s 28th Member State on 1 July 2013.
Introduction
8 European social statistics
European social statistics are also an integral part of the European
Union strategy – the Europe 2020 strategy – to develop as a smart-
er, knowledge-based, greener economy, and deliver high levels of
employment, productivity and social cohesion. The key objectives
of the strategy are expressed in the form of five headline targets
at the EU level, monitored by means of eight headline indicators.
The progress achieved in implementing some of these targets (in
the areas of employment, education and poverty/social exclusion)
is measured with help of social statistics.
This publication presents the latest results for ‘social’ headline in-
dicators on the EU-27 aggregates, individual Member States and,
where available, on the EFTA and the candidate countries.
The headline targets at the EU level:
75 % of the population aged 20-64 to be employed (page 139)
3 % of the EU’s GDP to be invested in research and development
(R&D)
Climate change and energy target:
To reduce greenhouse gas emissions by 20 % compared with
1990
To increase the share of renewable energy sources in final en-
ergy consumption to 20 %
To improve energy efficiency by 20 %
The share of early school leavers to be under 10 % (page 119)
and at least 40 % of those aged 30-34 to have completed tertiary
or equivalent education (page 117)
Reduction of poverty by lifting at least 20 million people out of
the risk of poverty or social exclusion (page 173).
These headline targets have been translated into specific targets
for each Member State (see Annex 1). For detailed information
at EU and national levels see the dedicated section – Europe 2020
indicators and Conclusions of the European Council – 17 June 2010.
Introduction
9 European social statistics
Eurostat
Eurostat is the statistical office of the European Union, situated
in Luxembourg. Its task is to provide the EU with statistics at a
European level that enable comparisons between countries and
regions.
Eurostat’s mission is ‘to be the leading provider of high quality sta-tistics on Europe’.
The production of Union statistics conforms to impartiality, reli-
ability, objectivity, scientific independence, cost-effectiveness and
statistical confidentiality; it does not entail excessive burdens on
economic operators.
Eurostat aims:
to provide other European institutions and the governments of
the Member States with the information needed to design, im-
plement, monitor and evaluate Community policies;
to disseminate statistics to the European public and enterprises
and to all economic and social agents involved in decision-
making;
to implement a set of standards, methods and organisational
structures which allow comparable, reliable and relevant sta-
tistics to be produced throughout the Union, in line with the
principles of the European statistics Code of Practice;
to improve the functioning of the European Statistical System,
to support the Member States, and to assist in the development
of statistical systems on international level.
Introduction
10 European social statistics
A practical guide to accessing European social statistics
Eurostat provides users with free access to its databases and all
of its publications in PDF format via the Internet. The website is
updated daily and gives access to the latest and most comprehen-
sive statistical information available on the EU, its Member States,
EFTA countries, and Candidate Countries.
Information relating to European social statistics may be found on
Eurostat’s website: http://ec.europa.eu/eurostat. From the Eurostat
homepage, all presented statistical themes may be accessed from
the Statistics tab that is permanently available in the top menu
bar. From there, you can select different social statistics under the
Population and social conditions heading. This section provides
access to Eurostat’s online databases, as well as access to the most
recent publications relating to different topical issues. Some of the
most important indicators derived from European social surveys
are used to monitor employment and social policy. These are de-
tailed within a dedicated section entitled Employment and social
policy indicators. This section can also be accessed directly from
the Statistics tab.
Eurostat’s website provides two main entry points to data:
Main tables – these are pre-defined tables where the axes of the
tables are fixed. They present the key indicators and are refreshed
automatically as a function of the data being loaded into the da-
tabase.
Database – this contains a complete set of available social statis-
tics. The data presented can be extracted in a variety of formats
and the user can freely select the information to be presented.
Introduction
11 European social statistics
Statistics Explained
Statistics Explained is part of Eurostat’s website – it provides easy ac-
cess to Eurostat’s statistical information. It can be accessed via a link
on the right-hand side of Eurostat’s homepage, or directly at
http://epp.eurostat.ec.europa.eu/statistics_explained
Statistics Explained is a wiki-based system that presents statisti-
cal topics. Together, the articles make up an encyclopaedia of Eu-
ropean statistics, which is completed by a statistical glossary that
clarifies the terms used. In addition, numerous links are provided
to the latest data and metadata and to further information, making
Statistics Explained a portal for regular and occasional users alike.
Users can search for articles using navigational features in the left-
hand menu. The top-right menu bar of Statistics Explained offers
tools, among others, to print, forward, cite, blog or share content
easily.

1Population change and the structure of the population are gaining
importance in the political, economic, social and cultural context
of demographic behaviour. Demographic trends in population
growth, fertility, mortality and migration are closely followed by
policymakers. EU policies, notably in social and economic fields,
use demographic data for planning and for programme monitor-
ing and evaluation.
Recent demographic developments show that the European Union’s
population is increasing, while its age structure is becoming older
as post-war baby-boom generations reach retirement age. Fur-
thermore, people are living longer, as life expectancy continues to
increase. On the other hand, while fertility is increasing slowly, it
remains well below a level that would keep the size of the popula-
tion constant in the absence of inward or outward migration.
This chapter presents a wide range of demographic data, including
statistics on populations at the European and national level, as well
as for various demographic factors (births, deaths, marriages and
divorces, immigration and emigration) influencing the size, the
structure and the specific characteristics of these populations. The
chapter also covers detailed information on different areas related
to migration and asylum: annual flows of immigrants, foreign resi-
dent populations and persons acquiring citizenship, information
on asylum applicants and asylum decisions, and information on
residence permits issued to non-EU nationals.
Population
Population1
14 European social statistics
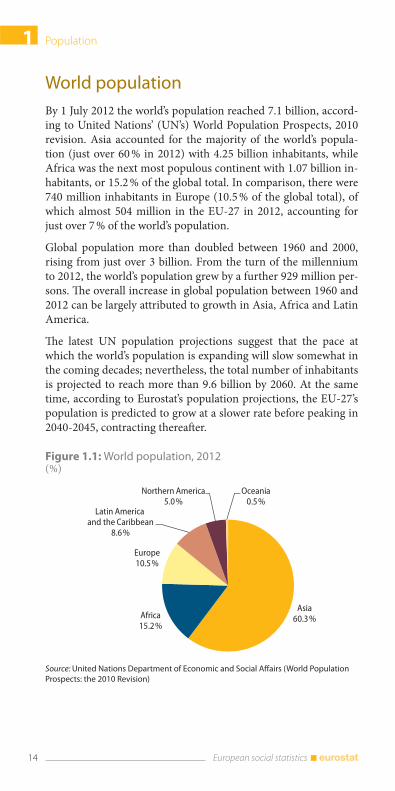
World population
By 1 July 2012 the world’s population reached 7.1 billion, accord-
ing to United Nations’ (UN’s) World Population Prospects, 2010
revision. Asia accounted for the majority of the world’s popula-
tion (just over 60 % in 2012) with 4.25 billion inhabitants, while
Africa was the next most populous continent with 1.07 billion in-
habitants, or 15.2 % of the global total. In comparison, there were
740 million inhabitants in Europe (10.5 % of the global total), of
which almost 504 million in the EU-27 in 2012, accounting for
just over 7 % of the world’s population.
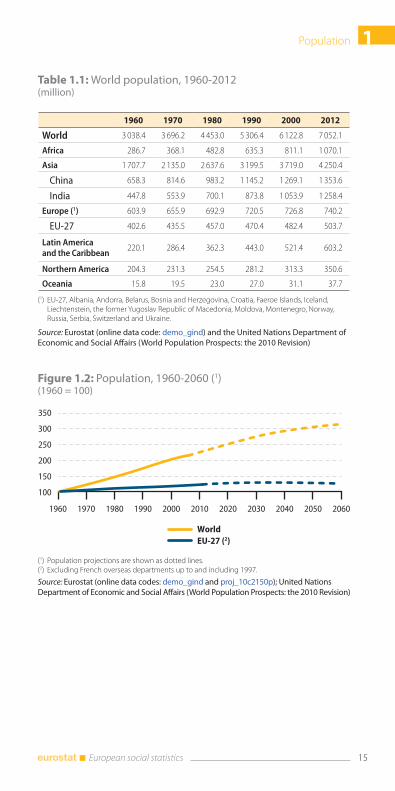
Global population more than doubled between 1960 and 2000,
rising from just over 3 billion. From the turn of the millennium
to 2012, the world’s population grew by a further 929 million per-
sons. The overall increase in global population between 1960 and
2012 can be largely attributed to growth in Asia, Africa and Latin
America.
The latest UN population projections suggest that the pace at
which the world’s population is expanding will slow somewhat in
the coming decades; nevertheless, the total number of inhabitants
is projected to reach more than 9.6 billion by 2060. At the same
time, according to Eurostat’s population projections, the EU-27’s
population is predicted to grow at a slower rate before peaking in
2040-2045, contracting thereafter.
Figure 1.1: World population, 2012(%)
Oceania0.5 %
Northern America5.0 %
Latin America and the Caribbean
8.6 %
Europe10.5 %
Africa15.2 %
Asia60.3 %
Source: United Nations Department of Economic and Social Affairs (World Population
Prospects: the 2010 Revision)
1Population
15 European social statistics
Table 1.1: World population, 1960-2012(million)
1960 1970 1980 1990 2000 2012
World 3 038.4 3 696.2 4 453.0 5 306.4 6 122.8 7 052.1
Africa 286.7 368.1 482.8 635.3 811.1 1 070.1
Asia 1 707.7 2 135.0 2 637.6 3 199.5 3 719.0 4 250.4
China 658.3 814.6 983.2 1 145.2 1 269.1 1 353.6
India 447.8 553.9 700.1 873.8 1 053.9 1 258.4
Europe (1) 603.9 655.9 692.9 720.5 726.8 740.2
EU-27 402.6 435.5 457.0 470.4 482.4 503.7
Latin America and the Caribbean
220.1 286.4 362.3 443.0 521.4 603.2
Northern America 204.3 231.3 254.5 281.2 313.3 350.6
Oceania 15.8 19.5 23.0 27.0 31.1 37.7
(1) EU-27, Albania, Andorra, Belarus, Bosnia and Herzegovina, Croatia, Faeroe Islands, Iceland, Liechtenstein, the former Yugoslav Republic of Macedonia, Moldova, Montenegro, Norway, Russia, Serbia, Switzerland and Ukraine.
Source: Eurostat (online data code: demo_gind) and the United Nations Department of
Economic and Social Affairs (World Population Prospects: the 2010 Revision)
Figure 1.2: Population, 1960-2060 (1) (1960 = 100)
350
300
250
200
150
100
1960 1970 1980 1990 2000 2010 2020 2030 2040 2050 2060
World
EU-27 (2)
(1) Population projections are shown as dotted lines.(2) Excluding French overseas departments up to and including 1997.
Source: Eurostat (online data codes: demo_gind and proj_10c2150p); United Nations
Department of Economic and Social Affairs (World Population Prospects: the 2010 Revision)
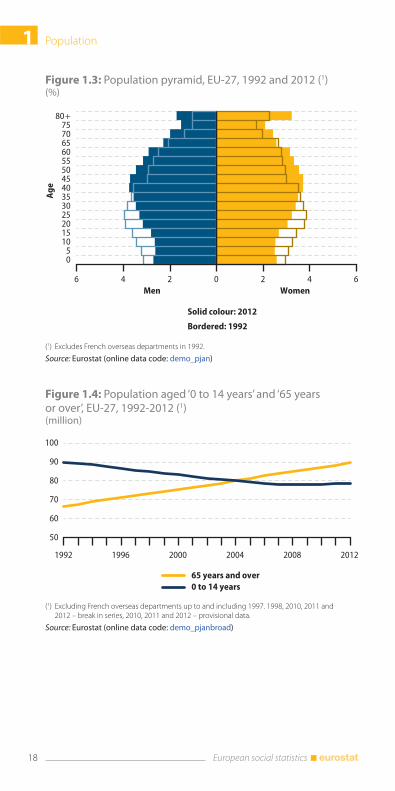
Population1
16 European social statistics
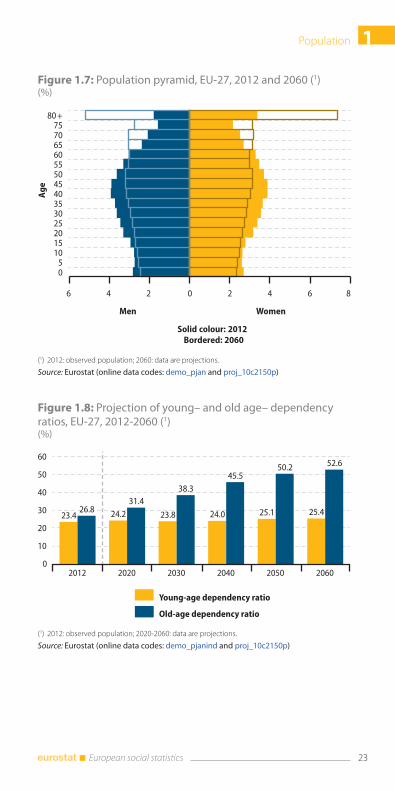
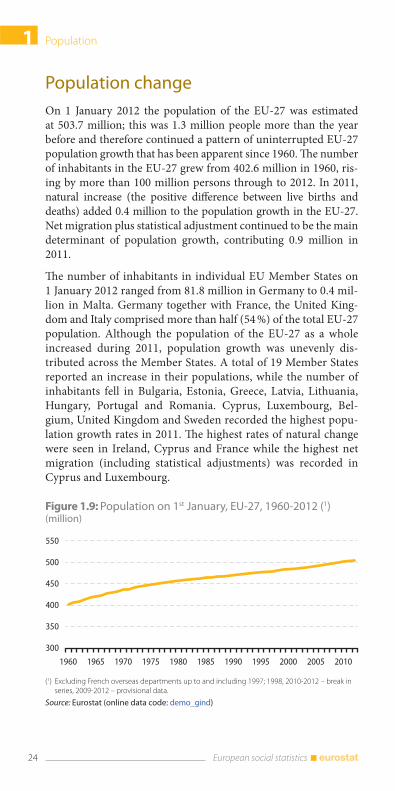
EU population structure and ageing Population ageing is a long-term trend which began several dec-
ades ago in the EU and it is expected to continue in future dec-
ades. According to Eurostat 2010-based population projections,
the EU-27’s population will be slightly larger by 2060 (516.9 mil-
lion compared to 503.7 million in 2012), while the age structure
of the population will be much older than it is now. This ageing is
reflected in an increasing share of older persons and a declining
share of young and working age persons in the total population.
Age pyramids for 2012 and 2060 show that the high number of
post-war baby-boomers will swell the number of elderly people.
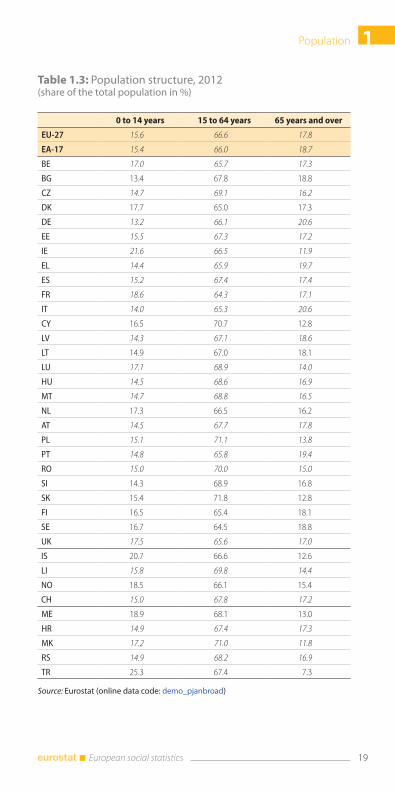
In 2012, young people (0 to 14 years old) made up 15.6 % of the EU-
27’s population, while persons considered to be of working age (15
to 64 years old) accounted for 66.6 % of the population, and older
persons (65 or more years old) had a 17.8 % share. Across the EU
Member States, the highest share of young people in the total popu-
lation was observed in Ireland (21.6 %), while the lowest shares were
recorded in Germany (13.2 %) and Bulgaria (13.4 %). The reverse
situation was observed for the proportion of older persons in the
total population, where Germany and Italy recorded the highest
proportion (20.6 % each) and Ireland had the lowest share (11.9 %).
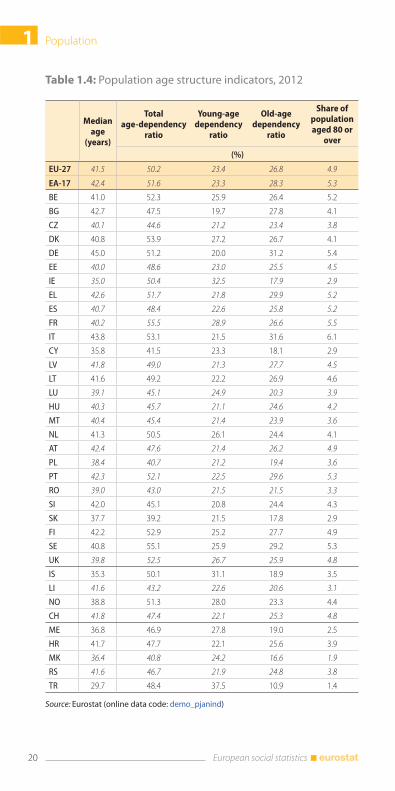
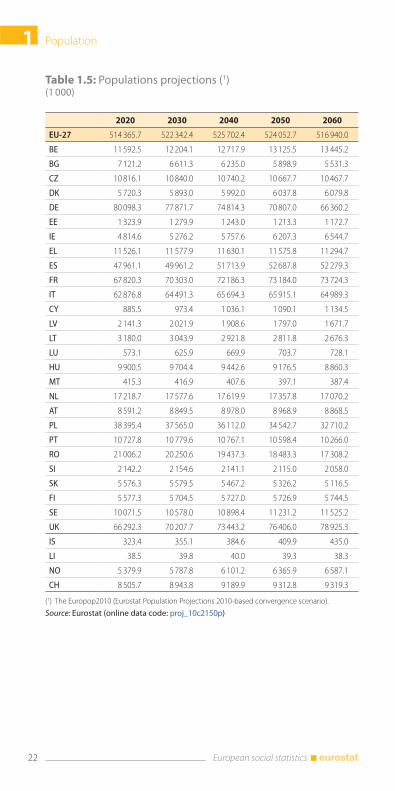
The median age of the EU-27’s population was 41.5 years on 1 Janu-
ary 2012: this means that half of the EU-27’s population was older
than 41.5 years, while half was younger. The median age of popula-
tions across the EU Member States ranged between 35.0 years in
Ireland and 45.0 years in Germany, confirming the relatively young
and relatively old population structures recorded in each of these
two countries. The development of the median age of the EU-27
population also provides an illustration of population ageing. The
median age increased from 35.7 years in 1992 to 41.5 years by 2012
and is projected to rise to 47.6 years in 2060.
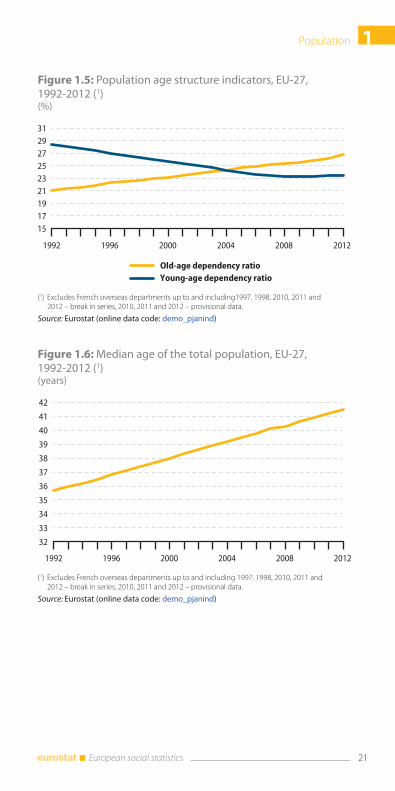
Age dependency ratios may be used to study the level of support given
to young and/or older persons by the working age population; these
ratios are expressed in terms of the relative size of young (0-14) and/or
older (65 or over) populations relative to the working age population
(conventionally considered 15-64 years old). The old-age dependency
ratio for the EU-27 was 26.8 % in 2012; as such, there were around four
persons of working age for every person aged 65 or over. The old-age
dependency ratio ranged across the EU Member States from 17.8 %
in Slovakia to 31.6 % in Italy. As a result of the population movement
between age groups, the EU-27’s old-age dependency ratio is projected
to more than double from 26.8 % in 2012 to 52.6 % by 2060.
1Population
17 European social statistics
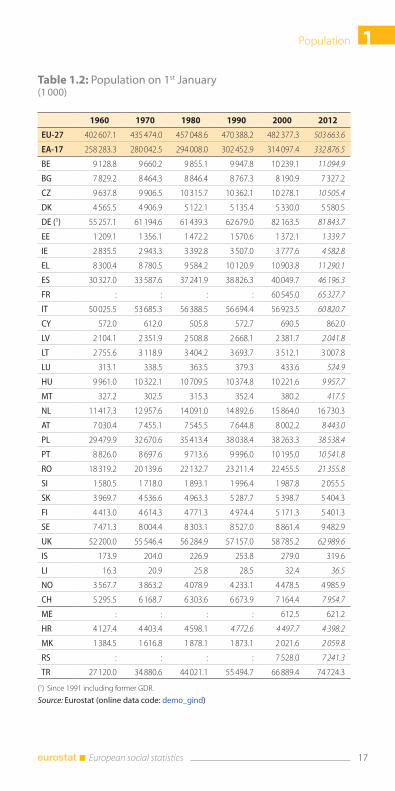
Table 1.2: Population on 1st January(1 000)
1960 1970 1980 1990 2000 2012
EU-27 402 607.1 435 474.0 457 048.6 470 388.2 482 377.3 503 663.6
EA-17 258 283.3 280 042.5 294 008.0 302 452.9 314 097.4 332 876.5
BE 9 128.8 9 660.2 9 855.1 9 947.8 10 239.1 11 094.9
BG 7 829.2 8 464.3 8 846.4 8 767.3 8 190.9 7 327.2
CZ 9 637.8 9 906.5 10 315.7 10 362.1 10 278.1 10 505.4
DK 4 565.5 4 906.9 5 122.1 5 135.4 5 330.0 5 580.5
DE (1) 55 257.1 61 194.6 61 439.3 62 679.0 82 163.5 81 843.7
EE 1 209.1 1 356.1 1 472.2 1 570.6 1 372.1 1 339.7
IE 2 835.5 2 943.3 3 392.8 3 507.0 3 777.6 4 582.8
EL 8 300.4 8 780.5 9 584.2 10 120.9 10 903.8 11 290.1
ES 30 327.0 33 587.6 37 241.9 38 826.3 40 049.7 46 196.3
FR : : : : 60 545.0 65 327.7
IT 50 025.5 53 685.3 56 388.5 56 694.4 56 923.5 60 820.7
CY 572.0 612.0 505.8 572.7 690.5 862.0
LV 2 104.1 2 351.9 2 508.8 2 668.1 2 381.7 2 041.8
LT 2 755.6 3 118.9 3 404.2 3 693.7 3 512.1 3 007.8
LU 313.1 338.5 363.5 379.3 433.6 524.9
HU 9 961.0 10 322.1 10 709.5 10 374.8 10 221.6 9 957.7
MT 327.2 302.5 315.3 352.4 380.2 417.5
NL 11 417.3 12 957.6 14 091.0 14 892.6 15 864.0 16 730.3
AT 7 030.4 7 455.1 7 545.5 7 644.8 8 002.2 8 443.0
PL 29 479.9 32 670.6 35 413.4 38 038.4 38 263.3 38 538.4
PT 8 826.0 8 697.6 9 713.6 9 996.0 10 195.0 10 541.8
RO 18 319.2 20 139.6 22 132.7 23 211.4 22 455.5 21 355.8
SI 1 580.5 1 718.0 1 893.1 1 996.4 1 987.8 2 055.5
SK 3 969.7 4 536.6 4 963.3 5 287.7 5 398.7 5 404.3
FI 4 413.0 4 614.3 4 771.3 4 974.4 5 171.3 5 401.3
SE 7 471.3 8 004.4 8 303.1 8 527.0 8 861.4 9 482.9
UK 52 200.0 55 546.4 56 284.9 57 157.0 58 785.2 62 989.6
IS 173.9 204.0 226.9 253.8 279.0 319.6
LI 16.3 20.9 25.8 28.5 32.4 36.5
NO 3 567.7 3 863.2 4 078.9 4 233.1 4 478.5 4 985.9
CH 5 295.5 6 168.7 6 303.6 6 673.9 7 164.4 7 954.7
ME : : : : 612.5 621.2
HR 4 127.4 4 403.4 4 598.1 4 772.6 4 497.7 4 398.2
MK 1 384.5 1 616.8 1 878.1 1 873.1 2 021.6 2 059.8
RS : : : : 7 528.0 7 241.3
TR 27 120.0 34 880.6 44 021.1 55 494.7 66 889.4 74 724.3
(1) Since 1991 including former GDR.
Source: Eurostat (online data code: demo_gind)
Population1
18 European social statistics
Figure 1.3: Population pyramid, EU-27, 1992 and 2012 (1)(%)
6 4 2 0 2 4 6
05
1015202530354045505560657075
80 +
WomenMen
Solid colour: 2012
Bordered: 1992
Ag
e
(1) Excludes French overseas departments in 1992.
Source: Eurostat (online data code: demo_pjan)
Figure 1.4: Population aged ‘0 to 14 years’ and ‘65 years or over’, EU-27, 1992-2012 (1)(million)
50
60
70
80
90
100
1992 1996 2000 2004 2008 2012
0 to 14 years
65 years and over
(1) Excluding French overseas departments up to and including 1997. 1998, 2010, 2011 and 2012 – break in series, 2010, 2011 and 2012 – provisional data.
Source: Eurostat (online data code: demo_pjanbroad)
1Population
19 European social statistics
Table 1.3: Population structure, 2012(share of the total population in %)
0 to 14 years 15 to 64 years 65 years and over
EU-27 15.6 66.6 17.8
EA-17 15.4 66.0 18.7
BE 17.0 65.7 17.3
BG 13.4 67.8 18.8
CZ 14.7 69.1 16.2
DK 17.7 65.0 17.3
DE 13.2 66.1 20.6
EE 15.5 67.3 17.2
IE 21.6 66.5 11.9
EL 14.4 65.9 19.7
ES 15.2 67.4 17.4
FR 18.6 64.3 17.1
IT 14.0 65.3 20.6
CY 16.5 70.7 12.8
LV 14.3 67.1 18.6
LT 14.9 67.0 18.1
LU 17.1 68.9 14.0
HU 14.5 68.6 16.9
MT 14.7 68.8 16.5
NL 17.3 66.5 16.2
AT 14.5 67.7 17.8
PL 15.1 71.1 13.8
PT 14.8 65.8 19.4
RO 15.0 70.0 15.0
SI 14.3 68.9 16.8
SK 15.4 71.8 12.8
FI 16.5 65.4 18.1
SE 16.7 64.5 18.8
UK 17.5 65.6 17.0
IS 20.7 66.6 12.6
LI 15.8 69.8 14.4
NO 18.5 66.1 15.4
CH 15.0 67.8 17.2
ME 18.9 68.1 13.0
HR 14.9 67.4 17.3
MK 17.2 71.0 11.8
RS 14.9 68.2 16.9
TR 25.3 67.4 7.3
Source: Eurostat (online data code: demo_pjanbroad)
Population1
20 European social statistics
Table 1.4: Population age structure indicators, 2012
Median age
(years)
Total age-dependency
ratio
Young-age dependency
ratio
Old-age dependency
ratio
Share of population aged 80 or
over
(%)
EU-27 41.5 50.2 23.4 26.8 4.9
EA-17 42.4 51.6 23.3 28.3 5.3
BE 41.0 52.3 25.9 26.4 5.2
BG 42.7 47.5 19.7 27.8 4.1
CZ 40.1 44.6 21.2 23.4 3.8
DK 40.8 53.9 27.2 26.7 4.1
DE 45.0 51.2 20.0 31.2 5.4
EE 40.0 48.6 23.0 25.5 4.5
IE 35.0 50.4 32.5 17.9 2.9
EL 42.6 51.7 21.8 29.9 5.2
ES 40.7 48.4 22.6 25.8 5.2
FR 40.2 55.5 28.9 26.6 5.5
IT 43.8 53.1 21.5 31.6 6.1
CY 35.8 41.5 23.3 18.1 2.9
LV 41.8 49.0 21.3 27.7 4.5
LT 41.6 49.2 22.2 26.9 4.6
LU 39.1 45.1 24.9 20.3 3.9
HU 40.3 45.7 21.1 24.6 4.2
MT 40.4 45.4 21.4 23.9 3.6
NL 41.3 50.5 26.1 24.4 4.1
AT 42.4 47.6 21.4 26.2 4.9
PL 38.4 40.7 21.2 19.4 3.6
PT 42.3 52.1 22.5 29.6 5.3
RO 39.0 43.0 21.5 21.5 3.3
SI 42.0 45.1 20.8 24.4 4.3
SK 37.7 39.2 21.5 17.8 2.9
FI 42.2 52.9 25.2 27.7 4.9
SE 40.8 55.1 25.9 29.2 5.3
UK 39.8 52.5 26.7 25.9 4.8
IS 35.3 50.1 31.1 18.9 3.5
LI 41.6 43.2 22.6 20.6 3.1
NO 38.8 51.3 28.0 23.3 4.4
CH 41.8 47.4 22.1 25.3 4.8
ME 36.8 46.9 27.8 19.0 2.5
HR 41.7 47.7 22.1 25.6 3.9
MK 36.4 40.8 24.2 16.6 1.9
RS 41.6 46.7 21.9 24.8 3.8
TR 29.7 48.4 37.5 10.9 1.4
Source: Eurostat (online data code: demo_pjanind)
1Population
21 European social statistics
Figure 1.5: Population age structure indicators, EU-27, 1992-2012 (1)(%)
151719212325272931
1992 1996 2000 2004 2008 2012
Young-age dependency ratio
Old-age dependency ratio
(1) Excludes French overseas departments up to and including1997. 1998, 2010, 2011 and 2012 – break in series, 2010, 2011 and 2012 – provisional data.
Source: Eurostat (online data code: demo_pjanind)
Figure 1.6: Median age of the total population, EU-27, 1992-2012 (1)(years)
32
33
34
35
36
37
38
39
40
41
42
1992 1996 2000 2004 2008 2012
(1) Excludes French overseas departments up to and including 1997. 1998, 2010, 2011 and 2012 – break in series, 2010, 2011 and 2012 – provisional data.
Source: Eurostat (online data code: demo_pjanind)
Population1
22 European social statistics
Table 1.5: Populations projections (1)(1 000)
2020 2030 2040 2050 2060
EU-27 514 365.7 522 342.4 525 702.4 524 052.7 516 940.0
BE 11 592.5 12 204.1 12 717.9 13 125.5 13 445.2
BG 7 121.2 6 611.3 6 235.0 5 898.9 5 531.3
CZ 10 816.1 10 840.0 10 740.2 10 667.7 10 467.7
DK 5 720.3 5 893.0 5 992.0 6 037.8 6 079.8
DE 80 098.3 77 871.7 74 814.3 70 807.0 66 360.2
EE 1 323.9 1 279.9 1 243.0 1 213.3 1 172.7
IE 4 814.6 5 276.2 5 757.6 6 207.3 6 544.7
EL 11 526.1 11 577.9 11 630.1 11 575.8 11 294.7
ES 47 961.1 49 961.2 51 713.9 52 687.8 52 279.3
FR 67 820.3 70 303.0 72 186.3 73 184.0 73 724.3
IT 62 876.8 64 491.3 65 694.3 65 915.1 64 989.3
CY 885.5 973.4 1 036.1 1 090.1 1 134.5
LV 2 141.3 2 021.9 1 908.6 1 797.0 1 671.7
LT 3 180.0 3 043.9 2 921.8 2 811.8 2 676.3
LU 573.1 625.9 669.9 703.7 728.1
HU 9 900.5 9 704.4 9 442.6 9 176.5 8 860.3
MT 415.3 416.9 407.6 397.1 387.4
NL 17 218.7 17 577.6 17 619.9 17 357.8 17 070.2
AT 8 591.2 8 849.5 8 978.0 8 968.9 8 868.5
PL 38 395.4 37 565.0 36 112.0 34 542.7 32 710.2
PT 10 727.8 10 779.6 10 767.1 10 598.4 10 266.0
RO 21 006.2 20 250.6 19 437.3 18 483.3 17 308.2
SI 2 142.2 2 154.6 2 141.1 2 115.0 2 058.0
SK 5 576.3 5 579.5 5 467.2 5 326.2 5 116.5
FI 5 577.3 5 704.5 5 727.0 5 726.9 5 744.5
SE 10 071.5 10 578.0 10 898.4 11 231.2 11 525.2
UK 66 292.3 70 207.7 73 443.2 76 406.0 78 925.3
IS 323.4 355.1 384.6 409.9 435.0
LI 38.5 39.8 40.0 39.3 38.3
NO 5 379.9 5 787.8 6 101.2 6 365.9 6 587.1
CH 8 505.7 8 943.8 9 189.9 9 312.8 9 319.3
(1) The Europop2010 (Eurostat Population Projections 2010-based convergence scenario).
Source: Eurostat (online data code: proj_10c2150p)
1Population
23 European social statistics
Figure 1.7: Population pyramid, EU-27, 2012 and 2060 (1) (%)
6 4 2 0 2 4 6 8
51015202530354045505560657075
80 +
0
WomenMen
Solid colour: 2012Bordered: 2060
Ag
e
(1) 2012: observed population; 2060: data are projections.
Source: Eurostat (online data codes: demo_pjan and proj_10c2150p)
Figure 1.8: Projection of young– and old age– dependency ratios, EU-27, 2012-2060 (1)(%)
23.4 24.2 23.8 24.0 25.1 25.426.831.4
38.345.5
50.2 52.6
0
10
20
30
40
50
60
2012 2020 2030 2040 2050 2060
Young-age dependency ratio
Old-age dependency ratio
(1) 2012: observed population; 2020-2060: data are projections.
Source: Eurostat (online data codes: demo_pjanind and proj_10c2150p)
Population1
24 European social statistics
Population change
On 1 January 2012 the population of the EU-27 was estimated
at 503.7 million; this was 1.3 million people more than the year
before and therefore continued a pattern of uninterrupted EU-27
population growth that has been apparent since 1960. The number
of inhabitants in the EU-27 grew from 402.6 million in 1960, ris-
ing by more than 100 million persons through to 2012. In 2011,
natural increase (the positive difference between live births and
deaths) added 0.4 million to the population growth in the EU-27.
Net migration plus statistical adjustment continued to be the main
determinant of population growth, contributing 0.9 million in
2011.
The number of inhabitants in individual EU Member States on
1 January 2012 ranged from 81.8 million in Germany to 0.4 mil-
lion in Malta. Germany together with France, the United King-
dom and Italy comprised more than half (54 %) of the total EU-27
population. Although the population of the EU-27 as a whole
increased during 2011, population growth was unevenly dis-
tributed across the Member States. A total of 19 Member States
reported an increase in their populations, while the number of
inhabitants fell in Bulgaria, Estonia, Greece, Latvia, Lithuania,
Hungary, Portugal and Romania. Cyprus, Luxembourg, Bel-
gium, United Kingdom and Sweden recorded the highest popu-
lation growth rates in 2011. The highest rates of natural change
were seen in Ireland, Cyprus and France while the highest net
migration (including statistical adjustments) was recorded in
Cyprus and Luxembourg.
Figure 1.9: Population on 1st January, EU-27, 1960-2012 (1)(million)
300
350
400
450
500
550
1960 1965 1970 1975 1980 1985 1990 1995 2000 2005 2010
(1) Excluding French overseas departments up to and including 1997; 1998, 2010-2012 – break in series, 2009-2012 – provisional data.
Source: Eurostat (online data code: demo_gind)
1Population
25 European social statistics
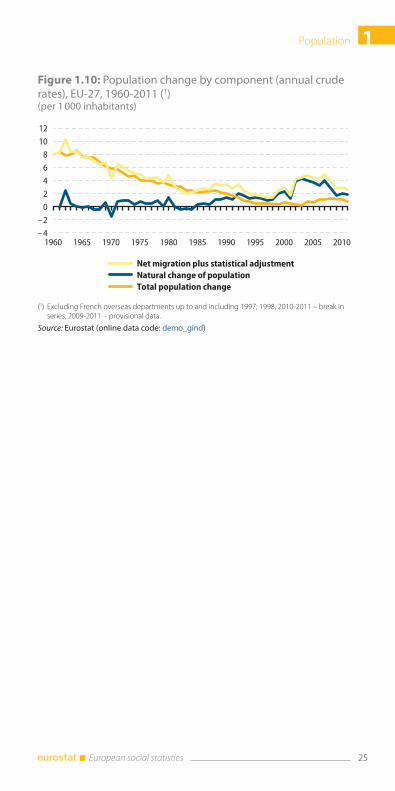
Figure 1.10: Population change by component (annual crude rates), EU-27, 1960-2011 (1)(per 1 000 inhabitants)
– 4
– 2
02
4
6
810
12
1960 1965 1970 1975 1980 1985 1990 1995 2000 2005 2010
Total population change
Natural change of population
Net migration plus statistical adjustment
(1) Excluding French overseas departments up to and including 1997; 1998, 2010-2011 – break in series, 2009-2011 – provisional data.
Source: Eurostat (online data code: demo_gind)
Population1
26 European social statistics
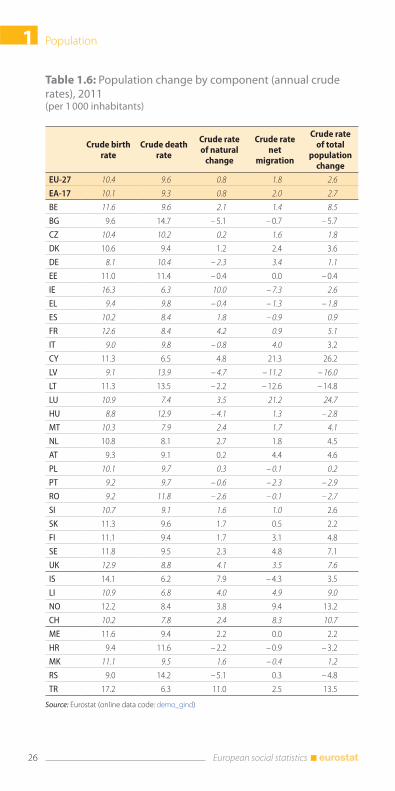
Table 1.6: Population change by component (annual crude rates), 2011(per 1 000 inhabitants)
Crude birth rate
Crude death rate
Crude rate of natural
change
Crude rate net
migration
Crude rate of total
population change
EU-27 10.4 9.6 0.8 1.8 2.6
EA-17 10.1 9.3 0.8 2.0 2.7
BE 11.6 9.6 2.1 1.4 8.5
BG 9.6 14.7 – 5.1 – 0.7 – 5.7
CZ 10.4 10.2 0.2 1.6 1.8
DK 10.6 9.4 1.2 2.4 3.6
DE 8.1 10.4 – 2.3 3.4 1.1
EE 11.0 11.4 – 0.4 0.0 – 0.4
IE 16.3 6.3 10.0 – 7.3 2.6
EL 9.4 9.8 – 0.4 – 1.3 – 1.8
ES 10.2 8.4 1.8 – 0.9 0.9
FR 12.6 8.4 4.2 0.9 5.1
IT 9.0 9.8 – 0.8 4.0 3.2
CY 11.3 6.5 4.8 21.3 26.2
LV 9.1 13.9 – 4.7 – 11.2 – 16.0
LT 11.3 13.5 – 2.2 – 12.6 – 14.8
LU 10.9 7.4 3.5 21.2 24.7
HU 8.8 12.9 – 4.1 1.3 – 2.8
MT 10.3 7.9 2.4 1.7 4.1
NL 10.8 8.1 2.7 1.8 4.5
AT 9.3 9.1 0.2 4.4 4.6
PL 10.1 9.7 0.3 – 0.1 0.2
PT 9.2 9.7 – 0.6 – 2.3 – 2.9
RO 9.2 11.8 – 2.6 – 0.1 – 2.7
SI 10.7 9.1 1.6 1.0 2.6
SK 11.3 9.6 1.7 0.5 2.2
FI 11.1 9.4 1.7 3.1 4.8
SE 11.8 9.5 2.3 4.8 7.1
UK 12.9 8.8 4.1 3.5 7.6
IS 14.1 6.2 7.9 – 4.3 3.5
LI 10.9 6.8 4.0 4.9 9.0
NO 12.2 8.4 3.8 9.4 13.2
CH 10.2 7.8 2.4 8.3 10.7
ME 11.6 9.4 2.2 0.0 2.2
HR 9.4 11.6 – 2.2 – 0.9 – 3.2
MK 11.1 9.5 1.6 – 0.4 1.2
RS 9.0 14.2 – 5.1 0.3 – 4.8
TR 17.2 6.3 11.0 2.5 13.5
Source: Eurostat (online data code: demo_gind)
1Population
27 European social statistics
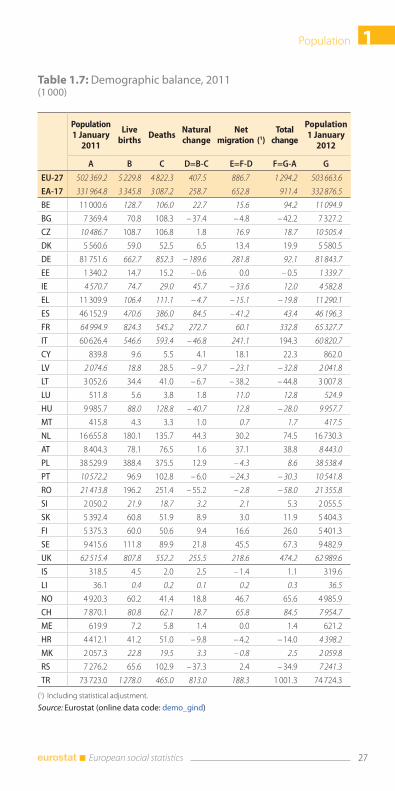
Table 1.7: Demographic balance, 2011(1 000)
Population 1 January
2011
Live births
DeathsNatural change
Net migration (1)
Total change
Population 1 January
2012
A B C D=B-C E=F-D F=G-A G
EU-27 502 369.2 5 229.8 4 822.3 407.5 886.7 1 294.2 503 663.6
EA-17 331 964.8 3 345.8 3 087.2 258.7 652.8 911.4 332 876.5
BE 11 000.6 128.7 106.0 22.7 15.6 94.2 11 094.9
BG 7 369.4 70.8 108.3 – 37.4 – 4.8 – 42.2 7 327.2
CZ 10 486.7 108.7 106.8 1.8 16.9 18.7 10 505.4
DK 5 560.6 59.0 52.5 6.5 13.4 19.9 5 580.5
DE 81 751.6 662.7 852.3 – 189.6 281.8 92.1 81 843.7
EE 1 340.2 14.7 15.2 – 0.6 0.0 – 0.5 1 339.7
IE 4 570.7 74.7 29.0 45.7 – 33.6 12.0 4 582.8
EL 11 309.9 106.4 111.1 – 4.7 – 15.1 – 19.8 11 290.1
ES 46 152.9 470.6 386.0 84.5 – 41.2 43.4 46 196.3
FR 64 994.9 824.3 545.2 272.7 60.1 332.8 65 327.7
IT 60 626.4 546.6 593.4 – 46.8 241.1 194.3 60 820.7
CY 839.8 9.6 5.5 4.1 18.1 22.3 862.0
LV 2 074.6 18.8 28.5 – 9.7 – 23.1 – 32.8 2 041.8
LT 3 052.6 34.4 41.0 – 6.7 – 38.2 – 44.8 3 007.8
LU 511.8 5.6 3.8 1.8 11.0 12.8 524.9
HU 9 985.7 88.0 128.8 – 40.7 12.8 – 28.0 9 957.7
MT 415.8 4.3 3.3 1.0 0.7 1.7 417.5
NL 16 655.8 180.1 135.7 44.3 30.2 74.5 16 730.3
AT 8 404.3 78.1 76.5 1.6 37.1 38.8 8 443.0
PL 38 529.9 388.4 375.5 12.9 – 4.3 8.6 38 538.4
PT 10 572.2 96.9 102.8 – 6.0 – 24.3 – 30.3 10 541.8
RO 21 413.8 196.2 251.4 – 55.2 – 2.8 – 58.0 21 355.8
SI 2 050.2 21.9 18.7 3.2 2.1 5.3 2 055.5
SK 5 392.4 60.8 51.9 8.9 3.0 11.9 5 404.3
FI 5 375.3 60.0 50.6 9.4 16.6 26.0 5 401.3
SE 9 415.6 111.8 89.9 21.8 45.5 67.3 9 482.9
UK 62 515.4 807.8 552.2 255.5 218.6 474.2 62 989.6
IS 318.5 4.5 2.0 2.5 – 1.4 1.1 319.6
LI 36.1 0.4 0.2 0.1 0.2 0.3 36.5
NO 4 920.3 60.2 41.4 18.8 46.7 65.6 4 985.9
CH 7 870.1 80.8 62.1 18.7 65.8 84.5 7 954.7
ME 619.9 7.2 5.8 1.4 0.0 1.4 621.2
HR 4 412.1 41.2 51.0 – 9.8 – 4.2 – 14.0 4 398.2
MK 2 057.3 22.8 19.5 3.3 – 0.8 2.5 2 059.8
RS 7 276.2 65.6 102.9 – 37.3 2.4 – 34.9 7 241.3
TR 73 723.0 1 278.0 465.0 813.0 188.3 1 001.3 74 724.3
(1) Including statistical adjustment.
Source: Eurostat (online data code: demo_gind)
Population1
28 European social statistics
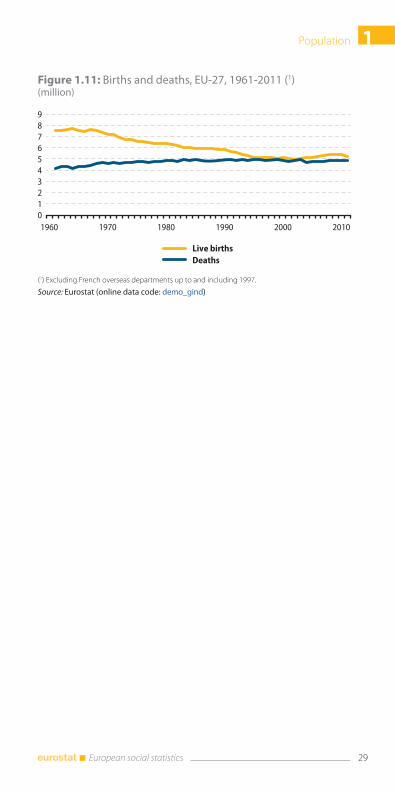
Fertility and mortality
In 2011, 5.2 million children were born in the EU-27, which
equated to a crude birth rate (the number of live births per
1 000 inhabitants) of 10.4. From the 1960s up to the beginning of
the 21st century, the number of live births in the EU-27 declined
sharply from 7.5 million to a low of 5.0 million in 2002. This was
followed by a modest rebound in the number of live births, with
5.4 million children born in the EU-27 in 2008, in turn followed
by further annual reductions during the period 2009-2011. In re-
cent decades Europeans have generally had fewer children, and
this pattern partly explains the slowdown in the EU-27’s popu-
lation growth (see population structure and population change
statistics). The total fertility rate (the number of live births per
woman) in the EU-27 declined to a level well below the replace-
ment level in recent decades (a total fertility rate of 2.1 live births
per woman is considered to be the replacement level, i.e. the level
required to keep the population size constant in the absence of
inward or outward migration). In 2011, the EU-27 average total
fertility rate was 1.57 live births per woman.
Over the years, the timing of births has also changed signifi-
cantly: the mean age of women at childbirth is higher. The
highest ages at childbirth in 2011 were in Ireland and Spain
(31.5 years each), and Italy (31.4 years), whereas the lowest were in
Bulgaria and Romania (27.1 years each). The difference between
the highest and the lowest mean age at childbirth was 4.4 years.
In 2011, women in 15 EU Member States and all EFTA Countries
tended to have their children when they were aged 30 or over.
In 2011, some 4.8 million persons died in the EU-27 – this was
broadly in line with the annual number of deaths recorded over
the previous four decades. The crude death rate (the number of
deaths per 1 000 inhabitants) was 9.6.
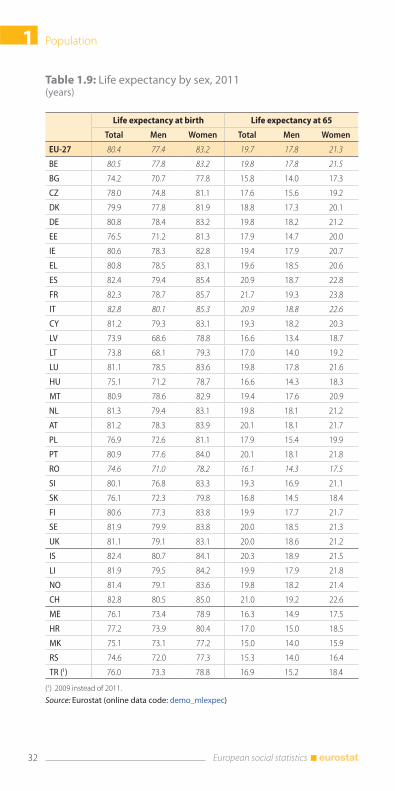
The most commonly used indicator for analysing mortality is that
of life expectancy at birth (the mean number of years that a per-
son can expect to live at birth if subjected throughout the rest of
his or her life to current mortality conditions). Differences in life
expectancy at birth throughout the EU-27 Member States are sig-
nificant. For men, the lowest life expectancy in 2011 was recorded
in Lithuania (68.1 years) and the highest in Sweden (79.9 years).
For women, the range was narrower, from a low of 77.8 years in
Bulgaria, to a high of 85.7 years in France.
1Population
29 European social statistics
Figure 1.11: Births and deaths, EU-27, 1961-2011 (1)(million)
0123456789
1960 1970 1980 1990 2000 2010
Live births
Deaths
(1) Excluding French overseas departments up to and including 1997.
Source: Eurostat (online data code: demo_gind)
Population1
30 European social statistics
Table 1.8: Fertility indicators, 1991, 2001 and 2011
Total fertility rate (live births per women)
Mean age of women at childbirth
1991 2001 2011 1991 2001 2011
EU-27 : : 1.57 : : 30.0
EA-17 : 1.45 1.56 : 29.6 30.6
BE 1.66 1.67 1.81 28.0 28.9 29.9
BG 1.66 1.21 1.51 23.7 25.1 27.1
CZ 1.86 1.14 1.43 24.7 27.5 29.7
DK 1.68 1.74 1.75 28.6 29.7 30.7
DE : 1.35 1.36 : 28.9 30.5
EE 1.80 1.34 1.52 25.3 27.2 29.5
IE 2.08 1.94 2.05 29.9 30.5 31.5
EL 1.38 1.25 1.42 27.4 29.2 30.4
ES 1.33 1.24 1.36 29.0 30.8 31.5
FR : 1.90 2.01 : 29.3 30.0
IT 1.30 1.25 1.40 29.1 30.5 31.4
CY 2.32 1.57 1.35 27.2 28.9 30.5
LV : : 1.34 : : 28.7
LT 2.01 1.30 1.76 25.7 26.9 28.9
LU 1.60 1.66 1.52 28.4 29.3 30.8
HU 1.87 1.31 1.23 25.7 27.6 29.4
MT 2.04 1.48 1.49 28.8 27.6 29.7
NL 1.61 1.71 1.76 29.5 30.3 30.9
AT 1.51 1.33 1.42 27.2 28.4 30.0
PL 2.07 1.31 1.30 26.3 27.6 28.9
PT 1.56 1.45 1.35 27.5 28.7 30.1
RO 1.59 1.27 1.25 25.0 25.9 27.1
SI 1.42 1.21 1.56 26.1 28.5 30.1
SK 2.05 1.20 1.45 25.0 26.8 28.9
FI 1.79 1.73 1.83 28.9 29.6 30.3
SE 2.11 1.57 1.90 28.7 30.0 30.8
UK 1.82 1.63 1.96 27.7 28.6 29.7
IS 2.18 1.95 2.02 28.0 29.1 30.1
LI : 1.52 1.69 : 29.8 31.5
NO 1.92 1.78 1.88 28.3 29.4 30.3
CH 1.58 1.38 1.52 29.0 30.0 31.4
ME : : 1.65 : : 28.7
HR : : 1.40 : : 29.3
MK : 1.73 1.46 : 26.6 28.0
RS : 1.58 1.36 : 26.9 28.4
TR (1) : : 2.04 : : 27.9
(1) Total fertility rate and Mean age of women at childbirth – 2010 instead of 2011.
Source: Eurostat (online data code: demo_find)
1Population
31 European social statistics
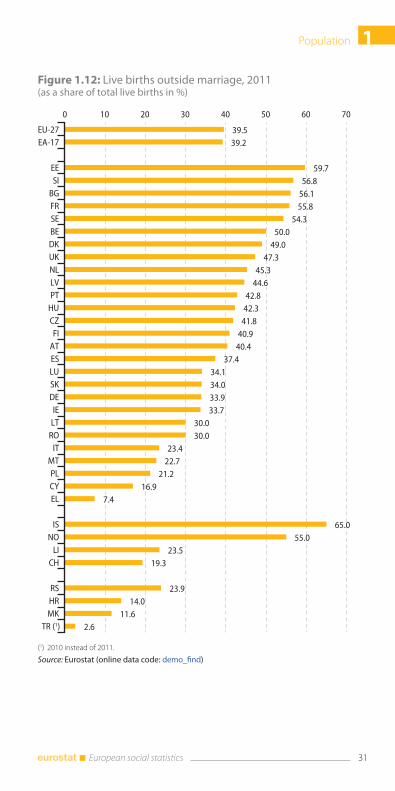
Figure 1.12: Live births outside marriage, 2011(as a share of total live births in %)
39.539.2
59.756.8
56.155.8
54.350.0
49.047.3
45.344.6
42.842.3
41.840.9
40.437.4
34.134.033.933.7
30.030.0
23.422.7
21.216.9
7.4
65.055.0
23.519.3
23.914.0
11.62.6
0 10 20 30 40 50 60 70
EU-27EA-17
EESI
BGFRSEBEDKUKNLLVPT
HUCZFI
ATESLUSKDEIE
LTRO
ITMTPLCYEL
ISNO
LICH
RSHRMK
TR (1)
(1) 2010 instead of 2011.
Source: Eurostat (online data code: demo_find)
Population1
32 European social statistics
Table 1.9: Life expectancy by sex, 2011(years)
Life expectancy at birth Life expectancy at 65
Total Men Women Total Men Women
EU-27 80.4 77.4 83.2 19.7 17.8 21.3
BE 80.5 77.8 83.2 19.8 17.8 21.5
BG 74.2 70.7 77.8 15.8 14.0 17.3
CZ 78.0 74.8 81.1 17.6 15.6 19.2
DK 79.9 77.8 81.9 18.8 17.3 20.1
DE 80.8 78.4 83.2 19.8 18.2 21.2
EE 76.5 71.2 81.3 17.9 14.7 20.0
IE 80.6 78.3 82.8 19.4 17.9 20.7
EL 80.8 78.5 83.1 19.6 18.5 20.6
ES 82.4 79.4 85.4 20.9 18.7 22.8
FR 82.3 78.7 85.7 21.7 19.3 23.8
IT 82.8 80.1 85.3 20.9 18.8 22.6
CY 81.2 79.3 83.1 19.3 18.2 20.3
LV 73.9 68.6 78.8 16.6 13.4 18.7
LT 73.8 68.1 79.3 17.0 14.0 19.2
LU 81.1 78.5 83.6 19.8 17.8 21.6
HU 75.1 71.2 78.7 16.6 14.3 18.3
MT 80.9 78.6 82.9 19.4 17.6 20.9
NL 81.3 79.4 83.1 19.8 18.1 21.2
AT 81.2 78.3 83.9 20.1 18.1 21.7
PL 76.9 72.6 81.1 17.9 15.4 19.9
PT 80.9 77.6 84.0 20.1 18.1 21.8
RO 74.6 71.0 78.2 16.1 14.3 17.5
SI 80.1 76.8 83.3 19.3 16.9 21.1
SK 76.1 72.3 79.8 16.8 14.5 18.4
FI 80.6 77.3 83.8 19.9 17.7 21.7
SE 81.9 79.9 83.8 20.0 18.5 21.3
UK 81.1 79.1 83.1 20.0 18.6 21.2
IS 82.4 80.7 84.1 20.3 18.9 21.5
LI 81.9 79.5 84.2 19.9 17.9 21.8
NO 81.4 79.1 83.6 19.8 18.2 21.4
CH 82.8 80.5 85.0 21.0 19.2 22.6
ME 76.1 73.4 78.9 16.3 14.9 17.5
HR 77.2 73.9 80.4 17.0 15.0 18.5
MK 75.1 73.1 77.2 15.0 14.0 15.9
RS 74.6 72.0 77.3 15.3 14.0 16.4
TR (1) 76.0 73.3 78.8 16.9 15.2 18.4
(1) 2009 instead of 2011.
Source: Eurostat (online data code: demo_mlexpec)
1Population
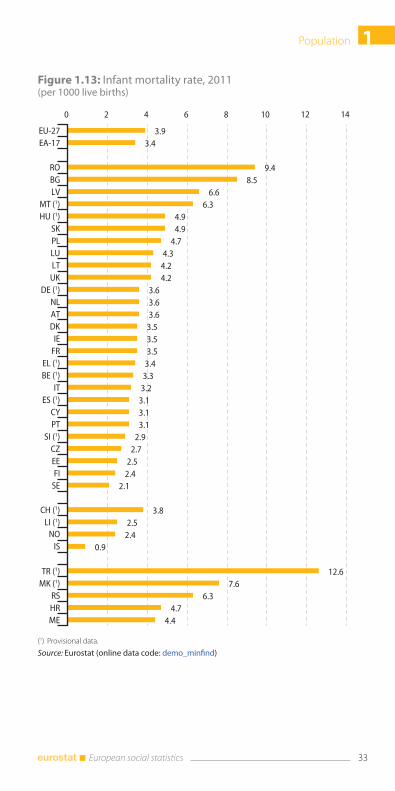
33 European social statistics
Figure 1.13: Infant mortality rate, 2011(per 1000 live births)
3.93.4
9.48.5
6.66.3
4.94.9
4.74.3
4.24.2
3.63.63.6
3.53.53.5
3.43.3
3.23.13.13.1
2.92.7
2.52.4
2.1
3.82.5
2.40.9
12.67.6
6.34.7
4.4
0 2 4 6 8 10 12 14
EU-27EA-17
ROBGLV
MT (1)HU (1)
SKPLLULT
UKDE (1)
NLATDK
IEFR
EL (1)BE (1)
ITES (1)
CYPT
SI (1)CZEEFI
SE
CH (1)LI (1)
NOIS
TR (1)MK (1)
RSHRME
(1) Provisional data.
Source: Eurostat (online data code: demo_minfind)
Population1
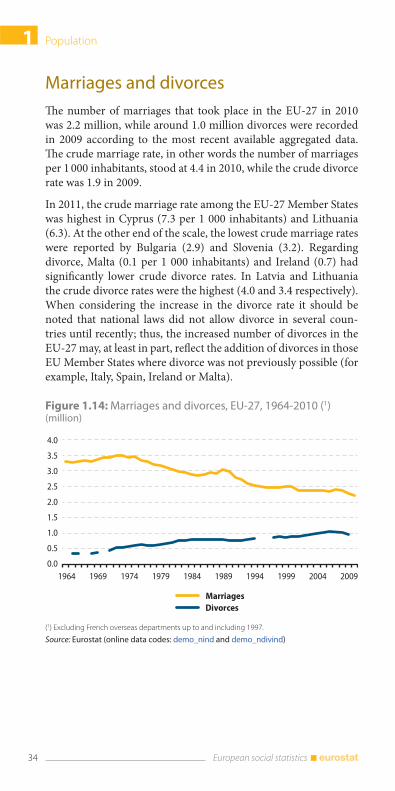
34 European social statistics
Marriages and divorces
The number of marriages that took place in the EU-27 in 2010
was 2.2 million, while around 1.0 million divorces were recorded
in 2009 according to the most recent available aggregated data.
The crude marriage rate, in other words the number of marriages
per 1 000 inhabitants, stood at 4.4 in 2010, while the crude divorce
rate was 1.9 in 2009.
In 2011, the crude marriage rate among the EU-27 Member States
was highest in Cyprus (7.3 per 1 000 inhabitants) and Lithuania
(6.3). At the other end of the scale, the lowest crude marriage rates
were reported by Bulgaria (2.9) and Slovenia (3.2). Regarding
divorce, Malta (0.1 per 1 000 inhabitants) and Ireland (0.7) had
significantly lower crude divorce rates. In Latvia and Lithuania
the crude divorce rates were the highest (4.0 and 3.4 respectively).
When considering the increase in the divorce rate it should be
noted that national laws did not allow divorce in several coun-
tries until recently; thus, the increased number of divorces in the
EU-27 may, at least in part, reflect the addition of divorces in those
EU Member States where divorce was not previously possible (for
example, Italy, Spain, Ireland or Malta).
Figure 1.14: Marriages and divorces, EU-27, 1964-2010 (1)(million)
0.0
0.5
1.0
1.5
2.0
2.5
3.0
3.5
4.0
1964 1969 1974 1979 1984 1989 1994 1999 2004 2009
Marriages
Divorces
(1) Excluding French overseas departments up to and including 1997.
Source: Eurostat (online data codes: demo_nind and demo_ndivind)
1Population
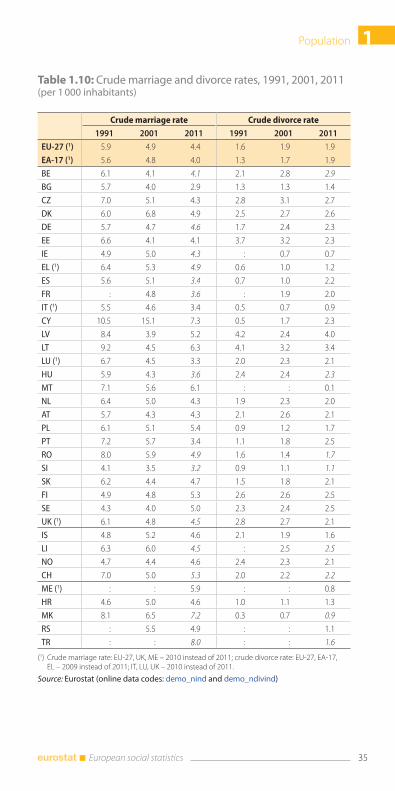
35 European social statistics
Table 1.10: Crude marriage and divorce rates, 1991, 2001, 2011 (per 1 000 inhabitants)
Crude marriage rate Crude divorce rate
1991 2001 2011 1991 2001 2011
EU-27 (1) 5.9 4.9 4.4 1.6 1.9 1.9
EA-17 (1) 5.6 4.8 4.0 1.3 1.7 1.9
BE 6.1 4.1 4.1 2.1 2.8 2.9
BG 5.7 4.0 2.9 1.3 1.3 1.4
CZ 7.0 5.1 4.3 2.8 3.1 2.7
DK 6.0 6.8 4.9 2.5 2.7 2.6
DE 5.7 4.7 4.6 1.7 2.4 2.3
EE 6.6 4.1 4.1 3.7 3.2 2.3
IE 4.9 5.0 4.3 : 0.7 0.7
EL (1) 6.4 5.3 4.9 0.6 1.0 1.2
ES 5.6 5.1 3.4 0.7 1.0 2.2
FR : 4.8 3.6 : 1.9 2.0
IT (1) 5.5 4.6 3.4 0.5 0.7 0.9
CY 10.5 15.1 7.3 0.5 1.7 2.3
LV 8.4 3.9 5.2 4.2 2.4 4.0
LT 9.2 4.5 6.3 4.1 3.2 3.4
LU (1) 6.7 4.5 3.3 2.0 2.3 2.1
HU 5.9 4.3 3.6 2.4 2.4 2.3
MT 7.1 5.6 6.1 : : 0.1
NL 6.4 5.0 4.3 1.9 2.3 2.0
AT 5.7 4.3 4.3 2.1 2.6 2.1
PL 6.1 5.1 5.4 0.9 1.2 1.7
PT 7.2 5.7 3.4 1.1 1.8 2.5
RO 8.0 5.9 4.9 1.6 1.4 1.7
SI 4.1 3.5 3.2 0.9 1.1 1.1
SK 6.2 4.4 4.7 1.5 1.8 2.1
FI 4.9 4.8 5.3 2.6 2.6 2.5
SE 4.3 4.0 5.0 2.3 2.4 2.5
UK (1) 6.1 4.8 4.5 2.8 2.7 2.1
IS 4.8 5.2 4.6 2.1 1.9 1.6
LI 6.3 6.0 4.5 : 2.5 2.5
NO 4.7 4.4 4.6 2.4 2.3 2.1
CH 7.0 5.0 5.3 2.0 2.2 2.2
ME (1) : : 5.9 : : 0.8
HR 4.6 5.0 4.6 1.0 1.1 1.3
MK 8.1 6.5 7.2 0.3 0.7 0.9
RS : 5.5 4.9 : : 1.1
TR : : 8.0 : : 1.6
(1) Crude marriage rate: EU-27, UK, ME – 2010 instead of 2011; crude divorce rate: EU-27, EA-17, EL – 2009 instead of 2011; IT, LU, UK – 2010 instead of 2011.
Source: Eurostat (online data codes: demo_nind and demo_ndivind)
Population1
36 European social statistics
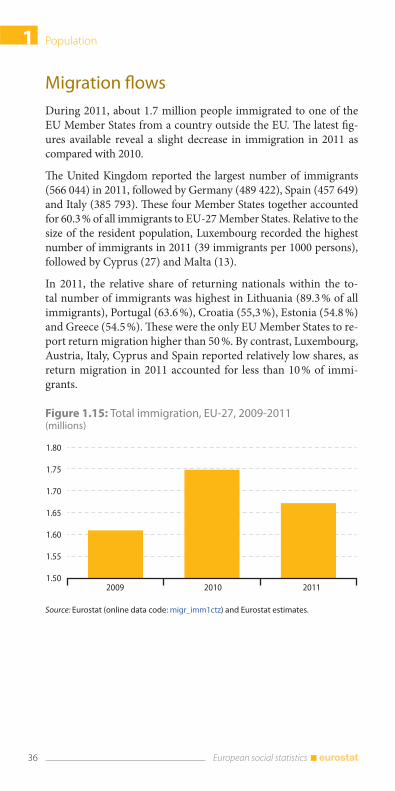
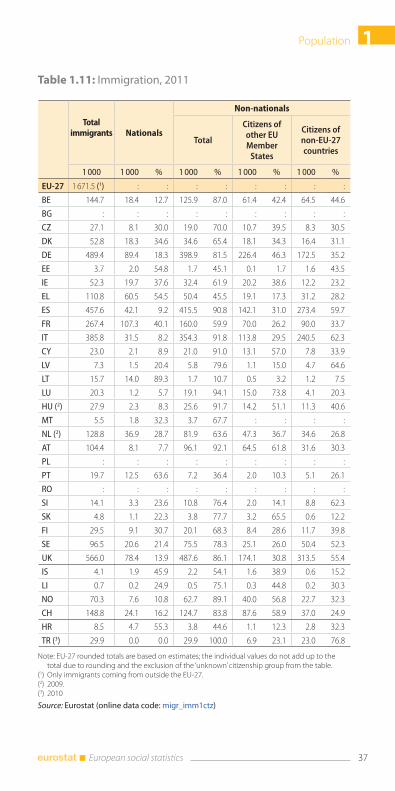
Migration flows
During 2011, about 1.7 million people immigrated to one of the
EU Member States from a country outside the EU. The latest fig-
ures available reveal a slight decrease in immigration in 2011 as
compared with 2010.
The United Kingdom reported the largest number of immigrants
(566 044) in 2011, followed by Germany (489 422), Spain (457 649)
and Italy (385 793). These four Member States together accounted
for 60.3 % of all immigrants to EU-27 Member States. Relative to the
size of the resident population, Luxembourg recorded the highest
number of immigrants in 2011 (39 immigrants per 1000 persons),
followed by Cyprus (27) and Malta (13).
In 2011, the relative share of returning nationals within the to-
tal number of immigrants was highest in Lithuania (89.3 % of all
immigrants), Portugal (63.6 %), Croatia (55,3 %), Estonia (54.8 %)
and Greece (54.5 %). These were the only EU Member States to re-
port return migration higher than 50 %. By contrast, Luxembourg,
Austria, Italy, Cyprus and Spain reported relatively low shares, as
return migration in 2011 accounted for less than 10 % of immi-
grants.
Figure 1.15: Total immigration, EU-27, 2009-2011(millions)
1.50
1.55
1.60
1.65
1.70
1.75
1.80
2009 2010 2011
Source: Eurostat (online data code: migr_imm1ctz) and Eurostat estimates.
1Population
37 European social statistics
Table 1.11: Immigration, 2011
Total immigrants Nationals
Non-nationals
Total
Citizens of other EU Member
States
Citizens of non-EU-27 countries
1 000 1 000 % 1 000 % 1 000 % 1 000 %
EU-27 1 671.5 (1) : : : : : : : :
BE 144.7 18.4 12.7 125.9 87.0 61.4 42.4 64.5 44.6
BG : : : : : : : : :
CZ 27.1 8.1 30.0 19.0 70.0 10.7 39.5 8.3 30.5
DK 52.8 18.3 34.6 34.6 65.4 18.1 34.3 16.4 31.1
DE 489.4 89.4 18.3 398.9 81.5 226.4 46.3 172.5 35.2
EE 3.7 2.0 54.8 1.7 45.1 0.1 1.7 1.6 43.5
IE 52.3 19.7 37.6 32.4 61.9 20.2 38.6 12.2 23.2
EL 110.8 60.5 54.5 50.4 45.5 19.1 17.3 31.2 28.2
ES 457.6 42.1 9.2 415.5 90.8 142.1 31.0 273.4 59.7
FR 267.4 107.3 40.1 160.0 59.9 70.0 26.2 90.0 33.7
IT 385.8 31.5 8.2 354.3 91.8 113.8 29.5 240.5 62.3
CY 23.0 2.1 8.9 21.0 91.0 13.1 57.0 7.8 33.9
LV 7.3 1.5 20.4 5.8 79.6 1.1 15.0 4.7 64.6
LT 15.7 14.0 89.3 1.7 10.7 0.5 3.2 1.2 7.5
LU 20.3 1.2 5.7 19.1 94.1 15.0 73.8 4.1 20.3
HU (2) 27.9 2.3 8.3 25.6 91.7 14.2 51.1 11.3 40.6
MT 5.5 1.8 32.3 3.7 67.7 : : : :
NL (2) 128.8 36.9 28.7 81.9 63.6 47.3 36.7 34.6 26.8
AT 104.4 8.1 7.7 96.1 92.1 64.5 61.8 31.6 30.3
PL : : : : : : : : :
PT 19.7 12.5 63.6 7.2 36.4 2.0 10.3 5.1 26.1
RO : : : : : : : : :
SI 14.1 3.3 23.6 10.8 76.4 2.0 14.1 8.8 62.3
SK 4.8 1.1 22.3 3.8 77.7 3.2 65.5 0.6 12.2
FI 29.5 9.1 30.7 20.1 68.3 8.4 28.6 11.7 39.8
SE 96.5 20.6 21.4 75.5 78.3 25.1 26.0 50.4 52.3
UK 566.0 78.4 13.9 487.6 86.1 174.1 30.8 313.5 55.4
IS 4.1 1.9 45.9 2.2 54.1 1.6 38.9 0.6 15.2
LI 0.7 0.2 24.9 0.5 75.1 0.3 44.8 0.2 30.3
NO 70.3 7.6 10.8 62.7 89.1 40.0 56.8 22.7 32.3
CH 148.8 24.1 16.2 124.7 83.8 87.6 58.9 37.0 24.9
HR 8.5 4.7 55.3 3.8 44.6 1.1 12.3 2.8 32.3
TR (3) 29.9 0.0 0.0 29.9 100.0 6.9 23.1 23.0 76.8
Note: EU-27 rounded totals are based on estimates; the individual values do not add up to the total due to rounding and the exclusion of the ‘unknown’ citizenship group from the table.
(1) Only immigrants coming from outside the EU-27.(2) 2009.(3) 2010
Source: Eurostat (online data code: migr_imm1ctz)
Population1
38 European social statistics
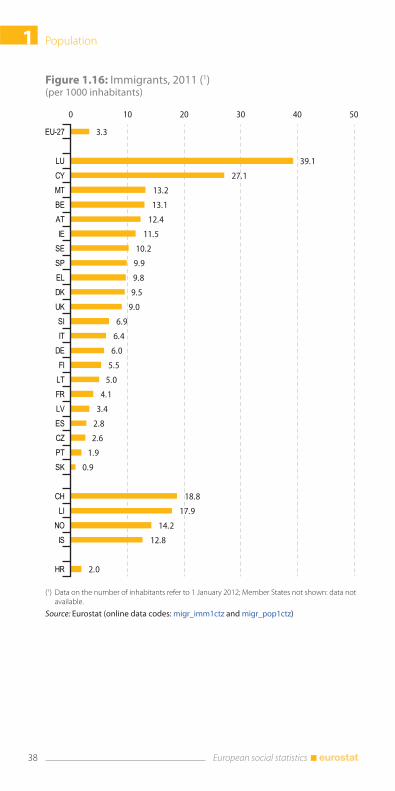
Figure 1.16: Immigrants, 2011 (1)(per 1000 inhabitants)
3.3
39.1
27.1
13.2
13.1
12.4
11.5
10.2
9.9
9.8
9.5
9.0
6.9
6.4
6.0
5.5
5.0
4.1
3.4
2.8
2.6
1.9
0.9
18.8
17.9
14.2
12.8
2.0
0 10 20 30 40 50
EU-27
LUCYMTBEATIE
SESPELDKUKSIIT
DEFI
LTFRLVESCZPTSK
CHLI
NOIS
HR
(1) Data on the number of inhabitants refer to 1 January 2012; Member States not shown: data not available.
Source: Eurostat (online data codes: migr_imm1ctz and migr_pop1ctz)
1Population
39 European social statistics
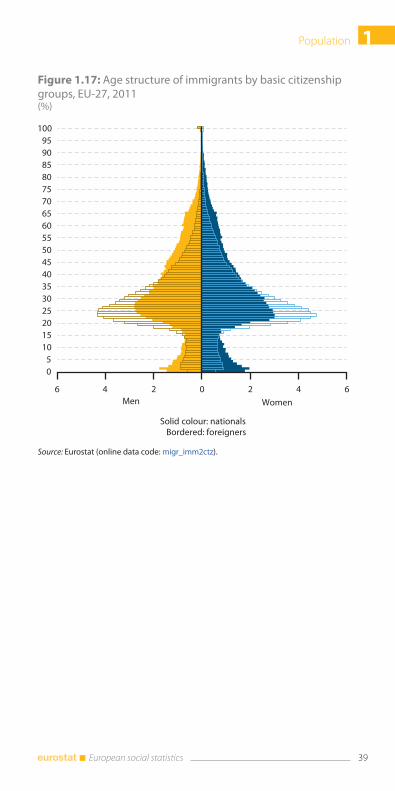
Figure 1.17: Age structure of immigrants by basic citizenship groups, EU-27, 2011(%)
6 4 2 0 2 4 6
05
101520253035404550556065707580859095
100
Men Women
Solid colour: nationalsBordered: foreigners
Source: Eurostat (online data code: migr_imm2ctz).
Population1
40 European social statistics
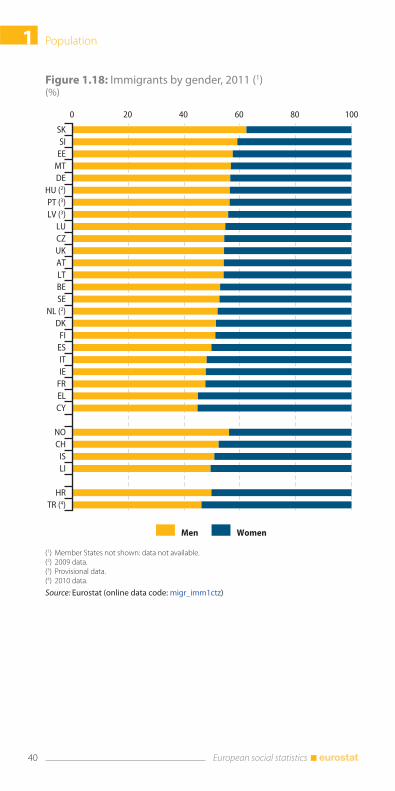
Figure 1.18: Immigrants by gender, 2011 (1)(%)
0 20 40 60 80 100
SKSI
EEMTDE
HU (2)PT (3)LV (3)
LUCZUKATLTBESE
NL (2)DK
FIESITIE
FRELCY
NOCH
ISLI
HRTR (4)
Men Women
(1) Member States not shown: data not available. (2) 2009 data.(3) Provisional data.(4) 2010 data.
Source: Eurostat (online data code: migr_imm1ctz)
1Population
41 European social statistics
Figure 1.19: Return migrants by citizenship, 2011 (1)(%)
0 20 40 60 80 100
LT
PT
EE
EL
FR
IE
DK
MT
FI
CZ
SI
SK
SE
LV
DE
UK
BE
ES
CY
IT
AT
LU
IS
LI
CH
NO
HR
Nationals Non-nationals Unknown
(1) Member States not shown: data not available.
Source: Eurostat (online data code: migr_imm1ctz)
Population1
42 European social statistics
Migration stocks
The EU-27 foreign population (people residing in an EU-27
Member State with citizenship of a non EU-27 Member State) on
1 January 2012 was 20.7 million, representing 4,1 % of the EU-27
population. In addition, there were 13.6 million persons living in a
EU-27 Member State with citizenship of another EU-27 Member
State on 1 January 2012.
In absolute terms, the largest numbers of foreigners living in the
EU on 1 January 2012 were found in Germany (7.4 million per-
sons), Spain (5.6 million), Italy (4.8 million), the United King-
dom (4.8 million) and France (3.9 million). Non-nationals in
these five Member States collectively represented 77.1 % of the
total number of non-nationals living in the EU-27, while the
same five Member States had a 62.9 % share of the EU’s popula-
tion. In relative terms, the EU-27 Member State with the highest
share of non-nationals was Luxembourg, as they accounted for
43.8 % of the total population. A high proportion of non-nation-
als (10 % or more of the resident population) was also observed
in Cyprus, Latvia, Estonia, Spain, Austria, Belgium and Ireland.
In most EU Member States the majority of non-nationals are
citizens of non-EU countries. The opposite is true only for Lux-
embourg, Ireland, Belgium, Slovakia, Cyprus, Hungary and the
Netherlands. In the case of Latvia and Estonia, the proportion of
citizens from non-EU countries is particularly large due to the
high number of recognised non-citizens (mainly former Soviet
Union citizens, who are permanently resident in these countries
but have not acquired any other citizenship).
Country of birth is another key variable for studying populations
with a foreign background. There were 33.0 million people born
outside a country of the EU-27 on 1 January 2012 and there were
17.2 million persons who were born in a different EU-27 Member
State from the country of residence. Only in Luxembourg, Ire-
land, Hungary, Cyprus and Slovakia did foreign-born people from
other EU-27 countries outnumber those born outside the EU-27.
People born abroad outnumbered foreign citizens in all Member
States, except in Luxembourg, Latvia and the Czech Republic.
1Population
43 European social statistics
Figure 1.20: Share of foreigners of the total population, 2012(%)
4.1
43.8
20.0
16.3
15.7
12.0
11.2
11.0
10.6
9.1
8.6
7.9
7.6
6.8
6.4
5.9
4.9
4.2
4.2
4.2
4.0
3.4
2.1
1.3
0.7
0.6
0.2
0.1
33.3
22.8
8.2
6.6
0.5
0 10 20 30 40 50
EU-27 (1)
LU
CY
LV
EE
ES
AT
BE
IE
DE
EL
IT
UK
SE
DK
FR
MT
NL
PT (2)
SI
CZ
FI
HU
SK
LT
BG
RO (2)
PL (2)
LI
CH
NO
IS
HR (3)
(1) Eurostat estimate.(2) Provisional data.(3) Population data for Croatia comes from 2011 Census as on 31 March 2011.
Source: Eurostat (online data code: migr_pop1ctz)
Population1
44 European social statistics
Table 1.12: Foreign population by groups of country of citizenship, 2012(absolute numbers and the share of the total population)
TotalCitizens of other
EU Member StatesCitizens of a
non-EU-27 country
1000 % 1000 % 1000 %
Sum of EU-27 (1) 34 323.4 6.8 13 613.5 2.7 20 709.9 4.1
BE 1 224.9 11.0 778.6 7.0 446.3 4.0
BG 42.4 0.6 11.3 0.2 31.1 0.4
CZ 423.0 4.0 151.3 1.4 271.7 2.6
DK 358.7 6.4 134.9 2.4 223.8 4.0
DE 7 409.8 9.1 2 744.8 3.4 4 665.0 5.7
EE 206.6 15.7 14.4 1.1 192.2 14.6
IE 487.9 10.6 388.8 8.5 99.1 2.2
EL 975.4 8.6 151.2 1.3 824.2 7.3
ES 5 562.1 12.0 2 354.5 5.1 3 207.6 6.9
FR 3 858.3 5.9 1 353.1 2.1 2 505.2 3.8
IT 4 825.6 7.9 1 450.1 2.4 3 375.4 5.5
CY 172.4 20.0 108.3 12.6 64.1 7.4
LV 332.9 16.3 6.7 0.3 326.2 16.0
LT 20.6 0.7 3.0 0.1 17.6 0.6
LU 229.9 43.8 198.7 37.9 31.2 5.9
HU 207.6 2.1 127.9 1.3 79.7 0.8
MT 20.5 4.9 : : : :
NL 697.7 4.2 360.8 2.2 336.9 2.0
AT 947.7 11.2 382.7 4.5 565.0 6.7
PL 57.5 0.1 18.4 0.0 39.0 0.1
PT 439.1 4.2 108.0 1.0 331.1 3.1
RO 36.5 0.2 7.0 0.0 29.5 0.1
SI 85.6 4.2 6.1 0.3 79.5 3.9
SK 70.7 1.3 54.0 1.0 16.7 0.3
FI 181.7 3.4 68.3 1.3 113.4 2.1
SE 646.1 6.8 276.0 2.9 370.1 3.9
UK 4 802.3 7.6 2 344.1 3.7 2 458.2 3.9
IS 21.0 6.6 16.5 5.2 4.5 1.4
LI 12.1 33.3 6.0 16.6 6.1 16.7
NO 409.2 8.2 247.2 5.0 161.9 3.3
CH 1 815.1 22.8 1 141.1 14.3 673.9 8.5
HR (2) 23.3 0.5 7.7 0.2 15.6 0.4
(1) EU-27 rounded totals are based on estimates; the individual values do not add up to the total due to rounding.
(2) Population data for Croatia comes from 2011 Census as on 31 March 2011.
Source: Eurostat (online data code: migr_pop1ctz)
1Population
45 European social statistics
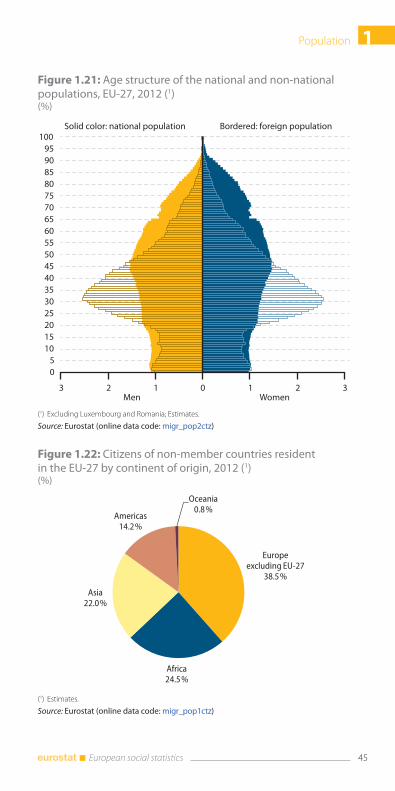
Figure 1.21: Age structure of the national and non-national populations, EU-27, 2012 (1)(%)
3 2 1 0 1 2 3
05
101520253035404550556065707580859095
100
Men Women
Solid color: national population Bordered: foreign population
(1) Excluding Luxembourg and Romania; Estimates.
Source: Eurostat (online data code: migr_pop2ctz)
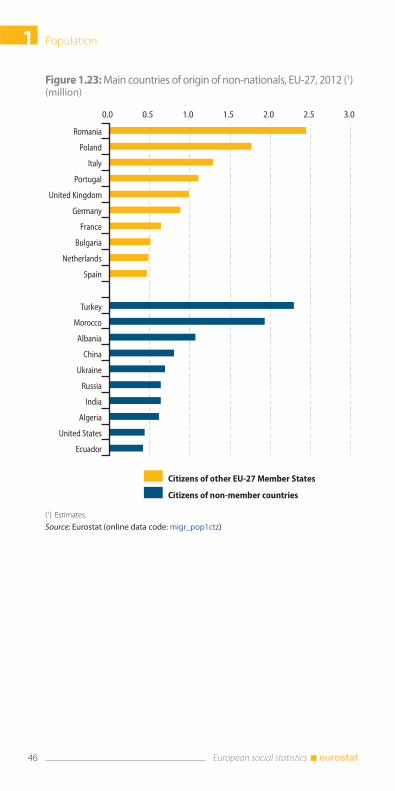
Figure 1.22: Citizens of non-member countries resident in the EU-27 by continent of origin, 2012 (1)(%)
Africa24.5 %
Asia22.0 %
Americas14.2 %
Oceania0.8 %
Europeexcluding EU-27
38.5 %
(1) Estimates.
Source: Eurostat (online data code: migr_pop1ctz)
Population1
46 European social statistics
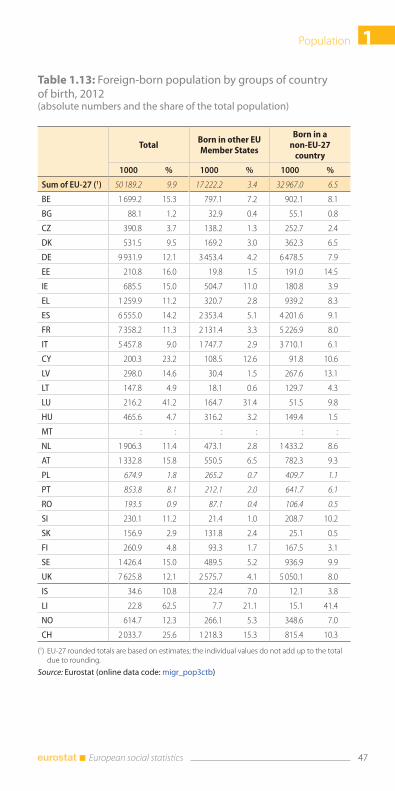
Figure 1.23: Main countries of origin of non-nationals, EU-27, 2012 (1)(million)
0.0 0.5 1.0 1.5 2.0 2.5 3.0
Romania
Italy
Poland
United Kingdom
Portugal
France
Germany
Netherlands
Bulgaria
Spain
Morocco
Turkey
China
Albania
Russia
Ukraine
Algeria
India
Ecuador
United States
Citizens of other EU-27 Member States
Citizens of non-member countries
(1) Estimates.
Source: Eurostat (online data code: migr_pop1ctz)
1Population
47 European social statistics
Table 1.13: Foreign-born population by groups of country of birth, 2012(absolute numbers and the share of the total population)
TotalBorn in other EU Member States
Born in a non-EU-27
country
1000 % 1000 % 1000 %
Sum of EU-27 (1) 50 189.2 9.9 17 222.2 3.4 32 967.0 6.5
BE 1 699.2 15.3 797.1 7.2 902.1 8.1
BG 88.1 1.2 32.9 0.4 55.1 0.8
CZ 390.8 3.7 138.2 1.3 252.7 2.4
DK 531.5 9.5 169.2 3.0 362.3 6.5
DE 9 931.9 12.1 3 453.4 4.2 6 478.5 7.9
EE 210.8 16.0 19.8 1.5 191.0 14.5
IE 685.5 15.0 504.7 11.0 180.8 3.9
EL 1 259.9 11.2 320.7 2.8 939.2 8.3
ES 6 555.0 14.2 2 353.4 5.1 4 201.6 9.1
FR 7 358.2 11.3 2 131.4 3.3 5 226.9 8.0
IT 5 457.8 9.0 1 747.7 2.9 3 710.1 6.1
CY 200.3 23.2 108.5 12.6 91.8 10.6
LV 298.0 14.6 30.4 1.5 267.6 13.1
LT 147.8 4.9 18.1 0.6 129.7 4.3
LU 216.2 41.2 164.7 31.4 51.5 9.8
HU 465.6 4.7 316.2 3.2 149.4 1.5
MT : : : : : :
NL 1 906.3 11.4 473.1 2.8 1 433.2 8.6
AT 1 332.8 15.8 550.5 6.5 782.3 9.3
PL 674.9 1.8 265.2 0.7 409.7 1.1
PT 853.8 8.1 212.1 2.0 641.7 6.1
RO 193.5 0.9 87.1 0.4 106.4 0.5
SI 230.1 11.2 21.4 1.0 208.7 10.2
SK 156.9 2.9 131.8 2.4 25.1 0.5
FI 260.9 4.8 93.3 1.7 167.5 3.1
SE 1 426.4 15.0 489.5 5.2 936.9 9.9
UK 7 625.8 12.1 2 575.7 4.1 5 050.1 8.0
IS 34.6 10.8 22.4 7.0 12.1 3.8
LI 22.8 62.5 7.7 21.1 15.1 41.4
NO 614.7 12.3 266.1 5.3 348.6 7.0
CH 2 033.7 25.6 1 218.3 15.3 815.4 10.3
(1) EU-27 rounded totals are based on estimates; the individual values do not add up to the total due to rounding.
Source: Eurostat (online data code: migr_pop3ctb)
Population1
48 European social statistics
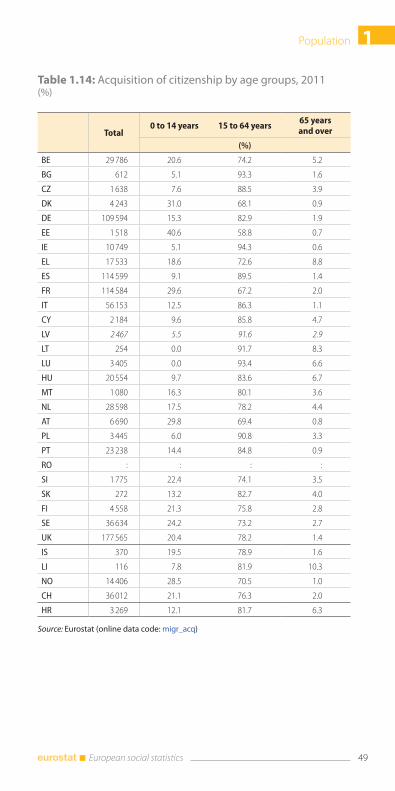
Acquisition of citizenship
The number of people acquiring the citizenship of an EU-27 Member
State in 2011 was 782 200, corresponding to a 3.5 % decrease with re-
spect to 2010. 2010 saw the greatest number of people acquiring the
citizenship of an EU Member State since 2001, and the first time that
the total number rose above 0.8 million.
The United Kingdom had the highest number of persons acquiring
citizenship in 2011, at 177 565 (or 22.7 % of the EU-27 total). The next
highest levels of acquisition of citizenship were in France (114 584),
Spain (114 599) and Germany (109 594); none of the remaining Mem-
ber States granted citizenship to more than 100 000 people in 2011.
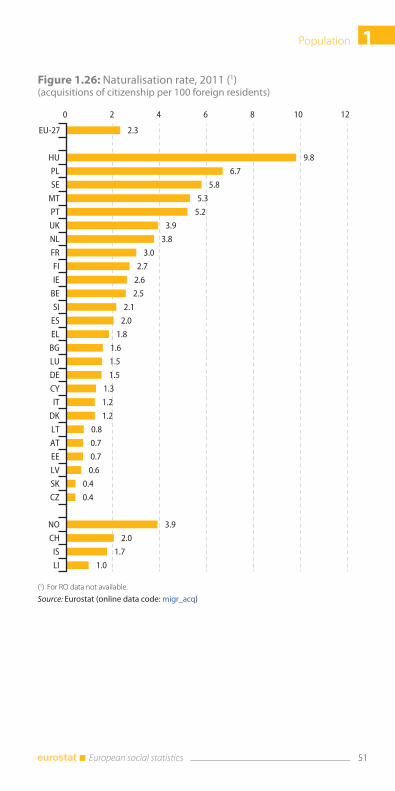
One indicator commonly used to measure the effect of national poli-
cies on citizenship is the ‘naturalisation rate’ or the ratio between the
total number of citizenships granted and the stock of foreign resi-
dents in a country at the beginning of the year. The country with the
highest naturalisation rate in 2011 was Hungary (9.8 acquisitions per
100 foreign residents), followed by Poland (6.7) and Sweden (5.8), fol-
lowed by Malta and Portugal with rates higher than 5 acquisitions per
100 foreign residents.
Figure 1.24: Total acquisitions of citizenship, EU-27, 2001-2011(1 000)
0
200
400
600
800
1000
2001 2002 2003 2004 2005 2006 2007 2008 2009 2010 2011
Source: Eurostat (online data code: migr_acq)
1Population
49 European social statistics
Table 1.14: Acquisition of citizenship by age groups, 2011 (%)
Total0 to 14 years 15 to 64 years
65 years and over
(%)
BE 29 786 20.6 74.2 5.2
BG 612 5.1 93.3 1.6
CZ 1 638 7.6 88.5 3.9
DK 4 243 31.0 68.1 0.9
DE 109 594 15.3 82.9 1.9
EE 1 518 40.6 58.8 0.7
IE 10 749 5.1 94.3 0.6
EL 17 533 18.6 72.6 8.8
ES 114 599 9.1 89.5 1.4
FR 114 584 29.6 67.2 2.0
IT 56 153 12.5 86.3 1.1
CY 2 184 9.6 85.8 4.7
LV 2 467 5.5 91.6 2.9
LT 254 0.0 91.7 8.3
LU 3 405 0.0 93.4 6.6
HU 20 554 9.7 83.6 6.7
MT 1 080 16.3 80.1 3.6
NL 28 598 17.5 78.2 4.4
AT 6 690 29.8 69.4 0.8
PL 3 445 6.0 90.8 3.3
PT 23 238 14.4 84.8 0.9
RO : : : :
SI 1 775 22.4 74.1 3.5
SK 272 13.2 82.7 4.0
FI 4 558 21.3 75.8 2.8
SE 36 634 24.2 73.2 2.7
UK 177 565 20.4 78.2 1.4
IS 370 19.5 78.9 1.6
LI 116 7.8 81.9 10.3
NO 14 406 28.5 70.5 1.0
CH 36 012 21.1 76.3 2.0
HR 3 269 12.1 81.7 6.3
Source: Eurostat (online data code: migr_acq)
Population1
50 European social statistics
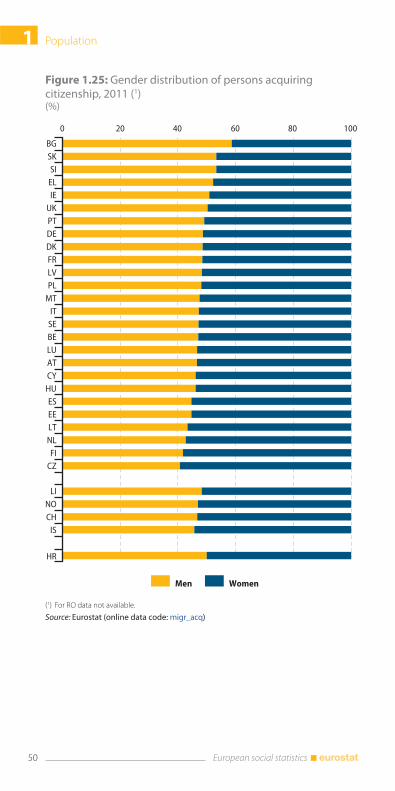
Figure 1.25: Gender distribution of persons acquiring citizenship, 2011 (1)(%)
0 20 40 60 80 100
BGSKSI
ELIE
UKPTDEDKFRLVPL
MTIT
SEBELUATCYHUESEELTNLFI
CZ
LINOCH
IS
HR
Men Women
(1) For RO data not available.
Source: Eurostat (online data code: migr_acq)
1Population
51 European social statistics
Figure 1.26: Naturalisation rate, 2011 (1)(acquisitions of citizenship per 100 foreign residents)
2.3
9.8
6.7
5.8
5.3
5.2
3.9
3.8
3.0
2.7
2.6
2.5
2.1
2.0
1.8
1.6
1.5
1.5
1.3
1.2
1.2
0.8
0.7
0.7
0.6
0.4
0.4
3.9
2.0
1.7
1.0
0 2 4 6 8 10 12
EU-27
HU
PL
SE
MT
PT
UK
NL
FR
FI
IE
BE
SI
ES
EL
BG
LU
DE
CY
IT
DK
LT
AT
EE
LV
SK
CZ
NO
CH
IS
LI
(1) For RO data not available.
Source: Eurostat (online data code: migr_acq)
Population1
52 European social statistics
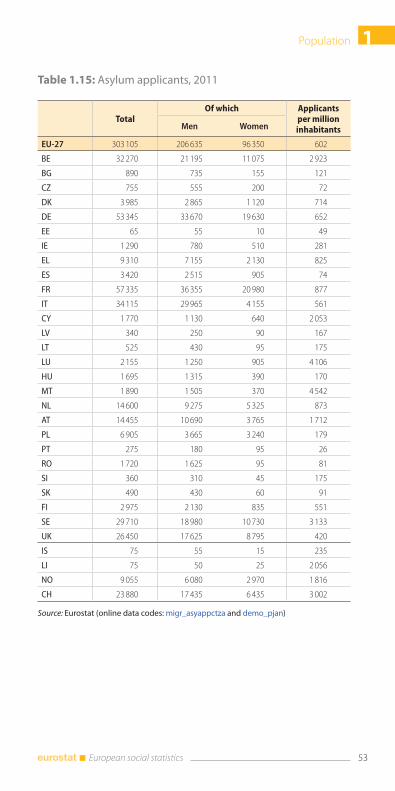
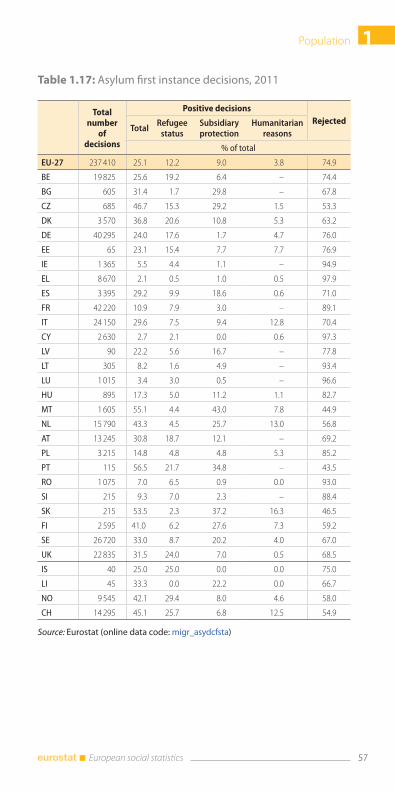
Asylum
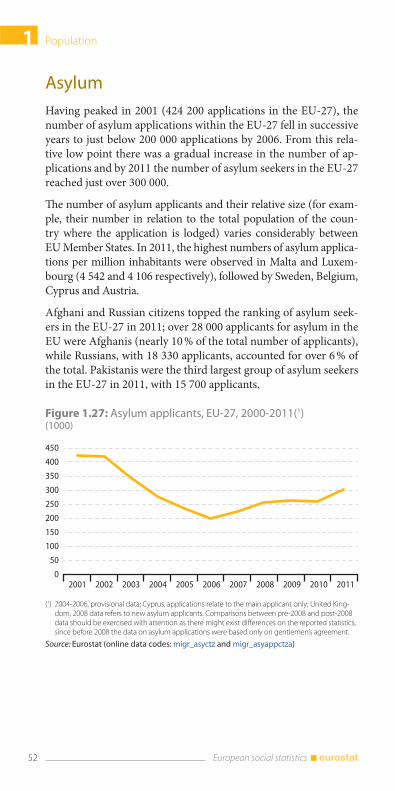
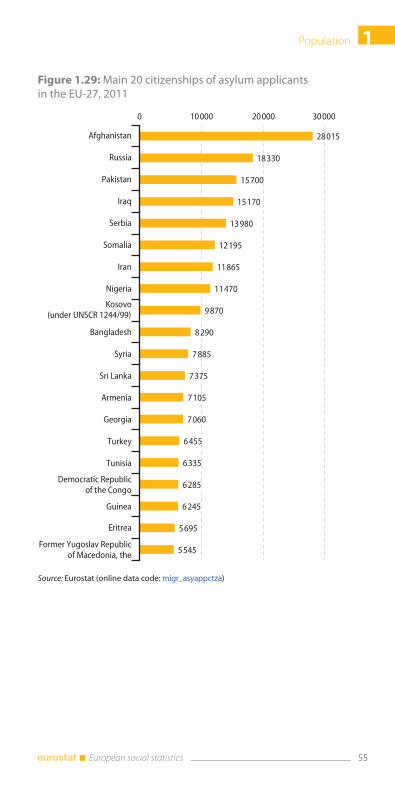
Having peaked in 2001 (424 200 applications in the EU-27), the
number of asylum applications within the EU-27 fell in successive
years to just below 200 000 applications by 2006. From this rela-
tive low point there was a gradual increase in the number of ap-
plications and by 2011 the number of asylum seekers in the EU-27
reached just over 300 000.
The number of asylum applicants and their relative size (for exam-
ple, their number in relation to the total population of the coun-
try where the application is lodged) varies considerably between
EU Member States. In 2011, the highest numbers of asylum applica-
tions per million inhabitants were observed in Malta and Luxem-
bourg (4 542 and 4 106 respectively), followed by Sweden, Belgium,
Cyprus and Austria.
Afghani and Russian citizens topped the ranking of asylum seek-
ers in the EU-27 in 2011; over 28 000 applicants for asylum in the
EU were Afghanis (nearly 10 % of the total number of applicants),
while Russians, with 18 330 applicants, accounted for over 6 % of
the total. Pakistanis were the third largest group of asylum seekers
in the EU-27 in 2011, with 15 700 applicants.
Figure 1.27: Asylum applicants, EU-27, 2000-2011(1)(1000)
0
50
100
150
200
250
300
350
400
450
2001 2002 2003 2004 2005 2006 2007 2008 2009 2010 2011
(1) 2004-2006, provisional data; Cyprus, applications relate to the main applicant only; United King-dom, 2008 data refers to new asylum applicants. Comparisons between pre-2008 and post-2008 data should be exercised with attention as there might exist differences on the reported statistics, since before 2008 the data on asylum applications were based only on gentlemen’s agreement.
Source: Eurostat (online data codes: migr_asyctz and migr_asyappctza)
1Population
53 European social statistics
Table 1.15: Asylum applicants, 2011
TotalOf which Applicants
per million inhabitantsMen Women
EU-27 303 105 206 635 96 350 602
BE 32 270 21 195 11 075 2 923
BG 890 735 155 121
CZ 755 555 200 72
DK 3 985 2 865 1 120 714
DE 53 345 33 670 19 630 652
EE 65 55 10 49
IE 1 290 780 510 281
EL 9 310 7 155 2 130 825
ES 3 420 2 515 905 74
FR 57 335 36 355 20 980 877
IT 34 115 29 965 4 155 561
CY 1 770 1 130 640 2 053
LV 340 250 90 167
LT 525 430 95 175
LU 2 155 1 250 905 4 106
HU 1 695 1 315 390 170
MT 1 890 1 505 370 4 542
NL 14 600 9 275 5 325 873
AT 14 455 10 690 3 765 1 712
PL 6 905 3 665 3 240 179
PT 275 180 95 26
RO 1 720 1 625 95 81
SI 360 310 45 175
SK 490 430 60 91
FI 2 975 2 130 835 551
SE 29 710 18 980 10 730 3 133
UK 26 450 17 625 8 795 420
IS 75 55 15 235
LI 75 50 25 2 056
NO 9 055 6 080 2 970 1 816
CH 23 880 17 435 6 435 3 002
Source: Eurostat (online data codes: migr_asyappctza and demo_pjan)
Population1
54 European social statistics
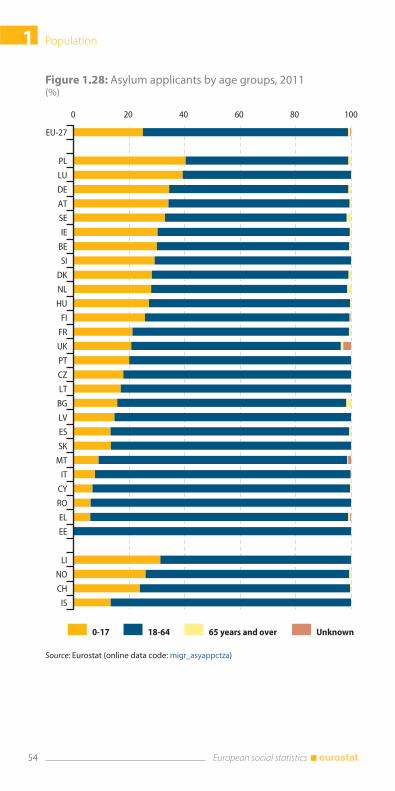
Figure 1.28: Asylum applicants by age groups, 2011(%)
0 20 40 60 80 100
EU-27
PL
LU
DE
AT
SE
IE
BE
SI
DK
NL
HU
FI
FR
UK
PT
CZ
LT
BG
LV
ES
SK
MT
IT
CY
RO
EL
EE
LI
NO
CH
IS
0-17 18-64 65 years and over Unknown
Source: Eurostat (online data code: migr_asyappctza)
1Population
55 European social statistics
Figure 1.29: Main 20 citizenships of asylum applicants in the EU-27, 2011
28 015
18 330
15 700
15 170
13 980
12 195
11 865
11 470
9 870
8 290
7 885
7 375
7 105
7 060
6 455
6 335
6 285
6 245
5 695
5 545
0 10 000 20 000 30 000
Afghanistan
Russia
Pakistan
Iraq
Serbia
Somalia
Iran
Nigeria
Bangladesh
Syria
Sri Lanka
Armenia
Georgia
Turkey
Tunisia
Guinea
Eritrea
Kosovo(under UNSCR 1244/99)
Democratic Republicof the Congo
Former Yugoslav Republicof Macedonia, the
Source: Eurostat (online data code: migr_asyappctza)
Population1
56 European social statistics
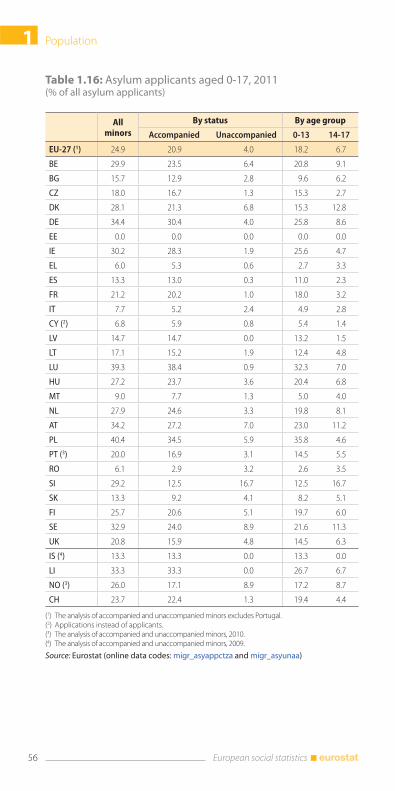
Table 1.16: Asylum applicants aged 0-17, 2011(% of all asylum applicants)
All minors
By status By age group
Accompanied Unaccompanied 0-13 14-17
EU-27 (1) 24.9 20.9 4.0 18.2 6.7
BE 29.9 23.5 6.4 20.8 9.1
BG 15.7 12.9 2.8 9.6 6.2
CZ 18.0 16.7 1.3 15.3 2.7
DK 28.1 21.3 6.8 15.3 12.8
DE 34.4 30.4 4.0 25.8 8.6
EE 0.0 0.0 0.0 0.0 0.0
IE 30.2 28.3 1.9 25.6 4.7
EL 6.0 5.3 0.6 2.7 3.3
ES 13.3 13.0 0.3 11.0 2.3
FR 21.2 20.2 1.0 18.0 3.2
IT 7.7 5.2 2.4 4.9 2.8
CY (2) 6.8 5.9 0.8 5.4 1.4
LV 14.7 14.7 0.0 13.2 1.5
LT 17.1 15.2 1.9 12.4 4.8
LU 39.3 38.4 0.9 32.3 7.0
HU 27.2 23.7 3.6 20.4 6.8
MT 9.0 7.7 1.3 5.0 4.0
NL 27.9 24.6 3.3 19.8 8.1
AT 34.2 27.2 7.0 23.0 11.2
PL 40.4 34.5 5.9 35.8 4.6
PT (3) 20.0 16.9 3.1 14.5 5.5
RO 6.1 2.9 3.2 2.6 3.5
SI 29.2 12.5 16.7 12.5 16.7
SK 13.3 9.2 4.1 8.2 5.1
FI 25.7 20.6 5.1 19.7 6.0
SE 32.9 24.0 8.9 21.6 11.3
UK 20.8 15.9 4.8 14.5 6.3
IS (4) 13.3 13.3 0.0 13.3 0.0
LI 33.3 33.3 0.0 26.7 6.7
NO (3) 26.0 17.1 8.9 17.2 8.7
CH 23.7 22.4 1.3 19.4 4.4
(1) The analysis of accompanied and unaccompanied minors excludes Portugal.(2) Applications instead of applicants.(3) The analysis of accompanied and unaccompanied minors, 2010.(4) The analysis of accompanied and unaccompanied minors, 2009.
Source: Eurostat (online data codes: migr_asyappctza and migr_asyunaa)
1Population
57 European social statistics
Table 1.17: Asylum first instance decisions, 2011
Total number
of decisions
Positive decisions
RejectedTotal
Refugee status
Subsidiary protection
Humanitarian reasons
% of total
EU-27 237 410 25.1 12.2 9.0 3.8 74.9
BE 19 825 25.6 19.2 6.4 – 74.4
BG 605 31.4 1.7 29.8 – 67.8
CZ 685 46.7 15.3 29.2 1.5 53.3
DK 3 570 36.8 20.6 10.8 5.3 63.2
DE 40 295 24.0 17.6 1.7 4.7 76.0
EE 65 23.1 15.4 7.7 7.7 76.9
IE 1 365 5.5 4.4 1.1 – 94.9
EL 8 670 2.1 0.5 1.0 0.5 97.9
ES 3 395 29.2 9.9 18.6 0.6 71.0
FR 42 220 10.9 7.9 3.0 – 89.1
IT 24 150 29.6 7.5 9.4 12.8 70.4
CY 2 630 2.7 2.1 0.0 0.6 97.3
LV 90 22.2 5.6 16.7 – 77.8
LT 305 8.2 1.6 4.9 – 93.4
LU 1 015 3.4 3.0 0.5 – 96.6
HU 895 17.3 5.0 11.2 1.1 82.7
MT 1 605 55.1 4.4 43.0 7.8 44.9
NL 15 790 43.3 4.5 25.7 13.0 56.8
AT 13 245 30.8 18.7 12.1 – 69.2
PL 3 215 14.8 4.8 4.8 5.3 85.2
PT 115 56.5 21.7 34.8 – 43.5
RO 1 075 7.0 6.5 0.9 0.0 93.0
SI 215 9.3 7.0 2.3 – 88.4
SK 215 53.5 2.3 37.2 16.3 46.5
FI 2 595 41.0 6.2 27.6 7.3 59.2
SE 26 720 33.0 8.7 20.2 4.0 67.0
UK 22 835 31.5 24.0 7.0 0.5 68.5
IS 40 25.0 25.0 0.0 0.0 75.0
LI 45 33.3 0.0 22.2 0.0 66.7
NO 9 545 42.1 29.4 8.0 4.6 58.0
CH 14 295 45.1 25.7 6.8 12.5 54.9
Source: Eurostat (online data code: migr_asydcfsta)
Population1
58 European social statistics
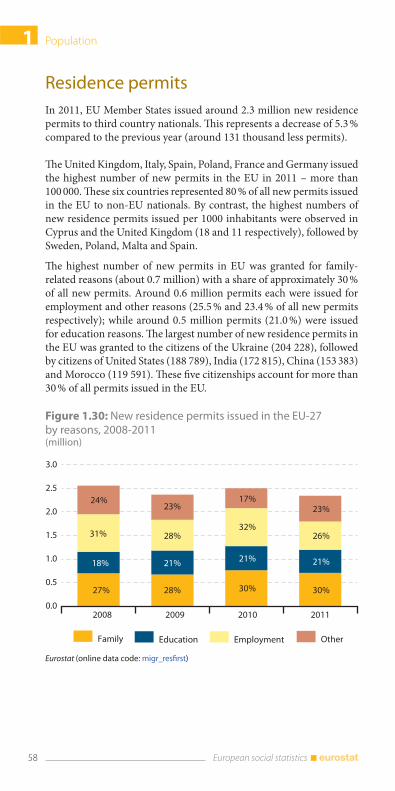
Residence permits
In 2011, EU Member States issued around 2.3 million new residence
permits to third country nationals. This represents a decrease of 5.3 %
compared to the previous year (around 131 thousand less permits).
The United Kingdom, Italy, Spain, Poland, France and Germany issued
the highest number of new permits in the EU in 2011 – more than
100 000. These six countries represented 80 % of all new permits issued
in the EU to non-EU nationals. By contrast, the highest numbers of
new residence permits issued per 1000 inhabitants were observed in
Cyprus and the United Kingdom (18 and 11 respectively), followed by
Sweden, Poland, Malta and Spain.
The highest number of new permits in EU was granted for family-
related reasons (about 0.7 million) with a share of approximately 30 %
of all new permits. Around 0.6 million permits each were issued for
employment and other reasons (25.5 % and 23.4 % of all new permits
respectively); while around 0.5 million permits (21.0 %) were issued
for education reasons. The largest number of new residence permits in
the EU was granted to the citizens of the Ukraine (204 228), followed
by citizens of United States (188 789), India (172 815), China (153 383)
and Morocco (119 591). These five citizenships account for more than
30 % of all permits issued in the EU.
Figure 1.30: New residence permits issued in the EU-27 by reasons, 2008-2011(million)
0.0
0.5
1.0
1.5
2.0
2.5
3.0
2008 2009 2010 2011
Family Education Employment Other
24 %
31 %
18 %
27 %
23 %
28 %
21 %
28 %
17 %
32 %
21 %
30 %
23 %
26 %
21 %
30 %
Eurostat (online data code: migr_resfirst)
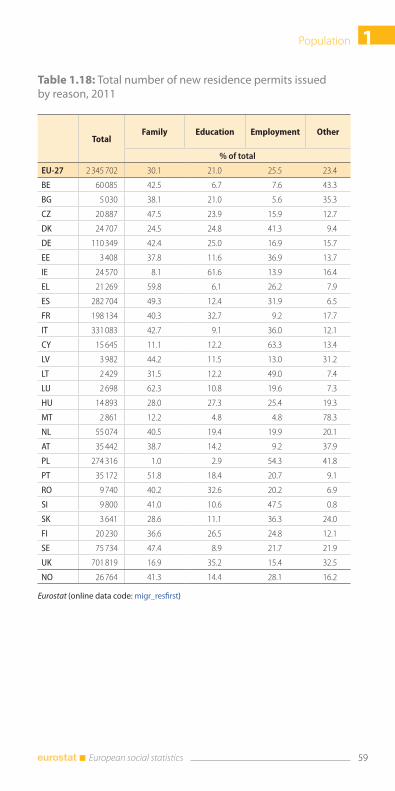
1Population
59 European social statistics
Table 1.18: Total number of new residence permits issued by reason, 2011
TotalFamily Education Employment Other
% of total
EU-27 2 345 702 30.1 21.0 25.5 23.4
BE 60 085 42.5 6.7 7.6 43.3
BG 5 030 38.1 21.0 5.6 35.3
CZ 20 887 47.5 23.9 15.9 12.7
DK 24 707 24.5 24.8 41.3 9.4
DE 110 349 42.4 25.0 16.9 15.7
EE 3 408 37.8 11.6 36.9 13.7
IE 24 570 8.1 61.6 13.9 16.4
EL 21 269 59.8 6.1 26.2 7.9
ES 282 704 49.3 12.4 31.9 6.5
FR 198 134 40.3 32.7 9.2 17.7
IT 331 083 42.7 9.1 36.0 12.1
CY 15 645 11.1 12.2 63.3 13.4
LV 3 982 44.2 11.5 13.0 31.2
LT 2 429 31.5 12.2 49.0 7.4
LU 2 698 62.3 10.8 19.6 7.3
HU 14 893 28.0 27.3 25.4 19.3
MT 2 861 12.2 4.8 4.8 78.3
NL 55 074 40.5 19.4 19.9 20.1
AT 35 442 38.7 14.2 9.2 37.9
PL 274 316 1.0 2.9 54.3 41.8
PT 35 172 51.8 18.4 20.7 9.1
RO 9 740 40.2 32.6 20.2 6.9
SI 9 800 41.0 10.6 47.5 0.8
SK 3 641 28.6 11.1 36.3 24.0
FI 20 230 36.6 26.5 24.8 12.1
SE 75 734 47.4 8.9 21.7 21.9
UK 701 819 16.9 35.2 15.4 32.5
NO 26 764 41.3 14.4 28.1 16.2
Eurostat (online data code: migr_resfirst)
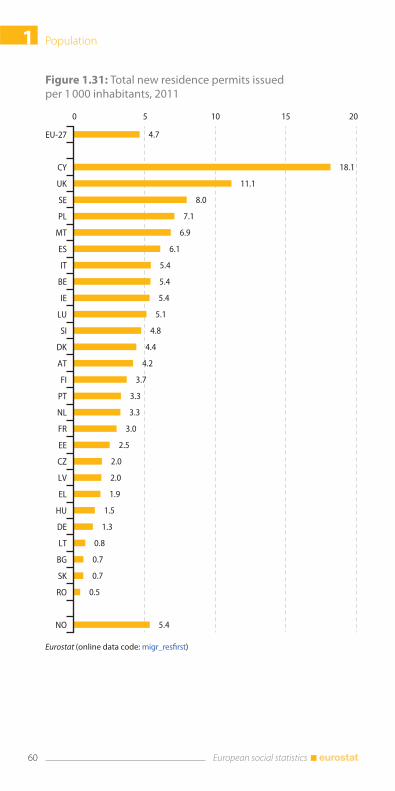
Population1
60 European social statistics
Figure 1.31: Total new residence permits issued per 1 000 inhabitants, 2011
4.7
18.1
11.1
8.0
7.1
6.9
6.1
5.4
5.4
5.4
5.1
4.8
4.4
4.2
3.7
3.3
3.3
3.0
2.5
2.0
2.0
1.9
1.5
1.3
0.8
0.7
0.7
0.5
5.4
0 5 10 15 20
EU-27
CY
UK
SE
PL
MT
ES
IT
BE
IE
LU
SI
DK
AT
FI
PT
NL
FR
EE
CZ
LV
EL
HU
DE
LT
BG
SK
RO
NO
Eurostat (online data code: migr_resfirst)
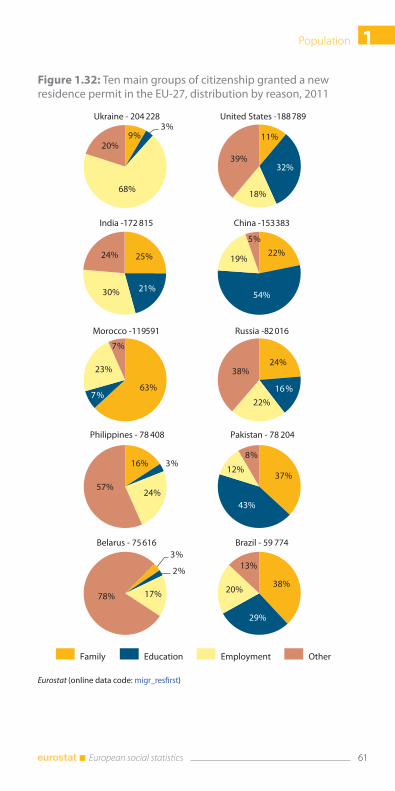
1Population
61 European social statistics
Figure 1.32: Ten main groups of citizenship granted a new residence permit in the EU-27, distribution by reason, 2011
3 %
2 %
17 %78 %
9 %3 %
68 %
20 %
63 %7 %
23 %
7 %
11 %
32 %
18 %
39 %
38 %
29 %
20 %
13 %
22 %
54 %
19 %
5 %
25 %
21 %30 %
24 %
37 %
43 %
12 %
8 %16 % 3 %
24 %57 %
24 %
16 %22 %
38 %
India -172 815 China -153 383
Morocco -119 591 Russia -82 016
Philippines - 78 408 Pakistan - 78 204
Belarus - 75 616 Brazil - 59 774
United States -188 789Ukraine - 204 228
Family Education Employment Other
Eurostat (online data code: migr_resfirst)
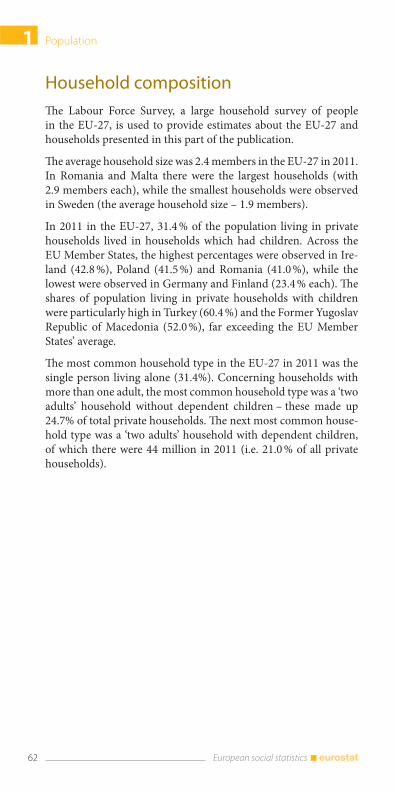
Population1
62 European social statistics
Household composition
The Labour Force Survey, a large household survey of people
in the EU-27, is used to provide estimates about the EU-27 and
households presented in this part of the publication.
The average household size was 2.4 members in the EU-27 in 2011.
In Romania and Malta there were the largest households (with
2.9 members each), while the smallest households were observed
in Sweden (the average household size – 1.9 members).
In 2011 in the EU-27, 31.4 % of the population living in private
households lived in households which had children. Across the
EU Member States, the highest percentages were observed in Ire-
land (42.8 %), Poland (41.5 %) and Romania (41.0 %), while the
lowest were observed in Germany and Finland (23.4 % each). The
shares of population living in private households with children
were particularly high in Turkey (60.4 %) and the Former Yugoslav
Republic of Macedonia (52.0 %), far exceeding the EU Member
States’ average.
The most common household type in the EU-27 in 2011 was the
single person living alone (31.4%). Concerning households with
more than one adult, the most common household type was a ‘two
adults’ household without dependent children – these made up
24.7% of total private households. The next most common house-
hold type was a ‘two adults’ household with dependent children,
of which there were 44 million in 2011 (i.e. 21.0 % of all private
households).
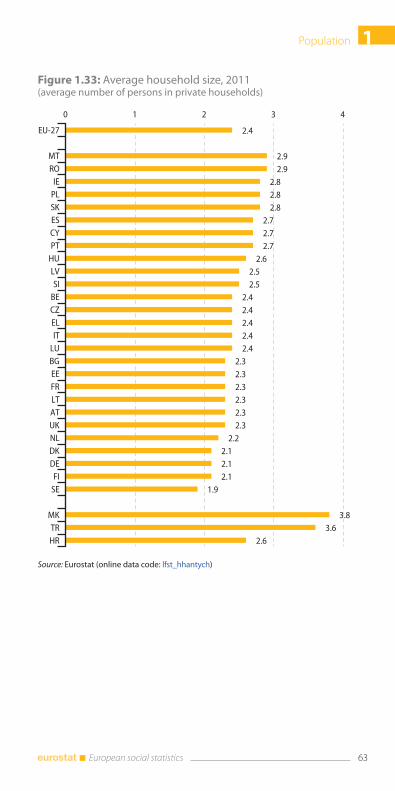
1Population
63 European social statistics
Figure 1.33: Average household size, 2011 (average number of persons in private households)
2.4
2.92.9
2.82.82.8
2.72.72.7
2.62.52.5
2.42.42.42.42.4
2.32.32.32.32.32.3
2.22.12.12.1
1.9
3.83.6
2.6
0 1 2 3 4
EU-27
MTRO
IEPLSKESCYPT
HULVSI
BECZELIT
LUBGEEFRLTATUKNLDKDEFI
SE
MKTRHR
Source: Eurostat (online data code: lfst_hhantych)
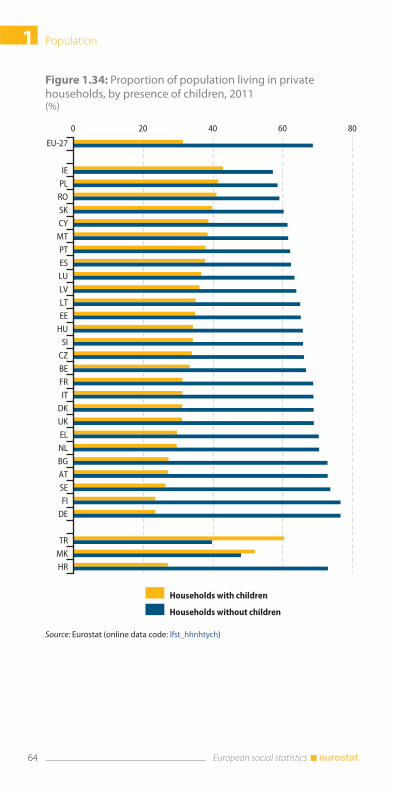
Population1
64 European social statistics
Figure 1.34: Proportion of population living in private households, by presence of children, 2011(%)
0 20 40 60 80
EU-27
IE
PL
RO
SK
CY
MT
PT
ES
LU
LV
LT
EE
HU
SI
CZ
BE
FR
IT
DK
UK
EL
NL
BG
AT
SE
FI
DE
TR
MK
HR
Households with children
Households without children
Source: Eurostat (online data code: lfst_hhnhtych)
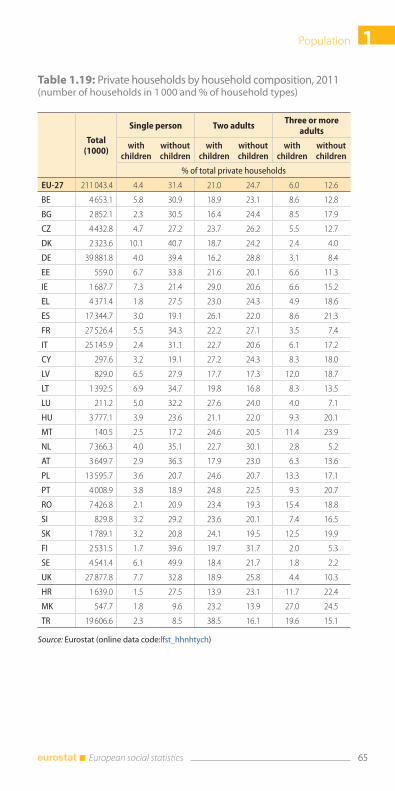
1Population
65 European social statistics
Table 1.19: Private households by household composition, 2011(number of households in 1 000 and % of household types)
Total (1000)
Single person Two adultsThree or more
adults
with children
without children
with children
without children
with children
without children
% of total private households
EU-27 211 043.4 4.4 31.4 21.0 24.7 6.0 12.6
BE 4 653.1 5.8 30.9 18.9 23.1 8.6 12.8
BG 2 852.1 2.3 30.5 16.4 24.4 8.5 17.9
CZ 4 432.8 4.7 27.2 23.7 26.2 5.5 12.7
DK 2 323.6 10.1 40.7 18.7 24.2 2.4 4.0
DE 39 881.8 4.0 39.4 16.2 28.8 3.1 8.4
EE 559.0 6.7 33.8 21.6 20.1 6.6 11.3
IE 1 687.7 7.3 21.4 29.0 20.6 6.6 15.2
EL 4 371.4 1.8 27.5 23.0 24.3 4.9 18.6
ES 17 344.7 3.0 19.1 26.1 22.0 8.6 21.3
FR 27 526.4 5.5 34.3 22.2 27.1 3.5 7.4
IT 25 145.9 2.4 31.1 22.7 20.6 6.1 17.2
CY 297.6 3.2 19.1 27.2 24.3 8.3 18.0
LV 829.0 6.5 27.9 17.7 17.3 12.0 18.7
LT 1 392.5 6.9 34.7 19.8 16.8 8.3 13.5
LU 211.2 5.0 32.2 27.6 24.0 4.0 7.1
HU 3 777.1 3.9 23.6 21.1 22.0 9.3 20.1
MT 140.5 2.5 17.2 24.6 20.5 11.4 23.9
NL 7 366.3 4.0 35.1 22.7 30.1 2.8 5.2
AT 3 649.7 2.9 36.3 17.9 23.0 6.3 13.6
PL 13 595.7 3.6 20.7 24.6 20.7 13.3 17.1
PT 4 008.9 3.8 18.9 24.8 22.5 9.3 20.7
RO 7 426.8 2.1 20.9 23.4 19.3 15.4 18.8
SI 829.8 3.2 29.2 23.6 20.1 7.4 16.5
SK 1 789.1 3.2 20.8 24.1 19.5 12.5 19.9
FI 2 531.5 1.7 39.6 19.7 31.7 2.0 5.3
SE 4 541.4 6.1 49.9 18.4 21.7 1.8 2.2
UK 27 877.8 7.7 32.8 18.9 25.8 4.4 10.3
HR 1 639.0 1.5 27.5 13.9 23.1 11.7 22.4
MK 547.7 1.8 9.6 23.2 13.9 27.0 24.5
TR 19 606.6 2.3 8.5 38.5 16.1 19.6 15.1
Source: Eurostat (online data code:lfst_hhnhtych)

2Health and safety
Health is a high priority for Europeans, who expect to have a long
and healthy life, to be protected against illnesses and accidents and
to receive appropriate health care. Health is a value in itself. It is
also a precondition for economic prosperity. People’s health influ-
ences economic outcomes in terms of productivity, labour supply,
human capital and public spending. Investing in health contribu-
tes to the Europe 2020 objective of smart, sustainable and inclusive
growth. (2)
Accurate and detailed statistics on health have a key role for evi-
dence based decisions by national and European authorities and
are a major tool for monitoring health policies.
This chapter presents a wide range of health statistics:
public health issues such as health status, health problems and
health determinants, health care provision and resources, health
care expenditures and causes of death. There are several sources
for these statistics, including the annual EU statistics on income
and social conditions, the five-yearly European health interview
survey, administrative data sources in the EU Member States, as
well as the System of Health Accounts;
health and safety at work issues such as accidents at work and
work-related health problems. Statistics on accidents at work
are reported from administrative data sources in the EU Member
States, and work-related health problems from surveys.
(2) Commission Staff Working document on Investing in Health, SWD(2013) 43 final, Brussels, 20.02.2013
Health and safety2
68 European social statistics
Healthy life years
In a context of increasing life expectancy and population ageing,
healthy life years has been endorsed as an important European
policy indicator to address whether years of longer life are lived in
good health. It is a measure of disability-free life expectancy which
indicates how long people can expect to live without limitations in
the activities people usually do.
In 2011 the number of healthy life years at birth was estimated at
61.8 years for men and 62.2 years for women in the EU-27. This
represented approximately 80 % and 75 % of total life expectancy
for men and women.
Life expectancy for women in the EU-27 was, on average, 5.7 years
longer than that for men in 2011. However, most of these addi-
tional years tend to be lived with activity limitations. Indeed, the
gender gap was considerably smaller in terms of healthy life years
than it was for overall life expectancy – at just 0.4 years difference
in favour of women in 2011. Men therefore tend to spend a greater
proportion of their somewhat shorter lives free from activity limi-
tations. In 18 EU Member States the healthy life years expectancy
is higher for women than for men (differences from 0.1 to 5 years).
Furthermore, an analysis of the period 2008 to 2011 shows that the
gap between the sexes is becoming smaller, as the disability-free
measure of healthy life years in the EU-27 increased slightly more
for men than for women.
Across the EU Member States, life expectancy at birth for men
in 2011 ranged between 68.1 years in Lithuania and 79.9 years
in Sweden; a difference of 11.8 years. A similar comparison for
women shows that the lowest level of life expectancy in 2011
was recorded in Bulgaria (77.8 years) and the highest in France
(both 85.7 years); a range of 7.9 years. The corresponding range
for healthy life years at birth for men was between 52.1 years in
Slovakia and 71.1 years in Sweden (19 years difference), while that
for women was from 52.3 years in Slovakia to 70.7 years in Malta
(18.4 years).
As such, it is clear that there are considerably wider differences
between EU Member States in terms of the quality of life (health
wise) that their respective populations may expect to live, when
compared with the overall differences in the length of their lives.
Men born in Slovenia in 2011 could expect to live 70.3 % of their
lives free from any activity limitation, a share that rose to as high
as 89.4 % in Malta. A woman born in 2011 in Slovenia could
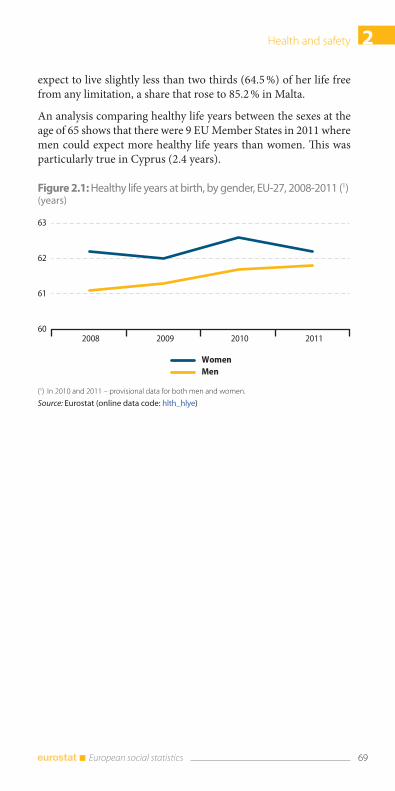
2Health and safety
69 European social statistics
expect to live slightly less than two thirds (64.5 %) of her life free
from any limitation, a share that rose to 85.2 % in Malta.
An analysis comparing healthy life years between the sexes at the
age of 65 shows that there were 9 EU Member States in 2011 where
men could expect more healthy life years than women. This was
particularly true in Cyprus (2.4 years).
Figure 2.1: Healthy life years at birth, by gender, EU-27, 2008-2011 (1)(years)
60
61
62
63
2008 2009 2010 2011
Men
Women
(1) In 2010 and 2011 – provisional data for both men and women.
Source: Eurostat (online data code: hlth_hlye)
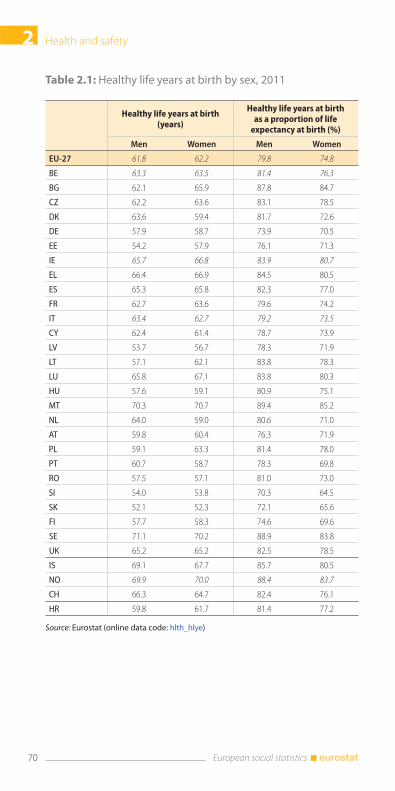
Health and safety2
70 European social statistics
Table 2.1: Healthy life years at birth by sex, 2011
Healthy life years at birth (years)
Healthy life years at birth as a proportion of life
expectancy at birth (%)
Men Women Men Women
EU-27 61.8 62.2 79.8 74.8
BE 63.3 63.5 81.4 76.3
BG 62.1 65.9 87.8 84.7
CZ 62.2 63.6 83.1 78.5
DK 63.6 59.4 81.7 72.6
DE 57.9 58.7 73.9 70.5
EE 54.2 57.9 76.1 71.3
IE 65.7 66.8 83.9 80.7
EL 66.4 66.9 84.5 80.5
ES 65.3 65.8 82.3 77.0
FR 62.7 63.6 79.6 74.2
IT 63.4 62.7 79.2 73.5
CY 62.4 61.4 78.7 73.9
LV 53.7 56.7 78.3 71.9
LT 57.1 62.1 83.8 78.3
LU 65.8 67.1 83.8 80.3
HU 57.6 59.1 80.9 75.1
MT 70.3 70.7 89.4 85.2
NL 64.0 59.0 80.6 71.0
AT 59.8 60.4 76.3 71.9
PL 59.1 63.3 81.4 78.0
PT 60.7 58.7 78.3 69.8
RO 57.5 57.1 81.0 73.0
SI 54.0 53.8 70.3 64.5
SK 52.1 52.3 72.1 65.6
FI 57.7 58.3 74.6 69.6
SE 71.1 70.2 88.9 83.8
UK 65.2 65.2 82.5 78.5
IS 69.1 67.7 85.7 80.5
NO 69.9 70.0 88.4 83.7
CH 66.3 64.7 82.4 76.1
HR 59.8 61.7 81.4 77.2
Source: Eurostat (online data code: hlth_hlye)
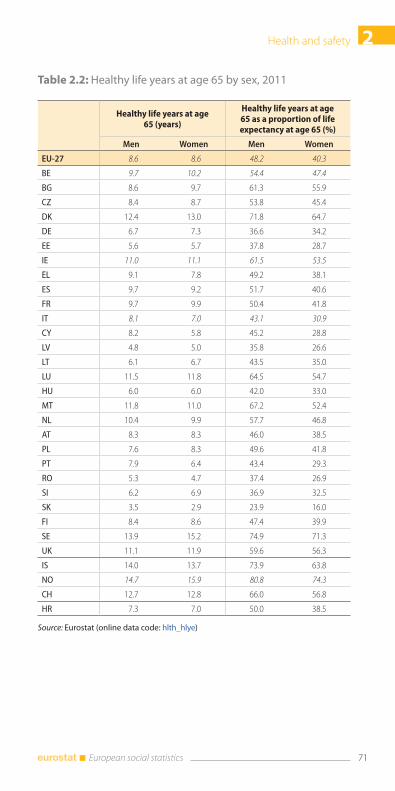
2Health and safety
71 European social statistics
Table 2.2: Healthy life years at age 65 by sex, 2011
Healthy life years at age 65 (years)
Healthy life years at age 65 as a proportion of life expectancy at age 65 (%)
Men Women Men Women
EU-27 8.6 8.6 48.2 40.3
BE 9.7 10.2 54.4 47.4
BG 8.6 9.7 61.3 55.9
CZ 8.4 8.7 53.8 45.4
DK 12.4 13.0 71.8 64.7
DE 6.7 7.3 36.6 34.2
EE 5.6 5.7 37.8 28.7
IE 11.0 11.1 61.5 53.5
EL 9.1 7.8 49.2 38.1
ES 9.7 9.2 51.7 40.6
FR 9.7 9.9 50.4 41.8
IT 8.1 7.0 43.1 30.9
CY 8.2 5.8 45.2 28.8
LV 4.8 5.0 35.8 26.6
LT 6.1 6.7 43.5 35.0
LU 11.5 11.8 64.5 54.7
HU 6.0 6.0 42.0 33.0
MT 11.8 11.0 67.2 52.4
NL 10.4 9.9 57.7 46.8
AT 8.3 8.3 46.0 38.5
PL 7.6 8.3 49.6 41.8
PT 7.9 6.4 43.4 29.3
RO 5.3 4.7 37.4 26.9
SI 6.2 6.9 36.9 32.5
SK 3.5 2.9 23.9 16.0
FI 8.4 8.6 47.4 39.9
SE 13.9 15.2 74.9 71.3
UK 11.1 11.9 59.6 56.3
IS 14.0 13.7 73.9 63.8
NO 14.7 15.9 80.8 74.3
CH 12.7 12.8 66.0 56.8
HR 7.3 7.0 50.0 38.5
Source: Eurostat (online data code: hlth_hlye)
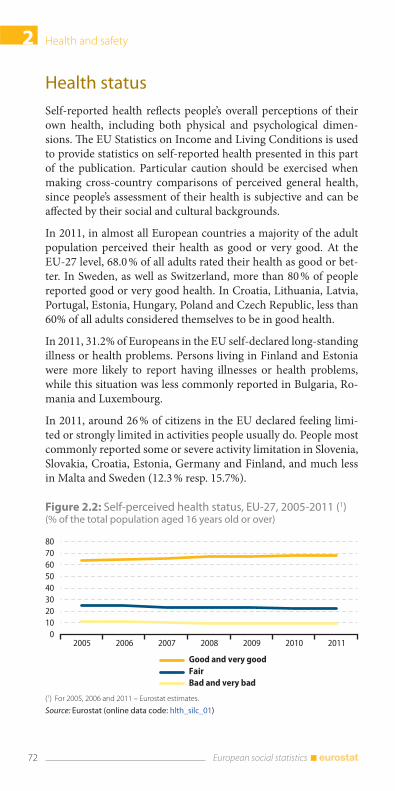
Health and safety2
72 European social statistics
Health status
Self-reported health reflects people’s overall perceptions of their
own health, including both physical and psychological dimen-
sions. The EU Statistics on Income and Living Conditions is used
to provide statistics on self-reported health presented in this part
of the publication. Particular caution should be exercised when
making cross-country comparisons of perceived general health,
since people’s assessment of their health is subjective and can be
affected by their social and cultural backgrounds.
In 2011, in almost all European countries a majority of the adult
population perceived their health as good or very good. At the
EU-27 level, 68.0 % of all adults rated their health as good or bet-
ter. In Sweden, as well as Switzerland, more than 80 % of people
reported good or very good health. In Croatia, Lithuania, Latvia,
Portugal, Estonia, Hungary, Poland and Czech Republic, less than
60% of all adults considered themselves to be in good health.
In 2011, 31.2% of Europeans in the EU self-declared long-standing
illness or health problems. Persons living in Finland and Estonia
were more likely to report having illnesses or health problems,
while this situation was less commonly reported in Bulgaria, Ro-
mania and Luxembourg.
In 2011, around 26 % of citizens in the EU declared feeling limi-
ted or strongly limited in activities people usually do. People most
commonly reported some or severe activity limitation in Slovenia,
Slovakia, Croatia, Estonia, Germany and Finland, and much less
in Malta and Sweden (12.3 % resp. 15.7%).
Figure 2.2: Self-perceived health status, EU-27, 2005-2011 (1)(% of the total population aged 16 years old or over)
01020304050607080
2005 2006 2007 2008 2009 2010 2011
Good and very good
Fair
Bad and very bad
(1) For 2005, 2006 and 2011 – Eurostat estimates.
Source: Eurostat (online data code: hlth_silc_01)
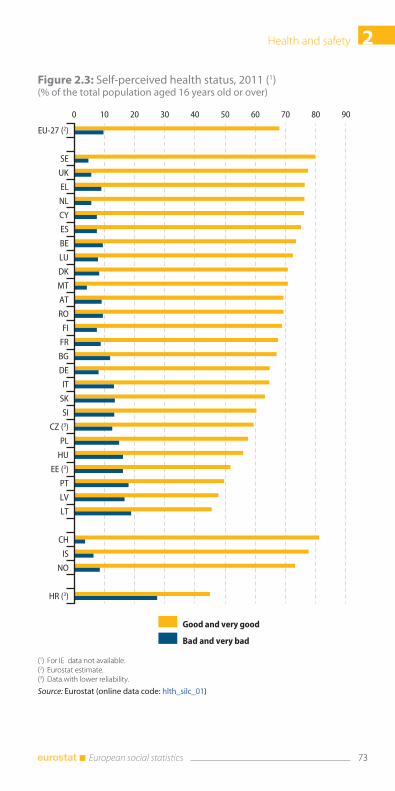
2Health and safety
73 European social statistics
Figure 2.3: Self-perceived health status, 2011 (1)(% of the total population aged 16 years old or over)
0 10 20 30 40 50 60 70 80 90
EU-27 (2)
SE
UK
EL
NL
CY
ES
BE
LU
DK
MT
AT
RO
FI
FR
BG
DE
IT
SK
SI
CZ (3)
PL
HU
EE (3)
PT
LV
LT
CH
IS
NO
HR (3)
Good and very good
Bad and very bad
(1) For IE data not available.(2) Eurostat estimate.(3) Data with lower reliability.
Source: Eurostat (online data code: hlth_silc_01)
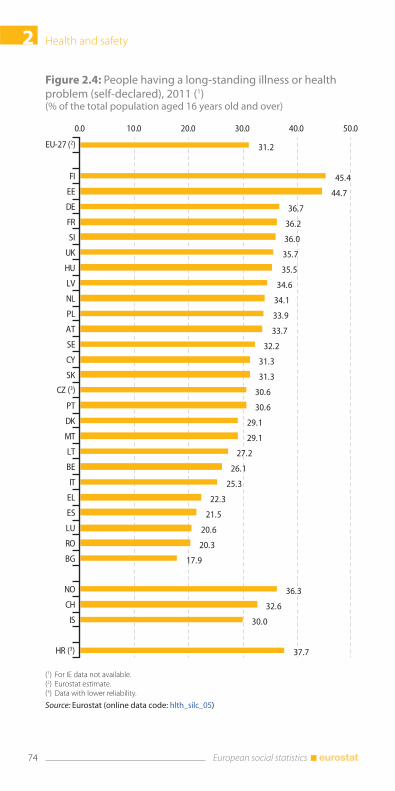
Health and safety2
74 European social statistics
Figure 2.4: People having a long-standing illness or health problem (self-declared), 2011 (1)(% of the total population aged 16 years old and over)
31.2
45.4
44.7
36.7
36.2
36.0
35.7
35.5
34.6
34.1
33.9
33.7
32.2
31.3
31.3
30.6
30.6
29.1
29.1
27.2
26.1
25.3
22.3
21.5
20.6
20.3
17.9
36.3
32.6
30.0
37.7
0.0 10.0 20.0 30.0 40.0 50.0
EU-27 (2)
FI
EE
DE
FR
SI
UK
HU
LV
NL
PL
AT
SE
CY
SK
CZ (3)
PT
DK
MT
LT
BE
IT
EL
ES
LU
RO
BG
NO
CH
IS
HR (3)
(1) For IE data not available.(2) Eurostat estimate.(3) Data with lower reliability.
Source: Eurostat (online data code: hlth_silc_05)
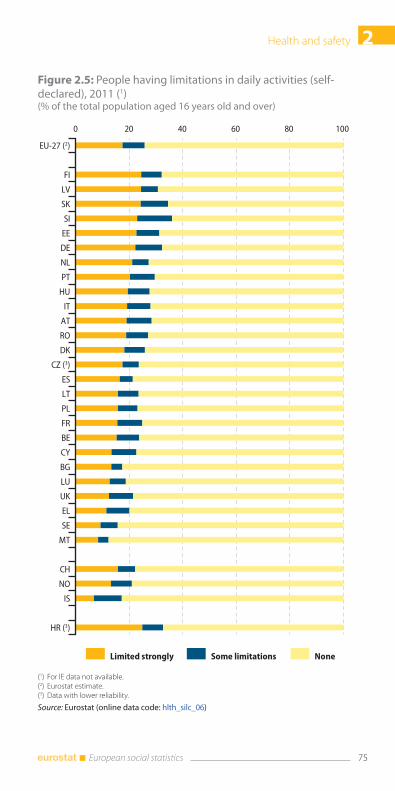
2Health and safety
75 European social statistics
Figure 2.5: People having limitations in daily activities (self-declared), 2011 (1)(% of the total population aged 16 years old and over)
0 20 40 60 80 100
EU-27 (2)
FI
LV
SK
SI
EE
DE
NL
PT
HU
IT
AT
RO
DK
CZ (3)
ES
LT
PL
FR
BE
CY
BG
LU
UK
EL
SE
MT
CH
NO
IS
HR (3)
Limited strongly Some limitations None
(1) For IE data not available.(2) Eurostat estimate.(3) Data with lower reliability.
Source: Eurostat (online data code: hlth_silc_06)
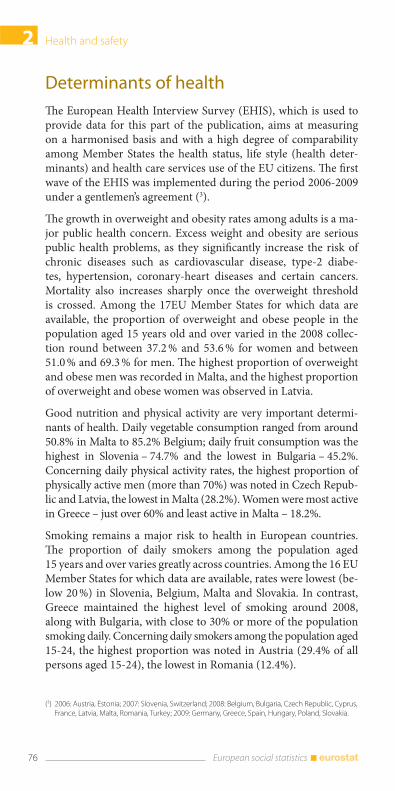
Health and safety2
76 European social statistics
Determinants of health
The European Health Interview Survey (EHIS), which is used to
provide data for this part of the publication, aims at measuring
on a harmonised basis and with a high degree of comparability
among Member States the health status, life style (health deter-
minants) and health care services use of the EU citizens. The first
wave of the EHIS was implemented during the period 2006-2009
under a gentlemen’s agreement (3).
The growth in overweight and obesity rates among adults is a ma-
jor public health concern. Excess weight and obesity are serious
public health problems, as they significantly increase the risk of
chronic diseases such as cardiovascular disease, type-2 diabe-
tes, hypertension, coronary-heart diseases and certain cancers.
Mortality also increases sharply once the overweight threshold
is crossed. Among the 17EU Member States for which data are
available, the proportion of overweight and obese people in the
population aged 15 years old and over varied in the 2008 collec-
tion round between 37.2 % and 53.6 % for women and between
51.0 % and 69.3 % for men. The highest proportion of overweight
and obese men was recorded in Malta, and the highest proportion
of overweight and obese women was observed in Latvia.
Good nutrition and physical activity are very important determi-
nants of health. Daily vegetable consumption ranged from around
50.8% in Malta to 85.2% Belgium; daily fruit consumption was the
highest in Slovenia – 74.7% and the lowest in Bulgaria – 45.2%.
Concerning daily physical activity rates, the highest proportion of
physically active men (more than 70%) was noted in Czech Repub-
lic and Latvia, the lowest in Malta (28.2%). Women were most active
in Greece – just over 60% and least active in Malta – 18.2%.
Smoking remains a major risk to health in European countries.
The proportion of daily smokers among the population aged
15 years and over varies greatly across countries. Among the 16 EU
Member States for which data are available, rates were lowest (be-
low 20 %) in Slovenia, Belgium, Malta and Slovakia. In contrast,
Greece maintained the highest level of smoking around 2008,
along with Bulgaria, with close to 30% or more of the population
smoking daily. Concerning daily smokers among the population aged
15-24, the highest proportion was noted in Austria (29.4% of all
persons aged 15-24), the lowest in Romania (12.4%).
(3) 2006: Austria, Estonia; 2007: Slovenia, Switzerland; 2008: Belgium, Bulgaria, Czech Republic, Cyprus, France, Latvia, Malta, Romania, Turkey; 2009: Germany, Greece, Spain, Hungary, Poland, Slovakia.
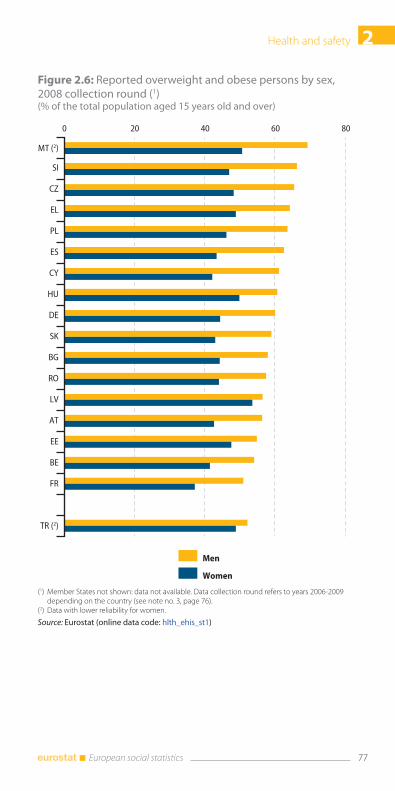
2Health and safety
77 European social statistics
Figure 2.6: Reported overweight and obese persons by sex, 2008 collection round (1)(% of the total population aged 15 years old and over)
0 20 40 60 80
MT (2)
SI
CZ
EL
PL
ES
CY
HU
DE
SK
BG
RO
LV
AT
EE
BE
FR
TR (2)
Men
Women
(1) Member States not shown: data not available. Data collection round refers to years 2006-2009 depending on the country (see note no. 3, page 76).
(2) Data with lower reliability for women.
Source: Eurostat (online data code: hlth_ehis_st1)
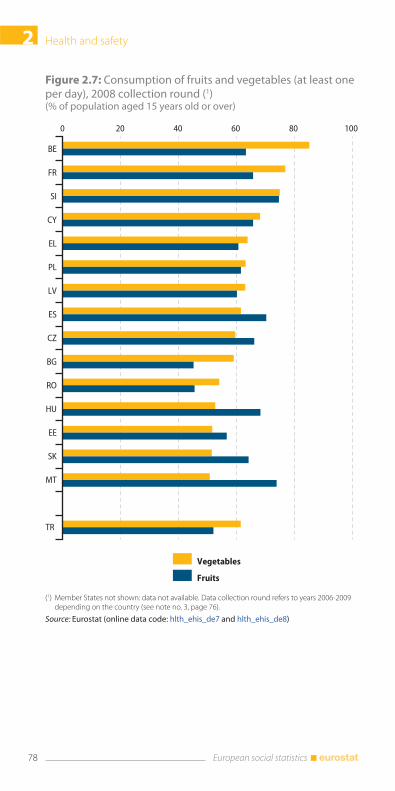
Health and safety2
78 European social statistics
Figure 2.7: Consumption of fruits and vegetables (at least one per day), 2008 collection round (1)(% of population aged 15 years old or over)
0 20 40 60 80 100
BE
FR
SI
CY
EL
PL
LV
ES
CZ
BG
RO
HU
EE
SK
MT
TR
Vegetables
Fruits
(1) Member States not shown: data not available. Data collection round refers to years 2006-2009 depending on the country (see note no. 3, page 76).
Source: Eurostat (online data code: hlth_ehis_de7 and hlth_ehis_de8)
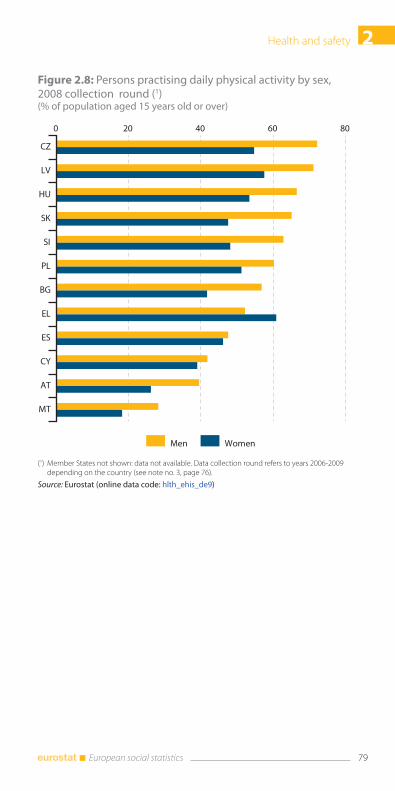
2Health and safety
79 European social statistics
Figure 2.8: Persons practising daily physical activity by sex, 2008 collection round (1)(% of population aged 15 years old or over)
0 20 40 60 80
CZ
LV
HU
SK
SI
PL
BG
EL
ES
CY
AT
MT
Men Women
(1) Member States not shown: data not available. Data collection round refers to years 2006-2009 depending on the country (see note no. 3, page 76).
Source: Eurostat (online data code: hlth_ehis_de9)
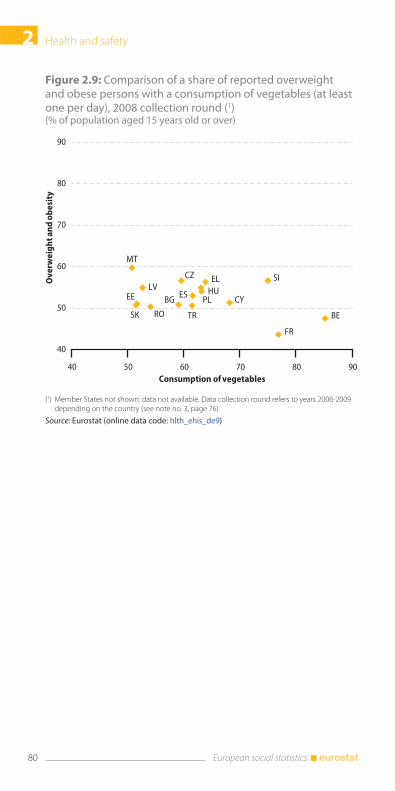
Health and safety2
80 European social statistics
Figure 2.9: Comparison of a share of reported overweight and obese persons with a consumption of vegetables (at least one per day), 2008 collection round (1)(% of population aged 15 years old or over)
BE
BG
CZ
EE
EL
ES
FR
CYHULV
MT
PL
RO
SI
SK TR
40
50
60
70
80
90
40 50 60 70 80 90
Ov
erw
eig
ht
an
d o
be
sity
Consumption of vegetables
(1) Member States not shown: data not available. Data collection round refers to years 2006-2009 depending on the country (see note no. 3, page 76).
Source: Eurostat (online data code: hlth_ehis_de9)
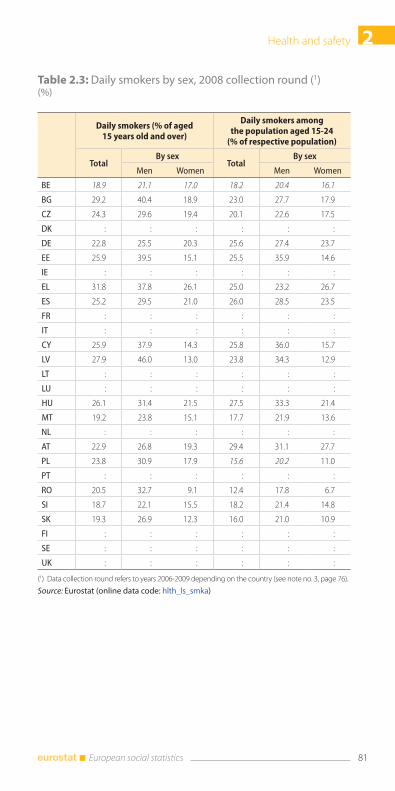
2Health and safety
81 European social statistics
Table 2.3: Daily smokers by sex, 2008 collection round (1)(%)
Daily smokers (% of aged 15 years old and over)
Daily smokers among the population aged 15-24
(% of respective population)
TotalBy sex
TotalBy sex
Men Women Men Women
BE 18.9 21.1 17.0 18.2 20.4 16.1
BG 29.2 40.4 18.9 23.0 27.7 17.9
CZ 24.3 29.6 19.4 20.1 22.6 17.5
DK : : : : : :
DE 22.8 25.5 20.3 25.6 27.4 23.7
EE 25.9 39.5 15.1 25.5 35.9 14.6
IE : : : : : :
EL 31.8 37.8 26.1 25.0 23.2 26.7
ES 25.2 29.5 21.0 26.0 28.5 23.5
FR : : : : : :
IT : : : : : :
CY 25.9 37.9 14.3 25.8 36.0 15.7
LV 27.9 46.0 13.0 23.8 34.3 12.9
LT : : : : : :
LU : : : : : :
HU 26.1 31.4 21.5 27.5 33.3 21.4
MT 19.2 23.8 15.1 17.7 21.9 13.6
NL : : : : : :
AT 22.9 26.8 19.3 29.4 31.1 27.7
PL 23.8 30.9 17.9 15.6 20.2 11.0
PT : : : : : :
RO 20.5 32.7 9.1 12.4 17.8 6.7
SI 18.7 22.1 15.5 18.2 21.4 14.8
SK 19.3 26.9 12.3 16.0 21.0 10.9
FI : : : : : :
SE : : : : : :
UK : : : : : :
(1) Data collection round refers to years 2006-2009 depending on the country (see note no. 3, page 76).
Source: Eurostat (online data code: hlth_ls_smka)
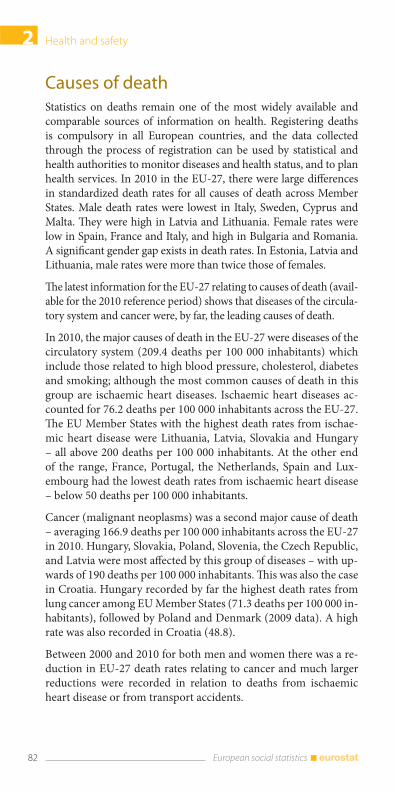
Health and safety2
82 European social statistics
Causes of deathStatistics on deaths remain one of the most widely available and
comparable sources of information on health. Registering deaths
is compulsory in all European countries, and the data collected
through the process of registration can be used by statistical and
health authorities to monitor diseases and health status, and to plan
health services. In 2010 in the EU-27, there were large differences
in standardized death rates for all causes of death across Member
States. Male death rates were lowest in Italy, Sweden, Cyprus and
Malta. They were high in Latvia and Lithuania. Female rates were
low in Spain, France and Italy, and high in Bulgaria and Romania.
A significant gender gap exists in death rates. In Estonia, Latvia and
Lithuania, male rates were more than twice those of females.
The latest information for the EU-27 relating to causes of death (avail-
able for the 2010 reference period) shows that diseases of the circula-
tory system and cancer were, by far, the leading causes of death.
In 2010, the major causes of death in the EU-27 were diseases of the
circulatory system (209.4 deaths per 100 000 inhabitants) which
include those related to high blood pressure, cholesterol, diabetes
and smoking; although the most common causes of death in this
group are ischaemic heart diseases. Ischaemic heart diseases ac-
counted for 76.2 deaths per 100 000 inhabitants across the EU-27.
The EU Member States with the highest death rates from ischae-
mic heart disease were Lithuania, Latvia, Slovakia and Hungary
– all above 200 deaths per 100 000 inhabitants. At the other end
of the range, France, Portugal, the Netherlands, Spain and Lux-
embourg had the lowest death rates from ischaemic heart disease
– below 50 deaths per 100 000 inhabitants.
Cancer (malignant neoplasms) was a second major cause of death
– averaging 166.9 deaths per 100 000 inhabitants across the EU-27
in 2010. Hungary, Slovakia, Poland, Slovenia, the Czech Republic,
and Latvia were most affected by this group of diseases – with up-
wards of 190 deaths per 100 000 inhabitants. This was also the case
in Croatia. Hungary recorded by far the highest death rates from
lung cancer among EU Member States (71.3 deaths per 100 000 in-
habitants), followed by Poland and Denmark (2009 data). A high
rate was also recorded in Croatia (48.8).
Between 2000 and 2010 for both men and women there was a re-
duction in EU-27 death rates relating to cancer and much larger
reductions were recorded in relation to deaths from ischaemic
heart disease or from transport accidents.
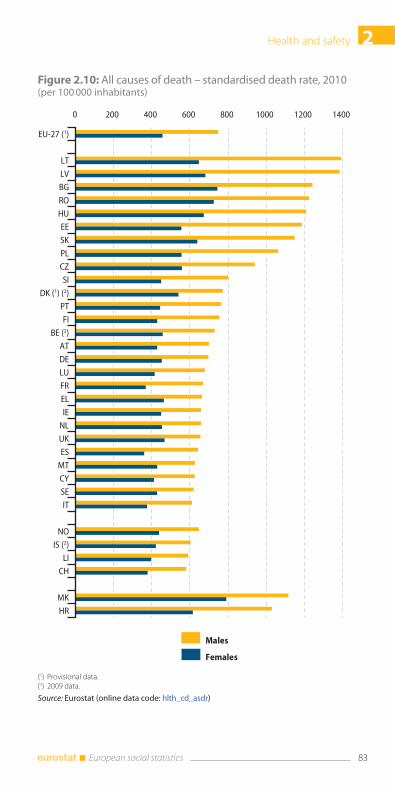
2Health and safety
83 European social statistics
Figure 2.10: All causes of death – standardised death rate, 2010(per 100 000 inhabitants)
0 200 400 600 800 1000 1200 1400
EU-27 (1)
LT
LV
BG
RO
HU
EE
SK
PL
CZ
SI
DK (1) (2)
PT
FI
BE (2)
AT
DE
LU
FR
EL
IE
NL
UK
ES
MT
CY
SE
IT
NO
IS (2)
LI
CH
MK
HR
Males
Females
(1) Provisional data.(2) 2009 data.
Source: Eurostat (online data code: hlth_cd_asdr)
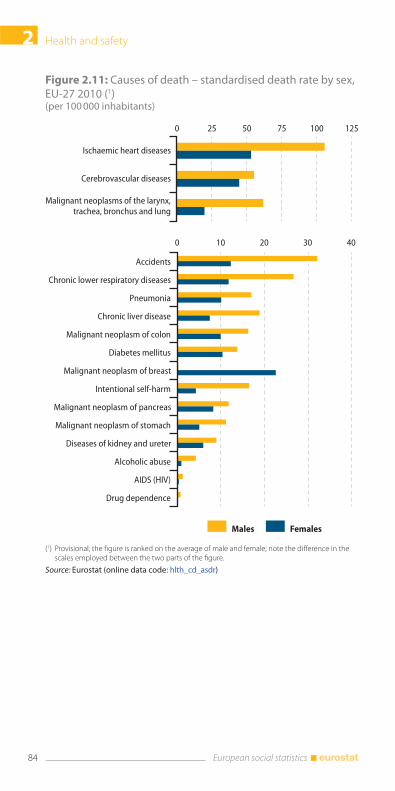
Health and safety2
84 European social statistics
Figure 2.11: Causes of death – standardised death rate by sex, EU-27 2010 (1)(per 100 000 inhabitants)
0 25 50 75 100 125
Ischaemic heart diseases
Cerebrovascular diseases
Malignant neoplasms of the larynx,trachea, bronchus and lung
0 10 20 30 40
Accidents
Chronic lower respiratory diseases
Pneumonia
Chronic liver disease
Malignant neoplasm of colon
Diabetes mellitus
Malignant neoplasm of breast
Intentional self-harm
Malignant neoplasm of pancreas
Malignant neoplasm of stomach
Diseases of kidney and ureter
Alcoholic abuse
AIDS (HIV)
Drug dependence
Males Females
(1) Provisional; the figure is ranked on the average of male and female; note the difference in the scales employed between the two parts of the figure.
Source: Eurostat (online data code: hlth_cd_asdr)
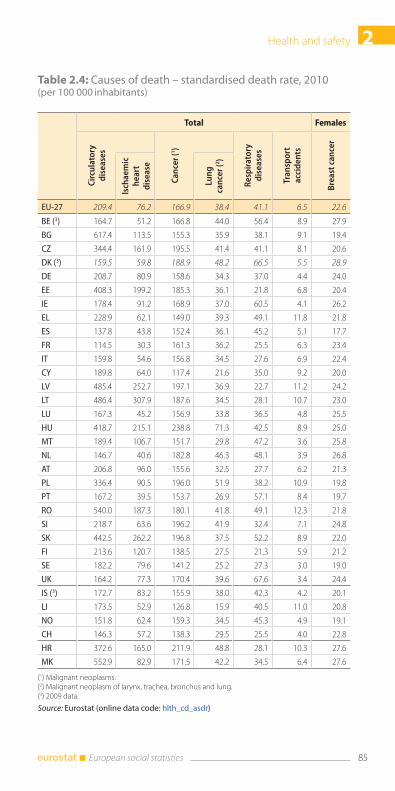
2Health and safety
85 European social statistics
Table 2.4: Causes of death – standardised death rate, 2010(per 100 000 inhabitants)
Total Females
Cir
cula
tory
d
isea
ses
Can
cer
(1)
Res
pir
ato
ry
dis
ease
s
Tran
spo
rt
acci
den
ts
Bre
ast
can
cer
Isch
aem
ic
hea
rt
dis
ease
Lun
g
can
cer
(2)
EU-27 209.4 76.2 166.9 38.4 41.1 6.5 22.6
BE (3) 164.7 51.2 166.8 44.0 56.4 8.9 27.9
BG 617.4 113.5 155.3 35.9 38.1 9.1 19.4
CZ 344.4 161.9 195.5 41.4 41.1 8.1 20.6
DK (3) 159.5 59.8 188.9 48.2 66.5 5.5 28.9
DE 208.7 80.9 158.6 34.3 37.0 4.4 24.0
EE 408.3 199.2 185.3 36.1 21.8 6.8 20.4
IE 178.4 91.2 168.9 37.0 60.5 4.1 26.2
EL 228.9 62.1 149.0 39.3 49.1 11.8 21.8
ES 137.8 43.8 152.4 36.1 45.2 5.1 17.7
FR 114.5 30.3 161.3 36.2 25.5 6.3 23.4
IT 159.8 54.6 156.8 34.5 27.6 6.9 22.4
CY 189.8 64.0 117.4 21.6 35.0 9.2 20.0
LV 485.4 252.7 197.1 36.9 22.7 11.2 24.2
LT 486.4 307.9 187.6 34.5 28.1 10.7 23.0
LU 167.3 45.2 156.9 33.8 36.5 4.8 25.5
HU 418.7 215.1 238.8 71.3 42.5 8.9 25.0
MT 189.4 106.7 151.7 29.8 47.2 3.6 25.8
NL 146.7 40.6 182.8 46.3 48.1 3.9 26.8
AT 206.8 96.0 155.6 32.5 27.7 6.2 21.3
PL 336.4 90.5 196.0 51.9 38.2 10.9 19.8
PT 167.2 39.5 153.7 26.9 57.1 8.4 19.7
RO 540.0 187.3 180.1 41.8 49.1 12.3 21.8
SI 218.7 63.6 196.2 41.9 32.4 7.1 24.8
SK 442.5 262.2 196.8 37.5 52.2 8.9 22.0
FI 213.6 120.7 138.5 27.5 21.3 5.9 21.2
SE 182.2 79.6 141.2 25.2 27.3 3.0 19.0
UK 164.2 77.3 170.4 39.6 67.6 3.4 24.4
IS (3) 172.7 83.2 155.9 38.0 42.3 4.2 20.1
LI 173.5 52.9 126.8 15.9 40.5 11.0 20.8
NO 151.8 62.4 159.3 34.5 45.3 4.9 19.1
CH 146.3 57.2 138.3 29.5 25.5 4.0 22.8
HR 372.6 165.0 211.9 48.8 28.1 10.3 27.6
MK 552.9 82.9 171.5 42.2 34.5 6.4 27.6
(1) Malignant neoplasms.(2) Malignant neoplasm of larynx, trachea, bronchus and lung.(3) 2009 data.
Source: Eurostat (online data code: hlth_cd_asdr)
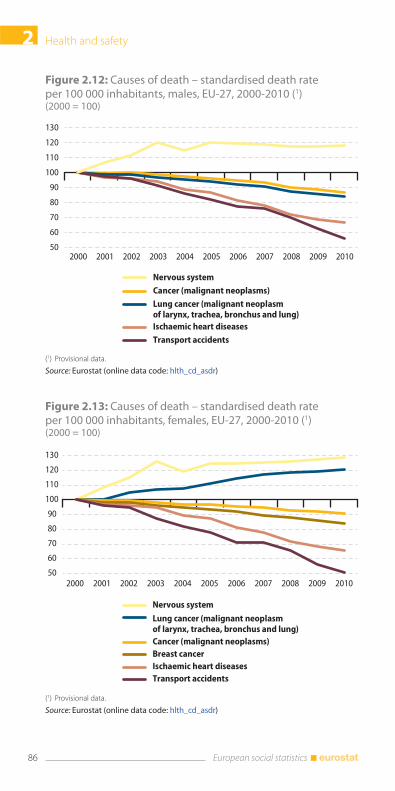
Health and safety2
86 European social statistics
Figure 2.12: Causes of death – standardised death rate per 100 000 inhabitants, males, EU-27, 2000-2010 (1)(2000 = 100)
50
60
70
80
90
100
110
120
130
2000 2001 2002 2003 2004 2005 2006 2007 2008 2009 2010
Nervous system
Cancer (malignant neoplasms)
Lung cancer (malignant neoplasm of larynx, trachea, bronchus and lung)
Ischaemic heart diseases
Transport accidents
(1) Provisional data.
Source: Eurostat (online data code: hlth_cd_asdr)
Figure 2.13: Causes of death – standardised death rate per 100 000 inhabitants, females, EU-27, 2000-2010 (1)(2000 = 100)
50
60
70
80
90
100
110
120
130
2000 2001 2002 2003 2004 2005 2006 2007 2008 2009 2010
Nervous system
Lung cancer (malignant neoplasm of larynx, trachea, bronchus and lung)
Cancer (malignant neoplasms)
Breast cancer
Ischaemic heart diseases
Transport accidents
(1) Provisional data.
Source: Eurostat (online data code: hlth_cd_asdr)
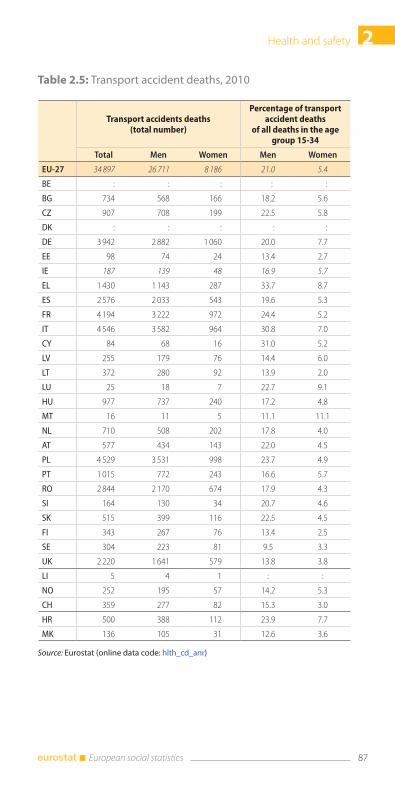
2Health and safety
87 European social statistics
Table 2.5: Transport accident deaths, 2010
Transport accidents deaths (total number)
Percentage of transport accident deaths
of all deaths in the age group 15-34
Total Men Women Men Women
EU-27 34 897 26 711 8 186 21.0 5.4
BE : : : : :
BG 734 568 166 18.2 5.6
CZ 907 708 199 22.5 5.8
DK : : : : :
DE 3 942 2 882 1 060 20.0 7.7
EE 98 74 24 13.4 2.7
IE 187 139 48 16.9 5.7
EL 1 430 1 143 287 33.7 8.7
ES 2 576 2 033 543 19.6 5.3
FR 4 194 3 222 972 24.4 5.2
IT 4 546 3 582 964 30.8 7.0
CY 84 68 16 31.0 5.2
LV 255 179 76 14.4 6.0
LT 372 280 92 13.9 2.0
LU 25 18 7 22.7 9.1
HU 977 737 240 17.2 4.8
MT 16 11 5 11.1 11.1
NL 710 508 202 17.8 4.0
AT 577 434 143 22.0 4.5
PL 4 529 3 531 998 23.7 4.9
PT 1 015 772 243 16.6 5.7
RO 2 844 2 170 674 17.9 4.3
SI 164 130 34 20.7 4.6
SK 515 399 116 22.5 4.5
FI 343 267 76 13.4 2.5
SE 304 223 81 9.5 3.3
UK 2 220 1 641 579 13.8 3.8
LI 5 4 1 : :
NO 252 195 57 14.2 5.3
CH 359 277 82 15.3 3.0
HR 500 388 112 23.9 7.7
MK 136 105 31 12.6 3.6
Source: Eurostat (online data code: hlth_cd_anr)
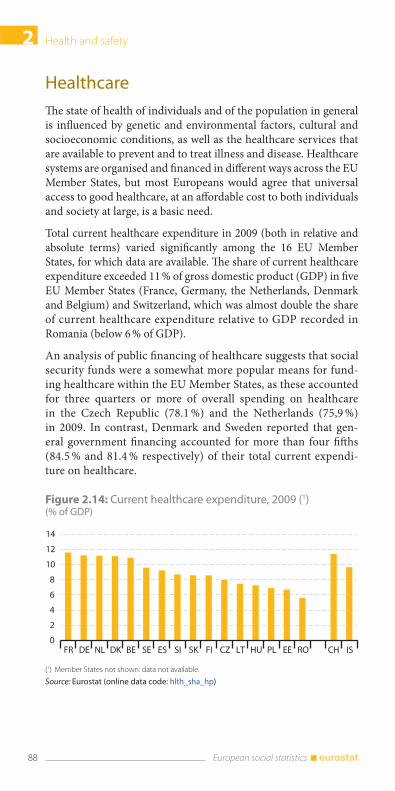
Health and safety2
88 European social statistics
Healthcare
The state of health of individuals and of the population in general
is influenced by genetic and environmental factors, cultural and
socioeconomic conditions, as well as the healthcare services that
are available to prevent and to treat illness and disease. Healthcare
systems are organised and financed in different ways across the EU
Member States, but most Europeans would agree that universal
access to good healthcare, at an affordable cost to both individuals
and society at large, is a basic need.
Total current healthcare expenditure in 2009 (both in relative and
absolute terms) varied significantly among the 16 EU Member
States, for which data are available. The share of current healthcare
expenditure exceeded 11 % of gross domestic product (GDP) in five
EU Member States (France, Germany, the Netherlands, Denmark
and Belgium) and Switzerland, which was almost double the share
of current healthcare expenditure relative to GDP recorded in
Romania (below 6 % of GDP).
An analysis of public financing of healthcare suggests that social
security funds were a somewhat more popular means for fund-
ing healthcare within the EU Member States, as these accounted
for three quarters or more of overall spending on healthcare
in the Czech Republic (78.1 %) and the Netherlands (75,9 %)
in 2009. In contrast, Denmark and Sweden reported that gen-
eral government financing accounted for more than four fifths
(84.5 % and 81.4 % respectively) of their total current expendi-
ture on healthcare.
Figure 2.14: Current healthcare expenditure, 2009 (1)(% of GDP)
0
2
4
6
8
10
12
14
FR DE NL DK BE SE ES SI SK FI CZ LT HU PL EE RO CH IS
(1) Member States not shown: data not available.
Source: Eurostat (online data code: hlth_sha_hp)
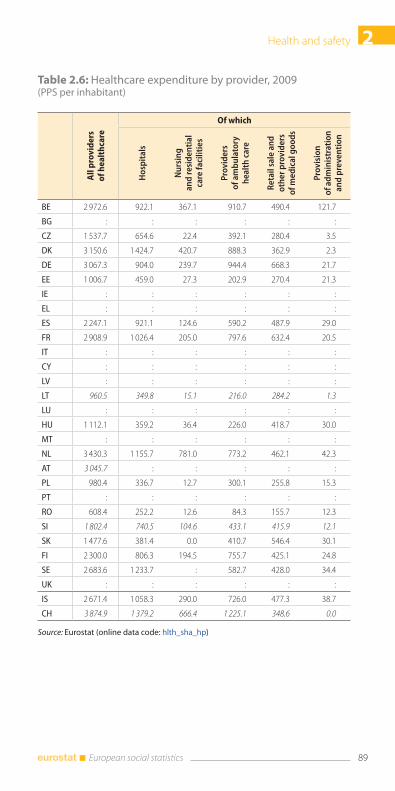
2Health and safety
89 European social statistics
Table 2.6: Healthcare expenditure by provider, 2009 (PPS per inhabitant)
All
pro
vid
ers
o
f h
ea
lth
care
Of which
Ho
spit
als
Nu
rsin
g
and
res
iden
tial
ca
re f
acil
itie
s
Pro
vid
ers
o
f am
bu
lato
ry
hea
lth
car
e
Ret
ail s
ale
and
o
ther
pro
vid
ers
o
f m
edic
al g
oo
ds
Pro
visi
on
o
f ad
min
istr
atio
n
and
pre
ven
tio
n
BE 2 972.6 922.1 367.1 910.7 490.4 121.7
BG : : : : : :
CZ 1 537.7 654.6 22.4 392.1 280.4 3.5
DK 3 150.6 1 424.7 420.7 888.3 362.9 2.3
DE 3 067.3 904.0 239.7 944.4 668.3 21.7
EE 1 006.7 459.0 27.3 202.9 270.4 21.3
IE : : : : : :
EL : : : : : :
ES 2 247.1 921.1 124.6 590.2 487.9 29.0
FR 2 908.9 1 026.4 205.0 797.6 632.4 20.5
IT : : : : : :
CY : : : : : :
LV : : : : : :
LT 960.5 349.8 15.1 216.0 284.2 1.3
LU : : : : : :
HU 1 112.1 359.2 36.4 226.0 418.7 30.0
MT : : : : : :
NL 3 430.3 1 155.7 781.0 773.2 462.1 42.3
AT 3 045.7 : : : : :
PL 980.4 336.7 12.7 300.1 255.8 15.3
PT : : : : : :
RO 608.4 252.2 12.6 84.3 155.7 12.3
SI 1 802.4 740.5 104.6 433.1 415.9 12.1
SK 1 477.6 381.4 0.0 410.7 546.4 30.1
FI 2 300.0 806.3 194.5 755.7 425.1 24.8
SE 2 683.6 1 233.7 : 582.7 428.0 34.4
UK : : : : : :
IS 2 671.4 1 058.3 290.0 726.0 477.3 38.7
CH 3 874.9 1 379.2 666.4 1 225.1 348.6 0.0
Source: Eurostat (online data code: hlth_sha_hp)
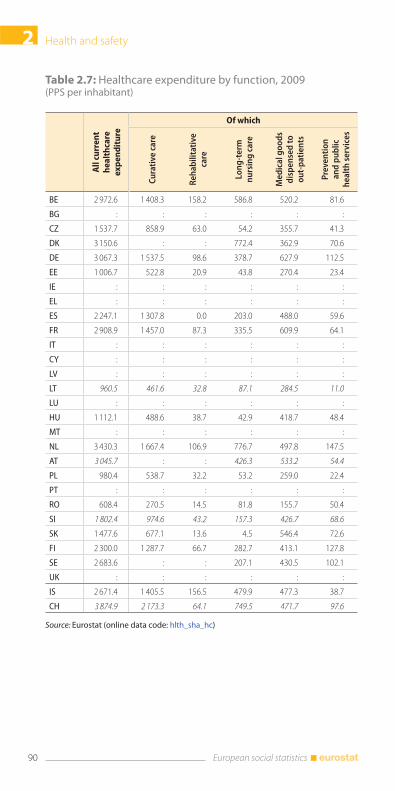
Health and safety2
90 European social statistics
Table 2.7: Healthcare expenditure by function, 2009(PPS per inhabitant)
All
cu
rre
nt
h
ea
lth
care
e
xp
en
dit
ure
Of which
Cu
rati
ve c
are
Reh
abil
itat
ive
care
Lon
g-t
erm
n
urs
ing
car
e
Med
ical
go
od
s d
isp
ense
d t
o
ou
t-p
atie
nts
Pre
ven
tio
n
and
pu
bli
c h
ealt
h s
ervi
ces
BE 2 972.6 1 408.3 158.2 586.8 520.2 81.6
BG : : : : : :
CZ 1 537.7 858.9 63.0 54.2 355.7 41.3
DK 3 150.6 : : 772.4 362.9 70.6
DE 3 067.3 1 537.5 98.6 378.7 627.9 112.5
EE 1 006.7 522.8 20.9 43.8 270.4 23.4
IE : : : : : :
EL : : : : : :
ES 2 247.1 1 307.8 0.0 203.0 488.0 59.6
FR 2 908.9 1 457.0 87.3 335.5 609.9 64.1
IT : : : : : :
CY : : : : : :
LV : : : : : :
LT 960.5 461.6 32.8 87.1 284.5 11.0
LU : : : : : :
HU 1 112.1 488.6 38.7 42.9 418.7 48.4
MT : : : : : :
NL 3 430.3 1 667.4 106.9 776.7 497.8 147.5
AT 3 045.7 : : 426.3 533.2 54.4
PL 980.4 538.7 32.2 53.2 259.0 22.4
PT : : : : : :
RO 608.4 270.5 14.5 81.8 155.7 50.4
SI 1 802.4 974.6 43.2 157.3 426.7 68.6
SK 1 477.6 677.1 13.6 4.5 546.4 72.6
FI 2 300.0 1 287.7 66.7 282.7 413.1 127.8
SE 2 683.6 : : 207.1 430.5 102.1
UK : : : : : :
IS 2 671.4 1 405.5 156.5 479.9 477.3 38.7
CH 3 874.9 2 173.3 64.1 749.5 471.7 97.6
Source: Eurostat (online data code: hlth_sha_hc)
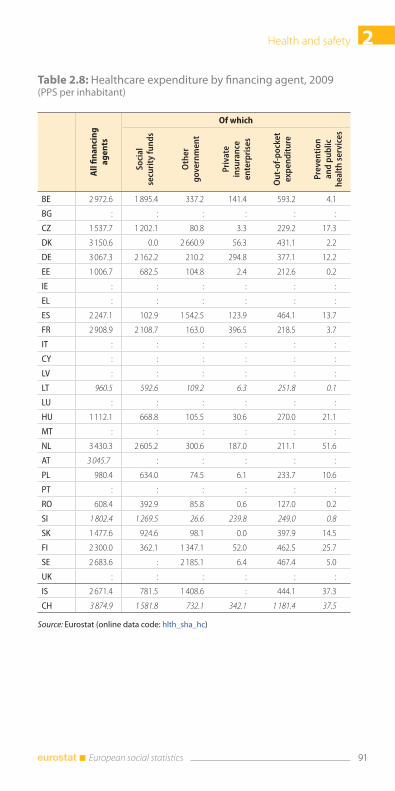
2Health and safety
91 European social statistics
Table 2.8: Healthcare expenditure by financing agent, 2009(PPS per inhabitant)
All
fin
an
cin
g
ag
en
ts
Of which
So
cial
se
curi
ty f
un
ds
Oth
er
go
vern
men
t
Pri
vate
in
sura
nce
en
terp
rise
s
Ou
t-o
f-p
ock
et
exp
end
itu
re
Pre
ven
tio
n
and
pu
bli
c h
ealt
h s
ervi
ces
BE 2 972.6 1 895.4 337.2 141.4 593.2 4.1
BG : : : : : :
CZ 1 537.7 1 202.1 80.8 3.3 229.2 17.3
DK 3 150.6 0.0 2 660.9 56.3 431.1 2.2
DE 3 067.3 2 162.2 210.2 294.8 377.1 12.2
EE 1 006.7 682.5 104.8 2.4 212.6 0.2
IE : : : : : :
EL : : : : : :
ES 2 247.1 102.9 1 542.5 123.9 464.1 13.7
FR 2 908.9 2 108.7 163.0 396.5 218.5 3.7
IT : : : : : :
CY : : : : : :
LV : : : : : :
LT 960.5 592.6 109.2 6.3 251.8 0.1
LU : : : : : :
HU 1 112.1 668.8 105.5 30.6 270.0 21.1
MT : : : : : :
NL 3 430.3 2 605.2 300.6 187.0 211.1 51.6
AT 3 045.7 : : : : :
PL 980.4 634.0 74.5 6.1 233.7 10.6
PT : : : : : :
RO 608.4 392.9 85.8 0.6 127.0 0.2
SI 1 802.4 1 269.5 26.6 239.8 249.0 0.8
SK 1 477.6 924.6 98.1 0.0 397.9 14.5
FI 2 300.0 362.1 1 347.1 52.0 462.5 25.7
SE 2 683.6 : 2 185.1 6.4 467.4 5.0
UK : : : : : :
IS 2 671.4 781.5 1 408.6 : 444.1 37.3
CH 3 874.9 1 581.8 732.1 342.1 1 181.4 37.5
Source: Eurostat (online data code: hlth_sha_hc)
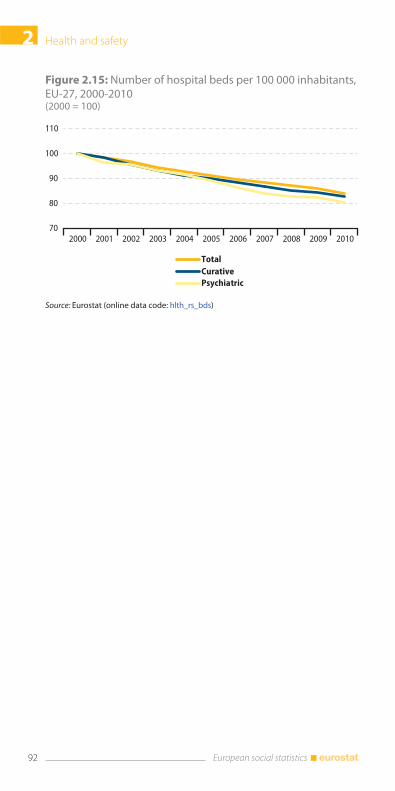
Health and safety2
92 European social statistics
Figure 2.15: Number of hospital beds per 100 000 inhabitants, EU-27, 2000-2010(2000 = 100)
70
80
90
100
110
2000 2001 2002 2003 2004 2005 2006 2007 2008 2009 2010
Total
Curative
Psychiatric
Source: Eurostat (online data code: hlth_rs_bds)
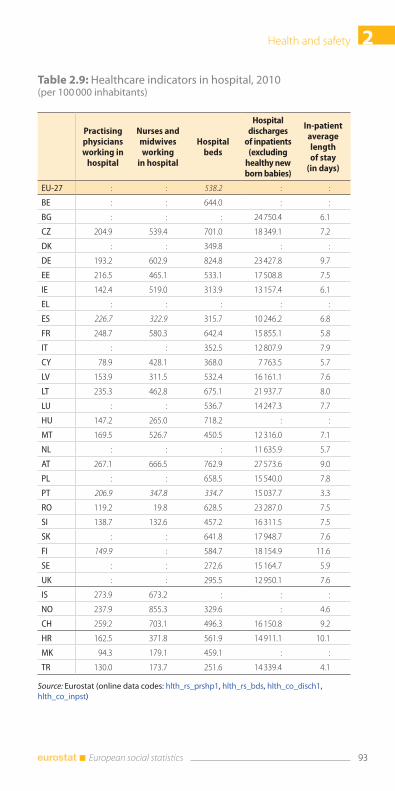
2Health and safety
93 European social statistics
Table 2.9: Healthcare indicators in hospital, 2010 (per 100 000 inhabitants)
Practising physicians working in
hospital
Nurses and midwives working
in hospital
Hospital beds
Hospital discharges
of inpatients (excluding
healthy new born babies)
In-patient average length of stay
(in days)
EU-27 : : 538.2 : :
BE : : 644.0 : :
BG : : : 24 750.4 6.1
CZ 204.9 539.4 701.0 18 349.1 7.2
DK : : 349.8 : :
DE 193.2 602.9 824.8 23 427.8 9.7
EE 216.5 465.1 533.1 17 508.8 7.5
IE 142.4 519.0 313.9 13 157.4 6.1
EL : : : : :
ES 226.7 322.9 315.7 10 246.2 6.8
FR 248.7 580.3 642.4 15 855.1 5.8
IT : : 352.5 12 807.9 7.9
CY 78.9 428.1 368.0 7 763.5 5.7
LV 153.9 311.5 532.4 16 161.1 7.6
LT 235.3 462.8 675.1 21 937.7 8.0
LU : : 536.7 14 247.3 7.7
HU 147.2 265.0 718.2 : :
MT 169.5 526.7 450.5 12 316.0 7.1
NL : : : 11 635.9 5.7
AT 267.1 666.5 762.9 27 573.6 9.0
PL : : 658.5 15 540.0 7.8
PT 206.9 347.8 334.7 15 037.7 3.3
RO 119.2 19.8 628.5 23 287.0 7.5
SI 138.7 132.6 457.2 16 311.5 7.5
SK : : 641.8 17 948.7 7.6
FI 149.9 : 584.7 18 154.9 11.6
SE : : 272.6 15 164.7 5.9
UK : : 295.5 12 950.1 7.6
IS 273.9 673.2 : : :
NO 237.9 855.3 329.6 : 4.6
CH 259.2 703.1 496.3 16 150.8 9.2
HR 162.5 371.8 561.9 14 911.1 10.1
MK 94.3 179.1 459.1 : :
TR 130.0 173.7 251.6 14 339.4 4.1
Source: Eurostat (online data codes: hlth_rs_prshp1, hlth_rs_bds, hlth_co_disch1,
hlth_co_inpst)
Health and safety2
94 European social statistics
Health and safety at work
In 2010, there were just over 3.3 million accidents that resulted in more
than three days of absence from work and an estimated 4 395 fatal
accidents in the EU-27. Men were considerably more likely than
women to have an accident at work. Almost four out of every five
(79.5 %) accidents at work in the EU-27 in 2010 involved men.
The numbers recorded for men remained much higher than those
for women in each of the EU Member States in 2010. In Portu-
gal, Austria and Malta the number of accidents at work for men
was in excess of three times as high as for women. In Denmark,
Sweden, Ireland and the Netherlands, the number of accidents at
work for men was no more than 1.5 times as high as that recorded
for women. The reason the number of accidents is considerably
higher for men is linked to the economic activities they more
frequently work. The number of accidents at work varies consi-
derably depending upon the economic activity in question and is
positively skewed in relation to male-dominated activities.
The highest incidence of fatal accidents at work in 2010 was re-
corded in Cyprus and Austria (4.9 and 4.8 deaths from accidents
at work per 100 000 persons employed respectively). In contrast,
at the other end of the scale, Norway, Denmark, Finland, Sweden,
Germany and the Netherlands recorded the lowest incidence rates,
within the range of 1.7 down to 0.9 fatal accidents at work per
100 000 persons employed.
The promotion of health and safety at work, and the promotion of
more and better jobs are important goals in the European Union.
To achieve these goals, assessment and monitoring is necessary.
This part of the publication presents an overview of the first re-
sults of the European Union Labour Force Survey (LFS) 2007 ad
hoc module on accidents at work, work-related health problems
and exposure to risk factors (4). In the EU-27 (5), 8.1% of workers
experienced a work-related health problem in the 12 months pre-
ceding the interview. 35.6 % of workers were exposed to factors
that could adversely affect physical health; 23.4 % of workers were
exposed to factors that can adversely affect mental well-being.
(4) The module will be repeated in 2013.(5) France not included.
2Health and safety
95 European social statistics
Table 2.10: Number of non-fatal and fatal accidents at work, 2010(persons)
Accidents at work involving more than three days of absence from work
Fatal accidents at work
Total Men Womenabsolut number
per 100 000 persons
employed
EU-27 3 319 478 2 394 242 924 700 4 395 2.1
BE 67 263 49 709 17 534 74 2.3
BG 2 331 1 629 702 92 3.1
CZ 65 109 46 402 18 707 121 2.5
DK 62 523 36 595 25 787 41 1.5
DE 930 447 705 797 224 357 567 1.2
EE 5 556 3 187 2 369 17 3.2
IE 19 294 13 242 5 974 42 2.3
EL : : : : :
ES 493 789 355 435 138 354 338 2.2
FR 358 205 245 994 112 211 550 2.1
IT 437 821 327 813 110 008 718 3.1
CY 2 165 1 644 521 19 4.9
LV 1 195 767 428 25 2.7
LT 2 266 1 479 787 50 4.0
LU 6 983 5 665 1 318 15 3.8
HU 19 989 12 983 7 006 96 2.6
MT 2 751 2 362 389 : :
NL 183 005 120 995 62 010 79 0.9
AT 78 413 61 027 17 386 182 4.8
PL 85 825 59 887 25 938 446 3.7
PT 130 271 102 775 27 497 204 4.1
RO 3 722 2 795 927 381 4.1
SI 16 367 12 330 4 037 24 2.8
SK 9 126 6 266 2 860 48 2.0
FI 48 263 33 624 14 639 37 1.5
SE 34 201 20 254 13 947 54 1.2
UK : : : : :
NO 38 660 23 128 15 533 46 1.7
CH 79 191 63 264 15 927 91 2.1
HR 11 903 8 384 3 519 35 2.4
Source: Eurostat (online data codes: hsw_n2_01 and hsw_n2_02)
Health and safety2
96 European social statistics
Figure 2.16: Fatal accidents at work by economic activity, EU-27, 2010 (1)(per 100 000 persons employed)
10.9
6.6
6.5
5.9
4.5
2.9
2.2
1.8
1.3
0.9
0.9
0.8
0.7
0.7
0.6
0.6
0.5
0.4
0.3
0 2 4 6 8 10 12
Mining and quarrying
Construction
Transportation and storage
Water supply; sewerage, waste management and remediation activities
Agriculture, forestry and fishing
Manufacturing
Real estate activities
Arts, entertainment and recreation
Other service activities
Information and communication
Financial and insurance activities
Education
Electricity, gas, steam andair conditioning supply
Administrative andsupport service activities
Wholesale and retail trade; repairof motor vehicles and motorcyclesPublic administration and defence;
compulsory social security
Professional, scientific andtechnical activities
Accommodation and foodservice activities
Human health and socialwork activities
(1) Eurostat estimates.
Source: Eurostat (online data code: hsw_n2_02)
2Health and safety
97 European social statistics
Table 2.11: Persons reporting one or more work-related health problems in the 12 months preceding the interview by sex, 2007(%)
Total Men Women
EU-27 (1) 8.1 8.1 8.1
BE 11.5 12.6 10.3
BG 4.8 4.5 5.0
CZ 8.5 8.0 8.9
DK 12.9 10.8 15.1
DE 5.2 5.6 4.8
EE 9.0 9.1 8.8
IE 3.0 3.3 2.5
EL 6.4 6.9 5.7
ES 5.8 5.6 6.0
FR (1) : : :
IT 6.8 7.3 6.3
CY 8.4 8.9 8.0
LV 4.0 4.1 4.0
LT 4.0 4.1 3.9
LU 3.8 4.2 3.3
HU 5.4 5.8 4.9
MT 4.0 5.8 1.9
NL 10.9 11.1 10.7
AT 15.0 16.3 13.6
PL 21.9 21.6 22.2
PT 4.5 3.5 5.5
RO 5.2 5.0 5.4
SI 10.2 9.4 11.1
SK 6.0 6.2 5.8
FI 24.5 20.6 28.4
SE 14.3 11.7 17.0
UK 4.6 4.8 4.4
NO 11.5 10.1 13.0
HR 8.1 9.1 6.9
(1) FR not included due to comparability issues. EU-27 figures reflect EU-27 without FR.
Source: Eurostat (online data code: hsw_pb1)
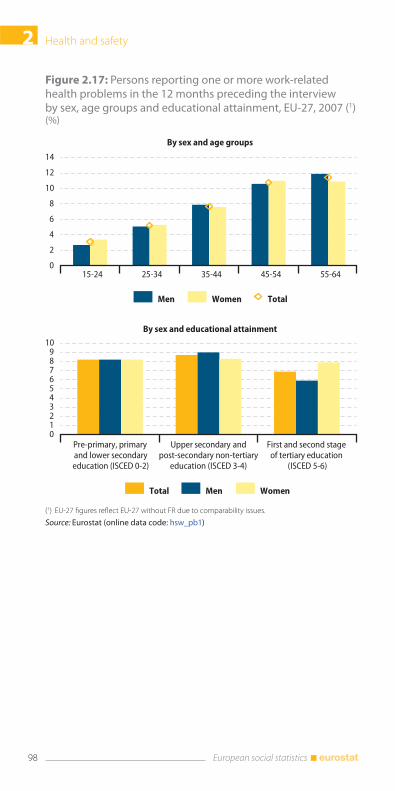
Health and safety2
98 European social statistics
Figure 2.17: Persons reporting one or more work-related health problems in the 12 months preceding the interview by sex, age groups and educational attainment, EU-27, 2007 (1)(%)
0
2
4
6
8
10
12
14
15-24 25-34 35-44 45-54 55-64
0 1 2 3 4 5 6 7 8 9
10
Pre-primary, primary and lower secondaryeducation (ISCED 0-2)
Upper secondary andpost-secondary non-tertiary
education (ISCED 3-4)
First and second stage of tertiary education
(ISCED 5-6)
Men Women Total
Total Men Women
By sex and age groups
By sex and educational attainment
(1) EU-27 figures reflect EU-27 without FR due to comparability issues.
Source: Eurostat (online data code: hsw_pb1)
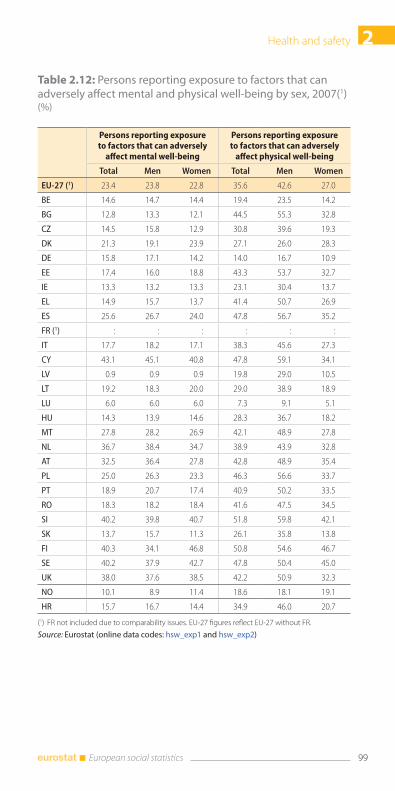
2Health and safety
99 European social statistics
Table 2.12: Persons reporting exposure to factors that can adversely affect mental and physical well-being by sex, 2007(1)(%)
Persons reporting exposure to factors that can adversely
affect mental well-being
Persons reporting exposure to factors that can adversely
affect physical well-being
Total Men Women Total Men Women
EU-27 (1) 23.4 23.8 22.8 35.6 42.6 27.0
BE 14.6 14.7 14.4 19.4 23.5 14.2
BG 12.8 13.3 12.1 44.5 55.3 32.8
CZ 14.5 15.8 12.9 30.8 39.6 19.3
DK 21.3 19.1 23.9 27.1 26.0 28.3
DE 15.8 17.1 14.2 14.0 16.7 10.9
EE 17.4 16.0 18.8 43.3 53.7 32.7
IE 13.3 13.2 13.3 23.1 30.4 13.7
EL 14.9 15.7 13.7 41.4 50.7 26.9
ES 25.6 26.7 24.0 47.8 56.7 35.2
FR (1) : : : : : :
IT 17.7 18.2 17.1 38.3 45.6 27.3
CY 43.1 45.1 40.8 47.8 59.1 34.1
LV 0.9 0.9 0.9 19.8 29.0 10.5
LT 19.2 18.3 20.0 29.0 38.9 18.9
LU 6.0 6.0 6.0 7.3 9.1 5.1
HU 14.3 13.9 14.6 28.3 36.7 18.2
MT 27.8 28.2 26.9 42.1 48.9 27.8
NL 36.7 38.4 34.7 38.9 43.9 32.8
AT 32.5 36.4 27.8 42.8 48.9 35.4
PL 25.0 26.3 23.3 46.3 56.6 33.7
PT 18.9 20.7 17.4 40.9 50.2 33.5
RO 18.3 18.2 18.4 41.6 47.5 34.5
SI 40.2 39.8 40.7 51.8 59.8 42.1
SK 13.7 15.7 11.3 26.1 35.8 13.8
FI 40.3 34.1 46.8 50.8 54.6 46.7
SE 40.2 37.9 42.7 47.8 50.4 45.0
UK 38.0 37.6 38.5 42.2 50.9 32.3
NO 10.1 8.9 11.4 18.6 18.1 19.1
HR 15.7 16.7 14.4 34.9 46.0 20.7
(1) FR not included due to comparability issues. EU-27 figures reflect EU-27 without FR.
Source: Eurostat (online data codes: hsw_exp1 and hsw_exp2)
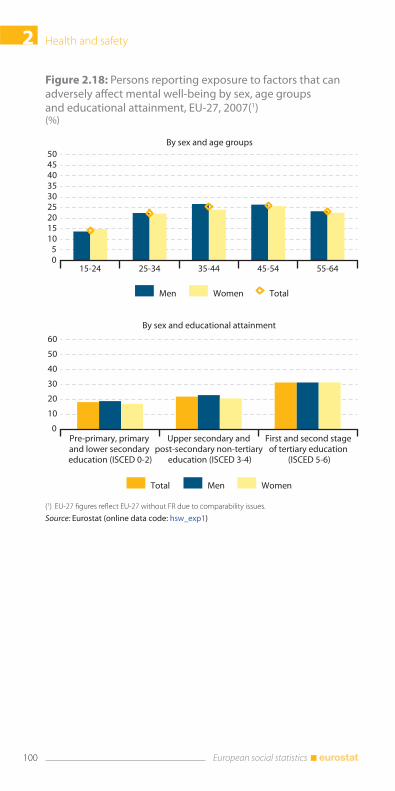
Health and safety2
100 European social statistics
Figure 2.18: Persons reporting exposure to factors that can adversely affect mental well-being by sex, age groups and educational attainment, EU-27, 2007(1)(%)
05
101520253035404550
15-24 25-34 35-44 45-54 55-64
0
10
20
30
40
50
60
Pre-primary, primary and lower secondary education (ISCED 0-2)
Upper secondary and post-secondary non-tertiary
education (ISCED 3-4)
First and second stage of tertiary education
(ISCED 5-6)
By sex and age groups
By sex and educational attainment
Men Women Total
Total Men Women
(1) EU-27 figures reflect EU-27 without FR due to comparability issues.
Source: Eurostat (online data code: hsw_exp1)
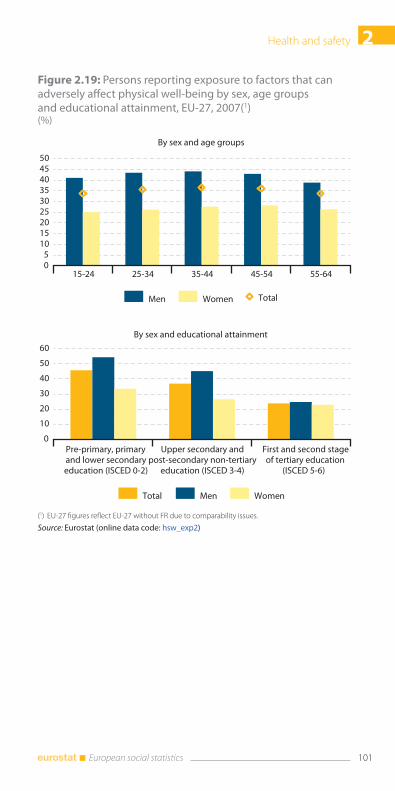
2Health and safety
101 European social statistics
Figure 2.19: Persons reporting exposure to factors that can adversely affect physical well-being by sex, age groups and educational attainment, EU-27, 2007(1)(%)
By sex and age groups
By sex and educational attainment
0 5
10 15 20 25 30 35 40 45 50
15-24 25-34 35-44 45-54 55-64
0
10
20
30
40
50
60
Pre-primary, primaryand lower secondaryeducation (ISCED 0-2)
Upper secondary andpost-secondary non-tertiary
education (ISCED 3-4)
First and second stageof tertiary education
(ISCED 5-6)
Men Women Total
Total Men Women
(1) EU-27 figures reflect EU-27 without FR due to comparability issues.
Source: Eurostat (online data code: hsw_exp2)

3Education and training
Education, vocational training and more generally lifelong learn-
ing play a vital role in both economic and social context. The op-
portunities which the European Union (EU) offers its citizens for
living, studying and working in other countries make a major con-
tribution to cross-cultural understanding, personal development
and the realisation of the EU’s full economic potential. Each year,
well over a million EU citizens of all ages benefit from EU-funded
educational, vocational and citizenship-building programmes.
Education statistics presented in this chapter cover a range of
subjects, including: expenditure, personnel, participation rates,
and educational attainment. The main source of data on enrol-
ment and graduates in the formal education system is the joint
UNESCO/OECD/Eurostat questionnaire on administrative edu-
cation statistics. Eurostat also collects data on regional enrolments
and foreign language learning in that framework. Data on educa-
tional attainment and adult learning are provided by household
surveys, in particular the European Union Labour Force Survey.
Education and training3
104 European social statistics
Pupils and students
The level of educational enrolment depends on a wide range of
factors, such as the age structure of the population, legal require-
ments concerning the start and end of compulsory education, and
the availability of educational resources – in particular, access to
specialist tertiary education may be limited in some of the smallest
Member States.
In the school year 2009/2010, there were approximately 108 mil-
lion pupils and students enrolled in educational establishments in
the EU-27. The highest share (15.1 %) of pupils and students in
the EU-27 total was accounted for by Germany, where 16.3 mil-
lion pupils and students attended educational establishments in
2009/2010; the next largest pupil and student populations were in
France and the United Kingdom (13.8 % and 13.1 % respectively).
The proportion of students found in each level of education var-
ied somewhat between the Member States. This variation reflects,
to some degree, the demographic structure of each population
and the differences in national school systems. In the school year
2009/2010, the highest proportion of pupils in primary education
was recorded in Ireland (43.5 %), the lowest in Lithuania (15.7 %).
The highest number of pupils in secondary education was ob-
served in Germany (50.5 %), the lowest in Spain (32.8 %). Results
for tertiary education show that the highest percentage of students
was recorded in Greece (29.4 %) and the lowest in Luxembourg
(5.3 % of all pupils and students enrolled in educational establish-
ments in the school year 2009/2010).
In the school year 2009/2010, pupil-teacher ratios within primary
and secondary education (ISCED 1-3) ranged from an average of
less than ten pupils per teacher in Lithuania, Portugal and Luxem-
bourg (8.3, 8.9 and 9.5 respectively), to almost double that rate in
the United Kingdom (17.3), the Netherlands (16.1) and Estonia
(16.0).
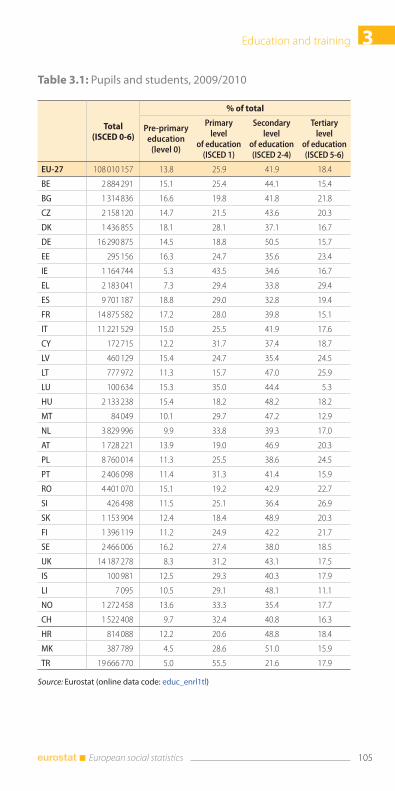
3Education and training
105 European social statistics
Table 3.1: Pupils and students, 2009/2010
Total (ISCED 0-6)
% of total
Pre-primary education
(level 0)
Primary level
of education (ISCED 1)
Secondary level
of education (ISCED 2-4)
Tertiary level
of education (ISCED 5-6)
EU-27 108 010 157 13.8 25.9 41.9 18.4
BE 2 884 291 15.1 25.4 44.1 15.4
BG 1 314 836 16.6 19.8 41.8 21.8
CZ 2 158 120 14.7 21.5 43.6 20.3
DK 1 436 855 18.1 28.1 37.1 16.7
DE 16 290 875 14.5 18.8 50.5 15.7
EE 295 156 16.3 24.7 35.6 23.4
IE 1 164 744 5.3 43.5 34.6 16.7
EL 2 183 041 7.3 29.4 33.8 29.4
ES 9 701 187 18.8 29.0 32.8 19.4
FR 14 875 582 17.2 28.0 39.8 15.1
IT 11 221 529 15.0 25.5 41.9 17.6
CY 172 715 12.2 31.7 37.4 18.7
LV 460 129 15.4 24.7 35.4 24.5
LT 777 972 11.3 15.7 47.0 25.9
LU 100 634 15.3 35.0 44.4 5.3
HU 2 133 238 15.4 18.2 48.2 18.2
MT 84 049 10.1 29.7 47.2 12.9
NL 3 829 996 9.9 33.8 39.3 17.0
AT 1 728 221 13.9 19.0 46.9 20.3
PL 8 760 014 11.3 25.5 38.6 24.5
PT 2 406 098 11.4 31.3 41.4 15.9
RO 4 401 070 15.1 19.2 42.9 22.7
SI 426 498 11.5 25.1 36.4 26.9
SK 1 153 904 12.4 18.4 48.9 20.3
FI 1 396 119 11.2 24.9 42.2 21.7
SE 2 466 006 16.2 27.4 38.0 18.5
UK 14 187 278 8.3 31.2 43.1 17.5
IS 100 981 12.5 29.3 40.3 17.9
LI 7 095 10.5 29.1 48.1 11.1
NO 1 272 458 13.6 33.3 35.4 17.7
CH 1 522 408 9.7 32.4 40.8 16.3
HR 814 088 12.2 20.6 48.8 18.4
MK 387 789 4.5 28.6 51.0 15.9
TR 19 666 770 5.0 55.5 21.6 17.9
Source: Eurostat (online data code: educ_enrl1tl)
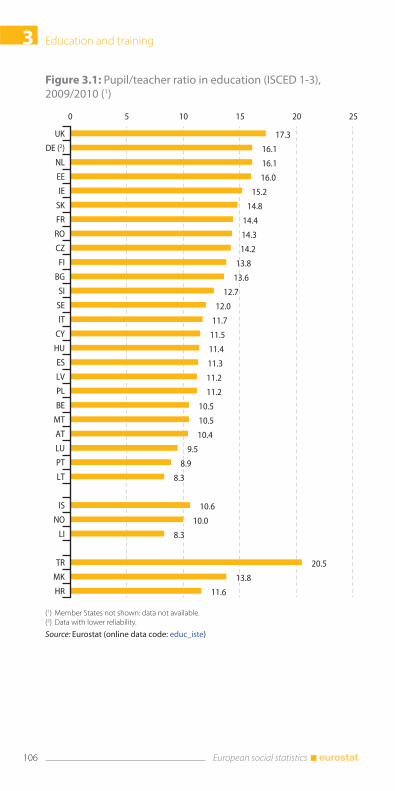
Education and training3
106 European social statistics
Figure 3.1: Pupil/teacher ratio in education (ISCED 1-3), 2009/2010 (1)
17.3
16.1
16.1
16.0
15.2
14.8
14.4
14.3
14.2
13.8
13.6
12.7
12.0
11.7
11.5
11.4
11.3
11.2
11.2
10.5
10.5
10.4
9.5
8.9
8.3
10.6
10.0
8.3
20.5
13.8
11.6
0 5 10 15 20 25
UK
DE (2)
NL
EE
IE
SK
FR
RO
CZ
FI
BG
SI
SE
IT
CY
HU
ES
LV
PL
BE
MT
AT
LU
PT
LT
IS
NO
LI
TR
MK
HR
(1) Member States not shown: data not available.(2) Data with lower reliability.
Source: Eurostat (online data code: educ_iste)
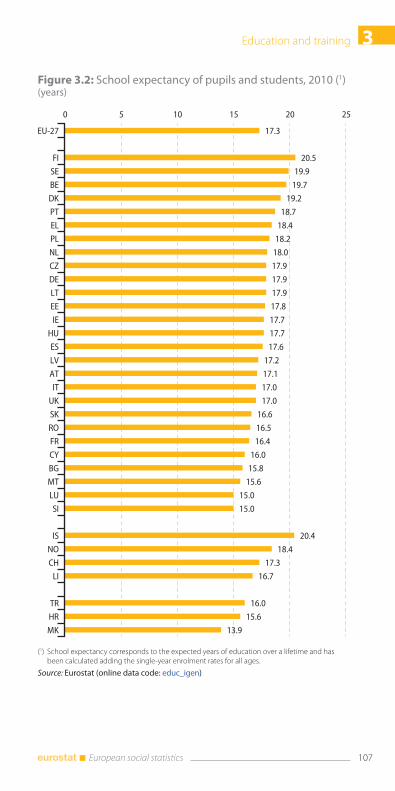
3Education and training
107 European social statistics
Figure 3.2: School expectancy of pupils and students, 2010 (1)(years)
17.3
20.5
19.9
19.7
19.2
18.7
18.4
18.2
18.0
17.9
17.9
17.9
17.8
17.7
17.7
17.6
17.2
17.1
17.0
17.0
16.6
16.5
16.4
16.0
15.8
15.6
15.0
15.0
20.4
18.4
17.3
16.7
16.0
15.6
13.9
0 5 10 15 20 25
EU-27
FI
SE
BE
DK
PT
EL
PL
NL
CZ
DE
LT
EE
IE
HU
ES
LV
AT
IT
UK
SK
RO
FR
CY
BG
MT
LU
SI
IS
NO
CH
LI
TR
HR
MK
(1) School expectancy corresponds to the expected years of education over a lifetime and has been calculated adding the single-year enrolment rates for all ages.
Source: Eurostat (online data code: educ_igen)
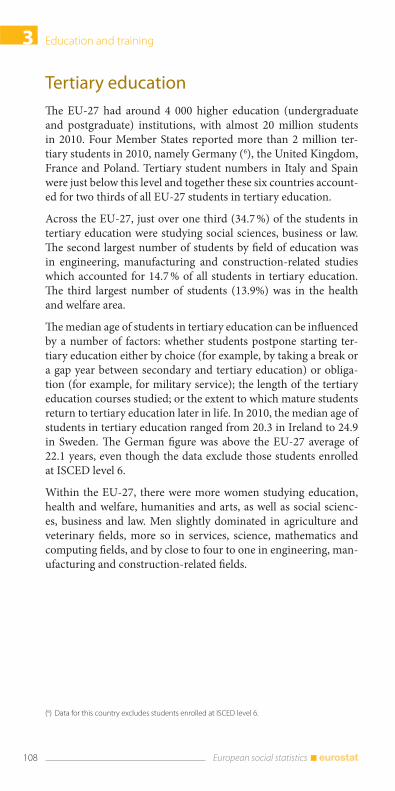
Education and training3
108 European social statistics
Tertiary education
The EU-27 had around 4 000 higher education (undergraduate
and postgraduate) institutions, with almost 20 million students
in 2010. Four Member States reported more than 2 million ter-
tiary students in 2010, namely Germany (6), the United Kingdom,
France and Poland. Tertiary student numbers in Italy and Spain
were just below this level and together these six countries account-
ed for two thirds of all EU-27 students in tertiary education.
Across the EU-27, just over one third (34.7 %) of the students in
tertiary education were studying social sciences, business or law.
The second largest number of students by field of education was
in engineering, manufacturing and construction-related studies
which accounted for 14.7 % of all students in tertiary education.
The third largest number of students (13.9%) was in the health
and welfare area.
The median age of students in tertiary education can be influenced
by a number of factors: whether students postpone starting ter-
tiary education either by choice (for example, by taking a break or
a gap year between secondary and tertiary education) or obliga-
tion (for example, for military service); the length of the tertiary
education courses studied; or the extent to which mature students
return to tertiary education later in life. In 2010, the median age of
students in tertiary education ranged from 20.3 in Ireland to 24.9
in Sweden. The German figure was above the EU-27 average of
22.1 years, even though the data exclude those students enrolled
at ISCED level 6.
Within the EU-27, there were more women studying education,
health and welfare, humanities and arts, as well as social scienc-
es, business and law. Men slightly dominated in agriculture and
veterinary fields, more so in services, science, mathematics and
computing fields, and by close to four to one in engineering, man-
ufacturing and construction-related fields.
(6) Data for this country excludes students enrolled at ISCED level 6.
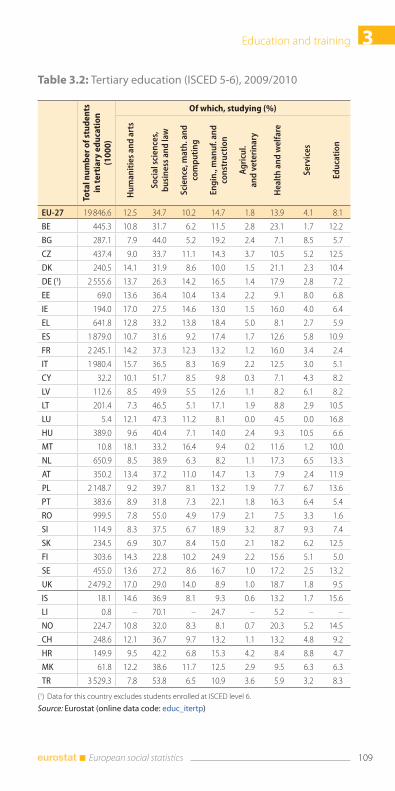
3Education and training
109 European social statistics
Table 3.2: Tertiary education (ISCED 5-6), 2009/2010To
tal n
um
be
r o
f st
ud
en
ts
in t
ert
iary
ed
uca
tio
n
(10
00
)Of which, studying (%)
Hu
man
itie
s an
d a
rts
So
cial
sci
ence
s,
bu
sin
ess
and
law
Sci
ence
, mat
h. a
nd
co
mp
uti
ng
Eng
in.,
man
uf.
an
d
con
stru
ctio
n
Ag
ricu
l.
and
vet
erin
ary
Hea
lth
an
d w
elfa
re
Ser
vice
s
Edu
cati
on
EU-27 19 846.6 12.5 34.7 10.2 14.7 1.8 13.9 4.1 8.1
BE 445.3 10.8 31.7 6.2 11.5 2.8 23.1 1.7 12.2
BG 287.1 7.9 44.0 5.2 19.2 2.4 7.1 8.5 5.7
CZ 437.4 9.0 33.7 11.1 14.3 3.7 10.5 5.2 12.5
DK 240.5 14.1 31.9 8.6 10.0 1.5 21.1 2.3 10.4
DE (1) 2 555.6 13.7 26.3 14.2 16.5 1.4 17.9 2.8 7.2
EE 69.0 13.6 36.4 10.4 13.4 2.2 9.1 8.0 6.8
IE 194.0 17.0 27.5 14.6 13.0 1.5 16.0 4.0 6.4
EL 641.8 12.8 33.2 13.8 18.4 5.0 8.1 2.7 5.9
ES 1 879.0 10.7 31.6 9.2 17.4 1.7 12.6 5.8 10.9
FR 2 245.1 14.2 37.3 12.3 13.2 1.2 16.0 3.4 2.4
IT 1 980.4 15.7 36.5 8.3 16.9 2.2 12.5 3.0 5.1
CY 32.2 10.1 51.7 8.5 9.8 0.3 7.1 4.3 8.2
LV 112.6 8.5 49.9 5.5 12.6 1.1 8.2 6.1 8.2
LT 201.4 7.3 46.5 5.1 17.1 1.9 8.8 2.9 10.5
LU 5.4 12.1 47.3 11.2 8.1 0.0 4.5 0.0 16.8
HU 389.0 9.6 40.4 7.1 14.0 2.4 9.3 10.5 6.6
MT 10.8 18.1 33.2 16.4 9.4 0.2 11.6 1.2 10.0
NL 650.9 8.5 38.9 6.3 8.2 1.1 17.3 6.5 13.3
AT 350.2 13.4 37.2 11.0 14.7 1.3 7.9 2.4 11.9
PL 2 148.7 9.2 39.7 8.1 13.2 1.9 7.7 6.7 13.6
PT 383.6 8.9 31.8 7.3 22.1 1.8 16.3 6.4 5.4
RO 999.5 7.8 55.0 4.9 17.9 2.1 7.5 3.3 1.6
SI 114.9 8.3 37.5 6.7 18.9 3.2 8.7 9.3 7.4
SK 234.5 6.9 30.7 8.4 15.0 2.1 18.2 6.2 12.5
FI 303.6 14.3 22.8 10.2 24.9 2.2 15.6 5.1 5.0
SE 455.0 13.6 27.2 8.6 16.7 1.0 17.2 2.5 13.2
UK 2 479.2 17.0 29.0 14.0 8.9 1.0 18.7 1.8 9.5
IS 18.1 14.6 36.9 8.1 9.3 0.6 13.2 1.7 15.6
LI 0.8 – 70.1 – 24.7 – 5.2 – –
NO 224.7 10.8 32.0 8.3 8.1 0.7 20.3 5.2 14.5
CH 248.6 12.1 36.7 9.7 13.2 1.1 13.2 4.8 9.2
HR 149.9 9.5 42.2 6.8 15.3 4.2 8.4 8.8 4.7
MK 61.8 12.2 38.6 11.7 12.5 2.9 9.5 6.3 6.3
TR 3 529.3 7.8 53.8 6.5 10.9 3.6 5.9 3.2 8.3
(1) Data for this country excludes students enrolled at ISCED level 6.
Source: Eurostat (online data code: educ_itertp)
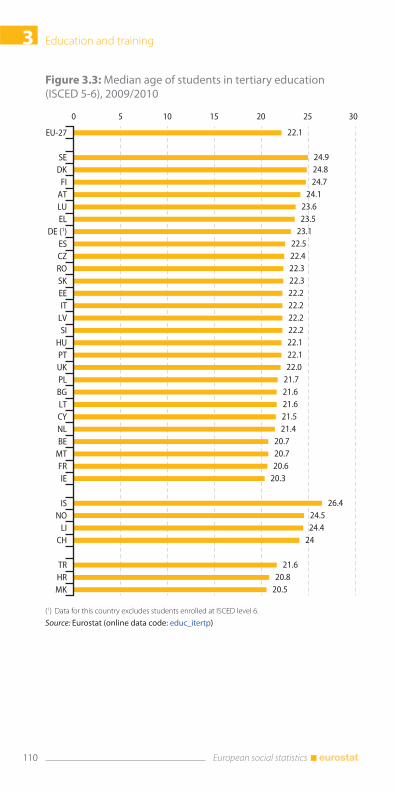
Education and training3
110 European social statistics
Figure 3.3: Median age of students in tertiary education (ISCED 5-6), 2009/2010
22.1
24.924.824.7
24.123.623.5
23.122.522.422.322.322.222.222.222.222.122.122.0
21.721.621.621.521.4
20.720.720.6
20.3
26.424.524.4
24
21.620.8
20.5
0 5 10 15 20 25 30
EU-27
SEDK
FIATLUEL
DE (1)ESCZROSKEEIT
LVSI
HUPTUKPLBGLTCYNLBE
MTFRIE
ISNO
LICH
TRHRMK
(1) Data for this country excludes students enrolled at ISCED level 6.
Source: Eurostat (online data code: educ_itertp)
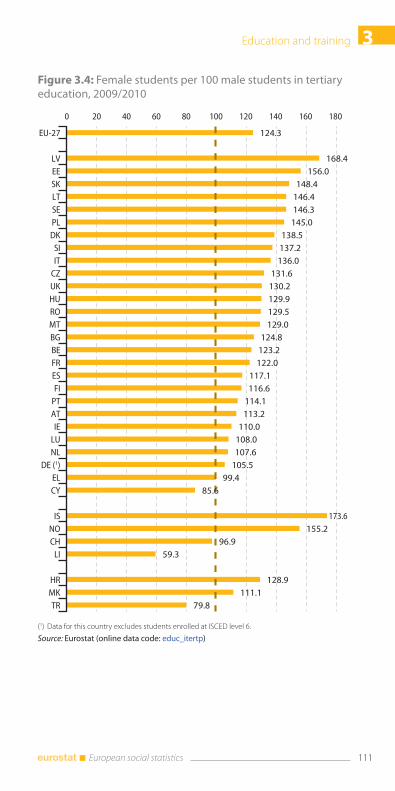
3Education and training
111 European social statistics
Figure 3.4: Female students per 100 male students in tertiary education, 2009/2010
124.3
168.4156.0
148.4146.4146.3145.0
138.5137.2136.0
131.6130.2129.9129.5129.0
124.8123.2122.0
117.1116.6
114.1113.2
110.0108.0107.6
105.599.4
85.6
173.6155.2
96.959.3
128.9111.1
79.8
0 20 40 60 80 100 120 140 160 180
EU-27
LVEESKLTSEPLDK
SIIT
CZUKHUROMTBGBEFRESFI
PTATIE
LUNL
DE (1)ELCY
ISNOCH
LI
HRMKTR
(1) Data for this country excludes students enrolled at ISCED level 6.
Source: Eurostat (online data code: educ_itertp)
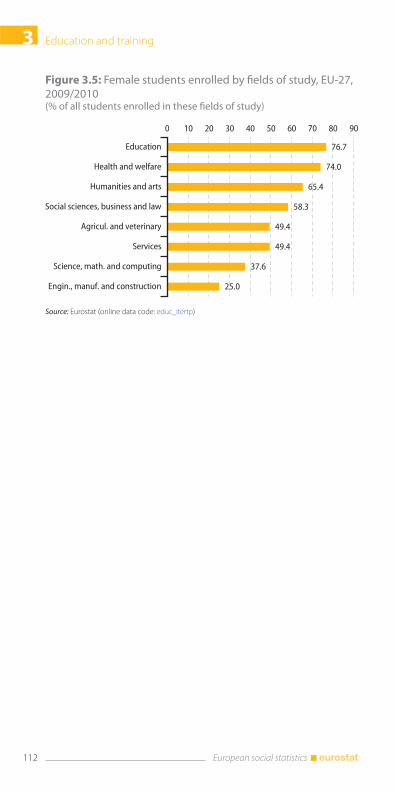
Education and training3
112 European social statistics
Figure 3.5: Female students enrolled by fields of study, EU-27, 2009/2010(% of all students enrolled in these fields of study)
76.7
74.0
65.4
58.3
49.4
49.4
37.6
25.0
0 10 20 30 40 50 60 70 80 90
Education
Health and welfare
Humanities and arts
Social sciences, business and law
Agricul. and veterinary
Services
Science, math. and computing
Engin., manuf. and construction
Source: Eurostat (online data code: educ_itertp)
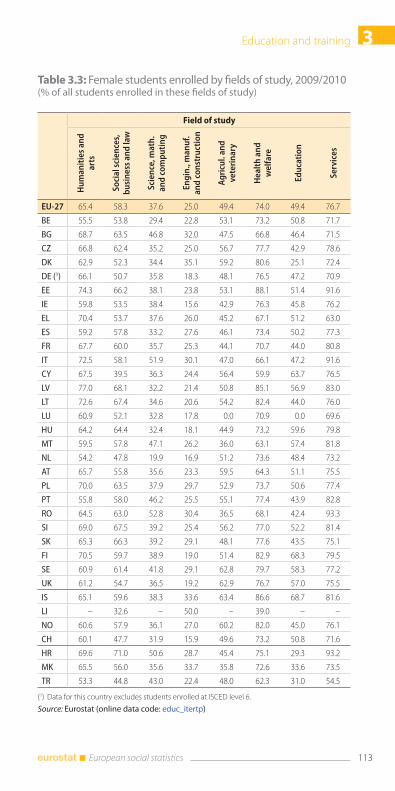
3Education and training
113 European social statistics
Table 3.3: Female students enrolled by fields of study, 2009/2010(% of all students enrolled in these fields of study)
Field of study
Hu
man
itie
s an
d
arts
So
cial
sci
ence
s,
bu
sin
ess
and
law
Sci
ence
, mat
h.
and
co
mp
uti
ng
Eng
in.,
man
uf.
an
d c
on
stru
ctio
n
Ag
ricu
l. an
d
vete
rin
ary
Hea
lth
an
d
wel
fare
Edu
cati
on
Ser
vice
s
EU-27 65.4 58.3 37.6 25.0 49.4 74.0 49.4 76.7
BE 55.5 53.8 29.4 22.8 53.1 73.2 50.8 71.7
BG 68.7 63.5 46.8 32.0 47.5 66.8 46.4 71.5
CZ 66.8 62.4 35.2 25.0 56.7 77.7 42.9 78.6
DK 62.9 52.3 34.4 35.1 59.2 80.6 25.1 72.4
DE (1) 66.1 50.7 35.8 18.3 48.1 76.5 47.2 70.9
EE 74.3 66.2 38.1 23.8 53.1 88.1 51.4 91.6
IE 59.8 53.5 38.4 15.6 42.9 76.3 45.8 76.2
EL 70.4 53.7 37.6 26.0 45.2 67.1 51.2 63.0
ES 59.2 57.8 33.2 27.6 46.1 73.4 50.2 77.3
FR 67.7 60.0 35.7 25.3 44.1 70.7 44.0 80.8
IT 72.5 58.1 51.9 30.1 47.0 66.1 47.2 91.6
CY 67.5 39.5 36.3 24.4 56.4 59.9 63.7 76.5
LV 77.0 68.1 32.2 21.4 50.8 85.1 56.9 83.0
LT 72.6 67.4 34.6 20.6 54.2 82.4 44.0 76.0
LU 60.9 52.1 32.8 17.8 0.0 70.9 0.0 69.6
HU 64.2 64.4 32.4 18.1 44.9 73.2 59.6 79.8
MT 59.5 57.8 47.1 26.2 36.0 63.1 57.4 81.8
NL 54.2 47.8 19.9 16.9 51.2 73.6 48.4 73.2
AT 65.7 55.8 35.6 23.3 59.5 64.3 51.1 75.5
PL 70.0 63.5 37.9 29.7 52.9 73.7 50.6 77.4
PT 55.8 58.0 46.2 25.5 55.1 77.4 43.9 82.8
RO 64.5 63.0 52.8 30.4 36.5 68.1 42.4 93.3
SI 69.0 67.5 39.2 25.4 56.2 77.0 52.2 81.4
SK 65.3 66.3 39.2 29.1 48.1 77.6 43.5 75.1
FI 70.5 59.7 38.9 19.0 51.4 82.9 68.3 79.5
SE 60.9 61.4 41.8 29.1 62.8 79.7 58.3 77.2
UK 61.2 54.7 36.5 19.2 62.9 76.7 57.0 75.5
IS 65.1 59.6 38.3 33.6 63.4 86.6 68.7 81.6
LI – 32.6 – 50.0 – 39.0 – –
NO 60.6 57.9 36.1 27.0 60.2 82.0 45.0 76.1
CH 60.1 47.7 31.9 15.9 49.6 73.2 50.8 71.6
HR 69.6 71.0 50.6 28.7 45.4 75.1 29.3 93.2
MK 65.5 56.0 35.6 33.7 35.8 72.6 33.6 73.5
TR 53.3 44.8 43.0 22.4 48.0 62.3 31.0 54.5
(1) Data for this country excludes students enrolled at ISCED level 6.
Source: Eurostat (online data code: educ_itertp)
Education and training3
114 European social statistics
Educational attainment of the population
Educational attainment levels of the population have improved
significantly over the last thirty years. In 2011, 76.4 % of people
aged 25-54 in the EU-27 had at least an upper secondary educa-
tion level, compared to 57.3 % of those aged 55-74. Those who had
high educational attainment amounted respectively 28.8 % and
17.6 %.
The Europe 2020 strategy set a number of benchmarks, including
one for tertiary education, namely that by 2020 the proportion of
30- to 34-year-olds with tertiary educational attainment should be
at least 40 %. Just over one third (34.6 %) of the population aged
30 to 34 in the EU-27 had a tertiary education in 2011. In 13 EU
Member States this proportion was already 40 % or more in 2011;
this was also the case in Norway, Iceland and Switzerland. In con-
trast, the lowest shares of those having a tertiary education were
observed in Malta, Romania and Italy, as well as in the Former Yu-
goslav Republic of Macedonia and Turkey where the proportion of
persons having a tertiary educational attainment was below 22 %.
Data on educational attainment also show that, in 2011, close to
four fifths (79.5 %) of the EU-27’s population aged 20 to 24 had
completed at least an upper secondary level of education, a figure
that reached 82.4 % for women.
On the other hand, 13.5 % of young people aged 18 to 24 (15.3 % of
men and 11.6 % of women) had at most a lower secondary educa-
tion and were no longer in education and training in 2011 (indica-
tor “early leavers from education and training”). A benchmark was
set by the EU to decrease this rate to less than 10 % by 2020 within
the Europe 2020 strategy. This level has already been reached in
2011 by eleven EU Member States. The share of early leavers from
education and training are still high in Malta (33.5 %)(7), Spain
(26.5 %) and Portugal (23.2 %).
(7) The Maltese series on ‘early leavers from education and training’ is under review by the Maltese Statistical Office and Eurostat. The review is about the classification of people of certain quali-fications at secondary level (‘O levels)’ and not in further education and training. The weight of this group in the current series is about 8 percentage points on average.
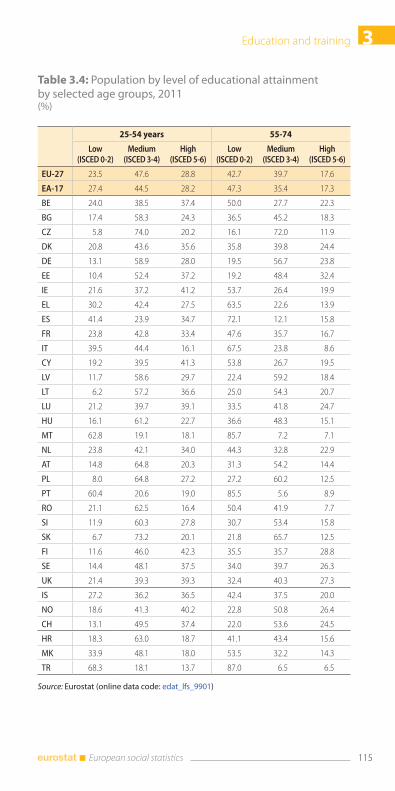
3Education and training
115 European social statistics
Table 3.4: Population by level of educational attainment by selected age groups, 2011(%)
25-54 years 55-74
Low (ISCED 0-2)
Medium (ISCED 3-4)
High (ISCED 5-6)
Low (ISCED 0-2)
Medium (ISCED 3-4)
High (ISCED 5-6)
EU-27 23.5 47.6 28.8 42.7 39.7 17.6
EA-17 27.4 44.5 28.2 47.3 35.4 17.3
BE 24.0 38.5 37.4 50.0 27.7 22.3
BG 17.4 58.3 24.3 36.5 45.2 18.3
CZ 5.8 74.0 20.2 16.1 72.0 11.9
DK 20.8 43.6 35.6 35.8 39.8 24.4
DE 13.1 58.9 28.0 19.5 56.7 23.8
EE 10.4 52.4 37.2 19.2 48.4 32.4
IE 21.6 37.2 41.2 53.7 26.4 19.9
EL 30.2 42.4 27.5 63.5 22.6 13.9
ES 41.4 23.9 34.7 72.1 12.1 15.8
FR 23.8 42.8 33.4 47.6 35.7 16.7
IT 39.5 44.4 16.1 67.5 23.8 8.6
CY 19.2 39.5 41.3 53.8 26.7 19.5
LV 11.7 58.6 29.7 22.4 59.2 18.4
LT 6.2 57.2 36.6 25.0 54.3 20.7
LU 21.2 39.7 39.1 33.5 41.8 24.7
HU 16.1 61.2 22.7 36.6 48.3 15.1
MT 62.8 19.1 18.1 85.7 7.2 7.1
NL 23.8 42.1 34.0 44.3 32.8 22.9
AT 14.8 64.8 20.3 31.3 54.2 14.4
PL 8.0 64.8 27.2 27.2 60.2 12.5
PT 60.4 20.6 19.0 85.5 5.6 8.9
RO 21.1 62.5 16.4 50.4 41.9 7.7
SI 11.9 60.3 27.8 30.7 53.4 15.8
SK 6.7 73.2 20.1 21.8 65.7 12.5
FI 11.6 46.0 42.3 35.5 35.7 28.8
SE 14.4 48.1 37.5 34.0 39.7 26.3
UK 21.4 39.3 39.3 32.4 40.3 27.3
IS 27.2 36.2 36.5 42.4 37.5 20.0
NO 18.6 41.3 40.2 22.8 50.8 26.4
CH 13.1 49.5 37.4 22.0 53.6 24.5
HR 18.3 63.0 18.7 41.1 43.4 15.6
MK 33.9 48.1 18.0 53.5 32.2 14.3
TR 68.3 18.1 13.7 87.0 6.5 6.5
Source: Eurostat (online data code: edat_lfs_9901)
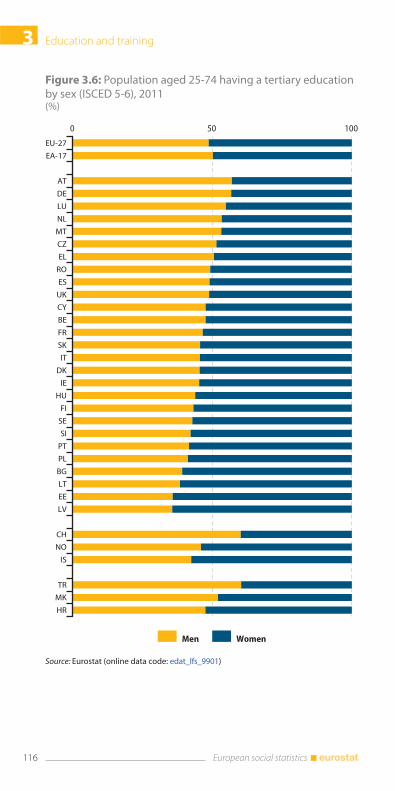
Education and training3
116 European social statistics
Figure 3.6: Population aged 25-74 having a tertiary education by sex (ISCED 5-6), 2011 (%)
0 50 100
EU-27
EA-17
AT
DE
LU
NL
MT
CZ
EL
RO
ES
UK
CY
BE
FR
SK
IT
DK
IE
HU
FI
SE
SI
PT
PL
BG
LT
EE
LV
CH
NO
IS
TR
MK
HR
Men Women
Source: Eurostat (online data code: edat_lfs_9901)
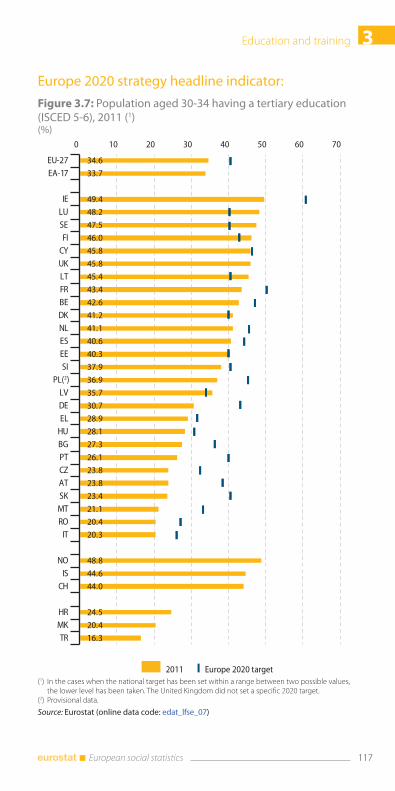
3Education and training
117 European social statistics
Europe 2020 strategy headline indicator:
Figure 3.7: Population aged 30-34 having a tertiary education (ISCED 5-6), 2011 (1)(%)
2011 Europe 2020 target
34.633.7
49.448.247.546.045.845.845.443.442.641.241.140.640.337.936.935.730.728.928.127.326.123.823.823.421.120.420.3
48.844.644.0
24.520.416.3
0 10 20 30 40 50 60 70
EU-27EA-17
IELUSEFI
CYUKLTFRBEDKNLESEESI
PL(2)LVDEEL
HUBGPTCZATSKMTRO
IT
NOIS
CH
HRMKTR
(1) In the cases when the national target has been set within a range between two possible values, the lower level has been taken. The United Kingdom did not set a specific 2020 target.
(2) Provisional data.
Source: Eurostat (online data code: edat_lfse_07)
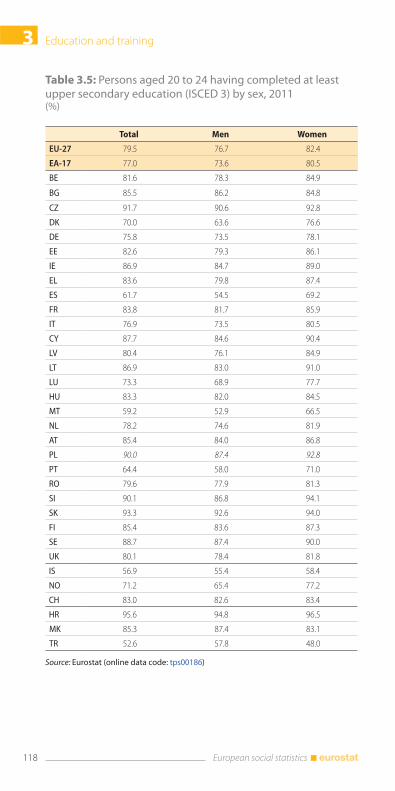
Education and training3
118 European social statistics
Table 3.5: Persons aged 20 to 24 having completed at least upper secondary education (ISCED 3) by sex, 2011(%)
Total Men Women
EU-27 79.5 76.7 82.4
EA-17 77.0 73.6 80.5
BE 81.6 78.3 84.9
BG 85.5 86.2 84.8
CZ 91.7 90.6 92.8
DK 70.0 63.6 76.6
DE 75.8 73.5 78.1
EE 82.6 79.3 86.1
IE 86.9 84.7 89.0
EL 83.6 79.8 87.4
ES 61.7 54.5 69.2
FR 83.8 81.7 85.9
IT 76.9 73.5 80.5
CY 87.7 84.6 90.4
LV 80.4 76.1 84.9
LT 86.9 83.0 91.0
LU 73.3 68.9 77.7
HU 83.3 82.0 84.5
MT 59.2 52.9 66.5
NL 78.2 74.6 81.9
AT 85.4 84.0 86.8
PL 90.0 87.4 92.8
PT 64.4 58.0 71.0
RO 79.6 77.9 81.3
SI 90.1 86.8 94.1
SK 93.3 92.6 94.0
FI 85.4 83.6 87.3
SE 88.7 87.4 90.0
UK 80.1 78.4 81.8
IS 56.9 55.4 58.4
NO 71.2 65.4 77.2
CH 83.0 82.6 83.4
HR 95.6 94.8 96.5
MK 85.3 87.4 83.1
TR 52.6 57.8 48.0
Source: Eurostat (online data code: tps00186)
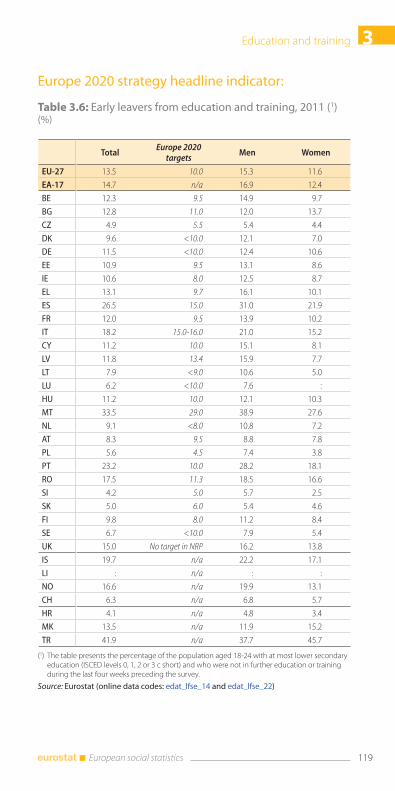
3Education and training
119 European social statistics
Europe 2020 strategy headline indicator:
Table 3.6: Early leavers from education and training, 2011 (1)(%)
Total Europe 2020
targetsMen Women
EU-27 13.5 10.0 15.3 11.6
EA-17 14.7 n/a 16.9 12.4
BE 12.3 9.5 14.9 9.7
BG 12.8 11.0 12.0 13.7
CZ 4.9 5.5 5.4 4.4
DK 9.6 <10.0 12.1 7.0
DE 11.5 <10.0 12.4 10.6
EE 10.9 9.5 13.1 8.6
IE 10.6 8.0 12.5 8.7
EL 13.1 9.7 16.1 10.1
ES 26.5 15.0 31.0 21.9
FR 12.0 9.5 13.9 10.2
IT 18.2 15.0-16.0 21.0 15.2
CY 11.2 10.0 15.1 8.1
LV 11.8 13.4 15.9 7.7
LT 7.9 <9.0 10.6 5.0
LU 6.2 <10.0 7.6 :
HU 11.2 10.0 12.1 10.3
MT 33.5 29.0 38.9 27.6
NL 9.1 <8.0 10.8 7.2
AT 8.3 9.5 8.8 7.8
PL 5.6 4.5 7.4 3.8
PT 23.2 10.0 28.2 18.1
RO 17.5 11.3 18.5 16.6
SI 4.2 5.0 5.7 2.5
SK 5.0 6.0 5.4 4.6
FI 9.8 8.0 11.2 8.4
SE 6.7 <10.0 7.9 5.4
UK 15.0 No target in NRP 16.2 13.8
IS 19.7 n/a 22.2 17.1
LI : n/a : :
NO 16.6 n/a 19.9 13.1
CH 6.3 n/a 6.8 5.7
HR 4.1 n/a 4.8 3.4
MK 13.5 n/a 11.9 15.2
TR 41.9 n/a 37.7 45.7
(1) The table presents the percentage of the population aged 18-24 with at most lower secondary education (ISCED levels 0, 1, 2 or 3 c short) and who were not in further education or training during the last four weeks preceding the survey.
Source: Eurostat (online data codes: edat_lfse_14 and edat_lfse_22)
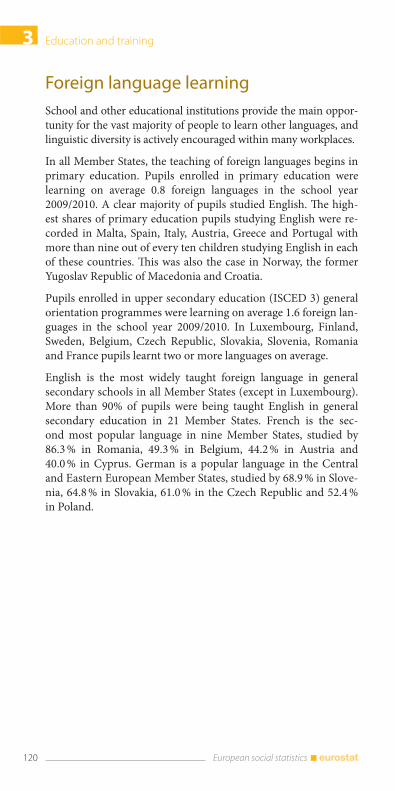
Education and training3
120 European social statistics
Foreign language learning
School and other educational institutions provide the main oppor-
tunity for the vast majority of people to learn other languages, and
linguistic diversity is actively encouraged within many workplaces.
In all Member States, the teaching of foreign languages begins in
primary education. Pupils enrolled in primary education were
learning on average 0.8 foreign languages in the school year
2009/2010. A clear majority of pupils studied English. The high-
est shares of primary education pupils studying English were re-
corded in Malta, Spain, Italy, Austria, Greece and Portugal with
more than nine out of every ten children studying English in each
of these countries. This was also the case in Norway, the former
Yugoslav Republic of Macedonia and Croatia.
Pupils enrolled in upper secondary education (ISCED 3) general
orientation programmes were learning on average 1.6 foreign lan-
guages in the school year 2009/2010. In Luxembourg, Finland,
Sweden, Belgium, Czech Republic, Slovakia, Slovenia, Romania
and France pupils learnt two or more languages on average.
English is the most widely taught foreign language in general
secondary schools in all Member States (except in Luxembourg).
More than 90% of pupils were being taught English in general
secondary education in 21 Member States. French is the sec-
ond most popular language in nine Member States, studied by
86.3 % in Romania, 49.3 % in Belgium, 44.2 % in Austria and
40.0 % in Cyprus. German is a popular language in the Central
and Eastern European Member States, studied by 68.9 % in Slove-
nia, 64.8 % in Slovakia, 61.0 % in the Czech Republic and 52.4 %
in Poland.
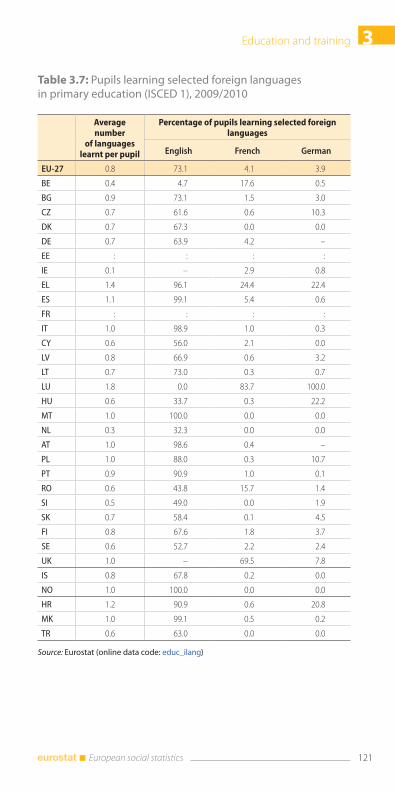
3Education and training
121 European social statistics
Table 3.7: Pupils learning selected foreign languages in primary education (ISCED 1), 2009/2010
Average number
of languages learnt per pupil
Percentage of pupils learning selected foreign languages
English French German
EU-27 0.8 73.1 4.1 3.9
BE 0.4 4.7 17.6 0.5
BG 0.9 73.1 1.5 3.0
CZ 0.7 61.6 0.6 10.3
DK 0.7 67.3 0.0 0.0
DE 0.7 63.9 4.2 –
EE : : : :
IE 0.1 – 2.9 0.8
EL 1.4 96.1 24.4 22.4
ES 1.1 99.1 5.4 0.6
FR : : : :
IT 1.0 98.9 1.0 0.3
CY 0.6 56.0 2.1 0.0
LV 0.8 66.9 0.6 3.2
LT 0.7 73.0 0.3 0.7
LU 1.8 0.0 83.7 100.0
HU 0.6 33.7 0.3 22.2
MT 1.0 100.0 0.0 0.0
NL 0.3 32.3 0.0 0.0
AT 1.0 98.6 0.4 –
PL 1.0 88.0 0.3 10.7
PT 0.9 90.9 1.0 0.1
RO 0.6 43.8 15.7 1.4
SI 0.5 49.0 0.0 1.9
SK 0.7 58.4 0.1 4.5
FI 0.8 67.6 1.8 3.7
SE 0.6 52.7 2.2 2.4
UK 1.0 – 69.5 7.8
IS 0.8 67.8 0.2 0.0
NO 1.0 100.0 0.0 0.0
HR 1.2 90.9 0.6 20.8
MK 1.0 99.1 0.5 0.2
TR 0.6 63.0 0.0 0.0
Source: Eurostat (online data code: educ_ilang)
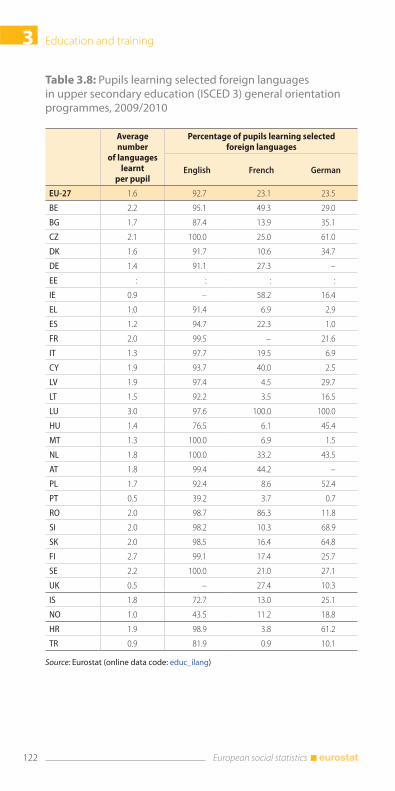
Education and training3
122 European social statistics
Table 3.8: Pupils learning selected foreign languages in upper secondary education (ISCED 3) general orientation programmes, 2009/2010
Average number
of languages learnt
per pupil
Percentage of pupils learning selected foreign languages
English French German
EU-27 1.6 92.7 23.1 23.5
BE 2.2 95.1 49.3 29.0
BG 1.7 87.4 13.9 35.1
CZ 2.1 100.0 25.0 61.0
DK 1.6 91.7 10.6 34.7
DE 1.4 91.1 27.3 –
EE : : : :
IE 0.9 – 58.2 16.4
EL 1.0 91.4 6.9 2.9
ES 1.2 94.7 22.3 1.0
FR 2.0 99.5 – 21.6
IT 1.3 97.7 19.5 6.9
CY 1.9 93.7 40.0 2.5
LV 1.9 97.4 4.5 29.7
LT 1.5 92.2 3.5 16.5
LU 3.0 97.6 100.0 100.0
HU 1.4 76.5 6.1 45.4
MT 1.3 100.0 6.9 1.5
NL 1.8 100.0 33.2 43.5
AT 1.8 99.4 44.2 –
PL 1.7 92.4 8.6 52.4
PT 0.5 39.2 3.7 0.7
RO 2.0 98.7 86.3 11.8
SI 2.0 98.2 10.3 68.9
SK 2.0 98.5 16.4 64.8
FI 2.7 99.1 17.4 25.7
SE 2.2 100.0 21.0 27.1
UK 0.5 – 27.4 10.3
IS 1.8 72.7 13.0 25.1
NO 1.0 43.5 11.2 18.8
HR 1.9 98.9 3.8 61.2
TR 0.9 81.9 0.9 10.1
Source: Eurostat (online data code: educ_ilang)
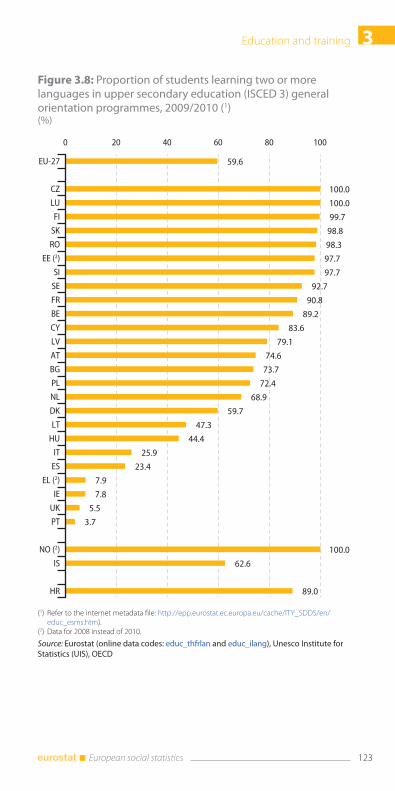
3Education and training
123 European social statistics
Figure 3.8: Proportion of students learning two or more languages in upper secondary education (ISCED 3) general orientation programmes, 2009/2010 (1)(%)
59.6
100.0
100.0
99.7
98.8
98.3
97.7
97.7
92.7
90.8
89.2
83.6
79.1
74.6
73.7
72.4
68.9
59.7
47.3
44.4
25.9
23.4
7.9
7.8
5.5
3.7
100.0
62.6
89.0
0 20 40 60 80 100
EU-27
CZ
LU
FI
SK
RO
EE (2)
SI
SE
FR
BE
CY
LV
AT
BG
PL
NL
DK
LT
HU
IT
ES
EL (2)
IE
UK
PT
NO (2)
IS
HR
(1) Refer to the internet metadata file: http://epp.eurostat.ec.europa.eu/cache/ITY_SDDS/en/educ_esms.htm).
(2) Data for 2008 instead of 2010.
Source: Eurostat (online data codes: educ_thfrlan and educ_ilang), Unesco Institute for
Statistics (UIS), OECD
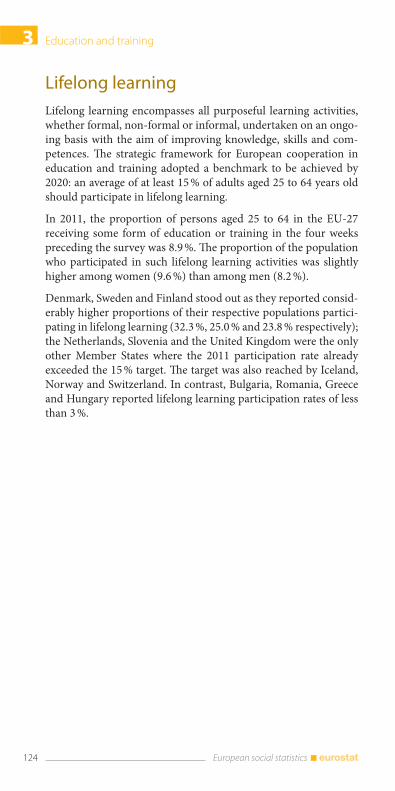
Education and training3
124 European social statistics
Lifelong learning
Lifelong learning encompasses all purposeful learning activities,
whether formal, non-formal or informal, undertaken on an ongo-
ing basis with the aim of improving knowledge, skills and com-
petences. The strategic framework for European cooperation in
education and training adopted a benchmark to be achieved by
2020: an average of at least 15 % of adults aged 25 to 64 years old
should participate in lifelong learning.
In 2011, the proportion of persons aged 25 to 64 in the EU-27
receiving some form of education or training in the four weeks
preceding the survey was 8.9 %. The proportion of the population
who participated in such lifelong learning activities was slightly
higher among women (9.6 %) than among men (8.2 %).
Denmark, Sweden and Finland stood out as they reported consid-
erably higher proportions of their respective populations partici-
pating in lifelong learning (32.3 %, 25.0 % and 23.8 % respectively);
the Netherlands, Slovenia and the United Kingdom were the only
other Member States where the 2011 participation rate already
exceeded the 15 % target. The target was also reached by Iceland,
Norway and Switzerland. In contrast, Bulgaria, Romania, Greece
and Hungary reported lifelong learning participation rates of less
than 3 %.
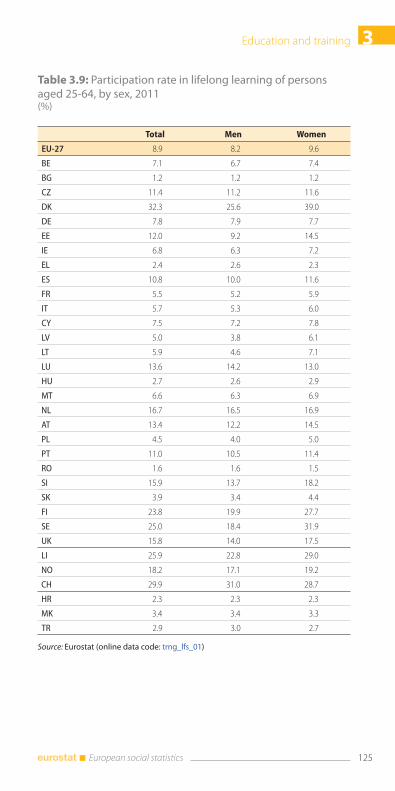
3Education and training
125 European social statistics
Table 3.9: Participation rate in lifelong learning of persons aged 25-64, by sex, 2011(%)
Total Men Women
EU-27 8.9 8.2 9.6
BE 7.1 6.7 7.4
BG 1.2 1.2 1.2
CZ 11.4 11.2 11.6
DK 32.3 25.6 39.0
DE 7.8 7.9 7.7
EE 12.0 9.2 14.5
IE 6.8 6.3 7.2
EL 2.4 2.6 2.3
ES 10.8 10.0 11.6
FR 5.5 5.2 5.9
IT 5.7 5.3 6.0
CY 7.5 7.2 7.8
LV 5.0 3.8 6.1
LT 5.9 4.6 7.1
LU 13.6 14.2 13.0
HU 2.7 2.6 2.9
MT 6.6 6.3 6.9
NL 16.7 16.5 16.9
AT 13.4 12.2 14.5
PL 4.5 4.0 5.0
PT 11.0 10.5 11.4
RO 1.6 1.6 1.5
SI 15.9 13.7 18.2
SK 3.9 3.4 4.4
FI 23.8 19.9 27.7
SE 25.0 18.4 31.9
UK 15.8 14.0 17.5
LI 25.9 22.8 29.0
NO 18.2 17.1 19.2
CH 29.9 31.0 28.7
HR 2.3 2.3 2.3
MK 3.4 3.4 3.3
TR 2.9 3.0 2.7
Source: Eurostat (online data code: trng_lfs_01)
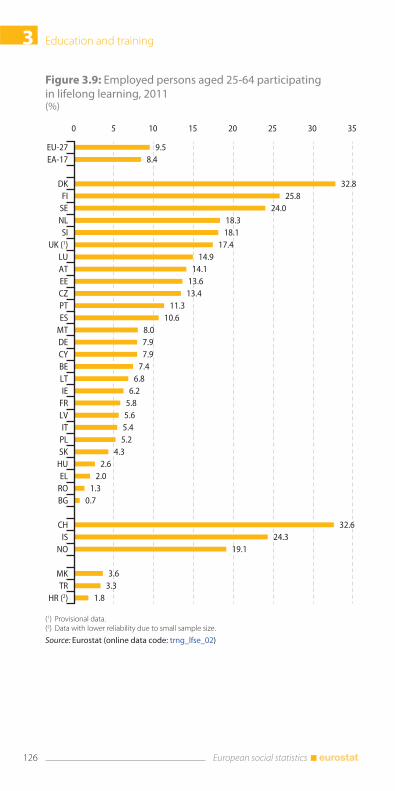
Education and training3
126 European social statistics
Figure 3.9: Employed persons aged 25-64 participating in lifelong learning, 2011(%)
9.58.4
32.825.8
24.018.318.1
17.414.9
14.113.613.4
11.310.6
8.07.97.9
7.46.8
6.25.85.65.45.2
4.32.6
2.01.3
0.7
32.624.3
19.1
3.63.3
1.8
0 5 10 15 20 25 30 35
EU-27EA-17
DKFI
SENLSI
UK (1)LUATEECZPTES
MTDECYBELTIE
FRLVIT
PLSK
HUEL
ROBG
CHIS
NO
MKTR
HR (2)
(1) Provisional data.(2) Data with lower reliability due to small sample size.
Source: Eurostat (online data code: trng_lfse_02)
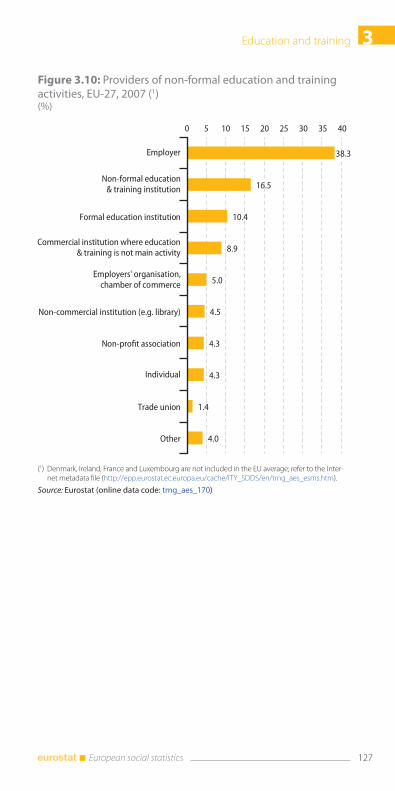
3Education and training
127 European social statistics
Figure 3.10: Providers of non-formal education and training activities, EU-27, 2007 (1)(%)
38.3
16.5
10.4
8.9
5.0
4.5
4.3
4.3
1.4
4.0
0 5 10 15 20 25 30 35 40
Employer
Formal education institution
Employers' organisation,chamber of commerce
Non-commercial institution (e.g. library)
Non-profit association
Individual
Trade union
Other
Non-formal education& training institution
Commercial institution where education& training is not main activity
(1) Denmark, Ireland, France and Luxembourg are not included in the EU average; refer to the Inter-net metadata file (http://epp.eurostat.ec.europa.eu/cache/ITY_SDDS/en/trng_aes_esms.htm).
Source: Eurostat (online data code: trng_aes_170)
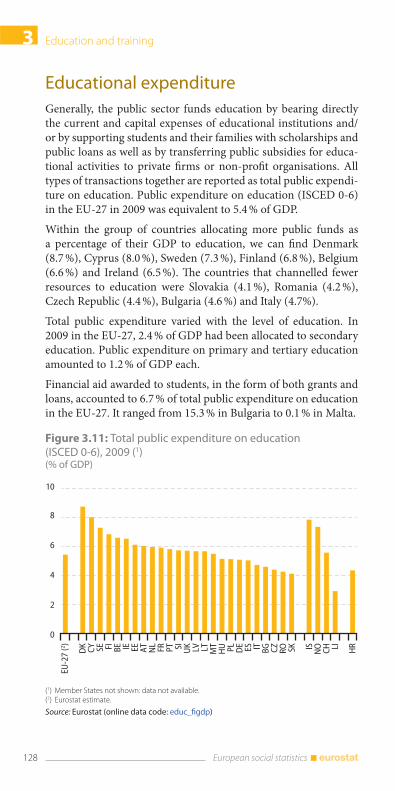
Education and training3
128 European social statistics
Educational expenditure
Generally, the public sector funds education by bearing directly
the current and capital expenses of educational institutions and/
or by supporting students and their families with scholarships and
public loans as well as by transferring public subsidies for educa-
tional activities to private firms or non-profit organisations. All
types of transactions together are reported as total public expendi-
ture on education. Public expenditure on education (ISCED 0-6)
in the EU-27 in 2009 was equivalent to 5.4 % of GDP.
Within the group of countries allocating more public funds as
a percentage of their GDP to education, we can find Denmark
(8.7 %), Cyprus (8.0 %), Sweden (7.3 %), Finland (6.8 %), Belgium
(6.6 %) and Ireland (6.5 %). The countries that channelled fewer
resources to education were Slovakia (4.1 %), Romania (4.2 %),
Czech Republic (4.4 %), Bulgaria (4.6 %) and Italy (4.7%).
Total public expenditure varied with the level of education. In
2009 in the EU-27, 2.4 % of GDP had been allocated to secondary
education. Public expenditure on primary and tertiary education
amounted to 1.2 % of GDP each.
Financial aid awarded to students, in the form of both grants and
loans, accounted to 6.7 % of total public expenditure on education
in the EU-27. It ranged from 15.3 % in Bulgaria to 0.1 % in Malta.
Figure 3.11: Total public expenditure on education (ISCED 0-6), 2009 (1)(% of GDP)
0
2
4
6
8
10
EU-2
7 (2 )
DK CY SE FI BE IE EE AT NL FR PT SI UK LV LT MT
HU PL DE ES IT BG CZ RO SK IS NO CH LI HR
(1) Member States not shown: data not available.(2) Eurostat estimate.
Source: Eurostat (online data code: educ_figdp)
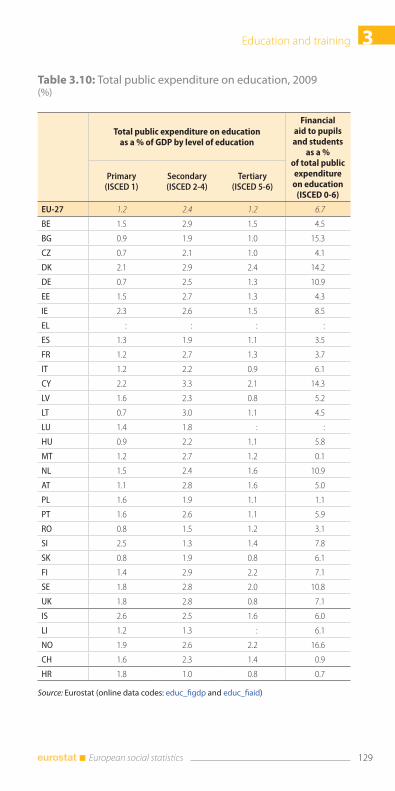
3Education and training
129 European social statistics
Table 3.10: Total public expenditure on education, 2009(%)
Total public expenditure on education as a % of GDP by level of education
Financial aid to pupils and students
as a % of total public expenditure on education
(ISCED 0-6)
Primary (ISCED 1)
Secondary (ISCED 2-4)
Tertiary (ISCED 5-6)
EU-27 1.2 2.4 1.2 6.7
BE 1.5 2.9 1.5 4.5
BG 0.9 1.9 1.0 15.3
CZ 0.7 2.1 1.0 4.1
DK 2.1 2.9 2.4 14.2
DE 0.7 2.5 1.3 10.9
EE 1.5 2.7 1.3 4.3
IE 2.3 2.6 1.5 8.5
EL : : : :
ES 1.3 1.9 1.1 3.5
FR 1.2 2.7 1.3 3.7
IT 1.2 2.2 0.9 6.1
CY 2.2 3.3 2.1 14.3
LV 1.6 2.3 0.8 5.2
LT 0.7 3.0 1.1 4.5
LU 1.4 1.8 : :
HU 0.9 2.2 1.1 5.8
MT 1.2 2.7 1.2 0.1
NL 1.5 2.4 1.6 10.9
AT 1.1 2.8 1.6 5.0
PL 1.6 1.9 1.1 1.1
PT 1.6 2.6 1.1 5.9
RO 0.8 1.5 1.2 3.1
SI 2.5 1.3 1.4 7.8
SK 0.8 1.9 0.8 6.1
FI 1.4 2.9 2.2 7.1
SE 1.8 2.8 2.0 10.8
UK 1.8 2.8 0.8 7.1
IS 2.6 2.5 1.6 6.0
LI 1.2 1.3 : 6.1
NO 1.9 2.6 2.2 16.6
CH 1.6 2.3 1.4 0.9
HR 1.8 1.0 0.8 0.7
Source: Eurostat (online data codes: educ_figdp and educ_fiaid)

4Labour Market
Labour market issues are at the heart of the social and political
debate. Labour market statistics cover a wide range of subjects, in-
cluding employment and unemployment, quality of work, labour
costs and earnings, job vacancies, and labour market policies. A
large share of Eurostat’s labour market statistics is based on the
results of the following major statistical surveys:
EU Labour Force Survey, which is the main data source of informa-
tion concerning the situation and trends within the labour market
in the EU and provides a wealth of information on employment
and unemployment, working time (full-time or part-time work),
and types of contracts (temporary or permanent contracts);
Structure of Earnings Survey, which provides detailed informa-
tion on the relationship between the level of earnings, individu-
al characteristics of employees and their employer;
Labour Cost Survey, which provides detailed data on the struc-
ture and the level of labour costs, hours worked and hours paid.
Other labour market data such as those on job vacancies, gross
and net earnings, minimum wages and labour market policies are
gathered through a variety of other data collections.
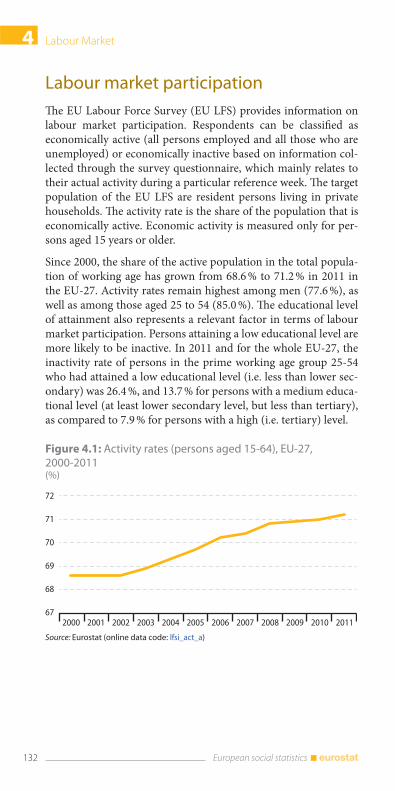
Labour Market4
132 European social statistics
Labour market participation
The EU Labour Force Survey (EU LFS) provides information on
labour market participation. Respondents can be classified as
economically active (all persons employed and all those who are
unemployed) or economically inactive based on information col-
lected through the survey questionnaire, which mainly relates to
their actual activity during a particular reference week. The target
population of the EU LFS are resident persons living in private
households. The activity rate is the share of the population that is
economically active. Economic activity is measured only for per-
sons aged 15 years or older.
Since 2000, the share of the active population in the total popula-
tion of working age has grown from 68.6 % to 71.2 % in 2011 in
the EU-27. Activity rates remain highest among men (77.6 %), as
well as among those aged 25 to 54 (85.0 %). The educational level
of attainment also represents a relevant factor in terms of labour
market participation. Persons attaining a low educational level are
more likely to be inactive. In 2011 and for the whole EU-27, the
inactivity rate of persons in the prime working age group 25-54
who had attained a low educational level (i.e. less than lower sec-
ondary) was 26.4 %, and 13.7 % for persons with a medium educa-
tional level (at least lower secondary level, but less than tertiary),
as compared to 7.9 % for persons with a high (i.e. tertiary) level.
Figure 4.1: Activity rates (persons aged 15-64), EU-27, 2000-2011(%)
67
68
69
70
71
72
2000 2001 2002 2003 2004 2005 2006 2007 2008 2009 2010 2011
Source: Eurostat (online data code: lfsi_act_a)
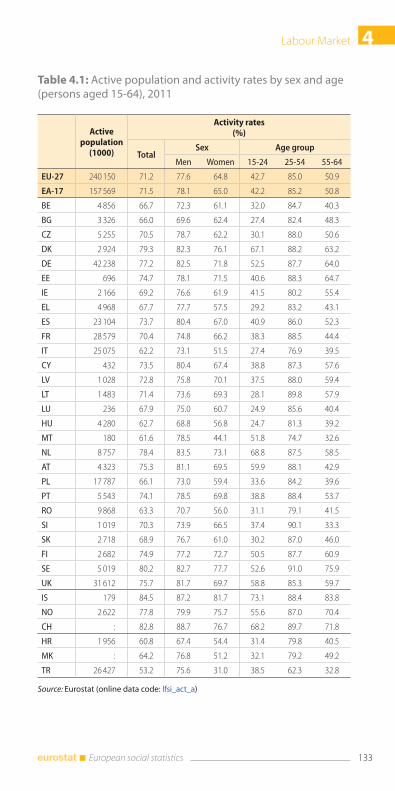
4Labour Market
133 European social statistics
Table 4.1: Active population and activity rates by sex and age (persons aged 15-64), 2011
Active population
(1000)
Activity rates(%)
TotalSex Age group
Men Women 15-24 25-54 55-64
EU-27 240 150 71.2 77.6 64.8 42.7 85.0 50.9
EA-17 157 569 71.5 78.1 65.0 42.2 85.2 50.8
BE 4 856 66.7 72.3 61.1 32.0 84.7 40.3
BG 3 326 66.0 69.6 62.4 27.4 82.4 48.3
CZ 5 255 70.5 78.7 62.2 30.1 88.0 50.6
DK 2 924 79.3 82.3 76.1 67.1 88.2 63.2
DE 42 238 77.2 82.5 71.8 52.5 87.7 64.0
EE 696 74.7 78.1 71.5 40.6 88.3 64.7
IE 2 166 69.2 76.6 61.9 41.5 80.2 55.4
EL 4 968 67.7 77.7 57.5 29.2 83.2 43.1
ES 23 104 73.7 80.4 67.0 40.9 86.0 52.3
FR 28 579 70.4 74.8 66.2 38.3 88.5 44.4
IT 25 075 62.2 73.1 51.5 27.4 76.9 39.5
CY 432 73.5 80.4 67.4 38.8 87.3 57.6
LV 1 028 72.8 75.8 70.1 37.5 88.0 59.4
LT 1 483 71.4 73.6 69.3 28.1 89.8 57.9
LU 236 67.9 75.0 60.7 24.9 85.6 40.4
HU 4 280 62.7 68.8 56.8 24.7 81.3 39.2
MT 180 61.6 78.5 44.1 51.8 74.7 32.6
NL 8 757 78.4 83.5 73.1 68.8 87.5 58.5
AT 4 323 75.3 81.1 69.5 59.9 88.1 42.9
PL 17 787 66.1 73.0 59.4 33.6 84.2 39.6
PT 5 543 74.1 78.5 69.8 38.8 88.4 53.7
RO 9 868 63.3 70.7 56.0 31.1 79.1 41.5
SI 1 019 70.3 73.9 66.5 37.4 90.1 33.3
SK 2 718 68.9 76.7 61.0 30.2 87.0 46.0
FI 2 682 74.9 77.2 72.7 50.5 87.7 60.9
SE 5 019 80.2 82.7 77.7 52.6 91.0 75.9
UK 31 612 75.7 81.7 69.7 58.8 85.3 59.7
IS 179 84.5 87.2 81.7 73.1 88.4 83.8
NO 2 622 77.8 79.9 75.7 55.6 87.0 70.4
CH : 82.8 88.7 76.7 68.2 89.7 71.8
HR 1 956 60.8 67.4 54.4 31.4 79.8 40.5
MK : 64.2 76.8 51.2 32.1 79.2 49.2
TR 26 427 53.2 75.6 31.0 38.5 62.3 32.8
Source: Eurostat (online data code: lfsi_act_a)
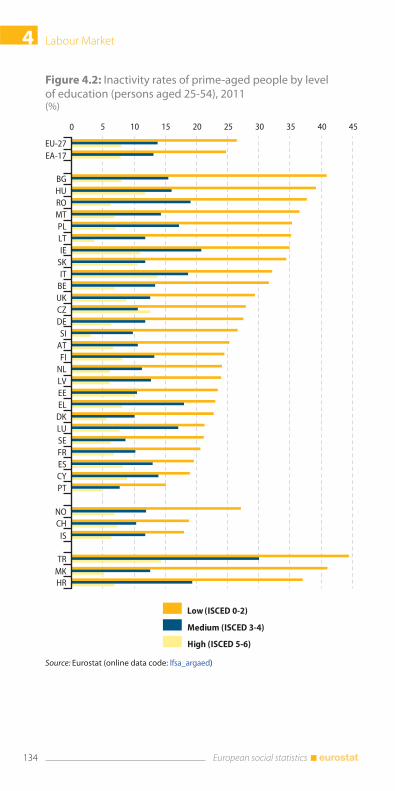
Labour Market4
134 European social statistics
Figure 4.2: Inactivity rates of prime-aged people by level of education (persons aged 25-54), 2011(%)
0 5 10 15 20 25 30 35 40 45
EU-27EA-17
BGHUROMTPLLTIE
SKIT
BEUKCZDESI
ATFI
NLLVEEEL
DKLUSEFRESCYPT
NOCH
IS
TRMKHR
Low (ISCED 0-2)
Medium (ISCED 3-4)
High (ISCED 5-6)
Source: Eurostat (online data code: lfsa_argaed)
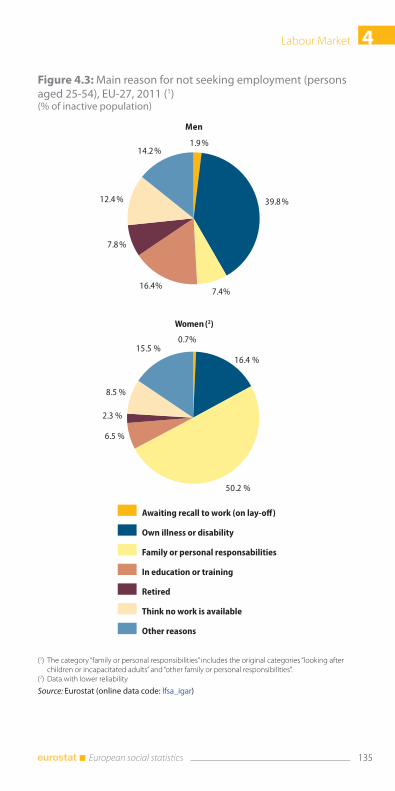
4Labour Market
135 European social statistics
Figure 4.3: Main reason for not seeking employment (persons aged 25-54), EU-27, 2011 (1)(% of inactive population)
1.9 %
39.8 %
7.4%16.4%
7.8 %
12.4 %
14.2 %
Men
0.7%
16.4 %
50.2 %
6.5 %
2.3 %
8.5 %
15.5 %
Women (2)
Awaiting recall to work (on lay-off)
Own illness or disability
Family or personal responsabilities
In education or training
Retired
Think no work is available
Other reasons
(1) The category “family or personal responsibilities” includes the original categories “looking after children or incapacitated adults” and “other family or personal responsibilities”.
(2) Data with lower reliability
Source: Eurostat (online data code: lfsa_igar)
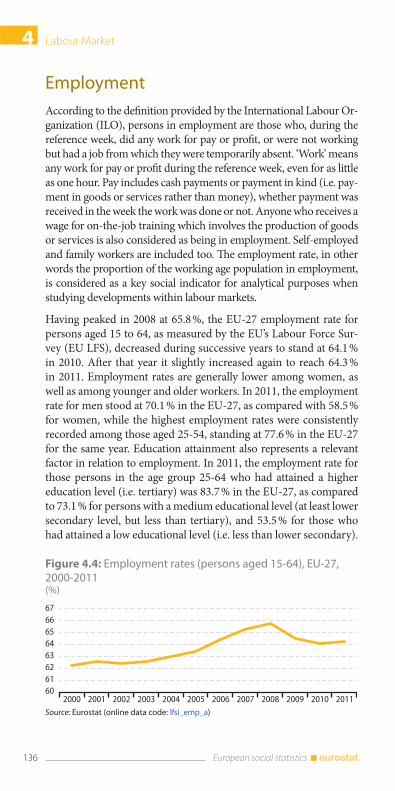
Labour Market4
136 European social statistics
Employment
According to the definition provided by the International Labour Or-
ganization (ILO), persons in employment are those who, during the
reference week, did any work for pay or profit, or were not working
but had a job from which they were temporarily absent. ‘Work’ means
any work for pay or profit during the reference week, even for as little
as one hour. Pay includes cash payments or payment in kind (i.e. pay-
ment in goods or services rather than money), whether payment was
received in the week the work was done or not. Anyone who receives a
wage for on-the-job training which involves the production of goods
or services is also considered as being in employment. Self-employed
and family workers are included too. The employment rate, in other
words the proportion of the working age population in employment,
is considered as a key social indicator for analytical purposes when
studying developments within labour markets.
Having peaked in 2008 at 65.8 %, the EU-27 employment rate for
persons aged 15 to 64, as measured by the EU’s Labour Force Sur-
vey (EU LFS), decreased during successive years to stand at 64.1 %
in 2010. After that year it slightly increased again to reach 64.3 %
in 2011. Employment rates are generally lower among women, as
well as among younger and older workers. In 2011, the employment
rate for men stood at 70.1 % in the EU-27, as compared with 58.5 %
for women, while the highest employment rates were consistently
recorded among those aged 25-54, standing at 77.6 % in the EU-27
for the same year. Education attainment also represents a relevant
factor in relation to employment. In 2011, the employment rate for
those persons in the age group 25-64 who had attained a higher
education level (i.e. tertiary) was 83.7 % in the EU-27, as compared
to 73.1 % for persons with a medium educational level (at least lower
secondary level, but less than tertiary), and 53.5 % for those who
had attained a low educational level (i.e. less than lower secondary).
Figure 4.4: Employment rates (persons aged 15-64), EU-27, 2000-2011(%)
6061626364656667
2000 2001 2002 2003 2004 2005 2006 2007 2008 2009 2010 2011Source: Eurostat (online data code: lfsi_emp_a)
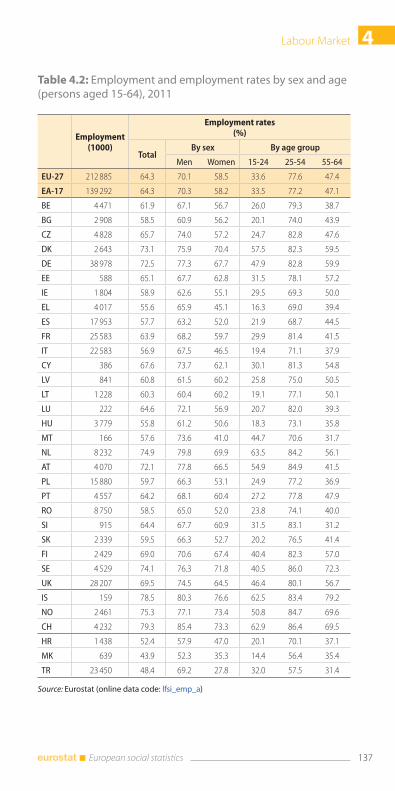
4Labour Market
137 European social statistics
Table 4.2: Employment and employment rates by sex and age (persons aged 15-64), 2011
Employment(1000)
Employment rates (%)
TotalBy sex By age group
Men Women 15-24 25-54 55-64
EU-27 212 885 64.3 70.1 58.5 33.6 77.6 47.4
EA-17 139 292 64.3 70.3 58.2 33.5 77.2 47.1
BE 4 471 61.9 67.1 56.7 26.0 79.3 38.7
BG 2 908 58.5 60.9 56.2 20.1 74.0 43.9
CZ 4 828 65.7 74.0 57.2 24.7 82.8 47.6
DK 2 643 73.1 75.9 70.4 57.5 82.3 59.5
DE 38 978 72.5 77.3 67.7 47.9 82.8 59.9
EE 588 65.1 67.7 62.8 31.5 78.1 57.2
IE 1 804 58.9 62.6 55.1 29.5 69.3 50.0
EL 4 017 55.6 65.9 45.1 16.3 69.0 39.4
ES 17 953 57.7 63.2 52.0 21.9 68.7 44.5
FR 25 583 63.9 68.2 59.7 29.9 81.4 41.5
IT 22 583 56.9 67.5 46.5 19.4 71.1 37.9
CY 386 67.6 73.7 62.1 30.1 81.3 54.8
LV 841 60.8 61.5 60.2 25.8 75.0 50.5
LT 1 228 60.3 60.4 60.2 19.1 77.1 50.1
LU 222 64.6 72.1 56.9 20.7 82.0 39.3
HU 3 779 55.8 61.2 50.6 18.3 73.1 35.8
MT 166 57.6 73.6 41.0 44.7 70.6 31.7
NL 8 232 74.9 79.8 69.9 63.5 84.2 56.1
AT 4 070 72.1 77.8 66.5 54.9 84.9 41.5
PL 15 880 59.7 66.3 53.1 24.9 77.2 36.9
PT 4 557 64.2 68.1 60.4 27.2 77.8 47.9
RO 8 750 58.5 65.0 52.0 23.8 74.1 40.0
SI 915 64.4 67.7 60.9 31.5 83.1 31.2
SK 2 339 59.5 66.3 52.7 20.2 76.5 41.4
FI 2 429 69.0 70.6 67.4 40.4 82.3 57.0
SE 4 529 74.1 76.3 71.8 40.5 86.0 72.3
UK 28 207 69.5 74.5 64.5 46.4 80.1 56.7
IS 159 78.5 80.3 76.6 62.5 83.4 79.2
NO 2 461 75.3 77.1 73.4 50.8 84.7 69.6
CH 4 232 79.3 85.4 73.3 62.9 86.4 69.5
HR 1 438 52.4 57.9 47.0 20.1 70.1 37.1
MK 639 43.9 52.3 35.3 14.4 56.4 35.4
TR 23 450 48.4 69.2 27.8 32.0 57.5 31.4
Source: Eurostat (online data code: lfsi_emp_a)
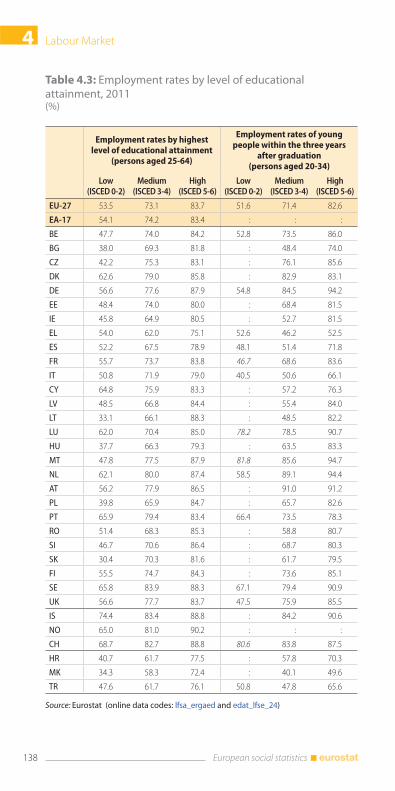
Labour Market4
138 European social statistics
Table 4.3: Employment rates by level of educational attainment, 2011(%)
Employment rates by highest level of educational attainment
(persons aged 25-64)
Employment rates of young people within the three years
after graduation(persons aged 20-34)
Low(ISCED 0-2)
Medium(ISCED 3-4)
High(ISCED 5-6)
Low(ISCED 0-2)
Medium(ISCED 3-4)
High(ISCED 5-6)
EU-27 53.5 73.1 83.7 51.6 71.4 82.6
EA-17 54.1 74.2 83.4 : : :
BE 47.7 74.0 84.2 52.8 73.5 86.0
BG 38.0 69.3 81.8 : 48.4 74.0
CZ 42.2 75.3 83.1 : 76.1 85.6
DK 62.6 79.0 85.8 : 82.9 83.1
DE 56.6 77.6 87.9 54.8 84.5 94.2
EE 48.4 74.0 80.0 : 68.4 81.5
IE 45.8 64.9 80.5 : 52.7 81.5
EL 54.0 62.0 75.1 52.6 46.2 52.5
ES 52.2 67.5 78.9 48.1 51.4 71.8
FR 55.7 73.7 83.8 46.7 68.6 83.6
IT 50.8 71.9 79.0 40.5 50.6 66.1
CY 64.8 75.9 83.3 : 57.2 76.3
LV 48.5 66.8 84.4 : 55.4 84.0
LT 33.1 66.1 88.3 : 48.5 82.2
LU 62.0 70.4 85.0 78.2 78.5 90.7
HU 37.7 66.3 79.3 : 63.5 83.3
MT 47.8 77.5 87.9 81.8 85.6 94.7
NL 62.1 80.0 87.4 58.5 89.1 94.4
AT 56.2 77.9 86.5 : 91.0 91.2
PL 39.8 65.9 84.7 : 65.7 82.6
PT 65.9 79.4 83.4 66.4 73.5 78.3
RO 51.4 68.3 85.3 : 58.8 80.7
SI 46.7 70.6 86.4 : 68.7 80.3
SK 30.4 70.3 81.6 : 61.7 79.5
FI 55.5 74.7 84.3 : 73.6 85.1
SE 65.8 83.9 88.3 67.1 79.4 90.9
UK 56.6 77.7 83.7 47.5 75.9 85.5
IS 74.4 83.4 88.8 : 84.2 90.6
NO 65.0 81.0 90.2 : : :
CH 68.7 82.7 88.8 80.6 83.8 87.5
HR 40.7 61.7 77.5 : 57.8 70.3
MK 34.3 58.3 72.4 : 40.1 49.6
TR 47.6 61.7 76.1 50.8 47.8 65.6
Source: Eurostat (online data codes: lfsa_ergaed and edat_lfse_24)
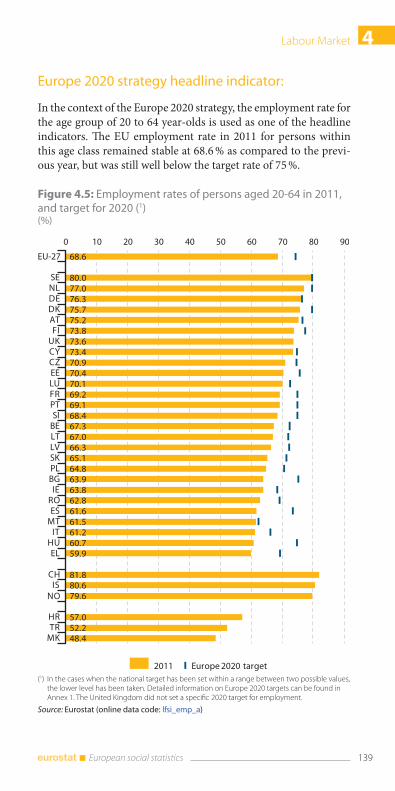
4Labour Market
139 European social statistics
Europe 2020 strategy headline indicator:
In the context of the Europe 2020 strategy, the employment rate for
the age group of 20 to 64 year-olds is used as one of the headline
indicators. The EU employment rate in 2011 for persons within
this age class remained stable at 68.6 % as compared to the previ-
ous year, but was still well below the target rate of 75 %.
Figure 4.5: Employment rates of persons aged 20-64 in 2011, and target for 2020 (1)(%)
68.6
80.077.076.375.775.273.873.673.470.970.470.169.269.168.467.367.066.365.164.863.963.862.861.661.561.260.759.9
81.880.679.6
57.052.248.4
0 10 20 30 40 50 60 70 80 90
SENLDEDKATFI
UKCYCZEELUFRPTSI
BELTLVSKPLBGIE
ROES
MTIT
HUEL
CHIS
NO
HRTR
MK
EU-27
2011 Europe 2020 target (1) In the cases when the national target has been set within a range between two possible values,
the lower level has been taken. Detailed information on Europe 2020 targets can be found in Annex 1. The United Kingdom did not set a specific 2020 target for employment.
Source: Eurostat (online data code: lfsi_emp_a)
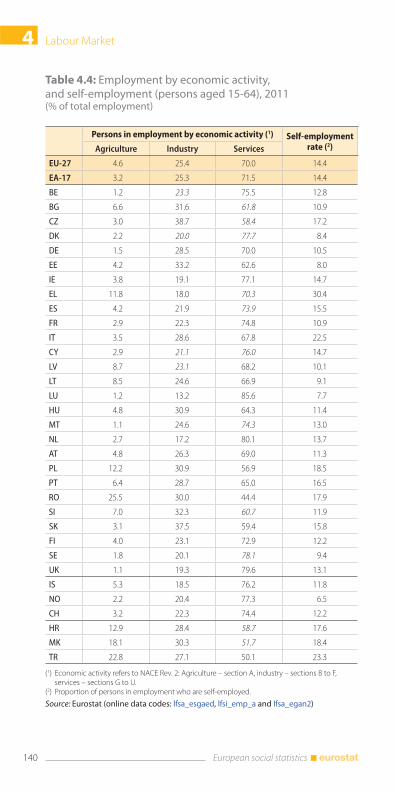
Labour Market4
140 European social statistics
Table 4.4: Employment by economic activity, and self-employment (persons aged 15-64), 2011(% of total employment)
Persons in employment by economic activity (1) Self-employment rate (2)Agriculture Industry Services
EU-27 4.6 25.4 70.0 14.4
EA-17 3.2 25.3 71.5 14.4
BE 1.2 23.3 75.5 12.8
BG 6.6 31.6 61.8 10.9
CZ 3.0 38.7 58.4 17.2
DK 2.2 20.0 77.7 8.4
DE 1.5 28.5 70.0 10.5
EE 4.2 33.2 62.6 8.0
IE 3.8 19.1 77.1 14.7
EL 11.8 18.0 70.3 30.4
ES 4.2 21.9 73.9 15.5
FR 2.9 22.3 74.8 10.9
IT 3.5 28.6 67.8 22.5
CY 2.9 21.1 76.0 14.7
LV 8.7 23.1 68.2 10.1
LT 8.5 24.6 66.9 9.1
LU 1.2 13.2 85.6 7.7
HU 4.8 30.9 64.3 11.4
MT 1.1 24.6 74.3 13.0
NL 2.7 17.2 80.1 13.7
AT 4.8 26.3 69.0 11.3
PL 12.2 30.9 56.9 18.5
PT 6.4 28.7 65.0 16.5
RO 25.5 30.0 44.4 17.9
SI 7.0 32.3 60.7 11.9
SK 3.1 37.5 59.4 15.8
FI 4.0 23.1 72.9 12.2
SE 1.8 20.1 78.1 9.4
UK 1.1 19.3 79.6 13.1
IS 5.3 18.5 76.2 11.8
NO 2.2 20.4 77.3 6.5
CH 3.2 22.3 74.4 12.2
HR 12.9 28.4 58.7 17.6
MK 18.1 30.3 51.7 18.4
TR 22.8 27.1 50.1 23.3
(1) Economic activity refers to NACE Rev. 2: Agriculture – section A, industry – sections B to F, services – sections G to U.
(2) Proportion of persons in employment who are self-employed.
Source: Eurostat (online data codes: lfsa_esgaed, lfsi_emp_a and lfsa_egan2)
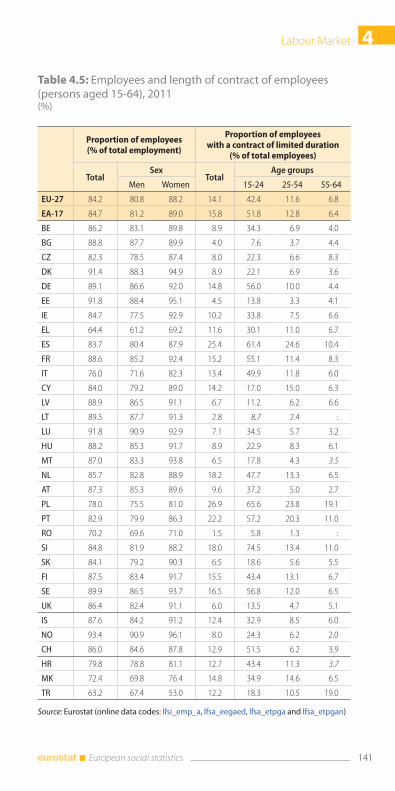
4Labour Market
141 European social statistics
Table 4.5: Employees and length of contract of employees (persons aged 15-64), 2011(%)
Proportion of employees(% of total employment)
Proportion of employees with a contract of limited duration
(% of total employees)
Total Sex
TotalAge groups
Men Women 15-24 25-54 55-64
EU-27 84.2 80.8 88.2 14.1 42.4 11.6 6.8
EA-17 84.7 81.2 89.0 15.8 51.8 12.8 6.4
BE 86.2 83.1 89.8 8.9 34.3 6.9 4.0
BG 88.8 87.7 89.9 4.0 7.6 3.7 4.4
CZ 82.3 78.5 87.4 8.0 22.3 6.6 8.3
DK 91.4 88.3 94.9 8.9 22.1 6.9 3.6
DE 89.1 86.6 92.0 14.8 56.0 10.0 4.4
EE 91.8 88.4 95.1 4.5 13.8 3.3 4.1
IE 84.7 77.5 92.9 10.2 33.8 7.5 6.6
EL 64.4 61.2 69.2 11.6 30.1 11.0 6.7
ES 83.7 80.4 87.9 25.4 61.4 24.6 10.4
FR 88.6 85.2 92.4 15.2 55.1 11.4 8.3
IT 76.0 71.6 82.3 13.4 49.9 11.8 6.0
CY 84.0 79.2 89.0 14.2 17.0 15.0 6.3
LV 88.9 86.5 91.1 6.7 11.2 6.2 6.6
LT 89.5 87.7 91.3 2.8 8.7 2.4 :
LU 91.8 90.9 92.9 7.1 34.5 5.7 3.2
HU 88.2 85.3 91.7 8.9 22.9 8.3 6.1
MT 87.0 83.3 93.8 6.5 17.8 4.3 3.5
NL 85.7 82.8 88.9 18.2 47.7 13.3 6.5
AT 87.3 85.3 89.6 9.6 37.2 5.0 2.7
PL 78.0 75.5 81.0 26.9 65.6 23.8 19.1
PT 82.9 79.9 86.3 22.2 57.2 20.3 11.0
RO 70.2 69.6 71.0 1.5 5.8 1.3 :
SI 84.8 81.9 88.2 18.0 74.5 13.4 11.0
SK 84.1 79.2 90.3 6.5 18.6 5.6 5.5
FI 87.5 83.4 91.7 15.5 43.4 13.1 6.7
SE 89.9 86.5 93.7 16.5 56.8 12.0 6.5
UK 86.4 82.4 91.1 6.0 13.5 4.7 5.1
IS 87.6 84.2 91.2 12.4 32.9 8.5 6.0
NO 93.4 90.9 96.1 8.0 24.3 6.2 2.0
CH 86.0 84.6 87.8 12.9 51.5 6.2 3.9
HR 79.8 78.8 81.1 12.7 43.4 11.3 3.7
MK 72.4 69.8 76.4 14.8 34.9 14.6 6.5
TR 63.2 67.4 53.0 12.2 18.3 10.5 19.0
Source: Eurostat (online data codes: lfsi_emp_a, lfsa_eegaed, lfsa_etpga and lfsa_etpgan)
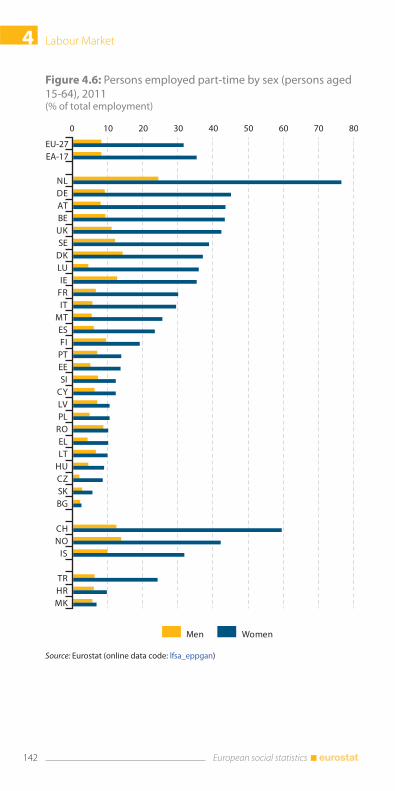
Labour Market4
142 European social statistics
Figure 4.6: Persons employed part-time by sex (persons aged 15-64), 2011(% of total employment)
0 10 20 30 40 50 60 70 80
NLDEATBEUKSE
DKLUIE
FRIT
MTESFI
PTEESI
CYLVPL
ROELLT
HUCZSKBG
CHNO
IS
TRHRMK
Men Women
EU-27EA-17
Source: Eurostat (online data code: lfsa_eppgan)
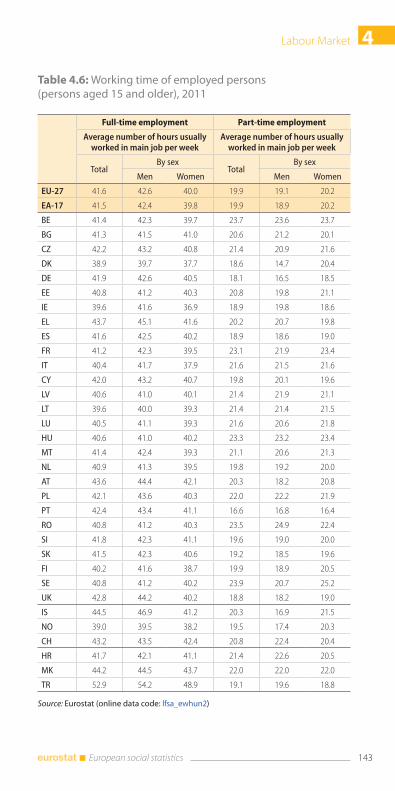
4Labour Market
143 European social statistics
Table 4.6: Working time of employed persons (persons aged 15 and older), 2011
Full-time employment Part-time employment
Average number of hours usually worked in main job per week
Average number of hours usually worked in main job per week
TotalBy sex
TotalBy sex
Men Women Men Women
EU-27 41.6 42.6 40.0 19.9 19.1 20.2
EA-17 41.5 42.4 39.8 19.9 18.9 20.2
BE 41.4 42.3 39.7 23.7 23.6 23.7
BG 41.3 41.5 41.0 20.6 21.2 20.1
CZ 42.2 43.2 40.8 21.4 20.9 21.6
DK 38.9 39.7 37.7 18.6 14.7 20.4
DE 41.9 42.6 40.5 18.1 16.5 18.5
EE 40.8 41.2 40.3 20.8 19.8 21.1
IE 39.6 41.6 36.9 18.9 19.8 18.6
EL 43.7 45.1 41.6 20.2 20.7 19.8
ES 41.6 42.5 40.2 18.9 18.6 19.0
FR 41.2 42.3 39.5 23.1 21.9 23.4
IT 40.4 41.7 37.9 21.6 21.5 21.6
CY 42.0 43.2 40.7 19.8 20.1 19.6
LV 40.6 41.0 40.1 21.4 21.9 21.1
LT 39.6 40.0 39.3 21.4 21.4 21.5
LU 40.5 41.1 39.3 21.6 20.6 21.8
HU 40.6 41.0 40.2 23.3 23.2 23.4
MT 41.4 42.4 39.3 21.1 20.6 21.3
NL 40.9 41.3 39.5 19.8 19.2 20.0
AT 43.6 44.4 42.1 20.3 18.2 20.8
PL 42.1 43.6 40.3 22.0 22.2 21.9
PT 42.4 43.4 41.1 16.6 16.8 16.4
RO 40.8 41.2 40.3 23.5 24.9 22.4
SI 41.8 42.3 41.1 19.6 19.0 20.0
SK 41.5 42.3 40.6 19.2 18.5 19.6
FI 40.2 41.6 38.7 19.9 18.9 20.5
SE 40.8 41.2 40.2 23.9 20.7 25.2
UK 42.8 44.2 40.2 18.8 18.2 19.0
IS 44.5 46.9 41.2 20.3 16.9 21.5
NO 39.0 39.5 38.2 19.5 17.4 20.3
CH 43.2 43.5 42.4 20.8 22.4 20.4
HR 41.7 42.1 41.1 21.4 22.6 20.5
MK 44.2 44.5 43.7 22.0 22.0 22.0
TR 52.9 54.2 48.9 19.1 19.6 18.8
Source: Eurostat (online data code: lfsa_ewhun2)
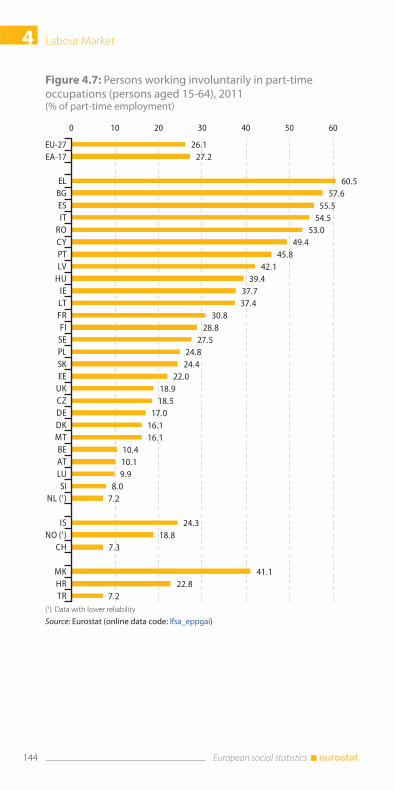
Labour Market4
144 European social statistics
Figure 4.7: Persons working involuntarily in part-time occupations (persons aged 15-64), 2011(% of part-time employment)
26.127.2
60.557.6
55.554.5
53.049.4
45.842.1
39.437.737.4
30.828.8
27.524.824.4
22.018.918.5
17.016.116.1
10.410.19.9
8.07.2
24.318.8
7.3
41.122.8
7.2
0 10 20 30 40 50 60
ELBGESIT
ROCYPTLV
HUIELTFRFISEPLSKEE
UKCZDEDKMTBEATLUSI
NL (1)
ISNO (1)
CH
MKHRTR
EU-27EA-17
(1) Data with lower reliability
Source: Eurostat (online data code: lfsa_eppgai)
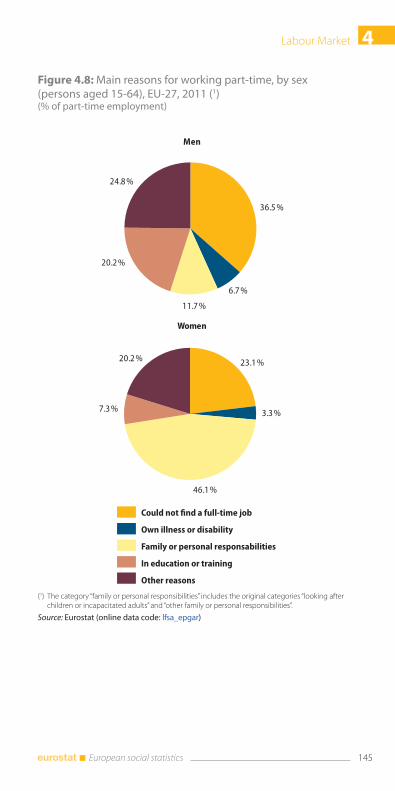
4Labour Market
145 European social statistics
Figure 4.8: Main reasons for working part-time, by sex (persons aged 15-64), EU-27, 2011 (1)(% of part-time employment)
36.5 %
6.7 %
11.7 %
20.2 %
24.8 %
23.1 %
3.3 %
46.1 %
7.3 %
20.2 %
Men
Women
Other reasons
Could not find a full-time job
Own illness or disability
Family or personal responsabilities
In education or training
(1) The category “family or personal responsibilities” includes the original categories “looking after children or incapacitated adults” and “other family or personal responsibilities”.
Source: Eurostat (online data code: lfsa_epgar)
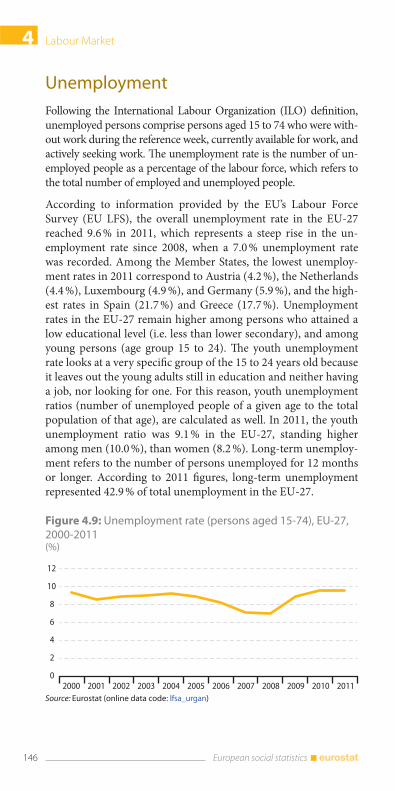
Labour Market4
146 European social statistics
Unemployment
Following the International Labour Organization (ILO) definition,
unemployed persons comprise persons aged 15 to 74 who were with-
out work during the reference week, currently available for work, and
actively seeking work. The unemployment rate is the number of un-
employed people as a percentage of the labour force, which refers to
the total number of employed and unemployed people.
According to information provided by the EU’s Labour Force
Survey (EU LFS), the overall unemployment rate in the EU-27
reached 9.6 % in 2011, which represents a steep rise in the un-
employment rate since 2008, when a 7.0 % unemployment rate
was recorded. Among the Member States, the lowest unemploy-
ment rates in 2011 correspond to Austria (4.2 %), the Netherlands
(4.4 %), Luxembourg (4.9 %), and Germany (5.9 %), and the high-
est rates in Spain (21.7 %) and Greece (17.7 %). Unemployment
rates in the EU-27 remain higher among persons who attained a
low educational level (i.e. less than lower secondary), and among
young persons (age group 15 to 24). The youth unemployment
rate looks at a very specific group of the 15 to 24 years old because
it leaves out the young adults still in education and neither having
a job, nor looking for one. For this reason, youth unemployment
ratios (number of unemployed people of a given age to the total
population of that age), are calculated as well. In 2011, the youth
unemployment ratio was 9.1 % in the EU-27, standing higher
among men (10.0 %), than women (8.2 %). Long-term unemploy-
ment refers to the number of persons unemployed for 12 months
or longer. According to 2011 figures, long-term unemployment
represented 42.9 % of total unemployment in the EU-27.
Figure 4.9: Unemployment rate (persons aged 15-74), EU-27, 2000-2011(%)
0
2
4
6
8
10
12
2000 2001 2002 2003 2004 2005 2006 2007 2008 2009 2010 2011Source: Eurostat (online data code: lfsa_urgan)
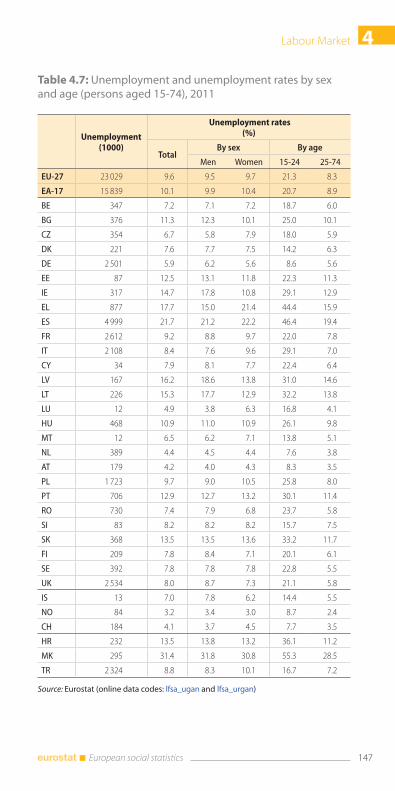
4Labour Market
147 European social statistics
Table 4.7: Unemployment and unemployment rates by sex and age (persons aged 15-74), 2011
Unemployment(1000)
Unemployment rates(%)
TotalBy sex By age
Men Women 15-24 25-74
EU-27 23 029 9.6 9.5 9.7 21.3 8.3
EA-17 15 839 10.1 9.9 10.4 20.7 8.9
BE 347 7.2 7.1 7.2 18.7 6.0
BG 376 11.3 12.3 10.1 25.0 10.1
CZ 354 6.7 5.8 7.9 18.0 5.9
DK 221 7.6 7.7 7.5 14.2 6.3
DE 2 501 5.9 6.2 5.6 8.6 5.6
EE 87 12.5 13.1 11.8 22.3 11.3
IE 317 14.7 17.8 10.8 29.1 12.9
EL 877 17.7 15.0 21.4 44.4 15.9
ES 4 999 21.7 21.2 22.2 46.4 19.4
FR 2 612 9.2 8.8 9.7 22.0 7.8
IT 2 108 8.4 7.6 9.6 29.1 7.0
CY 34 7.9 8.1 7.7 22.4 6.4
LV 167 16.2 18.6 13.8 31.0 14.6
LT 226 15.3 17.7 12.9 32.2 13.8
LU 12 4.9 3.8 6.3 16.8 4.1
HU 468 10.9 11.0 10.9 26.1 9.8
MT 12 6.5 6.2 7.1 13.8 5.1
NL 389 4.4 4.5 4.4 7.6 3.8
AT 179 4.2 4.0 4.3 8.3 3.5
PL 1 723 9.7 9.0 10.5 25.8 8.0
PT 706 12.9 12.7 13.2 30.1 11.4
RO 730 7.4 7.9 6.8 23.7 5.8
SI 83 8.2 8.2 8.2 15.7 7.5
SK 368 13.5 13.5 13.6 33.2 11.7
FI 209 7.8 8.4 7.1 20.1 6.1
SE 392 7.8 7.8 7.8 22.8 5.5
UK 2 534 8.0 8.7 7.3 21.1 5.8
IS 13 7.0 7.8 6.2 14.4 5.5
NO 84 3.2 3.4 3.0 8.7 2.4
CH 184 4.1 3.7 4.5 7.7 3.5
HR 232 13.5 13.8 13.2 36.1 11.2
MK 295 31.4 31.8 30.8 55.3 28.5
TR 2 324 8.8 8.3 10.1 16.7 7.2
Source: Eurostat (online data codes: lfsa_ugan and lfsa_urgan)
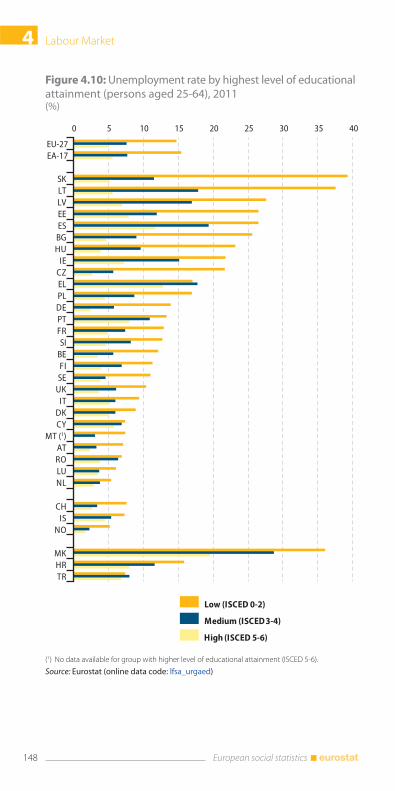
Labour Market4
148 European social statistics
Figure 4.10: Unemployment rate by highest level of educational attainment (persons aged 25-64), 2011(%)
0 5 10 15 20 25 30 35 40
SKLTLVEEESBGHU
IECZELPLDEPTFRSI
BEFISE
UKIT
DKCY
MT (1)ATROLUNL
CHIS
NO
MKHRTR
EU-27EA-17
Low (ISCED 0-2)
Medium (ISCED 3-4)
High (ISCED 5-6)
(1) No data available for group with higher level of educational attainment (ISCED 5-6).
Source: Eurostat (online data code: lfsa_urgaed)
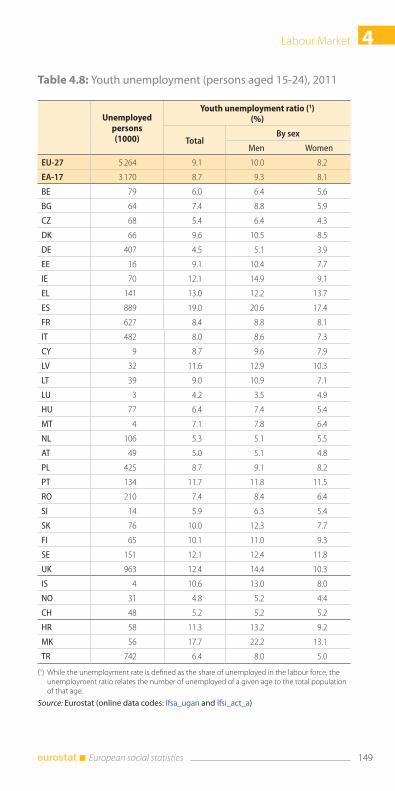
4Labour Market
149 European social statistics
Table 4.8: Youth unemployment (persons aged 15-24), 2011
Unemployed persons(1000)
Youth unemployment ratio (1)(%)
TotalBy sex
Men Women
EU-27 5 264 9.1 10.0 8.2
EA-17 3 170 8.7 9.3 8.1
BE 79 6.0 6.4 5.6
BG 64 7.4 8.8 5.9
CZ 68 5.4 6.4 4.3
DK 66 9.6 10.5 8.5
DE 407 4.5 5.1 3.9
EE 16 9.1 10.4 7.7
IE 70 12.1 14.9 9.1
EL 141 13.0 12.2 13.7
ES 889 19.0 20.6 17.4
FR 627 8.4 8.8 8.1
IT 482 8.0 8.6 7.3
CY 9 8.7 9.6 7.9
LV 32 11.6 12.9 10.3
LT 39 9.0 10.9 7.1
LU 3 4.2 3.5 4.9
HU 77 6.4 7.4 5.4
MT 4 7.1 7.8 6.4
NL 106 5.3 5.1 5.5
AT 49 5.0 5.1 4.8
PL 425 8.7 9.1 8.2
PT 134 11.7 11.8 11.5
RO 210 7.4 8.4 6.4
SI 14 5.9 6.3 5.4
SK 76 10.0 12.3 7.7
FI 65 10.1 11.0 9.3
SE 151 12.1 12.4 11.8
UK 963 12.4 14.4 10.3
IS 4 10.6 13.0 8.0
NO 31 4.8 5.2 4.4
CH 48 5.2 5.2 5.2
HR 58 11.3 13.2 9.2
MK 56 17.7 22.2 13.1
TR 742 6.4 8.0 5.0
(1) While the unemployment rate is defined as the share of unemployed in the labour force, the unemployment ratio relates the number of unemployed of a given age to the total population of that age.
Source: Eurostat (online data codes: lfsa_ugan and lfsi_act_a)
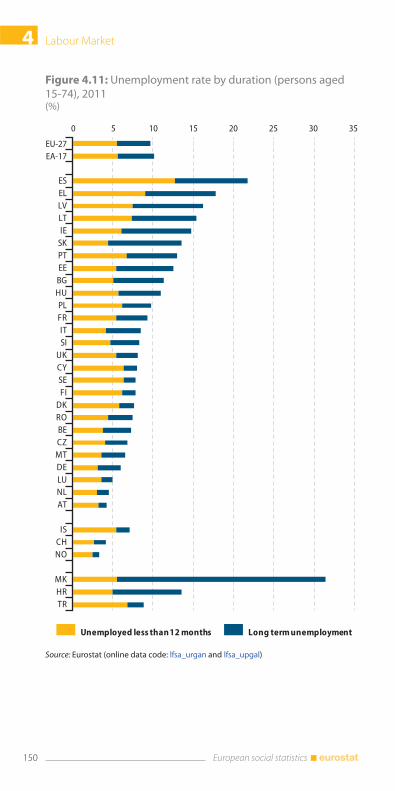
Labour Market4
150 European social statistics
Figure 4.11: Unemployment rate by duration (persons aged 15-74), 2011(%)
0 5 10 15 20 25 30 35
ESELLVLTIE
SKPTEEBGHUPLFRITSI
UKCYSEFI
DKROBECZMTDELUNLAT
ISCHNO
MKHRTR
EU-27EA-17
Unemployed less than 12 months Long term unemployment
Source: Eurostat (online data code: lfsa_urgan and lfsa_upgal)
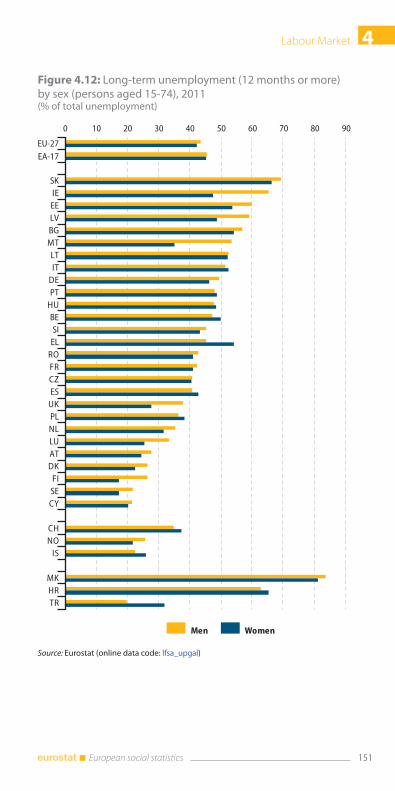
4Labour Market
151 European social statistics
Figure 4.12: Long-term unemployment (12 months or more) by sex (persons aged 15-74), 2011(% of total unemployment)
0 10 20 30 40 50 60 70 80 90
SKIEEELVBGMTLTIT
DEPT
HUBESI
ELROFRCZES
UKPLNLLUATDK
FISECY
CHNO
IS
MKHRTR
EU-27EA-17
Men Women
Source: Eurostat (online data code: lfsa_upgal)
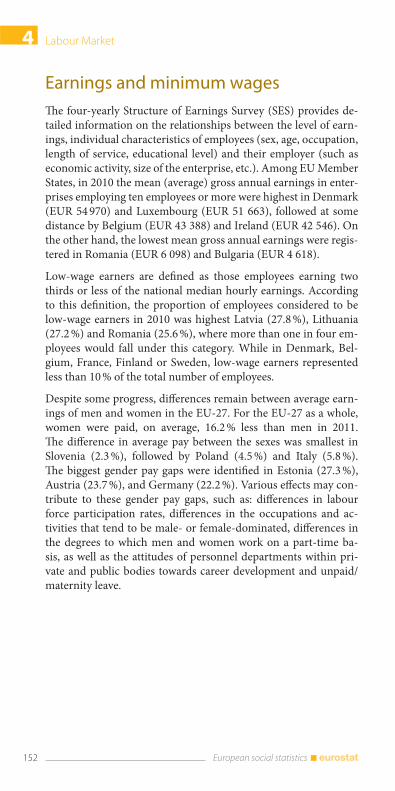
Labour Market4
152 European social statistics
Earnings and minimum wages
The four-yearly Structure of Earnings Survey (SES) provides de-
tailed information on the relationships between the level of earn-
ings, individual characteristics of employees (sex, age, occupation,
length of service, educational level) and their employer (such as
economic activity, size of the enterprise, etc.). Among EU Member
States, in 2010 the mean (average) gross annual earnings in enter-
prises employing ten employees or more were highest in Denmark
(EUR 54 970) and Luxembourg (EUR 51 663), followed at some
distance by Belgium (EUR 43 388) and Ireland (EUR 42 546). On
the other hand, the lowest mean gross annual earnings were regis-
tered in Romania (EUR 6 098) and Bulgaria (EUR 4 618).
Low-wage earners are defined as those employees earning two
thirds or less of the national median hourly earnings. According
to this definition, the proportion of employees considered to be
low-wage earners in 2010 was highest Latvia (27.8 %), Lithuania
(27.2 %) and Romania (25.6 %), where more than one in four em-
ployees would fall under this category. While in Denmark, Bel-
gium, France, Finland or Sweden, low-wage earners represented
less than 10 % of the total number of employees.
Despite some progress, differences remain between average earn-
ings of men and women in the EU-27. For the EU-27 as a whole,
women were paid, on average, 16.2 % less than men in 2011.
The difference in average pay between the sexes was smallest in
Slovenia (2.3 %), followed by Poland (4.5 %) and Italy (5.8 %).
The biggest gender pay gaps were identified in Estonia (27.3 %),
Austria (23.7 %), and Germany (22.2 %). Various effects may con-
tribute to these gender pay gaps, such as: differences in labour
force participation rates, differences in the occupations and ac-
tivities that tend to be male- or female-dominated, differences in
the degrees to which men and women work on a part-time ba-
sis, as well as the attitudes of personnel departments within pri-
vate and public bodies towards career development and unpaid/
maternity leave.
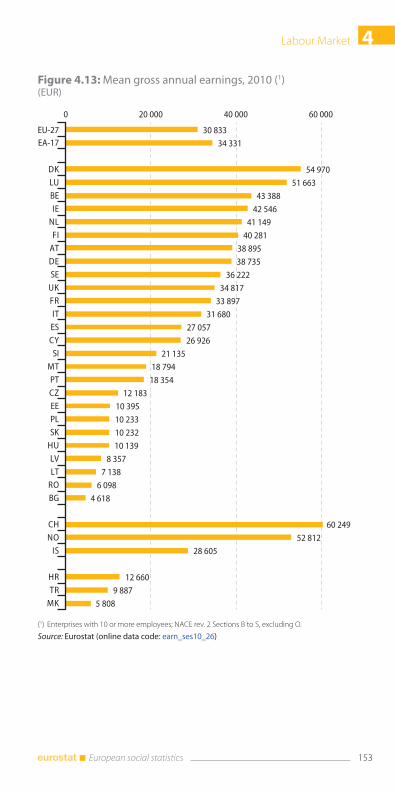
4Labour Market
153 European social statistics
Figure 4.13: Mean gross annual earnings, 2010 (1)(EUR)
30 833
34 331
54 970
51 663
43 388
42 546
41 149
40 281
38 895
38 735
36 222
34 817
33 897
31 680
27 057
26 926
21 135
18 794
18 354
12 183
10 395
10 233
10 232
10 139
8 357
7 138
6 098
4 618
60 249
52 812
28 605
12 660
9 887
5 808
0 20 000 40 000 60 000
DK
LU
BE
IE
NL
FI
AT
DE
SE
UK
FR
IT
ES
CY
SI
MT
PT
CZ
EE
PL
SK
HU
LV
LT
RO
BG
CH
NO
IS
HR
TR
MK
EU-27EA-17
(1) Enterprises with 10 or more employees; NACE rev. 2 Sections B to S, excluding O.
Source: Eurostat (online data code: earn_ses10_26)
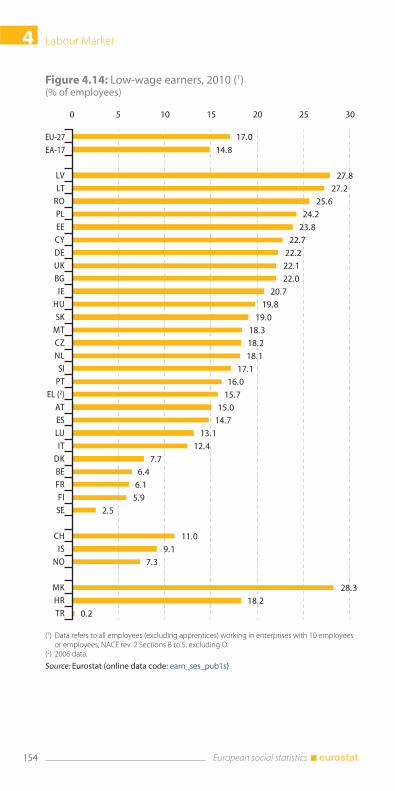
Labour Market4
154 European social statistics
Figure 4.14: Low-wage earners, 2010 (1)(% of employees)
17.014.8
27.827.2
25.624.2
23.822.7
22.222.122.0
20.719.8
19.018.318.218.1
17.116.0
15.715.0
14.713.1
12.47.7
6.46.1
5.92.5
11.09.1
7.3
28.318.2
0.2
0 5 10 15 20 25 30
LVLT
ROPLEECYDEUKBGIE
HUSK
MTCZNL
SIPT
EL (2)ATESLUIT
DKBEFRFISE
CHIS
NO
MKHRTR
EU-27EA-17
(1) Data refers to all employees (excluding apprentices) working in enterprises with 10 employees or employees; NACE rev. 2 Sections B to S, excluding O.
(2) 2006 data.
Source: Eurostat (online data code: earn_ses_pub1s)
4Labour Market
155 European social statistics
Table 4.9: Median gross hourly earnings of employees by educational attainment, 2010 (1)(EUR)
Total
By educational level
Low(ISCED 0-2)
Medium(ISCED 3-4)
High(ISCED 5-6)
EU-27 11.9 9.6 11.3 16.3
EA-17 13.2 9.8 13.3 18.6
BE 16.4 14.0 15.1 23.2
BG 1.5 1.1 1.3 2.3
CZ 4.4 3.2 4.3 6.6
DK 25.0 21.0 23.5 28.6
DE 15.4 9.8 15.1 25.0
EE 4.1 2.9 3.5 5.5
IE 18.3 15.0 16.5 22.9
EL (2) 7.7 6.5 6.8 10.1
ES 9.4 7.8 9.1 13.5
FR 13.7 11.4 12.6 17.6
IT 11.9 10.0 12.7 19.5
CY 9.4 8.0 7.6 15.3
LV 2.9 2.1 2.4 4.3
LT 2.7 1.9 2.0 3.8
LU 17.8 13.5 16.9 26.9
HU 3.4 2.5 3.2 5.5
MT 7.5 6.1 7.7 10.9
NL 15.3 11.5 14.9 21.4
AT 13.0 9.8 13.0 19.2
PL 4.0 2.8 3.4 6.9
PT 5.1 4.1 5.3 11.8
RO 2.0 1.3 1.7 3.3
SI 7.2 5.2 6.6 12.3
SK 3.9 2.6 3.7 5.6
FI 16.0 14.1 14.3 19.0
SE 14.9 13.7 14.3 15.9
UK 12.6 9.9 10.5 16.4
IS 10.0 8.4 10.1 11.9
NO 25.0 20.4 24.2 29.2
CH 22.4 16.4 21.1 32.4
HR 4.8 3.5 4.4 7.5
MK 2.5 1.6 2.0 3.3
TR 2.1 1.9 2.2 4.5
(1) Data refers to all employees (excluding apprentices) working in enterprises with 10 employees or employees; NACE rev. 2 Sections B to S, excluding O.
(2) 2006 data.
Source: Eurostat (online data code: earn_ses_pub2i)
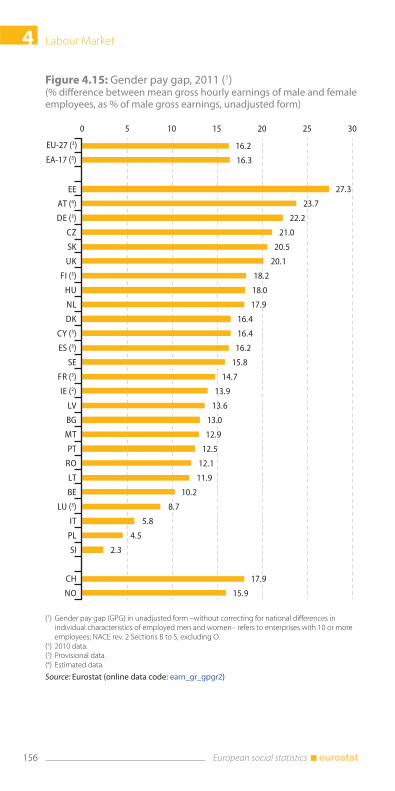
Labour Market4
156 European social statistics
Figure 4.15: Gender pay gap, 2011 (1)(% difference between mean gross hourly earnings of male and female employees, as % of male gross earnings, unadjusted form)
16.2
16.3
27.3
23.7
22.2
21.0
20.5
20.1
18.2
18.0
17.9
16.4
16.4
16.2
15.8
14.7
13.9
13.6
13.0
12.9
12.5
12.1
11.9
10.2
8.7
5.8
4.5
2.3
17.9
15.9
0 5 10 15 20 25 30
EE
AT (4)
DE (3)
CZ
SK
UK
FI (3)
HU
NL
DK
CY (3)
ES (3)
SE
FR (3)
IE (2)
LV
BG
MT
PT
RO
LT
BE
LU (3)
IT
PL
SI
CH
NO
EU-27 (3)
EA-17 (3)
(1) Gender pay gap (GPG) in unadjusted form –without correcting for national differences in individual characteristics of employed men and women– refers to enterprises with 10 or more employees; NACE rev. 2 Sections B to S, excluding O.
(2) 2010 data.(3) Provisional data.(4) Estimated data.
Source: Eurostat (online data code: earn_gr_gpgr2)
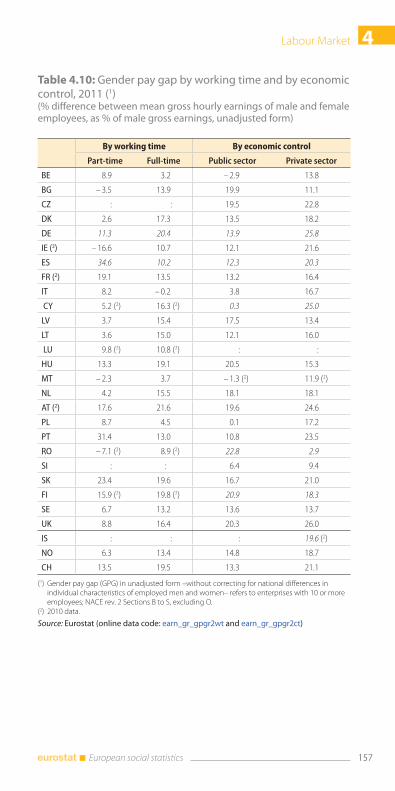
4Labour Market
157 European social statistics
Table 4.10: Gender pay gap by working time and by economic control, 2011 (1)(% difference between mean gross hourly earnings of male and female employees, as % of male gross earnings, unadjusted form)
By working time By economic control
Part-time Full-time Public sector Private sector
BE 8.9 3.2 – 2.9 13.8
BG – 3.5 13.9 19.9 11.1
CZ : : 19.5 22.8
DK 2.6 17.3 13.5 18.2
DE 11.3 20.4 13.9 25.8
IE (2) – 16.6 10.7 12.1 21.6
ES 34.6 10.2 12.3 20.3
FR (2) 19.1 13.5 13.2 16.4
IT 8.2 – 0.2 3.8 16.7
CY 5.2 (2) 16.3 (2) 0.3 25.0
LV 3.7 15.4 17.5 13.4
LT 3.6 15.0 12.1 16.0
LU 9.8 (2) 10.8 (2) : :
HU 13.3 19.1 20.5 15.3
MT – 2.3 3.7 – 1.3 (2) 11.9 (2)
NL 4.2 15.5 18.1 18.1
AT (2) 17.6 21.6 19.6 24.6
PL 8.7 4.5 0.1 17.2
PT 31.4 13.0 10.8 23.5
RO – 7.1 (2) 8.9 (2) 22.8 2.9
SI : : 6.4 9.4
SK 23.4 19.6 16.7 21.0
FI 15.9 (2) 19.8 (2) 20.9 18.3
SE 6.7 13.2 13.6 13.7
UK 8.8 16.4 20.3 26.0
IS : : : 19.6 (2)
NO 6.3 13.4 14.8 18.7
CH 13.5 19.5 13.3 21.1
(1) Gender pay gap (GPG) in unadjusted form –without correcting for national differences in individual characteristics of employed men and women– refers to enterprises with 10 or more employees; NACE rev. 2 Sections B to S, excluding O.
(2) 2010 data.
Source: Eurostat (online data code: earn_gr_gpgr2wt and earn_gr_gpgr2ct)
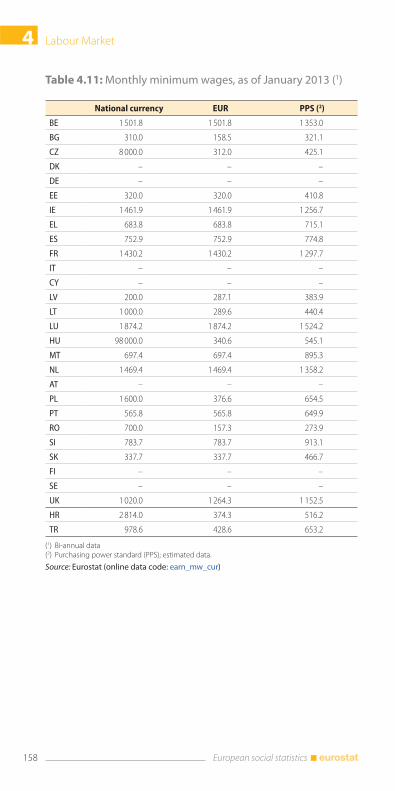
Labour Market4
158 European social statistics
Table 4.11: Monthly minimum wages, as of January 2013 (1)
National currency EUR PPS (2)
BE 1 501.8 1 501.8 1 353.0
BG 310.0 158.5 321.1
CZ 8 000.0 312.0 425.1
DK – – –
DE – – –
EE 320.0 320.0 410.8
IE 1 461.9 1 461.9 1 256.7
EL 683.8 683.8 715.1
ES 752.9 752.9 774.8
FR 1 430.2 1 430.2 1 297.7
IT – – –
CY – – –
LV 200.0 287.1 383.9
LT 1 000.0 289.6 440.4
LU 1 874.2 1 874.2 1 524.2
HU 98 000.0 340.6 545.1
MT 697.4 697.4 895.3
NL 1 469.4 1 469.4 1 358.2
AT – – –
PL 1 600.0 376.6 654.5
PT 565.8 565.8 649.9
RO 700.0 157.3 273.9
SI 783.7 783.7 913.1
SK 337.7 337.7 466.7
FI – – –
SE – – –
UK 1 020.0 1 264.3 1 152.5
HR 2 814.0 374.3 516.2
TR 978.6 428.6 653.2
(1) Bi-annual data(2) Purchasing power standard (PPS); estimated data.
Source: Eurostat (online data code: earn_mw_cur)
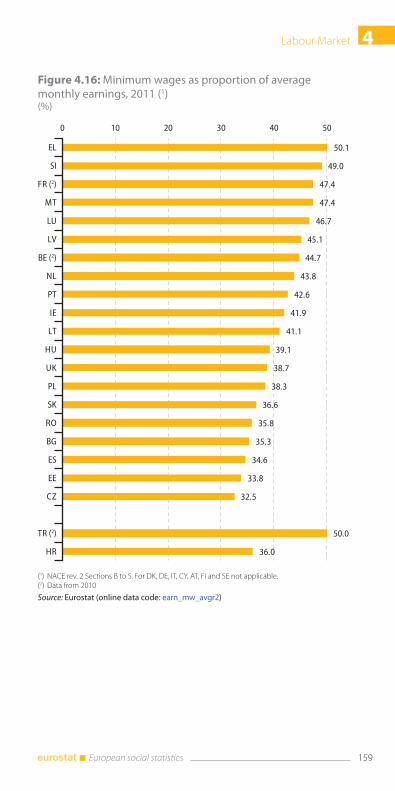
4Labour Market
159 European social statistics
Figure 4.16: Minimum wages as proportion of average monthly earnings, 2011 (1)(%)
50.1
49.0
47.4
47.4
46.7
45.1
44.7
43.8
42.6
41.9
41.1
39.1
38.7
38.3
36.6
35.8
35.3
34.6
33.8
32.5
50.0
36.0
0 10 20 30 40 50
EL
SI
FR (2)
MT
LU
LV
BE (2)
NL
PT
IE
LT
HU
UK
PL
SK
RO
BG
ES
EE
CZ
TR (2)
HR
(1) NACE rev. 2 Sections B to S. For DK, DE, IT, CY, AT, FI and SE not applicable. (2) Data from 2010
Source: Eurostat (online data code: earn_mw_avgr2)
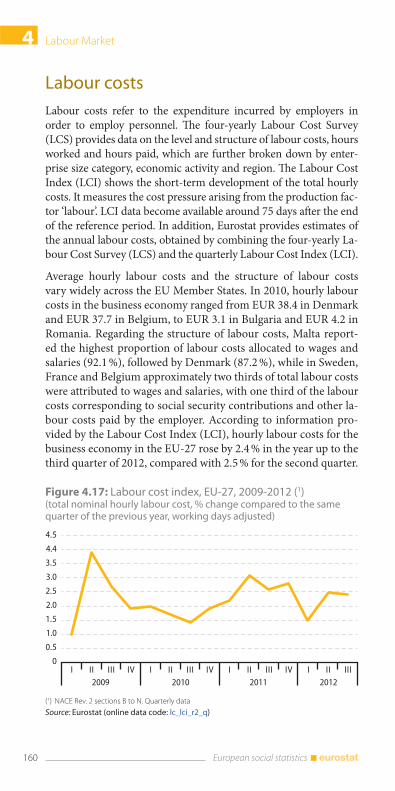
Labour Market4
160 European social statistics
Labour costs
Labour costs refer to the expenditure incurred by employers in
order to employ personnel. The four-yearly Labour Cost Survey
(LCS) provides data on the level and structure of labour costs, hours
worked and hours paid, which are further broken down by enter-
prise size category, economic activity and region. The Labour Cost
Index (LCI) shows the short-term development of the total hourly
costs. It measures the cost pressure arising from the production fac-
tor ‘labour’. LCI data become available around 75 days after the end
of the reference period. In addition, Eurostat provides estimates of
the annual labour costs, obtained by combining the four-yearly La-
bour Cost Survey (LCS) and the quarterly Labour Cost Index (LCI).
Average hourly labour costs and the structure of labour costs
vary widely across the EU Member States. In 2010, hourly labour
costs in the business economy ranged from EUR 38.4 in Denmark
and EUR 37.7 in Belgium, to EUR 3.1 in Bulgaria and EUR 4.2 in
Romania. Regarding the structure of labour costs, Malta report-
ed the highest proportion of labour costs allocated to wages and
salaries (92.1 %), followed by Denmark (87.2 %), while in Sweden,
France and Belgium approximately two thirds of total labour costs
were attributed to wages and salaries, with one third of the labour
costs corresponding to social security contributions and other la-
bour costs paid by the employer. According to information pro-
vided by the Labour Cost Index (LCI), hourly labour costs for the
business economy in the EU-27 rose by 2.4 % in the year up to the
third quarter of 2012, compared with 2.5 % for the second quarter.
Figure 4.17: Labour cost index, EU-27, 2009-2012 (1)(total nominal hourly labour cost, % change compared to the same quarter of the previous year, working days adjusted)
0
0.5
1.0
1.5
2.0
2.5
3.0
3.5
4.4
4.5
I2009 2010 2011 2012
II III IV I II III IV I II III IV I II III
(1) NACE Rev. 2 sections B to N. Quarterly data
Source: Eurostat (online data code: lc_lci_r2_q)
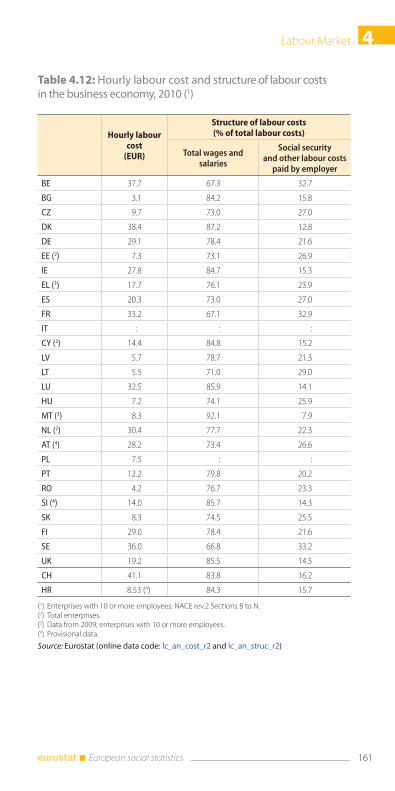
4Labour Market
161 European social statistics
Table 4.12: Hourly labour cost and structure of labour costs in the business economy, 2010 (1)
Hourly labour cost
(EUR)
Structure of labour costs(% of total labour costs)
Total wages and salaries
Social security and other labour costs
paid by employer
BE 37.7 67.3 32.7
BG 3.1 84.2 15.8
CZ 9.7 73.0 27.0
DK 38.4 87.2 12.8
DE 29.1 78.4 21.6
EE (2) 7.3 73.1 26.9
IE 27.8 84.7 15.3
EL (3) 17.7 76.1 23.9
ES 20.3 73.0 27.0
FR 33.2 67.1 32.9
IT : : :
CY (2) 14.4 84.8 15.2
LV 5.7 78.7 21.3
LT 5.5 71.0 29.0
LU 32.5 85.9 14.1
HU 7.2 74.1 25.9
MT (3) 8.3 92.1 7.9
NL (2) 30.4 77.7 22.3
AT (4) 28.2 73.4 26.6
PL 7.5 : :
PT 12.2 79.8 20.2
RO 4.2 76.7 23.3
SI (4) 14.0 85.7 14.3
SK 8.3 74.5 25.5
FI 29.0 78.4 21.6
SE 36.0 66.8 33.2
UK 19.2 85.5 14.5
CH 41.1 83.8 16.2
HR 8.53 (4) 84.3 15.7
(1) Enterprises with 10 or more employees; NACE rev.2 Sections B to N.(2) Total enterprises.(3) Data from 2009; enterprises with 10 or more employees.(4) Provisional data.
Source: Eurostat (online data code: lc_an_cost_r2 and lc_an_struc_r2)
Labour Market4
162 European social statistics
Job vacancies
Job vacancy statistics provide information on the demand side of
the labour market. A job vacancy is defined as a paid post that
is newly created, unoccupied, or about to become vacant, a) for
which the employer is taking active steps and is prepared to take
further steps to find a suitable candidate from outside the enter-
prise concerned; and b) which the employer intends to fill either
immediately or within a specific period of time.
Job vacancy statistics are predominantly presented in terms of the
Job Vacancy Rate (JVR), which measures the proportion of total
posts that are vacant. The JVR, in part, reflects the unmet demand
for labour, as well as potential mismatches between the skills and
availability of those who are unemployed and those sought by em-
ployers. Quarterly job vacancy statistics are also used as a short-
term indicator for analysing the business cycle; movements in job
vacancies lead economic activity at peaks and lag at troughs.
In the third quarter of 2012, the job vacancy rate (JVR) for the
EU-27 was 1.4 %. Compared to the previous quarter the JVR
decreased by 0.1 percentage points. Among the Member States,
Malta (3.7 %), Belgium (2.6 %) and Germany (2.3 %) reported
the highest JVR for the same time period, while Cyprus, Latvia,
Poland and Portugal (all 0.4 %) had the lowest. The JVR rose in
six Member States and fell in 13, when compared with the same
quarter of the previous year. Increases were registered for Malta
(0.7 p.p.), Belgium (0.5 p.p.), the Czech Republic, Denmark, Ire-
land and Lithuania (each 0.1 p.p.) while the JVR fell markedly in
Cyprus (0.5 p.p.), followed by Spain and the Netherlands (each
0.3 p.p.).
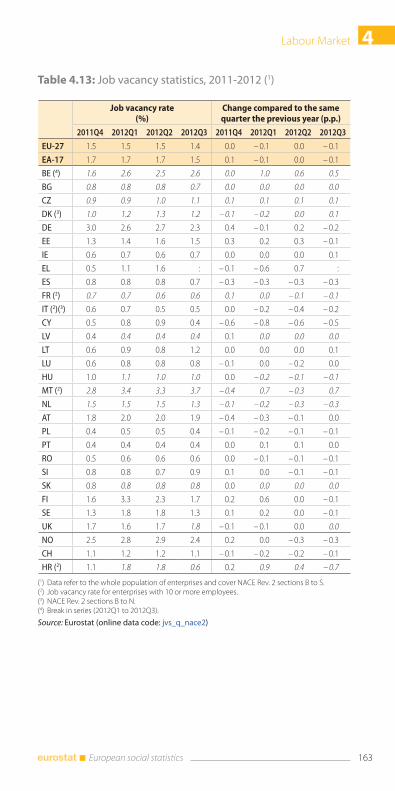
4Labour Market
163 European social statistics
Table 4.13: Job vacancy statistics, 2011-2012 (1)
Job vacancy rate(%)
Change compared to the same quarter the previous year (p.p.)
2011Q4 2012Q1 2012Q2 2012Q3 2011Q4 2012Q1 2012Q2 2012Q3
EU-27 1.5 1.5 1.5 1.4 0.0 – 0.1 0.0 – 0.1
EA-17 1.7 1.7 1.7 1.5 0.1 – 0.1 0.0 – 0.1
BE (4) 1.6 2.6 2.5 2.6 0.0 1.0 0.6 0.5
BG 0.8 0.8 0.8 0.7 0.0 0.0 0.0 0.0
CZ 0.9 0.9 1.0 1.1 0.1 0.1 0.1 0.1
DK (3) 1.0 1.2 1.3 1.2 – 0.1 – 0.2 0.0 0.1
DE 3.0 2.6 2.7 2.3 0.4 – 0.1 0.2 – 0.2
EE 1.3 1.4 1.6 1.5 0.3 0.2 0.3 – 0.1
IE 0.6 0.7 0.6 0.7 0.0 0.0 0.0 0.1
EL 0.5 1.1 1.6 : – 0.1 – 0.6 0.7 :
ES 0.8 0.8 0.8 0.7 – 0.3 – 0.3 – 0.3 – 0.3
FR (2) 0.7 0.7 0.6 0.6 0.1 0.0 – 0.1 – 0.1
IT (2)(3) 0.6 0.7 0.5 0.5 0.0 – 0.2 – 0.4 – 0.2
CY 0.5 0.8 0.9 0.4 – 0.6 – 0.8 – 0.6 – 0.5
LV 0.4 0.4 0.4 0.4 0.1 0.0 0.0 0.0
LT 0.6 0.9 0.8 1.2 0.0 0.0 0.0 0.1
LU 0.6 0.8 0.8 0.8 – 0.1 0.0 – 0.2 0.0
HU 1.0 1.1 1.0 1.0 0.0 – 0.2 – 0.1 – 0.1
MT (2) 2.8 3.4 3.3 3.7 – 0.4 0.7 – 0.3 0.7
NL 1.5 1.5 1.5 1.3 – 0.1 – 0.2 – 0.3 – 0.3
AT 1.8 2.0 2.0 1.9 – 0.4 – 0.3 – 0.1 0.0
PL 0.4 0.5 0.5 0.4 – 0.1 – 0.2 – 0.1 – 0.1
PT 0.4 0.4 0.4 0.4 0.0 0.1 0.1 0.0
RO 0.5 0.6 0.6 0.6 0.0 – 0.1 – 0.1 – 0.1
SI 0.8 0.8 0.7 0.9 0.1 0.0 – 0.1 – 0.1
SK 0.8 0.8 0.8 0.8 0.0 0.0 0.0 0.0
FI 1.6 3.3 2.3 1.7 0.2 0.6 0.0 – 0.1
SE 1.3 1.8 1.8 1.3 0.1 0.2 0.0 – 0.1
UK 1.7 1.6 1.7 1.8 – 0.1 – 0.1 0.0 0.0
NO 2.5 2.8 2.9 2.4 0.2 0.0 – 0.3 – 0.3
CH 1.1 1.2 1.2 1.1 – 0.1 – 0.2 – 0.2 – 0.1
HR (2) 1.1 1.8 1.8 0.6 0.2 0.9 0.4 – 0.7
(1) Data refer to the whole population of enterprises and cover NACE Rev. 2 sections B to S.(2) Job vacancy rate for enterprises with 10 or more employees.(3) NACE Rev. 2 sections B to N.(4) Break in series (2012Q1 to 2012Q3).
Source: Eurostat (online data code: jvs_q_nace2)
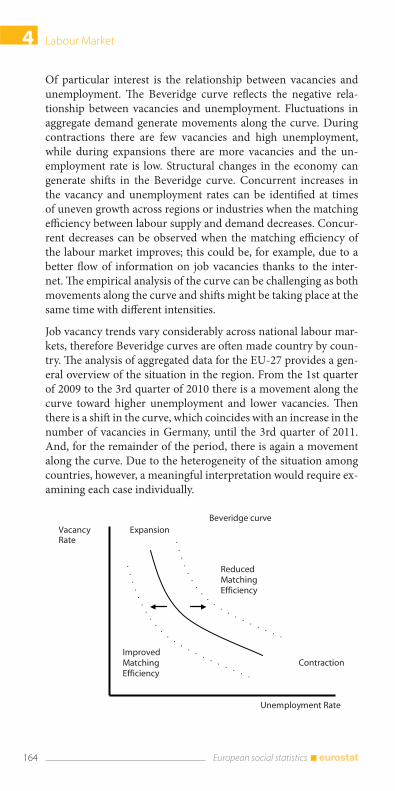
Labour Market4
164 European social statistics
Of particular interest is the relationship between vacancies and
unemployment. The Beveridge curve reflects the negative rela-
tionship between vacancies and unemployment. Fluctuations in
aggregate demand generate movements along the curve. During
contractions there are few vacancies and high unemployment,
while during expansions there are more vacancies and the un-
employment rate is low. Structural changes in the economy can
generate shifts in the Beveridge curve. Concurrent increases in
the vacancy and unemployment rates can be identified at times
of uneven growth across regions or industries when the matching
efficiency between labour supply and demand decreases. Concur-
rent decreases can be observed when the matching efficiency of
the labour market improves; this could be, for example, due to a
better flow of information on job vacancies thanks to the inter-
net. The empirical analysis of the curve can be challenging as both
movements along the curve and shifts might be taking place at the
same time with different intensities.
Job vacancy trends vary considerably across national labour mar-
kets, therefore Beveridge curves are often made country by coun-
try. The analysis of aggregated data for the EU-27 provides a gen-
eral overview of the situation in the region. From the 1st quarter
of 2009 to the 3rd quarter of 2010 there is a movement along the
curve toward higher unemployment and lower vacancies. Then
there is a shift in the curve, which coincides with an increase in the
number of vacancies in Germany, until the 3rd quarter of 2011.
And, for the remainder of the period, there is again a movement
along the curve. Due to the heterogeneity of the situation among
countries, however, a meaningful interpretation would require ex-
amining each case individually.
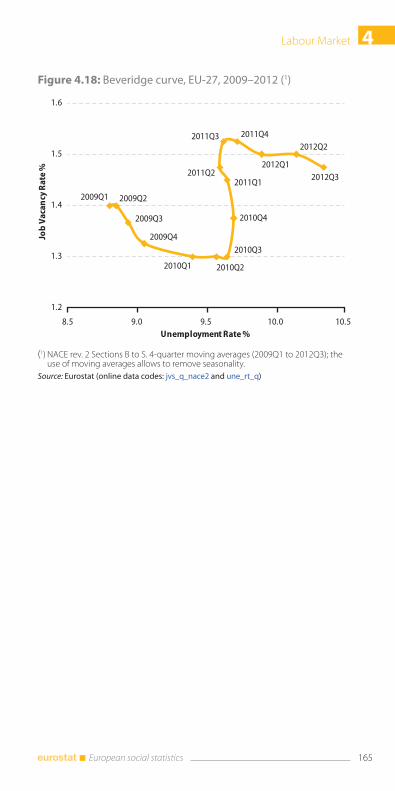
4Labour Market
165 European social statistics
Figure 4.18: Beveridge curve, EU-27, 2009–2012 (1)
2009Q1 2009Q2
2009Q3
2009Q4
2010Q1 2010Q2
2010Q3
2010Q4
2011Q12011Q2
2011Q3 2011Q4
2012Q1
2012Q2
2012Q3
1.2
1.3
1.4
1.5
1.6
8.5 9.0 9.5 10.0 10.5
Job
Va
can
cy R
ate
%
Unemployment Rate %
(1) NACE rev. 2 Sections B to S. 4-quarter moving averages (2009Q1 to 2012Q3); the use of moving averages allows to remove seasonality.
Source: Eurostat (online data codes: jvs_q_nace2 and une_rt_q)
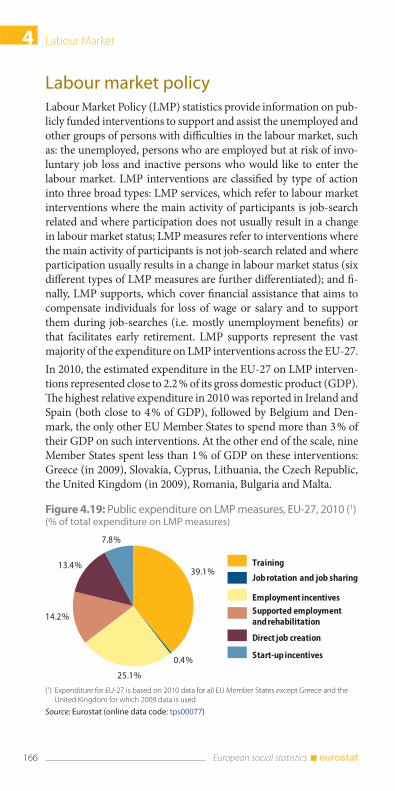
Labour Market4
166 European social statistics
Labour market policyLabour Market Policy (LMP) statistics provide information on pub-
licly funded interventions to support and assist the unemployed and
other groups of persons with difficulties in the labour market, such
as: the unemployed, persons who are employed but at risk of invo-
luntary job loss and inactive persons who would like to enter the
labour market. LMP interventions are classified by type of action
into three broad types: LMP services, which refer to labour market
interventions where the main activity of participants is job-search
related and where participation does not usually result in a change
in labour market status; LMP measures refer to interventions where
the main activity of participants is not job-search related and where
participation usually results in a change in labour market status (six
different types of LMP measures are further differentiated); and fi-
nally, LMP supports, which cover financial assistance that aims to
compensate individuals for loss of wage or salary and to support
them during job-searches (i.e. mostly unemployment benefits) or
that facilitates early retirement. LMP supports represent the vast
majority of the expenditure on LMP interventions across the EU-27.
In 2010, the estimated expenditure in the EU-27 on LMP interven-
tions represented close to 2.2 % of its gross domestic product (GDP).
The highest relative expenditure in 2010 was reported in Ireland and
Spain (both close to 4 % of GDP), followed by Belgium and Den-
mark, the only other EU Member States to spend more than 3 % of
their GDP on such interventions. At the other end of the scale, nine
Member States spent less than 1 % of GDP on these interventions:
Greece (in 2009), Slovakia, Cyprus, Lithuania, the Czech Republic,
the United Kingdom (in 2009), Romania, Bulgaria and Malta.
Figure 4.19: Public expenditure on LMP measures, EU-27, 2010 (1)(% of total expenditure on LMP measures)
39.1 %
0.4 %
25.1 %
14.2 %
13.4 %
7.8 %
Training
Employment incentives
Direct job creation
Job rotation and job sharing
Supported employment and rehabilitation
Start-up incentives
(1) Expenditure for EU-27 is based on 2010 data for all EU Member States except Greece and the United Kingdom for which 2009 data is used.
Source: Eurostat (online data code: tps00077)
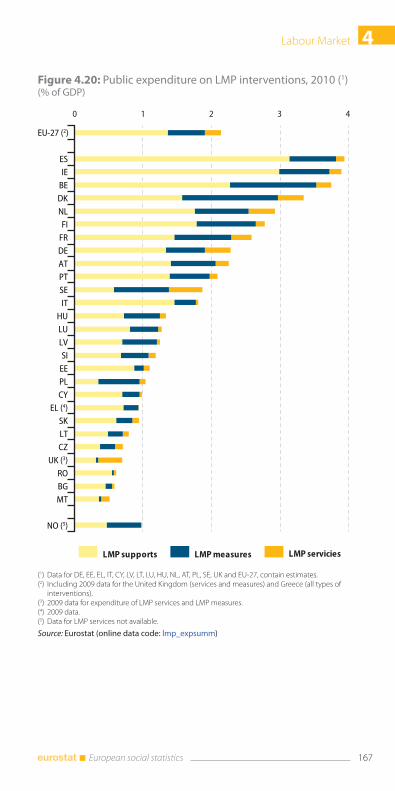
4Labour Market
167 European social statistics
Figure 4.20: Public expenditure on LMP interventions, 2010 (1)(% of GDP)
0 1 2 3 4
ESIE
BE
DKNL
FIFRDE
AT
PTSE
ITHU
LU
LVSI
EE
PLCY
EL (4)SK
LT
CZUK (3)
RO
BGMT
NO (5)
EU-27 (2)
LMP supports LMP measures LMP servicies
(1) Data for DE, EE, EL, IT, CY, LV, LT, LU, HU, NL, AT, PL, SE, UK and EU-27, contain estimates.(2) Including 2009 data for the United Kingdom (services and measures) and Greece (all types of
interventions).(3) 2009 data for expenditure of LMP services and LMP measures.(4) 2009 data.(5) Data for LMP services not available.
Source: Eurostat (online data code: lmp_expsumm)

The demand for statistics on living conditions received a new
impetus following the introduction of the social chapter of the
Amsterdam Treaty (1997) which became the driving force for
social statistics in the European Union (EU). This was reinforced
by successive European Councils that have kept the social di-
mension high on the political agenda.
The European Union strategy – Europe 2020 strategy – for smart,
sustainable and inclusive growth put forward by the European
Commission provides a growth strategy for the coming decade.
A European platform against poverty is one of the seven flagship
initiatives of this strategy. Additionally one of the key objectives
of the Europe 2020 strategy for the whole European Union is to
reduce poverty by aiming to lift at least 20 million people out of
the risk of poverty or social exclusion by 2020.
Eurostat data presented in this chapter aim to show a compre-
hensive picture of the social situation in the EU, covering indi-
cators related to income, poverty and social exclusion, material
deprivation and housing. The main source for these statistics is
the European Union Statistics on Income and Living Conditions
(EU-SILC).
5Income and living conditions
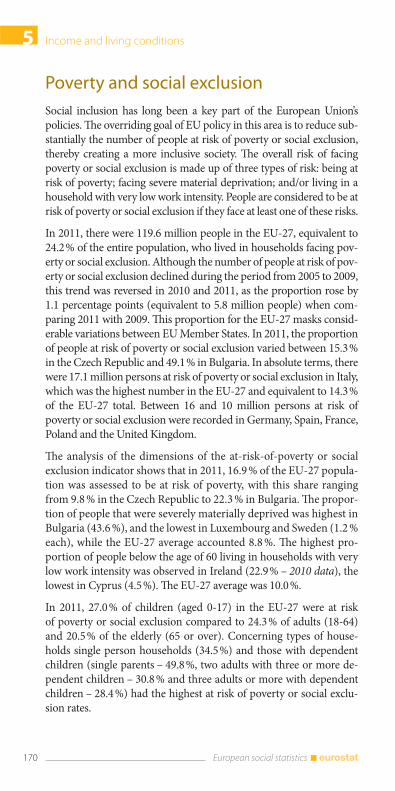
Income and living conditions5
170 European social statistics
Poverty and social exclusion
Social inclusion has long been a key part of the European Union’s
policies. The overriding goal of EU policy in this area is to reduce sub-
stantially the number of people at risk of poverty or social exclusion,
thereby creating a more inclusive society. The overall risk of facing
poverty or social exclusion is made up of three types of risk: being at
risk of poverty; facing severe material deprivation; and/or living in a
household with very low work intensity. People are considered to be at
risk of poverty or social exclusion if they face at least one of these risks.
In 2011, there were 119.6 million people in the EU-27, equivalent to
24.2 % of the entire population, who lived in households facing pov-
erty or social exclusion. Although the number of people at risk of pov-
erty or social exclusion declined during the period from 2005 to 2009,
this trend was reversed in 2010 and 2011, as the proportion rose by
1.1 percentage points (equivalent to 5.8 million people) when com-
paring 2011 with 2009. This proportion for the EU-27 masks consid-
erable variations between EU Member States. In 2011, the proportion
of people at risk of poverty or social exclusion varied between 15.3 %
in the Czech Republic and 49.1 % in Bulgaria. In absolute terms, there
were 17.1 million persons at risk of poverty or social exclusion in Italy,
which was the highest number in the EU-27 and equivalent to 14.3 %
of the EU-27 total. Between 16 and 10 million persons at risk of
poverty or social exclusion were recorded in Germany, Spain, France,
Poland and the United Kingdom.
The analysis of the dimensions of the at-risk-of-poverty or social
exclusion indicator shows that in 2011, 16.9 % of the EU-27 popula-
tion was assessed to be at risk of poverty, with this share ranging
from 9.8 % in the Czech Republic to 22.3 % in Bulgaria. The propor-
tion of people that were severely materially deprived was highest in
Bulgaria (43.6 %), and the lowest in Luxembourg and Sweden (1.2 %
each), while the EU-27 average accounted 8.8 %. The highest pro-
portion of people below the age of 60 living in households with very
low work intensity was observed in Ireland (22.9 % – 2010 data), the
lowest in Cyprus (4.5 %). The EU-27 average was 10.0 %.
In 2011, 27.0 % of children (aged 0-17) in the EU-27 were at risk
of poverty or social exclusion compared to 24.3 % of adults (18-64)
and 20.5 % of the elderly (65 or over). Concerning types of house-
holds single person households (34.5 %) and those with dependent
children (single parents – 49.8 %, two adults with three or more de-
pendent children – 30.8 % and three adults or more with dependent
children – 28.4 %) had the highest at risk of poverty or social exclu-
sion rates.
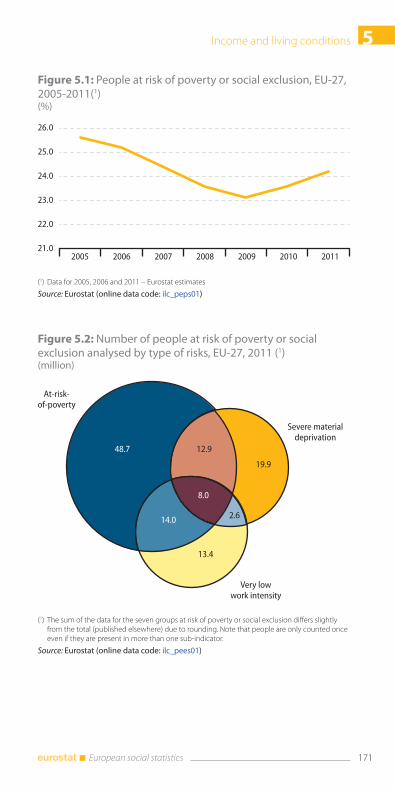
5Income and living conditions
171 European social statistics
Figure 5.1: People at risk of poverty or social exclusion, EU-27, 2005-2011(1)(%)
21.0
22.0
23.0
24.0
25.0
26.0
2005 2006 2007 2008 2009 2010 2011
(1) Data for 2005, 2006 and 2011 – Eurostat estimates
Source: Eurostat (online data code: ilc_peps01)
Figure 5.2: Number of people at risk of poverty or social exclusion analysed by type of risks, EU-27, 2011 (1)(million)
48.7 12.9
8.0
2.6
19.9
13.4
14.0
At-risk-of-poverty
Severe materialdeprivation
Very lowwork intensity
(1) The sum of the data for the seven groups at risk of poverty or social exclusion differs slightly from the total (published elsewhere) due to rounding. Note that people are only counted once even if they are present in more than one sub-indicator.
Source: Eurostat (online data code: ilc_pees01)
Income and living conditions5
172 European social statistics
Figure 5.3: Proportion of the population at-risk-of-poverty or social exclusion, 2011 (1)(%)
0 10 20 30 40 50 60
BGLV
ROLTEL
HUIE (3)
ITPLESPTCYEE
UKMTBESKDEFRSI
DKFI
LUATSENLCZ
CHNO
IS
HR
EU-27(2)EA-17(2)
Very low work intensity (other than at-risk-of-poverty or experiencing severe material deprivation)
At-risk-of-poverty
Severe material deprivation (other than at-risk-of-poverty)
(1) The sum of the data for the three groups at risk of poverty or social exclusion may differ slightly from the total (published elsewhere) due to rounding.
(2) Eurostat estimates.(3) 2010 data.
Source: Eurostat (online data codes: ilc_pees01 and ilc_li02)
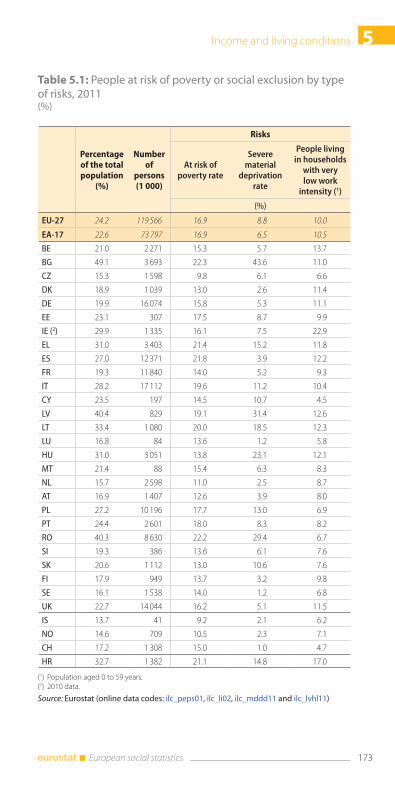
5Income and living conditions
173 European social statistics
Table 5.1: People at risk of poverty or social exclusion by type of risks, 2011 (%)
Percentage of the total population
(%)
Number of
persons (1 000)
Risks
At risk of poverty rate
Severe material
deprivation rate
People living in households
with very low work
intensity (1)
(%)
EU-27 24.2 119 566 16.9 8.8 10.0
EA-17 22.6 73 797 16.9 6.5 10.5
BE 21.0 2 271 15.3 5.7 13.7
BG 49.1 3 693 22.3 43.6 11.0
CZ 15.3 1 598 9.8 6.1 6.6
DK 18.9 1 039 13.0 2.6 11.4
DE 19.9 16 074 15.8 5.3 11.1
EE 23.1 307 17.5 8.7 9.9
IE (2) 29.9 1 335 16.1 7.5 22.9
EL 31.0 3 403 21.4 15.2 11.8
ES 27.0 12 371 21.8 3.9 12.2
FR 19.3 11 840 14.0 5.2 9.3
IT 28.2 17 112 19.6 11.2 10.4
CY 23.5 197 14.5 10.7 4.5
LV 40.4 829 19.1 31.4 12.6
LT 33.4 1 080 20.0 18.5 12.3
LU 16.8 84 13.6 1.2 5.8
HU 31.0 3 051 13.8 23.1 12.1
MT 21.4 88 15.4 6.3 8.3
NL 15.7 2 598 11.0 2.5 8.7
AT 16.9 1 407 12.6 3.9 8.0
PL 27.2 10 196 17.7 13.0 6.9
PT 24.4 2 601 18.0 8.3 8.2
RO 40.3 8 630 22.2 29.4 6.7
SI 19.3 386 13.6 6.1 7.6
SK 20.6 1 112 13.0 10.6 7.6
FI 17.9 949 13.7 3.2 9.8
SE 16.1 1 538 14.0 1.2 6.8
UK 22.7 14 044 16.2 5.1 11.5
IS 13.7 41 9.2 2.1 6.2
NO 14.6 709 10.5 2.3 7.1
CH 17.2 1 308 15.0 1.0 4.7
HR 32.7 1 382 21.1 14.8 17.0
(1) Population aged 0 to 59 years.(2) 2010 data.
Source: Eurostat (online data codes: ilc_peps01, ilc_li02, ilc_mddd11 and ilc_lvhl11)
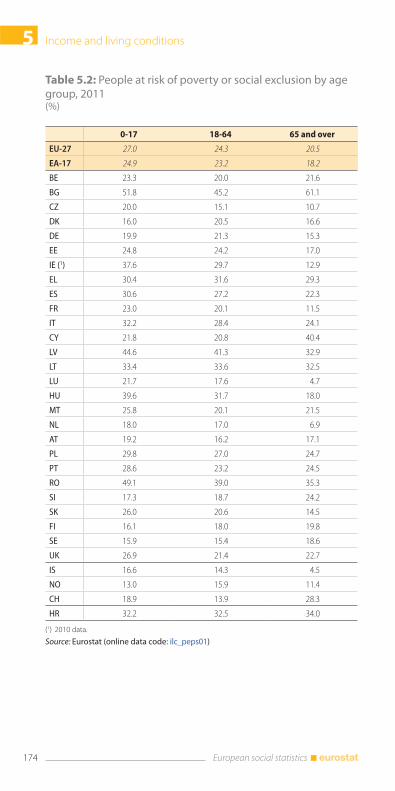
Income and living conditions5
174 European social statistics
Table 5.2: People at risk of poverty or social exclusion by age group, 2011 (%)
0-17 18-64 65 and over
EU-27 27.0 24.3 20.5
EA-17 24.9 23.2 18.2
BE 23.3 20.0 21.6
BG 51.8 45.2 61.1
CZ 20.0 15.1 10.7
DK 16.0 20.5 16.6
DE 19.9 21.3 15.3
EE 24.8 24.2 17.0
IE (1) 37.6 29.7 12.9
EL 30.4 31.6 29.3
ES 30.6 27.2 22.3
FR 23.0 20.1 11.5
IT 32.2 28.4 24.1
CY 21.8 20.8 40.4
LV 44.6 41.3 32.9
LT 33.4 33.6 32.5
LU 21.7 17.6 4.7
HU 39.6 31.7 18.0
MT 25.8 20.1 21.5
NL 18.0 17.0 6.9
AT 19.2 16.2 17.1
PL 29.8 27.0 24.7
PT 28.6 23.2 24.5
RO 49.1 39.0 35.3
SI 17.3 18.7 24.2
SK 26.0 20.6 14.5
FI 16.1 18.0 19.8
SE 15.9 15.4 18.6
UK 26.9 21.4 22.7
IS 16.6 14.3 4.5
NO 13.0 15.9 11.4
CH 18.9 13.9 28.3
HR 32.2 32.5 34.0
(1) 2010 data.
Source: Eurostat (online data code: ilc_peps01)
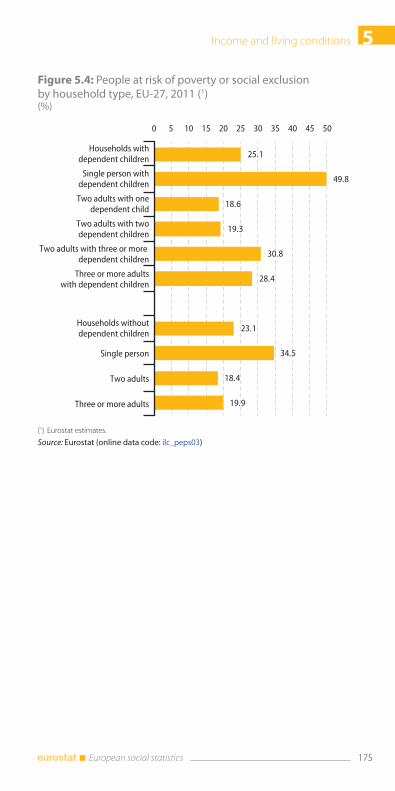
5Income and living conditions
175 European social statistics
Figure 5.4: People at risk of poverty or social exclusion by household type, EU-27, 2011 (1)(%)
25.1
49.8
18.6
19.3
30.8
28.4
23.1
34.5
18.4
19.9
0 5 10 15 20 25 30 35 40 45 50
Households withdependent children
Single person withdependent children
Two adults with onedependent child
Two adults with twodependent children
Three or more adultswith dependent children
Households withoutdependent children
Single person
Two adults
Three or more adults
Two adults with three or more dependent children
(1) Eurostat estimates.
Source: Eurostat (online data code: ilc_peps03)
Income and living conditions5
176 European social statistics
Monetary poverty
This part of the publication analyses recent statistics on monetary
poverty and income inequalities in the European Union. On the
one hand, inequalities in income distribution may create incen-
tives for people to improve their situation through work, inno-
vation or acquiring new skills. On the other hand, such income
inequalities are often viewed as being linked to poverty and social
exclusion.
In 2011, 16.9 % of the EU-27 population was assessed to be at risk
of poverty. This share conceals considerable variations across the
EU Member States. In five countries, namely Bulgaria, Romania,
Spain, Greece and Lithuania one fifth or more of the population
was viewed as being at risk of poverty. The lowest proportions
of persons at-risk-of-poverty were observed in the Netherlands
(11.0 %) and the Czech Republic (9.8 %). Norway (10.5 %) and
Iceland (9.2 %) also reported relatively low shares of their respec-
tive populations as being at risk of poverty.
The at-risk-of-poverty threshold is set at 60 % of the national me-
dian equivalised disposable income. This threshold, expressed in
purchasing power standards (PPS), varied considerably in 2011
across the EU Member States from PPS 2 134 in Romania and PPS
3 400 in Latvia to a level of PPS 16 001 in Luxembourg and PPS
12 150 in Austria; the poverty threshold was also relatively high in
Norway and Switzerland (exceeding PPS 13 000 in both of these
countries).
The differences in poverty rates are more notable when the popu-
lation is classified according to activity status. The unemployed
are a particularly vulnerable group: almost half (46.2 %) of unem-
ployed persons in the EU-27 were at risk of poverty in 2011. Those
in employment were far less likely to be at risk of poverty – an av-
erage of 8.9 % across the whole of the EU-27. The level of educa-
tion also represents a relevant factor in terms of poverty. In 2011 in
EU-27, 24.3 % of persons with low educational attainment were at
risk of poverty, compared with 7.3 % of those with high education-
al attainment. Moreover, 49.2 % of children whose parents’ highest
level of education was low were at-risk-of-poverty, compared to
7.5 % of those whose parents had high level of education.
Wide inequalities in the distribution of income were observed
among the population of the EU-27 in 2011: the 20 % of the popula-
tion with the highest equivalised disposable income received five
times as much income as the 20 % of the population with the lowest
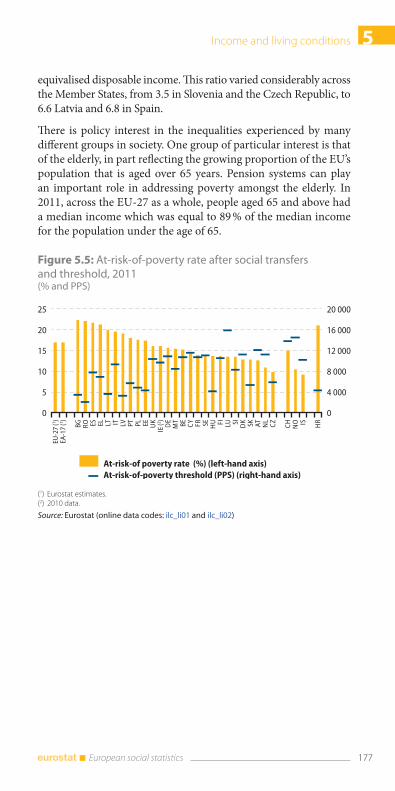
5Income and living conditions
177 European social statistics
equivalised disposable income. This ratio varied considerably across
the Member States, from 3.5 in Slovenia and the Czech Republic, to
6.6 Latvia and 6.8 in Spain.
There is policy interest in the inequalities experienced by many
different groups in society. One group of particular interest is that
of the elderly, in part reflecting the growing proportion of the EU’s
population that is aged over 65 years. Pension systems can play
an important role in addressing poverty amongst the elderly. In
2011, across the EU-27 as a whole, people aged 65 and above had
a median income which was equal to 89 % of the median income
for the population under the age of 65.
Figure 5.5: At-risk-of-poverty rate after social transfers and threshold, 2011(% and PPS)
0
4 000
8 000
12 000
16 000
20 000
0
5
10
15
20
25
BG RO ES EL LT IT LV PT PL EE UK
IE (2 )D
EM
T BE CY FR SE HU FI LU SI DK SK AT NL
CZ CH NO IS HR
EU-2
7 (1 )
EA-1
7 (1 )
At-risk-of poverty rate (%) (left-hand axis)
At-risk-of-poverty threshold (PPS) (right-hand axis)
(1) Eurostat estimates.(2) 2010 data.
Source: Eurostat (online data codes: ilc_li01 and ilc_li02)
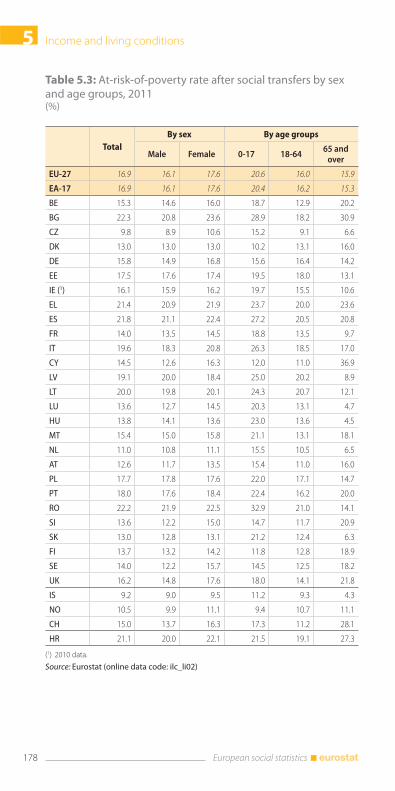
Income and living conditions5
178 European social statistics
Table 5.3: At-risk-of-poverty rate after social transfers by sex and age groups, 2011(%)
Total
By sex By age groups
Male Female 0-17 18-6465 and
over
EU-27 16.9 16.1 17.6 20.6 16.0 15.9
EA-17 16.9 16.1 17.6 20.4 16.2 15.3
BE 15.3 14.6 16.0 18.7 12.9 20.2
BG 22.3 20.8 23.6 28.9 18.2 30.9
CZ 9.8 8.9 10.6 15.2 9.1 6.6
DK 13.0 13.0 13.0 10.2 13.1 16.0
DE 15.8 14.9 16.8 15.6 16.4 14.2
EE 17.5 17.6 17.4 19.5 18.0 13.1
IE (1) 16.1 15.9 16.2 19.7 15.5 10.6
EL 21.4 20.9 21.9 23.7 20.0 23.6
ES 21.8 21.1 22.4 27.2 20.5 20.8
FR 14.0 13.5 14.5 18.8 13.5 9.7
IT 19.6 18.3 20.8 26.3 18.5 17.0
CY 14.5 12.6 16.3 12.0 11.0 36.9
LV 19.1 20.0 18.4 25.0 20.2 8.9
LT 20.0 19.8 20.1 24.3 20.7 12.1
LU 13.6 12.7 14.5 20.3 13.1 4.7
HU 13.8 14.1 13.6 23.0 13.6 4.5
MT 15.4 15.0 15.8 21.1 13.1 18.1
NL 11.0 10.8 11.1 15.5 10.5 6.5
AT 12.6 11.7 13.5 15.4 11.0 16.0
PL 17.7 17.8 17.6 22.0 17.1 14.7
PT 18.0 17.6 18.4 22.4 16.2 20.0
RO 22.2 21.9 22.5 32.9 21.0 14.1
SI 13.6 12.2 15.0 14.7 11.7 20.9
SK 13.0 12.8 13.1 21.2 12.4 6.3
FI 13.7 13.2 14.2 11.8 12.8 18.9
SE 14.0 12.2 15.7 14.5 12.5 18.2
UK 16.2 14.8 17.6 18.0 14.1 21.8
IS 9.2 9.0 9.5 11.2 9.3 4.3
NO 10.5 9.9 11.1 9.4 10.7 11.1
CH 15.0 13.7 16.3 17.3 11.2 28.1
HR 21.1 20.0 22.1 21.5 19.1 27.3
(1) 2010 data.
Source: Eurostat (online data code: ilc_li02)
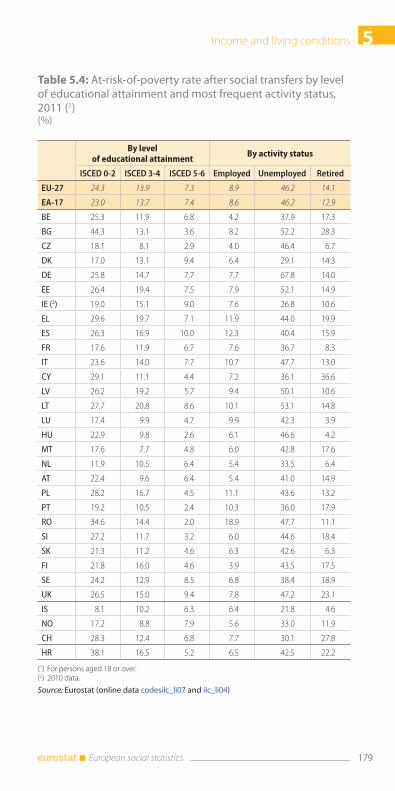
5Income and living conditions
179 European social statistics
Table 5.4: At-risk-of-poverty rate after social transfers by level of educational attainment and most frequent activity status, 2011 (1)(%)
By level of educational attainment
By activity status
ISCED 0-2 ISCED 3-4 ISCED 5-6 Employed Unemployed Retired
EU-27 24.3 13.9 7.3 8.9 46.2 14.1
EA-17 23.0 13.7 7.4 8.6 46.2 12.9
BE 25.3 11.9 6.8 4.2 37.9 17.3
BG 44.3 13.1 3.6 8.2 52.2 28.3
CZ 18.1 8.1 2.9 4.0 46.4 6.7
DK 17.0 13.1 9.4 6.4 29.1 14.3
DE 25.8 14.7 7.7 7.7 67.8 14.0
EE 26.4 19.4 7.5 7.9 52.1 14.9
IE (2) 19.0 15.1 9.0 7.6 26.8 10.6
EL 29.6 19.7 7.1 11.9 44.0 19.9
ES 26.3 16.9 10.0 12.3 40.4 15.9
FR 17.6 11.9 6.7 7.6 36.7 8.3
IT 23.6 14.0 7.7 10.7 47.7 13.0
CY 29.1 11.1 4.4 7.2 36.1 36.6
LV 26.2 19.2 5.7 9.4 50.1 10.6
LT 27.7 20.8 8.6 10.1 53.1 14.8
LU 17.4 9.9 4.7 9.9 42.3 3.9
HU 22.9 9.8 2.6 6.1 46.6 4.2
MT 17.6 7.7 4.8 6.0 42.8 17.6
NL 11.9 10.5 6.4 5.4 33.5 6.4
AT 22.4 9.6 6.4 5.4 41.0 14.9
PL 28.2 16.7 4.5 11.1 43.6 13.2
PT 19.2 10.5 2.4 10.3 36.0 17.9
RO 34.6 14.4 2.0 18.9 47.7 11.1
SI 27.2 11.7 3.2 6.0 44.6 18.4
SK 21.3 11.2 4.6 6.3 42.6 6.3
FI 21.8 16.0 4.6 3.9 43.5 17.5
SE 24.2 12.9 8.5 6.8 38.4 18.9
UK 26.5 15.0 9.4 7.8 47.2 23.1
IS 8.1 10.2 6.3 6.4 21.8 4.6
NO 17.2 8.8 7.9 5.6 33.0 11.9
CH 28.3 12.4 6.8 7.7 30.1 27.8
HR 38.1 16.5 5.2 6.5 42.5 22.2
(1) For persons aged 18 or over.(2) 2010 data.
Source: Eurostat (online data codesilc_li07 and ilc_li04)
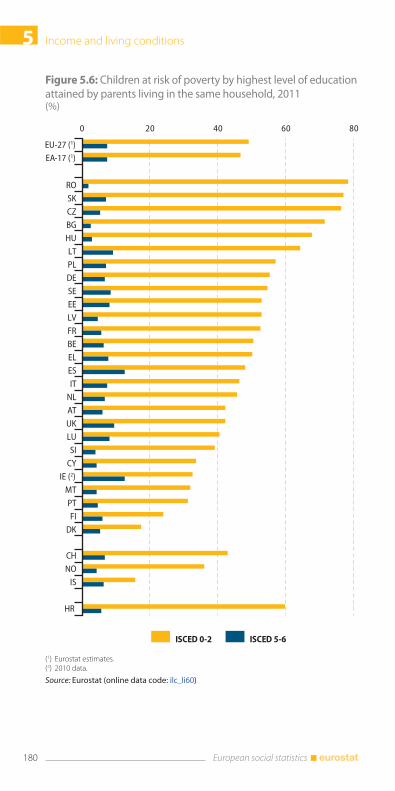
Income and living conditions5
180 European social statistics
Figure 5.6: Children at risk of poverty by highest level of education attained by parents living in the same household, 2011(%)
0 20 40 60 80
EU-27 (1)
EA-17 (1)
RO
SK
CZ
BG
HU
LT
PL
DE
SE
EE
LV
FR
BE
EL
ES
IT
NL
AT
UK
LU
SI
CY
IE (2)
MT
PT
FI
DK
CH
NO
IS
HR
ISCED 0-2 ISCED 5-6
(1) Eurostat estimates.(2) 2010 data.
Source: Eurostat (online data code: ilc_li60)
5Income and living conditions
181 European social statistics
Figure 5.7: At-risk-of-poverty rate after social transfers by household type, EU-27, 2011 (1)(%)
18.6
34.5
12.7
15.9
24.9
19.4
15.0
25.7
11.7
10.0
0 5 10 15 20 25 30 35 40
Households with dependent children
Single person with dependent children
Two adults with one dependent child
Two adults with two dependent children
Households without dependent children
Single person
Two adults
Three or more adults
Two adults with three or moredependent children
Three or more adults withdependent children
(1) Eurostat estimates.
Source: Eurostat (online data code: ilc_li03)
Income and living conditions5
182 European social statistics
Figure 5.8: At-risk-of-poverty rate before and after social transfers, 2011(1)(%)
0.0 10.0 20.0 30.0 40.0 50.0
IE (3)
DKHUUKSEFI
LUBEATLTFRSI
NLDECYLVCZES
MTPTEE
ROSKPLBGITEL
NOIS
CH
HR
EU-27(2)EA-17(2)
At-risk-of-poverty rate after social transfers
At-risk-of-poverty rate before social transfers
(1) Ranked on the difference between before and after social transfers.(2) Eurostat estimates.(3) 2010 data.
Source: Eurostat (online data codes: ilc_li02 and ilc_li10)
5Income and living conditions
183 European social statistics
Figure 5.9: Median equivalised disposable net income, 2011(PPS)
26 668
20 251
19 239
18 877
18 537
18 503
18 258
18 044
17 960
17 667
16 856
16 176
15 514
14 187
13 931
12 894
11 481
9 907
9 537
8 856
8 207
7 337
6 983
6 165
5 712
5 666
3 599
24 234
23 069
17 193
7 304
0 5 000 10 000 15 000 20 000 25 000 30 000
LU
AT
CY
NL
DK
SE
DE
FR
BE
FI
UK
IE (1)
IT
SI
MT
ES
EL
CZ
PT
SK
PL
EE
HU
LT
BG
LV
RO
NO
CH
IS
HR
(1) 2010 data.
Source: Eurostat (online data code: ilc_di03)
Income and living conditions5
184 European social statistics
Figure 5.10: Inequality of income distribution, 2011(S80/S20 income quintile share ratio)
5.1
5.0
6.8
6.6
6.5
6.2
6.0
5.8
5.7
5.6
5.3
5.3
5.3
5.0
4.6
4.5
4.4
4.3
4.1
4.0
3.9
3.9
3.8
3.8
3.8
3.7
3.6
3.5
3.5
4.5
3.3
3.3
5.4
0 2 4 6 8
EU-27(1)
EA-17(1)
ES
LV
BG
RO
EL
LT
PT
IT
EE
IE (2)
UK
PL
FR
DE
DK
CY
MT
LU
BE
HU
NL
AT
SK
FI
SE
CZ
SI
CH
IS
NO
HR
(1) Eurostat estimates.(2) 2010 data.
Source: Eurostat (online data code: ilc_di11)
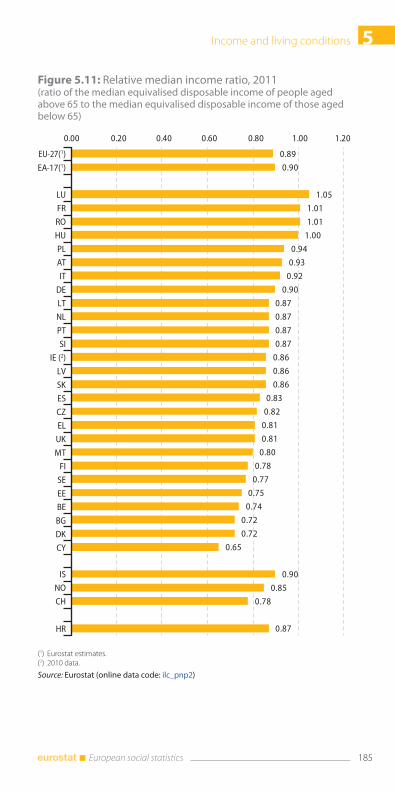
5Income and living conditions
185 European social statistics
Figure 5.11: Relative median income ratio, 2011(ratio of the median equivalised disposable income of people aged above 65 to the median equivalised disposable income of those aged below 65)
0.89
0.90
1.05
1.01
1.01
1.00
0.94
0.93
0.92
0.90
0.87
0.87
0.87
0.87
0.86
0.86
0.86
0.83
0.82
0.81
0.81
0.80
0.78
0.77
0.75
0.74
0.72
0.72
0.65
0.90
0.85
0.78
0.87
0.00 0.20 0.40 0.60 0.80 1.00 1.20
EU-27(1)
EA-17(1)
LU
FR
RO
HU
PL
AT
IT
DE
LT
NL
PT
SI
IE (2)
LV
SK
ES
CZ
EL
UK
MT
FI
SE
EE
BE
BG
DK
CY
IS
NO
CH
HR
(1) Eurostat estimates.(2) 2010 data.
Source: Eurostat (online data code: ilc_pnp2)
Income and living conditions5
186 European social statistics
Material deprivation and low work intensity
Income-related measures of poverty need to be analysed together
with non-monetary measures in order to have a better under-
standing of poverty. This part of the publication describes the non-
monetary components of the social inclusion headline indicator
“people at risk of poverty or social exclusion” set out in the Europe
2020 Strategy: people who are severely materially deprived and
people living in households with very low work intensity.
The definition of severe material deprivation is based on the in-
ability to afford a selection of items that are considered to be
necessary or desirable, namely: having arrears on mortgage or
rent payments, utility bills, hire purchase instalments or other
loan payments; not being able to afford one week’s annual holi-
day away from home; not being able to afford a meal with meat,
chicken, fish (or vegetarian equivalent) every second day; not be-
ing able to face unexpected financial expenses; not being able to
buy a telephone (including mobile phone); not being able to buy
a colour television; not being able to buy a washing machine; not
being able to buy a car; or not being able to afford heating to keep
the house warm. The severe material deprivation rate is defined
as the proportion of persons who cannot afford to pay for at least
four out of the nine items specified above. Following this defini-
tion, 8.8 % of population were severely deprived in the EU-27
in 2011. Only 1.2 % of the population were severely deprived in
Luxembourg as well as in Sweden. Switzerland also had a very
small percentage (1.0 %) of the population that were classified as
being severely materially deprived. On the other hand, in Bul-
garia and Latvia, more than 30 % of the population were found
to be severely materially deprived, while more than 20 % of the
population in Hungary and Romania fell within this category.
Moreover, in 2011, children aged 0-17, who lived in households
with an enforced lack of certain items at household level, had the
highest rate (10.0 %) of severe material deprivation, higher than
adults (8.9 %) and elderly people (7.2 %).
The rates of severe deprivation also vary between different house-
hold types. Overall at the EU-27 level, the most severely materi-
ally-deprived persons lived in single person households with de-
pendent children (18.4 %) followed by single female households
(11.9 %) and single male households (11.5 %). Persons living in
households consisting of two adults, at least one aged 65 years or
over were overall the least affected (5.2 %).
5Income and living conditions
187 European social statistics
Work intensity is the ratio between the number of months that
household members of working age (person aged 18-59 years,
who is not dependent child) worked during the income refer-
ence year and the total number of months that could theoretically
have been worked by these household members. People living in
households with very low work intensity are defined as people of
all ages (from 0-59 years) living in households where the members
of working age worked 20 % or less of their total potential during
the previous 12 months.
10.0 % of the EU-27 population lived in households with very low
work intensity in 2011, with some variation between Member
States. Less than 6 % of the target population was living in house-
holds with very low work intensity in Luxembourg and Cyprus.
In Switzerland, the rate was also relatively low (4.7 %). In contrast,
the indicator exceeded 13 % in Belgium. Ireland reported the
highest rate (22.9 % – 2010 data).
In 2011 at EU-27 level, very low work intensity was most common
in single person households with dependent children (25.6 %),
while households with two adults and one dependent child re-
ported the lowest rates (5.9 %).
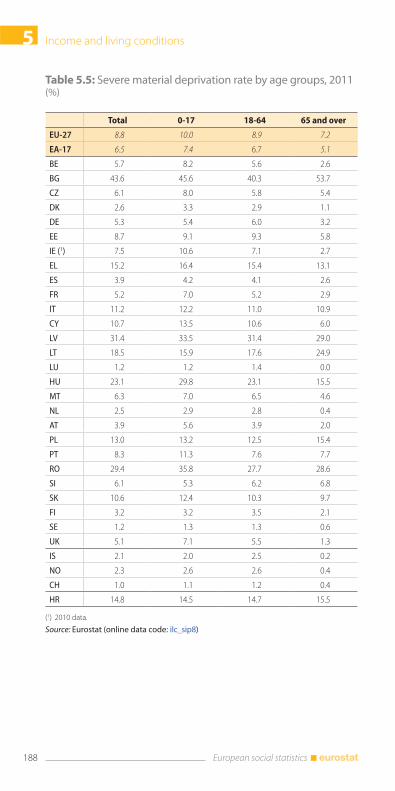
Income and living conditions5
188 European social statistics
Table 5.5: Severe material deprivation rate by age groups, 2011(%)
Total 0-17 18-64 65 and over
EU-27 8.8 10.0 8.9 7.2
EA-17 6.5 7.4 6.7 5.1
BE 5.7 8.2 5.6 2.6
BG 43.6 45.6 40.3 53.7
CZ 6.1 8.0 5.8 5.4
DK 2.6 3.3 2.9 1.1
DE 5.3 5.4 6.0 3.2
EE 8.7 9.1 9.3 5.8
IE (1) 7.5 10.6 7.1 2.7
EL 15.2 16.4 15.4 13.1
ES 3.9 4.2 4.1 2.6
FR 5.2 7.0 5.2 2.9
IT 11.2 12.2 11.0 10.9
CY 10.7 13.5 10.6 6.0
LV 31.4 33.5 31.4 29.0
LT 18.5 15.9 17.6 24.9
LU 1.2 1.2 1.4 0.0
HU 23.1 29.8 23.1 15.5
MT 6.3 7.0 6.5 4.6
NL 2.5 2.9 2.8 0.4
AT 3.9 5.6 3.9 2.0
PL 13.0 13.2 12.5 15.4
PT 8.3 11.3 7.6 7.7
RO 29.4 35.8 27.7 28.6
SI 6.1 5.3 6.2 6.8
SK 10.6 12.4 10.3 9.7
FI 3.2 3.2 3.5 2.1
SE 1.2 1.3 1.3 0.6
UK 5.1 7.1 5.5 1.3
IS 2.1 2.0 2.5 0.2
NO 2.3 2.6 2.6 0.4
CH 1.0 1.1 1.2 0.4
HR 14.8 14.5 14.7 15.5
(1) 2010 data.
Source: Eurostat (online data code: ilc_sip8)
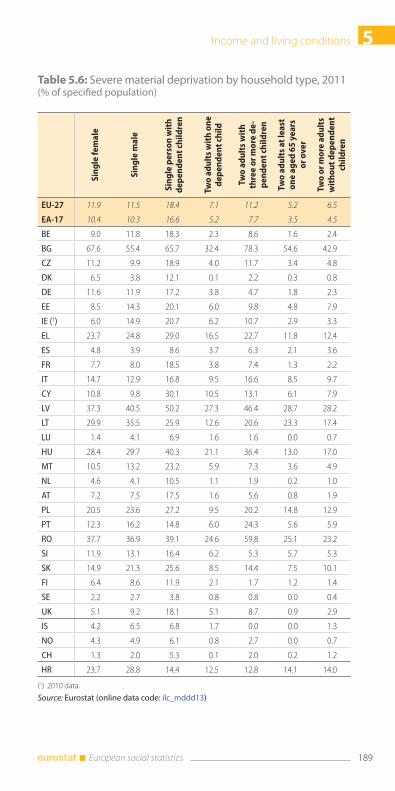
5Income and living conditions
189 European social statistics
Table 5.6: Severe material deprivation by household type, 2011(% of specified population)
Sin
gle
fe
ma
le
Sin
gle
ma
le
Sin
gle
pe
rso
n w
ith
d
ep
en
de
nt
chil
dre
n
Two
ad
ult
s w
ith
on
e
de
pe
nd
en
t ch
ild
Two
ad
ult
s w
ith
th
ree
or
mo
re d
e-
pe
nd
en
t ch
ild
ren
Two
ad
ult
s a
t le
ast
o
ne
ag
ed
65
ye
ars
o
r o
ver
Two
or
mo
re a
du
lts
wit
ho
ut
de
pe
nd
en
t ch
ild
ren
EU-27 11.9 11.5 18.4 7.1 11.2 5.2 6.5
EA-17 10.4 10.3 16.6 5.2 7.7 3.5 4.5
BE 9.0 11.8 18.3 2.3 8.6 1.6 2.4
BG 67.6 55.4 65.7 32.4 78.3 54.6 42.9
CZ 11.2 9.9 18.9 4.0 11.7 3.4 4.8
DK 6.5 3.8 12.1 0.1 2.2 0.3 0.8
DE 11.6 11.9 17.2 3.8 4.7 1.8 2.3
EE 8.5 14.3 20.1 6.0 9.8 4.8 7.9
IE (1) 6.0 14.9 20.7 6.2 10.7 2.9 3.3
EL 23.7 24.8 29.0 16.5 22.7 11.8 12.4
ES 4.8 3.9 8.6 3.7 6.3 2.1 3.6
FR 7.7 8.0 18.5 3.8 7.4 1.3 2.2
IT 14.7 12.9 16.8 9.5 16.6 8.5 9.7
CY 10.8 9.8 30.1 10.5 13.1 6.1 7.9
LV 37.3 40.5 50.2 27.3 46.4 28.7 28.2
LT 29.9 35.5 25.9 12.6 20.6 23.3 17.4
LU 1.4 4.1 6.9 1.6 1.6 0.0 0.7
HU 28.4 29.7 40.3 21.1 36.4 13.0 17.0
MT 10.5 13.2 23.2 5.9 7.3 3.6 4.9
NL 4.6 4.1 10.5 1.1 1.9 0.2 1.0
AT 7.2 7.5 17.5 1.6 5.6 0.8 1.9
PL 20.5 23.6 27.2 9.5 20.2 14.8 12.9
PT 12.3 16.2 14.8 6.0 24.3 5.6 5.9
RO 37.7 36.9 39.1 24.6 59.8 25.1 23.2
SI 11.9 13.1 16.4 6.2 5.3 5.7 5.3
SK 14.9 21.3 25.6 8.5 14.4 7.5 10.1
FI 6.4 8.6 11.9 2.1 1.7 1.2 1.4
SE 2.2 2.7 3.8 0.8 0.8 0.0 0.4
UK 5.1 9.2 18.1 5.1 8.7 0.9 2.9
IS 4.2 6.5 6.8 1.7 0.0 0.0 1.3
NO 4.3 4.9 6.1 0.8 2.7 0.0 0.7
CH 1.3 2.0 5.3 0.1 2.0 0.2 1.2
HR 23.7 28.8 14.4 12.5 12.8 14.1 14.0
(1) 2010 data.
Source: Eurostat (online data code: ilc_mddd13)
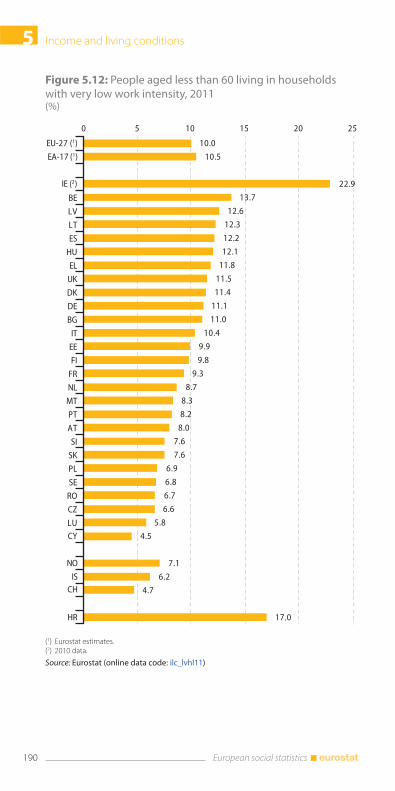
Income and living conditions5
190 European social statistics
Figure 5.12: People aged less than 60 living in households with very low work intensity, 2011(%)
10.0
10.5
22.9
13.7
12.6
12.3
12.2
12.1
11.8
11.5
11.4
11.1
11.0
10.4
9.9
9.8
9.3
8.7
8.3
8.2
8.0
7.6
7.6
6.9
6.8
6.7
6.6
5.8
4.5
7.1
6.2
4.7
17.0
0 5 10 15 20 25
IE (2)
BE
LV
LT
ES
HU
EL
UK
DK
DE
BG
IT
EE
FI
FR
NL
MT
PT
AT
SI
SK
PL
SE
RO
CZ
LU
CY
NO
ISCH
HR
EU-27 (1)
EA-17 (1)
(1) Eurostat estimates.(2) 2010 data.
Source: Eurostat (online data code: ilc_lvhl11)
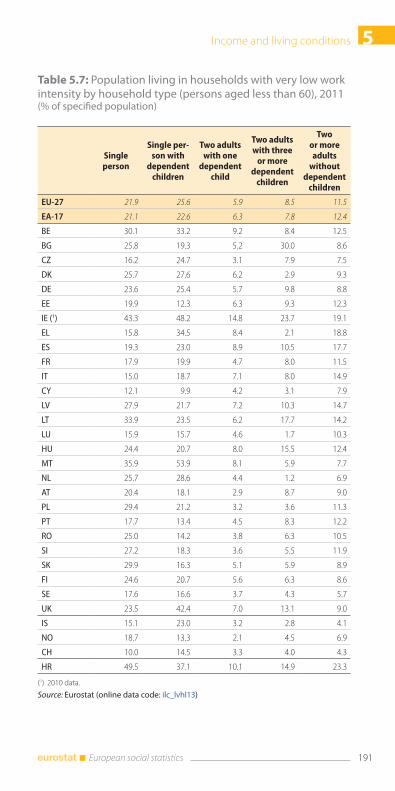
5Income and living conditions
191 European social statistics
Table 5.7: Population living in households with very low work intensity by household type (persons aged less than 60), 2011(% of specified population)
Single person
Single per-son with
dependent children
Two adults with one
dependent child
Two adults with three
or more dependent
children
Two or more adults
without dependent
children
EU-27 21.9 25.6 5.9 8.5 11.5
EA-17 21.1 22.6 6.3 7.8 12.4
BE 30.1 33.2 9.2 8.4 12.5
BG 25.8 19.3 5.2 30.0 8.6
CZ 16.2 24.7 3.1 7.9 7.5
DK 25.7 27.6 6.2 2.9 9.3
DE 23.6 25.4 5.7 9.8 8.8
EE 19.9 12.3 6.3 9.3 12.3
IE (1) 43.3 48.2 14.8 23.7 19.1
EL 15.8 34.5 8.4 2.1 18.8
ES 19.3 23.0 8.9 10.5 17.7
FR 17.9 19.9 4.7 8.0 11.5
IT 15.0 18.7 7.1 8.0 14.9
CY 12.1 9.9 4.2 3.1 7.9
LV 27.9 21.7 7.2 10.3 14.7
LT 33.9 23.5 6.2 17.7 14.2
LU 15.9 15.7 4.6 1.7 10.3
HU 24.4 20.7 8.0 15.5 12.4
MT 35.9 53.9 8.1 5.9 7.7
NL 25.7 28.6 4.4 1.2 6.9
AT 20.4 18.1 2.9 8.7 9.0
PL 29.4 21.2 3.2 3.6 11.3
PT 17.7 13.4 4.5 8.3 12.2
RO 25.0 14.2 3.8 6.3 10.5
SI 27.2 18.3 3.6 5.5 11.9
SK 29.9 16.3 5.1 5.9 8.9
FI 24.6 20.7 5.6 6.3 8.6
SE 17.6 16.6 3.7 4.3 5.7
UK 23.5 42.4 7.0 13.1 9.0
IS 15.1 23.0 3.2 2.8 4.1
NO 18.7 13.3 2.1 4.5 6.9
CH 10.0 14.5 3.3 4.0 4.3
HR 49.5 37.1 10.1 14.9 23.3
(1) 2010 data.
Source: Eurostat (online data code: ilc_lvhl13)
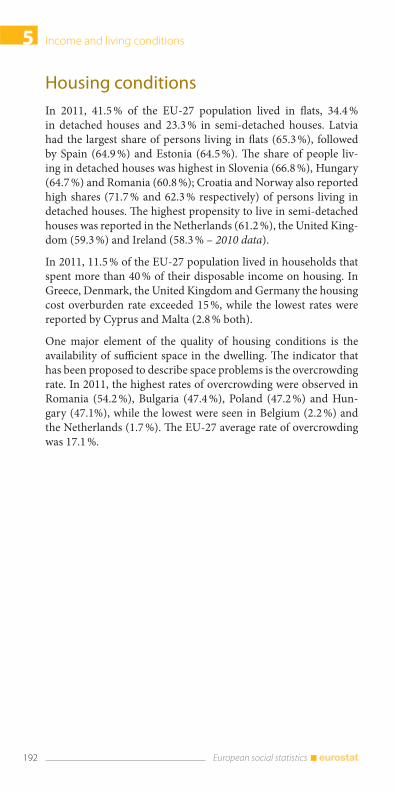
Income and living conditions5
192 European social statistics
Housing conditions
In 2011, 41.5 % of the EU-27 population lived in flats, 34.4 %
in detached houses and 23.3 % in semi-detached houses. Latvia
had the largest share of persons living in flats (65.3 %), followed
by Spain (64.9 %) and Estonia (64.5 %). The share of people liv-
ing in detached houses was highest in Slovenia (66.8 %), Hungary
(64.7 %) and Romania (60.8 %); Croatia and Norway also reported
high shares (71.7 % and 62.3 % respectively) of persons living in
detached houses. The highest propensity to live in semi-detached
houses was reported in the Netherlands (61.2 %), the United King-
dom (59.3 %) and Ireland (58.3 % – 2010 data).
In 2011, 11.5 % of the EU-27 population lived in households that
spent more than 40 % of their disposable income on housing. In
Greece, Denmark, the United Kingdom and Germany the housing
cost overburden rate exceeded 15 %, while the lowest rates were
reported by Cyprus and Malta (2.8 % both).
One major element of the quality of housing conditions is the
availability of sufficient space in the dwelling. The indicator that
has been proposed to describe space problems is the overcrowding
rate. In 2011, the highest rates of overcrowding were observed in
Romania (54.2 %), Bulgaria (47.4 %), Poland (47.2 %) and Hun-
gary (47.1%), while the lowest were seen in Belgium (2.2 %) and
the Netherlands (1.7 %). The EU-27 average rate of overcrowding
was 17.1 %.
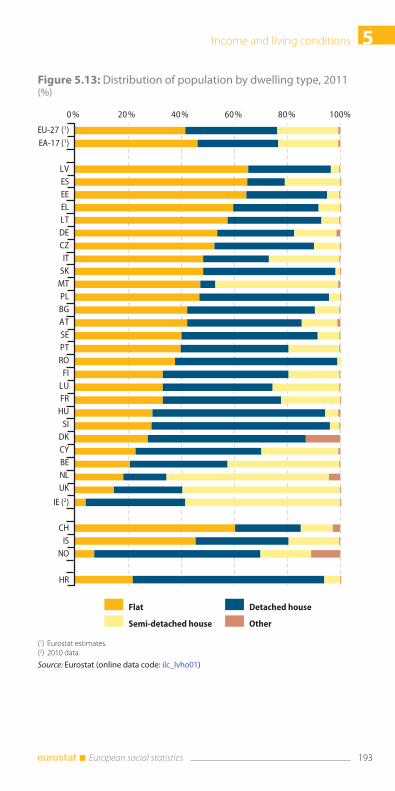
5Income and living conditions
193 European social statistics
Figure 5.13: Distribution of population by dwelling type, 2011(%)
0 % 20 % 40 % 60 % 80 % 100%
LVESEEELLTDECZIT
SKMTPLBGATSEPTRO
FILUFR
HUSI
DKCYBENLUK
IE (2)
CHIS
NO
HR
EU-27 (1)
EA-17 (1)
Flat Detached house
OtherSemi-detached house
(1) Eurostat estimates.(2) 2010 data.
Source: Eurostat (online data code: ilc_lvho01)
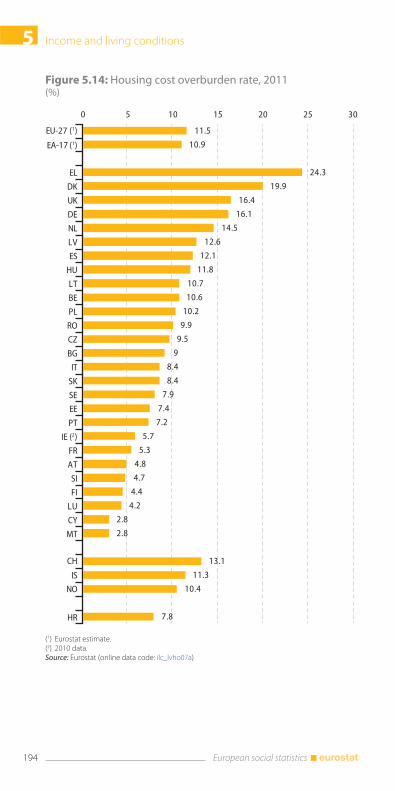
Income and living conditions5
194 European social statistics
Figure 5.14: Housing cost overburden rate, 2011(%)
11.5
10.9
24.3
19.9
16.4
16.1
14.5
12.6
12.1
11.8
10.7
10.6
10.2
9.9
9.5
9
8.4
8.4
7.9
7.4
7.2
5.7
5.3
4.8
4.7
4.4
4.2
2.8
2.8
13.1
11.3
10.4
7.8
0 10 155 20 25 30
EL
DK
UK
DE
NL
LV
ES
HU
LT
BE
PL
RO
CZ
BG
IT
SK
SE
EE
PT
IE (2)
FR
AT
SI
FI
LU
CY
MT
CH
IS
NO
HR
EU-27 (1)
EA-17 (1)
(1) Eurostat estimate.(2) 2010 data.Source: Eurostat (online data code: ilc_lvho07a)
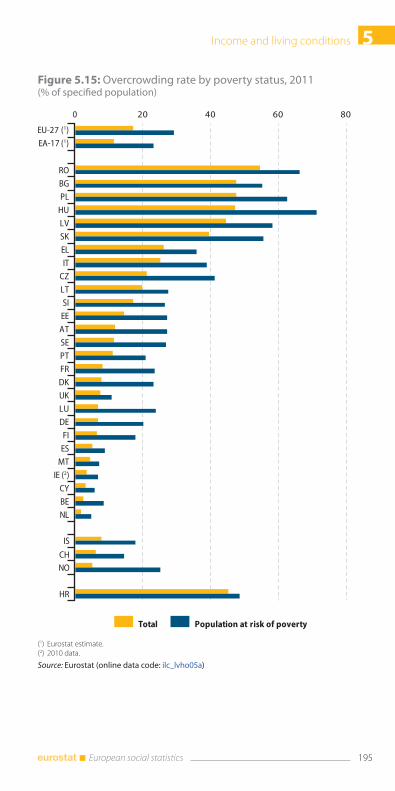
5Income and living conditions
195 European social statistics
Figure 5.15: Overcrowding rate by poverty status, 2011(% of specified population)
0 20 40 60 80
RO
BG
PL
HU
LV
SK
EL
IT
CZ
LT
SI
EE
AT
SE
PT
FR
DK
UK
LU
DE
FI
ES
MT
IE (2)
CY
BE
NL
IS
CHNO
HR
EU-27 (1)
EA-17 (1)
Total Population at risk of poverty
(1) Eurostat estimate.(2) 2010 data.
Source: Eurostat (online data code: ilc_lvho05a)

Social protection systems are highly developed in the European
Union (EU): they are designed to protect people against the risks
associated with unemployment, parental responsibilities, sick-
ness/health care and invalidity, the loss of a spouse or parent, old
age, housing and social exclusion. Member States are responsible
for organising and financing social protection systems within their
borders. The models vary from country to country, while the EU
seeks to ensure that people who move across borders continue to
receive sufficient protection. This coordinating role also promotes
efforts by Member States to combat poverty and social exclusion,
and to reform social protection systems on the basis of policy ex-
changes and mutual learning: this policy is known as the social
protection and social inclusion process. The process underpins
the revised Lisbon objectives for 2010 promoting a more inclusive
Europe. It is widely argued that this is necessary to help the EU
achieve sustained and sustainable economic growth, create more
and better jobs, and promote greater social cohesion.
This chapter presents data on expenditure and receipts of social
protection which are drawn up according to the European system
of integrated social protection statistics methodology. This system
has been designed to provide a comprehensive and coherent de-
scription of social protection in the Member States:
covering social benefits and their financing;
geared to international comparability;
harmonising with other statistics, particularly national accounts,
in its main concepts.
6Social protection
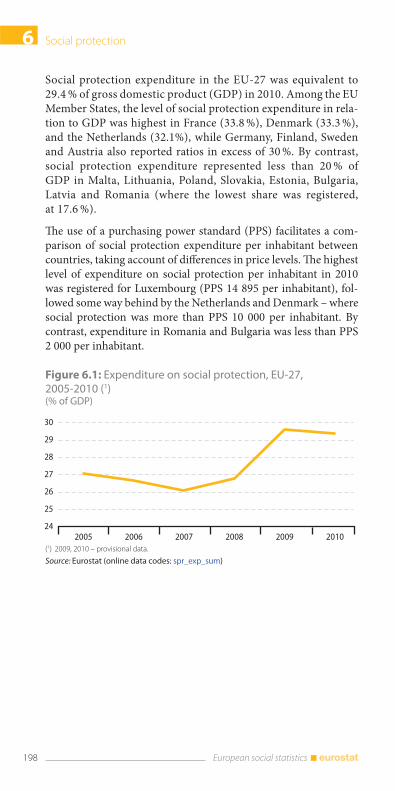
Social protection6
198 European social statistics
Social protection expenditure in the EU-27 was equivalent to
29.4 % of gross domestic product (GDP) in 2010. Among the EU
Member States, the level of social protection expenditure in rela-
tion to GDP was highest in France (33.8 %), Denmark (33.3 %),
and the Netherlands (32.1%), while Germany, Finland, Sweden
and Austria also reported ratios in excess of 30 %. By contrast,
social protection expenditure represented less than 20 % of
GDP in Malta, Lithuania, Poland, Slovakia, Estonia, Bulgaria,
Latvia and Romania (where the lowest share was registered,
at 17.6 %).
The use of a purchasing power standard (PPS) facilitates a com-
parison of social protection expenditure per inhabitant between
countries, taking account of differences in price levels. The highest
level of expenditure on social protection per inhabitant in 2010
was registered for Luxembourg (PPS 14 895 per inhabitant), fol-
lowed some way behind by the Netherlands and Denmark – where
social protection was more than PPS 10 000 per inhabitant. By
contrast, expenditure in Romania and Bulgaria was less than PPS
2 000 per inhabitant.
Figure 6.1: Expenditure on social protection, EU-27, 2005-2010 (1)(% of GDP)
24
25
26
27
28
29
30
2005 2006 2007 2008 2009 2010(1) 2009, 2010 – provisional data.
Source: Eurostat (online data codes: spr_exp_sum)
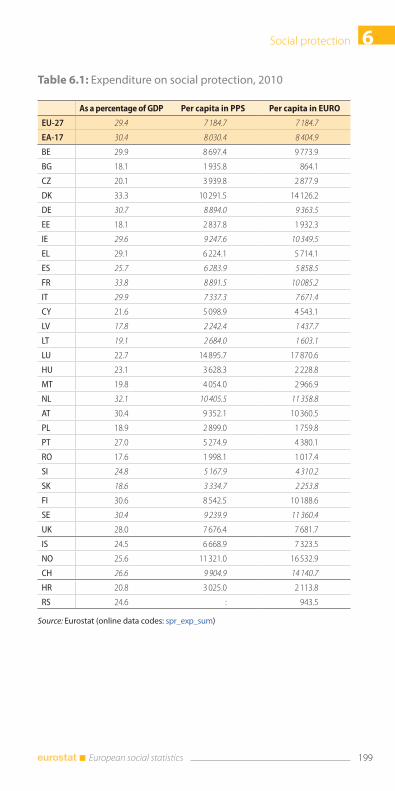
6Social protection
199 European social statistics
Table 6.1: Expenditure on social protection, 2010
As a percentage of GDP Per capita in PPS Per capita in EURO
EU-27 29.4 7 184.7 7 184.7
EA-17 30.4 8 030.4 8 404.9
BE 29.9 8 697.4 9 773.9
BG 18.1 1 935.8 864.1
CZ 20.1 3 939.8 2 877.9
DK 33.3 10 291.5 14 126.2
DE 30.7 8 894.0 9 363.5
EE 18.1 2 837.8 1 932.3
IE 29.6 9 247.6 10 349.5
EL 29.1 6 224.1 5 714.1
ES 25.7 6 283.9 5 858.5
FR 33.8 8 891.5 10 085.2
IT 29.9 7 337.3 7 671.4
CY 21.6 5 098.9 4 543.1
LV 17.8 2 242.4 1 437.7
LT 19.1 2 684.0 1 603.1
LU 22.7 14 895.7 17 870.6
HU 23.1 3 628.3 2 228.8
MT 19.8 4 054.0 2 966.9
NL 32.1 10 405.5 11 358.8
AT 30.4 9 352.1 10 360.5
PL 18.9 2 899.0 1 759.8
PT 27.0 5 274.9 4 380.1
RO 17.6 1 998.1 1 017.4
SI 24.8 5 167.9 4 310.2
SK 18.6 3 334.7 2 253.8
FI 30.6 8 542.5 10 188.6
SE 30.4 9 239.9 11 360.4
UK 28.0 7 676.4 7 681.7
IS 24.5 6 668.9 7 323.5
NO 25.6 11 321.0 16 532.9
CH 26.6 9 904.9 14 140.7
HR 20.8 3 025.0 2 113.8
RS 24.6 : 943.5
Source: Eurostat (online data codes: spr_exp_sum)
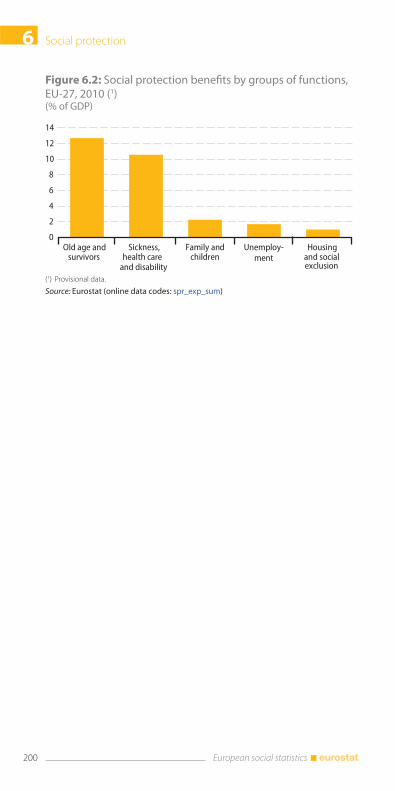
Social protection6
200 European social statistics
Figure 6.2: Social protection benefits by groups of functions, EU-27, 2010 (1)(% of GDP)
0
2
4
6
8
10
12
14
Old age andsurvivors
Sickness, health care
Family andchildren
Unemploy-ment
Housing
exclusionand disabilityand social
(1) Provisional data.
Source: Eurostat (online data codes: spr_exp_sum)
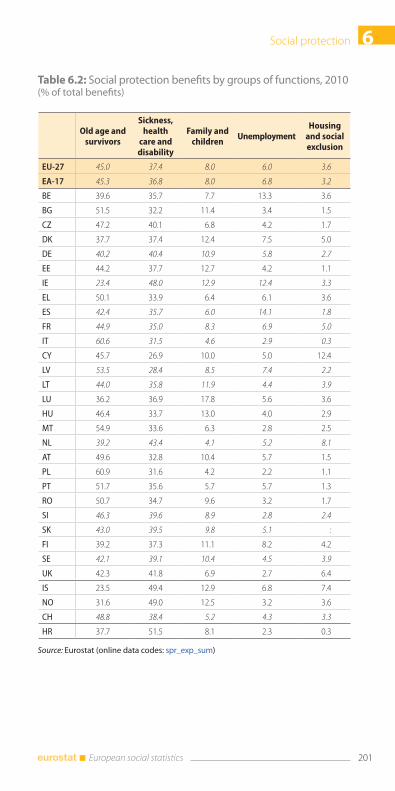
6Social protection
201 European social statistics
Table 6.2: Social protection benefits by groups of functions, 2010(% of total benefits)
Old age and survivors
Sickness, health
care and disability
Family and children
UnemploymentHousing
and social exclusion
EU-27 45.0 37.4 8.0 6.0 3.6
EA-17 45.3 36.8 8.0 6.8 3.2
BE 39.6 35.7 7.7 13.3 3.6
BG 51.5 32.2 11.4 3.4 1.5
CZ 47.2 40.1 6.8 4.2 1.7
DK 37.7 37.4 12.4 7.5 5.0
DE 40.2 40.4 10.9 5.8 2.7
EE 44.2 37.7 12.7 4.2 1.1
IE 23.4 48.0 12.9 12.4 3.3
EL 50.1 33.9 6.4 6.1 3.6
ES 42.4 35.7 6.0 14.1 1.8
FR 44.9 35.0 8.3 6.9 5.0
IT 60.6 31.5 4.6 2.9 0.3
CY 45.7 26.9 10.0 5.0 12.4
LV 53.5 28.4 8.5 7.4 2.2
LT 44.0 35.8 11.9 4.4 3.9
LU 36.2 36.9 17.8 5.6 3.6
HU 46.4 33.7 13.0 4.0 2.9
MT 54.9 33.6 6.3 2.8 2.5
NL 39.2 43.4 4.1 5.2 8.1
AT 49.6 32.8 10.4 5.7 1.5
PL 60.9 31.6 4.2 2.2 1.1
PT 51.7 35.6 5.7 5.7 1.3
RO 50.7 34.7 9.6 3.2 1.7
SI 46.3 39.6 8.9 2.8 2.4
SK 43.0 39.5 9.8 5.1 :
FI 39.2 37.3 11.1 8.2 4.2
SE 42.1 39.1 10.4 4.5 3.9
UK 42.3 41.8 6.9 2.7 6.4
IS 23.5 49.4 12.9 6.8 7.4
NO 31.6 49.0 12.5 3.2 3.6
CH 48.8 38.4 5.2 4.3 3.3
HR 37.7 51.5 8.1 2.3 0.3
Source: Eurostat (online data codes: spr_exp_sum)
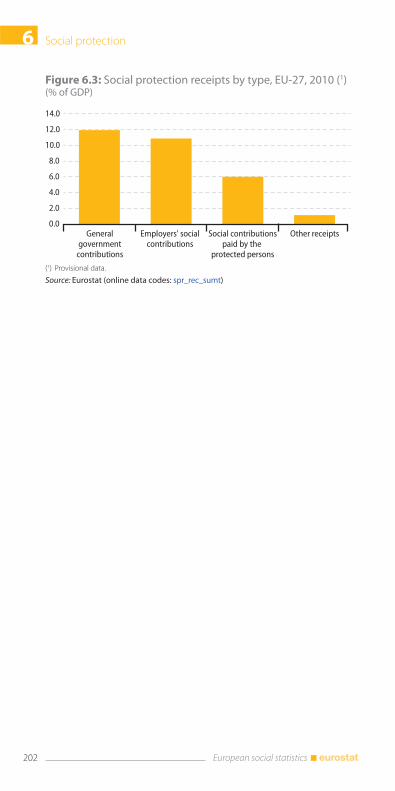
Social protection6
202 European social statistics
Figure 6.3: Social protection receipts by type, EU-27, 2010 (1) (% of GDP)
0.0
2.0
4.0
6.0
8.0
10.0
12.0
14.0
Other receiptsGeneralgovernment
contributions
Employers' socialcontributions
Social contributionspaid by the
protected persons
(1) Provisional data.
Source: Eurostat (online data codes: spr_rec_sumt)
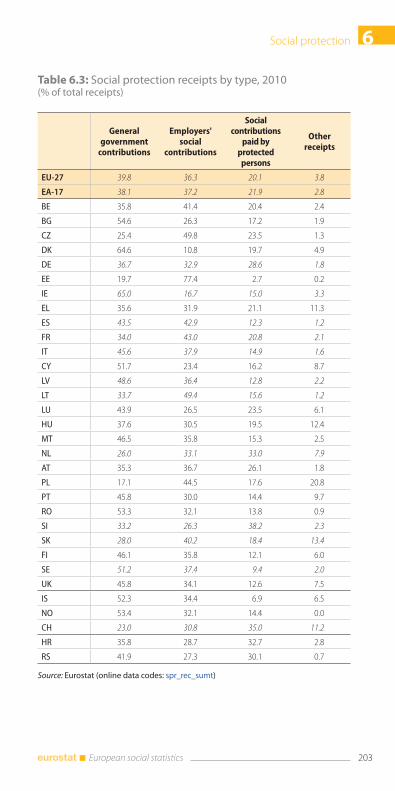
6Social protection
203 European social statistics
Table 6.3: Social protection receipts by type, 2010(% of total receipts)
General government
contributions
Employers' social
contributions
Social contributions
paid by protected
persons
Other receipts
EU-27 39.8 36.3 20.1 3.8
EA-17 38.1 37.2 21.9 2.8
BE 35.8 41.4 20.4 2.4
BG 54.6 26.3 17.2 1.9
CZ 25.4 49.8 23.5 1.3
DK 64.6 10.8 19.7 4.9
DE 36.7 32.9 28.6 1.8
EE 19.7 77.4 2.7 0.2
IE 65.0 16.7 15.0 3.3
EL 35.6 31.9 21.1 11.3
ES 43.5 42.9 12.3 1.2
FR 34.0 43.0 20.8 2.1
IT 45.6 37.9 14.9 1.6
CY 51.7 23.4 16.2 8.7
LV 48.6 36.4 12.8 2.2
LT 33.7 49.4 15.6 1.2
LU 43.9 26.5 23.5 6.1
HU 37.6 30.5 19.5 12.4
MT 46.5 35.8 15.3 2.5
NL 26.0 33.1 33.0 7.9
AT 35.3 36.7 26.1 1.8
PL 17.1 44.5 17.6 20.8
PT 45.8 30.0 14.4 9.7
RO 53.3 32.1 13.8 0.9
SI 33.2 26.3 38.2 2.3
SK 28.0 40.2 18.4 13.4
FI 46.1 35.8 12.1 6.0
SE 51.2 37.4 9.4 2.0
UK 45.8 34.1 12.6 7.5
IS 52.3 34.4 6.9 6.5
NO 53.4 32.1 14.4 0.0
CH 23.0 30.8 35.0 11.2
HR 35.8 28.7 32.7 2.8
RS 41.9 27.3 30.1 0.7
Source: Eurostat (online data codes: spr_rec_sumt)

Crime is not only a cause of suffering to victims and their fami-
lies but also a manifestation of the extreme marginalisation from
mainstream society that affects some individuals.
This chapter provides an overview of recent statistics on crime and
criminal justice in the European Union based largely on crime fig-
ures recorded by the police. National sources of information about
crime show considerable differences in approach (different levels
of criminalisation, the efficiency of criminal justice systems and
police recording practices) and coverage, which makes it neces-
sary to exercise caution in making direct comparisons between
countries and compiling totals at the level of the EU. Recent work
to improve the comparability of statistics on crime and criminal
justice reveals some significant developments in criminality in the
European Union.
7Crime and criminal justice
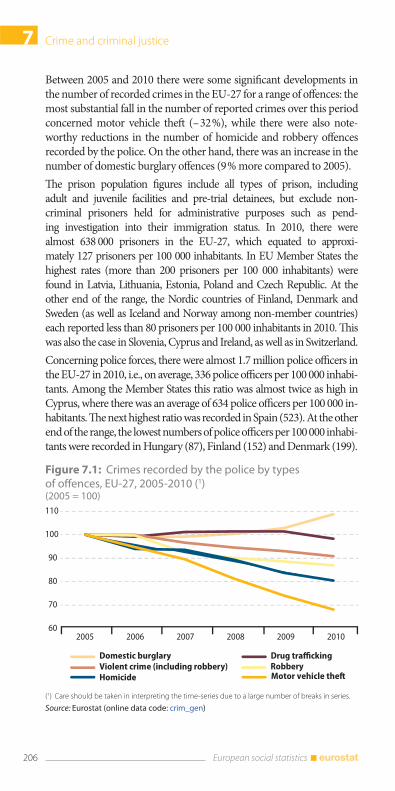
Crime and criminal justice7
206 European social statistics
Between 2005 and 2010 there were some significant developments in
the number of recorded crimes in the EU-27 for a range of offences: the
most substantial fall in the number of reported crimes over this period
concerned motor vehicle theft (– 32 %), while there were also note-
worthy reductions in the number of homicide and robbery offences
recorded by the police. On the other hand, there was an increase in the
number of domestic burglary offences (9 % more compared to 2005).
The prison population figures include all types of prison, including
adult and juvenile facilities and pre-trial detainees, but exclude non-
criminal prisoners held for administrative purposes such as pend-
ing investigation into their immigration status. In 2010, there were
almost 638 000 prisoners in the EU-27, which equated to approxi-
mately 127 prisoners per 100 000 inhabitants. In EU Member States the
highest rates (more than 200 prisoners per 100 000 inhabitants) were
found in Latvia, Lithuania, Estonia, Poland and Czech Republic. At the
other end of the range, the Nordic countries of Finland, Denmark and
Sweden (as well as Iceland and Norway among non-member countries)
each reported less than 80 prisoners per 100 000 inhabitants in 2010. This
was also the case in Slovenia, Cyprus and Ireland, as well as in Switzerland.
Concerning police forces, there were almost 1.7 million police officers in
the EU-27 in 2010, i.e., on average, 336 police officers per 100 000 inhabi-
tants. Among the Member States this ratio was almost twice as high in
Cyprus, where there was an average of 634 police officers per 100 000 in-
habitants. The next highest ratio was recorded in Spain (523). At the other
end of the range, the lowest numbers of police officers per 100 000 inhabi-
tants were recorded in Hungary (87), Finland (152) and Denmark (199).
Figure 7.1: Crimes recorded by the police by types of offences, EU-27, 2005-2010 (1)(2005 = 100)
60
70
80
90
100
110
2005 2006 2007 2008 2009 2010
Domestic burglary Drug traffickingViolent crime (including robbery) RobberyHomicide Motor vehicle theft
(1) Care should be taken in interpreting the time-series due to a large number of breaks in series.
Source: Eurostat (online data code: crim_gen)
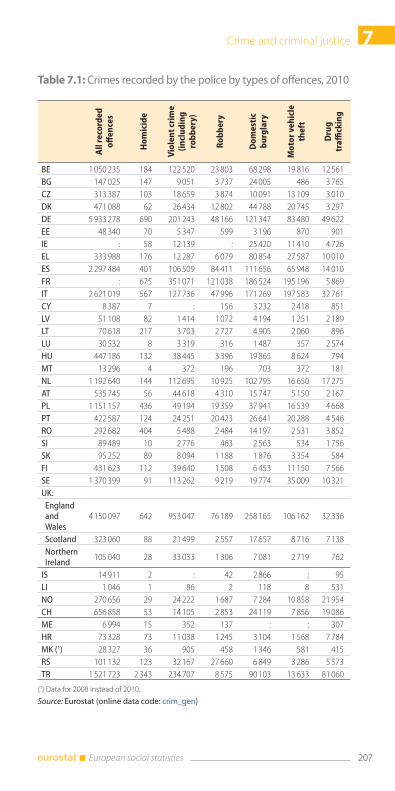
7Crime and criminal justice
207 European social statistics
Table 7.1: Crimes recorded by the police by types of offences, 2010
All
re
cord
ed
o
ffe
nce
s
Ho
mic
ide
Vio
len
t cr
ime
(i
ncl
ud
ing
ro
bb
ery
)
Ro
bb
ery
Do
me
stic
b
urg
lary
Mo
tor
veh
icle
th
eft
Dru
g
tra
ffick
ing
BE 1 050 235 184 122 520 23 803 68 298 19 816 12 561BG 147 025 147 9 051 3 737 24 005 486 3 765CZ 313 387 103 18 659 3 874 10 091 13 109 3 010DK 471 088 62 26 434 12 802 44 788 20 745 3 297DE 5 933 278 690 201 243 48 166 121 347 83 480 49 622EE 48 340 70 5 347 599 3 196 870 901IE : 58 12 139 : 25 420 11 410 4 726EL 333 988 176 12 287 6 079 80 854 27 587 10 010ES 2 297 484 401 106 509 84 411 111 656 65 948 14 010FR : 675 351 071 121 038 186 524 195 196 5 869IT 2 621 019 567 127 736 47 996 171 269 197 583 32 761CY 8 387 7 : 156 3 232 2 418 851LV 51 108 82 1 414 1 072 4 194 1 251 2 189LT 70 618 217 3 703 2 727 4 905 2 060 896LU 30 532 8 3 319 316 1 487 357 2 574HU 447 186 132 38 445 3 396 19 865 8 624 794MT 13 296 4 372 196 703 372 181NL 1 192 640 144 112 695 10 925 102 795 16 650 17 275AT 535 745 56 44 618 4 310 15 747 5 150 2 167PL 1 151 157 436 49 194 19 359 37 941 16 539 4 668PT 422 587 124 24 251 20 423 26 641 20 288 4 546RO 292 682 404 5 488 2 484 14 197 2 531 3 852SI 89 489 10 2 776 463 2 563 534 1 756SK 95 252 89 8 094 1 188 1 876 3 354 584FI 431 623 112 39 640 1 508 6 453 11 150 7 566SE 1 370 399 91 113 262 9 219 19 774 35 009 10 321UK: England and Wales
4 150 097 642 953 047 76 189 258 165 106 162 32 336
Scotland 323 060 88 21 499 2 557 17 657 8 716 7 138 Northern Ireland
105 040 28 33 033 1 306 7 081 2 719 762
IS 14 911 2 : 42 2 866 : 95LI 1 046 1 86 2 118 8 531NO 270 656 29 24 222 1 687 7 284 10 858 21 954CH 656 858 53 14 105 2 853 24 119 7 856 19 086ME 6 994 15 352 137 : : 307HR 73 328 73 11 038 1 245 3 104 1 568 7 784MK (1) 28 327 36 905 458 1 346 581 415RS 101 132 123 32 167 27 660 6 849 3 286 5 573TR 1 521 723 2 343 234 707 8 575 90 103 13 633 81 060
(1) Data for 2008 instead of 2010.
Source: Eurostat (online data code: crim_gen)
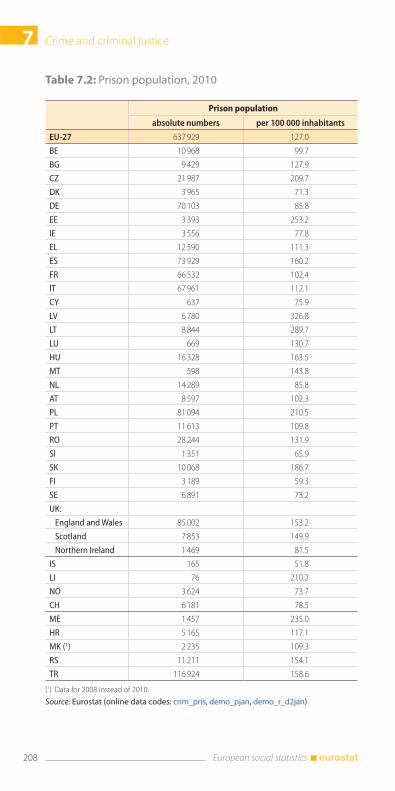
Crime and criminal justice7
208 European social statistics
Table 7.2: Prison population, 2010
Prison population
absolute numbers per 100 000 inhabitants
EU-27 637 929 127.0
BE 10 968 99.7
BG 9 429 127.9
CZ 21 987 209.7
DK 3 965 71.3
DE 70 103 85.8
EE 3 393 253.2
IE 3 556 77.8
EL 12 590 111.3
ES 73 929 160.2
FR 66 532 102.4
IT 67 961 112.1
CY 637 75.9
LV 6 780 326.8
LT 8 844 289.7
LU 669 130.7
HU 16 328 163.5
MT 598 143.8
NL 14 289 85.8
AT 8 597 102.3
PL 81 094 210.5
PT 11 613 109.8
RO 28 244 131.9
SI 1 351 65.9
SK 10 068 186.7
FI 3 189 59.3
SE 6 891 73.2
UK:
England and Wales 85 002 153.2
Scotland 7 853 149.9
Northern Ireland 1 469 81.5
IS 165 51.8
LI 76 210.2
NO 3 624 73.7
CH 6 181 78.5
ME 1 457 235.0
HR 5 165 117.1
MK (1) 2 235 109.3
RS 11 211 154.1
TR 116 924 158.6
(1) Data for 2008 instead of 2010.
Source: Eurostat (online data codes: crim_pris, demo_pjan, demo_r_d2jan)
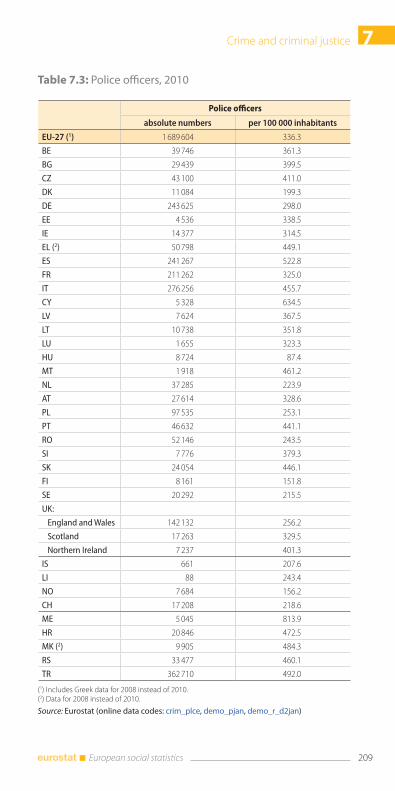
7Crime and criminal justice
209 European social statistics
Table 7.3: Police officers, 2010
Police officers
absolute numbers per 100 000 inhabitants
EU-27 (1) 1 689 604 336.3
BE 39 746 361.3
BG 29 439 399.5
CZ 43 100 411.0
DK 11 084 199.3
DE 243 625 298.0
EE 4 536 338.5
IE 14 377 314.5
EL (2) 50 798 449.1
ES 241 267 522.8
FR 211 262 325.0
IT 276 256 455.7
CY 5 328 634.5
LV 7 624 367.5
LT 10 738 351.8
LU 1 655 323.3
HU 8 724 87.4
MT 1 918 461.2
NL 37 285 223.9
AT 27 614 328.6
PL 97 535 253.1
PT 46 632 441.1
RO 52 146 243.5
SI 7 776 379.3
SK 24 054 446.1
FI 8 161 151.8
SE 20 292 215.5
UK:
England and Wales 142 132 256.2
Scotland 17 263 329.5
Northern Ireland 7 237 401.3
IS 661 207.6
LI 88 243.4
NO 7 684 156.2
CH 17 208 218.6
ME 5 045 813.9
HR 20 846 472.5
MK (2) 9 905 484.3
RS 33 477 460.1
TR 362 710 492.0
(1) Includes Greek data for 2008 instead of 2010.(2) Data for 2008 instead of 2010.
Source: Eurostat (online data codes: crim_plce, demo_pjan, demo_r_d2jan)
Data coverage, symbols and abbreviations
210 European social statistics
Data coverage, symbols and abbreviations
Data coverage and direct links to the database
The data presented within this publication were extracted between
January and March 2013.
The Eurostat website is constantly being updated; therefore it is
likely that fresher data will have become available since the data
was extracted for the production of this publication. It is possible
to access the latest version of each data set through hyper-links
that are provided as part of the source under the tables and graphs.
The link below can also be used to obtain direct access to the most
recent data on Eurostat’s website at:
http://epp.eurostat.ec.europa.eu/portal/page/portal/statistics/search_
database
This publication presents information for the EU-27 (the 27 Mem-
ber States of the EU), as well as the individual Member States. The
order of the Member States used in the publication generally fol-
lows their order of protocol; in other words, the alphabetical order
of the countries’ names in their respective original languages; in
some graphs the data are ranked according to the values of a par-
ticular indicator. Where available, information is also presented
for the EFTA countries – Iceland, Lichtenstein, Norway and Swit-
zerland and the Candidate Countries – Montenegro, Croatia (8),
the former Yugoslav Republic of Macedonia, Serbia and Turkey.
Where specific data are not available for the EFTA and Candidate
countries, these have been excluded from tables and graphs in or-
der to save space; however, the full set of 27 EU Member States
is maintained in tables, with footnotes being added in graphs for
those Member States for which information is missing.
Symbols
Eurostat online databases contain a large amount of meta-data
that provides information on the status of particular values. In or-
der to improve readability, the majority of this has been omitted
when constructing the tables and graphs.
(8) The EU and Croatian leaders signed Croatia’s EU Accession Treaty on 9 December 2011. Croatia is called thereafter an ‘acceding country’ (instead of a ‘candidate country’). Subject to ratification of the Treaty by all the Member States and Croatia, Croatia will become the EU’s 28th Member State on 1 July 2013.
Data coverage, symbols and abbreviations
211 European social statistics
The following symbols are used, where necessary:
Italic value is a forecast, provisional, an estimate or unreliable
: not available, confidential or extremely unreliable value
– not applicable
0 less than half the final digit shown and greater than real zero
Breaks in series are indicated in the footnotes provided under each
table and figure.
Abbreviations
EU European Union
EU-27 European Union of 27 Member states from 1 Janu-
ary 2007 (BE, BG, CZ, DK, DE, EE, IE, EL, ES, FR,
IT, CY, LV, LT, LU, HU, MT, NL, AT, PL, PT, RO, SI,
SK, FI, SE, UK)
EA-17 Euro area (EA) aggregate in this publication refers
to 17 countries as if all 17 of these had been part
of the euro area in periods prior to 1 January 2011
(BE, DE, EE, IE, EL, ES, FR, IT, CY, LU, MT, NL,
AT, PT, SI, SK, FI)
BE Belgium
BG Bulgaria
CZ the Czech Republic
DK Denmark
DE Germany
EE Estonia
IE Ireland
EL Greece
ES Spain
FR France
IT Italy
CY Cyprus
LV Latvia
LT Lithuania
LU Luxembourg
HU Hungary
MT Malta
NL the Netherlands
Data coverage, symbols and abbreviations
212 European social statistics
AT Austria
PL Poland
PT Portugal
RO Romania
SI Slovenia
SK Slovakia
FI Finland
SE Sweden
UK the United Kingdom
EFTA European Free Trade Association
IS Iceland (also an EU candidate country)
LI Liechtenstein
NO Norway
CH Switzerland
ME Montenegro
HR Croatia
MK the former Yugoslav Republic of Macedonia
RS Serbia
TR Turkey
GDP Gross Domestic Product
EEA European Economic Area
ESS European Statistical System
EU-LFS European Union Labour Force Survey
EU-
SILC
European Union Statistics on Income and Living
Conditions
ISCED International standard classification of education
ISCO Internationals standard classification of occupa-
tions
NACE Statistical classification of economic activities in
the European Community
PPS Purchasing power standards
UN United Nations
UNSCR United States Security Council Resolution
Glossary
213 European social statistics
Glossary
Accident at work
An accident at work is a discrete occurrence during the course of
work which leads to physical or mental harm. The phrase ‘in the
course of work’ means whilst engaged in an occupational activity
or during the time spent at work. This includes cases of road traffic
accidents in the course of work but excludes accidents during the
journey between home and the workplace.
Adult education survey (AES)
The adult education survey, abbreviated as AES, is a survey car-
ried out by 29 European Union, EFTA and candidate countries
between 2005 and 2008, collecting information on education and
lifelong learning activities by individuals aged 25-64 living in pri-
vate households. The AES, which uses 2007 as a reference year, was
a pilot exercise, and there are plans to conduct additional surveys
every five years. The survey allows for international comparisons
of education, occupation and economic activity.
Aggregate
Statistics for related categories can be grouped together or aggre-
gated in order to provide a broader picture. Thus, an aggregate is
the combination of related categories, usually within a common
branch of a hierarchy, to provide information at a broader level
to that at which detailed observations are taken. The aggregation
is usually not done by simple addition, but taking account of the
relative importance of the different categories, using weights.
Asylum
Asylum is a form of protection given by a state on its territory
based on the principle of non-refoulement and internationally or
nationally recognised refugee rights. It is granted to a person who
is unable to seek protection in his/her country of citizenship and/
or residence in particular for fear of being persecuted for reasons
of race, religion, nationality, membership of a particular social
group or political opinion.
Glossary
214 European social statistics
Asylum applicant
Asylum applicant means a person having submitted an applica-
tion for international protection or having been included in such
application as a family member during the reference period. ‘Ap-
plication for international protection’ means an application for
international protection as defined in Art.2(g) of Council Direc-
tive 2004/83/EC, in other words including requests for refugee
status or for subsidiary protection status, irrespective of whether
the application was lodged on arrival at a border, or from inside
the country, and irrespective of whether the person entered the
territory legally or illegally.
At-risk-of-poverty rate
The at-risk-of-poverty rate is the share of persons with an equiv-
alised disposable income (after social transfers) below the at-risk-
of-poverty threshold, which is set at 60 % of the national median
equivalised disposable income after social transfers. This indicator
does not measure wealth or poverty, but low income in compari-
son with other residents in that country, which does not necessar-
ily imply a low standard of living. The at-risk-of-poverty rate be-
fore social transfers is calculated as the share of persons having an
equivalised disposable income before social transfers that is below
the at-risk-of-poverty threshold calculated after social transfers.
Pensions, such as old age and survivors’ (widows’ and widowers’)
benefits, are counted as income (before social transfers) and not
as social transfers. This indicator examines the hypothetical non-
existence of social transfers.
Births
A birth is defined as the start of life when a child emerges from the
body of its mother. The total number of births includes both live
births and stillbirths.
A live birth is the birth of a child who showed any sign of life; the
number of live births refers to the number of births excluding still-
births. A live birth outside marriage is a birth where the mother’s
marital status at the time of birth is other than married.
The crude birth rate is the ratio of the number of births during the
year to the average population in that year; the value is expressed
per 1 000 inhabitants.
Glossary
215 European social statistics
Cause of death
The cause of death is defined as the disease or injury which started
the train (sequence) of morbid (disease-related) events which led
directly to death, or the circumstances of the accident or violence
which produced the fatal injury. This definition is derived from the
international classification of diseases (ICD) of the World Health
Organisation. Although international definitions are harmonised,
the statistics may not be fully comparable, among countries, as
classifications may vary when the cause of death is multiple or dif-
ficult to evaluate, and because of different notification procedures.
Deaths
A death, according to the United Nations definition, is the per-
manent disappearance of all vital functions without possibility of
resuscitation at any time after a live birth has taken place; this defi-
nition therefore excludes foetal deaths (stillbirths).
Mortality is the number of deaths for a given area during a given
period. Infant mortality is the mortality of live-born children aged
less than one year.
The mortality rate or death rate is the mortality expressed as a pro-
portion of the population.
The crude mortality rate or crude death rate is defined as the ratio
of the number of deaths during the year to the average population
in that year; the value is expressed per 1 000 inhabitants.
The infant mortality rate represents the ratio of the number of
deaths of children under one year of age to the number of live births
in the reference year. The value is expressed per 1 000 live births.
Divorces
A divorce is defined as the final legal dissolution (ending) of a
marriage. A divorce is the type of separation of husband and wife
that confers on the parties the right to remarry under civil, reli-
gious or other provisions, according to the laws of each country.
Divorce is possible in all European Union Member States. In al-
most all countries, divorces are registered at a court.
The crude divorce rate is the ratio of the number of divorces dur-
ing the year to the average population in that year. The value is
expressed per 1 000 inhabitants.
Glossary
216 European social statistics
Dwelling
A dwelling is a room or suite of rooms – including its accessories,
lobbies and corridors – in a permanent building or a structurally
separated part thereof which, by the way it has been built, rebuilt
or converted, is designed for habitation by one private household
all year round. A dwelling can be either a one-family dwelling in
a stand-alone building or detached edifice, or an apartment in a
block of flats. Dwellings include garages for residential use, even
when apart from the habitation or belonging to different owners.
Early leavers from education and training
The term ‘early leaver from education and training’, previously named
‘early school leaver’, generally refers to a person aged 18-24 who has
finished no more than a lower secondary education and is not in-
volved in further education or training; the number of such persons
can be expressed as a percentage of the total population aged 18-24.
For Eurostat statistical purposes, an early leaver from education
and training is operationally defined as a person aged 18-24 re-
corded in the labour force survey (LFS):
whose highest level of education or training attained is ISCED
0, 1, 2 or 3c short; and
who received no education or training in the four weeks preced-
ing the survey.
Earnings
Earnings are the wage or salary paid to an employee. There are two
main types:
gross earnings are paid in cash directly to an employee before
any deductions for income tax and social security contributions
paid by the employee. All bonuses, whether or not regularly
paid, are included (for example 13th or 14th month, holiday
bonuses, profit-sharing, allowances for leave not taken, and oc-
casional commissions);
net earnings represent the part of remuneration that employ-
ees can actually spend and are calculated by deducting social
security contributions and income taxes payable by employees
from gross earnings and by adding family allowances if there are
children in the family.
Glossary
217 European social statistics
Education
Broadly speaking, education refers to any act or experience that has a formative effect on an individual’s mind, character, or physical ability.
In its technical sense, education is the formal process by which so-
ciety, through schools, colleges, universities and other institutions,
deliberately transmits its cultural heritage and its accumulated
knowledge, values and skills to the next generation.
Employee
An employee is a person who has a contract to carry out work
for an employer and receives compensation in the form of wages,
salaries, fees, gratuities, piecework pay or remuneration in kind.
Employee – EU-LFS
The EU labour force survey defines an employee as an individual
who works for a public or private employer and who in return re-
ceives compensation in the form of wages, salaries, fees, gratuities,
payment by results or payment in kind. Professional military staff
are also included.
Employment
Employment is defined as the number of persons engaged in pro-
ductive activities in an economy. The concept includes employees,
the self-employed and the contributing family workers.
The two main measures used for employment are the number of
persons employed and the number of employees. More complex
measures of employment are sometimes produced by measur-
ing the number of hours worked or by converting the number of
hours worked into full-time equivalent units. In addition, some
particular categories of employment are measured, such as part-
time employment, female employment, self-employment, appren-
ticeships, home-workers and unpaid employment (unpaid family
workers and working proprietors).
Employment rate
The employment rate is the percentage of employed persons in rela-
tion to the comparable total population. For the overall employment
rate, the comparison is made with the population of working age; but
employment rates can also be calculated for a particular age group
and/or gender in a specific geographical area (for example the males
of age 15-24 employed in one of the European Union Member States).
Glossary
218 European social statistics
Equivalised disposable income
Equivalised disposable income is the total income of a household,
after tax and other deductions, that is available for spending or
saving, divided by the number of household members converted
into equivalent adults; household members are made equivalent
by weighting each according to their age, using the so-called mod-
ified OECD equivalence scale.
For poverty indicators, the equivalised disposable income is calcu-
lated from the total disposable income of each household divided
by the equivalised household size. The income reference period
is a fixed 12-month period (such as the previous calendar or tax
year) for all countries except the United Kingdom for which the
income reference period is the current year and Ireland for which
the survey is continuous and income is collected for the previous
twelve months.
Europe 2020 strategy
The Europe 2020 strategy is a strategy for the European Union to
develop as a smarter, knowledge-based, greener economy, grow-
ing fast and sustainably, creating high levels of employment and
social progress. It has been designed as the successor to the Lisbon
strategy, which was the reform strategy for the European Union
for the decade from 2000 to 2010.
As in the Lisbon process, a set of structural indicators for monitor-
ing the progress made in achieving the objectives of the Europe
2020 strategy is being used. Eurostat compiles these indicators
which will be used within the annual monitoring exercise.
EU statistics on income and living
conditions (EU-SILC)
EU statistics on income and living conditions, abbreviated as EU-
SILC, is the reference source for comparative statistics on income
distribution and social inclusion within the European Union.
EU-SILC is a multi-purpose instrument which focuses mainly on
income. Detailed data are collected on income components, most-
ly on personal income, although a few household income com-
ponents are included. However, information on social exclusion,
housing conditions, labour, education and health is also obtained.
The reference population in EU-SILC includes all private house-
holds and their current members residing in the territory of the
Glossary
219 European social statistics
countries at the time of data collection. Persons living in collec-
tive households and in institutions are generally excluded from the
target population. All household members are surveyed, but only
those aged 16 and over are interviewed.
European system of integrated social protection
statistics (ESSPROS)
The European system of integrated social protection statistics, ab-
breviated as ESSPROS, is a common framework developed in the
late 1970’s by Eurostat and the European Union Member States
providing a coherent comparison between European countries of
social benefits to households and their financing, thus making an
international comparison of the administrative national data on
social protection possible.
ESSPROS is built on the concept of social protection, or the cover-
age of precisely defined risks and needs including health, disabil-
ity, old age, family and unemployment. It records the receipts and
the expenditure of the organisations or schemes involved in social
protection interventions.
Fatal accident at work
A fatal accident at work is a physical or mental injury that oc-
curs during work activities, leading to death within one year. It
excludes accidents on the way to or from work, occurrences of a
strictly medical origin and occupational diseases.
Fertility
Fertility is the ability to conceive (become pregnant) and give birth
to children. The total fertility rate is defined as the mean number
of children who would be born to a woman during her lifetime, if
she were to spend her childbearing years conforming to the age-
specific fertility rates that have been measured in a given year.
The age-specific fertility rate or the fertility rate by age of mother is the number of births to mothers of age x proportional to the average female population of age x.
Gender gap
A gender gap may refer to any statistical disparities between men
and women. Usually, however, it refers to differences in labour
market statistics, such as the gender pay gap, or differences in em-
ployment and unemployment.
Glossary
220 European social statistics
Gender pay gap (GPG)
The gender pay gap, abbreviated as GPG, refers to the difference in
average wages between men and women. The unadjusted gender
pay gap is calculated as the difference between the average gross
hourly earnings of male and female paid employees as a percent-
age of average gross hourly earnings of male paid employees.
From the reference year 2006 onwards, the GPG is computed
annually in the European Union (EU) according to three main
guidelines; the GPG is:
unadjusted, in other words without correcting for national
differences in individual characteristics of employed men and
women – the main reason is that, at this stage, there is neither
consensus nor scientific evidence on which adjustment method
should be used;
calculated using gross hourly earnings – this choice aims to ex-
clude from the measurement differences among EU Member
States in terms of the use of part-time work;
based on a harmonised source across the EU, the structure of earn-
ings survey (SES), a rich employer-employee matched data set.
The unadjusted GPG aggregates for the EU-27 and the euro area
(EA-17) are calculated by Eurostat as the average of the national
GPGs weighted by the corresponding number of employees, both
for the overall GPG and its breakdown by main industrial grouping.
The annual data provided by the EU Member States between two
SES rounds are broken down by economic activity, age class and
type of economic control of the enterprise.
Gross domestic product (GDP)
Gross domestic product, abbreviated as GDP, is a basic measure of
a country’s overall economic health. As an aggregate measure of
production, GDP is equal to the sum of the gross value added of all
resident institutional units (in other words industries) engaged in
production, plus any taxes, and minus any subsidies, on products
not included in the value of their outputs. Gross value added is the
difference between output and intermediate consumption.
GDP is also equal to:
the sum of the final uses of goods and services (all uses except
intermediate consumption) measured in purchasers’ prices, mi-
nus the value of imports of goods and services;
the sum of primary incomes distributed by resident producer
units.
Glossary
221 European social statistics
Healthcare
Healthcare in a country comprises the sum of activities performed
either by institutions or individuals pursuing, through the applica-
tion of medical, paramedical and nursing knowledge and technol-
ogy, the purposes/core functions of:
promoting health and preventing disease;
curing illness and reducing premature mortality;
caring for persons affected by chronic illness who require nurs-
ing care;
caring for persons with health-related impairment, disability,
and handicaps who require nursing care;
assisting patients to die with dignity;
providing and administering public health;
providing and administering health programmes, health insur-
ance and other funding arrangements.
Healthy life years (HLY)
The number of healthy life years, abbreviated as HLY, and also
called disability-free life expectancy (DFLE), is defined as the
number of years that a person is expected to continue to live in a
healthy condition. This statistical indicator is compiled separately
for men and women, both at birth and at age 65. It is based on age-
specific prevalence (proportions) of the population in healthy and
unhealthy condition and age-specific mortality information. A
healthy condition is defined as one without limitation in function-
ing and without disability. The indicator is calculated following the
widely used Sullivan method. It is based on measures of the age-
specific proportion of population with and without disability and
on mortality data. Its interest lies in its simplicity, the availability
of its basic data, and its independence from the size and age struc-
ture of the population. However, cultural differences in reporting
disability can influence the HLY indicator.
Hospital
Hospitals include licensed establishments primarily engaged in
providing medical, diagnostic and treatment services that include
physician, nursing, and other health services to in-patients and the
specialised accommodation services needed by in-patients.
Hospital bed
Hospital bed numbers provide information on healthcare capaci-
ties, in other words on the maximum number of patients who can
Glossary
222 European social statistics
be treated by hospitals. Hospital beds are those which are regularly
maintained and staffed and immediately available for the care of
admitted patients. They cover beds accommodating patients who
are formally admitted (or hospitalised) to an institution for treat-
ment and/or care and who stay for a minimum of one night. These
include: beds in all hospitals, including general hospitals, mental
health and substance abuse hospitals, and other specialty hospi-
tals, irrespective of whether the bed is occupied or not. The sta-
tistics presented exclude surgical tables, recovery trolleys, emer-
gency stretchers, beds for same-day care, cots for healthy infants,
beds in wards which were closed for any reason, provisional and
temporary beds, or beds in nursing and residential care facilities.
A curative care bed or acute care bed is a hospital bed available for
curative care; these form a subgroup of total hospital beds.
Hours worked
Hours worked is the number of hours actually worked, defined as
the sum of all periods spent on direct and ancillary activities to
produce goods and services.
Housing cost overburden rate
The housing cost overburden rate is the percentage of the popula-
tion living in households where total housing costs (net of housing
allowances) represent more than 40 % of disposable income (net of
housing allowances).
Inactive
A person is economically inactive, according to the International
Labour Organization definition, if he or she is not part of the la-
bour force. So inactive persons are neither employed nor unem-
ployed. The inactive population can include pre-school children,
school children, students, pensioners and homemakers, for exam-
ple, provided that they are not working at all and not available or
looking for work either; some of these may be of working age.
Inequality of income distribution
Inequality of income distribution is the ratio of total income re-
ceived by the 20 % of the population having the highest income
(top quintile) to the total income of the 20 % of the population
having the lowest income (bottom quintile). Income is based on
equivalised disposable income.
Glossary
223 European social statistics
International standard classification of education
(ISCED)
The international standard classification of education (ISCED) is
an instrument for compiling internationally comparable educa-
tion statistics.
The current version, ISCED 97, covers two classification variables:
levels and fields of education as well as general/vocational/prevo-
cational orientation and educational/labour market destination.
ISCED 97 was implemented in European Union countries for col-
lecting data starting with the 1997/98 school year.
There are seven levels of education in ISCED 97:
Level 0 pre-primary education – the initial stage of organised in-
struction; it is school- or centre-based and is designed for children
aged at least three years.
Level 1 primary education – begins between five and seven years of
age, is the start of compulsory education where it exists and gener-
ally covers six years of full-time schooling.
Level 2 lower secondary education – continues the basic pro-
grammes of the primary level, although teaching is typically more
subject-focused. Usually, the end of this level coincides with the
end of compulsory education.
Level 3 upper secondary education – generally begins at the end of
compulsory education. The entrance age is typically 15 or 16 years.
Entrance qualifications (end of compulsory education) and other
minimum entry requirements are usually needed. Instruction is
often more subject-oriented than at ISCED level 2. The typical du-
ration of ISCED level 3 varies from two to five years.
Level 4 post-secondary non-tertiary education – between upper
secondary and tertiary education. This level serves to broaden
the knowledge of ISCED level 3 graduates. Typical examples are
programmes designed to prepare pupils for studies at level 5 or
programmes designed to prepare pupils for direct labour market
entry.
Level 5 tertiary education (first stage) – entry to these programmes
normally requires the successful completion of ISCED level 3 or
4. This includes tertiary programmes with academic orientation
(type A) which are largely theoretical and tertiary programmes
with an occupational orientation (type B). The latter are typically
shorter than type A programmes and aimed at preparing students
for the labour market.
Glossary
224 European social statistics
Level 6 tertiary education (second stage) – reserved for tertiary
studies that lead to an advanced research qualification (Ph.D. or
doctorate).
Fields of educationThe ISCED classification comprises 25 fields of education in all (at
the two-digit level), which can be further refined into the three-
digit level. At the highest one-digit level the following nine broad
groups of fields of education are distinguished:
0 general programmes;
1 education;
2 humanities and arts;
3 social sciences, business and law;
4 science;
5 engineering, manufacturing and construction;
6 agriculture;
7 health and welfare;
8 services.
Job vacancy rate (JVR)
A job vacancy is a post, either newly created, unoccupied or about
to become vacant, which the employer:
actively seeks to fill with a suitable candidate from outside the
enterprise, including any further necessary steps; and
intends to fill either immediately or in the near future.
The job vacancy rate, abbreviated as JVR, measures the percentage
of vacant posts, as defined above, compared with the total number
of occupied and unoccupied posts; it is calculated as follows:
JVR = number of job vacancies/(number of occupied posts +
number of job vacancies) * 100.
An occupied post is a post within an organisation to which an
employee has been assigned.
Data on job vacancies and occupied posts are broken down by
economic activity, occupation, size of enterprise and region.
Labour cost
Labour cost or total labour cost is the total expenditure borne by
employers for employing staff. Labour cost consists of employee
compensation (including wages, salaries in cash and in kind, em-
ployers’ social security contributions), vocational training costs,
other expenditure such as recruitment costs, spending on working
Glossary
225 European social statistics
clothes and employment taxes regarded as labour costs minus any
subsidies received. The Eurostat definition closely follows the in-
ternational one laid down by the International Conference of La-
bour Statisticians (Geneva, 1966) in its resolution on the statistics
of labour cost. The labour cost includes both direct and indirect
costs.
Direct costs are dominated by wages and salaries paid in cash.
Indirect costs are dominated by employers’ actual social contribu-
tions, in particular by employers’ statutory social security contri-
butions.
Labour cost index (LCI)
The labour cost index, abbreviated as LCI, is a short-term indica-
tor showing the short-term development of hourly labour costs
incurred by employers, i.e. the total cost on an hourly basis of em-
ploying labour. In other words, the LCI measures the cost pressure
arising from the production factor “labour”.
It is calculated dividing the labour costs by the number of hours
worked. Labour costs are made up of costs for wages and sala-
ries, plus non-wage costs such as employer’s social contributions.
These do not include vocational training costs or other expen-
ditures such as recruitment costs, spending on working clothes,
etc.
The LCI covers all business units irrespective of the number of
employees and all economic activities except agriculture, forestry
and fishing, private households and extra-territorial organisa-
tions.
Labour cost survey (LCS)
The Labour cost survey is a survey conducted every four years in
the Member States of the European Union (EU) measuring the
level and structure of labour costs, or total expenditure borne by
employers for the purpose of employing staff. The survey covers
enterprises with 10 employees or more, operating in all economic
activities defined in sections B to S (excluding O) of NACE Rev. 2.
Data become available approximately two years after the end of
the reference period.
In the Labour cost survey, detailed information is collected to
calculate the various components of labour costs. Besides wage
components (e.g. direct remuneration, bonuses and allowances,
payments to employees’ saving schemes, payments for days not
Glossary
226 European social statistics
worked, as well as wages and salaries in kind), these include so-
cial security contributions paid by the employer (statutory, under
collective agreements, contractual or voluntary), together with
employers’ ‘imputed’ social contributions (e.g. guaranteed remu-
neration in the event of sickness or payments to employees leaving
the business). Costs of vocational training and taxes and subsidies
relating to the employment of staff are also recorded.
At the same time, the survey also asks about the number of full-
time jobs and the number of hours worked and paid.
Labour force
The labour force or the economically active population, also short-
ened to the active population, includes both employed and unem-
ployed persons, but not the economically inactive, such as pre-
school children, school children, students and pensioners.
Labour force survey (LFS)
The labour force survey, abbreviated as LFS, is an inquiry directed
to households, designed to obtain information on the labour mar-
ket and related issues through a series of personal interviews.
The European Union (EU) LFS covers all citizens living in private
households and excludes those in collective households, such as
boarding houses, residence halls and hospitals. The definitions
used are common to all EU Member States and are based on inter-
national recommendations by the International Labour Organiza-
tion (ILO).
Labour market
The labour market is the real or virtual meeting point, within an
economy or market place, where people selling their labour (em-
ployees) negotiate and may reach an agreement with those who
buy it (employers).
Labour markets provide the structure through which workers
and employers interact about jobs, working conditions and pay.
Other actors are the institutions and processes of collective bar-
gaining, including the roles played by employers’ organisations
and trade unions. The labour market concept also covers issues
such as employment, unemployment, participation rates and
wages.
Glossary
227 European social statistics
Labour market policy (LMP)
The labour market policy (LMP) database covers all labour market
measures which can be described as public interventions in the
labour market aimed at reaching its efficient functioning and to
correct disequilibria and which can be distinguished from other
general employment policy measures in that they act selectively to
favour particular groups in the labour market.
Public interventions refer to measures taken by general govern-
ment in this respect which involve expenditure, either in the form
of actual disbursements or of forgone revenue (reductions in taxes,
social contributions or other charges normally payable). The scope
of the database is also limited to labour market measures which
are explicitly targeted in some way at groups of persons with dif-
ficulties in the labour market – referred to here as target groups. In
broad terms, this covers persons who are unemployed, persons in
employment but at risk of involuntary job loss, and inactive per-
sons who are currently not part of the labour force (in the sense
that they are not employed or unemployed according to the ILO
definitions) but who would like to enter the labour market and are
disadvantaged in some way.
Life expectancy
Life expectancy at a certain age is the mean additional number
of years that a person of that age can expect to live, if subjected
throughout the rest of his or her life to the current mortality con-
ditions (age-specific probabilities of dying, in other words the
death rates observed for the current period).
Lifelong learning
Lifelong learning is the lifelong, voluntary and self-motivated
pursuit of knowledge for personal or professional reasons. The
overall aim of learning is to improve knowledge, skills and com-
petences. The intention to learn distinguishes learning activities
from non-learning activities such as cultural activities or sports
activities.
Within the domain of lifelong learning statistics, formal education
covers education and training in the regular system of schools,
universities and colleges. Non-formal education and training in-
cludes all taught learning activities which are not part of a for-
mal education programme. The information collected relates to
all education or training regardless of whether it is relevant to the
Glossary
228 European social statistics
respondent’s current or possible future job. Lifelong learning sta-
tistics collected by Eurostat do not cover informal learning.
Long-term unemployment
Long-term unemployment refers to the number of people who are
out of work and have been actively seeking unemployment for at
least a year.
An unemployed person is defined as being aged 15 to 74 (or aged
16 to 74 in Spain, the United Kingdom, Iceland and Norway) who
was without work during the reference week, was currently avail-
able for work and was either actively seeking work in the last four
weeks or had already found a job to start within the next three
months. The unemployment period is defined as the duration of
a job search, or as the length of time since the last job was held (if
shorter than the time spent on a job search). This definition fol-
lows International Labour Organization guidelines.
Marriages
A marriage is the act, ceremony or process by which the legal rela-
tionship between two persons is formed. The legality of the union
may be established by civil, religious or other means as recognised
by the laws of each country.
In all European Union and other European countries, contracting
a civil marriage (before official authorities and on a legal basis)
is possible. However, the relation between a civil marriage and a
religious marriage (before religious representative only) is not the
same in all countries. In 15 countries (Denmark, Estonia, Ireland,
Greece, Spain, Italy, Cyprus, Latvia, Lithuania, Poland, Slovak,
Finland, Sweden and the United Kingdom, as well as Norway) a
religious marriage has consequences for the civil marriage in the
sense that a religious marriage is recognised by the state as equiva-
lent to a civil marriage. France states that a religious marriage has
no consequences for marital status, unless it has been contracted
abroad.
The crude marriage rate is the ratio of the number of marriages
during the year to the average population in that year. The value is
expressed per 1 000 inhabitants.
Material deprivation
Material deprivation refers to a state of economic strain and dura-
bles strain, defined as the enforced inability (rather than the choice
Glossary
229 European social statistics
not to do so) to pay unexpected expenses, afford a one-week an-
nual holiday away from home, a meal involving meat, chicken or
fish every second day, the adequate heating of a dwelling, durable
goods like a washing machine, colour television, telephone or car,
being confronted with payment arrears (mortgage or rent, utility
bills, hire purchase instalments or other loan payments).
The material deprivation rate is an indicator in EU-SILC that ex-
presses the inability to afford some items considered by most peo-
ple to be desirable or even necessary to lead an adequate life. The
indicator distinguishes between individuals who cannot afford a
certain good or service, and those who do not have this good or
service for another reason, for example because they do not want
or do not need it.
The indicator adopted by the Social Protection Committee meas-
ures the percentage of the population that cannot afford at least
three of the following nine items: 1. to pay their rent, mortgage or
utility bills; 2. to keep their home adequately warm; 3. to face un-
expected expenses; 4. to eat meat or proteins regularly; 5. to go on
holiday; 6. a television set; 7. a refrigerator; 8. a car; 9. a telephone.
Severe material deprivation rate is defined as the enforced inability
to pay for at least four of the above-mentioned items.
Migration
Migration refers to the number of migrants, i.e. persons changing
their residence to or from a given area (usually a country) during
a given time period (usually one year).
Immigrants are persons arriving or returning from abroad to take
up residence in a country for a certain period, having previously
been resident elsewhere. Immigration is the number of immi-
grants for a given area during the year.
Emigrants are persons leaving the country where they usually re-
side and effectively taking up residence in another country. Emi-
gration is the number of emigrants for a given area during the year.
Net migration is the difference between immigration to and
emigration from a given area during the year (net migration is
positive when there are more immigrants than emigrants and
negative when there are more emigrants than immigrants). Since
many countries either do not have accurate figures on immigra-
tion and emigration, or have no figures at all, net migration has
to be estimated. It is usually estimated as the difference between
the total population change and the natural increase during the
Glossary
230 European social statistics
year. Net migration gives no indication of the relative scale of the
separate immigration and emigration flows to and from a country;
a country may report low net migration but experience high im-
migration and emigration flows.
The crude rate of net migration is the ratio of net migration dur-
ing the year to the average population in that year. The value is
expressed per 1 000 inhabitants.
A recognised non-citizen is a person who is not a citizen of the
reporting country nor of any other country, but who has estab-
lished links to that country which include some but not all rights
and obligations of full citizenship. Recognised non-citizens are not
included in the number of European Union citizens.
Minimum wage
The minimum wage is the lowest wage that employers are legally
obliged to pay their employees. The basic national minimum wage
can be fixed at an hourly, weekly or monthly rate, and this mini-
mum wage is enforced by law (the government), often after con-
sultation with social partners, or directly by national intersectoral
agreement (in the European Union this is the case for Belgium
and Greece).
The national minimum wage usually applies to all employees, or at
least to a large majority of employees in the country. Some coun-
tries have exceptions, for example for younger workers, appren-
tices or workers with disabilities. Gross amounts are reported, that
is, before income tax and social security deductions, which vary
between countries.
Natural population change
Natural population change is the difference between the number
of live births and deaths during a given time period (usually one
year). It can be either positive or negative. Natural population in-
crease is a positive natural change, when the number of live births
is larger than the number of deaths during the time period con-
sidered. Natural population decrease is the opposite, a negative
natural change, when the number of deaths exceeds the number
of births.
Non-nationals
Non-nationals are people who are not citizens of the country in
which they currently reside
Glossary
231 European social statistics
Old age dependency ratio
The old age dependency ratio is the ratio of the number of elderly
people at an age when they are generally economically inactive
(in other words aged 65 and over), compared with the number of
people of working age (in other words 15-64 years old).
Overcrowding rate
The overcrowding rate is defined as the percentage of the popula-
tion living in an overcrowded household.
A person is considered as living in an overcrowded household if
the household does not have at its disposal a minimum number of
rooms equal to:
one room for the household;
one room per couple in the household;
one room for each single person aged 18 or more;
one room per pair of single people of the same gender between
12 and 17 years of age;
one room for each single person between 12 and 17 years of age
and not included in the previous category;
one room per pair of children under 12 years of age.
Persons living in households with low work intensity
The indicator ‘persons living in households with low work inten-
sity’ is defined as the number of persons living in a household hav-
ing a work intensity below a threshold set at 0.20.
The work intensity of a household is the ratio of the total number
of months that all working age household members have worked
during the income reference year and the total number of months
that the same household members theoretically could have worked
in the same period. A working age person is defined as a person
aged 18-59 years, with the exclusion of students in the age group
between 18 and 24 years. Households composed only of children,
of students aged less than 25 and/or people aged 60 or more are
totally excluded from the indicator calculation.
Police officer
Police officers generally include all ranks of police officers including
criminal police, traffic police, border police, gendarmerie, uniformed
police, city guard, and municipal police. They exclude civilian staff,
customs officers, tax police, military police, secret service police, part-
time officers, special duty police reserves, cadets, and court police.
Glossary
232 European social statistics
Population
The population figure of a given area is the total number of people
in that area at a given time.
Eurostat collects population data as of 1 January of each year from
the European Union’s Member States. The recommended defini-
tion is the ‘usual resident population’ and represents the number
of inhabitants of a given area on 1 January of the year in question
(or, in some cases, on 31 December of the previous year). The pop-
ulation can be based on data from the most recent census adjusted
by the components of population change produced since the last
census, or based on population registers.
The average population is calculated as the arithmetic mean of
the population on 1 January of two consecutive years. The aver-
age population is further used in the calculation of demographic
indicators, like crude rates per 1 000 inhabitants, and for some ‘per
capita’ indicators.
Population change
Population change, defined generally, is the difference in the
size of a population between the end and the beginning of a
given time period. Specifically, it is the difference in popu-
lation size on 1 January of two consecutive years. Population
change has two components: natural population change (the
number of live births minus the number of deaths); net mi-
gration (the number of immigrants minus the number of emi-
grants, plus statistical adjustment – it should be noted that net
migration as referred to in the context of population change
statistics includes the statistical adjustments occurring in the
annual balance of the population and that it serves the purpose
of closing this balance).
A positive population change, when the result of net migra-
tion plus live births minus deaths is positive, is referred to as
population growth, a negative one is called a population de-
crease. The crude rate of population growth is the ratio of total
population growth during the year to the average population
of the area in question that year. The value is expressed per
1 000 inhabitants.
Glossary
233 European social statistics
Prison population
For statistical purposes, the prison population is defined as the total number of adult and juvenile prisoners (including pre-trial detainees) at 1 September of a given year. The definition includes offenders held in prison administration facilities, other facilities, juvenile offenders institutions, drug addicts institutions and psychiatric or other hospitals. It excludes, however, non-criminal prisoners held for administrative purposes (for example, people held pending an investigation into their immigration status).
Public expenditure on education
Public expenditure on education generally refers to:
direct expenditure on educational institutions: bearing directly
the current and capital expenses of educational institutions;
transfers to private households and firms: supporting students
and their families with scholarships and public loans, as well as
transferring public subsidies for educational activities to private
firms or non-profit organisations.
Both types of transactions constitute total public expenditure on
education.
Purchasing power standard (PPS)
The purchasing power standard, abbreviated as PPS, is an artificial
currency unit. Theoretically, one PPS can buy the same amount
of goods and services in each country. However, price differences
across borders mean that different amounts of national currency
units are needed for the same goods and services depending on
the country. PPS are derived by dividing any economic aggregate
of a country in national currency by its respective purchasing
power parities. PPS is the technical term used by Eurostat for the
common currency in which national accounts aggregates are ex-
pressed when adjusted for price level differences using PPPs. Thus,
PPPs can be interpreted as the exchange rate of the PPS against
the euro.
Relative median at-risk-of-poverty gap
The relative median at-risk-of-poverty gap is calculated as the
difference between the median equivalised disposable income of
persons below the at-risk-of-poverty threshold and the at-risk-of-
poverty threshold, expressed as a percentage of the at-risk-of-pov-
erty threshold (cut-off point: 60 % of national median equivalised
disposable income).
Glossary
234 European social statistics
Relative median income ratio
The relative median income ratio is defined as the ratio of the me-
dian equivalised disposable income of persons aged 65 and over to
the median equivalised disposable income of those aged below 65.
Self-employed
A self-employed person is the sole or joint owner of an unincor-
porated enterprise (one that has not been incorporated in other
words formed into a legal corporation) in which he/she works, un-
less they are also in paid employment which is their main activity
(in that case, they are considered to be employees).
Self-employed persons also include:
unpaid family workers;
outworkers (who work outside the usual workplace, such as at
home);
workers engaged in production done entirely for their own final
use or own capital formation, either individually or collectively.
Serious accident at work
A serious accident at work is an accident resulting in more than
three days’ absence of the employee involved. An accident at work
is a discrete occurrence in the course of work that leads to physi-
cal or mental harm. This includes accidents outside the business
premises, even if caused by a third party, and cases of acute poi-
soning. It excludes accidents to or from work, occurrences of a
strictly medical nature, and occupational diseases.
Small and medium-sized enterprises (SMEs)
Small and medium-sized enterprises are enterprises employing
fewer than 250 persons. According to European Commission Rec-
ommendation 2003/361/EC of 6 May 2003, enterprises are defined
with regard to their number of employees, their annual turnover,
and their independence.
For statistical purposes, small and medium-sized enterprises may
be further subdivided into:
micro enterprises (fewer than 10 persons employed);
small enterprises (10 to 49 persons employed);
medium-sized enterprises (50 to 249 persons employed).
Large enterprises are defined as those with 250 or more persons
employed.
Glossary
235 European social statistics
Social benefits
Social benefits other than social transfers in kind are transfers
made in cash to households to relieve them of the financial burden
of certain risks or needs, for example, pensions, family and child
allowances, and disabled persons’ allowances.
Social benefits are paid out by social security funds, other govern-
ment units, non-profit institutions serving households (NPISHs),
employers administering unfunded social insurance schemes, in-
surance enterprises or other institutional units administering pri-
vately funded social insurance schemes.
Social contributions
Social contributions are paid on a compulsory or voluntary ba-
sis by employers, employees and self- and non-employed persons.
There are two types of social contributions, actual and imputed,
paid by the employer for the benefit of their employees:
Actual social contributions or actual payments consist of pay-
ments made by employers for the benefit of their employees to
insurers (social security funds and private funded schemes). These
payments cover statutory, conventional, contractual and voluntary
contributions in respect of insurance against social risks or needs.
Employers’ imputed social contributions represent the counter-
part to unfunded social benefits paid directly by employers to
their employees or former employees and other eligible persons
without involving an insurance enterprise or autonomous pen-
sion fund, and without creating a special fund or segregated re-
serve for the purpose.
Social protection
Social protection can be defined as the coverage of precisely de-
fined risks and needs associated with: sickness/healthcare and in-
validism; disability; old age; parental responsibilities; the loss of a
spouse or parent; unemployment; housing; social exclusion.
Social protection benefits
Social protection benefits are transfers to households, in cash or
in kind, intended to relieve them of the financial burden of several
risks and needs as defined in the European system of integrated
social protection statistics (ESSPROS). These include disability,
sickness/healthcare, old age, survivors, family/children, unem-
ployment, housing and social exclusion not covered elsewhere.
Glossary
236 European social statistics
Social protection expenditure
Social protection expenditure is the outlay for social protection
interventions. It consists mainly of:
social benefits, or transfers in cash or in kind, to households
and individuals with the aim to relieve them of the burden of a
defined set of risks or needs;
administration costs, or costs of managing or administering the
social protection scheme; and
other miscellaneous expenditure by social protection schemes
(payment of property income and other).
Social security fund
A social security fund is a central, state or local institutional unit
whose main activity is to provide social benefits. It fulfils the fol-
lowing two criteria:
by law or regulation (except those about government employ-
ees), certain population groups must take part in the scheme
and have to pay contributions;
general government is responsible for the management of the
institutional unit, for the payment or approval of the level of the
contributions and of the benefits, independent of its role as a
supervisory body or employer.
Social transfers
Social transfers cover the social help given by central, state or local
institutional units. They include: old age (retirement) and survi-
vors’ (widows’ and widowers’) pensions; unemployment benefits;
family-related benefits; sickness and invalidity benefits; educa-
tion-related benefits; housing allowances; social assistance; other
benefits.
Standardised death rate (SDR)
The standardised death rate, abbreviated as SDR, is the death rate of
a population adjusted to a standard age distribution. It is calculated
as a weighted average of the age-specific death rates of a given popu-
lation; the weights are the age distribution of that population. As
most causes of death vary significantly with people’s age and sex, the
use of standardised death rates improves comparability over time
and between countries. The reason for this is that death rates can
be measured independently of the age structure of populations in
different times and countries (sex ratios are usually more stable).
Glossary
237 European social statistics
Standardised death rates are calculated on the basis of a standard
European population defined by the World Health Organization
(WHO).
Statistical classification of economic activities in the
European Community (NACE)
The statistical classification of economic activities in the European
Community, abbreviated as NACE, designates the classification of
economic activities in the European Union. Various NACE ver-
sions have been developed since 1970.
NACE is a four-digit classification providing the framework for
collecting and presenting a large range of statistical data accord-
ing to economic activity in the fields of economic statistics (for
example, production, employment and national accounts) and in
other statistical domains developed within the European statistical
system (ESS).
NACE Rev. 2, a revised classification, was adopted at the end of
2006 and its implementation began in 2007. The first reference
year for NACE Rev. 2 compatible statistics was 2008.
Structure of earnings survey (SES)
The Structure of earnings survey, abbreviated as SES, is conduct-
ed every four years in the Member States of the European Union
(EU) and provides comparable information at EU level on rela-
tionships between the level of earnings, individual characteristics
of employees (sex, age, occupation, length of service, educational
level) and their employer (economic activity, size of the enterprise,
etc.) for reference years 2002, 2006 and 2010 (next survey with
reference year 2014).
The data collection is based on legislation and data become avail-
able approximately 2 years after the end of the reference period.
In the SES gross annual earnings cover remuneration in cash and
in kind paid during the reference year before any tax deductions
and social-security contributions payable by wage earners and re-
tained by the employer.
The SES covers businesses with at least 10 employees and all eco-
nomic activities defined in sections B to N, and P to S, of the
Statistical classification of economic activities in the European
Communities (NACE Rev 2). The transmission of data covering
small enterprises (below 10 employees) and enterprises belong-
ing to NACE Rev. 2 section O is optional.
Glossary
238 European social statistics
System of health accounts (SHA)
The system of health accounts, abbreviated as SHA, provides for
health accounting in the European Union Member States, an eco-
nomic framework, and accounting rules which are methodologi-
cally compatible with the system of national accounts.
The SHA provides a standard framework for producing a set of
comprehensive, consistent and internationally comparable ac-
counts to meet the needs of public and private sector health ana-
lysts and policymakers. At present, national health accounts are
at different stages of development and may not only differ in the
boundaries drawn between health and other social and economic
activities but also in the classifications used, in the level of detail
provided, and in the accounting rules. The SHA provides a frame-
work for a family of interrelated tables for standard reporting for
expenditure (spending) on health and for its financing. It has been
written with the dual aim of providing this framework for inter-
national data collections and as a possible model for redesigning
and complementing national health accounts to aid policymakers.
Total age-dependency ratio
The total age-dependency ratio is a measure of the age structure of
the population. It relates the number of individuals who are likely
to be ‘dependent’ on the support of others for their daily living –
the young and the elderly – to the number of those individuals
who are capable of providing this support.
The total age-dependency ratio is the ratio of the sum of the num-
ber of young and the number of elderly people at an age when both
groups are generally economically inactive, (in other words under
15 years of age and aged 65 and over), compared with the number
of people of working age (in other words 15-64 years old). It is the
sum of the two ratios, the young age-dependency ratio and the old
age-dependency ratio.
Total general government expenditure
Total general government expenditure is all the money that a gov-
ernment spends.
Total general government expenditure is defined according to
Commission Regulation (EC) No 1500/2000 of 10 July 2000 on
general government expenditure and revenue. It comprises the
following categories of the European system of accounts 1995
(ESA95): intermediate consumption; gross capital formation;
Glossary
239 European social statistics
compensation of employees; other taxes on production; subsidies
payable; property income; current taxes on income, wealth, etc.;
social benefits other than social transfers in kind; social transfers
in kind related to expenditure on products supplied to households
via market producers; other current transfers; adjustments for the
change in net equity of households in pension fund reserves; capi-
tal transfers payable; acquisitions less disposals of non-financial
non-produced assets.
Unemployment
An unemployed person is defined by Eurostat, according to the
guidelines of the International Labour Organization, as:
someone aged 15-74 (in Italy, Spain, the United Kingdom, Ice-
land, Norway: 16-74);
without work during the reference week;
available to start work within the next two weeks (or has already
found a job to start within the next three months);
actively having sought employment at some time during the last
four weeks.
The unemployment rate is the number of unemployed persons as
a percentage of the labour force.
Working-day adjustment
Working-day adjustment is a statistical method for removing the
calendar effect from an economic time series. The calendar effect
is the variation caused by the changing number of working days in
different months or other time periods (quarters, years).
Working-day adjustment is mainly used in the calculation of short-
term statistics (STS), for converting gross figures or indices into
their working-day adjusted equivalent. In order to adjust a figure or
an index, the calendar nature of a given month is taken into account
and calendar effects are removed, whatever their nature. The num-
ber of working days for a given month may depend on:
the timing of certain public holidays (Easter can fall in March or
in April, depending on the year);
the possible overlap of certain public holidays and non-working
days (1 May can fall on a Sunday);
the occurrence of a leap year.
Glossary
240 European social statistics
Youth unemployment
Youth unemployment is the unemployment among persons aged
15-24.
Youth unemployment rate is the percentage of the unemployed in
the age group 15-24 years old compared with the total labour force
(both employed and unemployed) in that age group. However, it
should be remembered that a large share of persons between these
ages are outside the labour market (since many youths are study-
ing full-time and thus are not available for work), which explains
why youth unemployment rates are generally higher than overall
unemployment rates, or those of other age groups.
While the unemployment rate is defined as the share of unem-
ployed in the labour market, the unemployment ratio relates the
number of unemployed of a given age to the total population of
that age.
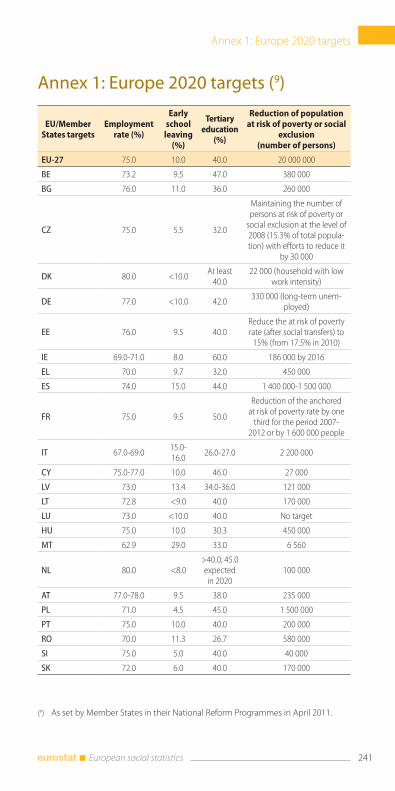
Annex 1: Europe 2020 targets
241 European social statistics
Annex 1: Europe 2020 targets (9)
EU/Member States targets
Employment rate (%)
Early school
leaving (%)
Tertiary education
(%)
Reduction of population at risk of poverty or social
exclusion (number of persons)
EU-27 75.0 10.0 40.0 20 000 000
BE 73.2 9.5 47.0 380 000
BG 76.0 11.0 36.0 260 000
CZ 75.0 5.5 32.0
Maintaining the number of persons at risk of poverty or
social exclusion at the level of 2008 (15.3% of total popula-tion) with efforts to reduce it
by 30 000
DK 80.0 <10.0At least
40.022 000 (household with low
work intensity)
DE 77.0 <10.0 42.0330 000 (long-term unem-
ployed)
EE 76.0 9.5 40.0Reduce the at risk of poverty rate (after social transfers) to
15% (from 17.5% in 2010)
IE 69.0-71.0 8.0 60.0 186 000 by 2016
EL 70.0 9.7 32.0 450 000
ES 74.0 15.0 44.0 1 400 000-1 500 000
FR 75.0 9.5 50.0
Reduction of the anchored at risk of poverty rate by one
third for the period 2007-2012 or by 1 600 000 people
IT 67.0-69.015.0-16.0
26.0-27.0 2 200 000
CY 75.0-77.0 10.0 46.0 27 000
LV 73.0 13.4 34.0-36.0 121 000
LT 72.8 <9.0 40.0 170 000
LU 73.0 <10.0 40.0 No target
HU 75.0 10.0 30.3 450 000
MT 62.9 29.0 33.0 6 560
NL 80.0 <8.0>40.0; 45.0 expected in 2020
100 000
AT 77.0-78.0 9.5 38.0 235 000
PL 71.0 4.5 45.0 1 500 000
PT 75.0 10.0 40.0 200 000
RO 70.0 11.3 26.7 580 000
SI 75.0 5.0 40.0 40 000
SK 72.0 6.0 40.0 170 000
(9) As set by Member States in their National Reform Programmes in April 2011.
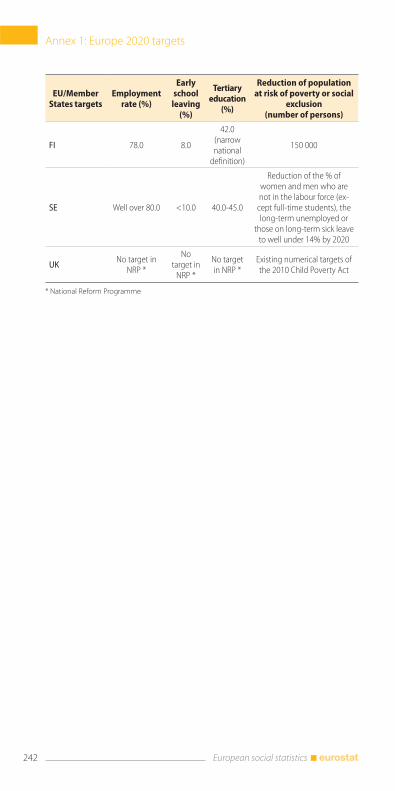
Annex 1: Europe 2020 targets
242 European social statistics
EU/Member States targets
Employment rate (%)
Early school
leaving (%)
Tertiary education
(%)
Reduction of population at risk of poverty or social
exclusion (number of persons)
FI 78.0 8.0
42.0 (narrow national
definition)
150 000
SE Well over 80.0 <10.0 40.0-45.0
Reduction of the % of women and men who are not in the labour force (ex-
cept full-time students), the long-term unemployed or
those on long-term sick leave to well under 14% by 2020
UKNo target in
NRP *
No target in
NRP *
No target in NRP *
Existing numerical targets of the 2010 Child Poverty Act
* National Reform Programme
European Commission
European social statistics — 2013 edition
Luxembourg: Publications Office of the European Union
2013 — 242 pp. — 10.5 x 21 cm
Theme: Population and social conditions
Collection: Pocketbooks
ISBN 978-92-79-27034-5
ISSN 1977-7930
doi:10.2785/36105
Cat. No KS-FP-13-001-EN-C


HOW TO OBTAIN EU PUBLICATIONS
Free publications:
http://bookshop.europa.eu);
from the European Union’s representations
http://ec.europa.eu/represent_en.htm);
from the delegations in non-EU countries
http://eeas.europa.eu/delegations/index_en.htm);
by contacting the Europe Direct service
http://europa.eu/europedirect/index_en.htm) or
operators, phone boxes or hotels may charge you).
Priced publications:
http://bookshop.europa.eu).
Priced subscriptions:
http://publications.europa.eu/
others/agents/index_en.htm).
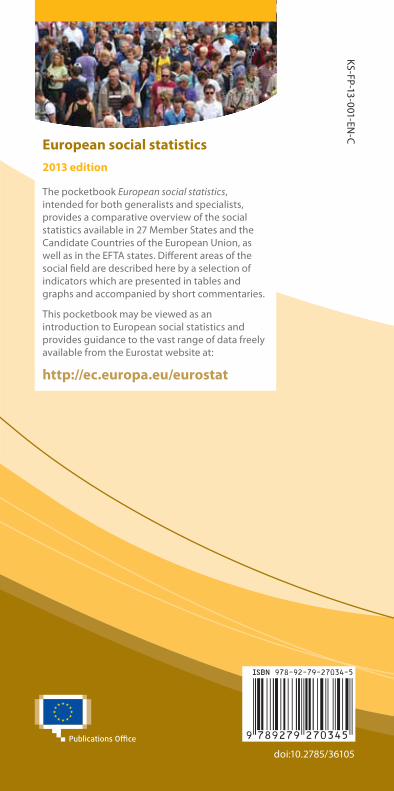
European social statistics
Pocketbooks
European social statistics
2013 edition
The pocketbook European social statistics,
intended for both generalists and specialists,
provides a comparative overview of the social
statistics available in 27 Member States and the
Candidate Countries of the European Union, as
well as in the EFTA states. Different areas of the
social field are described here by a selection of
indicators which are presented in tables and
graphs and accompanied by short commentaries.
This pocketbook may be viewed as an
introduction to European social statistics and
provides guidance to the vast range of data freely
available from the Eurostat website at:
http://ec.europa.eu/eurostat
Euro
pean
social statistics
2013 editio
n
KS
-FP-13
-00
1-E
N-C
ISSN 1977-7930
2013 edition
doi:10.2785/36105