Embed Size (px)
Citation preview

A New Concept of European Federalism
LSE ‘Europe in Question’ Discussion Paper Series
European Integration: Partisan Motives or
Economic Benefits?
Patricia Esteve-González & Bernd Theilen
LEQS Paper No. 71/2014
February 2014
LEQS is generously supported by the LSE Annual Fund

2
All views expressed in this paper are those of the author(s) and do not necessarily represent
the views of the editors or the LSE.
© Patricia Esteve-González & Bernd Theilen
Editorial Board
Dr Joan Costa-i-Font
Dr Vassilis Monastiriotis
Dr Jonathan White
Dr Katjana Gattermann

European Integration: Partisan Motives or
Economic Benefits?
Patricia Esteve-González* & Bernd Theilen*
Abstract
In this paper we examine the influence of economic factors on partisan support for European
integration over the last three decades. We find that partisan support is larger in ‘poorer’
countries with direct economic benefits from EU membership. On the other hand, parties in
countries affected by the Maastricht criteria are more Euro-sceptical. We also find weak
evidence for larger partisan support in countries with more developed welfare states, and
that the support for European integration fluctuates in parallel with the business cycle.
Finally, our results indicate that the importance of economic factors in determining partisan
support for European integration has grown in recent periods.
JEL Classification: F15, F42, F53, F55, H60.
Keywords: European Integration; Partisan Ideology; Maastricht Criteria;
European Budget; Benefits from Trade
* Departament d’Economia and CREIP, Universitat Rovira i Virgili,
Spain
Email: [email protected] and [email protected]
European Integration: Partisan Motives or Economic Benefits?
4
Table of Contents
Abstract
1. Introduction ......................................................................................... 5
2. Hypotheses ........................................................................................ 10
3. Data description and methodology .............................................. 17
4. Results ................................................................................................ 25
4.1 The determinants of partisan support for European integration .................. 25
4.2 Time trends in partisan support for European integration ............................. 31
5. Conclusions ....................................................................................... 35
References ............................................................................................... 37
Appendix ................................................................................................ 40
6.1 Data Processing ................................................................................................................. 40
Acknowledgements We thank Miquel Manjón Antolín, Luís Díaz Serrano, Helmut Herwartz and Oscar Martínez
Ibáñez for their comments and suggestions. Financial support from the Spanish Ministerio de
Ciencia e Innovación under projects ECO2010-17113 and ECO2010-19733 is gratefully
acknowledged.

Patricia Esteve-González & Bernd Theilen
5
European Integration: Partisan Motives or
Economic Benefits?
1. Introduction
The European Union (EU) represents a unique process of economic and
political integration in recent history. Never since World War II have
sovereign countries renounced their competences on economic and political
issues to such a great extent as in the process of European integration.
Throughout most of this process there seemed to be a consensus that more
integration was beneficial for all EU members. As a consequence, the
European Union has assumed more and more competences from its member
countries and has steadily gained new members. So, the EU has grown from 6
countries in 1952 to 28 in 2013. However, recently, scepticism on the benefits
of European integration has grown in many member countries. For example,
in 2005, France and the Netherlands rejected the EU constitution in a
referendum. As a consequence, a referendum on the EU constitution in six
other EU member countries has been cancelled or postponed indefinitely. In
Spain, recently, the supporters of the EU are now in the minority for the first
time.1 In the UK, David Cameron’s Conservative Party is even questioning EU
membership and planning a referendum on whether to remain a member of
the EU in 2018. One might argue that this increased scepticism is related to
the economic crisis that started in 2008. However, it might also be the case
that economic factors have played an important role in European integration
from its beginning and, therefore, have determined partisan support for
1 See Pew Research Center (2013), a summary of the 2013 Spring Pew Global Attitudes Survey.

European Integration: Partisan Motives or Economic Benefits?
6
European integration. In this article we examine whether economic factors
have indeed influenced partisan positions towards European integration over
the last three decades.
That something has changed in partisan support for European integration
becomes very clear from Figure 1, which displays the mean partisan support
in European countries from 1984 to 2010. Two main observations can be
made. First, partisan support is rather heterogeneously distributed over
European countries. This is particularly the case in 1984 and 1988 when
partisan attitudes towards European integration, on average, are lower in
small peripheral countries such as Portugal, Ireland and Scandinavia and
higher in large central European countries such as Germany, France, the UK,
Spain and Italy. Second, mean partisan support increased in almost all
countries between 1988 and 2002, after which time it started to decrease
(except in the new EU member countries). Since changes in partisan
constitutions, which have been used as the main explanatory variables for
partisan support for European integration in the literature up to now (cf.,
Marks et al. 2002, or Hellström 2008), are unlikely to be the causes of this
change, other determinants of partisan support need to be studied. Naturally,
economic factors whose importance is analysed in this paper might have
played a prominent role.

Patricia Esteve-González & Bernd Theilen
7
Figure 1: Mean partisan positions towards European integration by country and year.
(a) 1984 (b) 1988 (c) 1992 (d) 1996
(e) 1999 (f) 2002 (g) 2006 (h) 2010
Notes: White colour means that there is no information for that country and the intensity of the red colour corresponds to the intervals: [1, 5], (5, 5.6],
(5.6, 6], (6, 7]. The intervals are chosen as the quantils of the distribution of the mean partisan support for European integration.

European Integration: Partisan Motives or Economic Benefits?
8
To uncover the partisan and economic determinants that have driven partisan
support for European integration over the last three decades, we use data
from 297 political parties in 24 countries collected in eight waves (1984–2010)
to test six hypotheses, four of which refer exclusively to the influence of
economic factors. The other two hypotheses refer to partisan determinants
that have proved to influence partisan contestation over European integration
(for example, see Marks et al. 2002, and Hellström 2008). Regarding the
hypotheses on the economic determinants of partisan support for European
integration, first we analyse the influence of direct and indirect economic and
monetary benefits, and then we test whether European regulation, the size of
welfare states or the business cycle have affected partisan support.
Our results indicate that economic factors have indeed influenced partisan
support for European integration in several ways. Partisan support is larger in
relatively poorer countries that are supposed to obtain higher benefits from
EU membership. On the other hand, it is lower in those countries that were
affected by the Maastricht criteria, which indicates that parties worry about
losing their influence on national fiscal policies when their countries are
controlled by European institutions. Likewise, evidence is weak for larger
partisan support in countries with more developed welfare states, and
support for European integration increases (decreases) in periods of growth
above (below) the average. Finally, dividing our sample period into two
subsamples shows that the importance of economic factors in determining
partisan support for European integration has increased over time.
The literature on the determinants of partisan support for European
integration has not addressed the question of whether partisan contestation
over European integration is influenced by economic factors.2 Instead, the
2 On the contrary, in studies based on public opinion surveys, some authors have found that while
citizens from countries with higher income per capita are more sceptical, citizens from countries

Patricia Esteve-González & Bernd Theilen
9
literature has focused basically on two kinds of partisan determinant. The first
of these is partisan ideology, which has been found to be related to parties’
positioning on European integration according to an inverted U-relationship,
with central parties being pro-integrationist and extreme parties being Euro-
sceptical (Aspinwall 2002; Hellström 2008; Hix 1999; Hix and Lord 1997;
Hooghe and Marks 1999; Hooghe et al. 2002; Marks and Steenbergen 2002;
Marks and Wilson 2000; Marks et al. 2002). The second kind of partisan
determinant that has been taken into account is related to parties’ electoral
strategies. While well-established parties occupying the ideological centre
follow the mainstream and take median voter positions on European
integration, peripheral parties try to attract unsatisfied voters by taking more
radical positions (Hellström 2008). Thus, parties in government are found to
be more pro-integrationist than parties in the opposition. The same is true for
parties with greater electoral success (Marks et al. 2002, Hellström 2008). On
the other hand, extreme parties are found to be more sceptical of European
integration. We confirm these results in our paper with a larger sample
regarding its time, country and partisan dimension.
The remainder of this article is organized as follows. Section 2 motivates the
hypotheses subjected to empirical testing. Section 3 introduces the data and
outlines the estimation procedure. Results are discussed in Section 4. Finally,
in Section 5 the results are summarized and their relevance is discussed.
that receive benefits from both net EU transfers and intra-EU trade are more prone to European
integration (Doyle and Fidrmuc 2006; Christin 2005; Anderson and Reichert 1996; Eichengerg
and Dalton 1993, among others).

European Integration: Partisan Motives or Economic Benefits?
10
2. Hypotheses
The literature has explained political parties’ contestation over European
integration exclusively in terms of ideological and strategic electoral
competition motives (Aspinwall 2002; Hellström 2008; Hix 1999; Hix and Lord
1997; Hooghe and Marks 1999; Hooghe et al. 2002; Marks and Steenbergen
2002; Marks and Wilson 2000; Marks et al. 2002). However, economic factors
have not yet been considered as determinants of partisan support for
European integration. This is surprising for two reasons. First, as the EU is
primarily an economic union that has been designed to facilitate trade and
market integration, economic factors should be considered as important
determinants of support for European integration. Second, economic factors
have been found to play a role in studies on public opinion formation about
the European integration process (Garry and Tilley 2009; Doyle and Fidrmuc
2006; Brinegar and Jolly 2005; Christin 2005; Hooghe and Marks 2004;
McLaren 2004; Anderson and Reichert 1996; Eichengerg and Dalton 1993)
and, therefore, should also influence partisan positions on European
integration.3 The main research question in this paper is whether partisan
support to European integration depends on economic factors and, if so, to
what extent. The results of this paper, then, may indicate the extent to which
advances in European integration are subjected to the economic development
of its member countries and the economic benefits that member countries
obtain from integration. We extend the analysis of the determinants of
partisan positioning regarding European integration by including economic
factors that, as recent developments suggest, seem to have become
increasingly important.
3 However, citizen surveys on public opinion are substantially different from experts surveys on
political party positioning towards European integration. This is especially the case regarding the
distinct objectives of individuals and parties, the determinants of public and partisan positioning
and the representativeness of the surveys.

Patricia Esteve-González & Bernd Theilen
11
Apart from the novelty of analysing the relevance of economic factors to the
partisan support for European integration, this paper makes two other
contributions to the literature. First, while previous studies have usually been
restricted to cross-sectional estimation and have assumed cross-national
homogeneity (and, thus, neglected differences in the importance of the
relationship in different countries and at different times), our analysis is based
on fixed effects panel data estimation, which controls for both time and
country-specific effects. On the one hand, by considering time effects, our
analysis accounts for the changing focuses of European integration (single
market, common currency, EU enlargement, fiscal harmonization, etc.) and
the context of this process (financial crisis, sovereign debt crisis, etc.). On the
other hand, by considering country effects, we account for unobservable
country specific factors that are likely to influence partisan support for
European integration. Second, our study includes a larger set of countries and
more time periods, which provides new insights into the evolution of partisan
support over the business cycle and of party positioning on European
integration in new EU member countries.
Our analysis is based on three sets of hypotheses, each set containing two
hypotheses. The first set refers to the ideological and strategic electoral
motives that have already been analysed in the literature. The first hypothesis
follows Marks et al. (2002) in assuming that parties are organizations with
embedded ideologies that are grounded on ‘Weltanschauungen’ that
constitute the basis for their positioning towards European integration. In
particular, as far as European integration is concerned, partisan positioning is
often related to the historical role that parties played in this integration
process. According to the literature, partisan contestation over European
integration can be located in a two dimensional space (Hooghe and Marks
1999; Hooghe et al. 2010; Marks and Steenbergen 2002; Marks and

European Integration: Partisan Motives or Economic Benefits?
12
Steenbergen 2004; Marks and Wilson 2002; Marks et al. 2002; Hellström 2008).
One dimension measures parties’ economic position on market organization
(from ‘regulated capitalism’ to ‘neo-liberalism’) and the other considers the
extent to which decision making is centralised (from regionalism to a
supranationalism). While these two dimensions are in principle independent,
they are sometimes closely related to each other and highly correlated to the
partisan position on an ideological left/right dimension. Thus, extreme left-
and right-wing parties are strongly opposed to European integration; social
democratic and conservative parties are generally moderately in favour; and
liberal parties are strongly in favour. This results in an inverted U-shaped
relationship between ideology and partisan support for European integration
(Hellström 2008; Marks et al. 2002). According to this, our first hypothesis is:
H1: Ideology determines the partisan position regarding European
integration and follows an inverted U-shape relationship.
The second hypothesis takes account of partisan competition and the fact that
a party’s final objective is to maximize electoral support so that it can
implement its policies. According to Hix and Lord (1997) and Taggart (1998),
the major parties support European integration because their positioning in
favour of mainstream policy issues allows them to minimize intra-party
tensions. Therefore, parties protect the status quo with a neutral position on
such ‘new issues’ as European integration (Marks et al. 2002). Minor parties
take advantage of the resulting convergence of the policy positions of major
parties by formulating extreme positions on European integration in an
attempt to attract votes from Euro-scepticals. Following Marks et al. (2002),
we use three indicators to see whether strategic electoral motives influence
partisan positioning on European integration. First, if the major parties are
more pro-European, we would expect support for European integration to
increase with the share of votes that parties obtain in general elections.
Patricia Esteve-González & Bernd Theilen
13
Second, parties in government would be expected to have a more favourable
position towards European integration than parties that are excluded from
government, since the former can be made more responsible for the current
state of European integration. Finally, parties located at the extremes on an
ideological left/right dimension can also be expected to take more extreme
positions regarding European integration. In summary, the second hypothesis
we formulate is:
H2: Partisan support for European integration follows strategic electoral
motives and is positively related to electoral support and government
participation.
Our second set of hypotheses considers the economic dimension of European
integration. Specifically, we analyse whether the economic costs and benefits
of European integration have an influence on partisan positioning in favour
or against European integration in different member countries. Hypothesis
three takes account of the direct economic benefits that have also been found
to have a positive influence on citizen support for European integration
(Garry and Tilley 2009; Brinegar and Jolly 2005; Hooghe and Marks 2004;
McLaren 2004; Anderson and Reichert 1996; Eichengerg and Dalton 1993).
These benefits can be measured in various ways. As an initial measure, we
consider the difference between the member countries’ contribution payments
to the EU budget and the expenditure of the EU in these countries. While
these (net) expenditures are obviously only a part of the economic benefits of
EU membership, they need to be taken into account for several reasons. On
the one hand, both the contributions to the EU budget and the EU
expenditures in member countries are the result of extensive negotiations
between member countries. For example, the UK corrections, which reduced
the contributions of the UK to the EU budget, were agreed to by the 1984
Fontainebleau European Council after long negotiations. Their press coverage
and role in the national elections made voters in member countries more

European Integration: Partisan Motives or Economic Benefits?
14
aware of the financial benefits and costs of European integration. Therefore,
the position of the median voter regarding European integration should
depend on these benefits and costs and, as a consequence, partisan positions
towards European integration should also depend on them. On the other
hand, because of limited rationality, voters tend to give greater value to direct
costs and benefits rather than the indirect costs and benefits of European
integration, which are furthermore much more difficult to measure. As a
consequence, both voters and parties will give more importance to the
financial costs and benefits than to other advantages and disadvantages of
European integration.
Another important advance in European integration has been the creation of
the European Monetary Union (EMU). An important argument in favour of
the EMU is that a common market with a common currency increases trade
among EMU member countries. According to Frankel and Rose (2002), the
formation of a currency union allows member countries to triple trade with
other currency member countries without diverging trade from non-member
countries. They also find that, in the mid-run, a percent increase in total trade
raises income per capita by one-third of a percent. This means that the
economic benefits from the EMU should be substantial, particularly for large
and centrally located economies that, according to the gravity model of trade,
should obtain the largest benefits. Therefore, as a second measure of economic
benefits, we consider a country’s benefits from EMU induced trade which
should be positively related to partisan positioning in favour of European
integration in these countries. Interestingly, total trade, as a measure related
to the one used in this study, has been found to have a positive influence on
citizens’ support for European integration in McLaren (2004), Anderson and
Reichert (1996) and Eichengerg and Dalton (1993).

Patricia Esteve-González & Bernd Theilen
15
Finally, more European integration should lead to the convergence of EU
member countries. This economic convergence should primarily benefit those
countries that are below the European mean per capita income. Accordingly,
Garry and Tilley (2009) find that gross national income has a negative
influence on support for European integration in public opinion surveys.
Consequently, we should expect more support for European integration from
parties in relatively ‘poor’ countries than from parties in relatively ‘rich’
countries. Our third hypothesis is:
H3: Parties’ positioning regarding European integration depends positively
on the economic benefits of the party’s country from such integration.
As mentioned above, European integration implies the centralization of
decision making. New supranational institutions assume competencies that
formerly belonged to the governments of the member countries and,
therefore, were under the control of national parties. This has especially
affected economic competencies. The Maastricht criteria in 1992 were a first
attempt to control government deficits and debt and, thereby, government
spending at the national level. Another example is the creation of the EMU
and the introduction of the euro, which delegated the control of the monetary
policy in EMU member countries from national institutions to a supranational
institution. With hypothesis four we analyse whether partisan positioning
regarding European integration has changed in those countries that have been
especially affected by the control of supranational European institutions.4 We
use the Maastricht criteria to analyse whether the creation of supranational
institutions had a significant influence on partisan positioning towards
European integration in those countries with excessive budget deficits and
4 The role of supranational institutional change on the influence of partisan ideology on social
expenditure has recently been analysed by Herwartz and Theilen (2013). They find that, indeed,
the creation of supranational institutions has limited partisan influence on social spending in the
OECD during the last two decades.
European Integration: Partisan Motives or Economic Benefits?
16
debt, and which did not fulfil the three percent deficit criterion, the 60 percent
debt criterion, or both. Our fourth hypothesis is:
H4: The creation of European institutions that assume national
competencies and limit the partisan influence on formerly national
policy issues reduces partisan support for European integration.
Our third set of hypotheses takes account of the country’s economic situation.
Hypothesis five examines whether there is a relationship between national
advances in the welfare state and partisan support for European integration.
As European integration means the convergence of member economies, we
could interpret advances in European integration as a reduction of welfare
differences among EU member countries. Countries with larger welfare states
have median citizens that support more welfare spending and redistribution
than countries with smaller welfare states. Therefore, the population in
countries with more advanced welfare states could also be expected to be
more prone to a reduction of differences in welfare across countries.
Accordingly, our fifth hypothesis is:
H5: In countries with a larger welfare state, parties are more prone to
European integration.
Finally, hypothesis six aims to account for the influence of the business cycle
on parties’ contestation over European integration. Smith and Wanke (1993)
point out that European integration might have heterogeneous effects on
countries’ economic performance. Thus, even if the total benefits of European
integration are larger than its costs, the distribution of these benefits and costs
will be unequal across countries. If these costs lead to more unemployment
and less growth in some countries (relative to past national performance),
they diagnose that the population and the governments in these countries will
reduce their support for continued integration. On the other hand, as well as
goods and capital market integration, European integration also implies the

Patricia Esteve-González & Bernd Theilen
17
integration of labour markets. Thus, European integration facilitates finding
work in other member countries as barriers to entry are reduced. Therefore,
an increase in unemployment could also raise partisan support for European
integration. Indeed, in the literature on citizen support for European
integration we find mixed evidence on the effect of unemployment. While
Doyle and Fidrmuc (2006) state that higher unemployment has a positive
influence on support for European integration in 7 EU candidate countries in
2002, Eichenberg and Dalton (1993) find a negative influence. A positive
relationship between citizen support for European integration and economic
growth is found, for example, in Christin (2005). We formulate these
considerations as:
H6: Party positions regarding European integration depend on the
business cycle of the parties’ country. Partisan support for European
integration increases when a country’s GDP grows while the effect of a
country’s unemployment rate is ambiguous.
3. Data description and methodology
Our analysis is based on the Chapel Hill Expert Survey which merges three
data sets: Bakker et al. (2012), Hooghe et al. (2010) and Ray (1999). We use the
data from eight waves of surveys (1984, 1988, 1992, 1996, 1999, 2002, 2006 and
2010) for 24 member countries of the European Union (Austria, Belgium,
Denmark, Finland, France, Germany, Greece, Ireland, Italy, Netherlands,
Portugal, Spain, Sweden and United Kingdom, for all years; Bulgaria, Czech
Republic, Hungary, Latvia, Lithuania, Poland, Romania, Slovakia and
Slovenia since 2002; and Estonia since 2006).5 The Chapel Hill Expert Survey
contains evaluations by political scientists (experts) about partisan positions
5 Note that we extracted the data from these surveys in January 2013 when the 2010 survey had
already been published but not completely finished. In the Appendix we give more details on how
we treated the observations for 2010 and missing values in general.
European Integration: Partisan Motives or Economic Benefits?
18
regarding European integration of major and minor parties in the experts’
native country. The number of experts’ responses depends on the year of the
survey and ranges from 135 in 1984, with an average of 8 experts per country,
to 343 in 2010, with an average of 12 experts per country. Because parties
enter and exit, and several countries were included after 2002, our database is
an unbalanced panel with a total of 297 different parties and 1164
observations with approximately 10 parties per country and year.6 The
estimation method is panel data regression with fixed effects.
Our dependent variable is partisan contestation on European integration,
which measures party positions towards the European integration process in
the year of the survey as the mean of the experts’ individual rankings.
European integration is the logarithm of a categorical variable that ranges from
1, strongly opposed, to 7, strongly in favour. Although the experts’ answers
are integer numbers, our dependent variable, as the logarithm of the mean of
their evaluations, is not normally the logarithm of an integer.
Our explanatory variables can be arranged into six groups according to our
six hypotheses. To test hypothesis 1, as in Hellström (2008), we use Ideology
and, as in Marks et al. (2002), partisan family. Ideology is a categorical variable
that measures parties’ ideological position from 0, extreme left, to 10, extreme
right. As in Hellström (2008), we also consider this variable in squared form
(Ideology Squared), since the relationship between partisan support for
European integration and ideology is non-linear (radical parties at both ends
of the ideological spectrum tend to be more Euro-sceptical than central
parties). Further partisan characteristics are measured by dichotomous
variables for ten partisan families: Radical Right, Conservative, Liberal, Christian
Democratic, Socialist, Radical Left, Green, Regionalist/Ethnic, Confessional,
6 See Bakker et al. (2012), Hooghe et al. (2010) and Ray (1999) for more details on the
distribution of parties over countries and years.
Patricia Esteve-González & Bernd Theilen
19
Agrarian, and No Family. Hypothesis 2 is tested with two variables, Electoral
Support and Government Participation, which have also been used by Marks et
al. (2002) and Hellström (2008). Electoral support is measured as a party’s share
of total votes in the last national parliamentary elections before the survey
year in percentage points.7 Government participation is a dummy which takes
value one for parties that are in office during the year of the survey.8
Hypothesis 3 is contrasted with three different variables, Relative Income, EU
Net Expenditure and Trade Benefits. Relative Income takes the difference between
countries real per capita income and the EU mean (in thousands of euros and
purchasing power parity implied prices with 2000 as the base year). EU Net
Expenditure is the difference between a country’s contributions to the EU
budget and EU expenditure in this country.9 It is measured as a share of GDP
in percentage points. Trade Benefits are the benefits from EMU membership
induced trade as a share of GDP quoted in percentage points.10 To calculate
Trade Benefits we first estimate the linear trend in trade per GDP between
EMU member countries for each of these countries before the introduction of
the euro (from 1995 to 2001). Then, we calculate the differences between the
observed trade and the forecasted trade for a fictitious scenario without the
euro based on our trend estimates for the period before 2001.11 Finally,
7 Notice that this variable is different from a similar variable considered by Hellström (2008),
where it is measured as the increment of votes in the last elections. 8 Though Government Participation is a dichotomous variable that takes value 1 when the party is
in government and 0 otherwise, it can also take value 0.5 (for both outgoing parties and entering
parties) if there is a change of government in the survey year. Notice also that we measure
Government Participation differently from Marks et al. (2002). Their variable takes value one
when a party has participated in government at least once in the period 1965-1995. 9 We also include in EU Net Expenditure transfers from the EU to Bulgaria, Czech Republic,
Hungary, Latvia, Lithuania, Poland, Romania, Slovakia and Slovenia before these countries were
EU members. 10 Notice that measuring trade as a share of GDP automatically accounts for business cycle
fluctuations. 11 The estimated effects of EMU-induced trade are in line with the predictions of the gravity
model. Thus, trade benefits are highest for centrally located and large economies (Germany),
medium for small centrally located economies (Austria, Belgium, Luxembourg, Netherlands) and
large but more peripheral economies (France, Italy, Spain) and almost non-existent for small
European Integration: Partisan Motives or Economic Benefits?
20
following Frankel and Rose (2002) who estimated the welfare effects of
currency unions, we assume that a one percent increase in a country’s overall
trade (relative to GDP) raises income per capita by at least one-third of a
percent. Per definition, Trade Benefits are non-negative and, for EMU non-
member countries, zero. We consider Trade Benefits after the adoption of the
euro (i.e., when a country introduces euro banknotes and coins).
To test hypothesis 4, we use two alternative types of variables. Maastricht Debt
Non-Compliance, Maastricht Deficit Non-Compliance, and Maastricht Debt and
Deficit Non-Compliance are dummy variables. Maastricht Debt Non-Compliance
takes value one when the country’s government debt exceeds 60% of GDP but
complies with the deficit criterion. Similarly, Maastricht Deficit Non-Compliance
takes value one when government deficit is more than 3% of GDP but fulfils
the debt criterion. Finally, Maastricht Debt and Deficit Non-Compliance is one
when a country exceeds both thresholds. As an alternative to these variables
constructed according to the Maastricht criteria, we use total Government Debt
and the Budget Deficit, both measured as a share of GDP in percentage points.
Per definition, all these variables are zero in the period before 1992, the year
in which the Maastricht Treaty was signed.
The influence of the size of the welfare state on partisan contestation over
European integration (i.e., hypothesis 5) is analysed by two variables: Public
Expenditure and Inequality. Public Expenditure is the logarithm of total general
government expenditure as a share of GDP in percentage points. As can be
seen in Table 2, this variable oscillates between 3.51 and 4.26. The lowest
value corresponds to Ireland in 2002 and to Lithuania in 2006 (33.5% of GDP).
The highest value corresponds to Sweden in 1992 (70.5% of GDP). Inequality is
measured by the logarithm of the GINI index which ranges from 0, perfect
peripheral countries (Finland, Greece, Ireland, Portugal). Furthermore, for a control group of
EMU non-member countries (Denmark, Sweden, UK), there are no effects of EMU induced trade.

Patricia Esteve-González & Bernd Theilen
21
equality, to 100, perfect inequality. Table 2 shows that Inequality varies
between 3.00 and 3.66, which corresponds to a GINI index of 20 (for Finland
in 1988 and 1992, and Sweden 1984 and 1988) and 39 (for Greece in 1984 and
Latvia in 2006), respectively. Finally, to test hypothesis 6, we use Growth and
Unemployment. Growth measures the difference between a country’s annual
real per capita income growth rate and the country’s mean growth rate in the
period 1980-2010 (with prices indexed to 2005). Similarly, Unemployment is the
difference between a country’s annual unemployment rate and the country’s
mean unemployment rate in the period 1980-2010.
European Integration: Partisan Motives or Economic Benefits?
22
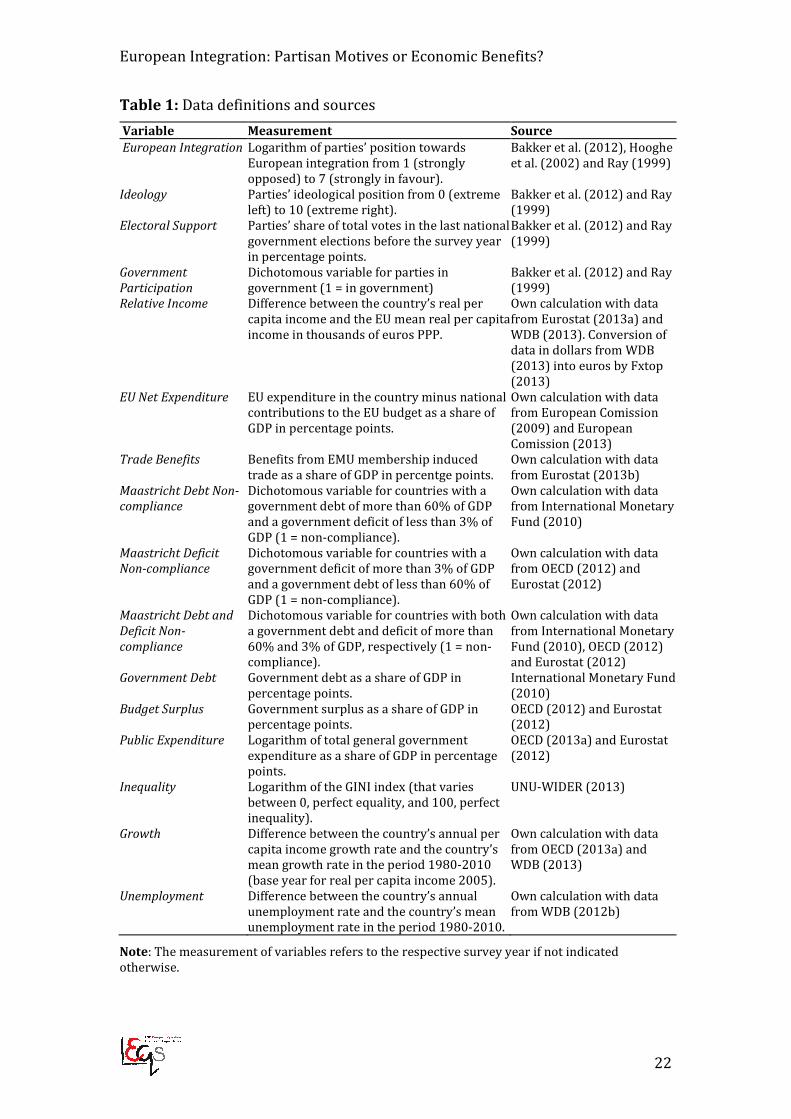
Table 1: Data definitions and sources
Variable Measurement Source
European Integration Logarithm of parties’ position towards
European integration from 1 (strongly
opposed) to 7 (strongly in favour).
Bakker et al. (2012), Hooghe
et al. (2002) and Ray (1999)
Ideology Parties’ ideological position from 0 (extreme
left) to 10 (extreme right).
Bakker et al. (2012) and Ray
(1999)
Electoral Support Parties’ share of total votes in the last national
government elections before the survey year
in percentage points.
Bakker et al. (2012) and Ray
(1999)
Government
Participation
Dichotomous variable for parties in
government (1 = in government)
Bakker et al. (2012) and Ray
(1999)
Relative Income Difference between the country’s real per
capita income and the EU mean real per capita
income in thousands of euros PPP.
Own calculation with data
from Eurostat (2013a) and
WDB (2013). Conversion of
data in dollars from WDB
(2013) into euros by Fxtop
(2013)
EU Net Expenditure EU expenditure in the country minus national
contributions to the EU budget as a share of
GDP in percentage points.
Own calculation with data
from European Comission
(2009) and European
Comission (2013)
Trade Benefits Benefits from EMU membership induced
trade as a share of GDP in percentge points.
Own calculation with data
from Eurostat (2013b)
Maastricht Debt Non-
compliance
Dichotomous variable for countries with a
government debt of more than 60% of GDP
and a government deficit of less than 3% of
GDP (1 = non-compliance).
Own calculation with data
from International Monetary
Fund (2010)
Maastricht Deficit
Non-compliance
Dichotomous variable for countries with a
government deficit of more than 3% of GDP
and a government debt of less than 60% of
GDP (1 = non-compliance).
Own calculation with data
from OECD (2012) and
Eurostat (2012)
Maastricht Debt and
Deficit Non-
compliance
Dichotomous variable for countries with both
a government debt and deficit of more than
60% and 3% of GDP, respectively (1 = non-
compliance).
Own calculation with data
from International Monetary
Fund (2010), OECD (2012)
and Eurostat (2012)
Government Debt Government debt as a share of GDP in
percentage points.
International Monetary Fund
(2010)
Budget Surplus Government surplus as a share of GDP in
percentage points.
OECD (2012) and Eurostat
(2012)
Public Expenditure Logarithm of total general government
expenditure as a share of GDP in percentage
points.
OECD (2013a) and Eurostat
(2012)
Inequality Logarithm of the GINI index (that varies
between 0, perfect equality, and 100, perfect
inequality).
UNU-WIDER (2013)
Growth Difference between the country’s annual per
capita income growth rate and the country’s
mean growth rate in the period 1980-2010
(base year for real per capita income 2005).
Own calculation with data
from OECD (2013a) and
WDB (2013)
Unemployment Difference between the country’s annual
unemployment rate and the country’s mean
unemployment rate in the period 1980-2010.
Own calculation with data
from WDB (2012b)
Note: The measurement of variables refers to the respective survey year if not indicated
otherwise.

Patricia Esteve-González & Bernd Theilen
23
Table 1 summarizes the measurement of the variables and gives detailed
information on the sources from which the data is obtained. Table 2 gives
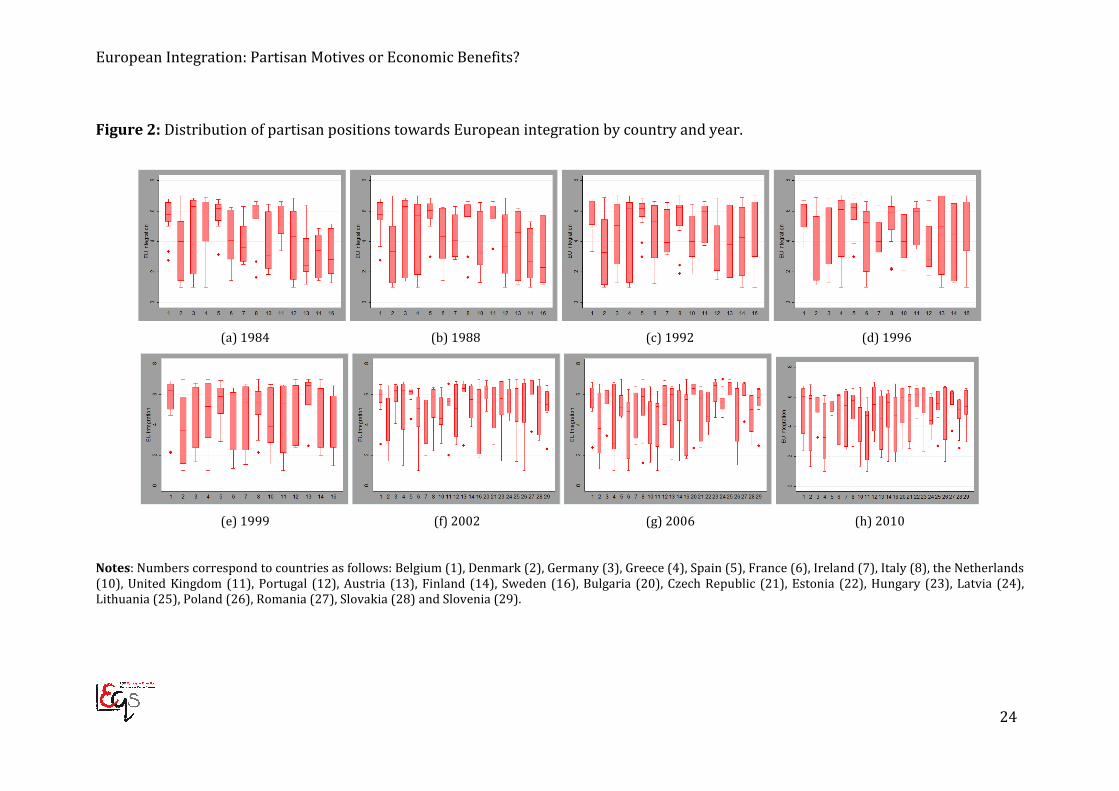
some details on descriptive statistics. We observe that there is considerable
heterogeneity among countries and parties. For example, Relative Income
varies from 17,400 euros below the EU per capita average to 9,800 euros
above. Heterogeneity of partisan support for European integration can also be
observed in Figure 2 which displays not only differences in mean partisan
support across counties and across time periods but also differences in the
countries’ distribution of partisan support. As mentioned above, because
differences in partisan ideology or competition are unlikely to be responsible
for this cross-country cross-time variation, economic factors are a possible
explanation for the observed heterogeneity in partisan support for European
integration.
Table 2: Descriptive statistics
Variable Mean Std. Dev. Min Max
European Integration 1.47 0.52 0 1.95
Ideology 4.96 2.36 0 10
Electoral Support 11.06 12.24 0 52.73
Government Participation 0.28 0.44 0 1
Relative Income -1.71 5.53 -17.40 9.80
EU Net Expenditure 0.60 1.38 -4.14 6.66
Trade benefits 0.55 1.47 0 7.80
Maastricht Debt Non-compliance 0.17 0.37 0 1
Maastricht Deficit Non-compliance 0.19 0.39 0 1
Maastricht Debt and Deficit Non-
compliance
0.22 0.41 0 1
Government Debt 49.88 36.95 0 144.55
Budget Surplus -2.64 3.32 -13.30 5.00
Public Expenditure 3.86 0.16 3.51 4.26
Inequality 3.36 0.16 3.00 3.66
Growth 0.87 2.36 -6.09 10.82
Unemployment 0.42 2.77 -7.74 8.63
European Integration: Partisan Motives or Economic Benefits?
24
Figure 2: Distribution of partisan positions towards European integration by country and year.
(a) 1984 (b) 1988 (c) 1992 (d) 1996
(e) 1999 (f) 2002 (g) 2006 (h) 2010
Notes: Numbers correspond to countries as follows: Belgium (1), Denmark (2), Germany (3), Greece (4), Spain (5), France (6), Ireland (7), Italy (8), the Netherlands
(10), United Kingdom (11), Portugal (12), Austria (13), Finland (14), Sweden (16), Bulgaria (20), Czech Republic (21), Estonia (22), Hungary (23), Latvia (24),
Lithuania (25), Poland (26), Romania (27), Slovakia (28) and Slovenia (29).

Patricia Esteve-González & Bernd Theilen
25
4. Results
4.1 The determinants of partisan support for European integration
In what follows we briefly comment on model diagnostics to provide support
for the estimation approach adopted. Then, we comment in detail on the
estimation results regarding the hypotheses raised in Section 2. Following the
literature, in columns 1 and 2 of Table 3 we estimate a model (Model 1) that
includes partisan variables with standard OLS panel data regression. Though
our sample includes four more waves of expert surveys and nearly twice the
number of countries, our results in column 1 mainly confirm the findings in
Marks et al. (2002). Radical parties are opposed to European integration,
while liberal, Christian democratic and social democratic parties widely
support it. Furthermore, parties in government and with larger electoral
support favour European integration. From these results we can confirm
hypotheses 1 and 2 that partisan positioning on European integration is
determined by ideological and strategic electoral motives.

European Integration: Partisan Motives or Economic Benefits?
26
Table 3: Panel data estimation results for the influence of partisan variables on
European Integration. Model 1 Model 2
OLS Fixed Effects
Radical Right -0.460*** 0.245
(0.062) (0.244)
Conservatives 0.250*** 0.177
(0.061) (0.201)
Liberal 0.492*** 0.104
(0.057) (0.185)
Christian-
Democratic
0.415*** 0.326
(0.065) (0.205)
Socialist 0.367*** 0.154
(0.061) (0.301)
Radical Left -0.341*** 0.167
(0.055) (0.342)
Green 0.141**
(0.060)
Regionalist/Ethnic 0.257***
(0.062)
Confessional -0.037 -0.311
(0.078) (0.193)
Agrarian 0.116 0.248
(0.079) (0.227)
Ideology 0.522*** 0.192***
(0.019) (0.035)
Ideology Squared -0.051*** -0.020***
(0.002) (0.003)
Electoral Support 0.004*** 0.005*** -0.001 -0.001
(0.001) (0.001) (0.002) (0.002)
Government
Participation
0.067** 0.090*** 0.039** 0.032*
(0.029) (0.026) (0.019) (0.019)
1984 -0.103** -0.051 -0.125*** -0.123***
(0.045) (0.042) (0.026) (0.026)
1988 -0.094** -0.023 -0.092*** -0.092***
(0.045) (0.042) (0.026) (0.026)
1992 -0.033 0.050 -0.034 -0.033
(0.044) (0.041) (0.025) (0.026)
1996 -0.025 0.040 -0.029 -0.035
(0.044) (0.041) (0.025) (0.025)
1999 -0.024 -0.060 -0.029 -0.054**
(0.044) (0.040) (0.026) (0.026)
2002 0.034 0.031 0.001 -0.008
(0.041) (0.036) (0.023) (0.023)
2006 -0.009 0.006 -0.013 -0.013
(0.040) (0.036) (0.022) (0.022)
Constant 1.269*** 0.361*** 1.387*** 1.177***
(0.077) (0.065) (0.151) (0.096)
N 1192 1164 1192 1164
R-sq / R-sq within 0.535 0.554 0.071 0.092
F test ui=0: Prob>F - - 0.000 0.000
Hausman test: : Prob>χ2 - - 0.000 0.000
Notes: Standard errors are in parentheses. *,**,*** indicate significance at the 10, 5 and 1 percent level, respectively. The base categorical variables for party family, country and year are No Family, Germany and 2010, respectively. Country dummies with a significant positive effect in both models are Belgium, Spain and Italy, and with a significant negative effect Denmark and Finland. The largest effects in Model 1 are for Finland, with a coefficient of -0.305, and Spain, with a coefficient of 0.244. The detailed results are available upon request from the authors.

Patricia Esteve-González & Bernd Theilen
27
Following Hellström (2008), in column 2 we have captured family
characteristics using a one dimensional ideology variable for which we
confirm a quadratic relationship with parties’ contestation over European
integration. We find that replacing partisan family by this ideology variable
does not significantly decrease the explanatory content of the model, as the
respective R2 of the models in columns 1 and 2 are almost identical.
Therefore, for further analysis we will use this ideological variable to capture
partisan family characteristics. Columns 3 and 4 display the estimation results
from fixed effects panel data regression (Model 2). While the direction and
significance of the diagnosed effects is rather similar to those of Model 1 (with
the exception that electoral support becomes insignificant), we find that the
existence of fixed effects cannot be rejected from standard F- and Hausman
tests with negligible error. Therefore, we regard fixed effects estimation as the
appropriate method for further analysis. Note also that in the fixed effects
estimation with partisan family and country dummies (column 3 of Table 3)
all these dummy variables become insignificant (in comparison to the model
estimated in column 1). This also indicates that neither the family nor the
country dummies are indicated to capture unobserved heterogeneity among
parties.12
12 Furthermore, once we estimate by fixed effects, most of our categorical variables are omitted
because of collinearity, as it is the case with green and regionalist/ethic party family and all
country dummies.

European Integration: Partisan Motives or Economic Benefits?
28
Table 4: Fixed effects estimation results for the influence of partisan and
economic variables on European Integration. Model 2 Model 3 Model 4
H1-H2 H1-H4 H1-H6
Ideology 0.192*** 0.208*** 0.201*** 0.209*** 0.205***
(0.035) (0.035) (0.034) (0.034) (0.034)
Ideology Squared -0.020*** -0.021*** -0.020*** -0.022*** -0.021***
(0.003) (0.003) (0.003) (0.003) (0.003)
Electoral Support -0.001 -0.001 -0.001 -0.001 -0.001
(0.002) (0.002) (0.002) (0.002) (0.002)
Government
Participation
0.032* 0.023 0.026 0.027 0.030*
(0.019) (0.018) (0.018) (0.018) (0.018)
Relative Income -0.020*** -0.020*** -0.003 -0.002
(0.005) (0.005) (0.006) (0.006)
EU Net Expenditure -0.002 -0.005 0.004 0.001
(0.008) (0.008) (0.008) (0.008)
Trade Benefits -0.017*** -0.019*** -0.015** -0.016***
(0.006) (0.006) (0.006) (0.006)
Maastricht Debt Non-
Compliance
-0.065** -0.063**
(0.026) (0.026)
Maastricht Deficit Non-
Compliance
-0.079*** -0.060**
(0.029) (0.030)
Maastricht Debt and
Deficit Non-Compliance
-0.088*** -0.080***
(0.030) (0.031)
Government Debt -0.001*** -0.001**
(0.001) (0.001)
Budget Surplus 0.006 0.008
(0.004) (0.005)
Public Expenditure -0.002 0.055
(0.109) (0.118)
Inequality 0.003 -0.012
(0.078) (0.078)
Growth 0.013*** 0.013***
(0.004) (0.004)
Unemployment 0.017*** 0.017***
(0.003) (0.003)
1984 -0.123*** -0.327*** -0.391*** -0.273*** -0.342***
(0.026) (0.048) (0.056) (0.048) (0.057)
1988 -0.092*** -0.282*** -0.346*** -0.240*** -0.308***
(0.026) (0.045) (0.054) (0.047) (0.055)
1992 -0.033 -0.151*** -0.156*** -0.088** -0.090**
(0.026) (0.035) (0.034) (0.036) (0.036)
1996 -0.035 -0.141*** -0.150*** -0.124*** -0.132***
(0.025) (0.033) (0.034) (0.034) (0.035)
1999 -0.054** -0.190*** -0.197*** -0.143*** -0.159***
(0.026) (0.039) (0.041) (0.041) (0.041)
2002 -0.008 -0.117*** -0.116*** -0.040 -0.044
(0.023) (0.035) (0.034) (0.038) (0.036)
2006 -0.013 -0.067** -0.079** -0.028 -0.049
(0.022) (0.029) (0.033) (0.031) (0.034)
Constant 1.177*** 1.266*** 1.346*** 1.234** 1.147**
(0.096) (0.098) (0.102) (0.534) (0.561)
N 1164 1164 1164 1164 1164
R-sq within 0.092 0.124 0.128 0.160 0.166
Hausman test: Prob>χ2 0.000 0.000 0.000 0.000 0.000
Notes: Standard errors are in parentheses. *,**,*** indicate significance at the 10, 5 and 1 percent
level, respectively. The base categorical variables are Germany (country) and 2010 (year).
Patricia Esteve-González & Bernd Theilen
29
Table 4 displays the fixed effects estimation results used to contrast the
hypotheses stated in Section 2. Column 1 replicates the results of column 4 in
Table 3 (Model 2) which, as mentioned above, allow hypotheses 1 and 2 to be
confirmed. Columns 2 and 3 contain the second set of variables to test
whether the economic benefits and costs of EU membership influence
partisan contestation over European integration (Model 3). In the case of
hypothesis 3, we find mixed evidence for such an influence. On the one hand,
when economic benefits and costs are related to the distance of countries’ per
capita income from the European mean, we do find that poorer countries
(which should be expected to obtain higher net benefits) are more in favour of
European integration than richer countries (for whom net benefits will
probably be lower). So, we find that the difference between the poorest and
the richest economy represents a decrease in the support for European
integration of 54.4%.13 On the other hand, direct financial benefits from the EU
turn out to have no influence on partisan contestation over European
integration. Finally, we find that parties in countries with higher benefits from
EMU-induced trade are more opposed to EU integration than parties in those
countries that benefit less. The estimated effect of the difference between a
country with no Trade Benefits to a country with the highest Trade Benefits is a
13.26% decrease in partisan support for European integration. This is an
unexpected result which could have two explanations. First, as EMU-induced
benefits from trade are indirect benefits that are difficult to quantify, voters
and parties might not take them into account when positioning on European
integration issues. Second, Trade Benefits is based on the sum of exports and
imports which may have different impacts on partisan positioning towards
European integration. So, parties may consider an increase in exports to be
more positive for their economies than an increase in imports. However,
measuring Trade Benefits as trade balance (exports minus imports as a share of
13 Table 2 shows that this corresponds to a change in relative income from -17.40 to 9.80.

European Integration: Partisan Motives or Economic Benefits?
30
GDP) provides rather similar estimation results.14 Nevertheless, as the impact
of relative income is considerable, we consider this as weak evidence in
favour of hypothesis 3 and conclude that economic costs and benefits have an
influence on partisan positioning towards European integration.
With respect to hypothesis 4, we find that parties in countries that either did
not fulfil the 3 percent deficit or the 60 percent debt criterion of the Maastricht
Treaty after 1992 manifest lower support for European integration by 7.9%
and 6.5%, respectively. For parties in countries that violate both criteria
simultaneously, the decrease in partisan support for European integration is
slightly larger (8.8%). Since any control of the fulfilment of the Maastricht
criteria tends to be rather weak, we use the absolute amount of budget
surplus and debt in the estimation in column 3 of Table 4 as an alternative
measure for the influence of supranational institutional intervention. We find
that an increase in government debt and budget deficit decreases partisan
support for European integration. However, the second effect is not
significant. We also find that an increase of 10 percentage points in
government debt decreases partisan support for European integration by 1%.
Therefore, hypothesis 4 can be accepted, at least regarding government debt.
Parties, then, dislike losing their influence on national fiscal policies because
of the creation of European institutions.
The third set of hypotheses is contrasted with Model 4, the estimation results
of which are displayed in columns 4 and 5 of Table 4. Regarding the influence
of larger welfare states, we find that none of our two indicator variables,
Inequality and Public Expenditure, has a significant effect on our dependent
variable. Therefore, we reject hypothesis 5. Finally, regarding the impact of
the business cycle, we find that parties in countries with higher per capita
income growth are more in favour of European integration. Our results show
14 The detailed estimation results are available upon request from the authors.

Patricia Esteve-González & Bernd Theilen
31
that partisan support for European integration increases by 13% when a
country’s growth rate increases 10 percentage points. We find similar results
for Unemployment. Here, an increase of the unemployment rate of 10
percentage points represents a 17% increase in partisan support for European
integration. We take both results as evidence for hypothesis 6 that the
business cycle influences partisan support for European integration.
Regarding the estimated time effects, we find that support for European
integration significantly increased by around 25% in the period from 1984 to
1992. In the period from 1992 to 1999 support was 9 to 16% lower than in
2010. Finally, between 2002 and 2010 we do not observe significant differences
in the estimated time effects. Note also that our estimation results are rather
robust as the inclusion of new explanatory variables in Models 3 and 4 does
not have any great effect on the estimates of Models 2 and 3. In summary, we
have found evidence, though of different degrees of strength, for all of our
hypotheses in Section 2 except for hypothesis 5.
4.2 Time trends in partisan support for European integration
As there have been important institutional changes in the European Union we
also study the stability of our estimated model. For this purpose we divide the
sample period into two subsample periods. We regard the creation of the
EMU in 1999 as an important event that could have affected the determinants
of partisan contestation on European integration. Consequently, we re-
examine Model 4 in Table 4 for the subsample periods 1984-1996 (Model 5)
and 1999-2010 (Model 6) in Table 5.

European Integration: Partisan Motives or Economic Benefits?
32
Table 5: Fixed effects estimation results for the influence of partisan and
economic variables on European Integration for subsamples: 1984-1996 and
1999-2010. Model 5 Model 6
1984-1996 1999-2010
Ideology 0.304*** 0.301*** 0.225*** 0.214***
(0.083) (0.083) (0.037) (0.037)
Ideology Squared -0.030*** -0.030*** -0.020*** -0.020***
(0.008) (0.008) (0.003) (0.003)
Electoral Support -0.006** -0.006** -0.001 -0.000
(0.003) (0.003) (0.001) (0.001)
Government Participation 0.055** 0.057** 0.013 0.016
(0.028) (0.028) (0.016) (0.016)
Relative Income -0.004 -0.000 -0.011 -0.017**
(0.014) (0.013) (0.008) (0.007)
EU Net Expenditure -0.022 -0.027 -0.004 -0.013
(0.018) (0.018) (0.009) (0.009)
Trade Benefits -0.011*** -0.011***
(0.004) (0.004)
Maastricht Debt Non-
Compliance
0.040 -0.061***
(0.068) (0.023)
Maastricht Deficit Non-
Compliance
-0.016 -0.037
(0.063) (0.026)
Maastricht Debt and Deficit
Non-Compliance
0.015 -0.046
(0.062) (0.031)
Government Debt 0.001 -0.003***
(0.001) (0.001)
Budget Surplus 0.005 0.014***
(0.008) (0.005)
Public Expenditure 0.093 0.101 0.183 0.530***
(0.183) (0.200) (0.125) (0.157)
Inequality -0.136 -0.139 0.016 0.054
(0.100) (0.098) (0.119) (0.116)
Growth 0.004 0.004 0.010** 0.013***
(0.006) (0.006) (0.004) (0.004)
Unemployment 0.022*** 0.023*** 0.002 0.003
(0.006) (0.006) (0.003) (0.003)
1984 -0.069 -0.048
(0.065) (0.056)
1988 -0.021 -0.002
(0.064) (0.057)
1992 0.035 0.047
(0.028) (0.030)
1999 -0.112*** -0.195***
(0.043) (0.041)
2002 -0.048 -0.115***
(0.038) (0.036)
2006 -0.036 -0.122***
(0.026) (0.031)
Constant 0.988 0.954 0.322 -0.885
(0.891) (0.957) (0.593) (0.683)
N 491 491 673 673
R-sq within 0.208 0.206 0.163 0.188
Hausman test: Prob>χ2 0.000 0.000 0.000 0.000
Notes: Standard errors are in parentheses. *,**,*** indicate significance at the 10, 5 and 1 percent
level, respectively. The base categorical variables are 1996 for the first subsample period and
2010 for the last subsample period.

Patricia Esteve-González & Bernd Theilen
33
Regarding hypothesis 1, our results indicate that partisan characteristics
measured by Ideology have a similar effect on partisan contestation as in the
full sample period, though their importance diminishes over time. However,
for hypothesis 2, we observe important changes. For the first subsample
period both Electoral Support and Government Participation have a significant
influence on partisan positioning on European integration while for the
second subsample period neither variable has a significant influence.
Somewhat surprisingly, the impact of Electoral Support is negative. However,
because part of the effect of the size of political parties is already captured by
our ideology variable, we cannot conclude from this result that partisan
support decreases with the size of political parties. The estimated effect of
Government Participation in the first subsample period is even larger than for
the full sample. So now we find that party support for European integration
increases by 5.5% when the party is in government while for the full sample
period the increase was 3.0%. To sum up, we can conclude that strategic
electoral motives for partisan positioning on European integration have lost
some of their importance over time.
The second set of hypotheses considers the economic dimension of European
integration. For hypothesis 3, we find that partisan positioning on European
integration issues has, over time, been increasingly affected by economic
aspects. Thus, while none of our EU benefit variables are significant in the
first subsample period, in the second subsample period Relative Income and
Trade Benefits have a significant negative effect, which is similar in size to the
effects obtained in Models 3 and 4 for the full sample period.
Regarding the role of European institutions (hypothesis 4), for the second
subsample period our results are similar to those of Model 4. Our estimation
with Maastricht dummies finds that parties in countries that did not fulfil the
60 percent debt criterion of the Maastricht Treaty after 1992 reduce their

European Integration: Partisan Motives or Economic Benefits?
34
support for European integration by 6.1%. The other two dummy variable
estimates are not significant. In the alternative estimation with level variables
both Government Debt and Budget Surplus have a significant influence on
partisan support for European integration. An increase of 10 percentage
points in government debt decreases partisan support for European
integration by 3% and an increase of one percentage point in government
deficit reduces support by 1.4%. On the other hand, for the first subsample
period we find that these variables have no significant influence. This result
coincides with anecdotal evidence that compliance with the Maastricht
criteria was controlled in rather a relaxed fashion at the beginning but more
strictly in the first decade of this century. Overall, these results indicate that
partisan support for European integration declines when national fiscal
policies are affected by supranational control. On the basis of this evidence,
we accept hypothesis 4 for the second subsample period.
Our last set of hypotheses takes account of the countries’ economic situation.
While we do not find any effect of the size of welfare states on partisan
contestation on European integration in our full sample estimation in Model
4, we do find a positive relationship between the size of the welfare state and
partisan support for European integration for the second subsample period.
More precisely, we find that Public Expenditure is related to a more favourable
contestation on European integration. A one-percent increase in public
expenditure increases partisan support for European integration by 0.5%. We
find no significant effect of Inequality in either of the subsample periods. From
these results we would (weakly) accept hypothesis 5 for the second
subsample period.
With regard to hypothesis 6, we find that only Unemployment has a significant
influence on partisan contestation on European integration in the first
subsample period while for the second subsample period Growth is the only

Patricia Esteve-González & Bernd Theilen
35
variable with significant impact. Therefore, we confirm the result obtained
with Model 4 that the business cycle influences partisan contestation on
European integration.
Taken together, the results on the stability of the relationship between
partisan support for European integration and its determinants indicate that
economic factors have become of increasing importance. On the one hand,
partisan support has declined in countries that have been affected by
European control of their fiscal policies. But on the other, partisan support for
European integration depends on the economic benefits, the size of the
welfare state and the current economic situation of a party’s country.
5. Conclusions
In this article we study whether economic factors influence partisan support
for European integration. We find that partisan contestation over European
integration is indeed affected by several economic variables. First, partisan
support is larger in relatively poorer countries indicating that economic
benefits from EU membership seem to play an important role. Second, in
countries that were affected by the Maastricht criteria partisan support for
European integration decreases significantly. We take this as evidence that
parties are rather jealous of losing some of their influence on fiscal policies to
supranational organizations and therefore reduce their support when this
becomes effective. Third, we find weak evidence for larger partisan support in
countries with more developed welfare states. Fourth, we detect that support
for European integration is in parallel to the business cycle. Finally, our
results indicate that the importance of economic factors has grown in recent
periods.
European Integration: Partisan Motives or Economic Benefits?
36
Our results have some interesting policy implications for the future of the
European integration process in particular and for processes of economic
integration in general. First, as partisan support for European integration
depends on economic factors, future advances in the European integration
process will depend crucially on the economic benefits and their distribution
among EU member countries. Second, as it is most likely impossible to obtain
positive direct monetary benefits for all members by further integration
policies, it becomes particularly important to accentuate the indirect benefits
of such policies. For example, our results show that partisan support in those
countries with largest benefits from EMU-induced trade is lower than in those
countries with smaller benefits. We take this as evidence of the lack of
awareness of these indirect benefits to the general public. Finally, while the
European integration process unquestionably has its historic specificities,
which can be traced back to experiences during and after World War II, it
seems that this process, after considerable advances, has now arrived to a
‘normal’ state of affairs. This teaches us valuable lessons that can be applied
to other processes of economic integration. Therefore, for these processes the
first two policy implications are also applicable.
Patricia Esteve-González & Bernd Theilen
37
References
Anderson CJ., and Reichert MS. 1996. Economic Benefits and Support for Membership in the E.U.:
A Cross-National Analysis. Journal of Public Policy 15(3):231–249.
Bakker R., de Vries C., Edwards E., Hooghe L., Jolly S., Marks G., Polk J., Rovny J., Steenbergen M.
and Vachudova M. 2012. Measuring party positions in Europe: the Chapel Hill expert survey
trend file, 1999-2010. Party Politics. Published online 29 November 2012 DOI:
10.1177/1354068812462931.
Brinegar AP., and Jolly SK. 2005. Location, Location, Location: National Contextual Factors and
Public Support for European Integration. European Union Politics 6(2):155–180.
Christin T. 2005. Economic and Political Basis of Attitudes towards the EU in Central and East
European Countries in the 1990s. European Union Politics 6(1):29–57.
Doyle O., and Fidrmuc J. 2006. Who Favors Enlargement? : Determinants of Support for EU
Membership in the Candidate Countries’ Referenda. European Journal of Political Economy
22:520–543.
Eichenberg RC., and Dalton RJ. 1993. Europeans and the European Community: The Dynamics of
Public Support for European Integration. International Organization 47(4):507–534.
European Commission 2009. EU Budget 2008: Financial Report. Publications Office of the
European Union (Luxembourg).
European Commission 2013. Financial Programming and Budget. Retrieved in January 2013 from
http://ec.europa.eu/budget/index_en.cfm
Eurostat 2012. Annual Government Finance Statistics. Retrieved in December 2012 from
http://epp.eurostat.ec.europa.eu/portal/page/portal/statistics/search_database
Eurostat 2013a. Auxiliary Indicators to National Accounts. Retrieved in May 2013 from
http://epp.eurostat.ec.europa.eu/portal/page/portal/statistics/search_database
Eurostat 2013b. EU27 Trade since 1988 by CN8. Retrieved in May 2013 from
http://epp.eurostat.ec.europa.eu/portal/page/portal/statistics/search_database
Frankel J. and Rose A. 2002. An estimate of the effect of common currencies on trade and income.
The Quarterly Journal of Economics 117(2):437–466.
Fxtop 2013. Historical Exchange Rates. Retrieved in May 2013 from
http://fxtop.com/en/historical-exchange-rates.php
Garry J., and Tilley J. 2009. The macroeconomic factors conditioning the impact of identity on
attitudes towards the EU. European Union Politics 10(3):361–379.
Hellström J. 2008. Partisan responses to Europe: the role of ideology for national political parties’
positions on European integration. Journal of European Public Policy 15(2):189–207.
Herwartz H. and Theilen B. 2013. Partisan influence on social spending under market integration,
fiscal pressure and institutional change. European Journal of Political Economy.
http://dx.doi.org/10.1016/j.ejpoleco.2013.10.003.
Hix S. and Lord C. 1997. Political Parties in the European Union. Macmillan Press (London).
European Integration: Partisan Motives or Economic Benefits?
38
Hooghe L. and Marks G. 1999. The making of a polity: the struggle over European integration.
Chapter 3 in: Kitschelt M., Lange P., Marks G. and Stephens JD. (eds), Continuity and Change
in Contemporary Capitalism. Cambridge Studies in Comparative Politics, Cambridge
University Press (Cambridge).
Hooghe L. and Marks G. 2004. Does identity or economic rationality drive public opinion on
European integration? Political Science and Politics 35(8):965–989.
Hooghe L., Marks G. and Wilson CJ. 2002. Does left/right structure party positions on European
integration? Comparative Political Studies 37:415–420.
Hooghe L., Bakker R., Brigevich A., de Vries C., Edwards E., Marks G., Rovny J. and Steenbergen M.
2010. Reliability and validity of measuring party positions: the Chapel Hill expert surveys of
2002 and 2006. European Journal of Political Research (4):684–703.
International Monetary Fund. 2010. A Historical Public Debt Database. IMF Working Papers
10/245.
Marks G. and Steenbergen M. 2002. Understanding political contestation in the European Union.
Comparative Political Studies 35(8):879–892.
Marks G. and Steenbergen M., (eds), 2004. European integration and political conflict. Cambridge
University Press (Cambridge).
Marks G., Wilson CJ. and Ray L. 2002. National political parties and European integration.
American Journal of Political Science 46(3):585–594.
Marks G. and Wilson CJ. 2000. The past in the present: a cleavage theory of party response to
European integration. British Journal of Political Science 30(3):433–459.
McLaren L. 2000. Opposition to European integration and fear of loss of national identity:
Debunking a basic assumption regarding hostility to the integration project. European
Journal of Political Research 43:895–911.
The Organisation for Economic Co-operation and Development (OECD) 2012. Economic
Projections: Economic Outlook No 92. Retrieved in December 2012 from
http://stats.oecd.org/
The Organisation for Economic Co-operation and Development (OECD) 2013a. Macro-economic
References. Retrieved in February 2013 from http://stats.oecd.org/
The Organisation for Economic Co-operation and Development (OECD) 2013b. National
Accounts: Gross Domestic Product. Retrieved in May 2013 from http://stats.oecd.org/
Pew Research Center. 2013. The New Sick Man of Europe: the European Union. Retrieved in May
2013 from http://www.pewglobal.org/2013/05/13/the-new-sick-man-of-europe-the-
european-union/
Ray L. 1999. Measuring party orientations toward European integration: Results from an expert
survey. European Journal of Political Research 36(2):283–306.
Smith DL. and Wanke J. 1993. Completing the single European market: An analysis of the impact
on the member countries. American Journal of Political Science 37(2):529–554.
Steenbergen MR. and Marks G. 2007. Evaluating expert judgments. European Journal of Political
Research 46(3):347–366.
Taggart P. 1998. A Touchstone of dissent: Euroscepticism in contemporary western European
party systems. European Journal of Political Research 33(3):363–388.

Patricia Esteve-González & Bernd Theilen
39
United Nations University and World Institute for Development Economics Research (UNU-
WIDER) 2013. World Income Inequality Database. Retrieved in March 2013 from
http://www.wider.unu.edu/research/Database/en_GB/wiid/
World DataBank (WDB) 2012a. Economic Policy & External Debt. Retrieved in November 2012
from http://data.worldbank.org/indicator
World DataBank (WDB) 2012b. Labor & Social Protection. Retrieved in December 2012 from
http://data.worldbank.org/indicator
World DataBank (WDB) 2013. Economic Policy & External Debt. Retrieved in May 2013 from
http://data.worldbank.org/indicator
European Integration: Partisan Motives or Economic Benefits?
40
Appendix
6.1 Data Processing
Partisan data for 2010 is not complete because the data was extracted before
the Chapel Hill Experts Survey data set had been completely finished. We
have used information about partisan positioning on European issues and
partisan ‘overall’ ideology. Information on partisan family is not in the data.
We have assumed that parties belong to the same family as in the previous
survey. Parties’ Electoral Support and Government Participation for 2010 are
from our own data. Similarly, some data about parties’ ideology is missing in
some survey years. We assumed that their ideology is equal to their ideology
quote in the closest survey year. Because of missing information, 28
observations on parties were not included in our sample. There is no
information on the GINI index for all years to report Inequality. To prevent the
loss of any more observations, we estimate missing data by taking the average
of the two closest observations in time.
Recent LEQS papers
Monastiriotis, Vassilis. 'Origin of FDI and domestic productivity spillovers: does European FDI have a
'productivity advantage' in the ENP countries?' LEQS Paper No. 70, January 2014
Ward-Warmedinger, Melanie & Macchiarelli, Corrado. 'Transitions in labour market status in the
European Union' LEQS Paper No. 69, November 2013
Dani, Marco. 'The ‘Partisan Constitution’ and the corrosion of European constitutional culture' LEQS
Paper No. 68, November 2013
Bronk, Richard & Jacoby, Wade. 'Avoiding monocultures in the European Union: the case for the
mutual recognition of difference in conditions of uncertainty' LEQS Paper No. 67, September 2013
Johnston, Alison, Hancké, Bob & Pant, Suman. 'Comparative Institutional Advantage in the European
Sovereign Debt Crisis' LEQS Paper No. 66, September 2013
Lunz, Patrick. 'What's left of the left? Partisanship and the political economy of labour market reform:
why has the social democratic party in Germany liberalised labour markets?' LEQS Paper No. 65,
July 2013
Estrin, Saul & Uvalic, Milica. ‘Foreign direct investment into transition economies: Are the Balkans
different?’ LEQS Paper No. 64, July 2013
Everson, Michelle & Joerges, Christian. 'Who is the Guardian for Constitutionalism in Europe after the
Financial Crisis?' LEQS Paper No. 63, June 2013
Meijers, Maurits. 'The Euro-crisis as a catalyst of the Europeanization of public spheres? A cross-
temporal study of the Netherlands and Germany' LEQS Paper No. 62, June 2013
Bugaric, Bojan. 'Europe Against the Left? On Legal Limits to Progressive Politics' LEQS Paper No. 61,
May 2013
Somek, Alexander. 'Europe: From emancipation to empowerment' LEQS Paper No. 60, April 2013
Kleine, Mareike. ‘Trading Control: National Chiefdoms within International Organizations’ LEQS
Paper No. 59, March 2013
Aranki, Ted & Macchiarelli, Corrado. 'Employment Duration and Shifts into Retirement in the EU'
LEQS Paper No. 58, February 2013
De Grauwe, Paul. ‘Design Failures in the Eurozone: Can they be fixed?’ LEQS Paper No. 57, February
2013
Teixeira, Pedro. 'The Tortuous Ways of the Market: Looking at the European Integration of Higher
Education from an Economic Perspective' LEQS Paper No. 56, January 2013
Costa-i-Font, Joan. ' Fiscal Federalism and European Health System Decentralization: A Perspective'
LEQS Paper No. 55, December 2012
Schelkle, Waltraud. 'Collapsing Worlds and Varieties of welfare capitalism: In search of a new political
economy of welfare' LEQS Paper No. 54, November 2012
Crescenzi, Riccardo, Pietrobelli, Carlo & Rabellotti, Roberta. ‘Innovation Drivers, Value Chains and the
Geography of Multinational Firms in European Regions’ LEQS Paper No. 53, October 2012

European Integration: Partisan Motives or Economic Benefits?
42
Stuff
LEQS
European Institute
London School of Economics
Houghton Street
WC2A 2AE London
Email: [email protected]
http://www2.lse.ac.uk/europeanInstitute/LEQS/Home.aspx