Embed Size (px)
Citation preview

0
0
European Helicopter Safety Team - EHEST
EHEST Analysis of 2006-2010 European Helicopter Accidents
Final EHSAT Analysis Report
Report Document ref. Status Date
Final 2015-08-11
Contact details for enquiries: European Helicopter Safety Team
[email protected] www.easa.europa.eu/essi
Disclaimer:
The safety improvement analyses and recommendations produced by EHEST are based on
expert judgement and are supplementary to the official reports of the accident investigation boards (AIB). Such recommendations, and the safety improvement actions that may follow,
are solely aimed at improving helicopter safety, are not binding and under no circumstances should be considered to take precedence over the official AIB reports. The adoption of such
safety improvement recommendations is subject to voluntary commitment, and engages only the responsibility of those who endorse these actions. The EHEST accepts no responsibility or
liability whatsoever with regard to the content or for any actions resulting from the use of the
information contained in these recommendations.
Name
Coordinated by Martin Bernandersson (EASA)
Reference group
Tony Eagles (UK CAA), Marc Greiller (Airbus Helicopters), Michel Masson (EASA), John Steel (IAA)
Reviewed by Andy Evans (Aerossurance), John Franklin (EASA), Yngvi Rafn Yngvason
(EASA)
1
Table of Contents
Executive Summary ...................................................................................................... 2
1 Analysis Results ..................................................................................................... 3 1.1 Basic Data ..................................................................................................... 3 1.2 SPS Analysis – Time Period Comparison ............................................................. 7 1.3 SPS Analysis – Type of Operation Comparison ..................................................... 9 1.4 SPS Level 2 Analysis – Commercial Air Transport ............................................... 11 1.5 SPS Level 2 Analysis – Aerial Work .................................................................. 15 1.6 SPS Level 2 Analysis – General Aviation ........................................................... 17 1.7 HFACS Level 2 Analysis – Commercial Air Transport ........................................... 19 1.8 Intervention Recommendations Analysis ........................................................... 21
2 Concluding Remarks and Way Forward .................................................................... 25

2
Executive Summary
This report covers the work performed by the European Helicopter Safety Analysis Team (EHSAT), a sub-group of the European Helicopter Safety Team (EHEST) – the rotorcraft pillar
of the European Strategic Safety Initiative (ESSI) and the European component of the
International Helicopter Safety Team (IHST).
This report is a follow-up on the first EHSAT report published in 2010 addressing 2000-2005 European Helicopter accidents. It covers the analyses performed by the EHSAT regional teams
of accidents that occurred in the years 2006-2010. It also provides comparisons between the two time periods 2000-2005 and 2006-2010 as well as some deeper analysis of results
covering the entire time period 2000-2010.
EHSAT Regional Teams were established in the following countries: Finland, France, Germany,
Hungary, Ireland, Italy, the Netherlands, Norway, Spain, Sweden and the United Kingdom.
The analysis methodology used is the Standard Problem Statements (SPS) and Human Factors Analysis and Classification System (HFACS). This methodology was presented in detail in the
first EHSAT report. For further information please consult that publication.
The continued analysis of Helicopter Accidents in the period 2006-2010 by the EHSAT Regional Teams and the comparison with the analysis of 200-2005 accidents have globally confirmed
that the issues identified in this first period continue to be of concern and that the safety
improvement actions decided and developed based on the first analysis period were still valid.
A few differences have been identified though and additional analyses have been conducted. These will help shaping up the future priorities of the European Helicopter Safety
Implementation Team (EHSIT) and its three Specialist Teams on Training, Ops & SMS and Technology.
This report will also be communicated to EASA and contribute developing the helicopter Safety
Risk Portfolio (SRP), which will help populating the helicopter section of the European Aviation
Safety plan (EASp).
Additional data on helicopter safety in Europe can also be found in the EASA Annual Safety Reviews published annually on the EASA website.
3
1 Analysis Results
1.1 Basic Data
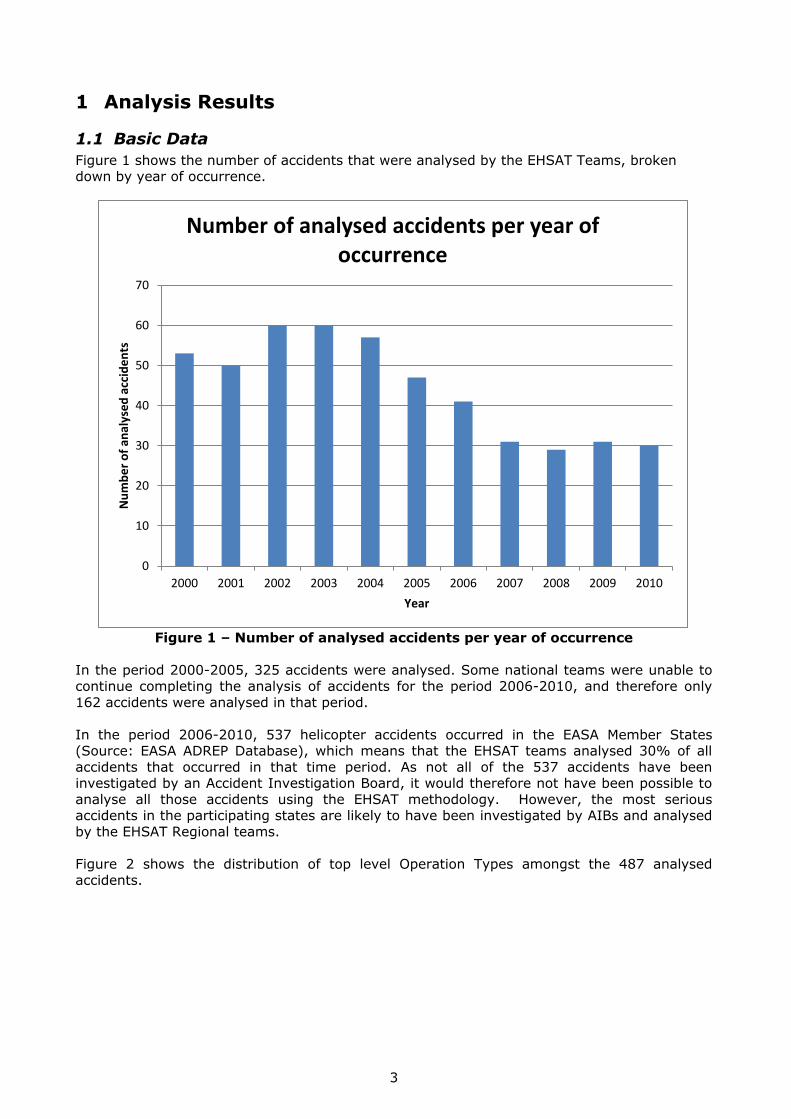
Figure 1 shows the number of accidents that were analysed by the EHSAT Teams, broken down by year of occurrence.
Figure 1 – Number of analysed accidents per year of occurrence
In the period 2000-2005, 325 accidents were analysed. Some national teams were unable to
continue completing the analysis of accidents for the period 2006-2010, and therefore only
162 accidents were analysed in that period.
In the period 2006-2010, 537 helicopter accidents occurred in the EASA Member States (Source: EASA ADREP Database), which means that the EHSAT teams analysed 30% of all
accidents that occurred in that time period. As not all of the 537 accidents have been investigated by an Accident Investigation Board, it would therefore not have been possible to
analyse all those accidents using the EHSAT methodology. However, the most serious accidents in the participating states are likely to have been investigated by AIBs and analysed
by the EHSAT Regional teams.
Figure 2 shows the distribution of top level Operation Types amongst the 487 analysed
accidents.
0
10
20
30
40
50
60
70
2000 2001 2002 2003 2004 2005 2006 2007 2008 2009 2010
Nu
mb
er
of
anal
yse
d a
ccid
en
ts
Year
Number of analysed accidents per year of occurrence
4
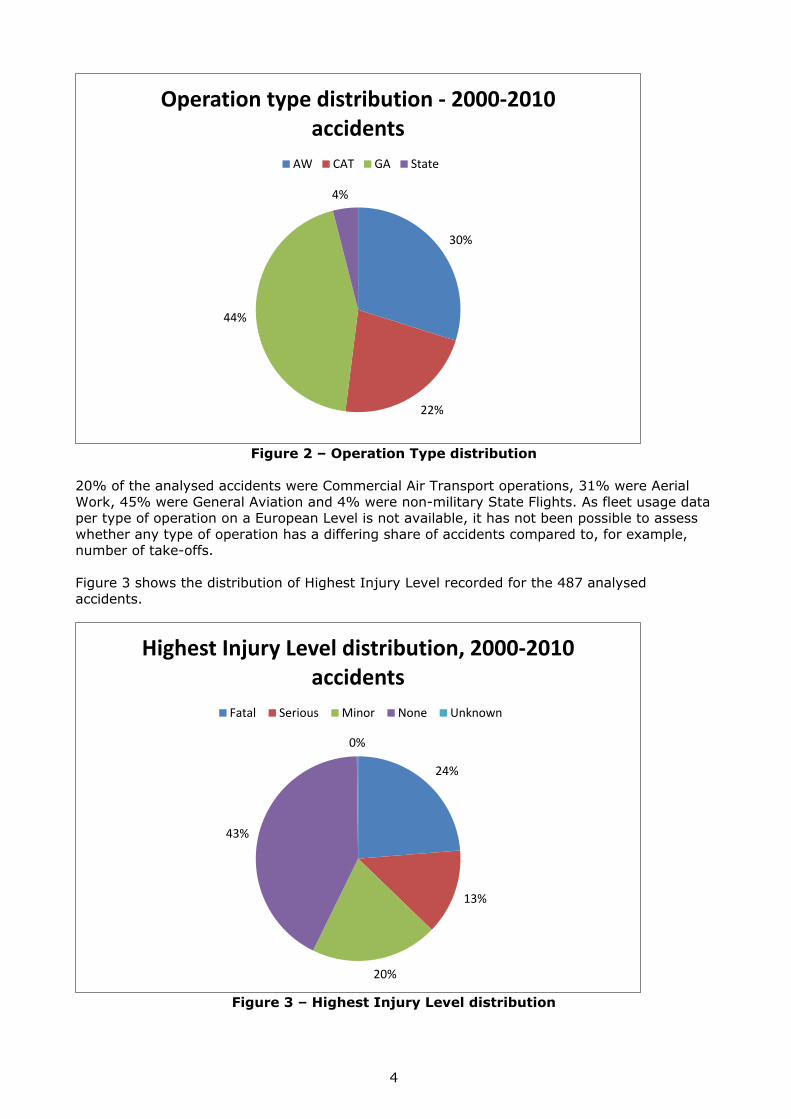
Figure 2 – Operation Type distribution
20% of the analysed accidents were Commercial Air Transport operations, 31% were Aerial
Work, 45% were General Aviation and 4% were non-military State Flights. As fleet usage data per type of operation on a European Level is not available, it has not been possible to assess
whether any type of operation has a differing share of accidents compared to, for example, number of take-offs.
Figure 3 shows the distribution of Highest Injury Level recorded for the 487 analysed
accidents.
Figure 3 – Highest Injury Level distribution
30%
22%
44%
4%
Operation type distribution - 2000-2010 accidents
AW CAT GA State
24%
13%
20%
43%
0%
Highest Injury Level distribution, 2000-2010 accidents
Fatal Serious Minor None Unknown
5
24% of the analysed accidents were fatal, i.e. one or more persons involved in the accident died as a result of the injuries sustained in the accident. On the other hand, in 43% of the
accidents there were no injuries. In 13% of the accidents the persons involved sustained serious injuries, and in 20% of the accidents minor injuries were sustained.
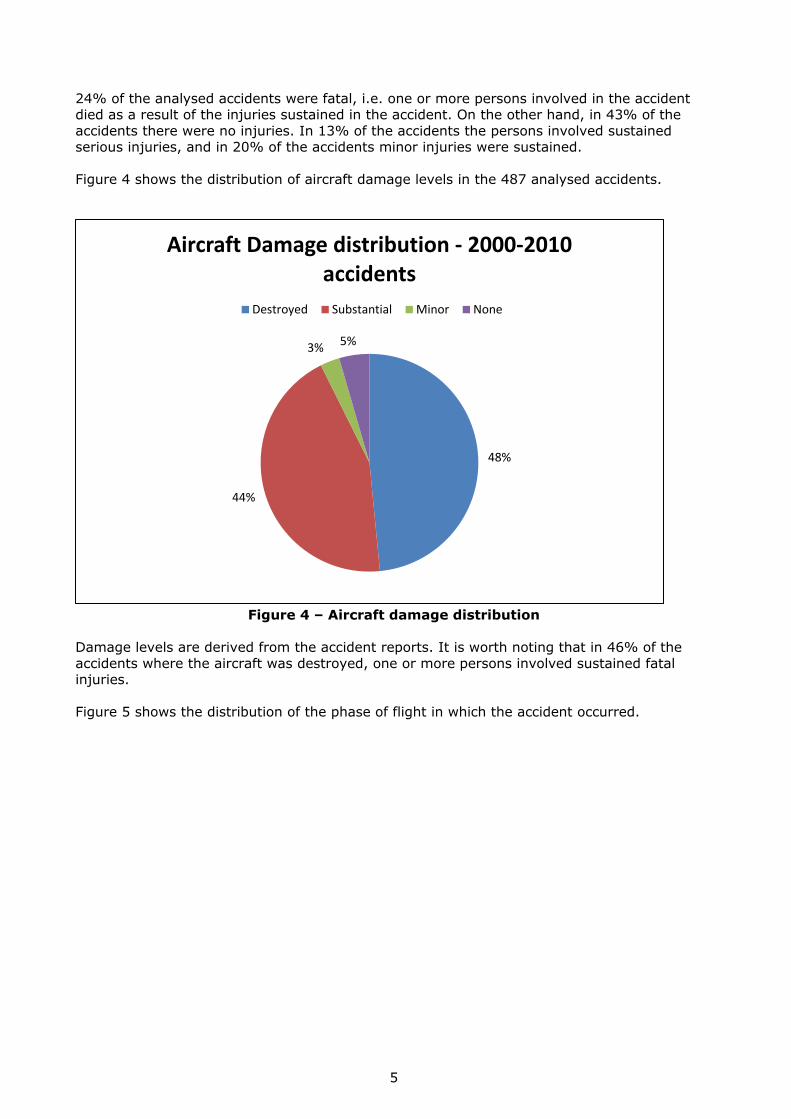
Figure 4 shows the distribution of aircraft damage levels in the 487 analysed accidents.
Figure 4 – Aircraft damage distribution
Damage levels are derived from the accident reports. It is worth noting that in 46% of the
accidents where the aircraft was destroyed, one or more persons involved sustained fatal injuries.
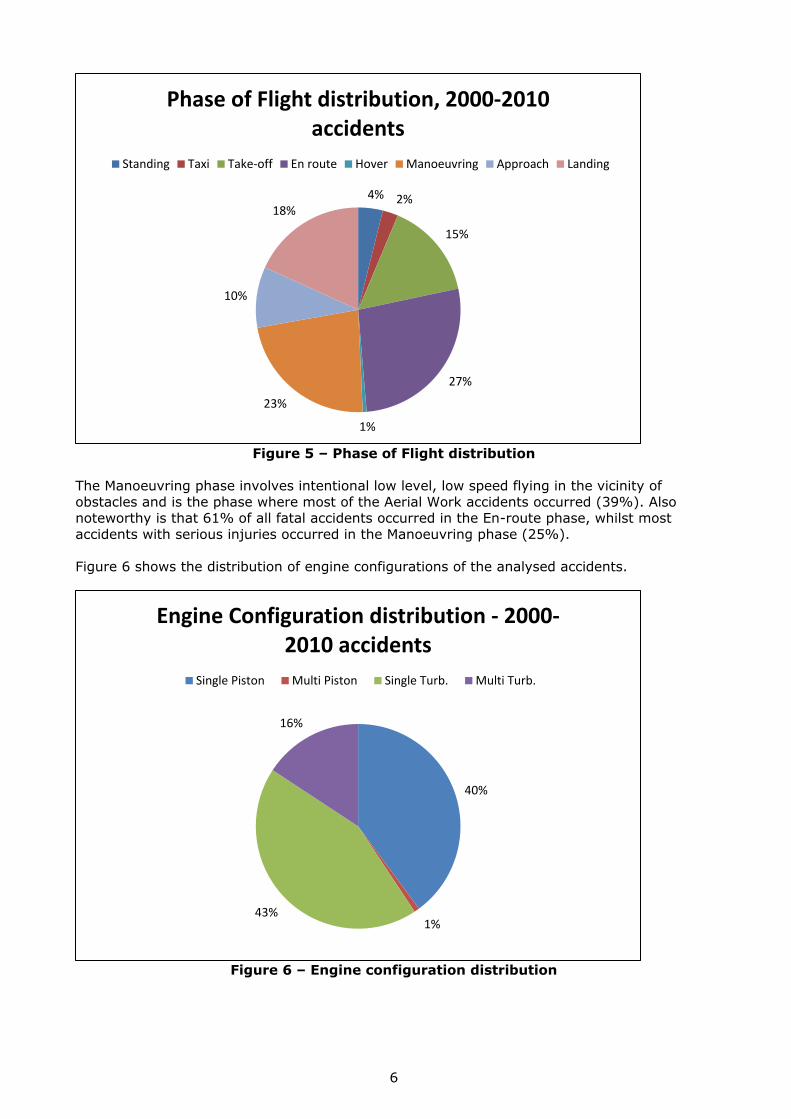
Figure 5 shows the distribution of the phase of flight in which the accident occurred.
48%
44%
3% 5%
Aircraft Damage distribution - 2000-2010 accidents
Destroyed Substantial Minor None
6
Figure 5 – Phase of Flight distribution
The Manoeuvring phase involves intentional low level, low speed flying in the vicinity of
obstacles and is the phase where most of the Aerial Work accidents occurred (39%). Also noteworthy is that 61% of all fatal accidents occurred in the En-route phase, whilst most
accidents with serious injuries occurred in the Manoeuvring phase (25%).
Figure 6 shows the distribution of engine configurations of the analysed accidents.
Figure 6 – Engine configuration distribution
4% 2%
15%
27%
1%
23%
10%
18%
Phase of Flight distribution, 2000-2010 accidents
Standing Taxi Take-off En route Hover Manoeuvring Approach Landing
40%
1%43%
16%
Engine Configuration distribution - 2000-2010 accidents
Single Piston Multi Piston Single Turb. Multi Turb.
7
Most analysed accidents occurred to single engine helicopters, who also comprise the majority
of the helicopter fleet in Europe.
1.2 SPS Analysis – Time Period Comparison
In this section, comparisons will be made between the initial time period of 2000-2005 and the second period of 2006-2010 to see whether there are any significant differences between
the two time periods. In order to facilitate easy comparison and reduce the impact of differing implementation of the coding instructions, the percentage of accidents where the SPS/HFACS
codes on Level 1 have been assigned at least once will be used in this section, as was the case
in the previous report.
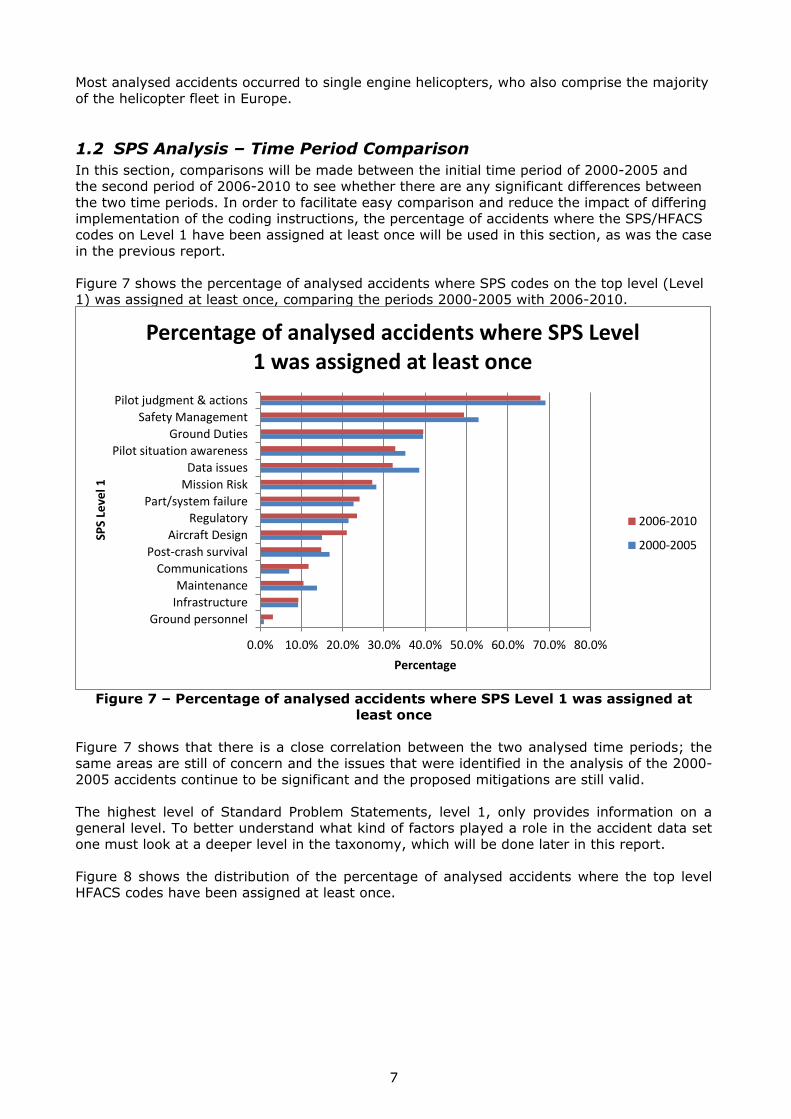
Figure 7 shows the percentage of analysed accidents where SPS codes on the top level (Level 1) was assigned at least once, comparing the periods 2000-2005 with 2006-2010.
Figure 7 – Percentage of analysed accidents where SPS Level 1 was assigned at
least once
Figure 7 shows that there is a close correlation between the two analysed time periods; the
same areas are still of concern and the issues that were identified in the analysis of the 2000-
2005 accidents continue to be significant and the proposed mitigations are still valid.
The highest level of Standard Problem Statements, level 1, only provides information on a general level. To better understand what kind of factors played a role in the accident data set
one must look at a deeper level in the taxonomy, which will be done later in this report.
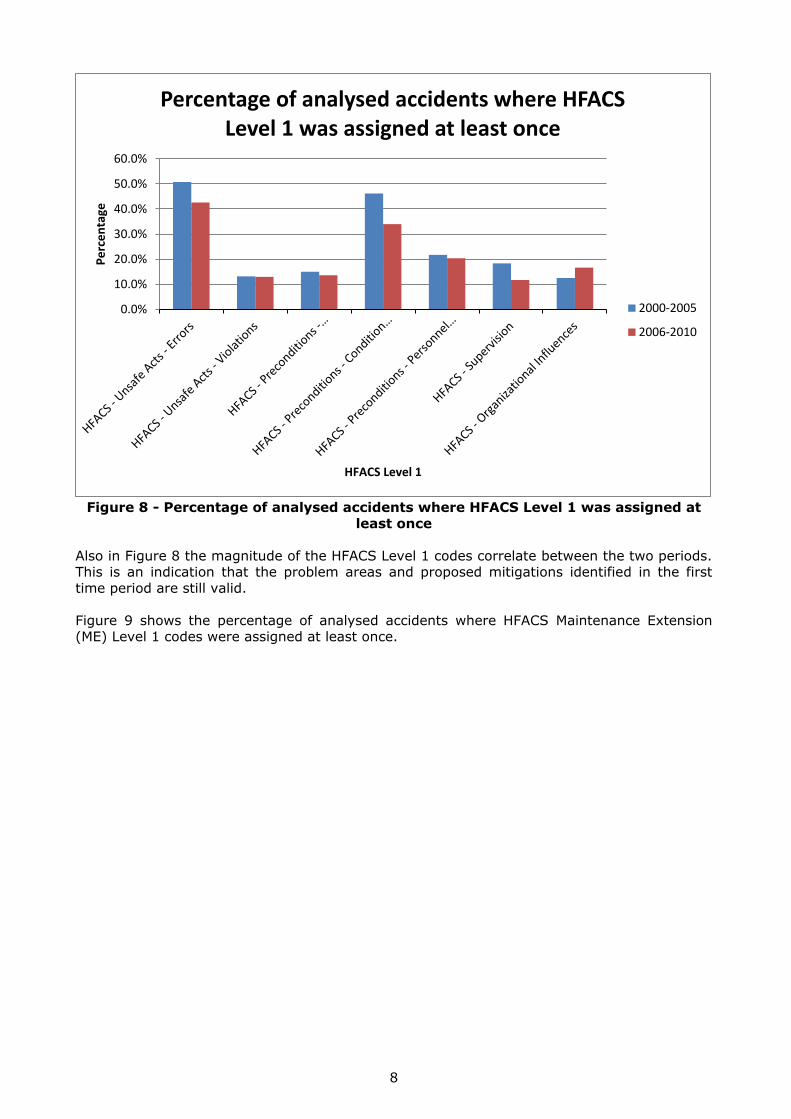
Figure 8 shows the distribution of the percentage of analysed accidents where the top level HFACS codes have been assigned at least once.
0.0% 10.0% 20.0% 30.0% 40.0% 50.0% 60.0% 70.0% 80.0%
Ground personnel
Infrastructure
Maintenance
Communications
Post-crash survival
Aircraft Design
Regulatory
Part/system failure
Mission Risk
Data issues
Pilot situation awareness
Ground Duties
Safety Management
Pilot judgment & actions
Percentage
SPS
Leve
l 1
Percentage of analysed accidents where SPS Level 1 was assigned at least once
2006-2010
2000-2005
8
Figure 8 - Percentage of analysed accidents where HFACS Level 1 was assigned at
least once
Also in Figure 8 the magnitude of the HFACS Level 1 codes correlate between the two periods. This is an indication that the problem areas and proposed mitigations identified in the first
time period are still valid.
Figure 9 shows the percentage of analysed accidents where HFACS Maintenance Extension (ME) Level 1 codes were assigned at least once.
0.0%
10.0%
20.0%
30.0%
40.0%
50.0%
60.0%
Pe
rce
nta
ge
HFACS Level 1
Percentage of analysed accidents where HFACS Level 1 was assigned at least once
2000-2005
2006-2010
9
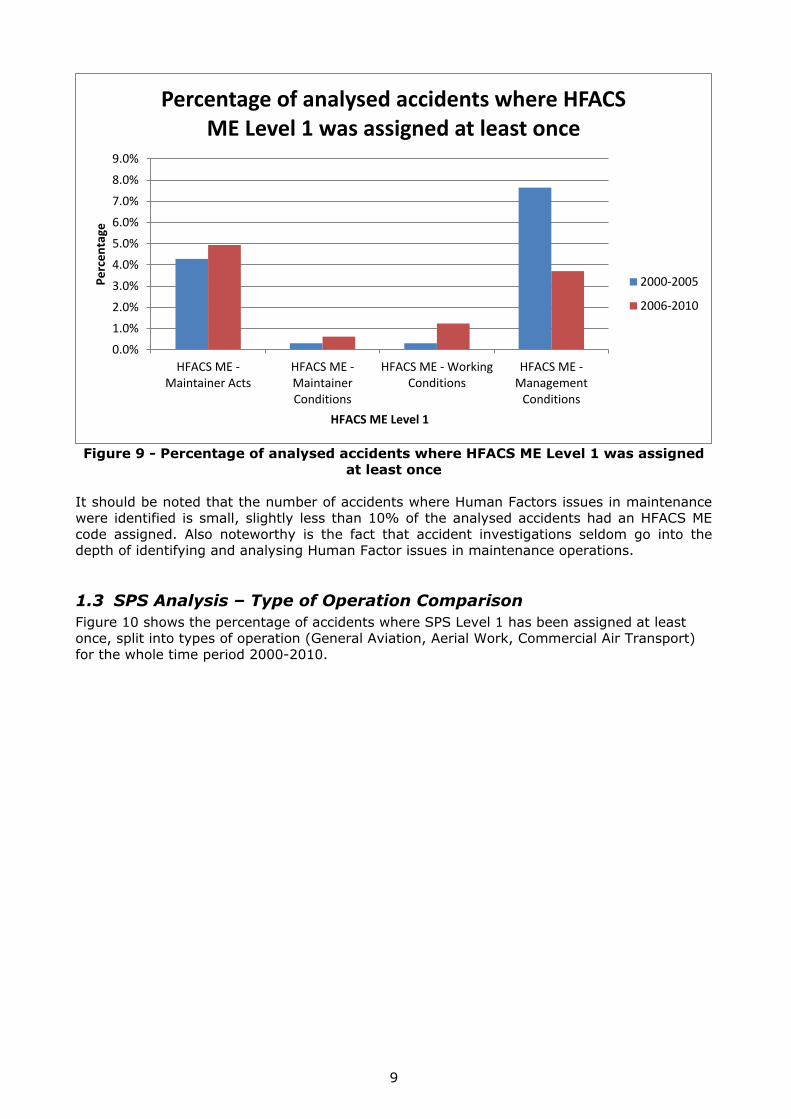
Figure 9 - Percentage of analysed accidents where HFACS ME Level 1 was assigned
at least once
It should be noted that the number of accidents where Human Factors issues in maintenance were identified is small, slightly less than 10% of the analysed accidents had an HFACS ME
code assigned. Also noteworthy is the fact that accident investigations seldom go into the depth of identifying and analysing Human Factor issues in maintenance operations.
1.3 SPS Analysis – Type of Operation Comparison
Figure 10 shows the percentage of accidents where SPS Level 1 has been assigned at least once, split into types of operation (General Aviation, Aerial Work, Commercial Air Transport)
for the whole time period 2000-2010.
0.0%
1.0%
2.0%
3.0%
4.0%
5.0%
6.0%
7.0%
8.0%
9.0%
HFACS ME -Maintainer Acts
HFACS ME -MaintainerConditions
HFACS ME - WorkingConditions
HFACS ME -Management
Conditions
Pe
rce
nta
ge
HFACS ME Level 1
Percentage of analysed accidents where HFACS ME Level 1 was assigned at least once
2000-2005
2006-2010
10
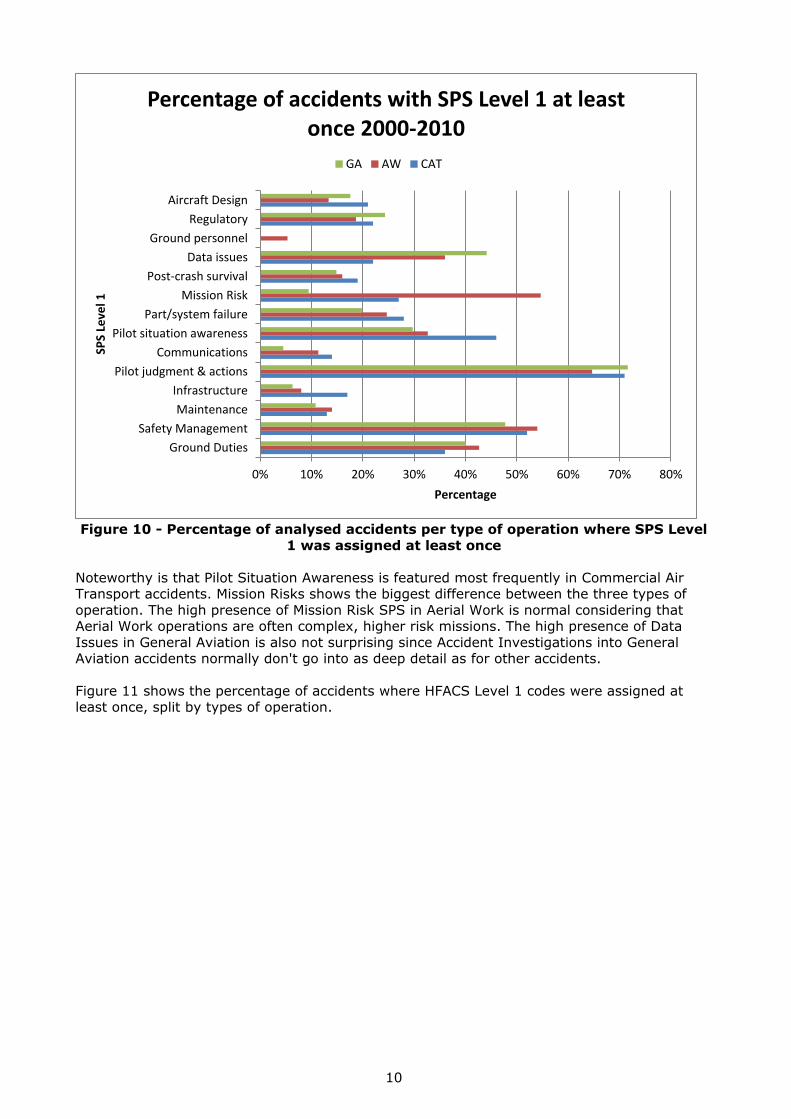
Figure 10 - Percentage of analysed accidents per type of operation where SPS Level
1 was assigned at least once
Noteworthy is that Pilot Situation Awareness is featured most frequently in Commercial Air Transport accidents. Mission Risks shows the biggest difference between the three types of
operation. The high presence of Mission Risk SPS in Aerial Work is normal considering that Aerial Work operations are often complex, higher risk missions. The high presence of Data
Issues in General Aviation is also not surprising since Accident Investigations into General Aviation accidents normally don't go into as deep detail as for other accidents.
Figure 11 shows the percentage of accidents where HFACS Level 1 codes were assigned at least once, split by types of operation.
0% 10% 20% 30% 40% 50% 60% 70% 80%
Ground Duties
Safety Management
Maintenance
Infrastructure
Pilot judgment & actions
Communications
Pilot situation awareness
Part/system failure
Mission Risk
Post-crash survival
Data issues
Ground personnel
Regulatory
Aircraft Design
Percentage
SPS
Leve
l 1Percentage of accidents with SPS Level 1 at least
once 2000-2010
GA AW CAT
11
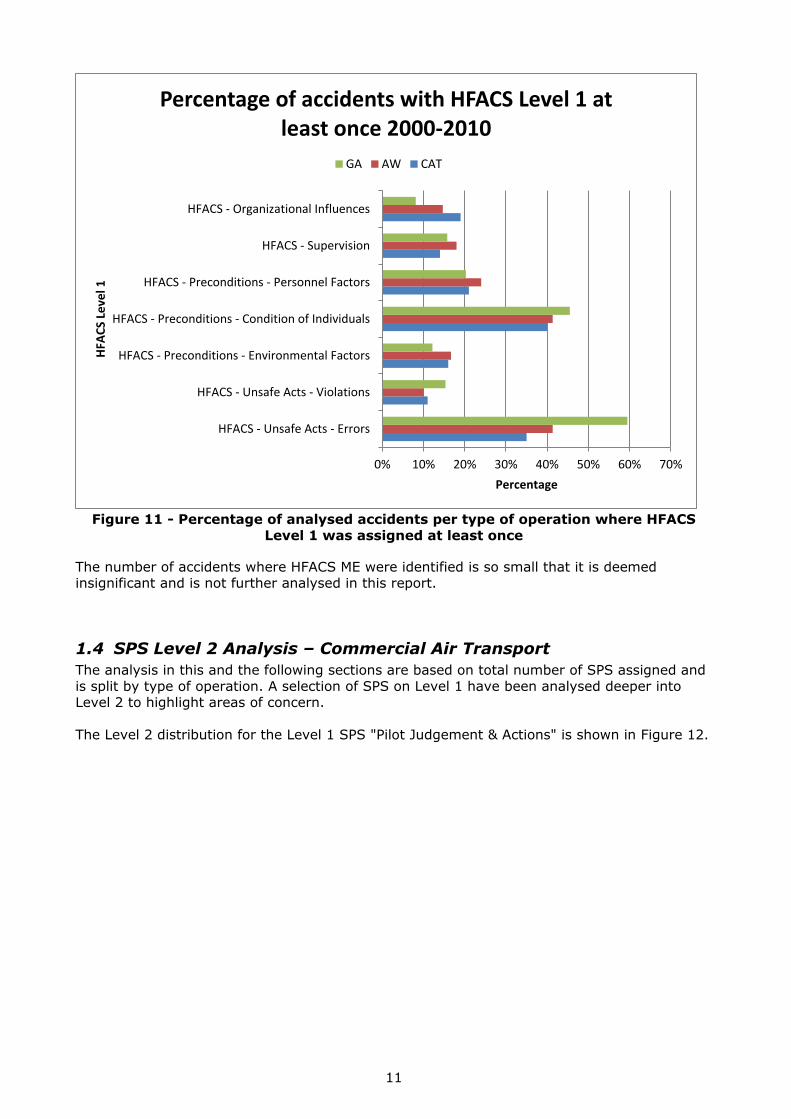
Figure 11 - Percentage of analysed accidents per type of operation where HFACS
Level 1 was assigned at least once
The number of accidents where HFACS ME were identified is so small that it is deemed insignificant and is not further analysed in this report.
1.4 SPS Level 2 Analysis – Commercial Air Transport
The analysis in this and the following sections are based on total number of SPS assigned and
is split by type of operation. A selection of SPS on Level 1 have been analysed deeper into Level 2 to highlight areas of concern.
The Level 2 distribution for the Level 1 SPS "Pilot Judgement & Actions" is shown in Figure 12.
0% 10% 20% 30% 40% 50% 60% 70%
HFACS - Unsafe Acts - Errors
HFACS - Unsafe Acts - Violations
HFACS - Preconditions - Environmental Factors
HFACS - Preconditions - Condition of Individuals
HFACS - Preconditions - Personnel Factors
HFACS - Supervision
HFACS - Organizational Influences
Percentage
HFA
CS
Leve
l 1Percentage of accidents with HFACS Level 1 at
least once 2000-2010
GA AW CAT
12
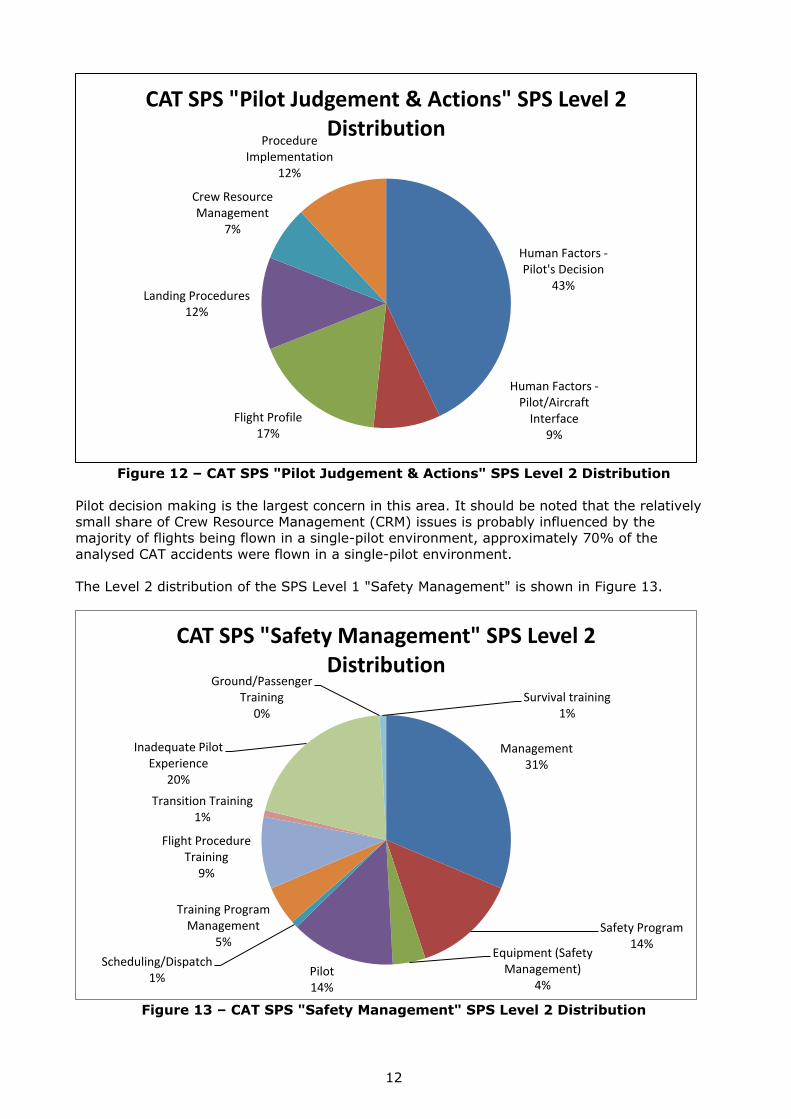
Figure 12 – CAT SPS "Pilot Judgement & Actions" SPS Level 2 Distribution
Pilot decision making is the largest concern in this area. It should be noted that the relatively
small share of Crew Resource Management (CRM) issues is probably influenced by the majority of flights being flown in a single-pilot environment, approximately 70% of the
analysed CAT accidents were flown in a single-pilot environment.
The Level 2 distribution of the SPS Level 1 "Safety Management" is shown in Figure 13.
Figure 13 – CAT SPS "Safety Management" SPS Level 2 Distribution
Human Factors -Pilot's Decision
43%
Human Factors -Pilot/Aircraft
Interface9%
Flight Profile17%
Landing Procedures12%
Crew Resource Management
7%
Procedure Implementation
12%
CAT SPS "Pilot Judgement & Actions" SPS Level 2 Distribution
Management31%
Safety Program14%
Equipment (Safety Management)
4%Pilot14%
Scheduling/Dispatch1%
Training Program Management
5%
Flight Procedure Training
9%
Transition Training1%
Inadequate Pilot Experience
20%
Ground/Passenger Training
0%Survival training
1%
CAT SPS "Safety Management" SPS Level 2 Distribution
13
The Management of the operations and the assignment of inexperienced pilots to difficult missions are the most prominent concerns in this area.
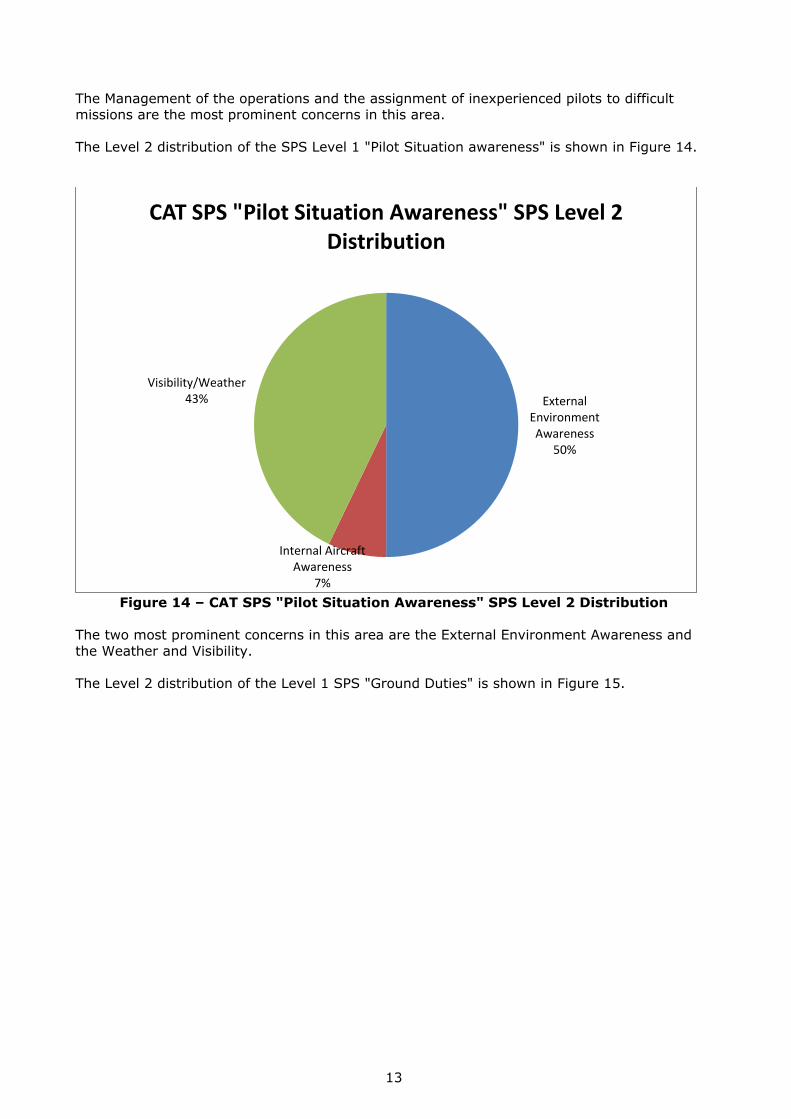
The Level 2 distribution of the SPS Level 1 "Pilot Situation awareness" is shown in Figure 14.
Figure 14 – CAT SPS "Pilot Situation Awareness" SPS Level 2 Distribution
The two most prominent concerns in this area are the External Environment Awareness and
the Weather and Visibility.
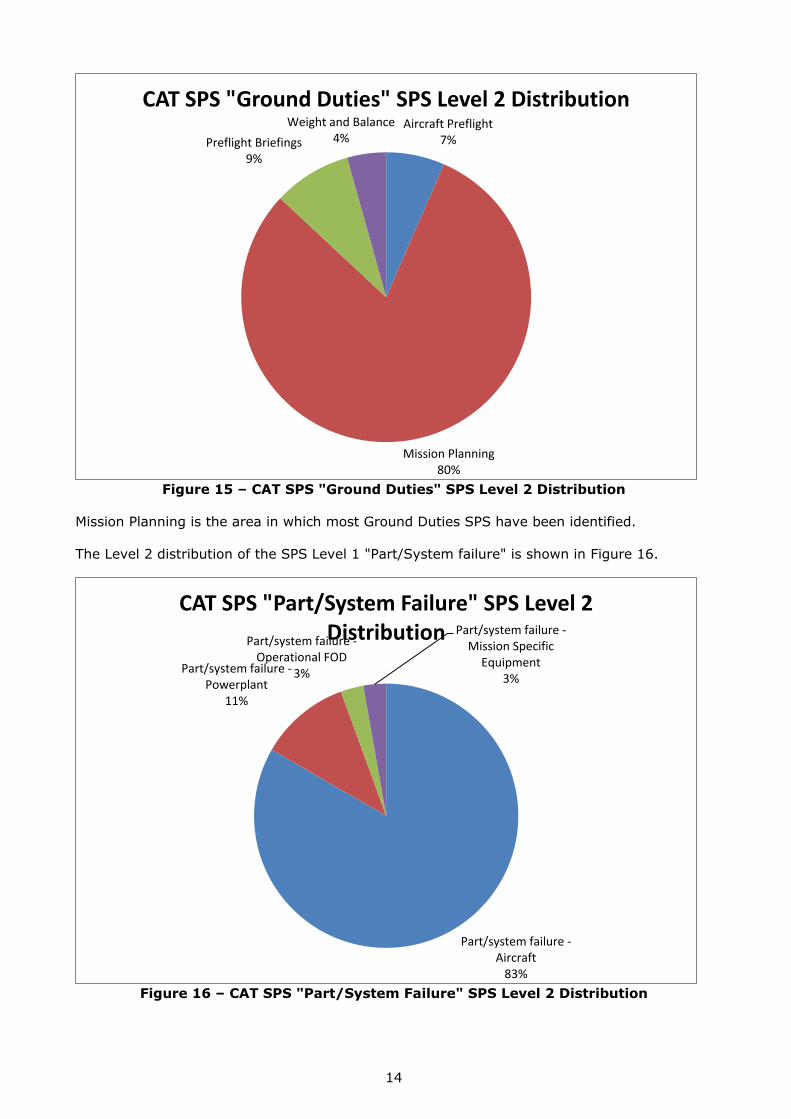
The Level 2 distribution of the Level 1 SPS "Ground Duties" is shown in Figure 15.
External Environment Awareness
50%
Internal Aircraft Awareness
7%
Visibility/Weather43%
CAT SPS "Pilot Situation Awareness" SPS Level 2 Distribution
14
Figure 15 – CAT SPS "Ground Duties" SPS Level 2 Distribution
Mission Planning is the area in which most Ground Duties SPS have been identified.
The Level 2 distribution of the SPS Level 1 "Part/System failure" is shown in Figure 16.
Figure 16 – CAT SPS "Part/System Failure" SPS Level 2 Distribution
Aircraft Preflight7%
Mission Planning80%
Preflight Briefings9%
Weight and Balance4%
CAT SPS "Ground Duties" SPS Level 2 Distribution
Part/system failure -Aircraft
83%
Part/system failure -Powerplant
11%
Part/system failure -Operational FOD
3%
Part/system failure -Mission Specific
Equipment3%
CAT SPS "Part/System Failure" SPS Level 2 Distribution
15
Failures of the airframe (rather than powerplant/engine failures) are the highest number
identified in this area.
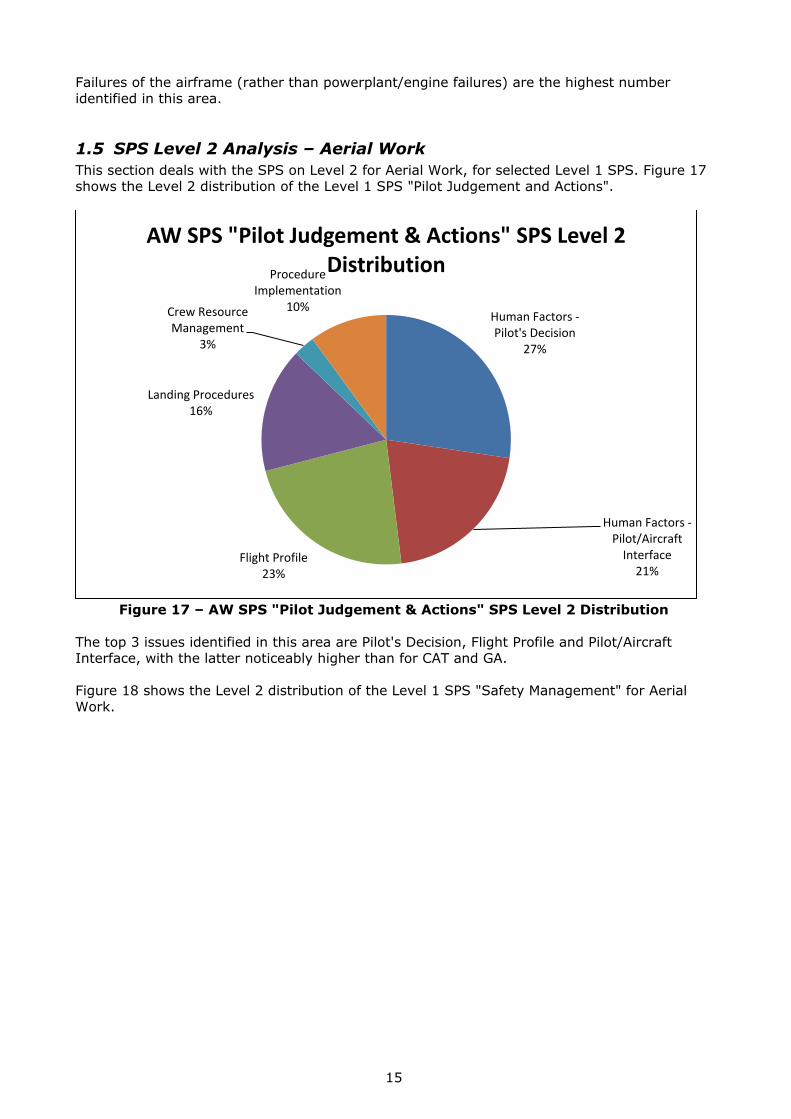
1.5 SPS Level 2 Analysis – Aerial Work
This section deals with the SPS on Level 2 for Aerial Work, for selected Level 1 SPS. Figure 17 shows the Level 2 distribution of the Level 1 SPS "Pilot Judgement and Actions".
Figure 17 – AW SPS "Pilot Judgement & Actions" SPS Level 2 Distribution
The top 3 issues identified in this area are Pilot's Decision, Flight Profile and Pilot/Aircraft Interface, with the latter noticeably higher than for CAT and GA.
Figure 18 shows the Level 2 distribution of the Level 1 SPS "Safety Management" for Aerial
Work.
Human Factors -Pilot's Decision
27%
Human Factors -Pilot/Aircraft
Interface21%
Flight Profile23%
Landing Procedures16%
Crew Resource Management
3%
Procedure Implementation
10%
AW SPS "Pilot Judgement & Actions" SPS Level 2 Distribution
16
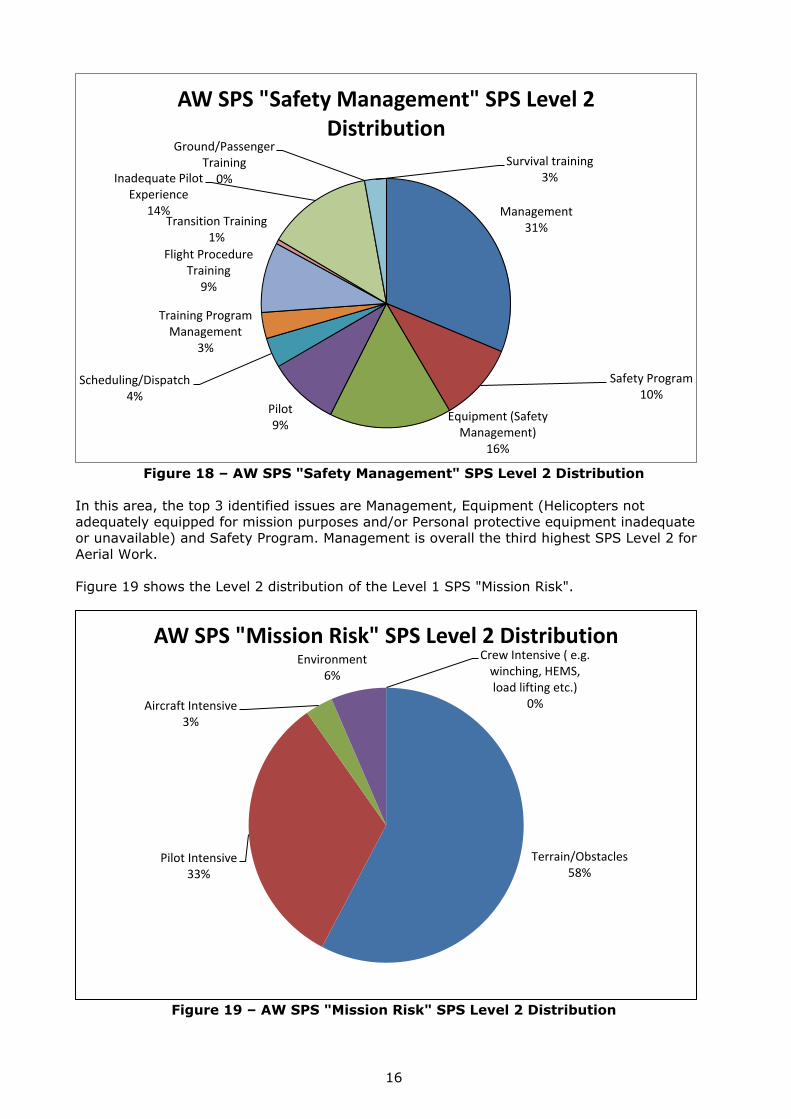
Figure 18 – AW SPS "Safety Management" SPS Level 2 Distribution
In this area, the top 3 identified issues are Management, Equipment (Helicopters not
adequately equipped for mission purposes and/or Personal protective equipment inadequate or unavailable) and Safety Program. Management is overall the third highest SPS Level 2 for
Aerial Work.
Figure 19 shows the Level 2 distribution of the Level 1 SPS "Mission Risk".
Figure 19 – AW SPS "Mission Risk" SPS Level 2 Distribution
Management31%
Safety Program10%
Equipment (Safety Management)
16%
Pilot9%
Scheduling/Dispatch4%
Training Program Management
3%
Flight Procedure Training
9%
Transition Training1%
Inadequate Pilot Experience
14%
Ground/Passenger Training
0%
Survival training3%
AW SPS "Safety Management" SPS Level 2 Distribution
Terrain/Obstacles58%
Pilot Intensive33%
Aircraft Intensive3%
Environment6%
Crew Intensive ( e.g. winching, HEMS, load lifting etc.)
0%
AW SPS "Mission Risk" SPS Level 2 Distribution
17
Not surprisingly, the proximity to terrain and obstacles are the highest areas of concerns for
Aerial Work missions. Many Aerial Work missions are conducted at low height, for example Power line inspections, Reindeer herding and firefighting.
1.6 SPS Level 2 Analysis – General Aviation
This section deals with the SPS on Level 2 for General Aviation, for selected Level 1 SPS.
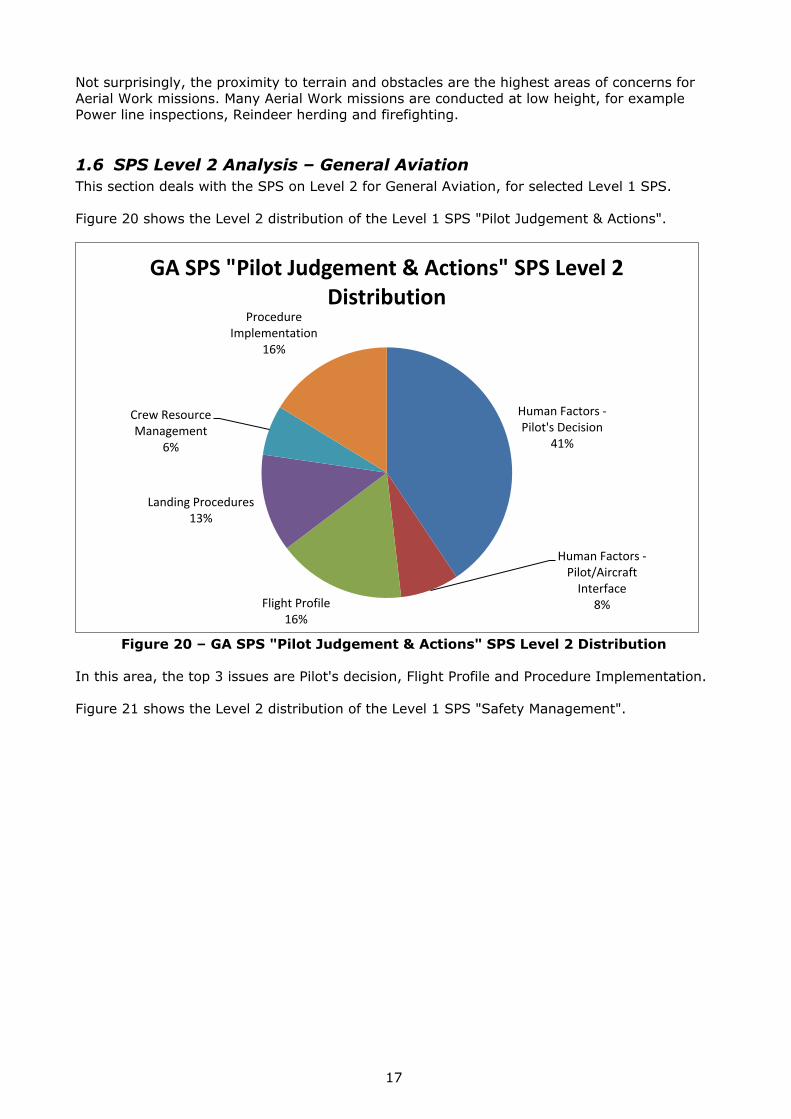
Figure 20 shows the Level 2 distribution of the Level 1 SPS "Pilot Judgement & Actions".
Figure 20 – GA SPS "Pilot Judgement & Actions" SPS Level 2 Distribution
In this area, the top 3 issues are Pilot's decision, Flight Profile and Procedure Implementation.
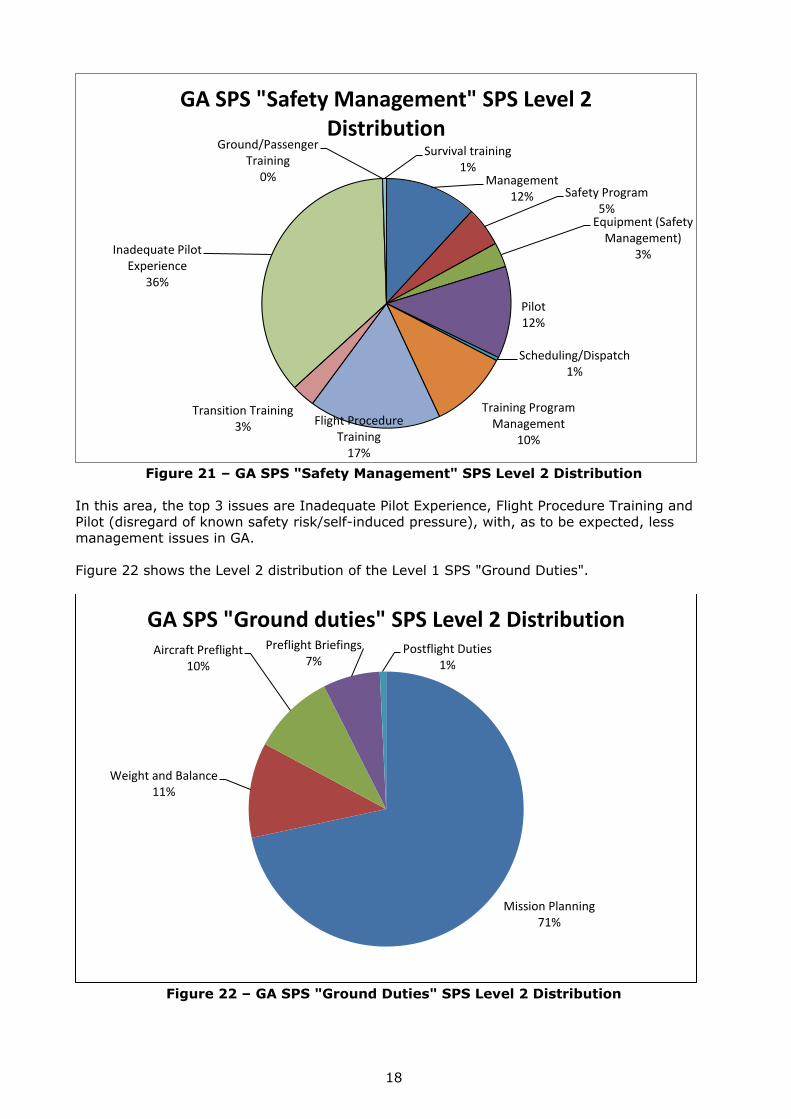
Figure 21 shows the Level 2 distribution of the Level 1 SPS "Safety Management".
Human Factors -Pilot's Decision
41%
Human Factors -Pilot/Aircraft
Interface8%Flight Profile
16%
Landing Procedures13%
Crew Resource Management
6%
Procedure Implementation
16%
GA SPS "Pilot Judgement & Actions" SPS Level 2 Distribution
18
Figure 21 – GA SPS "Safety Management" SPS Level 2 Distribution
In this area, the top 3 issues are Inadequate Pilot Experience, Flight Procedure Training and
Pilot (disregard of known safety risk/self-induced pressure), with, as to be expected, less management issues in GA.
Figure 22 shows the Level 2 distribution of the Level 1 SPS "Ground Duties".
Figure 22 – GA SPS "Ground Duties" SPS Level 2 Distribution
Management12% Safety Program
5%Equipment (Safety
Management)3%
Pilot12%
Scheduling/Dispatch1%
Training Program Management
10%
Flight Procedure Training
17%
Transition Training3%
Inadequate Pilot Experience
36%
Ground/Passenger Training
0%
Survival training1%
GA SPS "Safety Management" SPS Level 2 Distribution
Mission Planning71%
Weight and Balance11%
Aircraft Preflight10%
Preflight Briefings7%
Postflight Duties1%
GA SPS "Ground duties" SPS Level 2 Distribution
19
Mission Planning is the main issue in this area, followed by Weight and Balance and Aircraft
preflight.
1.7 HFACS Level 2 Analysis – Commercial Air Transport
This section highlights the HFACS analysis performed by the regional teams on Commercial Air Transport accidents.
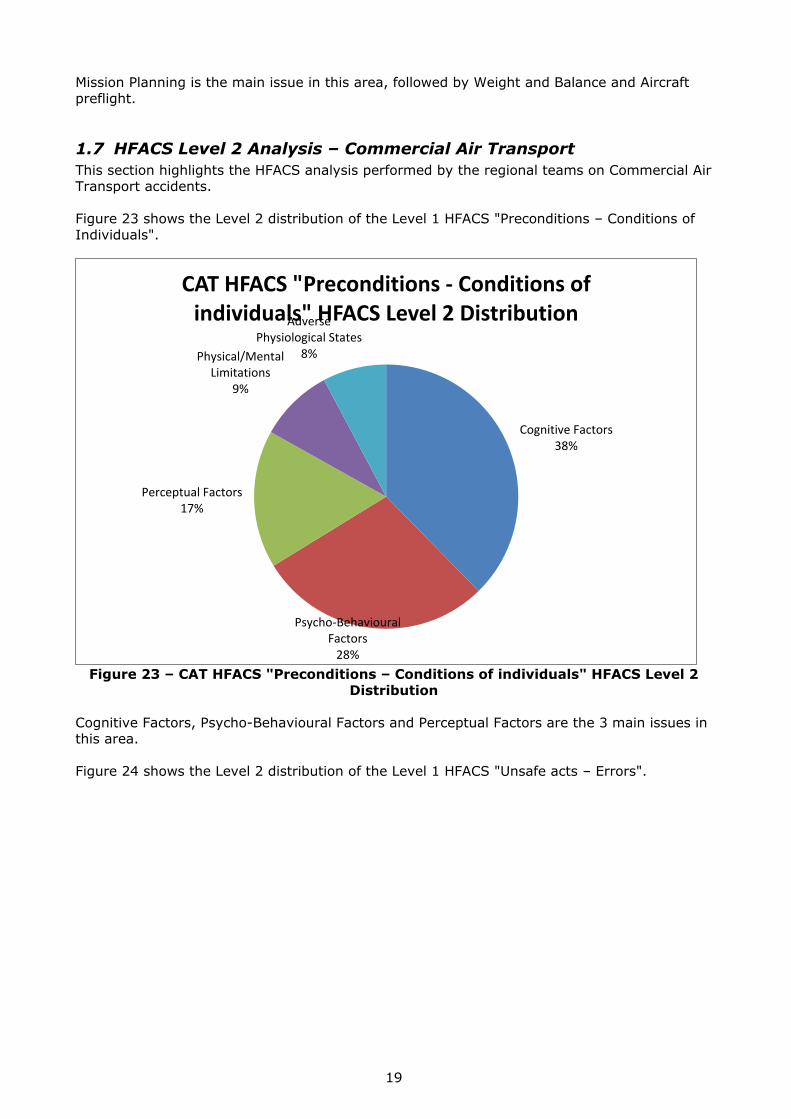
Figure 23 shows the Level 2 distribution of the Level 1 HFACS "Preconditions – Conditions of
Individuals".
Figure 23 – CAT HFACS "Preconditions – Conditions of individuals" HFACS Level 2
Distribution
Cognitive Factors, Psycho-Behavioural Factors and Perceptual Factors are the 3 main issues in this area.
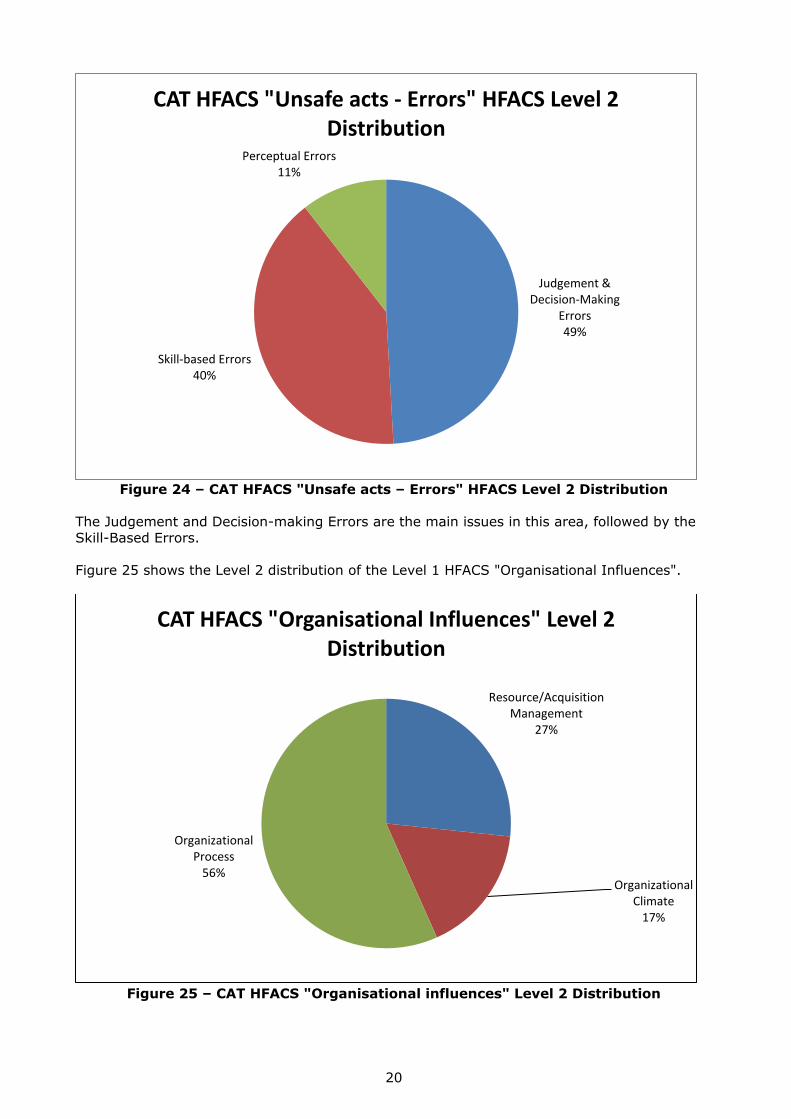
Figure 24 shows the Level 2 distribution of the Level 1 HFACS "Unsafe acts – Errors".
Cognitive Factors38%
Psycho-Behavioural Factors
28%
Perceptual Factors17%
Physical/Mental Limitations
9%
Adverse Physiological States
8%
CAT HFACS "Preconditions - Conditions of individuals" HFACS Level 2 Distribution
20
Figure 24 – CAT HFACS "Unsafe acts – Errors" HFACS Level 2 Distribution
The Judgement and Decision-making Errors are the main issues in this area, followed by the
Skill-Based Errors.
Figure 25 shows the Level 2 distribution of the Level 1 HFACS "Organisational Influences".
Figure 25 – CAT HFACS "Organisational influences" Level 2 Distribution
Judgement & Decision-Making
Errors49%
Skill-based Errors40%
Perceptual Errors11%
CAT HFACS "Unsafe acts - Errors" HFACS Level 2 Distribution
Resource/Acquisition Management
27%
Organizational Climate
17%
Organizational Process
56%
CAT HFACS "Organisational Influences" Level 2 Distribution
21
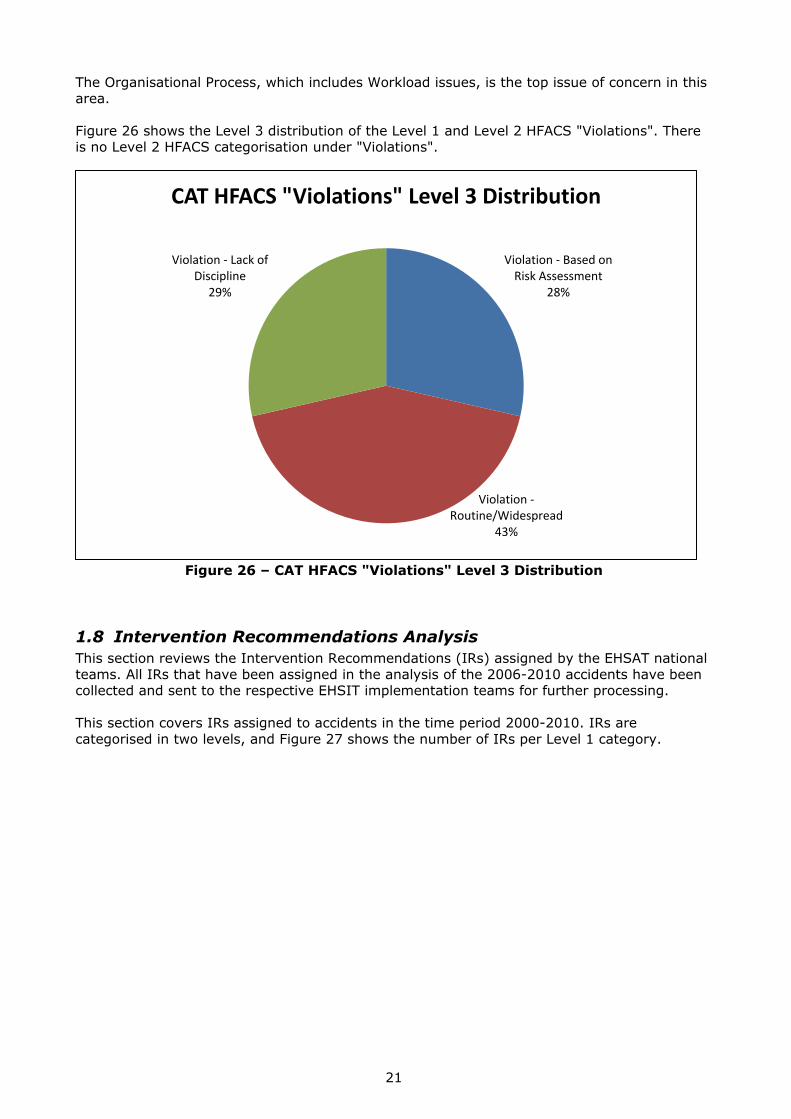
The Organisational Process, which includes Workload issues, is the top issue of concern in this
area.
Figure 26 shows the Level 3 distribution of the Level 1 and Level 2 HFACS "Violations". There is no Level 2 HFACS categorisation under "Violations".
Figure 26 – CAT HFACS "Violations" Level 3 Distribution
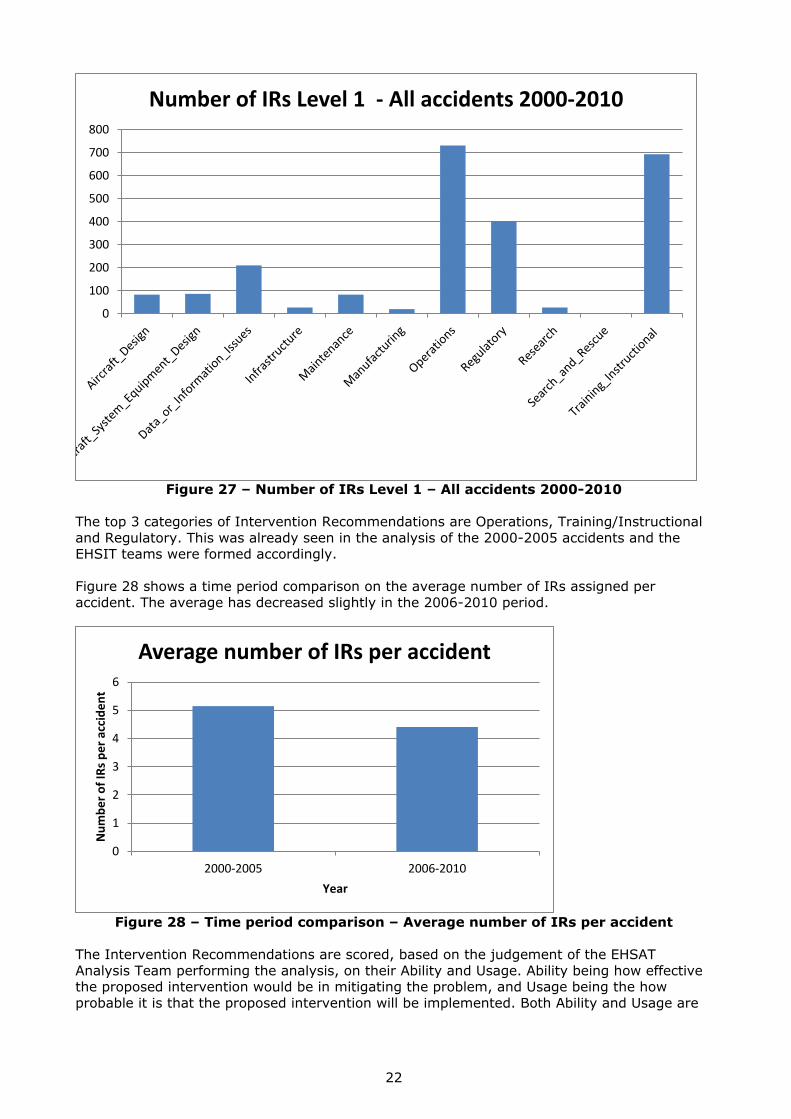
1.8 Intervention Recommendations Analysis
This section reviews the Intervention Recommendations (IRs) assigned by the EHSAT national
teams. All IRs that have been assigned in the analysis of the 2006-2010 accidents have been collected and sent to the respective EHSIT implementation teams for further processing.
This section covers IRs assigned to accidents in the time period 2000-2010. IRs are
categorised in two levels, and Figure 27 shows the number of IRs per Level 1 category.
Violation - Based on Risk Assessment
28%
Violation -Routine/Widespread
43%
Violation - Lack of Discipline
29%
CAT HFACS "Violations" Level 3 Distribution
22
Figure 27 – Number of IRs Level 1 – All accidents 2000-2010
The top 3 categories of Intervention Recommendations are Operations, Training/Instructional
and Regulatory. This was already seen in the analysis of the 2000-2005 accidents and the EHSIT teams were formed accordingly.
Figure 28 shows a time period comparison on the average number of IRs assigned per
accident. The average has decreased slightly in the 2006-2010 period.
Figure 28 – Time period comparison – Average number of IRs per accident
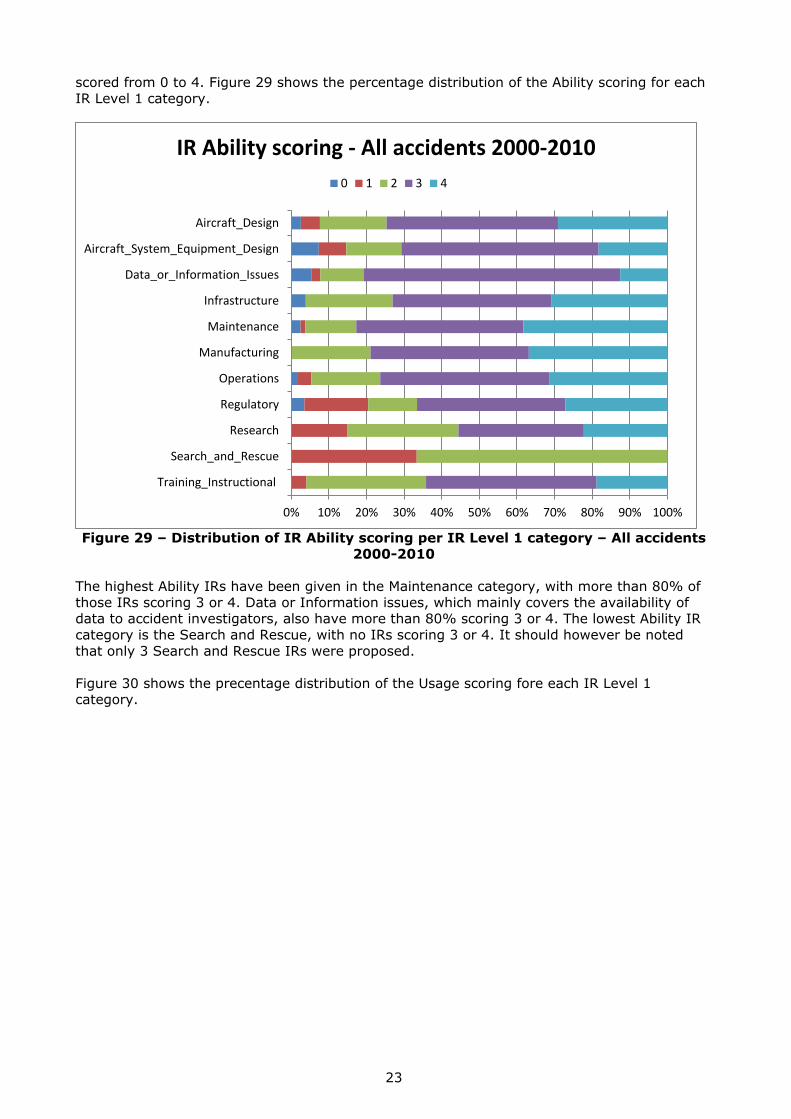
The Intervention Recommendations are scored, based on the judgement of the EHSAT
Analysis Team performing the analysis, on their Ability and Usage. Ability being how effective the proposed intervention would be in mitigating the problem, and Usage being the how
probable it is that the proposed intervention will be implemented. Both Ability and Usage are
0
100
200
300
400
500
600
700
800
Number of IRs Level 1 - All accidents 2000-2010
0
1
2
3
4
5
6
2000-2005 2006-2010
Nu
mb
er
of
IRs
pe
r ac
cid
en
t
Year
Average number of IRs per accident
23
scored from 0 to 4. Figure 29 shows the percentage distribution of the Ability scoring for each
IR Level 1 category.
Figure 29 – Distribution of IR Ability scoring per IR Level 1 category – All accidents
2000-2010
The highest Ability IRs have been given in the Maintenance category, with more than 80% of
those IRs scoring 3 or 4. Data or Information issues, which mainly covers the availability of data to accident investigators, also have more than 80% scoring 3 or 4. The lowest Ability IR
category is the Search and Rescue, with no IRs scoring 3 or 4. It should however be noted
that only 3 Search and Rescue IRs were proposed.
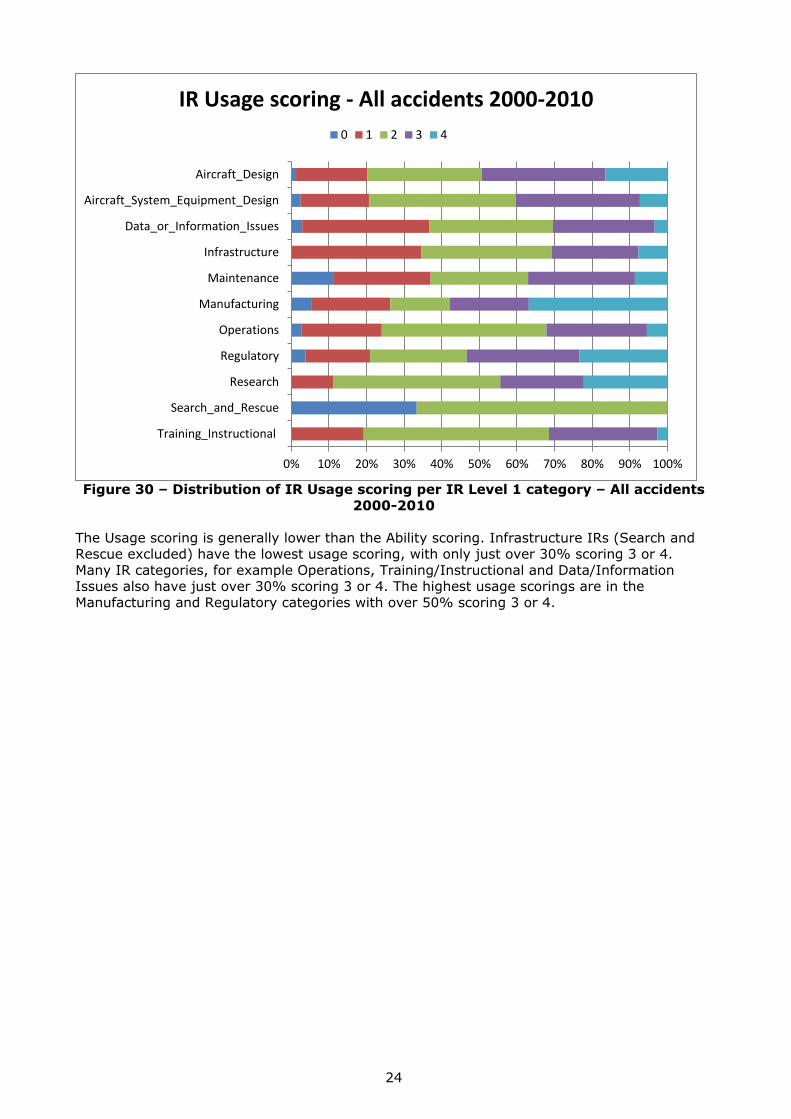
Figure 30 shows the precentage distribution of the Usage scoring fore each IR Level 1 category.
0% 10% 20% 30% 40% 50% 60% 70% 80% 90% 100%
Training_Instructional
Search_and_Rescue
Research
Regulatory
Operations
Manufacturing
Maintenance
Infrastructure
Data_or_Information_Issues
Aircraft_System_Equipment_Design
Aircraft_Design
IR Ability scoring - All accidents 2000-2010
0 1 2 3 4
24
Figure 30 – Distribution of IR Usage scoring per IR Level 1 category – All accidents
2000-2010
The Usage scoring is generally lower than the Ability scoring. Infrastructure IRs (Search and Rescue excluded) have the lowest usage scoring, with only just over 30% scoring 3 or 4.
Many IR categories, for example Operations, Training/Instructional and Data/Information Issues also have just over 30% scoring 3 or 4. The highest usage scorings are in the
Manufacturing and Regulatory categories with over 50% scoring 3 or 4.
0% 10% 20% 30% 40% 50% 60% 70% 80% 90% 100%
Training_Instructional
Search_and_Rescue
Research
Regulatory
Operations
Manufacturing
Maintenance
Infrastructure
Data_or_Information_Issues
Aircraft_System_Equipment_Design
Aircraft_Design
IR Usage scoring - All accidents 2000-2010
0 1 2 3 4
25
2 Concluding Remarks and Way Forward The continued analysis of Helicopter Accidents in the period 2006-2010 by the EHSAT Teams
and the comparison with the analysis of 2000-2005 accidents have confirmed that the issues identified in this first period continue to be of concern and that the safety improvement
actions decided based on the first analysis period are still valid.
Since this first analysis report was published, the EHSIT Specialist Teams Training, Ops & SMS and Technology have produced a number of safety promotion material in the form of leaflets,
videos, toolkits, manuals and reports. That material addresses and provides ways to mitigate
the top safety issues and intervention recommendations identified in the analysis of the 2000-2005 accidents.
This work continues and the results of the analysis of the 2006-2010 accidents will be
communicated to the EHSIT STs and will contribute to shaping the future priorities and actions of the EHIST Specialist Teams.
Results will also be shared within EASA and contribute to defining the helicopter Safety Risk
Portfolio, which will serve as a basis to develop the helicopter section of the European Aviation
Safety plan (EASp).