Embed Size (px)
Citation preview
European Electricity Market between Liberalisation and Climate Protection
Dr. Markus Blesl, Dipl.-Ing. Uwe Remme, Dr. Ulrich Fahl
23.06.2004International Energy Workshop,
Paris
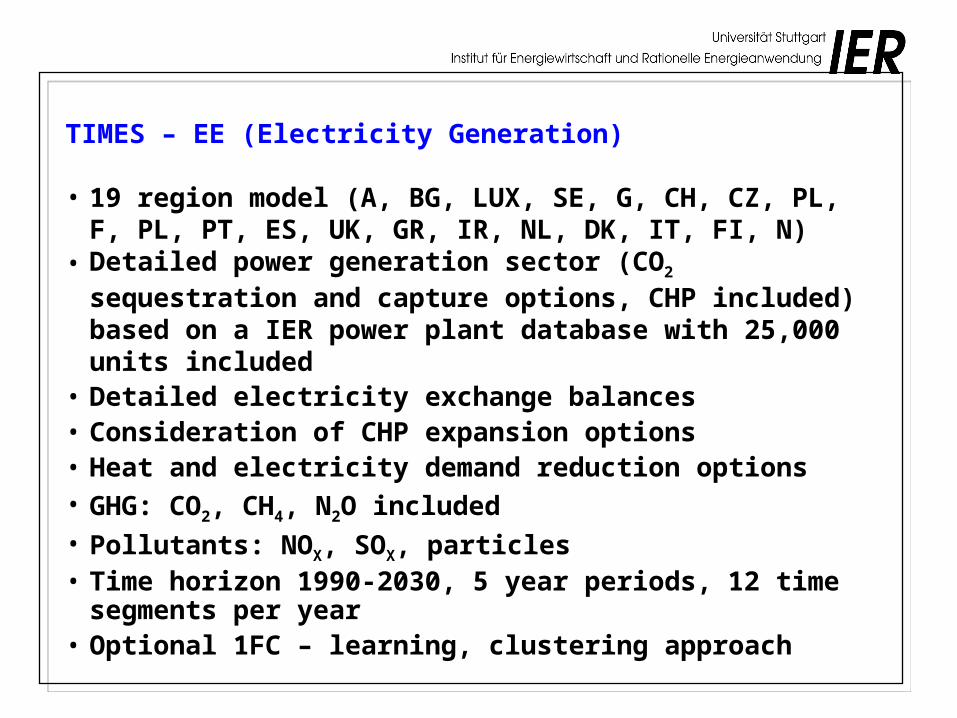
TIMES – EE (Electricity Generation)
• 19 region model (A, BG, LUX, SE, G, CH, CZ, PL, F, PL, PT, ES, UK, GR, IR, NL, DK, IT, FI, N)
• Detailed power generation sector (CO2 sequestration and capture options, CHP included) based on a IER power plant database with 25,000 units included
• Detailed electricity exchange balances• Consideration of CHP expansion options• Heat and electricity demand reduction options • GHG: CO2, CH4, N2O included• Pollutants: NOX, SOX, particles• Time horizon 1990-2030, 5 year periods, 12 time segments per
year• Optional 1FC – learning, clustering approach
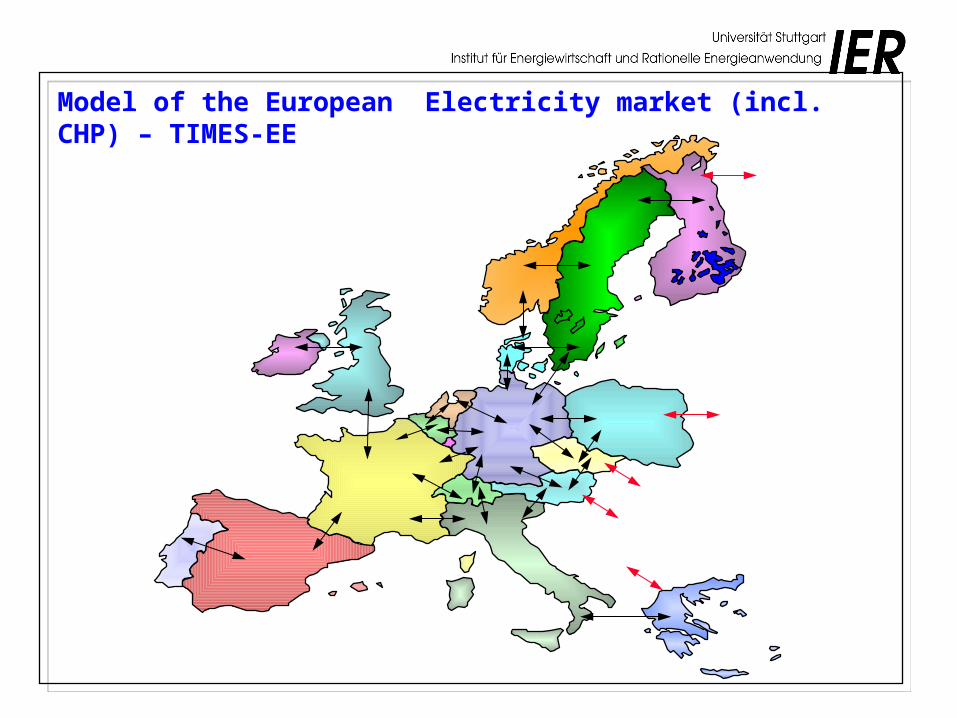
Model of the European Electricity market (incl. CHP) – TIMES-EE
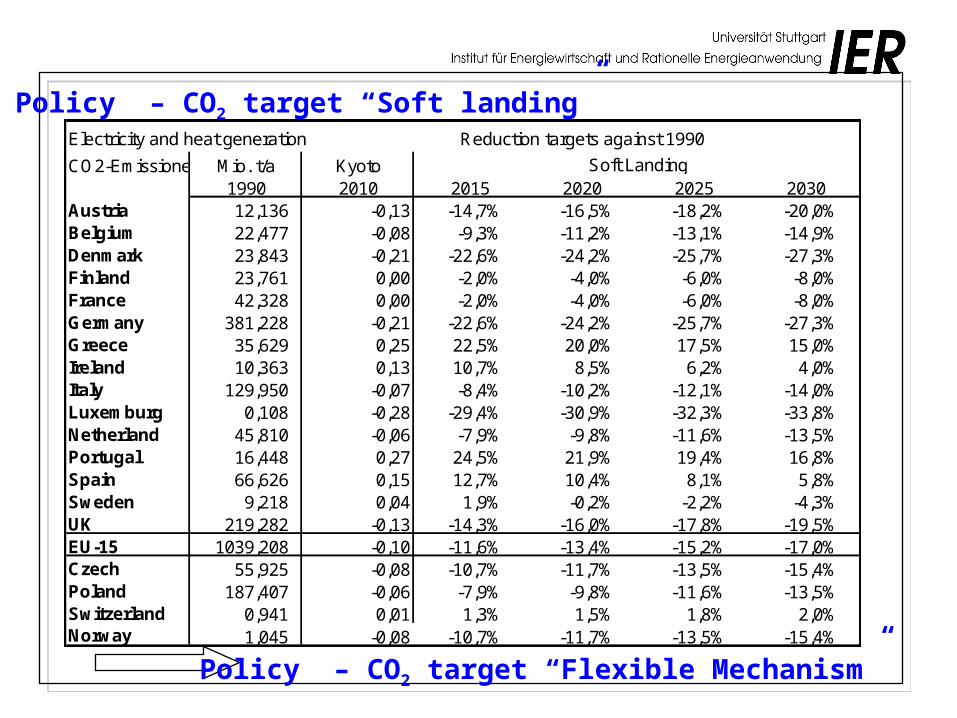
Policy – CO2 target “Soft landing” Electricity and heat generation Reduction targets against 1990
CO2-Emissionen Mio. t/a Kyoto1990 2010 2015 2020 2025 2030
Austria 12,136 -0,13 -14,7% -16,5% -18,2% -20,0% Belgium 22,477 -0,08 -9,3% -11,2% -13,1% -14,9% Denmark 23,843 -0,21 -22,6% -24,2% -25,7% -27,3% Finland 23,761 0,00 -2,0% -4,0% -6,0% -8,0% France 42,328 0,00 -2,0% -4,0% -6,0% -8,0% Germany 381,228 -0,21 -22,6% -24,2% -25,7% -27,3% Greece 35,629 0,25 22,5% 20,0% 17,5% 15,0% Ireland 10,363 0,13 10,7% 8,5% 6,2% 4,0% Italy 129,950 -0,07 -8,4% -10,2% -12,1% -14,0% Luxemburg 0,108 -0,28 -29,4% -30,9% -32,3% -33,8% Netherland 45,810 -0,06 -7,9% -9,8% -11,6% -13,5% Portugal 16,448 0,27 24,5% 21,9% 19,4% 16,8% Spain 66,626 0,15 12,7% 10,4% 8,1% 5,8% Sweden 9,218 0,04 1,9% -0,2% -2,2% -4,3% UK 219,282 -0,13 -14,3% -16,0% -17,8% -19,5% EU-15 1039,208 -0,10 -11,6% -13,4% -15,2% -17,0% Czech 55,925 -0,08 -10,7% -11,7% -13,5% -15,4% Poland 187,407 -0,06 -7,9% -9,8% -11,6% -13,5% Switzerland 0,941 0,01 1,3% 1,5% 1,8% 2,0% Norway 1,045 -0,08 -10,7% -11,7% -13,5% -15,4%
Soft Landing
Policy – CO2 target “Flexible Mechanism”

Energy price assumption on power plant level (Euro pro GJ)
0
1
2
3
4
5
6
1990 1995 2000 2005 2010 2015 2020 2025 2030
En
erg
y p
rice
on
po
wer
pla
nt
leve
l in
[E
uro
/GJ]
Lignite Coal Oil Gas

Energy price differences on power plant level compared with Germany (tax included) in Euro/GJ
Light Fuel Oil
Heavy Fuel Oil Natural Gas Steam Coal
France -0,26 0,00 0,00 -0,23Austria 0,07 -0,19 0,18 0,00Belgium / Lux -0,97 0,16 -0,60 0,03Switzerland -2,68 0,00 0,00 0,00Czech Republic -0,79 -1,43 -0,18 -0,93Denmark -1,03 0,00 0,00 0,00Sweden -2,55 0,00 0,00 0,00Poland -1,16 -1,30 0,00 -0,29Netherlands 1,40 1,80 -0,74 0,00Finland 1,56 2,32 -0,16 -0,17Greece 3,41 1,33Ireland -0,05 1,22 -0,56 -0,45Italy 3,48 0,19 -0,51 0,11Luxembourg 0,64Portugal 1,39 -0,40Spain 6,05 3,64 1,34UK 0,46 1,54 -0,85 -0,03
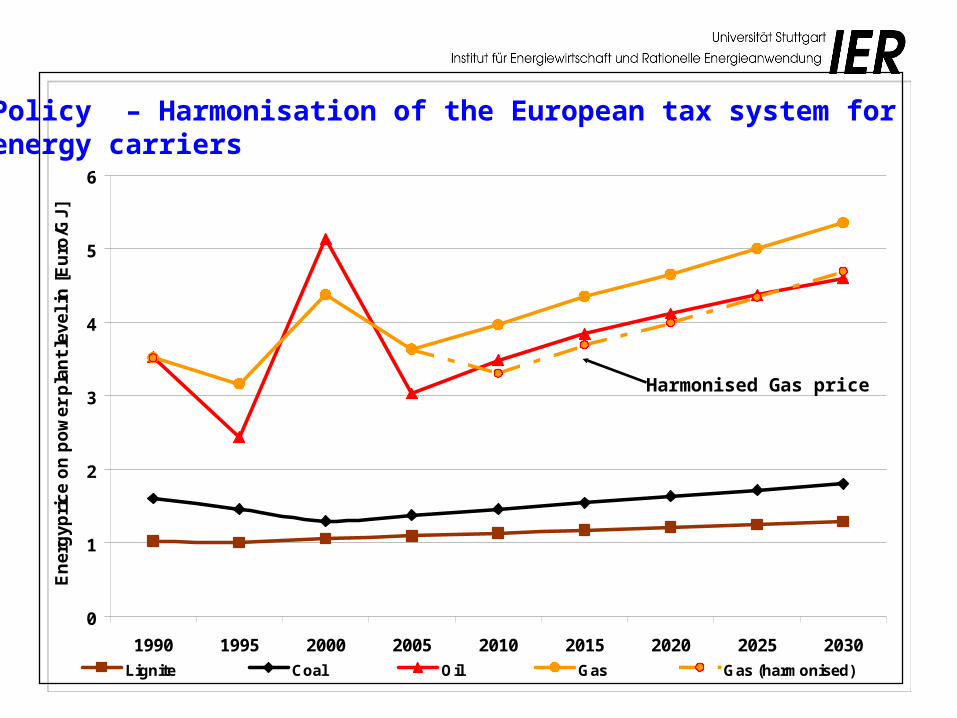
Policy – Harmonisation of the European tax system for energy carriers
0
1
2
3
4
5
6
1990 1995 2000 2005 2010 2015 2020 2025 2030
En
erg
yp
ric
e o
n p
ow
er
pla
nt
lev
el
in [
Eu
ro/G
J]
Lignite Coal Oil Gas Gas (harmonised)
Harmonised Gas price
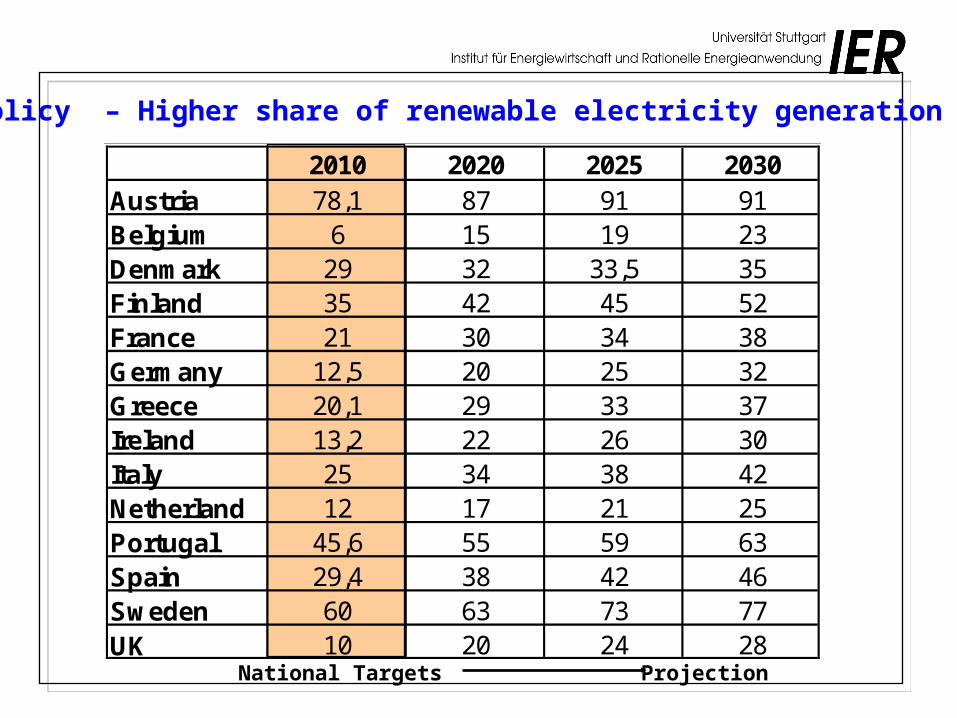
Policy – Higher share of renewable electricity generation
2010 2020 2025 2030Austria 78,1 87 91 91Belgium 6 15 19 23Denmark 29 32 33,5 35Finland 35 42 45 52France 21 30 34 38Germany 12,5 20 25 32Greece 20,1 29 33 37Ireland 13,2 22 26 30Italy 25 34 38 42Netherland 12 17 21 25Portugal 45,6 55 59 63Spain 29,4 38 42 46Sweden 60 63 73 77UK 10 20 24 28
Projection National Targets
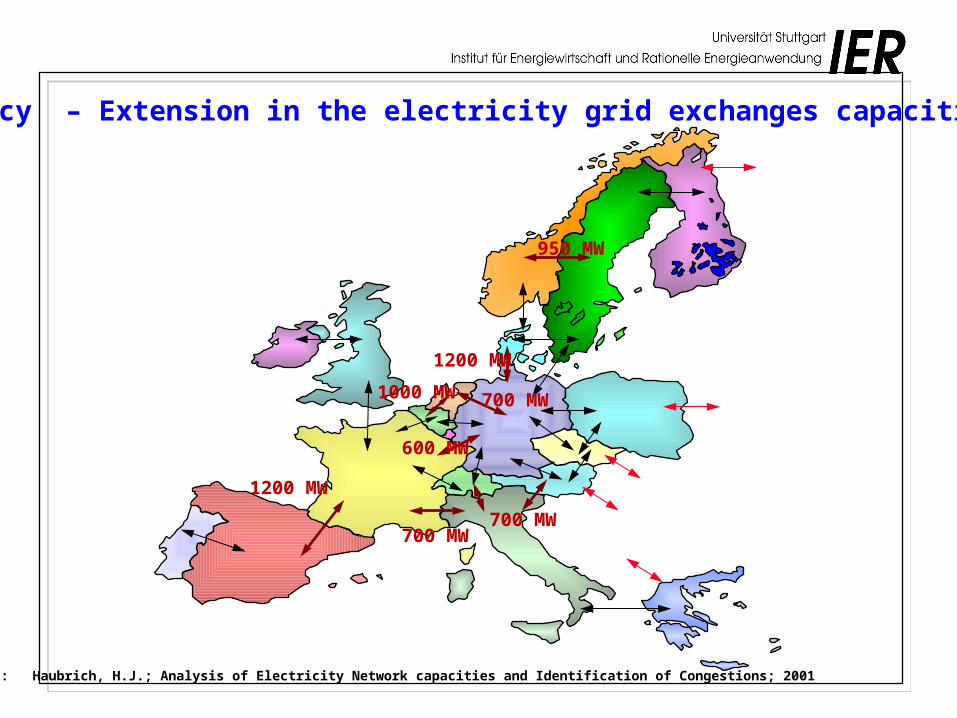
Policy – Extension in the electricity grid exchanges capacities
1200 MW
700 MW
600 MW
1000 MW
1200 MW
950 MW
700 MW
700 MW
Source: Haubrich, H.J.; Analysis of Electricity Network capacities and Identification of Congestions; 2001
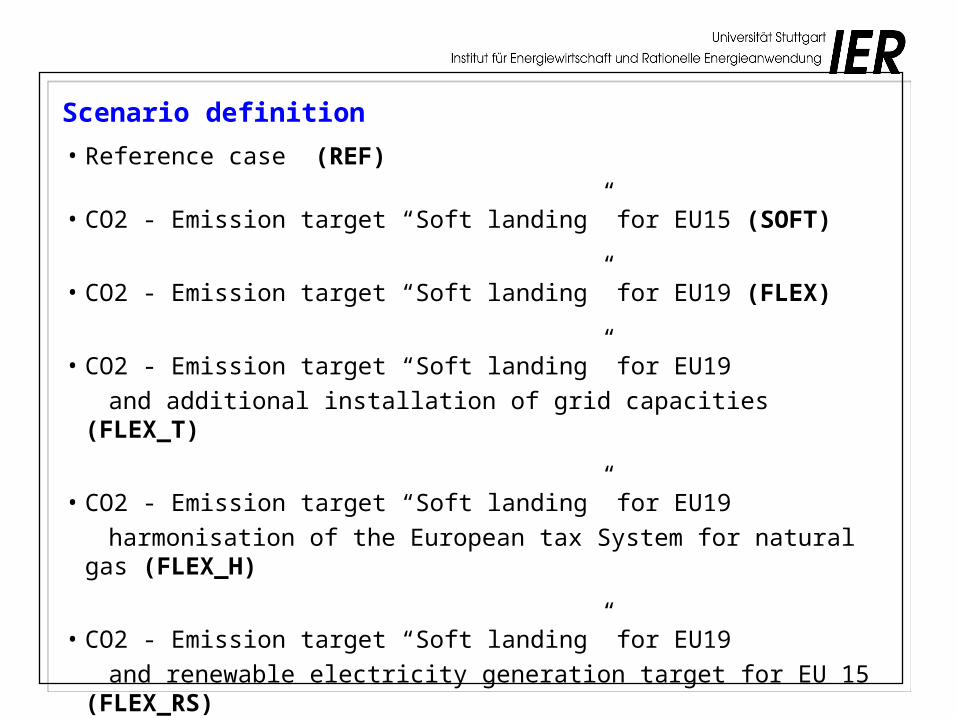
Scenario definition
• Reference case (REF)
• CO2 - Emission target “Soft landing” for EU15 (SOFT)
• CO2 - Emission target “Soft landing” for EU19 (FLEX)
• CO2 - Emission target “Soft landing” for EU19
and additional installation of grid capacities (FLEX_T)
• CO2 - Emission target “Soft landing” for EU19
harmonisation of the European tax System for natural gas (FLEX_H)
• CO2 - Emission target “Soft landing” for EU19
and renewable electricity generation target for EU 15 (FLEX_RS)
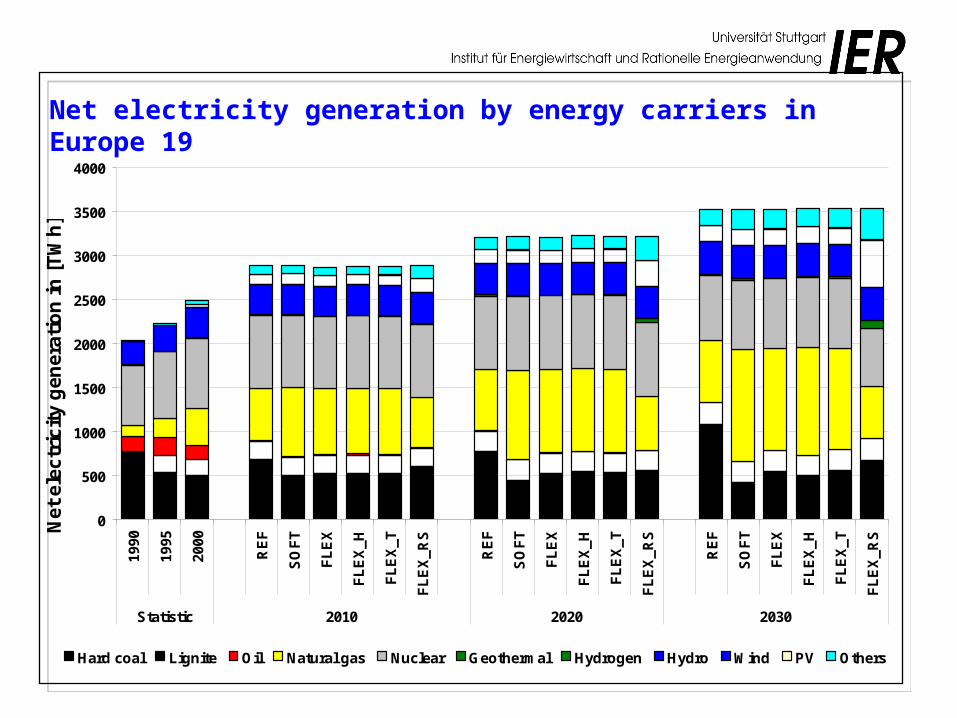
Net electricity generation by energy carriers in Europe 19
0
500
1000
1500
2000
2500
3000
3500
4000
1990
1995
2000
RE
F
SO
FT
FL
EX
FL
EX
_H
FL
EX
_T
FL
EX
_RS
RE
F
SO
FT
FL
EX
FL
EX
_H
FL
EX
_T
FL
EX
_RS
RE
F
SO
FT
FL
EX
FL
EX
_H
FL
EX
_T
FL
EX
_RS
Statistic 2010 2020 2030
Ne
t e
lec
tric
ity
ge
ne
rati
on
in [
TW
h]
Hard coal Lignite Oil Natural gas Nuclear Geothermal Hydrogen Hydro Wind PV Others
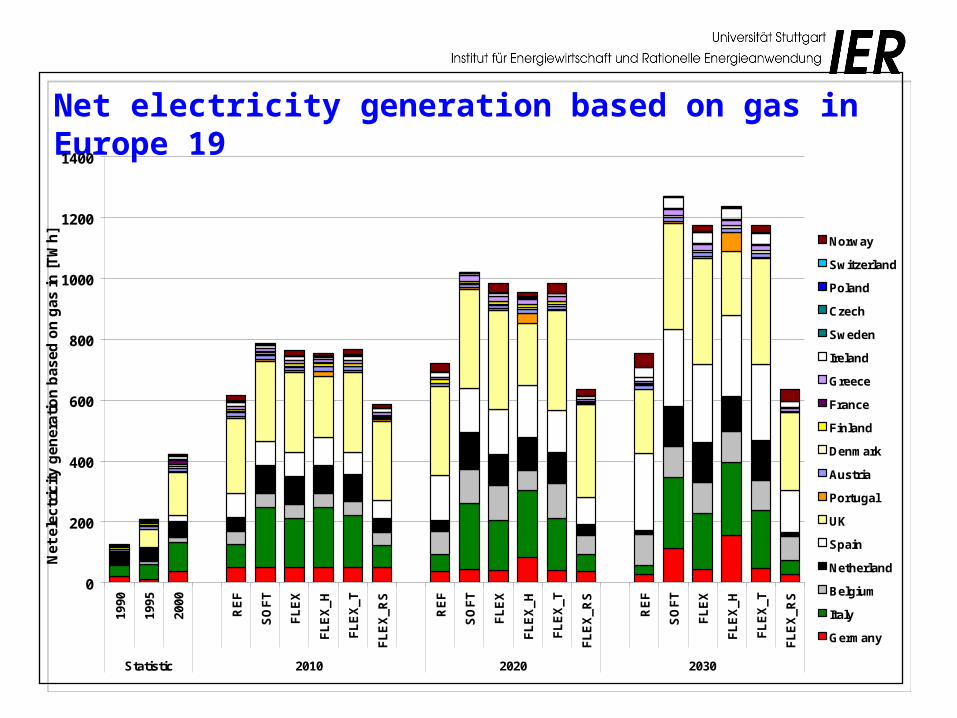
Net electricity generation based on gas in Europe 19
0
200
400
600
800
1000
1200
1400
1990
1995
2000
RE
F
SO
FT
FL
EX
FL
EX
_H
FL
EX
_T
FL
EX
_RS
RE
F
SO
FT
FL
EX
FL
EX
_H
FL
EX
_T
FL
EX
_RS
RE
F
SO
FT
FL
EX
FL
EX
_H
FL
EX
_T
FL
EX
_RS
Statistic 2010 2020 2030
Net
ele
ctr
icit
y g
en
era
tio
n b
as
ed
on
ga
s i
n [
TW
h]
Norway
Switzerland
Poland
Czech
Sweden
Ireland
Greece
France
Finland
Denmark
Austria
Portugal
UK
Spain
Netherland
Belgium
Italy
Germany
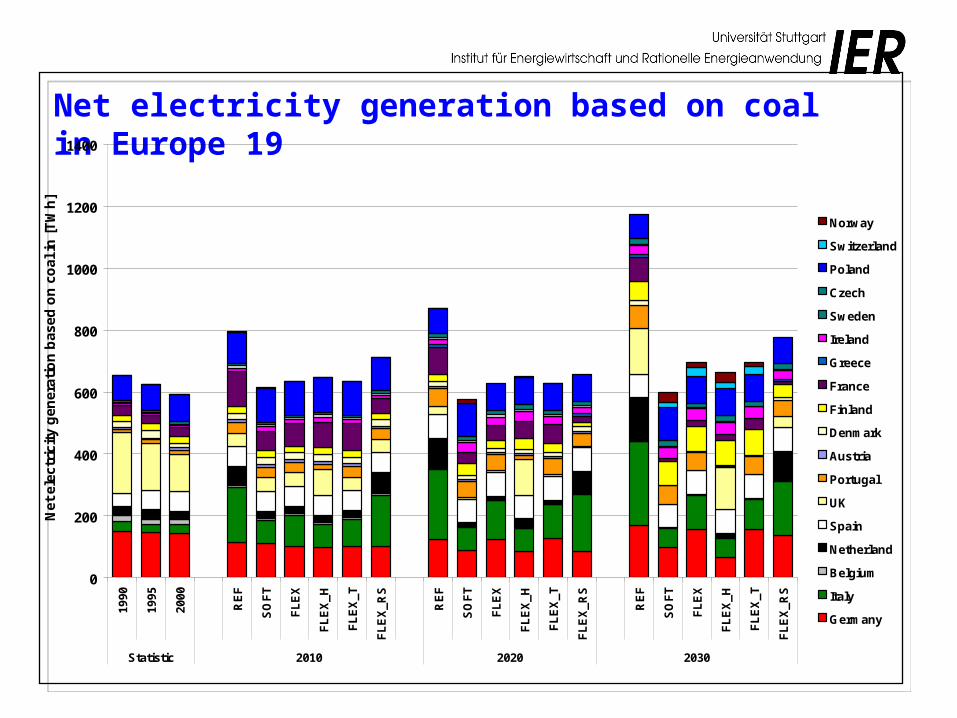
Net electricity generation based on coal in Europe 19
0
200
400
600
800
1000
1200
1400
1990
1995
2000
RE
F
SO
FT
FL
EX
FL
EX
_H
FL
EX
_T
FL
EX
_RS
RE
F
SO
FT
FL
EX
FL
EX
_H
FL
EX
_T
FL
EX
_RS
RE
F
SO
FT
FL
EX
FL
EX
_H
FL
EX
_T
FL
EX
_RS
Statistic 2010 2020 2030
Net
ele
ctri
city
gen
erat
ion
bas
ed o
n c
oal
in
[T
Wh
]
Norway
Switzerland
Poland
Czech
Sweden
Ireland
Greece
France
Finland
Denmark
Austria
Portugal
UK
Spain
Netherland
Belgium
Italy
Germany
-250
-200
-150
-100
-50
0
50
100
150
200
250
1990
1995
2000
RE
F
SO
FT
FL
EX
FL
EX
_H
FL
EX
_T
FL
EX
_RS
RE
F
SO
FT
FL
EX
FL
EX
_H
FL
EX
_T
FL
EX
_RS
RE
F
SO
FT
FL
EX
FL
EX
_H
FL
EX
_T
FL
EX
_RS
Statistic 2010 2020 2030
Ele
ctri
city
exc
han
ge
in [
TW
h]
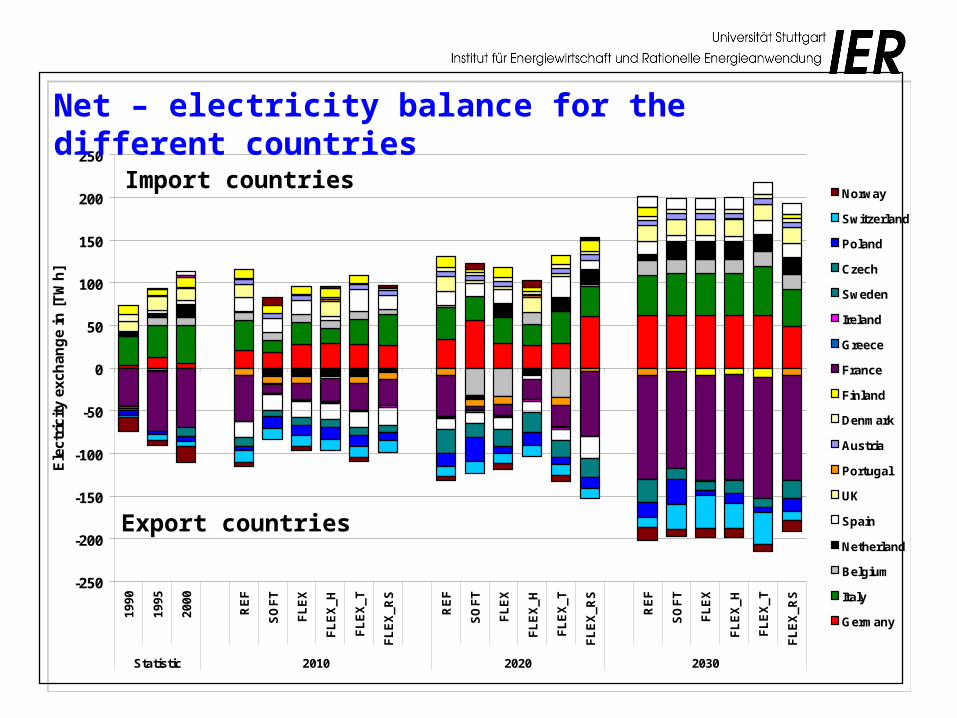
Norway
Switzerland
Poland
Czech
Sweden
Ireland
Greece
France
Finland
Denmark
Austria
Portugal
UK
Spain
Netherland
Belgium
Italy
Germany
Net – electricity balance for the different countries
Import countries
Export countries

-100
-50
0
50
100
150
200S
OF
T
FL
EX
FL
EX
_H
FL
EX
_T
FL
EX
_RS
SO
FT
FL
EX
FL
EX
_H
FL
EX
_T
FL
EX
_RS
SO
FT
FL
EX
FL
EX
_H
FL
EX
_T
FL
EX
_RS
2010 2020 2030
Dif
fere
nc
e n
et
ele
ctr
icit
y g
en
era
tio
n c
ap
ac
ity
to
RE
F i
n
[GW
]
Hard coal Lignite Oil Natural gas Nuclear Geothermal Hydrogen Hydro Wind PV Others
Differences in net electricity generation capacity in Europe-19 relative to REF
14,0
19,0
24,0
29,0
34,0
39,0
1990 1995 2000 2005 2010 2015 2020 2025 2030Year
Ren
ewa
ble
sh
are
in n
et e
lec
tric
ity
ge
ner
atio
n
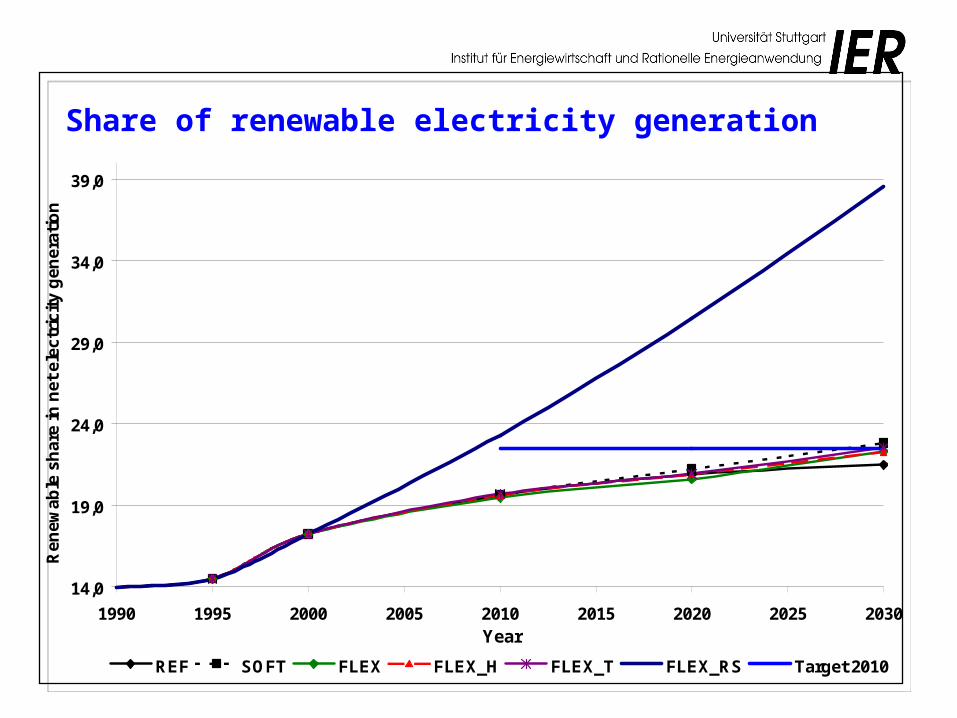
REF SOFT FLEX FLEX_H FLEX_T FLEX_RS Target 2010
Share of renewable electricity generation
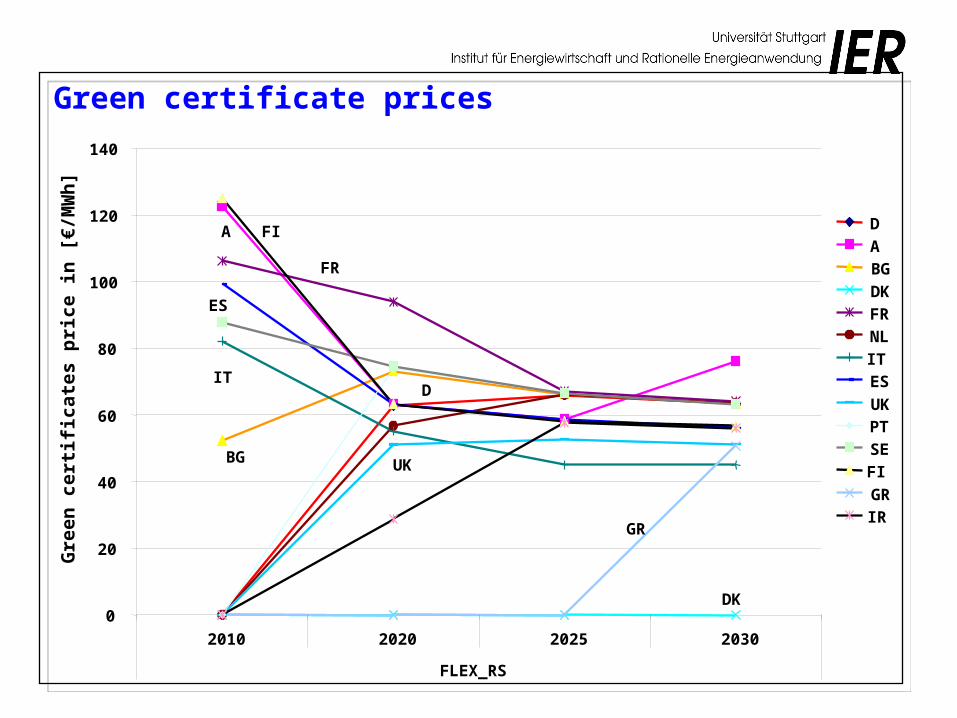
0
20
40
60
80
100
120
140
2010 2020 2025 2030
FLEX_RS
Gre
en c
erti
fica
tes
pri
ce i
n [
€/M
Wh
]
D
A
BG
DK
FR
NL
IT
ES
UK
PT
SE
FI
GR
IRGR
DK
FI
FR
A
D
Green certificate prices
UKBG
IT
ES
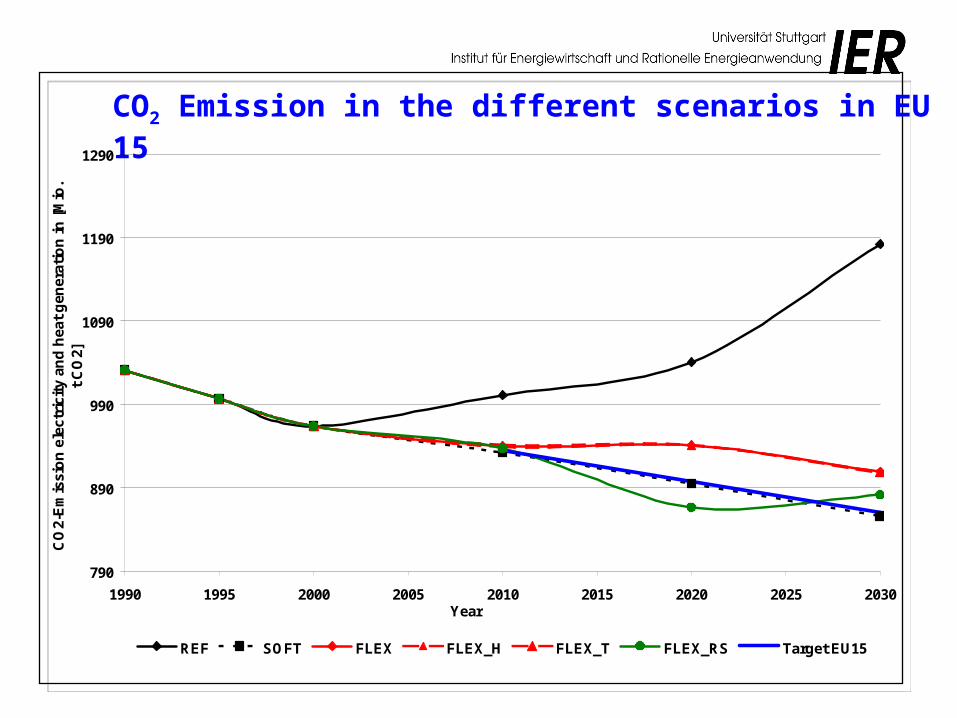
CO2 Emission in the different scenarios in EU 15
790
890
990
1090
1190
1290
1990 1995 2000 2005 2010 2015 2020 2025 2030Year
CO
2-E
mis
sio
n e
lect
rici
ty a
nd
hea
t g
ener
atio
n i
n [
Mio
. t
CO
2]
REF SOFT FLEX FLEX_H FLEX_T FLEX_RS Target EU15

Differences between CO2 Emission „soft landing“ and national target (buyer/seller)
-250
-150
-50
50
150
250
350
RE
F
SO
FT
FL
EX
FL
EX
_H
FL
EX
_T
FL
EX
_R
S
RE
F
SO
FT
FL
EX
FL
EX
_H
FL
EX
_T
FL
EX
_R
S
RE
F
SO
FT
FL
EX
FL
EX
_H
FL
EX
_T
FL
EX
_R
S
2010 2020 2030Dif
fere
nce
bet
wee
n "
So
ftla
nd
ing
tar
get
" an
d C
O2 em
issi
on
en i
n [
Mio
. t
CO
2]
Norway
Switzerland
Poland
Czech
Sweden
Ireland
Greece
France
Finland
Denmark
Austria
Portugal
UK
Spain
Netherland
Belgium
Italy
Germany
0,0
5,0
10,0
15,0
20,0
25,0
30,0
35,0
40,0
2010 2015 2020 2025 2030
Year
Ma
rgin
al a
ba
tem
en
t c
os
t in
[€
/ t C
O2
]
SOFT FLEX FLEX_RS
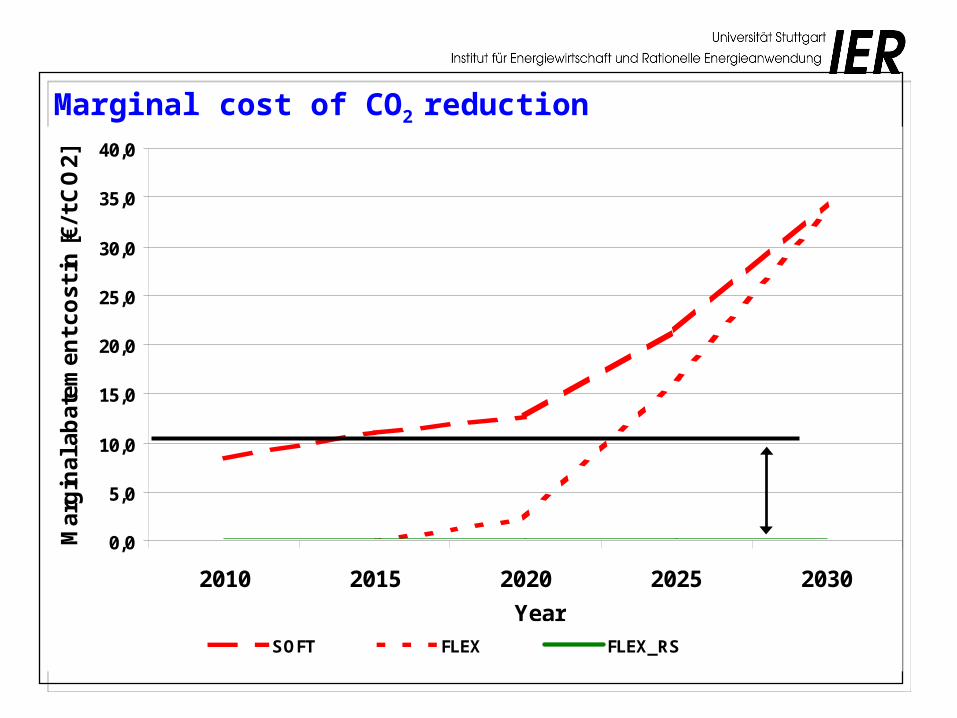
Marginal cost of CO2 reduction

Conclusions• The differences between Kyoto – target and the emissions of the
electricity and heat sector are not so big.
• If all European countries will include in the emission trading the certificate prices fall especially because of the hot air from Poland.
• Under the energy carrier price assumptions, the harmonisation of the European energy tax system influences the electricity capacities which will be installed in the different countries.
• The total amount of electricity exchange will be on the same level if there will be investments in additional net capacities between the countries. But the price for peak-load electricity fall and the national net imports balances will change.
• With the national targets for renewable electricity automatically the Kyoto-target will be achieved.
• With a common electricity market, a free certificate market, a harmonised tax system the European emission reduction and the national renewable targets can be achieved in the most cost-effective manner leading to the lowest electricity prices.


![[XLS]ec.europa.euec.europa.eu/research/participants/data/ref/h2020/... · Web viewEnginar Haluk Escaich Sonia Estrela Da Silva Evans Ceri Fabiani Joël Fahl Falcão Fantinel Fabiana](https://img.pdfslide.us/doc/110x75/5aecdd3b7f8b9a66258f2474/xlsec-viewenginar-haluk-escaich-sonia-estrela-da-silva-evans-ceri-fabiani-jol.jpg)