Embed Size (px)
Citation preview
Theme: Building Information Modelling
European Electrical Installation Monitor – Q1 2018
June 2018
2
Table of contents
1. Research background
2. Activities of installation companies
3. Turnover and order book development
4. Theme: Building Information Modelling
5. Appendix
3
Table of contents
1. Research background
2. Activities of installation companies
3. Turnover and order book development
4. Theme: Building Information Modelling
5. Appendix
1. Research background
4
§ 1.1 Research objectives and phases
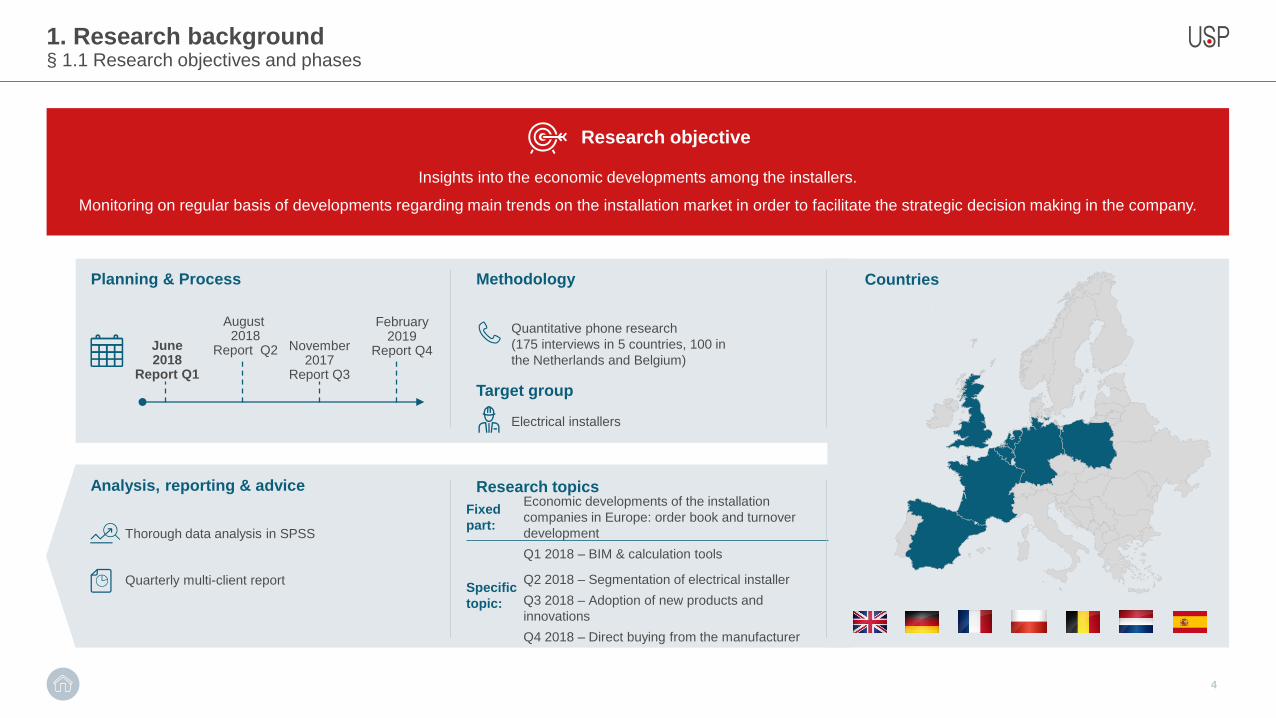
Insights into the economic developments among the installers.
Monitoring on regular basis of developments regarding main trends on the installation market in order to facilitate the strategic decision making in the company.
Research objective
Planning & Process
June 2018
Report Q1
August2018
Report Q2 November 2017
Report Q3
February2019
Report Q4
Methodology
Quantitative phone research
(175 interviews in 5 countries, 100 in
the Netherlands and Belgium)
Target group
Electrical installers
Countries
Research topics
Thorough data analysis in SPSS
Quarterly multi-client report
Analysis, reporting & advice
Fixed
part:
Economic developments of the installation
companies in Europe: order book and turnover
development
Specific
topic:
Q1 2018 – BIM & calculation tools
Q2 2018 – Segmentation of electrical installer
Q3 2018 – Adoption of new products and
innovations
Q4 2018 – Direct buying from the manufacturer
Calculation Tools & Building Information Modelling (BIM)
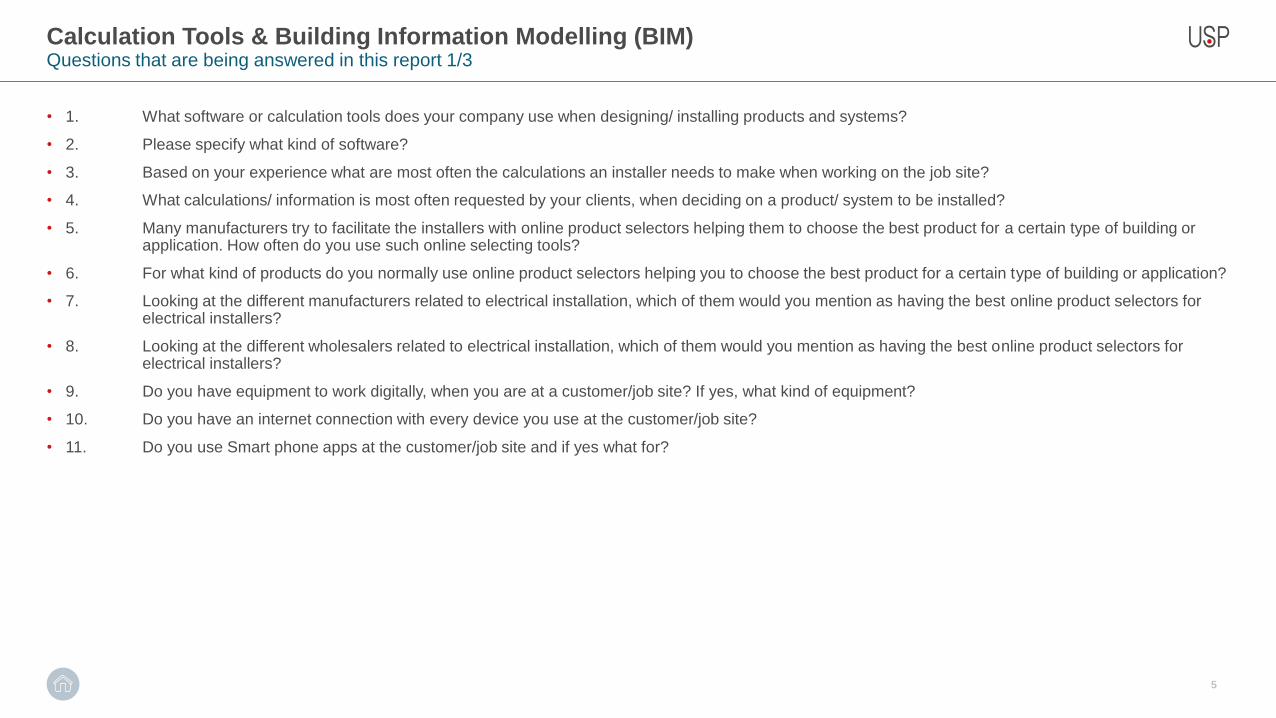
• 1. What software or calculation tools does your company use when designing/ installing products and systems?
• 2. Please specify what kind of software?
• 3. Based on your experience what are most often the calculations an installer needs to make when working on the job site?
• 4. What calculations/ information is most often requested by your clients, when deciding on a product/ system to be installed?
• 5. Many manufacturers try to facilitate the installers with online product selectors helping them to choose the best product for a certain type of building or application. How often do you use such online selecting tools?
• 6. For what kind of products do you normally use online product selectors helping you to choose the best product for a certain type of building or application?
• 7. Looking at the different manufacturers related to electrical installation, which of them would you mention as having the best online product selectors for electrical installers?
• 8. Looking at the different wholesalers related to electrical installation, which of them would you mention as having the best online product selectors for electrical installers?
• 9. Do you have equipment to work digitally, when you are at a customer/job site? If yes, what kind of equipment?
• 10. Do you have an internet connection with every device you use at the customer/job site?
• 11. Do you use Smart phone apps at the customer/job site and if yes what for?
5
Questions that are being answered in this report 1/3
Calculation Tools & Building Information Modelling (BIM)
6
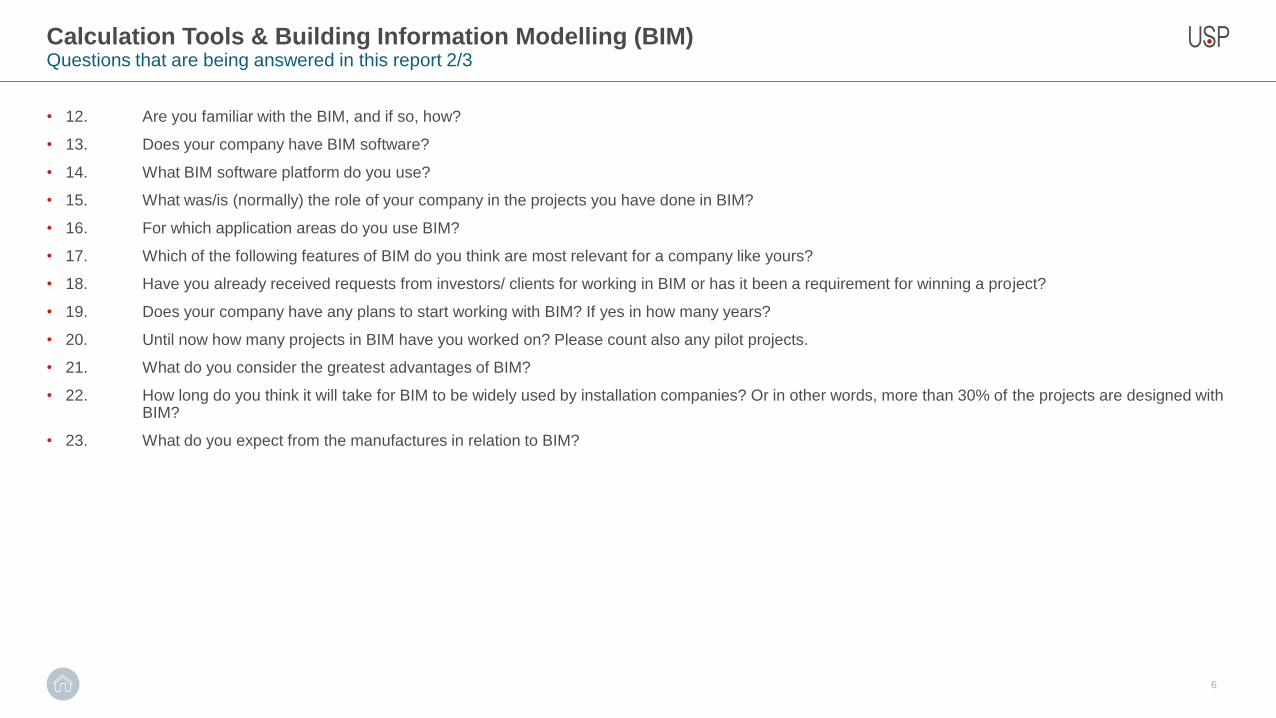
Questions that are being answered in this report 2/3
• 12. Are you familiar with the BIM, and if so, how?
• 13. Does your company have BIM software?
• 14. What BIM software platform do you use?
• 15. What was/is (normally) the role of your company in the projects you have done in BIM?
• 16. For which application areas do you use BIM?
• 17. Which of the following features of BIM do you think are most relevant for a company like yours?
• 18. Have you already received requests from investors/ clients for working in BIM or has it been a requirement for winning a project?
• 19. Does your company have any plans to start working with BIM? If yes in how many years?
• 20. Until now how many projects in BIM have you worked on? Please count also any pilot projects.
• 21. What do you consider the greatest advantages of BIM?
• 22. How long do you think it will take for BIM to be widely used by installation companies? Or in other words, more than 30% of the projects are designed with BIM?
• 23. What do you expect from the manufactures in relation to BIM?
Calculation Tools & Building Information Modelling (BIM)
7
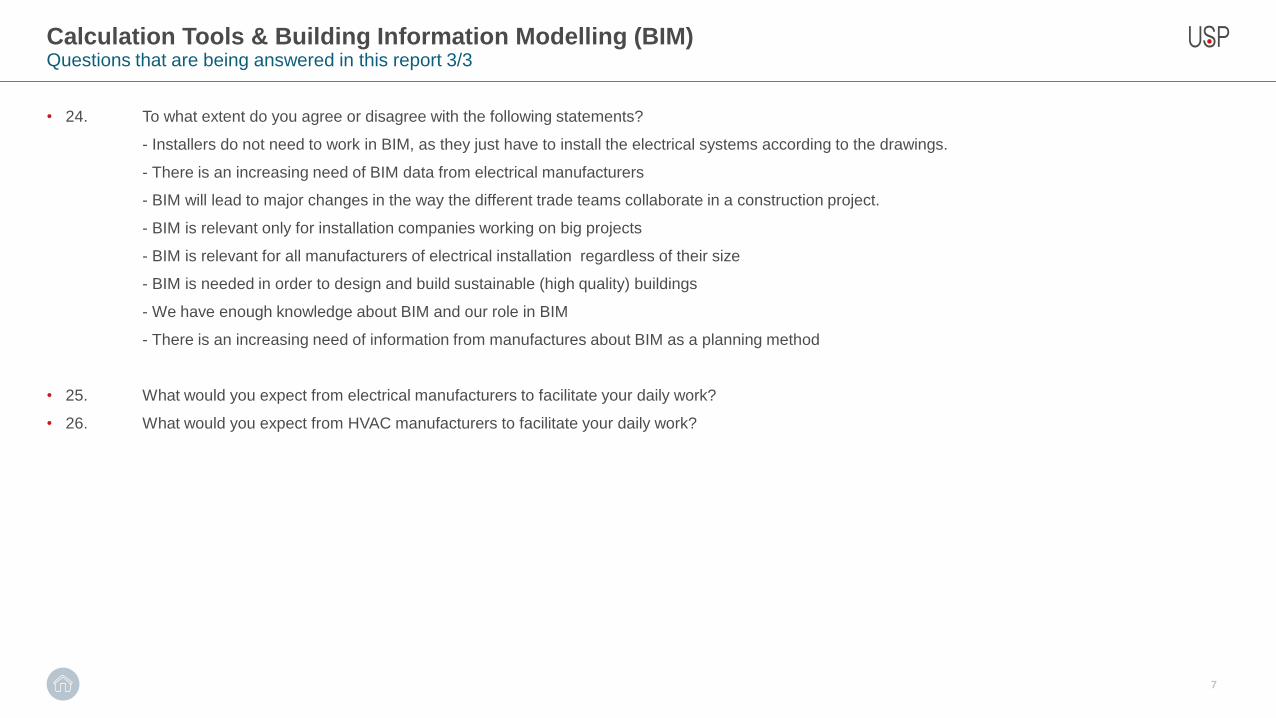
Questions that are being answered in this report 3/3
• 24. To what extent do you agree or disagree with the following statements?
- Installers do not need to work in BIM, as they just have to install the electrical systems according to the drawings.
- There is an increasing need of BIM data from electrical manufacturers
- BIM will lead to major changes in the way the different trade teams collaborate in a construction project.
- BIM is relevant only for installation companies working on big projects
- BIM is relevant for all manufacturers of electrical installation regardless of their size
- BIM is needed in order to design and build sustainable (high quality) buildings
- We have enough knowledge about BIM and our role in BIM
- There is an increasing need of information from manufactures about BIM as a planning method
• 25. What would you expect from electrical manufacturers to facilitate your daily work?
• 26. What would you expect from HVAC manufacturers to facilitate your daily work?
8
Table of contents
3. Turnover and order book development
5. Appendix2. Activities of installation companies
1. Research background
4. Theme: Building Information Modelling
2. Activities of installation companies
9
§ 2.1 Additional services offered by installation companies
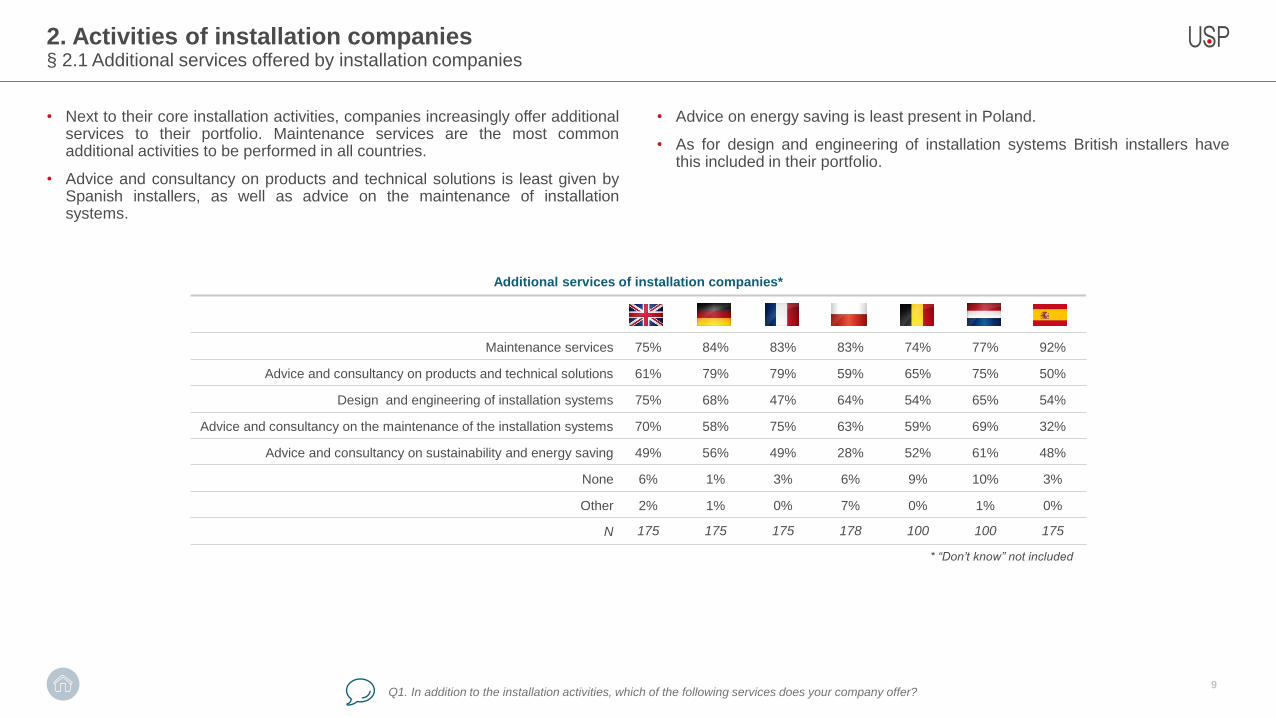
Additional services of installation companies*
UK GE FR PO BE NL SP
Maintenance services 75% 84% 83% 83% 74% 77% 92%
Advice and consultancy on products and technical solutions 61% 79% 79% 59% 65% 75% 50%
Design and engineering of installation systems 75% 68% 47% 64% 54% 65% 54%
Advice and consultancy on the maintenance of the installation systems 70% 58% 75% 63% 59% 69% 32%
Advice and consultancy on sustainability and energy saving 49% 56% 49% 28% 52% 61% 48%
None 6% 1% 3% 6% 9% 10% 3%
Other 2% 1% 0% 7% 0% 1% 0%
N 175 175 175 178 100 100 175
Q1. In addition to the installation activities, which of the following services does your company offer?
* “Don’t know” not included
• Next to their core installation activities, companies increasingly offer additionalservices to their portfolio. Maintenance services are the most commonadditional activities to be performed in all countries.
• Advice and consultancy on products and technical solutions is least given bySpanish installers, as well as advice on the maintenance of installationsystems.
• Advice on energy saving is least present in Poland.
• As for design and engineering of installation systems British installers havethis included in their portfolio.
10
Table of contents
5. Appendix1. Research background
2. Activities of installation companies
3. Turnover and order book development
4. Theme: Building Information Modelling
3. Turnover and order book development
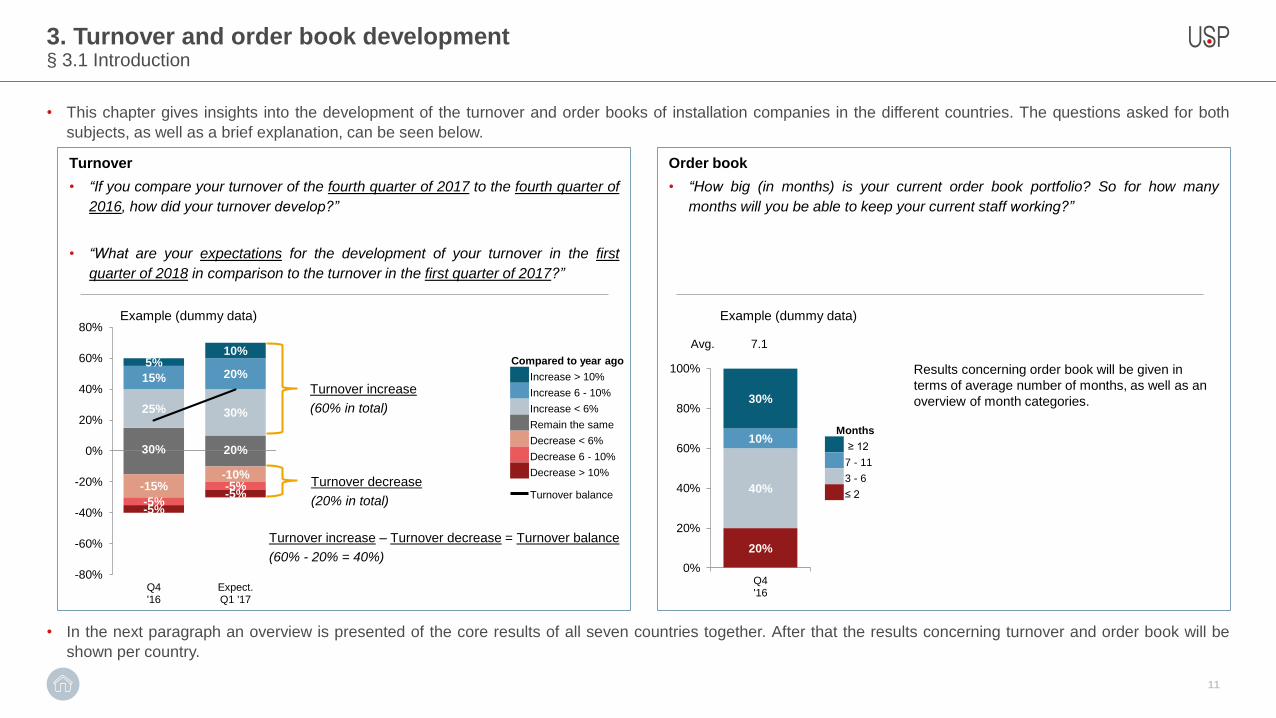
• This chapter gives insights into the development of the turnover and order books of installation companies in the different countries. The questions asked for both
subjects, as well as a brief explanation, can be seen below.
• In the next paragraph an overview is presented of the core results of all seven countries together. After that the results concerning turnover and order book will be
shown per country.
11
§ 3.1 Introduction
Turnover
• “If you compare your turnover of the fourth quarter of 2017 to the fourth quarter of
2016, how did your turnover develop?”
• “What are your expectations for the development of your turnover in the first
quarter of 2018 in comparison to the turnover in the first quarter of 2017?”
Order book
• “How big (in months) is your current order book portfolio? So for how many
months will you be able to keep your current staff working?”
-15%-10%
-5%
-5%
-5%
-5%
30% 20%
25% 30%
15% 20%5%
10%
-80%
-60%
-40%
-20%
0%
20%
40%
60%
80%
Q4'16
Expect.Q1 '17
Compared to year ago
Increase > 10%
Increase 6 - 10%
Increase < 6%
Remain the same
Decrease < 6%
Decrease 6 - 10%
Decrease > 10%
Turnover balance
Turnover increase
(60% in total)
Turnover decrease
(20% in total)
Example (dummy data)
Turnover increase – Turnover decrease = Turnover balance
(60% - 20% = 40%) 20%
40%
10%
30%
0%
20%
40%
60%
80%
100%
Q4'16
Avg. 7.1
Months
≥ 12
7 - 11
3 - 6
≤ 2
Example (dummy data)
Results concerning order book will be given in
terms of average number of months, as well as an
overview of month categories.
3. Turnover and order book development
12
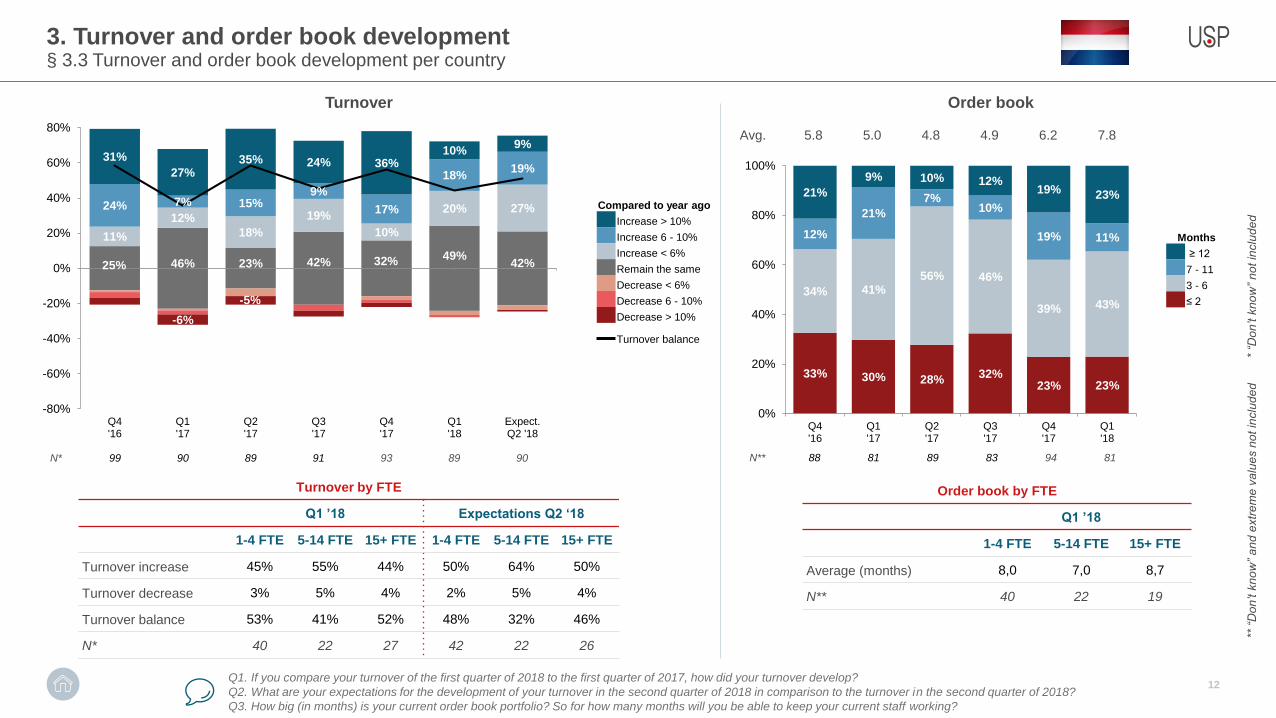
§ 3.3 Turnover and order book development per country
Turnover Order book
* “D
on
’t k
no
w”
no
t in
clu
de
d
** “
Do
n’t k
no
w”
an
d e
xtr
em
e v
alu
es n
ot in
clu
de
d
Avg. 5.8 5.0 4.8 4.9 6.2 7.8
N* 99 90 89 91 93 89 90 N** 88 81 89 83 94 81
Compared to year ago
Increase > 10%
Increase 6 - 10%
Increase < 6%
Remain the same
Decrease < 6%
Decrease 6 - 10%
Decrease > 10%
Turnover balance
Months
≥ 12
7 - 11
3 - 6
≤ 2
Q1. If you compare your turnover of the first quarter of 2018 to the first quarter of 2017, how did your turnover develop?
Q2. What are your expectations for the development of your turnover in the second quarter of 2018 in comparison to the turnover in the second quarter of 2018?
Q3. How big (in months) is your current order book portfolio? So for how many months will you be able to keep your current staff working?
-6%
-5%
25% 46% 23% 42% 32% 49%42%
11%
12%
18%
19%
10%
20% 27%24% 7% 15%9%
17%
18%19%
31%
27%35% 24% 36%
10%9%
-80%
-60%
-40%
-20%
0%
20%
40%
60%
80%
Q4'16
Q1'17
Q2'17
Q3'17
Q4'17
Q1'18
Expect.Q2 '18
33% 30% 28%32%
23% 23%
34% 41%56% 46%
39% 43%
12%
21%
7%10%
19% 11%
21%
9% 10% 12%19% 23%
0%
20%
40%
60%
80%
100%
Q4'16
Q1'17
Q2'17
Q3'17
Q4'17
Q1'18
Turnover by FTE
Q1 ’18 Expectations Q2 ‘18
1-4 FTE 5-14 FTE 15+ FTE 1-4 FTE 5-14 FTE 15+ FTE
Turnover increase 45% 55% 44% 50% 64% 50%
Turnover decrease 3% 5% 4% 2% 5% 4%
Turnover balance 53% 41% 52% 48% 32% 46%
N* 40 22 27 42 22 26
Order book by FTE
Q1 ’18
1-4 FTE 5-14 FTE 15+ FTE
Average (months) 8,0 7,0 8,7
N** 40 22 19
13
Table of contents
5. Appendix1. Research background
2. Activities of installation companies
3. Turnover and order book development
4. Theme: Building Information Modelling
7%
7%
15%
10%
11%
13%
6%
13%
6%
24%
23%
15%
14%
22%
29%
20%
28%
16%
28%
29%
25%
25%
13%
31%
39%
49%
36%
43%
32%
44%
5%
Always Most of the time
Sometimes Rarely
Never Don't know/no opinion
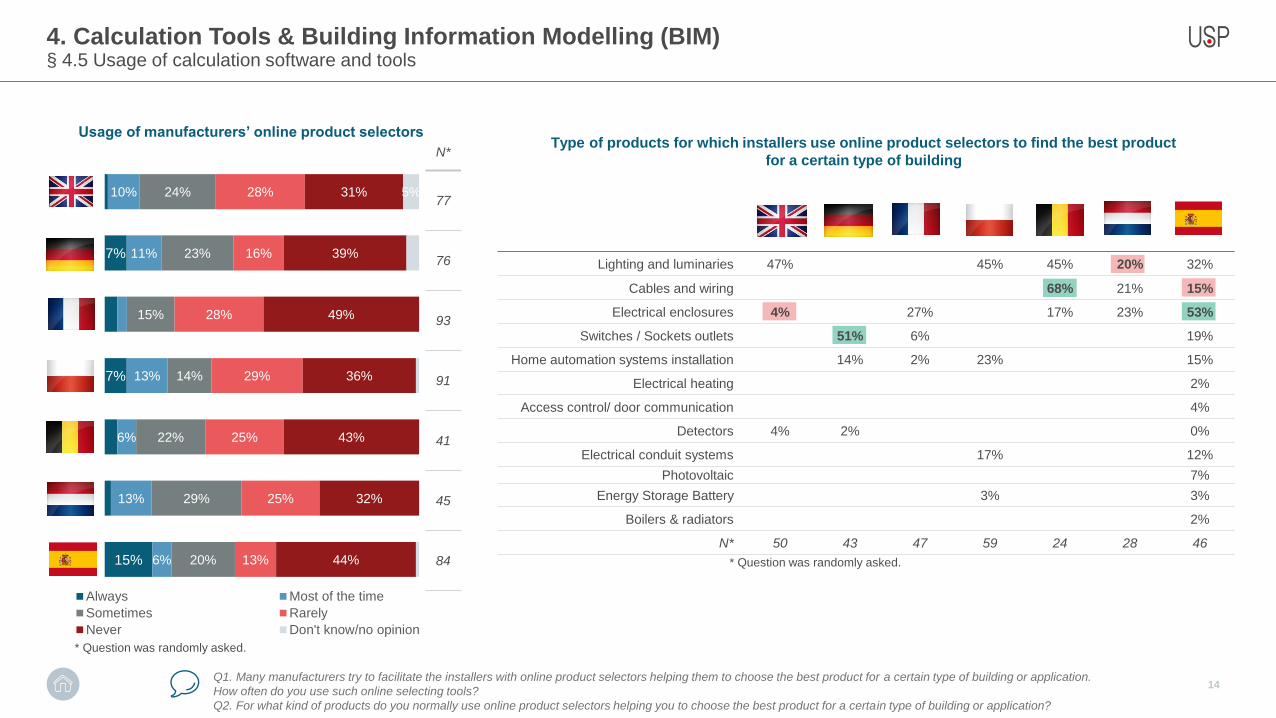
Type of products for which installers use online product selectors to find the best product
for a certain type of building
Usage of manufacturers’ online product selectors
4. Calculation Tools & Building Information Modelling (BIM)
14
§ 4.5 Usage of calculation software and tools
Q1. Many manufacturers try to facilitate the installers with online product selectors helping them to choose the best product for a certain type of building or application.
How often do you use such online selecting tools?
Q2. For what kind of products do you normally use online product selectors helping you to choose the best product for a certain type of building or application?
N*
77
76
93
91
41
45
84
Lighting and luminaries 47% 45% 45% 20% 32%
Cables and wiring 68% 21% 15%
Electrical enclosures 4% 27% 17% 23% 53%
Switches / Sockets outlets 51% 6% 19%
Home automation systems installation 14% 2% 23% 15%
Electrical heating 2%
Access control/ door communication 4%
Detectors 4% 2% 0%
Electrical conduit systems 17% 12%
Photovoltaic 7%
Energy Storage Battery 3% 3%
Boilers & radiators 2%
N* 50 43 47 59 24 28 46
* Question was randomly asked.
* Question was randomly asked.
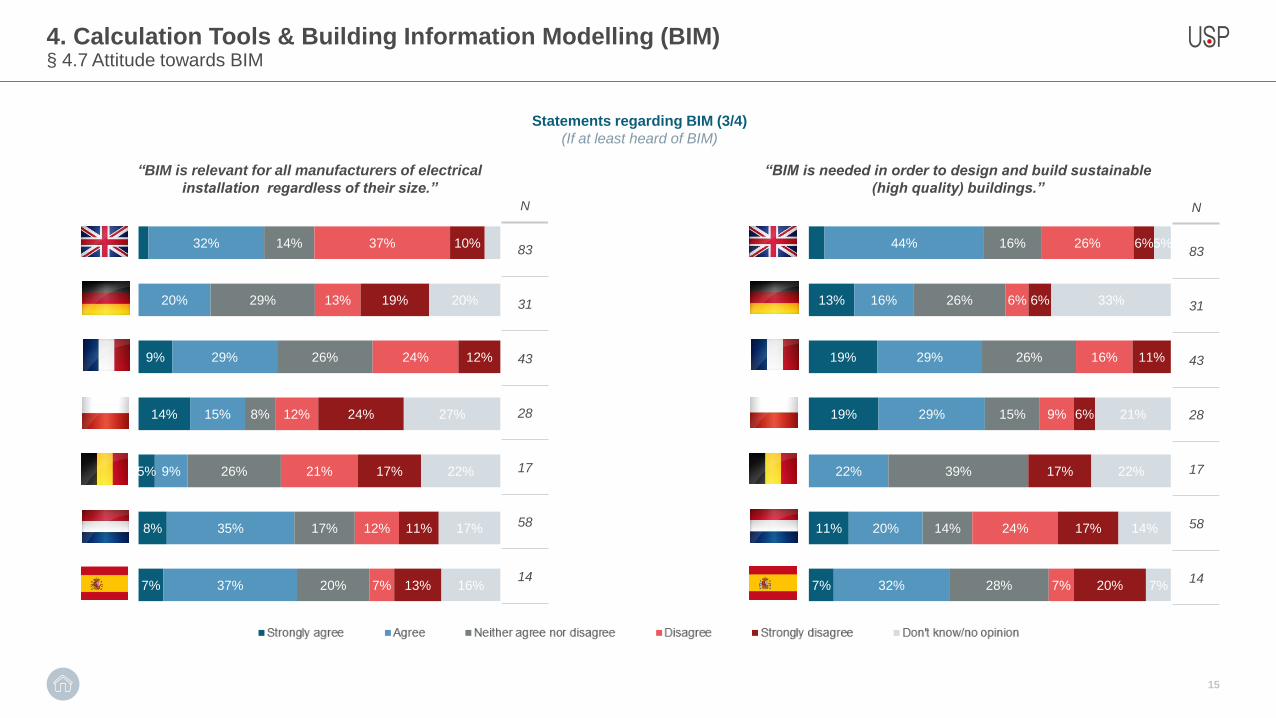
Statements regarding BIM (3/4)
(If at least heard of BIM)
4. Calculation Tools & Building Information Modelling (BIM)
15
§ 4.7 Attitude towards BIM
“BIM is relevant for all manufacturers of electrical
installation regardless of their size.”
“BIM is needed in order to design and build sustainable
(high quality) buildings.”
N
83
31
43
28
17
58
14
N
83
31
43
28
17
58
14
9%
14%
5%
8%
7%
32%
20%
29%
15%
9%
35%
37%
14%
29%
26%
8%
26%
17%
20%
37%
13%
24%
12%
21%
12%
7%
10%
19%
12%
24%
17%
11%
13%
20%
27%
22%
17%
16%
13%
19%
19%
11%
7%
44%
16%
29%
29%
22%
20%
32%
16%
26%
26%
15%
39%
14%
28%
26%
6%
16%
9%
24%
7%
6%
6%
11%
6%
17%
17%
20%
5%
33%
21%
22%
14%
7%
16
Table of contents
1. Research background
2. Activities of installation companies
3. Turnover and order book development
5. Appendix4. Theme: Building Information Modelling
17
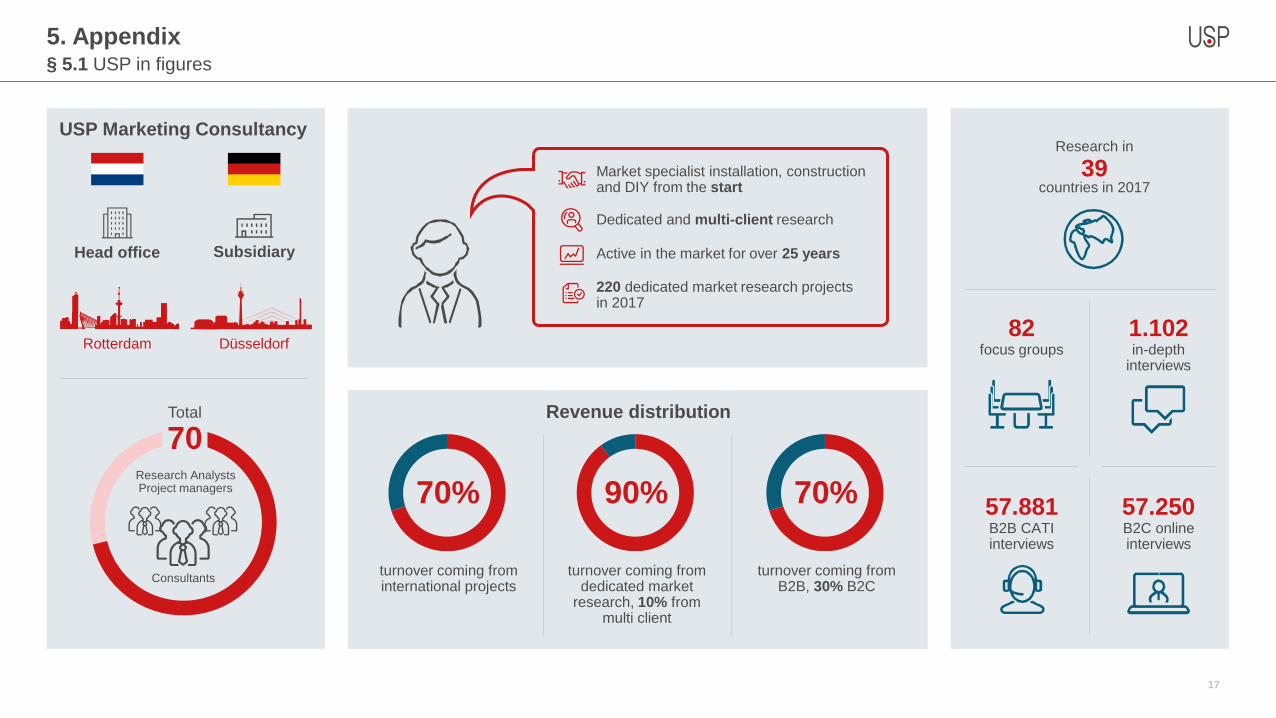
5. Appendix
USP Marketing Consultancy
Total
70
Head office Subsidiary
Rotterdam Düsseldorf
Consultants
Research AnalystsProject managers
Market specialist installation, construction and DIY from the start
Dedicated and multi-client research
Active in the market for over 25 years
220 dedicated market research projectsin 2017
Revenue distribution
turnover coming from international projects
70%
turnover coming from dedicated market
research, 10% from multi client
90%
turnover coming from B2B, 30% B2C
70%
focus groups in-depth interviews
82 1.102
B2B CATI interviews
B2C online interviews
57.881 57.250
Research in
39countries in 2017
§ 5.1 USP in figures
18
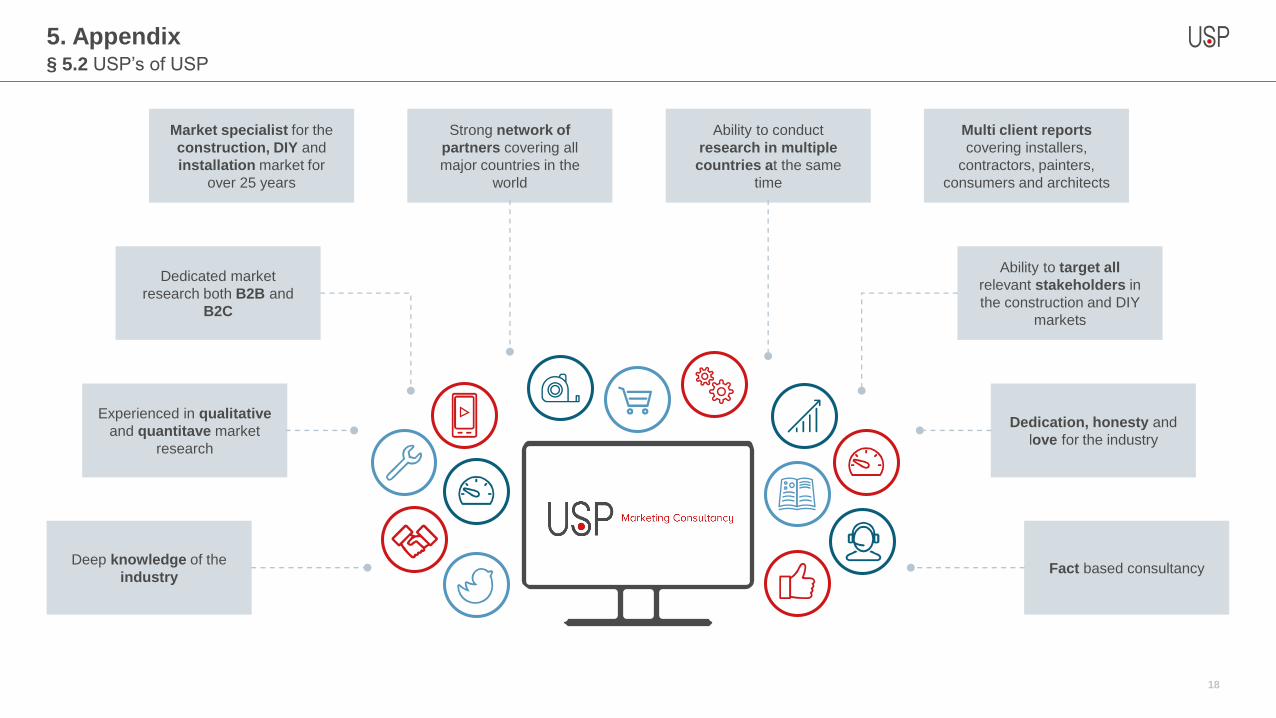
5. Appendix § 5.2 USP’s of USP
Deep knowledge of the
industry
Experienced in qualitative
and quantitave market
research
Dedicated market
research both B2B and
B2C
Market specialist for the
construction, DIY and
installation market for
over 25 years
Strong network of
partners covering all
major countries in the
world
Ability to conduct
research in multiple
countries at the same
time
Multi client reports
covering installers,
contractors, painters,
consumers and architects
Fact based consultancy
Dedication, honesty and
love for the industry
Ability to target all
relevant stakeholders in
the construction and DIY
markets
19
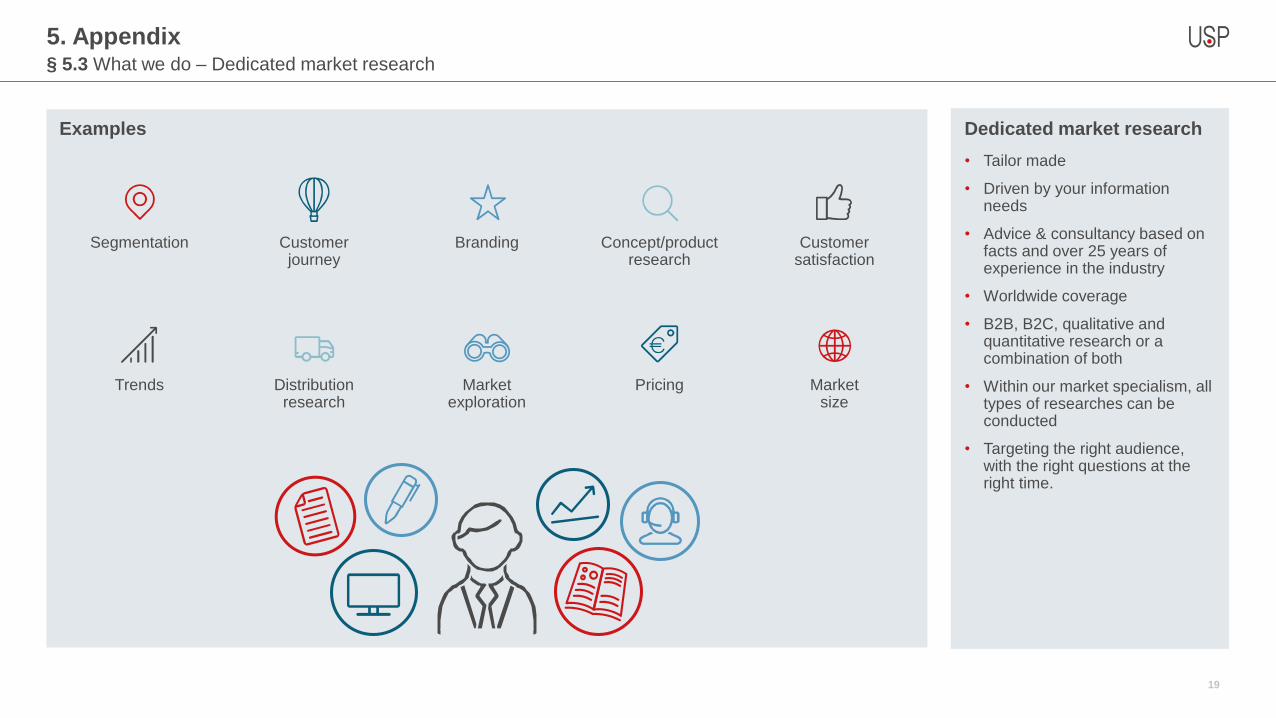
5. Appendix § 5.3 What we do – Dedicated market research
Examples Dedicated market research
• Tailor made
• Driven by your information needs
• Advice & consultancy based on facts and over 25 years of experience in the industry
• Worldwide coverage
• B2B, B2C, qualitative and quantitative research or a combination of both
• Within our market specialism, all types of researches can be conducted
• Targeting the right audience, with the right questions at the right time.
Segmentation Customerjourney
Branding Concept/product research
Customersatisfaction
Trends Distributionresearch
Marketexploration
Pricing Marketsize
20
5. Appendix § 5.4 What we do – Multi client research
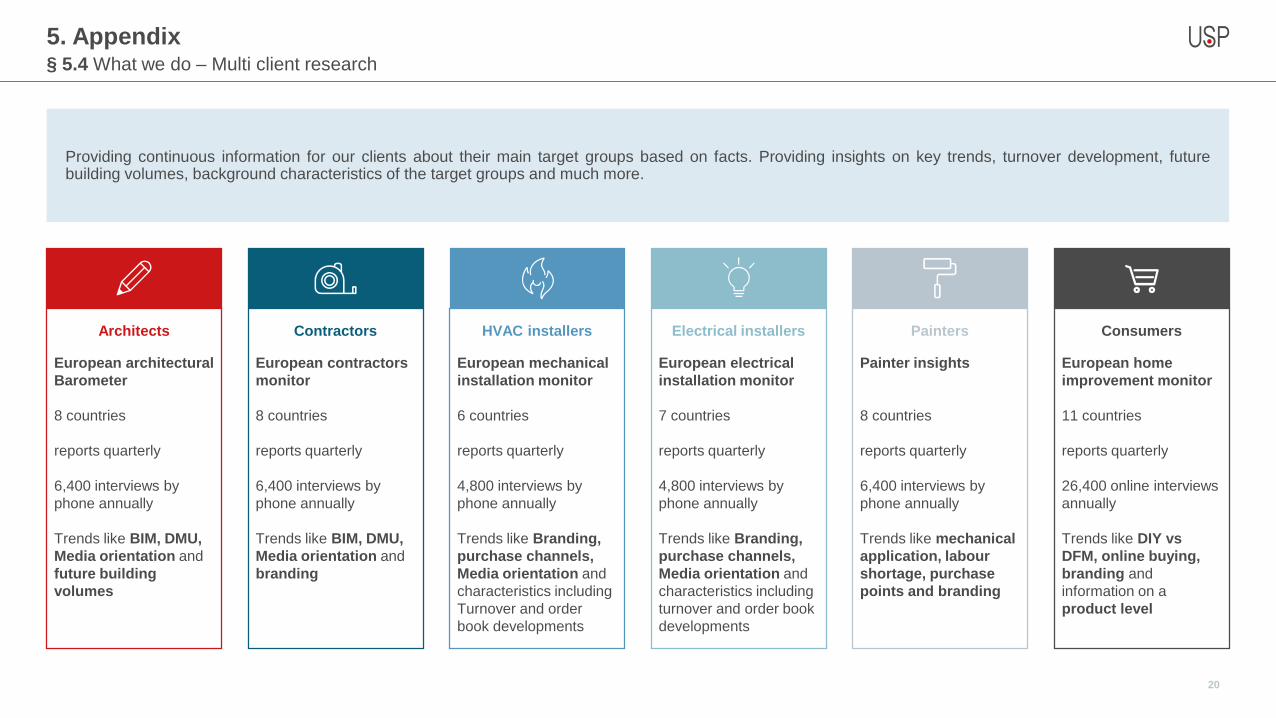
Providing continuous information for our clients about their main target groups based on facts. Providing insights on key trends, turnover development, futurebuilding volumes, background characteristics of the target groups and much more.
European architectural
Barometer
8 countries
reports quarterly
6,400 interviews by
phone annually
Trends like BIM, DMU,
Media orientation and
future building
volumes
Architects
European contractors
monitor
8 countries
reports quarterly
6,400 interviews by
phone annually
Trends like BIM, DMU,
Media orientation and
branding
Contractors
European mechanical
installation monitor
6 countries
reports quarterly
4,800 interviews by
phone annually
Trends like Branding,
purchase channels,
Media orientation and
characteristics including
Turnover and order
book developments
HVAC installers
European electrical
installation monitor
7 countries
reports quarterly
4,800 interviews by
phone annually
Trends like Branding,
purchase channels,
Media orientation and
characteristics including
turnover and order book
developments
Electrical installers
Painter insights
8 countries
reports quarterly
6,400 interviews by
phone annually
Trends like mechanical
application, labour
shortage, purchase
points and branding
Painters
European home
improvement monitor
11 countries
reports quarterly
26,400 online interviews
annually
Trends like DIY vs
DFM, online buying,
branding and
information on a
product level
Consumers
21
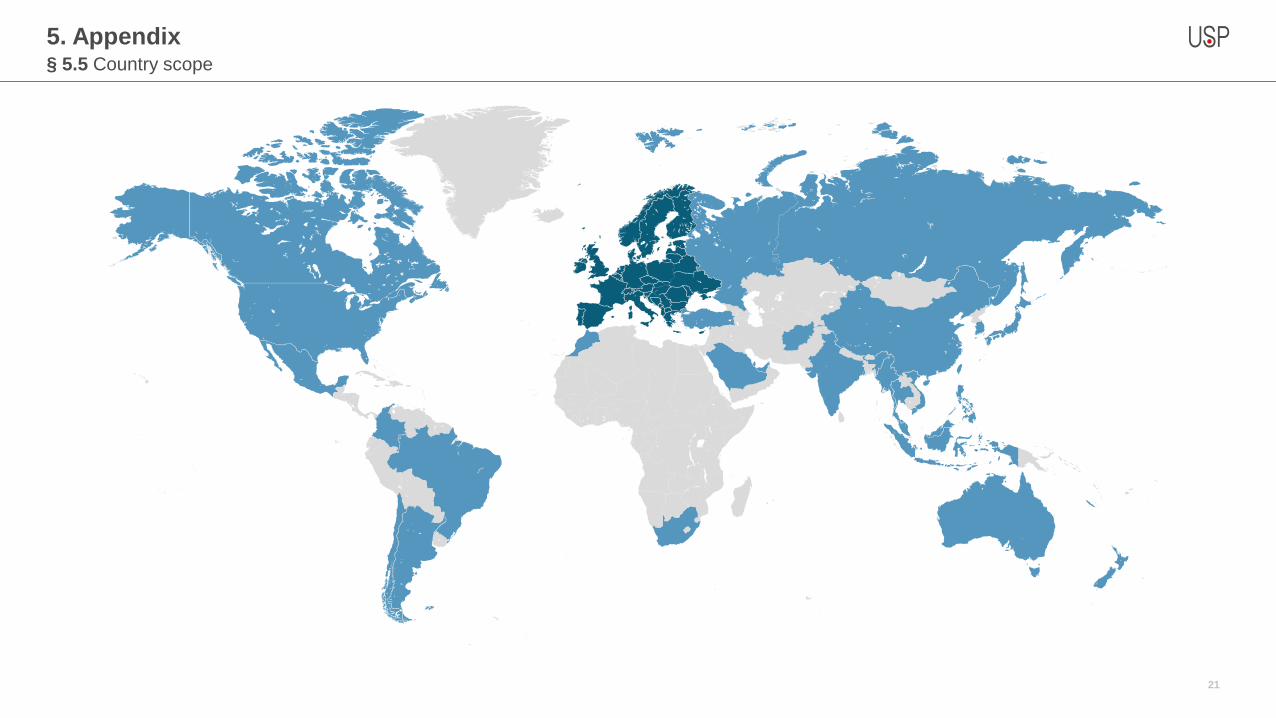
5. Appendix § 5.5 Country scope
22
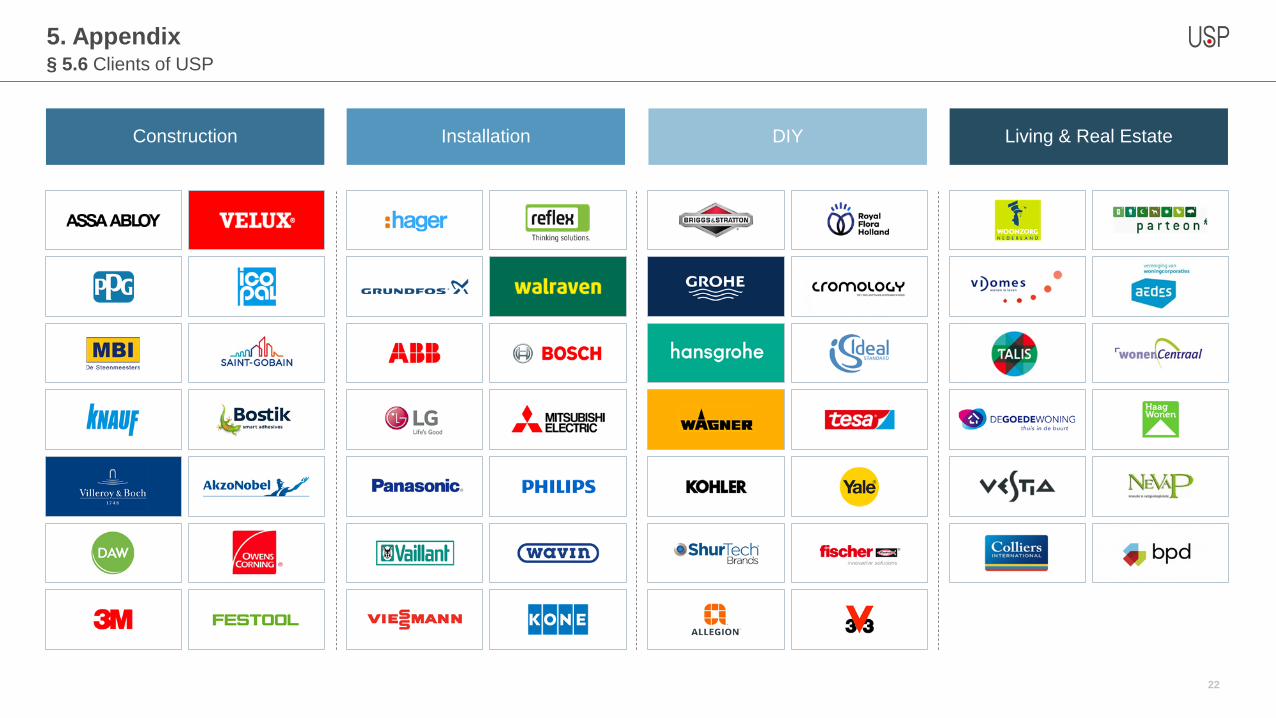
5. Appendix
Construction Installation DIY Living & Real Estate
§ 5.6 Clients of USP
23
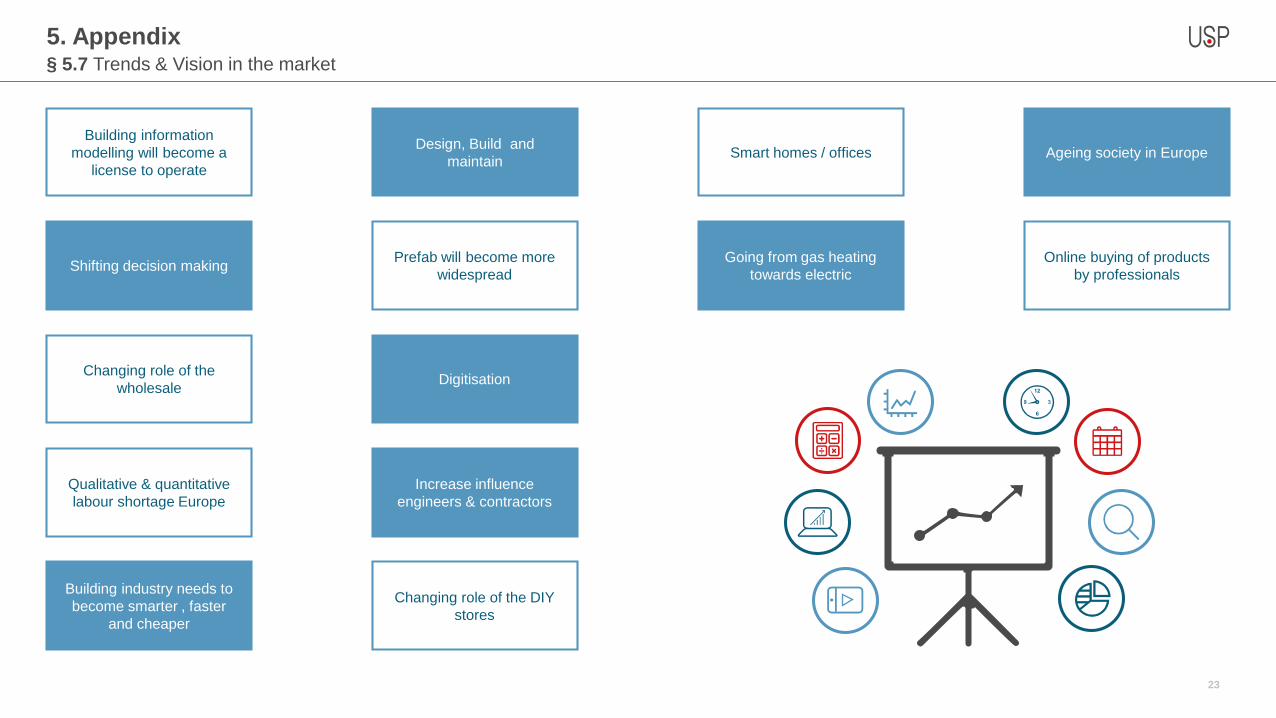
5. Appendix § 5.7 Trends & Vision in the market
Shifting decision making
Building information
modelling will become a
license to operate
Design, Build and
maintainSmart homes / offices Ageing society in Europe
Going from gas heating
towards electric
Prefab will become more
widespread
Online buying of products
by professionals
Changing role of the
wholesale
Qualitative & quantitative
labour shortage Europe
Building industry needs to
become smarter , faster
and cheaper
Digitisation
Increase influence
engineers & contractors
Changing role of the DIY
stores
Max Euwelaan 51
3062 MA Rotterdam
+31-10-2066900
Call center +31-10-8002700
© , USP Marketing Consultancy B.V.
The information in this publication is strictly confidential and all relevant
copyrights, database rights and other (intellectual) property rights are
explicitly reserved. No part of this publication may be reproduced and/or
published without the prior written permission of USP Marketing
Consultancy B.V.
Feel free to contact us for more information
24
18 juli 2018
Mark de Graaf
Consultant
+31 641 765 837
Christian Schrauwen
Research Manager
+31 10 206 69 00

© 18 July 2018, USP Marketing Consultancy B.V.
De in deze uitgave vermelde gegevens zijn strikt vertrouwelijk en alle hierop betrekking hebbende auteursrechten,
databankrechten en overige (intellectuele) eigendomsrechten worden uitdrukkelijk voorbehouden.
Niets uit deze uitgave mag zonder voorafgaande schriftelijke toestemming van USP Marketing Consultancy B.V.
verveelvoudigd en/of openbaar gemaakt worden.