Embed Size (px)
Citation preview
Europe: The Excluded Sufferwhile Europe StagnatesReview of the Social Situation in Europe and Considerations for a More Sustainable and Inclusive Future
E U R O P E A N R E S E A R C H S E R I E S
E U R O P E A N R E S E A R C H S E R I E S
Europe: The ExcludedSuffer while EuropeStagnates
Review of the Social Situation inEurope and Considerations for aMore Sustainable and InclusiveFuture
Social Justice Ireland2017
First Published January 2017
Published bySocial Justice IrelandArena HouseArena RoadSandyfordDublin D18 V8P6Ireland
www.socialjustice.ie
Tel: 01- 2130724
e-mail: [email protected]

4
PREFACE
‘Europe: The Excluded Suffer while Europe Stagnates’ is the tenth publication in Social JusticeIreland’s European Research Series. The purpose of our European Research Series is tocontribute to the debate and discussion on policy issues that affect all members of theEuropean Union. To date this research series has produced comprehensive reviews ofIreland’s performance towards its Europe 2020 targets, a comprehensive examination of theimpact of policies pursued by the European Union and its members states after the financialcrisis of 2008 and an extensive analysis of how European member states have beenperforming in terms of social and economic targets after the crisis. This research focussedon those countries most affected by the crisis.
Social Justice Ireland’s European Research Series provides a comprehensive and detailedanalysis of key issues, and it also makes a series of policy proposals at local, NGO, nationaland EU level. These proposals are aimed at ensuring a more sustainable and inclusive futurefor European citizens.
‘Europe: The Excluded Suffer while Europe Stagnates’ reviews the social situation in the 28EU member states and makes some proposals and recommendations for a more sustainableand inclusive future. The report analyses performance in areas such as poverty andinequality, employment, access to key public services and taxation. These areas areexamined in light of the key social policy responses of the European Union to the crisisincluding the social investment package.
The report also points to some policy proposals and alternatives for discussion. Theseinclude the right to sufficient income, meaningful work and access to key quality services.These policy proposals explore how these areas might be delivered upon in a changingworld.
We hope that this report can make a timely and significant contribution to the launch ofthe consultation on a European Pillar of Social Rights. The aim of the European Pillar ofSocial Rights is to take account of the changing realities of Europe’s societies and the worldof work. Failure to deliver a balanced policy approach between economic and social policyacross the European Union for several decades has contributed to the crisis that Europe findsitself in today.
Focusing on this century alone we see that the original Lisbon Strategy also known as theLisbon Agenda or Lisbon Process, was deemed to be such a failure that it had to be revisedhalf way through its ten-year lifespan. The revised version eliminated the social aspects ofpolicy that had been a feature of the original iteration of the Lisbon Strategy. This seemedto suggest that it was the social aspects of policy that were holding back the economicpriorities of job creation. This analysis in turn proved to be false as the Lisbon Strategy in itssecond iteration also was deemed to be a failure.
In 2010 the Lisbon Strategy was replaced by the Europe 2020 strategy. In practice this, too,has had little positive impact on social aspects of policy that it is meant to address. Of
Preface
particular significance is its total failure to reduce poverty or to even make any progresstowards reaching the target set. The European Union is strong on rhetoric but weak ondelivery where the social aspects of policy are concerned. Failure to deliver on social aspectsof policy, in particular on reducing poverty and long-term unemployment and improvingaccess to quality services, will have major implications for the future of the EU as it willstrengthen the growing conclusion that it is not a democratic project but is, rather, focusedon delivering outcomes that favour the economically powerful.
Our research has consistently shown that a more integrated social dimension across theEuropean Union is required to ensure the European Social Model can meet the challengesof new realities and that the damage to social cohesion across the Union caused by the crisiscan begin to be repaired. This publication points to the need to examine alternatives and todevelop a social welfare and support system that can adapt to changing realities andwithstand future shocks. Minimum income schemes, the Living Wage, Basic Incomeschemes, the changing nature of work, adequate investment, access to quality services,representation and sustainability are policy areas which are discussed and examined in thisresearch. We present this research as part of our ongoing contribution to the Europeanpolicy process.
Social Justice Ireland would like to thank Ann Leahy in particular for her work in preparingand producing the research for this publication. She brought a great deal of experience,research, knowledge and wisdom to this work and contributed long hours and her obvioustalent to ensuring that this publication is a worthwhile contribution to the ongoingdiscussion on how to secure a more sustainable and inclusive future for all in the EuropeanUnion.
5
TABLE OF CONTENTS
1. Introduction and Context 91.1 Background 91.2 The Crisis and its Aftermath 111.3 EU – Some Key Social Policy Responses 131.4 This Report 15
2. Poverty, Social Exclusion and Income Inequality 182.1 Poverty and Social Exclusion and other Measures - Adults 182.2 Poverty and Social Exclusion and other Indicators – Specific Groups 272.3 Income Inequality 352.4 Disposable Income and Financial Distress 372.5 Summary and Conclusion 41
3. Employment and Unemployment 443.1 Employment 443.2 Unemployment 473.3 Youth Unemployment 493.4 Summary and Conclusions 52
4. Key Services 544.1 Education 544.2 Education - Conclusion 624.3 Health Services 624.4 Health - Conclusion 67
5. Taxation 685.1 Total Taxation as a percentage of GDP 685.2 Total Taxation in light of Some Social Inclusion Indicators 705.3 Taxation - Conclusion 74
6. Alternatives: Some Issues for Discussion 756.1 Introduction 756.2 Right to Sufficient Income 766.3 Right to Meaningful Work 806.4 Right to Access to Quality Services 846.5 Other Key Issues 86
7. Summary, Conclusions and Recommendations 887.1 Summary of Findings 887.2 Conclusions and Recommendations 93
7.2.1 Recommendations 94
References 98
Glossary 107
Statistical Issues 109

Table 1 Social Investment: EU Countries And Main Policy-Making Trends 16
Table 2 Social Justice Ireland - Seven Core Rights 16
Table 3 People experiencing Poverty, EU-28, 2008, 2013 and 2014 20
Table 4 Average Literacy/Numeracy Proficiency among Adults, Ages 16-65 60
Table 5 EU-28: Total Taxation as % GDP (2014) 71
Table 6 EU-28 Total Taxation as % of GDP and Social Investment Approaches 73
Table 7 EU-28 Key Poverty Indicators 2014 90
Figure 1 People at Risk of Poverty or Social Exclusion (%), EU-28, 2008, 212013 and 2014
Figure 2 At Risk of Poverty or Social Exclusion, EU-28, PP Change in Rate, 222013 to 2014
Figure 3 People at Risk of Poverty (%), EU-28, 2008, 2013 and 2014 23
Figure 4 Risk of Poverty, EU-28, PP Change in Rate 2013 to 2014 24
Figure 5 Severely Materially Deprived Persons, Rate (%), EU-28, 2008, 2013 25and 2014
Figure 6 Severe Material Deprivation, PP Change in Rate, 2013 to 2014 26
Figure 7 Children: Poverty or Social Exclusion Rate (%), EU28, 2008, 2013 27and 2014
Figure 8 Children: Risk of Poverty or Social Exclusion, PP Change in Rate 282013 to 2014
Figure 9 Children: Risk of Poverty Rate (%), 2008, 2013 and 2014 29
Figure 10 Children: Risk of Poverty, PP Change in Rate, 2013 to 2014 29
Figure 11 Children: Severe Material Deprivation Rate (%) 2008, 2013 and 2014 30
Figure 12 Children: Severe Material Deprivation, PP Change in Rate 2013 to 2014 31
Figure 13 Older People: Poverty or Social Exclusion Rate (%), EU-28, 2008, 322013 and 2014
Figure 14 Older People: Severe Material Deprivation Rate (%), 2008, 2013 and 2014 34
Figure 15 Older People: Severe Material Deprivation, PP Change in rate, 342013 to 2014
Figure 16 In-Work Risk of Poverty Rate, EU-28, 2008, 2013 and 2014 35
Figure 17 Income Inequality EU-28, S80/S20, 2008, 2013 and 2014 38
Figure 18 Median Disposable Annual Income (€): EU28, 2008, 2013 and 2014 39
Figure 19 Change in Median Disposable Income (€), EU, 2013 to 2014 39
Figure 20 Household Financial Distress (%) in lowest income quartile, 2007 41average, 2015 Q1 and 2016 Q1, EU-28.
Figure 21 Employment in Europe (%), Ages 20-64, EU-28, 2008-2015 44
Figure 22 Employment (%), ages 20-64, EU-28 Countries, 2008, 2014 and 2015 45
Figure 23 Unemployment (% active population), EU-28, 2008, 2014 and 2015 47
Figure 24 Youth Unemployment (% of active population), EU-28, 2008, 2014 50and 2015
Figure 25 Youth Unemployment, EU-28, PP Change 2014-2015 51
Figure 26 Early School-Leaving (%), EU-28, 2008, 2014 and 2015 55
Figure 27 Tertiary Education Attainment (%), EU28, (ages 30-34) 2008, 2014 56and 2015
Figure 28 Lifelong Learning, (%) EU-28, 2008, 2014 and 2015 58
Figure 29 Self-reported unmet need for Medical Examination or Treatment Due to 64Problem of Access (%), EU-28, 2007-2014, By income Quintile
Figure 30 Self-Reported Unmet Need for Medical Examination or Treatment 65Due to Problem of Access, EU-28. PP change, 2009-2014
Figure 31 Health Score based on Social Justice Index, 2008, 2014 and 2015 66(From Bertelsmann Stiftung)
Figure 32 EU-28 Total Taxes (incl ssc) as a % of GDP, 2013 and 2014 69
Figure 33 EU-15 Total Taxes (incl SSC) as a % of GDP, 2008 and 2014 70

9
1.
I N TRODUCT ION ANDCONTEXT
The financial crisis from 2008 led to the sharpest contraction of European economies sincethe Great Depression. In 2009, for example, the economic output in the countries of theEuropean Union shrank by 4.5 percent, the largest reduction in GDP since its creation(Sundaram et al 2014). The crisis led to a rapidly dis-improved social situation across Europein which millions of people lost their job. This, and a range of austerity measures, led toincreases in poverty and social exclusion, growing inequalities and divergences betweencountries. In more recent years there has been some recovery but in the aftermath of thecrisis Europe is facing serious economic, social and political problems. It has been said that:
What originally has been a financial crisis has transformed into a social crisis. But Europe’sresponse to this challenge has been weak (Nicolas Schmit, Minister of Labour, Employmentand the Social and Solidarity Economy of Luxembourg, 2016:11).
The social situation in Europe is the issue with which this report is concerned. In this sectionwe outline briefly the background to the economic crisis, its aftermath and the Europeanresponse to it.
1.1 BackgroundThe background to the global economic crisis is associated with bad regulation and badfinancial practices in the United States, which in turn affected the entire world. Thesepractices can be linked to attempts to maintain and to boost demand in an economy inwhich poorer people were encouraged to keep borrowing and spending and which led to amassive debt finance bubble (Stiglitz 2009). The financial crisis has raised deep questionsabout the role of the financial sector and its impact on growth and income distribution(Cournede at al, 2015). The economic ideas, models and policies used prior to 2008 areacknowledged by many now to have been wrong or seriously flawed (see, for example, theOECD’s New Approaches to Economic Challenges, OECD, 2015c; and Skidelsky 2016).Amartya Sen and other distinguished figures pointed out that what began as a clear failureof the market economy (particularly associated with financial institutions) was sooninterpreted as a problem of the overstretched role of the state leading to a prioritisation ofausterity policies (2015). Thus austerity became seen as the dominant priority of thefinancial leaders of Europe (Sen 2015). As the crisis spread a series of measures were adoptedincluding
• Consolidation and Adjustment- reducing deficits throughout the EU through fiscalconsolidation along with lending to distressed countries with requirements toundertake structural adjustment programmes and austerity policies;
E U R O P E A N R E S E A R C H S E R I E S
Introduction and Context
10
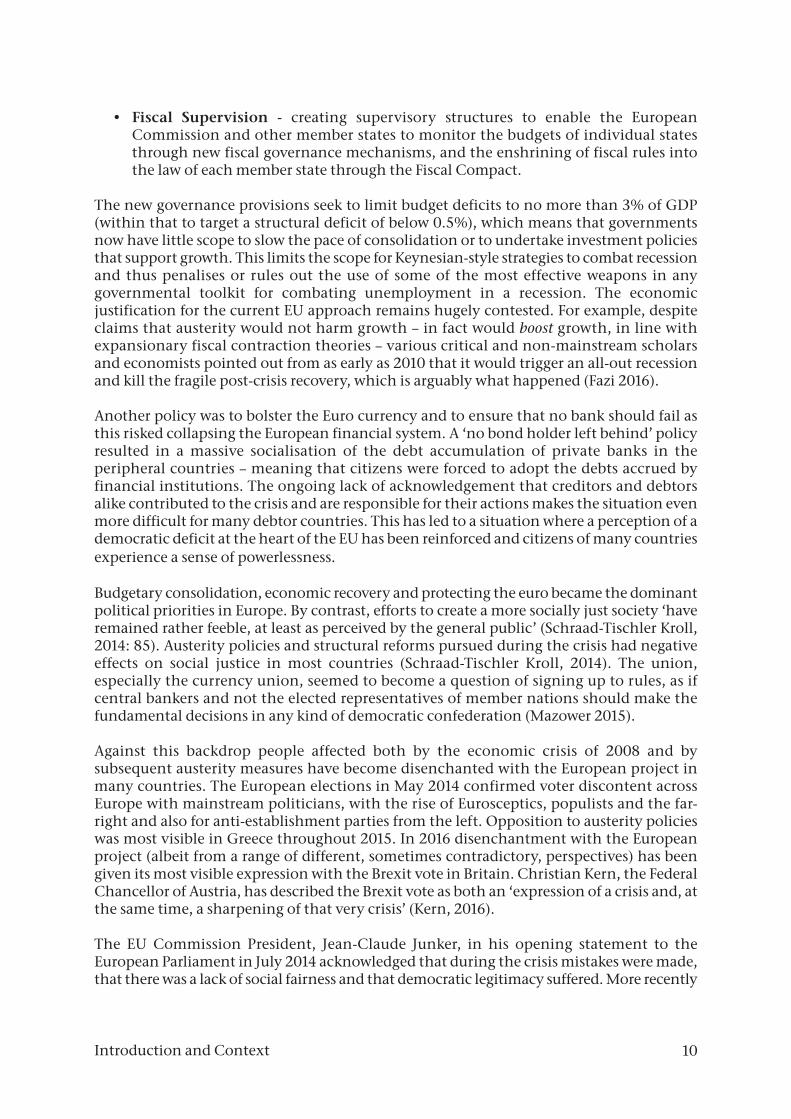
• Fiscal Supervision - creating supervisory structures to enable the EuropeanCommission and other member states to monitor the budgets of individual statesthrough new fiscal governance mechanisms, and the enshrining of fiscal rules intothe law of each member state through the Fiscal Compact.
The new governance provisions seek to limit budget deficits to no more than 3% of GDP(within that to target a structural deficit of below 0.5%), which means that governmentsnow have little scope to slow the pace of consolidation or to undertake investment policiesthat support growth. This limits the scope for Keynesian-style strategies to combat recessionand thus penalises or rules out the use of some of the most effective weapons in anygovernmental toolkit for combating unemployment in a recession. The economicjustification for the current EU approach remains hugely contested. For example, despiteclaims that austerity would not harm growth – in fact would boost growth, in line withexpansionary fiscal contraction theories – various critical and non-mainstream scholarsand economists pointed out from as early as 2010 that it would trigger an all-out recessionand kill the fragile post-crisis recovery, which is arguably what happened (Fazi 2016).
Another policy was to bolster the Euro currency and to ensure that no bank should fail asthis risked collapsing the European financial system. A ‘no bond holder left behind’ policyresulted in a massive socialisation of the debt accumulation of private banks in theperipheral countries – meaning that citizens were forced to adopt the debts accrued byfinancial institutions. The ongoing lack of acknowledgement that creditors and debtorsalike contributed to the crisis and are responsible for their actions makes the situation evenmore difficult for many debtor countries. This has led to a situation where a perception of ademocratic deficit at the heart of the EU has been reinforced and citizens of many countriesexperience a sense of powerlessness.
Budgetary consolidation, economic recovery and protecting the euro became the dominantpolitical priorities in Europe. By contrast, efforts to create a more socially just society ‘haveremained rather feeble, at least as perceived by the general public’ (Schraad-Tischler Kroll,2014: 85). Austerity policies and structural reforms pursued during the crisis had negativeeffects on social justice in most countries (Schraad-Tischler Kroll, 2014). The union,especially the currency union, seemed to become a question of signing up to rules, as ifcentral bankers and not the elected representatives of member nations should make thefundamental decisions in any kind of democratic confederation (Mazower 2015).
Against this backdrop people affected both by the economic crisis of 2008 and bysubsequent austerity measures have become disenchanted with the European project inmany countries. The European elections in May 2014 confirmed voter discontent acrossEurope with mainstream politicians, with the rise of Eurosceptics, populists and the far-right and also for anti-establishment parties from the left. Opposition to austerity policieswas most visible in Greece throughout 2015. In 2016 disenchantment with the Europeanproject (albeit from a range of different, sometimes contradictory, perspectives) has beengiven its most visible expression with the Brexit vote in Britain. Christian Kern, the FederalChancellor of Austria, has described the Brexit vote as both an ‘expression of a crisis and, atthe same time, a sharpening of that very crisis’ (Kern, 2016).
The EU Commission President, Jean-Claude Junker, in his opening statement to theEuropean Parliament in July 2014 acknowledged that during the crisis mistakes were made,that there was a lack of social fairness and that democratic legitimacy suffered. More recently
Introduction and Context
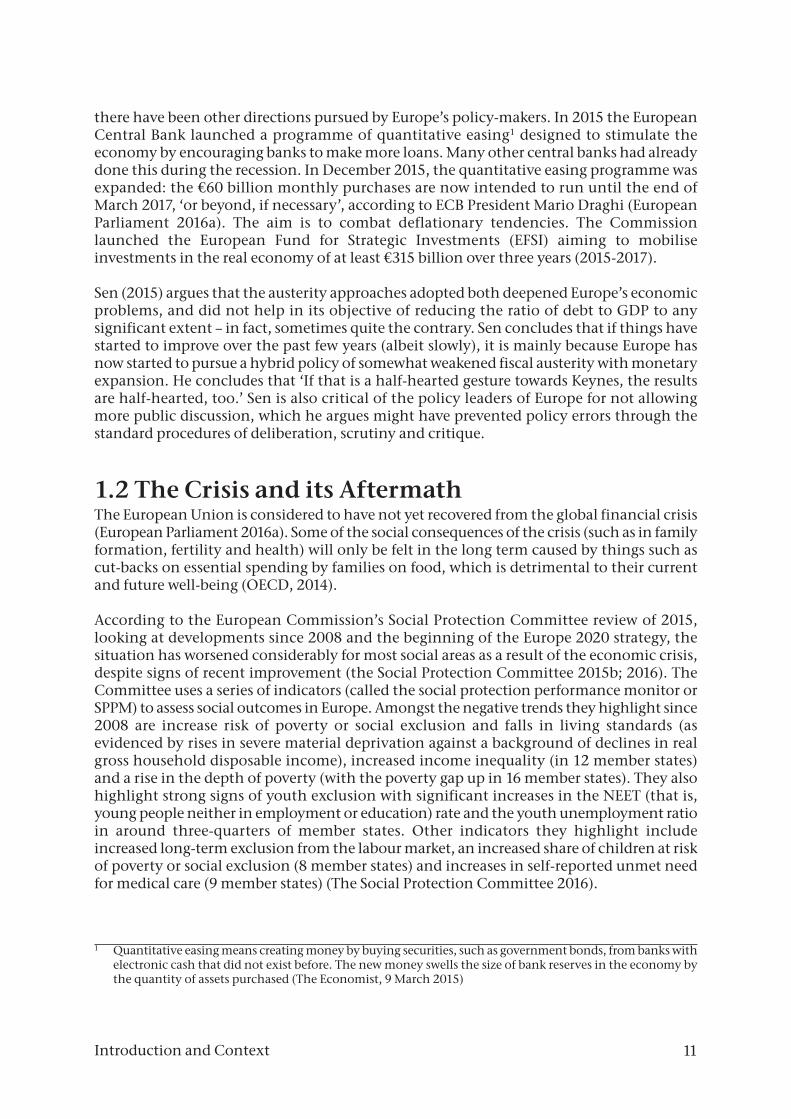
there have been other directions pursued by Europe’s policy-makers. In 2015 the EuropeanCentral Bank launched a programme of quantitative easing1 designed to stimulate theeconomy by encouraging banks to make more loans. Many other central banks had alreadydone this during the recession. In December 2015, the quantitative easing programme wasexpanded: the €60 billion monthly purchases are now intended to run until the end ofMarch 2017, ‘or beyond, if necessary’, according to ECB President Mario Draghi (EuropeanParliament 2016a). The aim is to combat deflationary tendencies. The Commissionlaunched the European Fund for Strategic Investments (EFSI) aiming to mobiliseinvestments in the real economy of at least €315 billion over three years (2015-2017).
Sen (2015) argues that the austerity approaches adopted both deepened Europe’s economicproblems, and did not help in its objective of reducing the ratio of debt to GDP to anysignificant extent – in fact, sometimes quite the contrary. Sen concludes that if things havestarted to improve over the past few years (albeit slowly), it is mainly because Europe hasnow started to pursue a hybrid policy of somewhat weakened fiscal austerity with monetaryexpansion. He concludes that ‘If that is a half-hearted gesture towards Keynes, the resultsare half-hearted, too.’ Sen is also critical of the policy leaders of Europe for not allowingmore public discussion, which he argues might have prevented policy errors through thestandard procedures of deliberation, scrutiny and critique.
1.2 The Crisis and its Aftermath The European Union is considered to have not yet recovered from the global financial crisis(European Parliament 2016a). Some of the social consequences of the crisis (such as in familyformation, fertility and health) will only be felt in the long term caused by things such ascut-backs on essential spending by families on food, which is detrimental to their currentand future well-being (OECD, 2014).
According to the European Commission’s Social Protection Committee review of 2015,looking at developments since 2008 and the beginning of the Europe 2020 strategy, thesituation has worsened considerably for most social areas as a result of the economic crisis,despite signs of recent improvement (the Social Protection Committee 2015b; 2016). TheCommittee uses a series of indicators (called the social protection performance monitor orSPPM) to assess social outcomes in Europe. Amongst the negative trends they highlight since2008 are increase risk of poverty or social exclusion and falls in living standards (asevidenced by rises in severe material deprivation against a background of declines in realgross household disposable income), increased income inequality (in 12 member states)and a rise in the depth of poverty (with the poverty gap up in 16 member states). They alsohighlight strong signs of youth exclusion with significant increases in the NEET (that is,young people neither in employment or education) rate and the youth unemployment ratioin around three-quarters of member states. Other indicators they highlight includeincreased long-term exclusion from the labour market, an increased share of children at riskof poverty or social exclusion (8 member states) and increases in self-reported unmet needfor medical care (9 member states) (The Social Protection Committee 2016).
11Introduction and Context
1 Quantitative easing means creating money by buying securities, such as government bonds, from banks withelectronic cash that did not exist before. The new money swells the size of bank reserves in the economy bythe quantity of assets purchased (The Economist, 9 March 2015)

12
Again looking back to 2008, the EU member states with the most worrisome outcomes – interms of showing a significant worsening in the greatest number of social indicators - areGreece, Slovenia, Cyprus, Spain, Italy, Ireland and Hungary (all registering deterioration in11 or more indicators) (the Social Protection Committee 2016). At the other end of the scale,Austria, United Kingdom, Belgium, the Czech Republic and Finland have registeredsignificant deterioration on 4 or fewer indicators.
As we discussed in last year’s report in this series, an issue that the crisis of 2008 and thesubsequent years has highlighted is the significant shares of unemployed people not coveredby standard safety nets, such as unemployment benefits or social assistance income orschemes of ‘last resort’– even in some of the ‘older’ countries of the EU. A EuropeanCommission study shows that well-established minimum income schemes are not the normin Europe; out of 30 European countries, only 15 have comprehensive and accessibleschemes (European Commission 2015c). Greece, Italy and Bulgaria are amongst thecountries with very limited, partial or piecemeal schemes which fail to cover all those inneed of support.
While the Europe 2020 Strategy is focused on achieving high levels of employment,productivity and social cohesion, it is well recognised that social cohesion is declining or atleast under new pressure (Eurofound and Bertelsmann Stiftung 2014). As we noted in thelast report in this series, this is due not only to the economic and employment crisis but alsodue to longer-term trends such as growing inequality, immigration and increased culturaldiversity and also increasing social disparities in relation to issues of poverty, labour marketaccess, health and equitable education. The OECD has noted recently that at the same timeas the world economy shows little sign of making a full recovery from the crisis, geopoliticaluncertainty is rising highlighted by events during the past year such as the escalation of therefugee crisis in Europe, and the terrorist threat that has manifested itself so tragically inParis, Brussels and elsewhere (2016b).
In its latest Interim Economic Outlook (February 2016), the OECD expresses alarm aboutthe global economy’s and euro area’s sluggish pace of recovery (OECD 2016c; EuropeanParliament 2016a) Thus the economy has entered a period of stagnation, with real GDPgrowth in 2016 more or less at the same low level as in 2015. According to the OECD, withfew exceptions, economies are not recovering but facing another year of stagnation. In theeuro area, GDP growth is expected to pick up only slowly with investment remaining weakand unemployment remaining high.
The OECD recommends a stronger collective policy response in order to strengthendemand, including a commitment to raising public investment collectively to boost demandwhile remaining on a fiscally sustainable path. Investment spending can have high knock-on effects, while quality infrastructure projects would help to support future growth, makingup for the shortfall in investment following the cuts imposed across advanced countries inrecent years
While the employment situation is now improving, the issue of poor quality jobs andunequal access to the labour market has to be addressed, and unemployment levels remainfar too high in some European countries (OECD 2016a). The effect of the crisis on youngpeople’s employment has been marked. In 2013 some 23.5 per cent of young people (aged15-24) across the EU were unemployed, which was the highest level ever recorded in thehistory of the EU (Eurostat quoted in Eurofound 2016). There have been improvements since
Introduction and Context
13
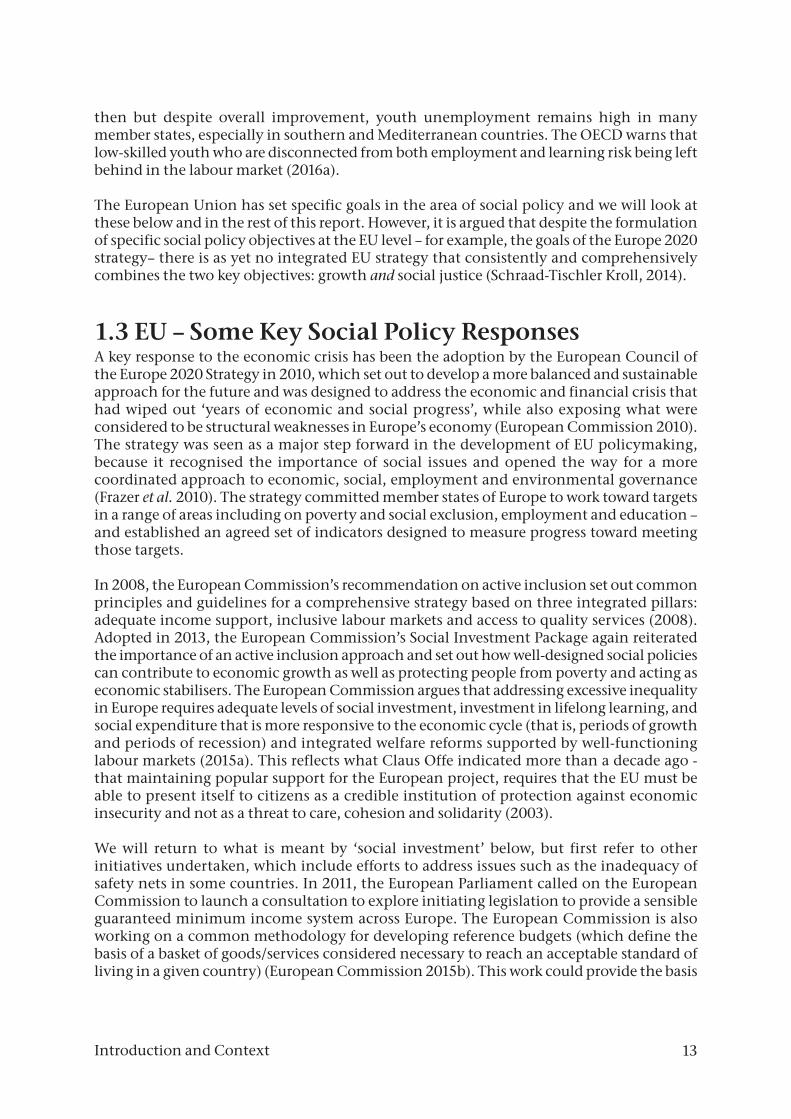
then but despite overall improvement, youth unemployment remains high in manymember states, especially in southern and Mediterranean countries. The OECD warns thatlow-skilled youth who are disconnected from both employment and learning risk being leftbehind in the labour market (2016a).
The European Union has set specific goals in the area of social policy and we will look atthese below and in the rest of this report. However, it is argued that despite the formulationof specific social policy objectives at the EU level – for example, the goals of the Europe 2020strategy– there is as yet no integrated EU strategy that consistently and comprehensivelycombines the two key objectives: growth and social justice (Schraad-Tischler Kroll, 2014).
1.3 EU – Some Key Social Policy ResponsesA key response to the economic crisis has been the adoption by the European Council ofthe Europe 2020 Strategy in 2010, which set out to develop a more balanced and sustainableapproach for the future and was designed to address the economic and financial crisis thathad wiped out ‘years of economic and social progress’, while also exposing what wereconsidered to be structural weaknesses in Europe’s economy (European Commission 2010).The strategy was seen as a major step forward in the development of EU policymaking,because it recognised the importance of social issues and opened the way for a morecoordinated approach to economic, social, employment and environmental governance(Frazer et al. 2010). The strategy committed member states of Europe to work toward targetsin a range of areas including on poverty and social exclusion, employment and education –and established an agreed set of indicators designed to measure progress toward meetingthose targets.
In 2008, the European Commission’s recommendation on active inclusion set out commonprinciples and guidelines for a comprehensive strategy based on three integrated pillars:adequate income support, inclusive labour markets and access to quality services (2008).Adopted in 2013, the European Commission’s Social Investment Package again reiteratedthe importance of an active inclusion approach and set out how well-designed social policiescan contribute to economic growth as well as protecting people from poverty and acting aseconomic stabilisers. The European Commission argues that addressing excessive inequalityin Europe requires adequate levels of social investment, investment in lifelong learning, andsocial expenditure that is more responsive to the economic cycle (that is, periods of growthand periods of recession) and integrated welfare reforms supported by well-func tioninglabour markets (2015a). This reflects what Claus Offe indicated more than a decade ago -that maintaining popular support for the European project, requires that the EU must beable to present itself to citizens as a credible institution of protection against economicinsecurity and not as a threat to care, cohesion and solidarity (2003).
We will return to what is meant by ‘social investment’ below, but first refer to otherinitiatives undertaken, which include efforts to address issues such as the inadequacy ofsafety nets in some countries. In 2011, the European Parliament called on the EuropeanCommission to launch a consultation to explore initiating legislation to provide a sensibleguaranteed minimum income system across Europe. The European Commission is alsoworking on a common methodology for developing reference budgets (which define thebasis of a basket of goods/services considered necessary to reach an acceptable standard ofliving in a given country) (European Commission 2015b). This work could provide the basis
Introduction and Context

for the European Commission and Member States to agree on common criteria forestablishing what constitutes an adequate minimum income to lift people out of povertyand to lead a decent life compatible with human dignity and thus for a more coordinatedapproach to these issues across Europe (Frazer and Marlier 2016).
The European Pillar of Social Rights is the European Commission’s latest major initiative inthe field of employment and social affairs announced by President Juncker in September2015. It is intended to strengthen the Economic and Monetary Union by strengthening itsemployment and social aspects and is understood as official recognition that the reactionsto the Eurozone crisis neglected the EU’s social dimension. In March 2016, the Commissionpublished a preliminary outline of the Pillar, which is now undergoing consultation. Theoutline released by the Commission for consultation contains principles for equalopportunities and access to the labour market, for fair working conditions and for adequateand sustainable social protection that could become a European reference framework formonitoring and benchmarking (European Commission 2016). While many welcome thisinitiative in principle for addressing important social policy issues, the consultation drafthas also been criticised. One criticism is that it that it fails to provide for social rights ratherthan guidelines and principles (Poulou 2016) and formulates some of its principles vaguelyand lacks clear-cut indicators to measure and compare the social performance of memberstates (Sanden and Schluter 2016). Others are that its legal status is unclear and consequentlythat its effects may be insignificant, that it subordinates social policy principles to theprimacy of fiscal sustainability, and that it does not seek to confer any collective social rights(Seikel 2016). The Pillar represents a potentially important development, but this willdepend on the form it ultimately takes.
Returning to the concept of social investment, it is characterised by policies that ‘prepare’individuals and families to respond to new social risks of the competitive knowledge societyby investing in human capital from early childhood on, rather than simply to ‘repair’damage after moments of economic or political crisis (Hemerijck 2014). The European socialinvestment package calls for social protection systems that guard against risks across thelifecycle, emphasising the need for well-targeted, comprehensive and enabling benefits andservices. It stresses that welfare systems fulfil three functions: social investment, socialprotection and stabilisation of the economy. The social investment approach relies on theassumption that social and economic policies are mutually reinforcing and that the former,when framed in a social investment perspective, represents a “precondition” for futureeconomic and employment growth. The Social Investment Package aims for qualityemployment for those who can work and for resources sufficient to live in dignity for thosewho cannot (European Commission 2013b). It refers to the use of European structural andinvestment funds for Member States in implementing the strategy set out in the packageand for the monitoring of the adequacy of income support as part of the European Semester.
The Social Investment Package proposes that financing decisions for social policy be basedon analysis in advance of their likely impact, intended to ensure that the longer-termoutcomes of social investment be taken into account from the start (2013b). This would bea departure from many of the policy-making approaches that have occurred since 2008,where significant, ad hoc cuts were made to social programmes like welfare, education andhealth without any analysis of long-term effects on people or on finances – and where thesocial impact of ‘reforms’ was not in general considered in advance by the Troika of the EU,ECB and the IMF in countries in receipt of assistance programmes (see Bouget et al 2015 andLeahy, Healy and Murphy, 2015 and other reports in the same series from Caritas Europa).
14Introduction and Context
In this context, it is interesting to note that as well as investment, the OECD ChiefEconomist is in 2016 placing a new emphasis on policy coherence, that is to say, looking athow a range of different approaches to policy impact on the overall well-being of a country’scitizens and more broadly on the world (OECD 2016b). This arises from a recognition thatmistakes were made in the response to the economic crisis (OECD 2015c). Measuressuggested include a greater focus on well-being and its distribution to ensure that growthdelivers progress for all. This is based on the fact that the gap between rich and poor is at itshighest level in 30 years in OECD countries, that large income inequalities underminegrowth and wellbeing, and requiring, amongst other things, that taxation systems arereformed to ensure that they are progressive enough (OECD 2015c).
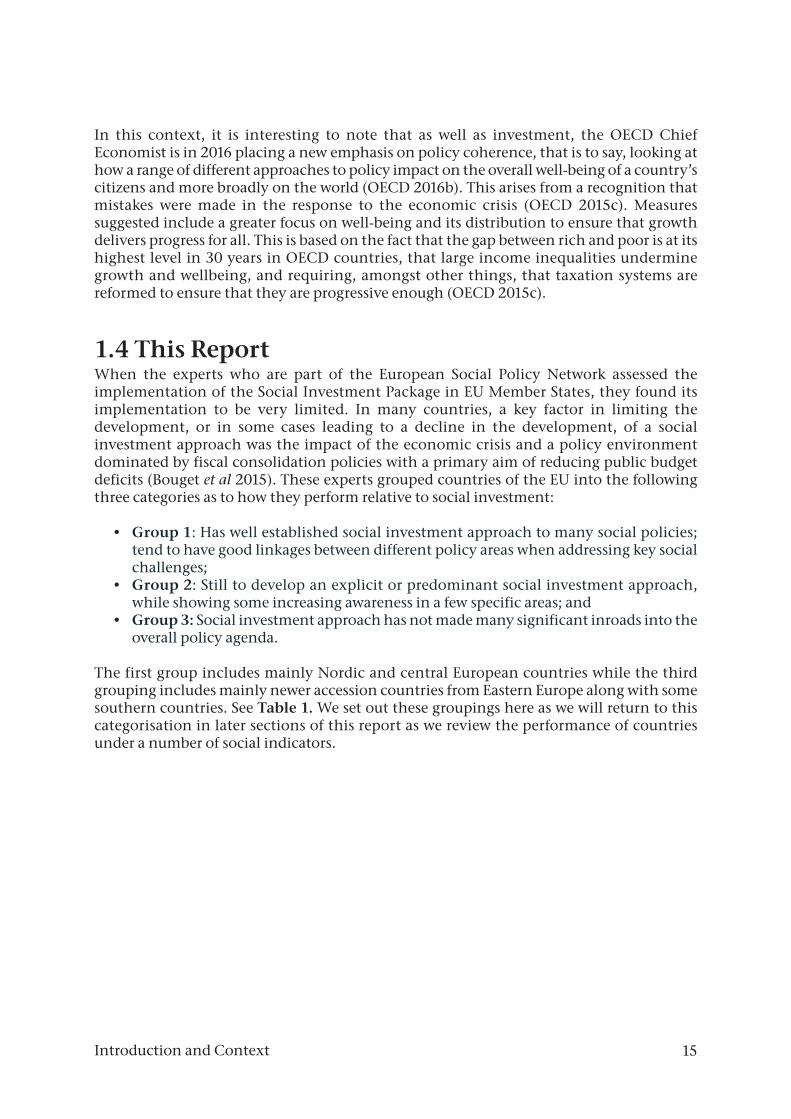
1.4 This ReportWhen the experts who are part of the European Social Policy Network assessed theimplementation of the Social Investment Package in EU Member States, they found itsimplementation to be very limited. In many countries, a key factor in limiting thedevelopment, or in some cases leading to a decline in the development, of a socialinvestment approach was the impact of the economic crisis and a policy environmentdominated by fiscal consolidation policies with a primary aim of reducing public budgetdeficits (Bouget et al 2015). These experts grouped countries of the EU into the followingthree categories as to how they perform relative to social investment:
• Group 1: Has well established social investment approach to many social policies;tend to have good linkages between different policy areas when addressing key socialchallenges;
• Group 2: Still to develop an explicit or predominant social investment approach,while showing some increasing awareness in a few specific areas; and
• Group 3: Social investment approach has not made many significant inroads into theoverall policy agenda.
The first group includes mainly Nordic and central European countries while the thirdgrouping includes mainly newer accession countries from Eastern Europe along with somesouthern countries. See Table 1. We set out these groupings here as we will return to thiscategorisation in later sections of this report as we review the performance of countriesunder a number of social indicators.
15Introduction and Context
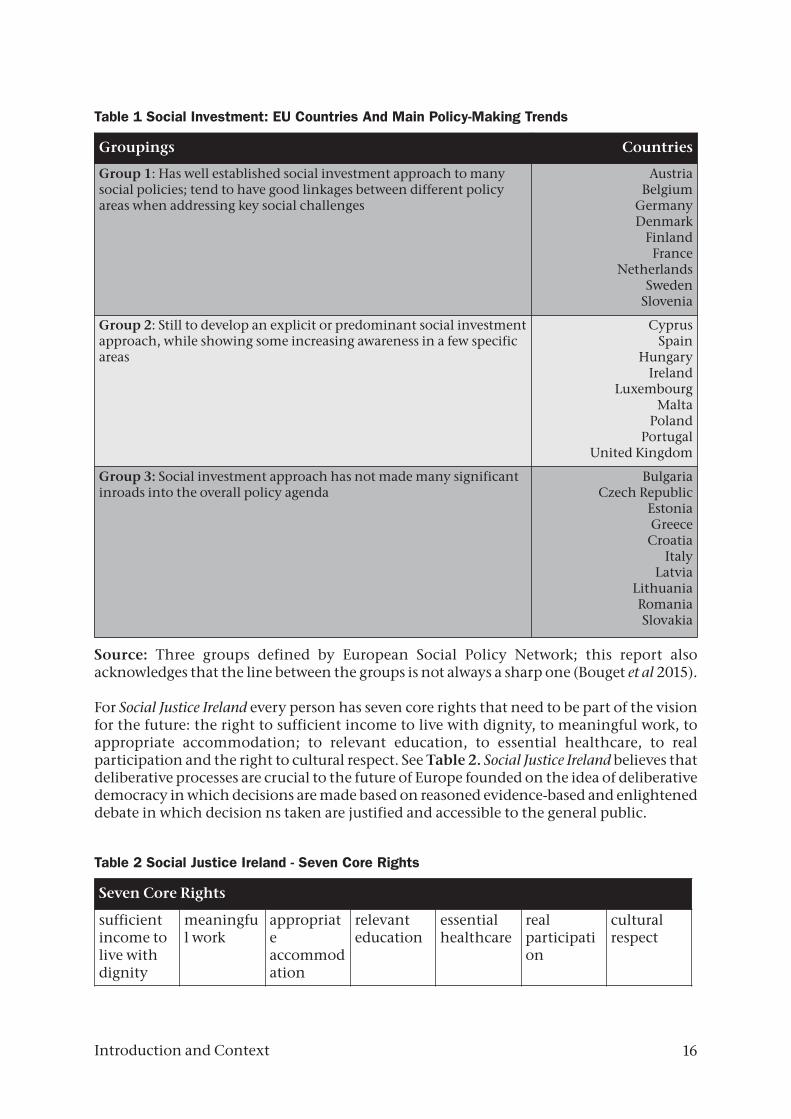
Table 1 Social Investment: EU Countries And Main Policy-Making Trends
Source: Three groups defined by European Social Policy Network; this report alsoacknowledges that the line between the groups is not always a sharp one (Bouget et al 2015).
For Social Justice Ireland every person has seven core rights that need to be part of the visionfor the future: the right to sufficient income to live with dignity, to meaningful work, toappropriate accommodation; to relevant education, to essential healthcare, to realparticipation and the right to cultural respect. See Table 2. Social Justice Ireland believes thatdeliberative processes are crucial to the future of Europe founded on the idea of deliberativedemocracy in which decisions are made based on reasoned evidence-based and enlighteneddebate in which decision ns taken are justified and accessible to the general public.
Table 2 Social Justice Ireland - Seven Core Rights
Groupings Countries
Group 1: Has well established social investment approach to manysocial policies; tend to have good linkages between different policyareas when addressing key social challenges
AustriaBelgium
GermanyDenmark
FinlandFrance
NetherlandsSweden
Slovenia
Group 2: Still to develop an explicit or predominant social investmentapproach, while showing some increasing awareness in a few specificareas
CyprusSpain
HungaryIreland
LuxembourgMalta
PolandPortugal
United Kingdom
Group 3: Social investment approach has not made many significantinroads into the overall policy agenda
BulgariaCzech Republic
EstoniaGreece
CroatiaItaly
LatviaLithuaniaRomaniaSlovakia
Seven Core Rights
sufficientincome tolive withdignity
meaningful work
appropriateaccommodation
relevanteducation
essentialhealthcare
realparticipation
culturalrespect
16Introduction and Context

In the previous report in this series, we reviewed progress (or the lack of it) in key areas ofsocial policy focusing especially on the period between 2008 and 2013. In this report, weprincipally aim to update the previous report and to present what is an annual review ofthese key areas.
In Sections 2 to 4 of this report, we will discuss issues relevant to the realisation of some ofthese rights by looking at social indicators under the headings of poverty and socialexclusion, employment/unemployment, and services in health and in education. We willalso look at how countries compare in respect of total taxation2 (Section 5). Throughoutthe report we will review how the groupings of countries relative to their performance undersocial investment and set out in Table 1 perform in relation to some of these headings. Wewill then set out some alternative approaches to policy-making in Section 6, and finish bydrawing some conclusions and making some recommendations in Section 7.
17Introduction and Context
2 That is, taxes on production and imports, income and wealth, capital taxes, and compulsory socialcontributions paid by employers and employees (see Eurostat 2014:268)
2.
POVERTY, SOC I A LEXCLUS ION AND INCOMEINEQUAL I TY
Social Justice Ireland includes the right to sufficient income to live with dignity amongst itslist of core rights that need to guide policy-making in the future. (For the full list, see Table2, above.) The headline target set in 2010 in the 2020 Strategy was to reduce the number ofEuropeans living in or at risk of poverty or social exclusion by 20 million by 2020. In thissection, we will take that as a starting point by referring to how Europe is progressing inrelation to that target and we will also look at some further indicators of poverty/inequalityas well as impacts on certain groups. We will finish this section by looking briefly at incomeinequality and at financial distress.
2.1 Poverty and Social Exclusion and other Measures - Adults
First it is necessary to refer to the issue of how poverty is defined. Used in the Europe 2020strategy, the indicator, ‘poverty or social exclusion’ is based on a combination of threeindividual indicators – an income measure which is related to the median income of eachcountry, a measure of a lack of resources and a work-exclusion measure. Specifically thesetake the form of the following three indicators:
(1) people who are at risk of poverty - people with an equivalised disposable incomebelow the risk-of-poverty threshold set at 60 per cent of the national median (ormiddle) equivalised disposable income (after social transfers) (Eurostat, t2020_50)3.;
(2) people severely materially deprived - have living conditions severely constrained bya lack of resources; they experience at least 4 out of a list of 9 deprivation items (SeeGlossary for the full list) (Eurostat, t2020_50); or
(3) people living in households with very low work intensity - those aged 0-59 living inhouseholds where the adults (aged 18-59) work less than 20 per cent of their totalwork potential during the past year (Eurostat, t2020_50).
18Poverty, Social Exclusion and Income Inequality
E U R O P E A N R E S E A R C H S E R I E S
3 The 60% threshold is adopted in the Europe 2020 Strategy. It is also possible to examine incomes below otherthresholds such as 40%, 50% or 70%.
Thus the combined ‘poverty or social exclusion’ indicator corresponds to the sum of personswho are at risk of poverty or severely materially deprived or living in households with verylow work intensity. Persons are only counted once even if they are present in several sub-indicators. It is also possible to examine each of the indicators separately and we will do so inthis report. In Table 3we set out a summary of the position relative to each of these indicatorsin 2008 and 2014 and we discuss each of them further below. The Glossary at the back of thisreport contains more detailed definitions of the indicators used in the EU 2020 Strategy.
Measuring and monitoring poverty and other social conditions can be a challengingprocess. The Social Protection Committee of the European Union has introduced a newinstrument – the social protection performance monitor (known as the SPPM) – intendedto build on the existing indicators and to contribute to monitoring the European socialsituation. It involves a dashboard of indicators designed to monitor trends that are bothpositive and negative – and in this report we will refer to some of these indicators also. Thedashboard includes over 20 indicators (including those already discussed above and usedto monitor the Europe 2020 strategy) that are broader than poverty/incomes and also takein issues like health, unemployment, housing cost over-burden, and early school leaving.For a full list of these indicators (which are not static and are designed to be capable ofchange) see Glossary.
It may also be worth noting here that attention is beginning to be paid to the dynamics ofpoverty or looking at poverty over time and at issues around probability of exiting andentering poverty in different groups of the population (Vaalavuo 2015). These results showgreat variations between countries even when those countries have similar at risk of povertyrates, and there are also differences between age groups in the patterns of poverty exit andentry. However, these dynamic measures are not widely adopted yet in Europe so in thisreport we focus mainly on the most commonly used measures.
We discussed social developments in Europe between 2008 and 2013 in last year’s report inthis series. One reference point we used was the Social Protection Performance Monitor,from the EU’s Social Protection Committee, which reported how between 2008 and 2013,the countries with the most worrisome outcomes were Cyprus, Greece, Spain and Sloveniawhere there was deterioration in at least 15 of the indicators (2015). In a further 3 countries,Hungary, Italy and Ireland, deteriorations occurred in more than 12 of the indicators, Butother countries, notably, Austria, the Czech Republic, Finland and Germany registereddeterioration in far fewer of the indicators (4 or fewer).
Overall what we concluded was that, having set targets to reduce poverty and promoteinclusion in 2010 in the Europe 2020 Strategy, Europe moved farther away in subsequentyears from achieving those targets and countries were very divergent in their experiences.The risk of poverty or social exclusion rate (the combined indicator of poverty used inthe Europe 2020 strategy) increased between 2008 and 2012 and showed a slightimprovement since then.
19Poverty, Social Exclusion and Income Inequality

Table 3 PEOPLE EXPERIENCING POVERTY, EU-28, 2008, 2013 and 2014
Source: Eurostat Online Databases: t2020_50, t2020_51, t2020_52, t2020_53,ilc_lvhl11,ilc_li02, Ilc_mddd11, ilc_peps01. * relates to EU-27 countries, not EU-28, as this was prior to the accession of Croatia
In this report our main focus is on the period between 2013 and 2014 (the latest year forwhich comparable rates are available across Europe). Those experiencing poverty or socialexclusion still amount to over 122 million people (EU-28) or 24.2 per cent of the populationof the EU (that is, almost 1 in 4 people) (Eurostat online database code t2020_50). Despitea slight decrease in the rate each year since 2012, there has been an overall increase ofapproximately 6 million people affected since 2008 (in EU-28)4.
In last year’s report in this series, we discussed how the situation worsened in 19 memberStates (out of EU-27) between 2008 and 2013 and how, in the larger countries, very largenumbers of people were affected. The countries that had substantially contributed to theincrease in the numbers affected (2008 to 2013) were Italy and Spain, especially, and also tosome extent Greece, Hungary and the United Kingdom (Social Protection Committee2015a).
Poverty Indicators 2008, 2013, 2014
People at risk ofpoverty or socialexclusion
People at risk ofpoverty (60%threshold)
PeopleexperiencingSevere MaterialDeprivation
People inhouseholds withvery low workintensity
EU-28 Number % Number % Number % Number %
Total population
2008 116.2m* 23.8* 81m* 16.6* 42.3* 8.5* 34.4m* 9.2*
2013 122.9m 24.6 83.4m 16.6 48.1 9.6 40.7m 10.9
2014 122.17m 24.2 86.2m 17.2 44.5 8.9 41.8m 11.2
Children (under 18)
2008 25m* 26.4* 19.3m* 20.3* 9.4m* 9.8* 7.3m* 7.7*
2013 26.3m 27.7 19.2m 20.3 10.5m 11 8.9m 9.5
2014 26.2m 27.8 19.9m 21.1 9.8m 10.4 9.1m 9.7
Older people (over 65s)
2008 19.2m* 23.3* 15.6* 19* 6.2m* 7.5* n/a n/a
2013 16.4m 18.2 12.35m 13.8 6.2m 6.9 n/a n/a
2014 16.3m 17.8 12.6m 13.8 5.7m 6.2
20Poverty, Social Exclusion and Income Inequality
4 Eurostat doesn’t publish the figure for 2008 for EU28 as that was before the accession of Croatia and 2008rates are not published for Croatia.
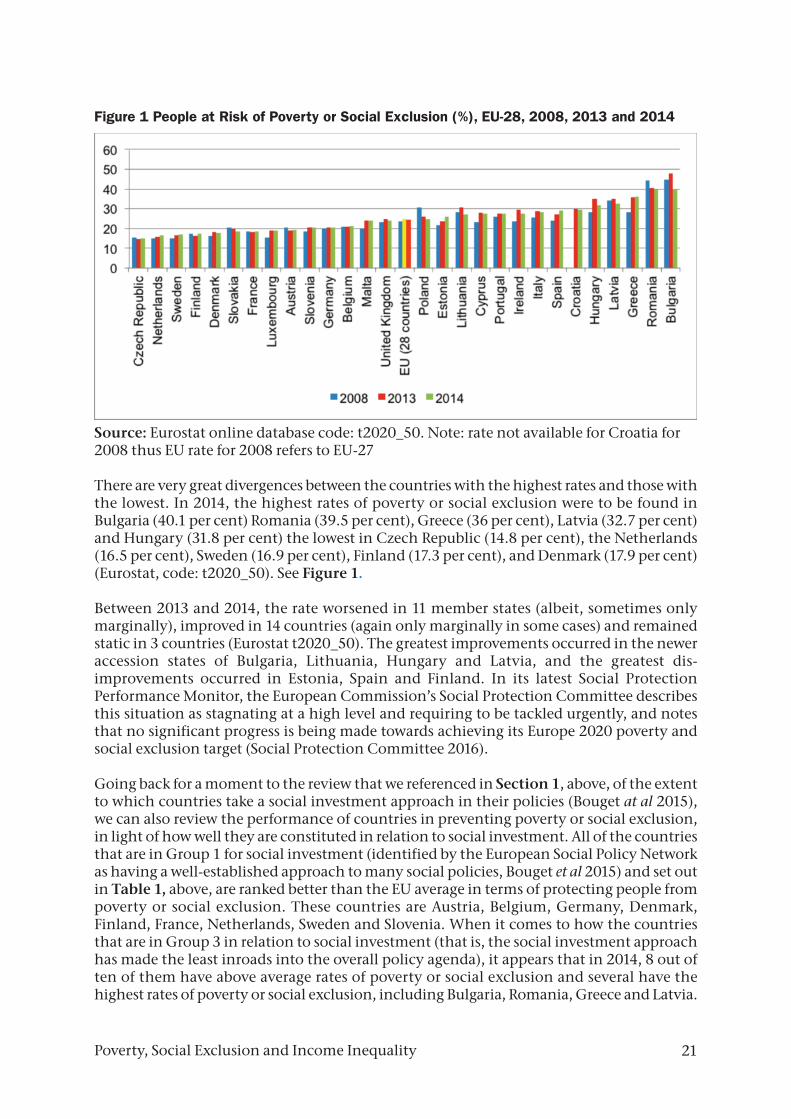
Figure 1 People at Risk of Poverty or Social Exclusion (%), EU-28, 2008, 2013 and 2014
Source: Eurostat online database code: t2020_50. Note: rate not available for Croatia for2008 thus EU rate for 2008 refers to EU-27
There are very great divergences between the countries with the highest rates and those withthe lowest. In 2014, the highest rates of poverty or social exclusion were to be found inBulgaria (40.1 per cent) Romania (39.5 per cent), Greece (36 per cent), Latvia (32.7 per cent)and Hungary (31.8 per cent) the lowest in Czech Republic (14.8 per cent), the Netherlands(16.5 per cent), Sweden (16.9 per cent), Finland (17.3 per cent), and Denmark (17.9 per cent)(Eurostat, code: t2020_50). See Figure 1.
Between 2013 and 2014, the rate worsened in 11 member states (albeit, sometimes onlymarginally), improved in 14 countries (again only marginally in some cases) and remainedstatic in 3 countries (Eurostat t2020_50). The greatest improvements occurred in the neweraccession states of Bulgaria, Lithuania, Hungary and Latvia, and the greatest dis-improvements occurred in Estonia, Spain and Finland. In its latest Social ProtectionPerformance Monitor, the European Commission’s Social Protection Committee describesthis situation as stagnating at a high level and requiring to be tackled urgently, and notesthat no significant progress is being made towards achieving its Europe 2020 poverty andsocial exclusion target (Social Protection Committee 2016).
Going back for a moment to the review that we referenced in Section 1, above, of the extentto which countries take a social investment approach in their policies (Bouget at al 2015),we can also review the performance of countries in preventing poverty or social exclusion,in light of how well they are constituted in relation to social investment. All of the countriesthat are in Group 1 for social investment (identified by the European Social Policy Networkas having a well-established approach to many social policies, Bouget et al 2015) and set outin Table 1, above, are ranked better than the EU average in terms of protecting people frompoverty or social exclusion. These countries are Austria, Belgium, Germany, Denmark,Finland, France, Netherlands, Sweden and Slovenia. When it comes to how the countriesthat are in Group 3 in relation to social investment (that is, the social investment approachhas made the least inroads into the overall policy agenda), it appears that in 2014, 8 out often of them have above average rates of poverty or social exclusion and several have thehighest rates of poverty or social exclusion, including Bulgaria, Romania, Greece and Latvia.
21Poverty, Social Exclusion and Income Inequality

22
In 2014 from Group 3 (with the least developed social investment approach), only the CzechRepublic and Slovakia achieve rates of poverty or social exclusion lower than the EU-28average. Czech Republic is an interesting case. Ranked as having the best (lowest) povertyor social exclusion rate, it is considered, in a Europe-wide review of social justice, todemonstrate merely middling economic performance, but to be relatively more effective atdelivering fairness in society, illustrating how social policy plays a critical role in achievingsocial justice (Schraad-Tischler Kroll, 2015). Slovakia is considered to do relatively well interms of protecting its population from poverty because of its comparatively even incomedistribution patterns (Schraad-Tischler Kroll, 2015).
Figure 2 illustrates the changes in the poverty or social exclusion rates amongst EU countriesbetween 2013 and 2014. Estonia and Spain are the countries showing the largest percentagepoint increases, and it is interesting to note that Finland and the Netherlands, withtraditionally low rates, are amongst those showing some dis-improvement in their positions.The rate has fallen in other countries with overall high levels including in Bulgaria,Lithuania, Hungary and Latvia.
Figure 2 At Risk of Poverty or Social Exclusion, EU-28, PP Change in Rate, 2013 TO 2014
Source: Eurostat online database code: t2020_50.
Below are some key statistics from a Eurostat analysis of those at risk of poverty or social
• More than 30 per cent of young people aged 18 to 24 and 27.8 per cent of childrenaged less than 18 were at risk in 2014.
• Almost 18 per cent of those aged 65 or over were also at risk in 2014. • Of all groups examined, the unemployed faced the greatest risk of poverty or social
exclusion, at 66.7 per cent in 2014.
Poverty, Social Exclusion and Income Inequality
• Almost 50 per cent of all single parents were at risk in 2014. This was double the averageand higher than for any other household type analysed.
• 35 per cent of adults with at most lower secondary educational attainment were at riskof poverty or social exclusion in 2014. 63.8 per cent of children of parents with pre-primary and lower secondary education were at risk as well.
• In 2014, 40.1 per cent of adults born in a country outside the EU-28 and 24.8 per centof those born in a different EU-28 country than the reporting one were at risk ofpoverty or social exclusion. For native citizens 22.5 per cent of the population was atthis risk.
• EU-28 citizens in rural areas were on average more likely to live in poverty or socialexclusion than those living in urban areas (27.2 per cent compared with 24.3 per cent)in 2014
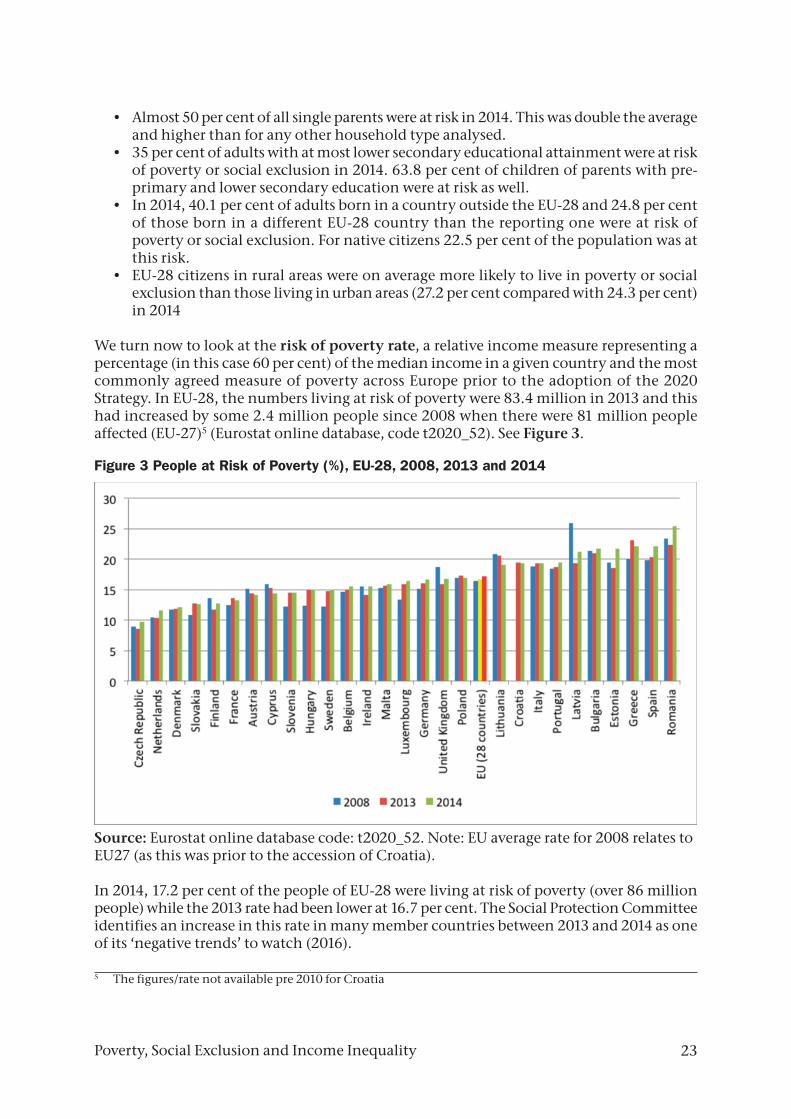
We turn now to look at the risk of poverty rate, a relative income measure representing apercentage (in this case 60 per cent) of the median income in a given country and the mostcommonly agreed measure of poverty across Europe prior to the adoption of the 2020Strategy. In EU-28, the numbers living at risk of poverty were 83.4 million in 2013 and thishad increased by some 2.4 million people since 2008 when there were 81 million peopleaffected (EU-27)5 (Eurostat online database, code t2020_52). See Figure 3.
Figure 3 People at Risk of Poverty (%), EU-28, 2008, 2013 and 2014
Source: Eurostat online database code: t2020_52. Note: EU average rate for 2008 relates toEU27 (as this was prior to the accession of Croatia).
In 2014, 17.2 per cent of the people of EU-28 were living at risk of poverty (over 86 millionpeople) while the 2013 rate had been lower at 16.7 per cent. The Social Protection Committeeidentifies an increase in this rate in many member countries between 2013 and 2014 as oneof its ‘negative trends’ to watch (2016).
23Poverty, Social Exclusion and Income Inequality
5 The figures/rate not available pre 2010 for Croatia
In 2014 in six member states, one fifth or more of the population was at risk of poverty, withthe highest rates in Romania (25.4 per cent), Spain (22.2 per cent), Greece (22.1 per cent),Estonia and Bulgaria (both at 21.8 per cent) and Latvia (21.2 per cent); the lowest in CzechRepublic (9.7 per cent), the Netherlands (11.6 per cent), and Denmark (12.1 per cent). CzechRepublic and the Netherlands also had the lowest rates in 2013. Amongst EU15 (that is, whenthe newer accession countries are excluded), the highest rates were seen in Spain, Greece,Portugal and Italy.
Amongst households with dependent children, the highest at risk of poverty rate in 2014in the EU-28 was recorded for single persons with dependent children, at close to one third(32.5 per cent) (Eurostat 2016a). Among households without dependent children, peopleliving alone were most likely to be at risk of poverty, a situation faced by 25.1 per cent ofsingle person households in 2014 (Eurostat 2016a).
When we look at their performance on the risk of poverty indicator in light of how well theyperform in relation to social investment, again we find that all of the countries that are inGroup 1 for social investment (identified by the European Social Policy Network as havinga well-established approach to many social policies, Bouget et al 2015) and set out in Table1, in Section 1, above, are ranked better than the EU average in terms of protecting peoplefrom poverty or social exclusion (again, Austria, Belgium, Germany, Denmark, Finland,France, Netherlands, Sweden and Slovenia). By contrast several countries with the leastdeveloped social investment approach have the highest rates of poverty (including Romania,Greece, Estonia, Bulgaria and Latvia).
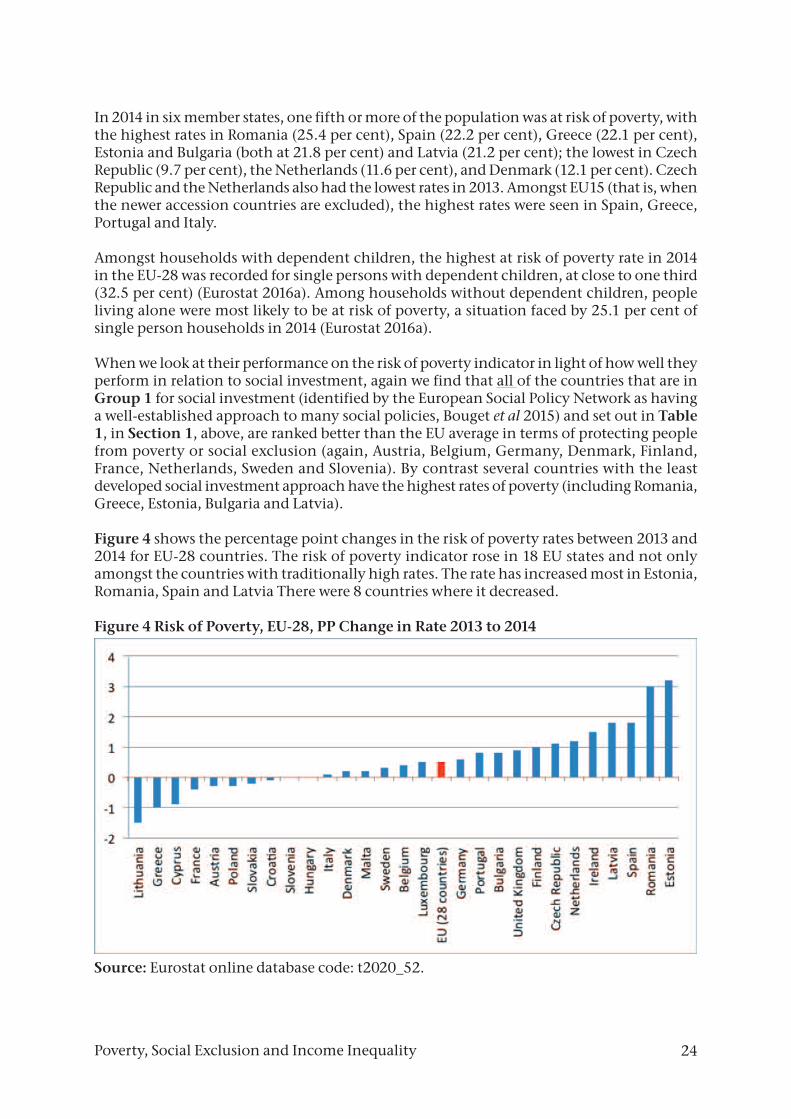
Figure 4 shows the percentage point changes in the risk of poverty rates between 2013 and2014 for EU-28 countries. The risk of poverty indicator rose in 18 EU states and not onlyamongst the countries with traditionally high rates. The rate has increased most in Estonia,Romania, Spain and Latvia There were 8 countries where it decreased.
Figure 4 Risk of Poverty, EU-28, PP Change in Rate 2013 to 2014
Source: Eurostat online database code: t2020_52.
24Poverty, Social Exclusion and Income Inequality
25
One way of examining depth of poverty within those who are poor is to look at theproportion of those who are living below 40 per cent (as opposed to 60 per cent) of medianincomes. Countries with relatively large shares of people living on incomes lower than 40per cent of median incomes in 2014 included Romania, Bulgaria as well as southernEuropean countries of Spain, Greece, Italy, Portugal and Croatia (Eurostat online database,ilc_li02). Between 2013 and 2014, this rate increased by half a percentage point in EU-28indicating more people slipping into deep poverty. It represented more than 31 millionpeople in 2014 – which is an extraordinary figure. Between 2013 and 2014 the largestincreases in this rate occurred in Romania, Spain, Bulgaria, Estonia, and perhapssurprisingly, also in Germany.
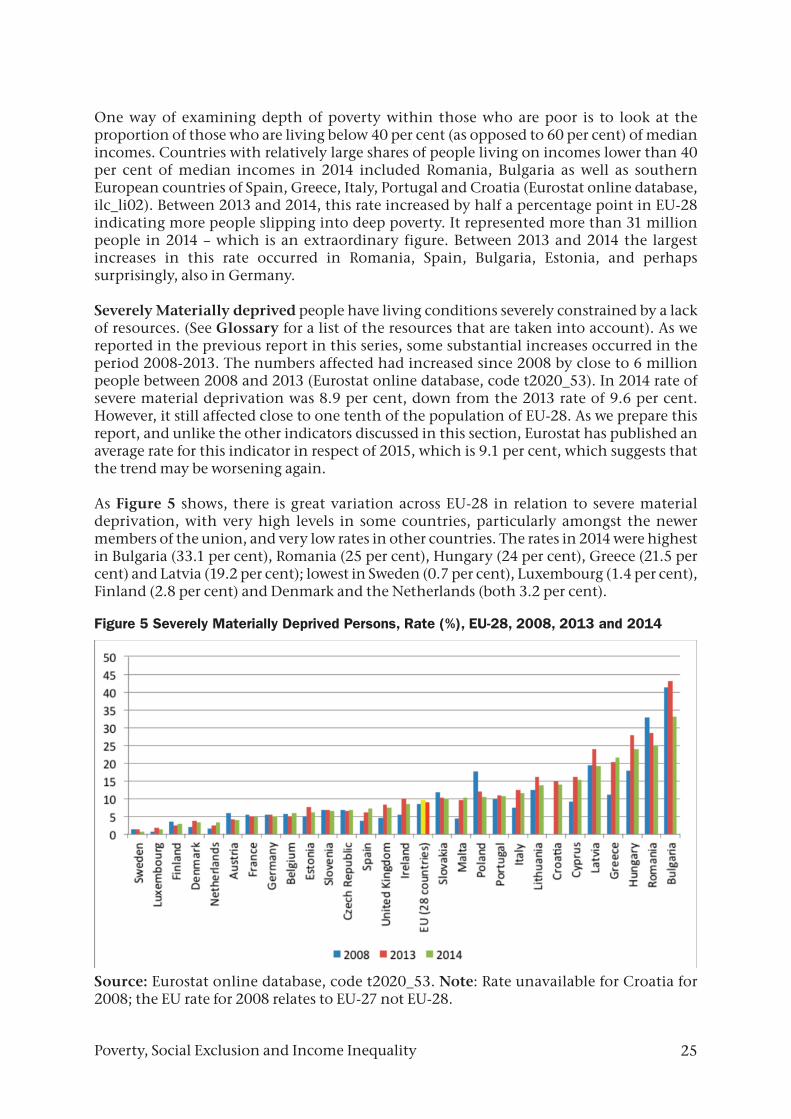
Severely Materially deprived people have living conditions severely constrained by a lackof resources. (See Glossary for a list of the resources that are taken into account). As wereported in the previous report in this series, some substantial increases occurred in theperiod 2008-2013. The numbers affected had increased since 2008 by close to 6 millionpeople between 2008 and 2013 (Eurostat online database, code t2020_53). In 2014 rate ofsevere material deprivation was 8.9 per cent, down from the 2013 rate of 9.6 per cent.However, it still affected close to one tenth of the population of EU-28. As we prepare thisreport, and unlike the other indicators discussed in this section, Eurostat has published anaverage rate for this indicator in respect of 2015, which is 9.1 per cent, which suggests thatthe trend may be worsening again.
As Figure 5 shows, there is great variation across EU-28 in relation to severe materialdeprivation, with very high levels in some countries, particularly amongst the newermembers of the union, and very low rates in other countries. The rates in 2014 were highestin Bulgaria (33.1 per cent), Romania (25 per cent), Hungary (24 per cent), Greece (21.5 percent) and Latvia (19.2 per cent); lowest in Sweden (0.7 per cent), Luxembourg (1.4 per cent),Finland (2.8 per cent) and Denmark and the Netherlands (both 3.2 per cent).
Figure 5 Severely Materially Deprived Persons, Rate (%), EU-28, 2008, 2013 and 2014
Source: Eurostat online database, code t2020_53. Note: Rate unavailable for Croatia for2008; the EU rate for 2008 relates to EU-27 not EU-28.
Poverty, Social Exclusion and Income Inequality
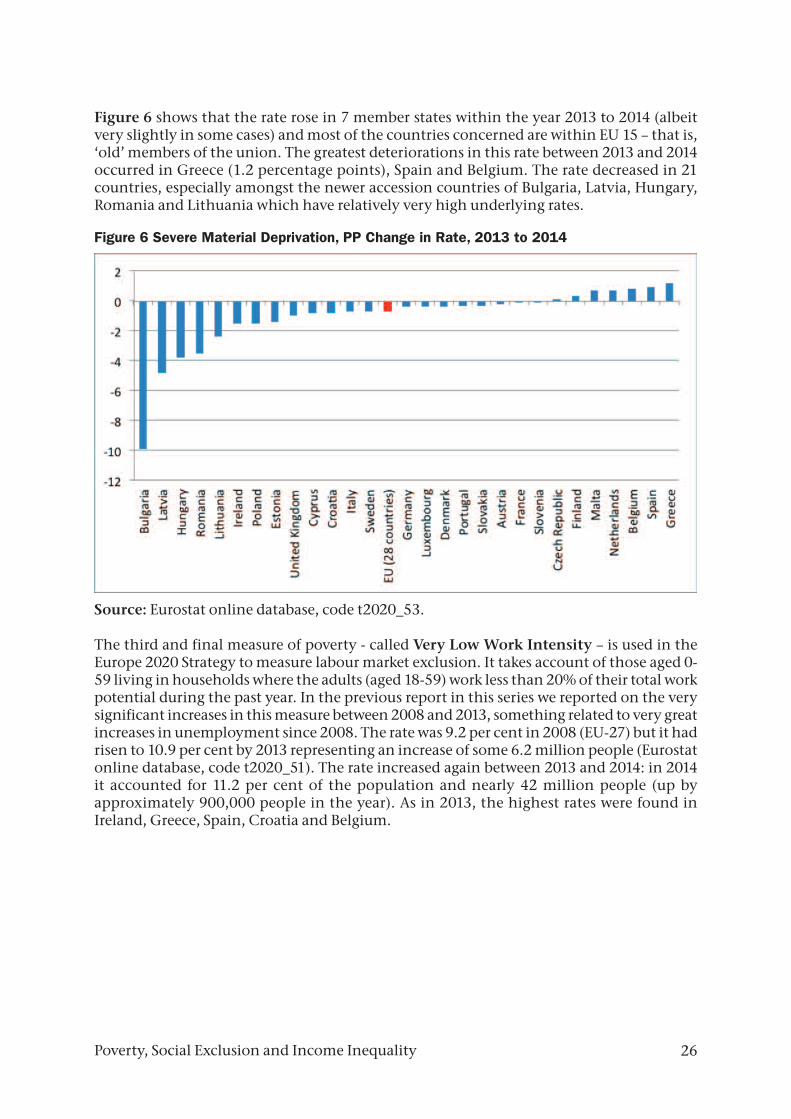
Figure 6 shows that the rate rose in 7 member states within the year 2013 to 2014 (albeitvery slightly in some cases) and most of the countries concerned are within EU 15 – that is,‘old’ members of the union. The greatest deteriorations in this rate between 2013 and 2014occurred in Greece (1.2 percentage points), Spain and Belgium. The rate decreased in 21countries, especially amongst the newer accession countries of Bulgaria, Latvia, Hungary,Romania and Lithuania which have relatively very high underlying rates.
Figure 6 Severe Material Deprivation, PP Change in Rate, 2013 to 2014
Source: Eurostat online database, code t2020_53.
The third and final measure of poverty - called Very Low Work Intensity – is used in theEurope 2020 Strategy to measure labour market exclusion. It takes account of those aged 0-59 living in households where the adults (aged 18-59) work less than 20% of their total workpotential during the past year. In the previous report in this series we reported on the verysignificant increases in this measure between 2008 and 2013, something related to very greatincreases in unemployment since 2008. The rate was 9.2 per cent in 2008 (EU-27) but it hadrisen to 10.9 per cent by 2013 representing an increase of some 6.2 million people (Eurostatonline database, code t2020_51). The rate increased again between 2013 and 2014: in 2014it accounted for 11.2 per cent of the population and nearly 42 million people (up byapproximately 900,000 people in the year). As in 2013, the highest rates were found inIreland, Greece, Spain, Croatia and Belgium.
26Poverty, Social Exclusion and Income Inequality
2.2 Poverty and Social Exclusion and otherIndicators – Specific Groups
In this section we will look at two groups in more detail, again using the poverty measuresthat are most used at European level.
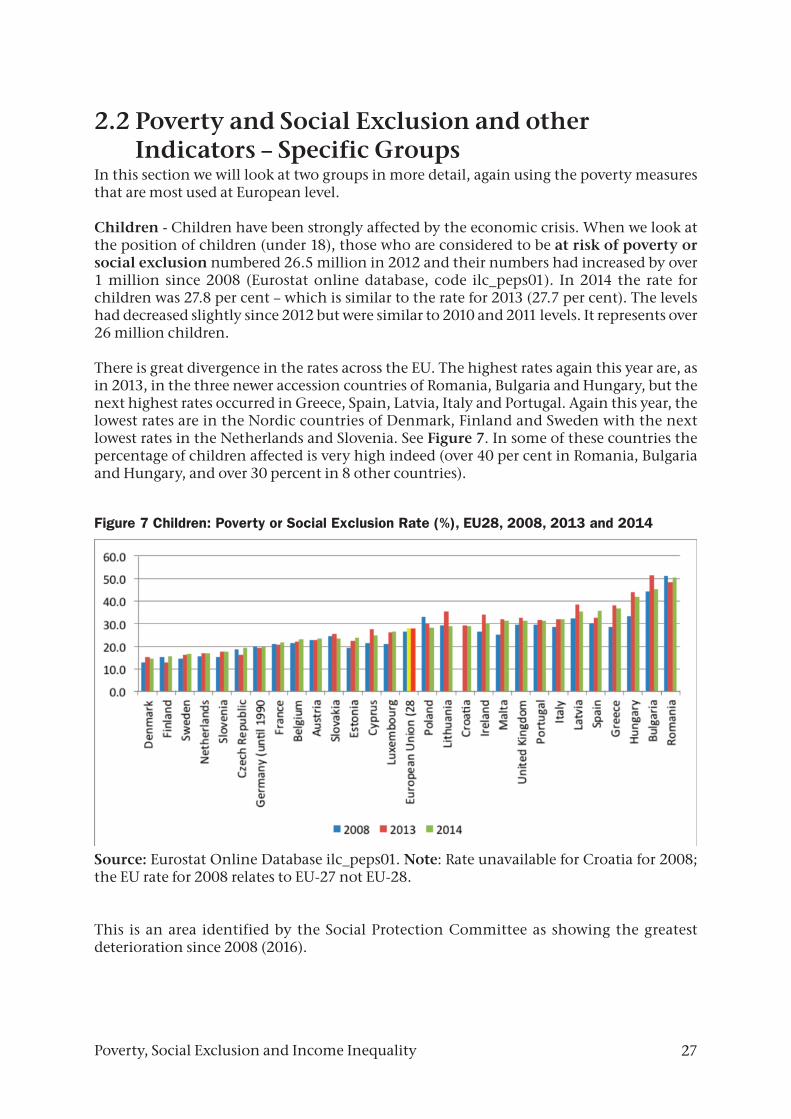
Children - Children have been strongly affected by the economic crisis. When we look atthe position of children (under 18), those who are considered to be at risk of poverty orsocial exclusion numbered 26.5 million in 2012 and their numbers had increased by over1 million since 2008 (Eurostat online database, code ilc_peps01). In 2014 the rate forchildren was 27.8 per cent – which is similar to the rate for 2013 (27.7 per cent). The levelshad decreased slightly since 2012 but were similar to 2010 and 2011 levels. It represents over26 million children.
There is great divergence in the rates across the EU. The highest rates again this year are, asin 2013, in the three newer accession countries of Romania, Bulgaria and Hungary, but thenext highest rates occurred in Greece, Spain, Latvia, Italy and Portugal. Again this year, thelowest rates are in the Nordic countries of Denmark, Finland and Sweden with the nextlowest rates in the Netherlands and Slovenia. See Figure 7. In some of these countries thepercentage of children affected is very high indeed (over 40 per cent in Romania, Bulgariaand Hungary, and over 30 percent in 8 other countries).
Figure 7 Children: Poverty or Social Exclusion Rate (%), EU28, 2008, 2013 and 2014
Source: Eurostat Online Database ilc_peps01. Note: Rate unavailable for Croatia for 2008;the EU rate for 2008 relates to EU-27 not EU-28.
This is an area identified by the Social Protection Committee as showing the greatestdeterioration since 2008 (2016).
27Poverty, Social Exclusion and Income Inequality
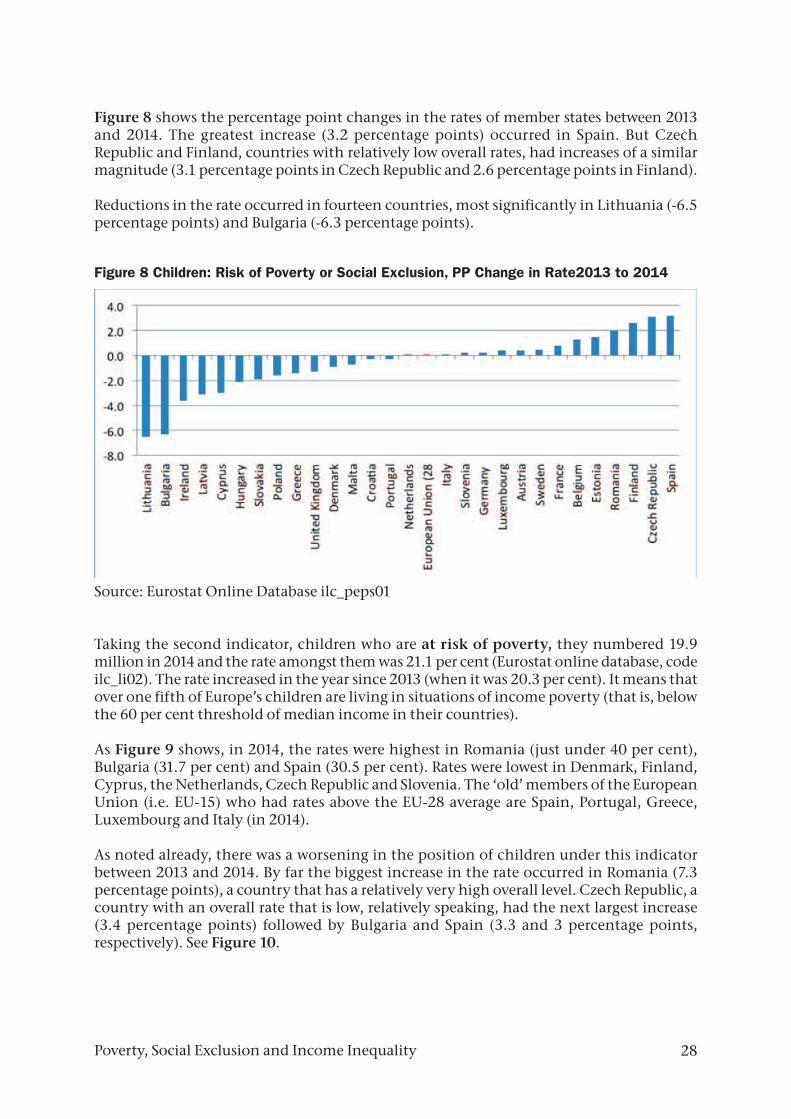
Figure 8 shows the percentage point changes in the rates of member states between 2013and 2014. The greatest increase (3.2 percentage points) occurred in Spain. But CzechRepublic and Finland, countries with relatively low overall rates, had increases of a similarmagnitude (3.1 percentage points in Czech Republic and 2.6 percentage points in Finland).
Reductions in the rate occurred in fourteen countries, most significantly in Lithuania (-6.5percentage points) and Bulgaria (-6.3 percentage points).
Figure 8 Children: Risk of Poverty or Social Exclusion, PP Change in Rate2013 to 2014
Source: Eurostat Online Database ilc_peps01
Taking the second indicator, children who are at risk of poverty, they numbered 19.9million in 2014 and the rate amongst them was 21.1 per cent (Eurostat online database, codeilc_li02). The rate increased in the year since 2013 (when it was 20.3 per cent). It means thatover one fifth of Europe’s children are living in situations of income poverty (that is, belowthe 60 per cent threshold of median income in their countries).
As Figure 9 shows, in 2014, the rates were highest in Romania (just under 40 per cent),Bulgaria (31.7 per cent) and Spain (30.5 per cent). Rates were lowest in Denmark, Finland,Cyprus, the Netherlands, Czech Republic and Slovenia. The ‘old’ members of the EuropeanUnion (i.e. EU-15) who had rates above the EU-28 average are Spain, Portugal, Greece,Luxembourg and Italy (in 2014).
As noted already, there was a worsening in the position of children under this indicatorbetween 2013 and 2014. By far the biggest increase in the rate occurred in Romania (7.3percentage points), a country that has a relatively very high overall level. Czech Republic, acountry with an overall rate that is low, relatively speaking, had the next largest increase(3.4 percentage points) followed by Bulgaria and Spain (3.3 and 3 percentage points,respectively). See Figure 10.
28Poverty, Social Exclusion and Income Inequality
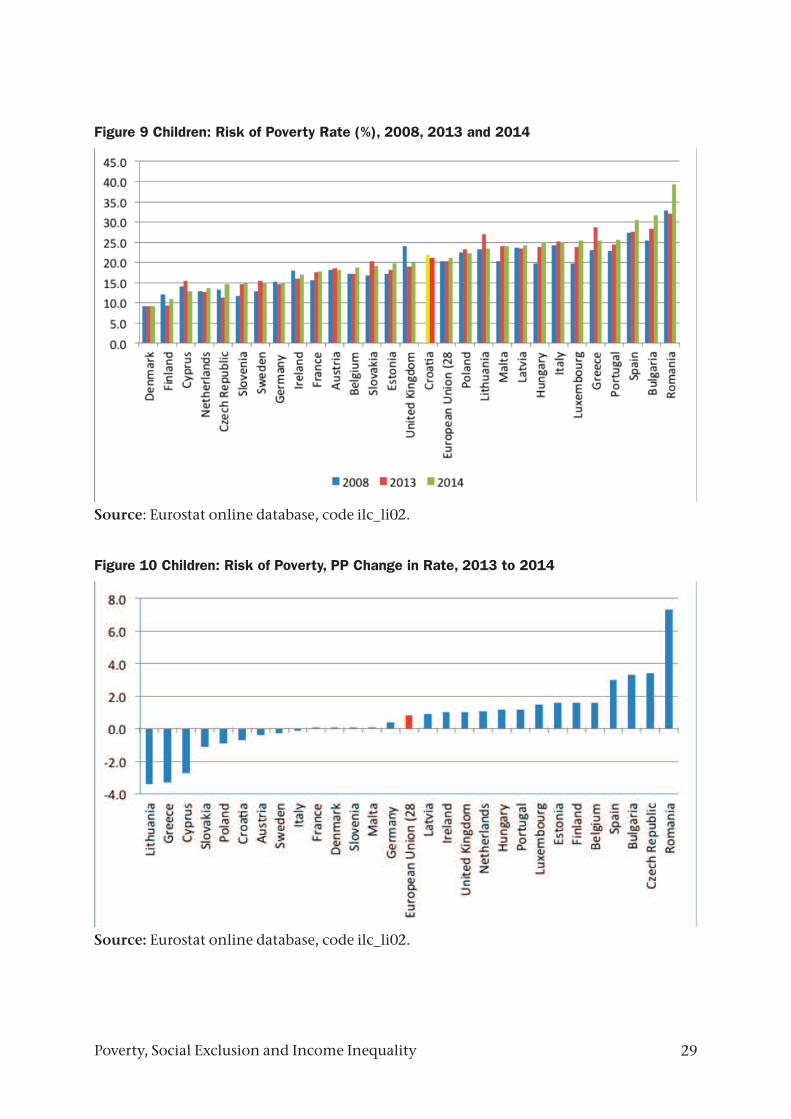
Figure 9 Children: Risk of Poverty Rate (%), 2008, 2013 and 2014
Source: Eurostat online database, code ilc_li02.
Figure 10 Children: Risk of Poverty, PP Change in Rate, 2013 to 2014
Source: Eurostat online database, code ilc_li02.
29Poverty, Social Exclusion and Income Inequality
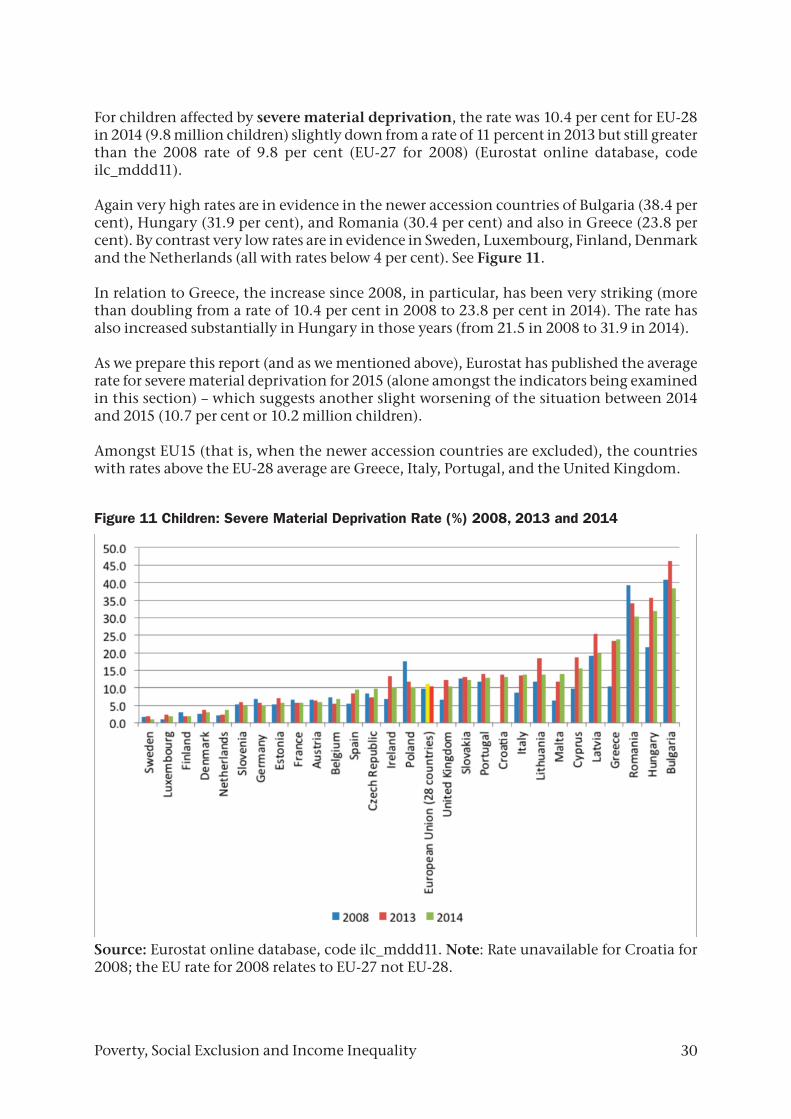
For children affected by severe material deprivation, the rate was 10.4 per cent for EU-28in 2014 (9.8 million children) slightly down from a rate of 11 percent in 2013 but still greaterthan the 2008 rate of 9.8 per cent (EU-27 for 2008) (Eurostat online database, codeilc_mddd11).
Again very high rates are in evidence in the newer accession countries of Bulgaria (38.4 percent), Hungary (31.9 per cent), and Romania (30.4 per cent) and also in Greece (23.8 percent). By contrast very low rates are in evidence in Sweden, Luxembourg, Finland, Denmarkand the Netherlands (all with rates below 4 per cent). See Figure 11.
In relation to Greece, the increase since 2008, in particular, has been very striking (morethan doubling from a rate of 10.4 per cent in 2008 to 23.8 per cent in 2014). The rate hasalso increased substantially in Hungary in those years (from 21.5 in 2008 to 31.9 in 2014).
As we prepare this report (and as we mentioned above), Eurostat has published the averagerate for severe material deprivation for 2015 (alone amongst the indicators being examinedin this section) – which suggests another slight worsening of the situation between 2014and 2015 (10.7 per cent or 10.2 million children).
Amongst EU15 (that is, when the newer accession countries are excluded), the countrieswith rates above the EU-28 average are Greece, Italy, Portugal, and the United Kingdom.
Figure 11 Children: Severe Material Deprivation Rate (%) 2008, 2013 and 2014
Source: Eurostat online database, code ilc_mddd11. Note: Rate unavailable for Croatia for2008; the EU rate for 2008 relates to EU-27 not EU-28.
30Poverty, Social Exclusion and Income Inequality
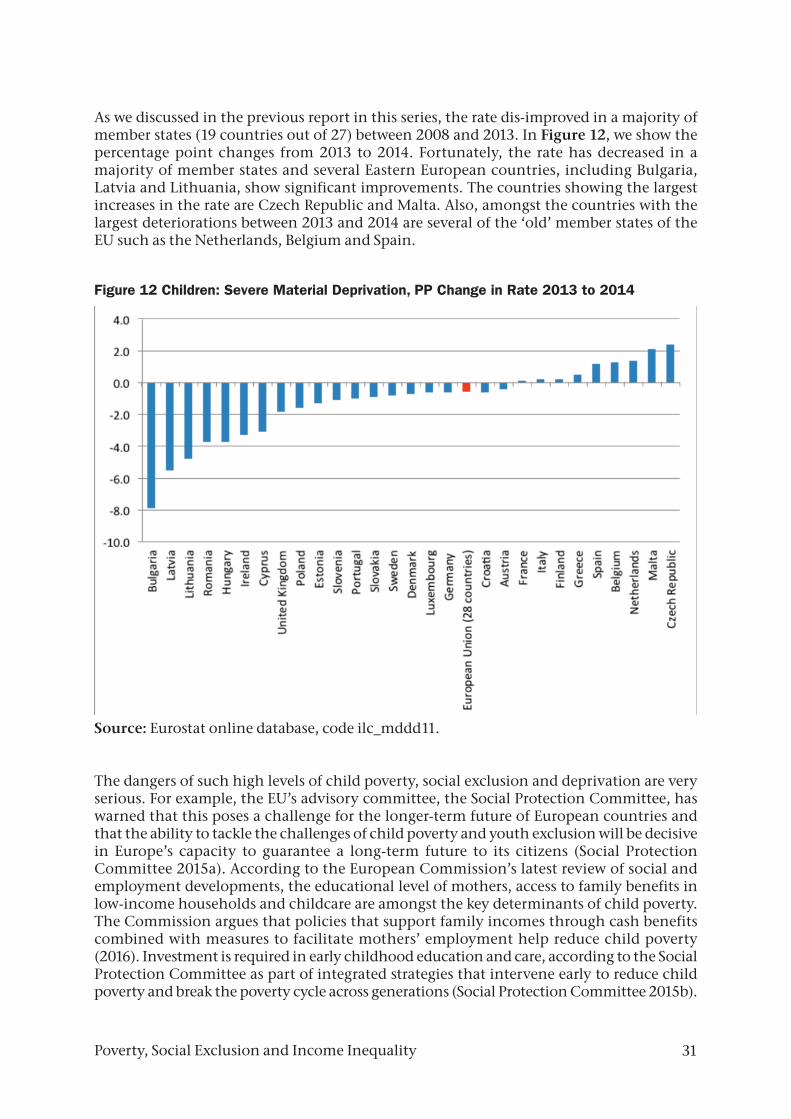
As we discussed in the previous report in this series, the rate dis-improved in a majority ofmember states (19 countries out of 27) between 2008 and 2013. In Figure 12, we show thepercentage point changes from 2013 to 2014. Fortunately, the rate has decreased in amajority of member states and several Eastern European countries, including Bulgaria,Latvia and Lithuania, show significant improvements. The countries showing the largestincreases in the rate are Czech Republic and Malta. Also, amongst the countries with thelargest deteriorations between 2013 and 2014 are several of the ‘old’ member states of theEU such as the Netherlands, Belgium and Spain.
Figure 12 Children: Severe Material Deprivation, PP Change in Rate 2013 to 2014
Source: Eurostat online database, code ilc_mddd11.
The dangers of such high levels of child poverty, social exclusion and deprivation are veryserious. For example, the EU’s advisory committee, the Social Protection Committee, haswarned that this poses a challenge for the longer-term future of European countries andthat the ability to tackle the challenges of child poverty and youth exclusion will be decisivein Europe’s capacity to guarantee a long-term future to its citizens (Social ProtectionCommittee 2015a). According to the European Commission’s latest review of social andemployment developments, the educational level of mothers, access to family benefits inlow-income households and childcare are amongst the key determinants of child poverty.The Commission argues that policies that support family incomes through cash benefitscombined with measures to facilitate mothers’ employment help reduce child poverty(2016). Investment is required in early childhood education and care, according to the SocialProtection Committee as part of integrated strategies that intervene early to reduce childpoverty and break the poverty cycle across generations (Social Protection Committee 2015b).
31Poverty, Social Exclusion and Income Inequality
It is also argued that a dynamic perspective on poverty (that is, experience of poverty overtime) underlines the key role of proactive policy measures, like social investment, orpreventative social protection and services, whose results are only visible in the long runand, unfortunately, are often not prioritised (Vaalavuo 2015).
We mentioned above that more attention is beginning to be paid to measures of povertythat examine the persistence of poverty over time and issues around entering and exitingfrom poverty. A working paper from 2015 suggests that there is a great deal of variation inthe experience of poverty within and across countries – variation in the duration of poverty,and across age groups and countries. It is not possible to examine these measures in thisreport in any detail, but it may be worth noting that in some countries (the Netherlands,Belgium, Portugal and Romania) it is children that face a higher risk of long-term poverty,while in other countries (Slovenia, Finland and Cyprus) older people are more at risk(Vaalavuo 2015).
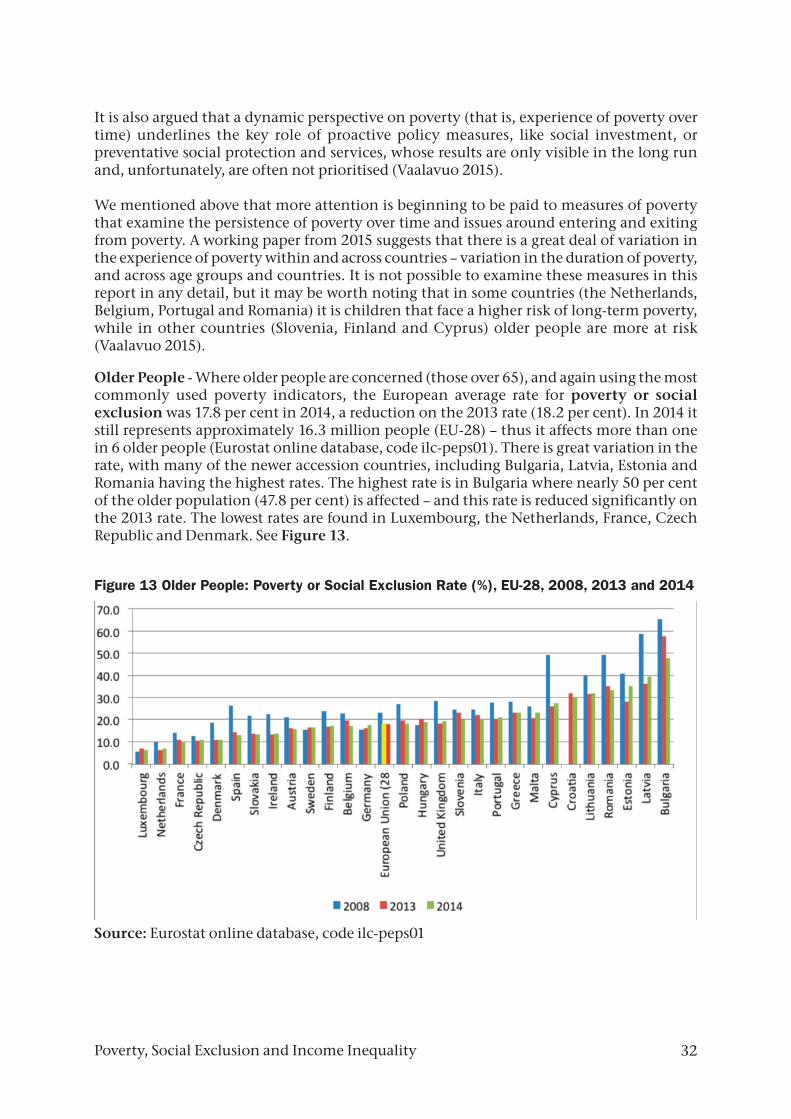
Older People -Where older people are concerned (those over 65), and again using the mostcommonly used poverty indicators, the European average rate for poverty or socialexclusion was 17.8 per cent in 2014, a reduction on the 2013 rate (18.2 per cent). In 2014 itstill represents approximately 16.3 million people (EU-28) – thus it affects more than onein 6 older people (Eurostat online database, code ilc-peps01). There is great variation in therate, with many of the newer accession countries, including Bulgaria, Latvia, Estonia andRomania having the highest rates. The highest rate is in Bulgaria where nearly 50 per centof the older population (47.8 per cent) is affected – and this rate is reduced significantly onthe 2013 rate. The lowest rates are found in Luxembourg, the Netherlands, France, CzechRepublic and Denmark. See Figure 13.
Figure 13 Older People: Poverty or Social Exclusion Rate (%), EU-28, 2008, 2013 and 2014
Source: Eurostat online database, code ilc-peps01
32Poverty, Social Exclusion and Income Inequality

When we look at the at risk of poverty rate, it was nearly 14 per cent (13.8 per cent) forpeople over 65 in EU-28 in 2014 and this rate has fallen from 2008 when it was 19 per centEurostat ilc_li02). It affects 12.6 million people. There has been no change in the ratebetween 2013 and 2014. It is also important to note, as the EU Social Protection Committeeargues generally in relation to pensions, that apparent improvements relative to poverty inrecent times be seen in relation to declines in the poverty thresholds rather than asimprovements in the economic situation of people aged 65+ in real terms (2012a, p.20).
There is a significant gender difference in this area with the rate considerably higher forwomen (15.2 per cent in 2014) than men (11.2 per cent in 2014). Because women live longerthan men, this means that almost twice the number of older women are affected than oldermen (4.5 million men as opposed to 8.1 million women in 2014)
The highest rates occurred in 2014 in some of the newer accession countries of Estonia,Latvia, Croatia, and Bulgaria; while the lowest rates were seen in Hungary, the Netherlands,Slovakia and Luxembourg (Eurostat online database ilc_li02).
The average severe material deprivation rate for this age group was 6.2 per centrepresenting 5.7 million people (EU-28) in 2014 (Eurostat online database, codeilc_mddd11). The rate showed a slight improvement between 2013 and 2014. Again the rateis higher for older women than older men, and because women live longer than men, thismeans that much higher numbers of older women are affected (1.9 million men as opposedto 3.7 women in 2014).
As we prepare this report (and as we mentioned above), Eurostat has published the averagerate for severe material deprivation for 2015 (alone amongst the indicators being examinedin this section) – which suggests another slight worsening of the situation between 2014and 2015 (6.4 per cent representing 5.9million older people).
There is great variation in the levels of this form of deprivation across Europe, withapproximately 40 percentage points difference between the country with the highest rate,Bulgaria, and those with the lowest, Luxembourg and Sweden. Again some of the neweraccession states tend to have the highest rates such as Bulgaria (40.3 per cent), Romania(24.8 per cent) and Latvia (22 per cent). Countries with the lowest rates include Sweden (0.2per cent), the Netherlands (0.8 per cent), Luxembourg (0.1 per cent), Sweden (0.2 per cent)and Denmark (1 per cent). See Figure 14.
Dis-improvements in this rate have occurred in 8 member states between 2013 and 2014,most notably in Greece (1.8 percentage points) and Malta (1 percentage point).Improvements in the rate have also occurred especially notably in Bulgaria (-10.4 percentagepoints) See Figure 15.
33Poverty, Social Exclusion and Income Inequality

Figure 14 Older People: Severe Material Deprivation Rate (%), 2008, 2013 and 2014
Source: Eurostat online database, code ilc_mddd11. Note: Rate unavailable for Croatia for2008; the EU rate for 2008 relates to EU-27 not EU-28.
Figure 15 Older People: Severe Material Deprivation, PP Change in rate, 2013 to 2014
Source: Eurostat online database, code ilc_mddd11
Working Poor – In 2014, 9.6 per cent of employed people (aged 18-64) were living underthe poverty threshold (EU-28), a slight dis-improvement on the rate for 2013 (9 per cent)(Eurostat Online database, code ilc_iw01). The highest rates occurred in Romania (19.5 percent), Greece (13.2 per cent), Spain (12.6 per cent), Estonia (11.8 per cent) and Luxembourgand Italy (both 11.1 per cent). The lowest rates occurred in Czech Republic, Finland,Denmark and Belgium. See Figure 16.
34Poverty, Social Exclusion and Income Inequality
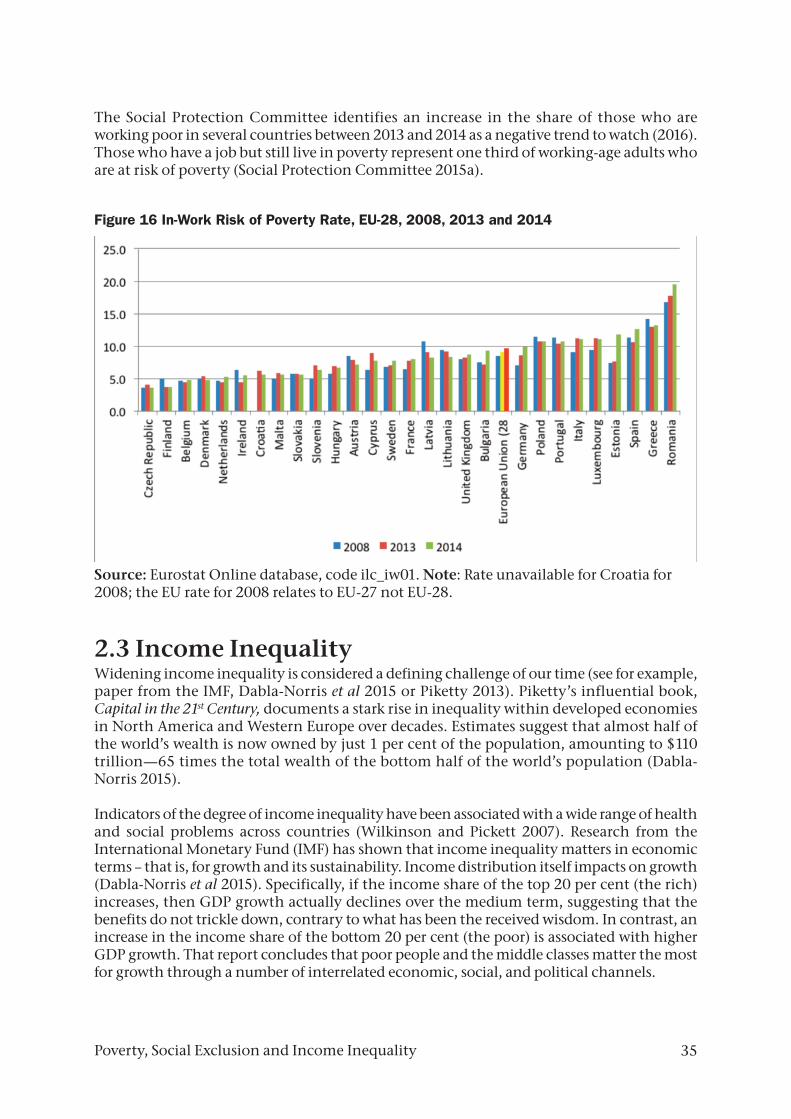
The Social Protection Committee identifies an increase in the share of those who areworking poor in several countries between 2013 and 2014 as a negative trend to watch (2016).Those who have a job but still live in poverty represent one third of working-age adults whoare at risk of poverty (Social Protection Committee 2015a).
Figure 16 In-Work Risk of Poverty Rate, EU-28, 2008, 2013 and 2014
Source: Eurostat Online database, code ilc_iw01. Note: Rate unavailable for Croatia for2008; the EU rate for 2008 relates to EU-27 not EU-28.
2.3 Income InequalityWidening income inequality is considered a defining challenge of our time (see for example,paper from the IMF, Dabla-Norris et al 2015 or Piketty 2013). Piketty’s influential book,Capital in the 21st Century, documents a stark rise in inequality within developed economiesin North America and Western Europe over decades. Estimates suggest that almost half ofthe world’s wealth is now owned by just 1 per cent of the population, amounting to $110trillion—65 times the total wealth of the bottom half of the world’s population (Dabla-Norris 2015).
Indicators of the degree of income inequality have been associated with a wide range of healthand social problems across countries (Wilkinson and Pickett 2007). Research from theInternational Monetary Fund (IMF) has shown that income inequality matters in economicterms – that is, for growth and its sustainability. Income distribution itself impacts on growth(Dabla-Norris et al 2015). Specifically, if the income share of the top 20 per cent (the rich)increases, then GDP growth actually declines over the medium term, suggesting that thebenefits do not trickle down, contrary to what has been the received wisdom. In contrast, anincrease in the income share of the bottom 20 per cent (the poor) is associated with higherGDP growth. That report concludes that poor people and the middle classes matter the mostfor growth through a number of interrelated economic, social, and political channels.
35Poverty, Social Exclusion and Income Inequality

There is clear evidence that income inequality has increased markedly since the mid-1980sin Europe, and that the recent crisis as well as fiscal consolidation programmes could worsenthe situation (European Parliament 2014). Inequality continues to increase even aseconomies recover from the crisis, particularly in countries hit hardest by the crisis such asSpain, Ireland, Greece, and Estonia (European Parliament 2014). The drop in income duringthe recession has been larger for individuals at the bottom than for those at the top of thedistribution (OECD 2014; European Parliament 2014).Thus the crisis has affected differentsections of the population in different ways and income inequality is growing both acrossand within many member states. Growing income inequality is especially the picture insouthern Europe and in several non-central countries, often in the states that have had thegreatest increases in unemployment and sometimes those most affected by fiscalconsolidation (Social Protection Committee 2015a).
One measure of income inequality is the GINI coefficient, an index ranging from 0 to 100where 0 represents a perfectly equal distribution of income and 100 represents a perfectlyunequal distribution. See Glossary. The higher the GINI coefficient, the greater the incomeinequality. According to the GINI coefficient indicator, this measure shows a very slightincrease between 2013 and 2014 (from 30.5 to 30.9) within EU-28. At 31, the rate is slightlyhigher in the Eurozone (19 countries) and has increased there slightly between 2008 (whenit was 30.5) and 2014 (Eurostat online database, code: ilc_di12).
The countries with the greatest income inequality (according to the GINI coefficient) in2014 were Estonia, Latvia, Bulgaria, Lithuania, Cyprus, Romania, as well as Spain, Portugal,Greece, Italy and the U.K.. Those with the lowest included Slovenia, Czech Republic,Sweden, Finland and Belgium. Those showing the greatest increases in the rate between2013 and 2014 were Estonia and Cyprus (both with increases greater than 2 points) as wellas Slovakia, U.K, Netherlands, Spain and Germany (with increases of 1 point or more).
Another measure of income inequality is the income quintile share ratio or the S80/S20ratio, which is a measure of the inequality of income distribution. It is calculated as theratio of total income received by the 20 per cent of the population with the highest income(the top quintile) to that received by the 20 per cent of the population with the lowestincome (the bottom quintile). While on average the S80/20 ratio remained stable between2008 and 2013, what is noted is a wide dispersion and growing divergence in inequalitybetween member states (European Commission 2013). As we reported in the previous reportin this series, between 2008 and 2013, the picture was mixed, with the rate increasing inmany countries and improving in others, especially in some countries with traditionallyhigh rates (such as Latvia, Portugal and Romania), but the high rates in these and in othercountries continue to be of concern (European Commission 2013).
There were wide inequalities in the distribution of income in 2014: the top 20 per cent of thepopulation (with the highest equivalised disposable income) received 5.2 times as muchincome as the bottom 20 per cent (with the lowest equivalised disposable income). The rateincreased in 16 member states and decreased in 5 (staying static in the remaining 7 countries)between 2013 and 2014. This ratio varied considerably across the EU Member States, from 3.5in the Czech Republic and 3.6 in Finland to more than 6.0 in Lithuania, Portugal, Latvia,Greece, Estonia, Spain and Bulgaria, peaking at 7.2 in Romania. See Figure 17.
The S80/20 ratio suggests that income inequality is particularly high in the southern andeastern European countries (Eurostat online database, code ilc_di11). The results of analysisusing the GINI coefficient and using this indicator (S80/20) show that both indicatorssuggest a somewhat similar list of countries that can be considered most unequal.
36Poverty, Social Exclusion and Income Inequality
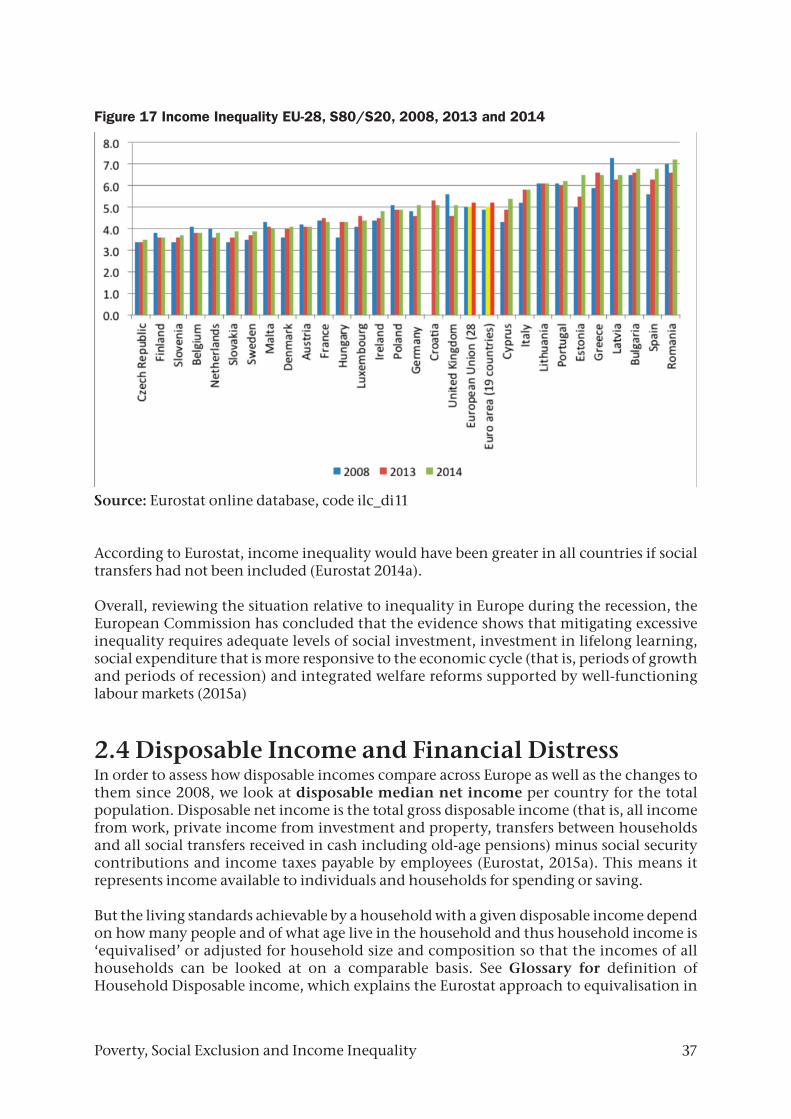
Figure 17 Income Inequality EU-28, S80/S20, 2008, 2013 and 2014
Source: Eurostat online database, code ilc_di11
According to Eurostat, income inequality would have been greater in all countries if socialtransfers had not been included (Eurostat 2014a).
Overall, reviewing the situation relative to inequality in Europe during the recession, theEuropean Commission has concluded that the evidence shows that mitigating excessiveinequality requires adequate levels of social investment, investment in lifelong learning,social expenditure that is more responsive to the economic cycle (that is, periods of growthand periods of recession) and integrated welfare reforms supported by well-func tioninglabour markets (2015a)
2.4 Disposable Income and Financial DistressIn order to assess how disposable incomes compare across Europe as well as the changes tothem since 2008, we look at disposable median net income per country for the totalpopulation. Disposable net income is the total gross disposable income (that is, all incomefrom work, private income from investment and property, transfers between householdsand all social transfers received in cash including old-age pensions) minus social securitycontributions and income taxes payable by employees (Eurostat, 2015a). This means itrepresents income available to individuals and households for spending or saving.
But the living standards achievable by a household with a given disposable income dependon how many people and of what age live in the household and thus household income is‘equivalised’ or adjusted for household size and composition so that the incomes of allhouseholds can be looked at on a comparable basis. See Glossary for definition ofHousehold Disposable income, which explains the Eurostat approach to equivalisation in
37Poverty, Social Exclusion and Income Inequality

more detail. It is to be noted that national statistical agencies may take different approachesto equivalisation and thus publish different levels6. However, in this report, in order tofacilitate comparison across countries, we are using the Eurostat calculations.
We will look at the median income value, which involves dividing a population into twoequal-sized groups: exactly 50 per cent of people fall below that value and 50 per cent areabove it, because the average or mean household disposable income can be skewed by veryhigh or very low incomes of a few having a disproportionate impact.
See Figure 18, which shows that in 2014 the highest levels occurred in Luxembourg,Denmark, Sweden, Finland and Austria, the lowest in Romania, Bulgaria, Hungary,Lithuania, Latvia, and other newer accession members. There is also great variation in thelevels between the highest countries and the lowest. For example, the 2014 figure in the toptwo countries, Luxembourg and Denmark, was €34,320 and €27,861, respectively; that inthe countries with the lowest levels, Romania and Bulgaria, were €2,195 and €3,311,respectively. Thus half of the people of these countries are considered to have disposableincomes above those amounts and half below.
Figure 18 Median Disposable Annual Income (€): EU28, 2008, 2013 and 2014
Source: Eurostat online database ilc_di03 (source: SILC) Earlier figure unavailable forCroatia
38Poverty, Social Exclusion and Income Inequality
6 Equivalence scales are used to calculate the equivalised household size in a household. For example, theequivalence scale used in Ireland attributes a weight of 1 to the first adult, 0.66 to each subsequent adult(aged 14+ ) living in the household and 0.33 to each child aged less than 14. The weights for each householdare then summed to calculate the equivalised household size. Disposable household income is divided bythe equivalised household size to calculate equivalised disposable income for each person, which essentiallyis an approximate measure of how much of the income can be attributed to each member of the household.This equivalised income is then applied to each member of the household. Eurostat uses a differentequivalence scale attributing a weight of 1 to the first adult, 0.5 to each subsequent adult and 0.3 to eachchild – see Glossary.
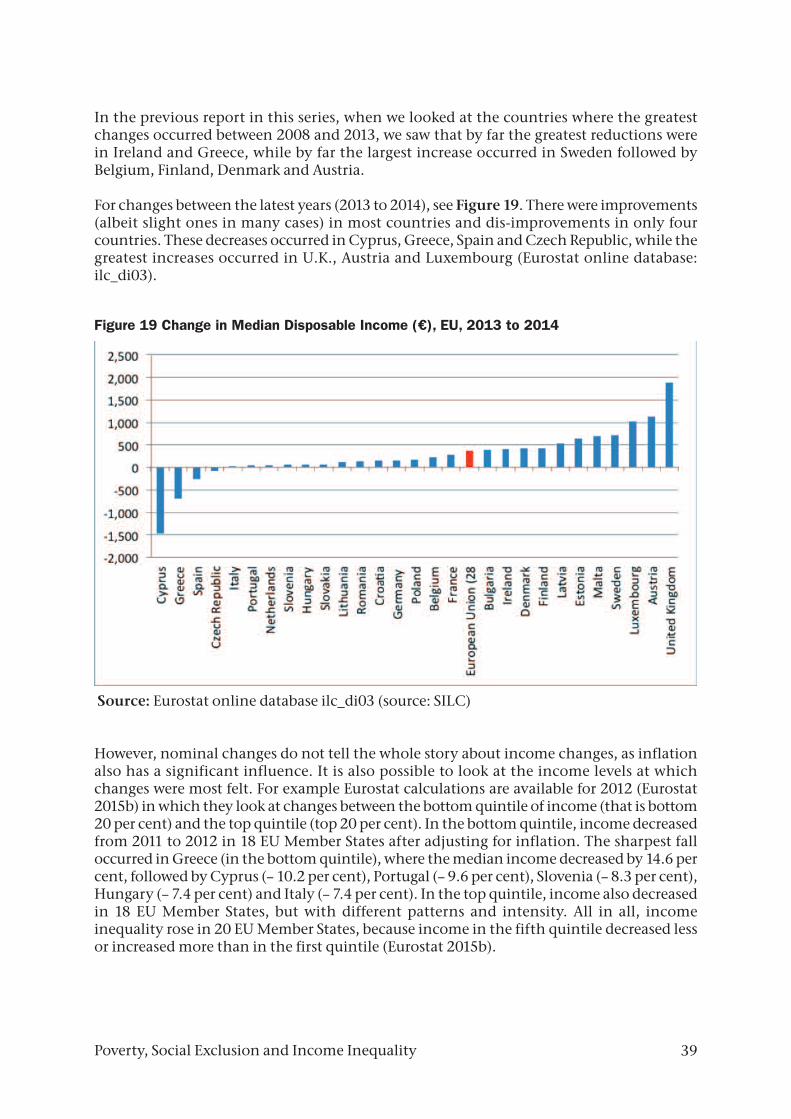
In the previous report in this series, when we looked at the countries where the greatestchanges occurred between 2008 and 2013, we saw that by far the greatest reductions werein Ireland and Greece, while by far the largest increase occurred in Sweden followed byBelgium, Finland, Denmark and Austria.
For changes between the latest years (2013 to 2014), see Figure 19. There were improvements(albeit slight ones in many cases) in most countries and dis-improvements in only fourcountries. These decreases occurred in Cyprus, Greece, Spain and Czech Republic, while thegreatest increases occurred in U.K., Austria and Luxembourg (Eurostat online database:ilc_di03).
Figure 19 Change in Median Disposable Income (€), EU, 2013 to 2014
Source: Eurostat online database ilc_di03 (source: SILC)
However, nominal changes do not tell the whole story about income changes, as inflationalso has a significant influence. It is also possible to look at the income levels at whichchanges were most felt. For example Eurostat calculations are available for 2012 (Eurostat2015b) in which they look at changes between the bottom quintile of income (that is bottom20 per cent) and the top quintile (top 20 per cent). In the bottom quintile, income decreasedfrom 2011 to 2012 in 18 EU Member States after adjusting for inflation. The sharpest falloccurred in Greece (in the bottom quintile), where the median income decreased by 14.6 percent, followed by Cyprus (– 10.2 per cent), Portugal (– 9.6 per cent), Slovenia (– 8.3 per cent),Hungary (– 7.4 per cent) and Italy (– 7.4 per cent). In the top quintile, income also decreasedin 18 EU Member States, but with different patterns and intensity. All in all, incomeinequality rose in 20 EU Member States, because income in the fifth quintile decreased lessor increased more than in the first quintile (Eurostat 2015b).
39Poverty, Social Exclusion and Income Inequality

More recently, the European Commission reports real growth of 2 per cent in grossdisposable household income during the year to the end of 2015 (‘real’ means that nominalfigures are deflated using the consumer price index) with a somewhat lower level in the EuroArea (European Commission 2016).7
The OECD has started to publish indicators, which it calls a dashboard of householdstatistics, designed to highlight the economic activity of households across its membercountries. Overall they conclude that in most OECD countries, GDP dropped sharply at thebeginning of the financial crisis, but real household income showed more resilience due toboth automatic stabilisers (which might be things like welfare or pension payments) andsupportive fiscal policies. However, patterns diverge across countries as purchasing powerstill remained below pre-2007 levels in a number of countries, including Austria, Greece,Ireland, Italy, Portugal and Spain (referring to end 2015) (OECD 2015b). Since 2010 GDP percapita growth has outpaced household income growth in most OECD countries.
Financial distress of households (defined as the need to draw on savings or to run into debtto cover current expenditures) is still running at high levels relative to the previous decade(European Commission 2016). It reached a historically high level of 17 per cent in autumn2013 and since then it has declined to 15 per cent, according to the European Commission’ssummer 2015 quarterly review. Both the share of the households reporting running intodebt and the share of those having to draw on their savings have declined, particularly theshare of those running into debt. However, in the majority of member states, overall levelsof financial distress remain higher than in 2007, in particular in Cyprus, France, Italy andSpain, and it varies considerably between countries ranging from around 3.5 per cent inGermany to more than 25 per cent in Greece, France and Italy. Around 25 per cent of adultsin low-income households are in financial distress (European Commission 2016).
Compared to 2007, financial distress for the poorest households is higher in around half ofmember states. There is a big range amongst countries: financial distress is much higher forlower-income households in some countries than others, affecting (in 2016) 10 per cent ofhouseholds in the poorest quartile in Germany at one end of the scale, compared with 40per cent of the poorest quartile in Spain (European Commission 2016). It also affects over30 per cent of low income households in France, Italy, Slovakia and Croatia.
See Figure 20, where rates for the first quarters of 2015 and 2016 are shown for the lowestincome households as well as an average for 2007.
For low income households (that is, the lowest quartiles or lowest 25 per cent), financialdistress has remained at historically high levels for the past two and a half years. TheCommission considers that there has not yet been a more permanent easing in theirfinancial distress, notwithstanding that it appears to have eased in the first quarter of 2016(European Commission 2016). In the first half of 2016, about 10 per cent of adults in low-income households ran into debt and nearly a further 15 per cent drew on savings to covercurrent expenditure and the gap between low-income and high income households haswidened (European Commission 2016). (The levels for all households were much lower –4.5 per cent and 10 per cent, respectively).
40Poverty, Social Exclusion and Income Inequality
7 This relates to member states for which quarterly data are available
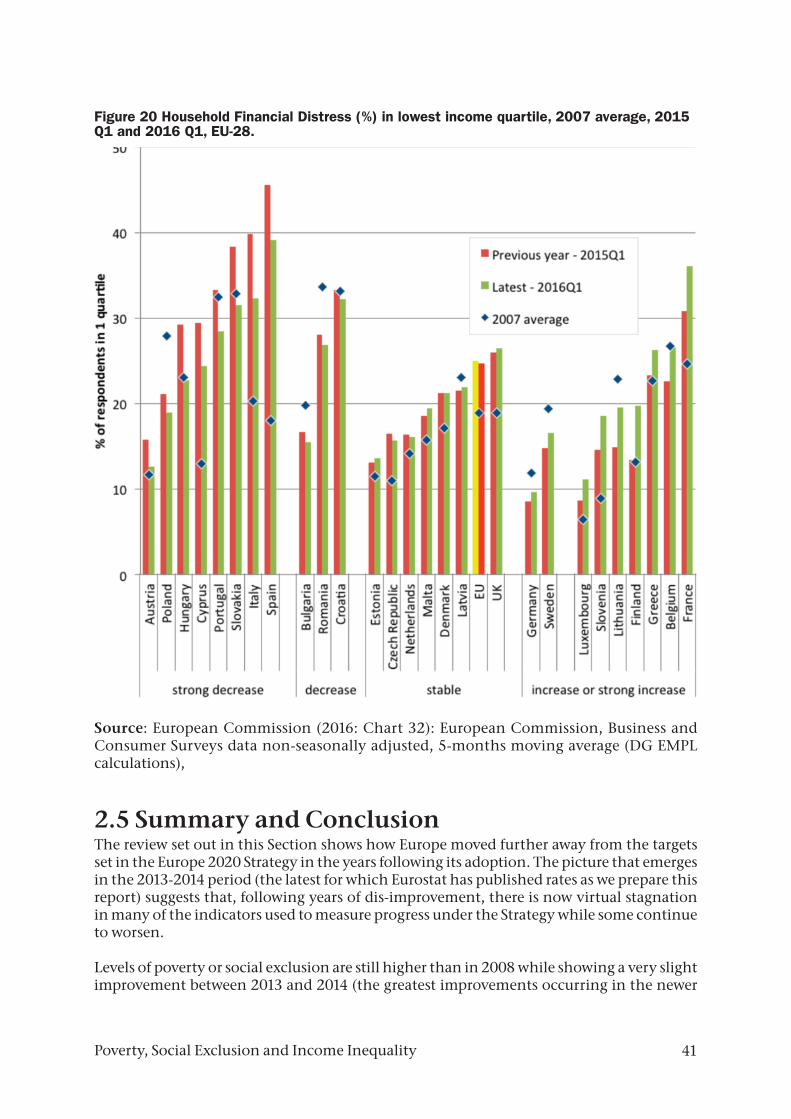
Figure 20 Household Financial Distress (%) in lowest income quartile, 2007 average, 2015Q1 and 2016 Q1, EU-28.
Source: European Commission (2016: Chart 32): European Commission, Business andConsumer Surveys data non-seasonally adjusted, 5-months moving average (DG EMPLcalculations),
2.5 Summary and ConclusionThe review set out in this Section shows how Europe moved further away from the targetsset in the Europe 2020 Strategy in the years following its adoption. The picture that emergesin the 2013-2014 period (the latest for which Eurostat has published rates as we prepare thisreport) suggests that, following years of dis-improvement, there is now virtual stagnationin many of the indicators used to measure progress under the Strategy while some continueto worsen.
Levels of poverty or social exclusion are still higher than in 2008 while showing a very slightimprovement between 2013 and 2014 (the greatest improvements occurring in the newer
41Poverty, Social Exclusion and Income Inequality
accession states of Bulgaria, Lithuania, Hungary and Latvia), In 2014 the numbers affectedstill amounted to over 122 million people (EU-28) or 24.2 per cent of the population of theEU (that is, almost 1 in 4 people). There are very great divergences between the countrieswith the highest rates (Bulgaria and Romania having rates of approximately 40 per cent)and those with the lowest rates (Czech Republic and the Netherlands with rates of 15 and16.5 per cent, respectively).
Amongst the groups most affected are the unemployed, while amongst household types,single parents have significantly higher rates.
It is notable that those countries identified by the European Social Policy Network as havinga well-established approach to social investment tend to do well at protecting theirpopulations from poverty or social exclusion relative to other countries with a less welldeveloped social investment approach.
In 2014, over 86 million people in Europe were experiencing income poverty (measured bythe at risk of poverty indicator – 60 per cent threshold), a slight increase on the 2013 level.In six member states one fifth or more of the population was at risk of poverty. There is anindication that the depth of poverty worsened between 2013 and 2014 with an increase inthe rate of risk of poverty at the 40 per cent threshold (that is, those with an income at orbelow 40 per cent of the national median equivalised income). Those living at this low levelamounted to more than 31 million people in 2014.
When we look at the severe material deprivation indicator, there is great divergence acrosscountries, with particularly high rates amongst the newer accession countries. However,between 2013 and 2014 the rates rose (albeit very slightly in some cases) in countries withinEU-15 – that is, ‘old’ members of the union. The greatest deterioration between 2013 and2014 in this rate occurred in Greece.
Children (that is, under 18s) were strongly affected by the economic crisis and their positionis highlighted by the Social Protection Committee as one of the areas where there has beengreatest deterioration since 2008 – something that has long-term consequences for thepeople and families concerned as well as for the EU as a whole. Children in poverty or socialexclusion amounted over 26 million in 2014 (which is well over a quarter of all children).There is great divergence in the rates across the EU and the lowest rates are in the Nordiccountries of Denmark, Finland and Sweden. Between 2013 and 2014, the greatest increaseoccurred in Spain, but Czech Republic and Finland, countries with relatively low overallrates, also had increases of a similar magnitude. When we look at income poverty, the at riskof poverty rate in children rose between 2013 and 2014, and approximately one fifth ofEurope’s children were affected in 2014 (that is, living below the 60 per cent threshold ofmedian income in their countries). When we look at severe material deprivation (that is,lacking certain key resources) approximately 10 per cent of children were affected in 2014.
Where older people are concerned (those over 65), about one in 6 was affected by povertyor social exclusion in 2014, representing approximately16.3 million people (EU-28). Betweendifferent countries, there is great variation in the rates, and this is also true in respect ofsevere material deprivation amongst this group. When we look at income poverty in 2014(or the at risk of poverty rate, 60 per cent threshold), the highest rates occurred in some ofthe newer accession countries. Where severe material deprivation is concerned, there is anapproximately 40 percentage points difference between the country with the highest rate,
42Poverty, Social Exclusion and Income Inequality

Bulgaria (notwithstanding a recent, significant decrease in the rate), and those with thelowest rates, Luxembourg and Sweden. Rates of both income poverty and severe materialdeprivation are considerably higher for older women than older men and, because womentend to live longer than men, this means that very much larger numbers of women areaffected.
The rate for working poor – those who have a job but still live in poverty - increased between2013 and 2014 and the Social Protection Committee has identified this as a negative trendto watch (2016).
When income inequality is examined, there is concern about the wide dispersion andgrowing divergence in inequality between member states (European Commission 2013).The income inequality rate (S80/20 indicator) increased in 16 member states and decreasedin 5 (staying static in the remaining 7 countries) between 2013 and 2014.
Financial distress of households (defined as the need to draw on savings or to run into debtto cover current expenditures) is still running at high levels despite some easing of thesituation in recent times. Comparing the situation in 2016 to 2007, financial distress for thepoorest households is higher in around half of member states. Around 25 per cent of adultsin low-income households are in financial distress (European Commission 2016). There is abig range amongst countries: financial distress is much lower for lower-income householdsin some countries (such as the central European countries of Germany, Luxembourg andAustria) than others (such as Spain France, Italy, Slovakia and Croatia).
Overall there are very great differences in the social situation across countries. Somecountries have been more affected by the economic crisis than others, and some countrieshave been able to benefit more from recent economic improvements than others. Overallthe social indicators suggest stagnation of the positon for very many people living in Europe,with dis-improvement for some groups. Any recovery has yet to be felt more generally acrosssocial groups.
43Poverty, Social Exclusion and Income Inequality

44
3.
EMPLOYMENT ANDUNEMPLOYMENT
Social Justice Ireland includes the right to meaningful work amongst its core rights thatneed to guide policy-making in the future (see Section 1, above).
3.1 EmploymentThe Europe 2020 strategy set a headline target that 75 per cent of 20-64 year-olds would beemployed by 2020. Figure 21 shows the drastic job losses in Europe as a whole following2008 – a picture that has improved only since 2013. The average rate in 2015 was 70.1 percent and it had been 70.3 per cent in 2008. The rate in the Euro area is slightly lower (69 percent in 2015) (Eurostat t2020_10).
Thus Europe’s employment levels are now again approaching 2008 levels but there is still agap from achieving the 75 per cent employment target set in 2010.
Figure 21 Employment in Europe (%), Ages 20-64, EU-28, 2008-2015
Source: Eurostat online database, code t2020_10
Employment and Unemployment
E U R O P E A N R E S E A R C H S E R I E S
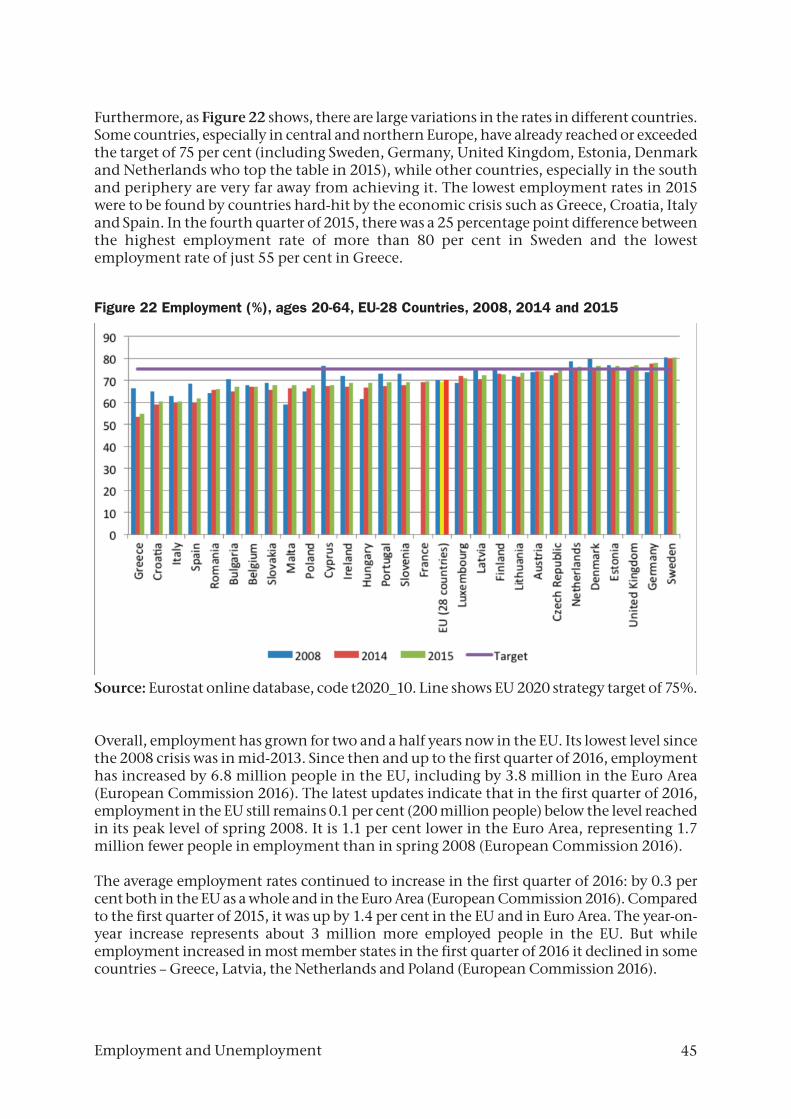
Furthermore, as Figure 22 shows, there are large variations in the rates in different countries.Some countries, especially in central and northern Europe, have already reached or exceededthe target of 75 per cent (including Sweden, Germany, United Kingdom, Estonia, Denmarkand Netherlands who top the table in 2015), while other countries, especially in the southand periphery are very far away from achieving it. The lowest employment rates in 2015were to be found by countries hard-hit by the economic crisis such as Greece, Croatia, Italyand Spain. In the fourth quarter of 2015, there was a 25 percentage point difference betweenthe highest employment rate of more than 80 per cent in Sweden and the lowestemployment rate of just 55 per cent in Greece.
Figure 22 Employment (%), ages 20-64, EU-28 Countries, 2008, 2014 and 2015
Source: Eurostat online database, code t2020_10. Line shows EU 2020 strategy target of 75%.
Overall, employment has grown for two and a half years now in the EU. Its lowest level sincethe 2008 crisis was in mid-2013. Since then and up to the first quarter of 2016, employmenthas increased by 6.8 million people in the EU, including by 3.8 million in the Euro Area(European Commission 2016). The latest updates indicate that in the first quarter of 2016,employment in the EU still remains 0.1 per cent (200 million people) below the level reachedin its peak level of spring 2008. It is 1.1 per cent lower in the Euro Area, representing 1.7million fewer people in employment than in spring 2008 (European Commission 2016).
The average employment rates continued to increase in the first quarter of 2016: by 0.3 percent both in the EU as a whole and in the Euro Area (European Commission 2016). Comparedto the first quarter of 2015, it was up by 1.4 per cent in the EU and in Euro Area. The year-on-year increase represents about 3 million more employed people in the EU. But whileemployment increased in most member states in the first quarter of 2016 it declined in somecountries – Greece, Latvia, the Netherlands and Poland (European Commission 2016).
45Employment and Unemployment

There are also concerns about the way that the employment picture is evolving in recentyears to do with growth in temporary and part-time work and also to do withfalling/stagnating wages. Some issues:
• temporary employment has been growing at a faster rate than permanentemployment for the past two years (European Commission 2016);
• while full-time employment has increased faster than part-time employment since2014, it is still below its 2008 level while part-time employment has increased since2008; (European Commission 2016);
• involuntary part-time accounts for a significant share of part-time work in severalmember states, with implications for income and potentially increasing the risk ofpoverty or social exclusion (European Commission 2016a);
• while economic output is above 2007 levels in a large majority of OECD countries,employment and wage gaps persist especially amongst disadvantaged groups (OECD2015a).
Thus many of the new jobs created recently are temporary or part-time, which raises manyconcerns, including for the robustness of the recovery (European Commission 2015b). Lowpay and in-work poverty were already major policy challenges before the onset of theeconomic crisis, and have become more acute since then as pay levels have fallen orstagnated in many countries (OECD 2015a). In Spain and Cyprus, for example, more than90 per cent of those on temporary work contracts are involuntarily in this kind ofemployment while in Austria this rate is just 8.8 per cent (Schraad-Tischler 2015). Largedifferences exist across the EU: as mentioned, the share of workers with involuntarytemporary contracts is 8.8 per cent in Austria, but at the other end of the scale, it is 94.3 percent in Cyprus (European Commission 2016a); the share of employees moving fromtemporary to permanent employment per year varies from about 10 per cent in France tomore than 60 per cent in Estonia; the share of involuntary part-time workers ranges fromless than 12 per cent in Slovenia, Belgium, Austria and the Netherlands to more than 60 percent in Bulgaria, Greece, Spain, Italy and Cyprus.
A recent report from the International Labour Organization (a tripartite organisationbringing together representatives of governments, employers, and workers) confirms thatdecent work is paramount in the fight to reduce poverty (International Labour Organization2016). The report concludes that without an adequate supply of decent work opportunities,it will be difficult for the working poor to improve their working conditions, acquire a careerand thus lift themselves and their families out of poverty.
The European Commission has noted that some of the Member States that have been mostresilient during the crisis have high levels of employment protection legislation, particularlyGermany, Sweden, the Netherlands and the Czech Republic (2015a). They recently notedthat countries with the combined highest investment in activation measures, train ing andeffective unemployment benefits were those that fared better in the cri sis (EuropeanCommission 2016a).
The international economic and financial crisis has pushed down investment levels withinthe EU by about 15 per cent from their peak in 2007. The persistence of high unemploymentin many member states has caused some experts to argue that the Euro area (alongside Japanand the United States) is facing ‘secular stagnation’, a long-term economic stagnationcharacterised by a shrinking work force, low demand, excess savings and low investments,despite low interest rates and deflationary tendencies (European Parliament 2016).
46Employment and Unemployment
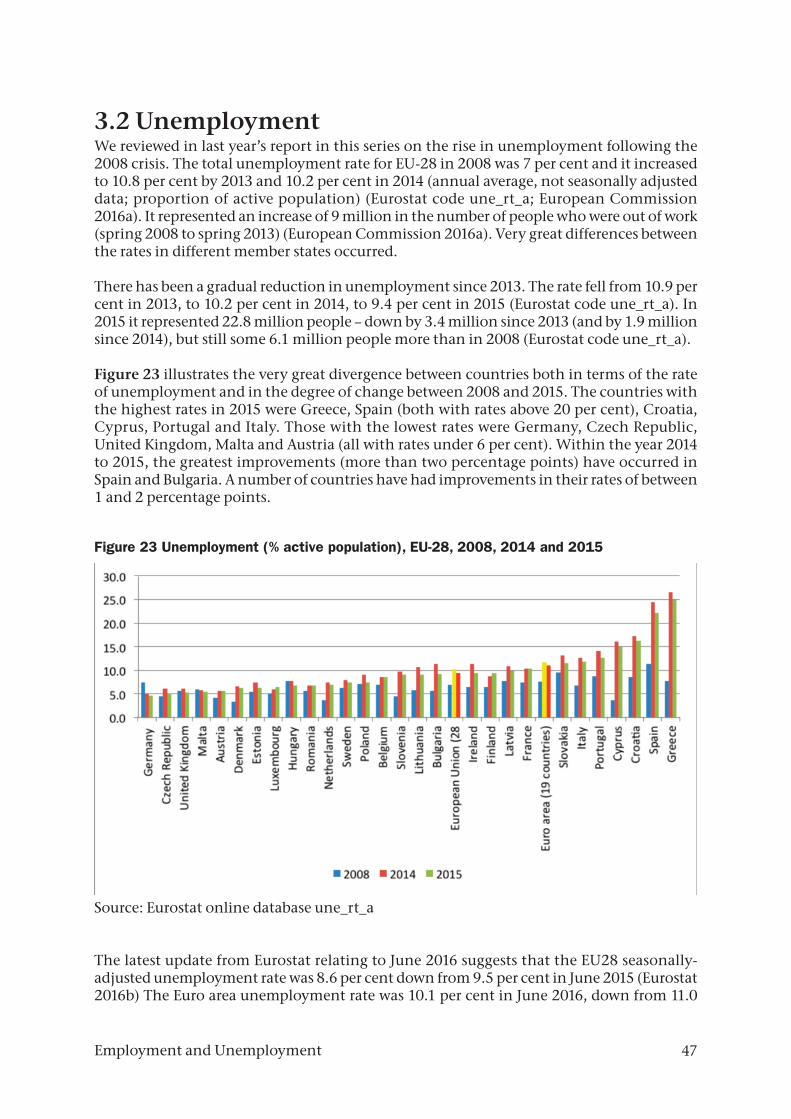
3.2 UnemploymentWe reviewed in last year’s report in this series on the rise in unemployment following the2008 crisis. The total unemployment rate for EU-28 in 2008 was 7 per cent and it increasedto 10.8 per cent by 2013 and 10.2 per cent in 2014 (annual average, not seasonally adjusteddata; proportion of active population) (Eurostat code une_rt_a; European Commission2016a). It represented an increase of 9 million in the number of people who were out of work(spring 2008 to spring 2013) (European Commission 2016a). Very great differences betweenthe rates in different member states occurred.
There has been a gradual reduction in unemployment since 2013. The rate fell from 10.9 percent in 2013, to 10.2 per cent in 2014, to 9.4 per cent in 2015 (Eurostat code une_rt_a). In2015 it represented 22.8 million people – down by 3.4 million since 2013 (and by 1.9 millionsince 2014), but still some 6.1 million people more than in 2008 (Eurostat code une_rt_a).
Figure 23 illustrates the very great divergence between countries both in terms of the rateof unemployment and in the degree of change between 2008 and 2015. The countries withthe highest rates in 2015 were Greece, Spain (both with rates above 20 per cent), Croatia,Cyprus, Portugal and Italy. Those with the lowest rates were Germany, Czech Republic,United Kingdom, Malta and Austria (all with rates under 6 per cent). Within the year 2014to 2015, the greatest improvements (more than two percentage points) have occurred inSpain and Bulgaria. A number of countries have had improvements in their rates of between1 and 2 percentage points.
Figure 23 Unemployment (% active population), EU-28, 2008, 2014 and 2015
Source: Eurostat online database une_rt_a
The latest update from Eurostat relating to June 2016 suggests that the EU28 seasonally-adjusted unemployment rate was 8.6 per cent down from 9.5 per cent in June 2015 (Eurostat2016b) The Euro area unemployment rate was 10.1 per cent in June 2016, down from 11.0
47Employment and Unemployment
per cent in June 2015. Eurostat estimates that 20.986 million people in the EU28, of whom16.269 million were in the euro area, were unemployed in June 2016. Some 4.2 millionyoung people (under 25) were unemployed in the EU28, of whom 2.915 million were in theeuro area, but compared with June 2015, youth unemployment had also decreased (Eurostat2016b).
Among the Member States, the lowest unemployment rates in June 2016 were recorded inMalta (4.0 per cent), the Czech Republic (4.1 per cent) and Germany (4.2 per cent). Highestrates were observed in Greece (23.3 per cent in April 2016) and Spain (19.9 per cent). Thusthere was an almost 20 percentage point difference between the country with the highestunemployment rate (Greece) and that with the lowest (Malta).
There are supplementary indicators used to monitor the evolution of underemployment.As we saw in last year’s report, the number of people available and want ing to work but notlooking for a job (considered to be ‘discouraged workers’) increased between 2008 and 2013.During the year to the end of 2015, there was a modest decrease in three supplementaryindicators8 of 0.4 percentage points (European Commission 2016).
In the last report in this series we reported on how the long-term unemployment rate (thatis, long-term unemployment as a percentage of the total number of active persons in thelabour market) had doubled between 2008 and 2014 at EU level. Long-term unemploymentcontinues to be a major concern. Long-term unemployment (unemployment for 12months or more) has implications in human and social terms and has financial costs andpossible impacts on social cohesion. Long periods of unemployment make being rehiredmore difficult with long-term unemployed workers having about half the chance of findingemployment than short-term unemployed workers (European Commission 2016a). Theirsituation worsened during the crisis and their chances of finding a job worsen the longerthey remain unemployed (European Commission 2016a).
Comparing the situation at the end of 2015 with 2008, only three countries have loweredtheir long-term unemployment rates: Germany (by 1.6 pp), Hungary (by 0.9 pp) and Malta(by 0.6 pp) (European Commission 2016).
While employment has been declining since 2013, long-term unemployment has onlyrecently stopped rising (European Commission 2016a).
There have been improvements in the average long-term unemployment rate from 2014 andthe rate decreased 0.6 percentage points in the year to the fourth quarter of 2015 to reach4.3 per cent of the labour force (European Commission 2016). The European Commissionhas noted how long-term unemployment remains an important challenge in the EU witharound 10.5 million people in unemployment for more than a year, despite searching for ajob, including 6.6 million for more than two years (European Commission 2016). Thus thatvery high proportions of Europe’s unemployed people continue to be long-termunemployed can be seen from what is called the share of unemployment that is constitutedby long-term unemployment (that is, long-term unemployment -12 months or more- as apercentage of total unemployment). The picture is worrying – almost half of unemployedpeople in EU-28 are long-term unemployed (48.2 per cent, Quarter 4, 2015) (Eurostat online
48Employment and Unemployment
8 ‘available for work but not seeking’, ‘underemployed’ and ‘seeking but not available for work’ (EuropeanCommission 2016).
database, code lfsq_upgal). Within the Euro Area the share exceeds 50 per cent (51.3 percent, Quarter 4, 2015) (Eurostat online database, code lfsq_upgal).
At the end of 2015, the share of long-term unemployment was above 50 per cent in tencountries – worst amongst them is Greece (where long-term unemployment represents 74.3per cent of unemployment) (Quarter 4, 2015). It constitutes more than 60 per cent ofunemployment in Croatia and Slovakia, and more than 50 per cent in Spain, Belgium,Slovenia, Ireland, Portugal, Italy and Bulgaria (Quarter 4, 2015) (Eurostat online database,code lfsq_upgal). At the other end of the scale, long-term unemployment represents 21.6per cent of total unemployment in Sweden and approximately 28 per cent in Denmark andFinland (Quarter 4, 2015).
Some countries have higher transition rates from long-term unemployment back toemployment than others. Notably, Denmark has the smallest share of persistent long-termunemployment and the chances of moving into employment from long-termunemployment are quite high there (40 per cent) (European Commission 2016a). InDenmark, Austria, Finland, Sweden, Germany and Latvia less than 20 per cent of the short-term unemployed became long-term unemployed in the following year (referring to labourmarket status in 2014 of people long-term unemployed in 2013)(European Commission2016a). By contrast in Bulgaria, Greece and Slovakia, the proportions were of the order of40 per cent (European Commission 2016a).
The European Commission’s review for 2015 notes that long-term unemployment has notaffected all groups of the EU-28 popu lation equally. Those facing the highest risks before thecrisis suffered most dur ing the crisis and to this day. These are the low-skilled, the young andyoung adults as well as workers born in a third country (European Commission 2016a).
Of all the age groups, the youngest and oldest workers were hardest hit by long-termunemployment in the crisis and while older workers are less likely to become unemployedthan other workers, once they become long-term unemployed they face greater difficultiesin finding a new job (European Commission 2016a). The youngest workers (20-24) weremost affected by long-term unemployment both before and during the crisis, with therecession pushing more of them into long-term unemploy ment than older age groups.Nevertheless, according to the European Commission, younger workers seem to haverelatively high chances of finding a job, while the older long-term unemployed people hadthe worst chances of returning to employment (2016a). These factors create the potentialfor long-term marginalisation of some groups.
3.3 Youth UnemploymentAs Figure 24 shows, there is great variation in the rates of youth unemployment acrossEurope and there were very great variations in the rate of its increase since 2008. The rates(2015) were over 40 per cent in Greece (49.8 per cent), Spain (48.3 per cent), Croatia (43 percent) and Italy (40.3 per cent) notwithstanding an improvement in all those countriesbetween 2014 and 2015 (Eurostat online database une_rt_a). Relatively high rates of over 30per cent occurred in Cyprus (32.8 per cent) and Portugal (32 per cent). By contrast, the 2015rate in Germany was 7.2 per cent and that in Austria was 10.6 per cent.
49Employment and Unemployment
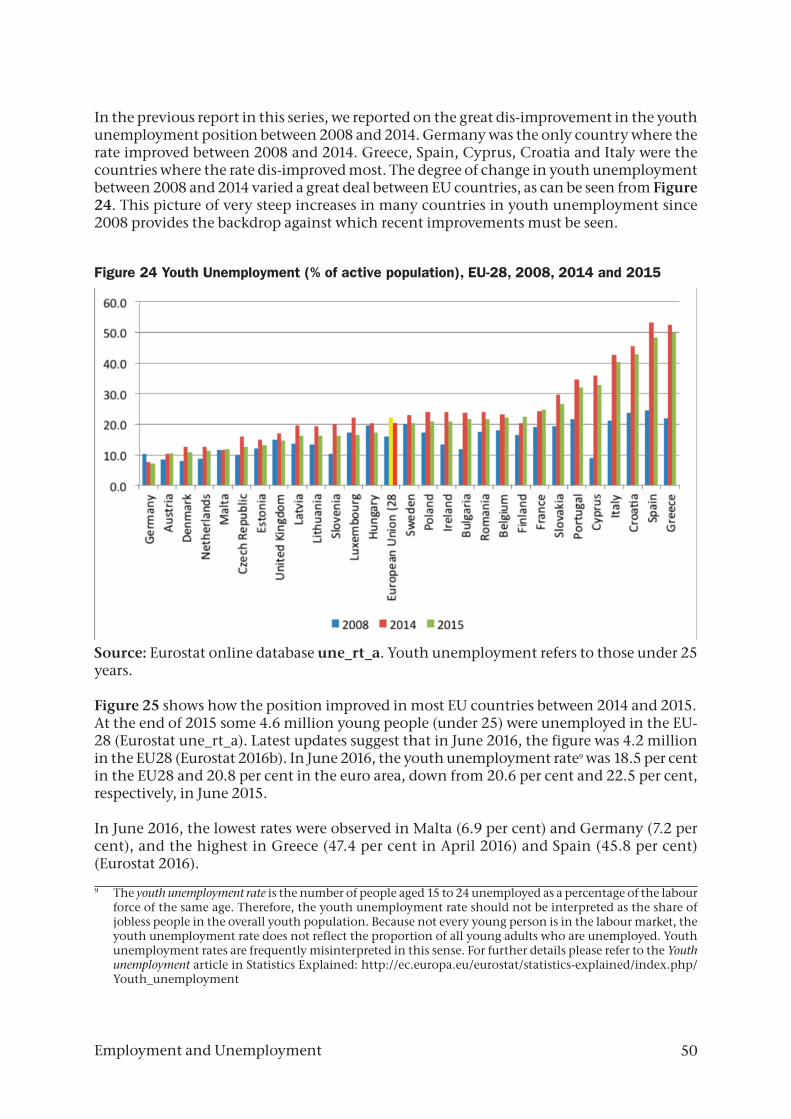
In the previous report in this series, we reported on the great dis-improvement in the youthunemployment position between 2008 and 2014. Germany was the only country where therate improved between 2008 and 2014. Greece, Spain, Cyprus, Croatia and Italy were thecountries where the rate dis-improved most. The degree of change in youth unemploymentbetween 2008 and 2014 varied a great deal between EU countries, as can be seen from Figure24. This picture of very steep increases in many countries in youth unemployment since2008 provides the backdrop against which recent improvements must be seen.
Figure 24 Youth Unemployment (% of active population), EU-28, 2008, 2014 and 2015
Source: Eurostat online database une_rt_a. Youth unemployment refers to those under 25years.
Figure 25 shows how the position improved in most EU countries between 2014 and 2015. At the end of 2015 some 4.6 million young people (under 25) were unemployed in the EU-28 (Eurostat une_rt_a). Latest updates suggest that in June 2016, the figure was 4.2 millionin the EU28 (Eurostat 2016b). In June 2016, the youth unemployment rate9 was 18.5 per centin the EU28 and 20.8 per cent in the euro area, down from 20.6 per cent and 22.5 per cent,respectively, in June 2015.
In June 2016, the lowest rates were observed in Malta (6.9 per cent) and Germany (7.2 percent), and the highest in Greece (47.4 per cent in April 2016) and Spain (45.8 per cent)(Eurostat 2016).
50Employment and Unemployment
9 The youth unemployment rate is the number of people aged 15 to 24 unemployed as a percentage of the labourforce of the same age. Therefore, the youth unemployment rate should not be interpreted as the share ofjobless people in the overall youth population. Because not every young person is in the labour market, theyouth unemployment rate does not reflect the proportion of all young adults who are unemployed. Youthunemployment rates are frequently misinterpreted in this sense. For further details please refer to the Youthunemployment article in Statistics Explained: http://ec.europa.eu/eurostat/statistics-explained/index.php/Youth_unemployment
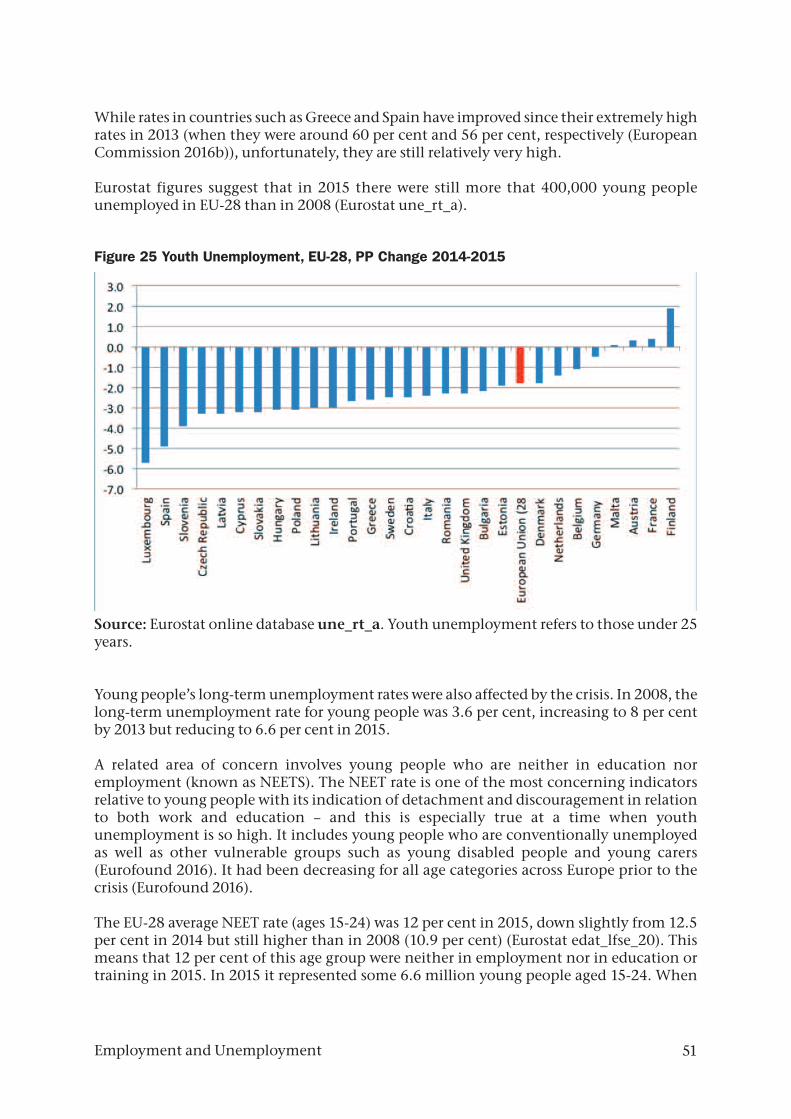
While rates in countries such as Greece and Spain have improved since their extremely highrates in 2013 (when they were around 60 per cent and 56 per cent, respectively (EuropeanCommission 2016b)), unfortunately, they are still relatively very high.
Eurostat figures suggest that in 2015 there were still more that 400,000 young peopleunemployed in EU-28 than in 2008 (Eurostat une_rt_a).
Figure 25 Youth Unemployment, EU-28, PP Change 2014-2015
Source: Eurostat online database une_rt_a. Youth unemployment refers to those under 25years.
Young people’s long-term unemployment rates were also affected by the crisis. In 2008, thelong-term unemployment rate for young people was 3.6 per cent, increasing to 8 per centby 2013 but reducing to 6.6 per cent in 2015.
A related area of concern involves young people who are neither in education noremployment (known as NEETS). The NEET rate is one of the most concerning indicatorsrelative to young people with its indication of detachment and discouragement in relationto both work and education – and this is especially true at a time when youthunemployment is so high. It includes young people who are conventionally unemployedas well as other vulnerable groups such as young disabled people and young carers(Eurofound 2016). It had been decreasing for all age categories across Europe prior to thecrisis (Eurofound 2016).
The EU-28 average NEET rate (ages 15-24) was 12 per cent in 2015, down slightly from 12.5per cent in 2014 but still higher than in 2008 (10.9 per cent) (Eurostat edat_lfse_20). Thismeans that 12 per cent of this age group were neither in employment nor in education ortraining in 2015. In 2015 it represented some 6.6 million young people aged 15-24. When
51Employment and Unemployment
we look at the age group 15-29, some 14 million young people were in this category in 2015,a NEET rate of 14.8 per cent for that age group (Eurofound 2016: 11;15). Thus the rateincreases with age (up to age 29), young women are more likely to be NEET than young men,and it varies a lot between member states as does the extent to which it has increased since2008 (Eurofound 2016).
The 2015 NEET rate (ages 15-24) was highest in Italy at 21.4 per cent. Rates were also abovethe EU-28 average in Bulgaria, Croatia, Romania, Greece, Spain, Cyprus, Ireland, Slovakiaand Belgium. At the other end of the scale, the countries with the lowest rates were theNetherlands (4.7 per cent), Denmark, Germany, Luxembourg and Sweden. In absoluteterms, the population of NEETS is highest in Italy and the UK with approximately onemillion young people in this category in the each country (Eurofound 2016: 15). A recentreview from Eurofound found that as well as variation between countries in the NEET rates,there are also wide variations among countries in the composition of the NEET population(Eurofound 2016). The tendency in most Nordic, western and continental countries is forthe largest groups to be short-term unemployed, while in some southern and Mediterraneancountries the shares of long-term unemployed and discouraged workers are higher. Ineastern European countries, the majority of NEETs are women who are in that category dueto family responsibilities. Approximately 40 per cent of NEETs are in that category forreasons that are not connected with the labour-market but more to do with issues like familyresponsibilities, illness or disability.
Just 57 per cent of NEETs were registered with public employment services in 2013 – thismeans that they are not targeted by schemes attempting to address youth unemploymentsuch as Youth Guarantee initiatives (Eurofound 2016). Serious concerns are now surfacingabout the so called ‘missing’ NEETS – young people who have a low level of education, haveno work experience and are not registered with public employment services, and aretherefore very difficult to reach and at risk of becoming deeply alienated (Eurofound 2016).In the EU in 2013 some 19 per cent of NEETs (aged 15-24) were classified as ‘missing.’
While there have been welcome improvements in youth unemployment within the pastyear, the situation is still extremely difficult especially for some groups and in somecountries. The OECD has noted that the transition from school to work has never beenparticularly easy; but for millions of young people in OECD countries, it has become nearlyimpossible (2015).
3.4 Summary and ConclusionsEmployment has continued to increase in the EU and in the Euro Area since 2014. However,there is great variation between member states in relation to employment levels with a 25percentage point difference in 2015 between the country with the highest level (Sweden)and that with the lowest (Greece). Furthermore, there is still a gap between EU average rateand the 75 per cent target set in the Europe 2020 Strategy. There are also a number of issuesin relation to how the employment situation has evolved, concerning increased rates oftemporary employment, increased part-time employment (much of it involuntary)especially in some member states, and pay levels decreasing or stagnating in many countriesespecially for disadvantaged groups. Without decent jobs, some workers continue toexperience poverty.
52Employment and Unemployment

Some 21 million people in the EU28, of whom 16.3million were in the Euro Area, wereunemployed in June 2016 (Eurostat 2016b). There has been a gradual reduction inunemployment since 2013, but it still affects some 6.1 million people more than in 2008(Eurostat code une_rt_a). Rates diverge greatly between countries. Greece and Spain had thehighest rates in 2015 while the lowest rate was in Germany.
The long-term unemployment picture continues to be worrying – around 11 million peopleor almost half of unemployed people in EU-28 are long-term unemployed. Whileunemployment has been declining since 2013, long-term unemployment has only recentlystopped rising (European Commission 2016a). Long-term unemployment has not affectedall groups equally and the low-skilled, the young and young adults as well as workers bornin a third country are particularly affected. In terms of age groups, the youngest and oldestworkers have been hardest hit by long-term unemployment.
Very steep increases in youth unemployment occurred in many countries following 2008.Improvements have occurred in the position in most EU countries between 2014 and 2015.Nonetheless, at the end of 2015 some 4.6 million young people (under 25) were unemployedin the EU-28 (Eurostat une_rt_a). Rates in countries such as Greece and Spain have improvedsince their extremely high rates in 2013, but, unfortunately, they are still relatively very high.Eurostat figures suggest that in 2015 there were still more that 400,000 young peopleunemployed in EU-28 than in 2008 (Eurostat une_rt_a).
The long-term unemployment rate for young people has improved but is also still higherthan in 2008. Twelve per cent of the age group 15-24 (approx. 6.6 million people) wasneither in employment nor in education or training in 2015 and this rate is still higher thanit was in 2008. Some 14 million young people aged 15-29 were in this category. This (knownas the NEET rate) is one of the most concerning indicators relative to young people with itsindication of detachment and discouragement in relation to both work and education.
The European Commission has noted that some of the Member States that have been mostresilient during the crisis have high levels of employment protection legislation, particularlyGermany, Sweden, the Netherlands and the Czech Republic (2015a).
Despite recent, welcome improvements, Europe still faces some very significantemployment challenges including the fact that there continue to be divergent experiencesacross countries. Exclusion from the labour market substantially limits individualopportunities for self-realization, contributes to an increased risk of poverty, and can leadto serious health stresses (Schraad-Tischler 2015). As the European Commission comments(2016), the employment recovery is far from robust in some countries.
53Employment and Unemployment

4.
KEY SERV ICES
Social Justice Ireland includes the right to appropriate accommodation, to relevant education,to essential healthcare, to real participation amongst its core rights that need to guide policy-making in the future. See Table 2 in Section 1, above.
There are at least three functions of welfare systems that are recognised: social investment(through education, for example), social protection (providing safeguards across the life-cycle) and stabilization of the economy (by cushioning shocks when unemploymentincreases). It is recognised that as well as income support, access to enabling services (suchas early childhood education and care, education and training, transport, housing, jobassistance, debt-counselling, health care, and long-term care) also play an essential role inreducing depth of poverty and supporting people to improve their living conditions andemployment prospects (Social Protection Committee 2015a).
In this Section, we look at two of these vital supports – education and health.
4.1 EducationThe Europe 2020 Strategy sets the following targets in the field of education –
• Reducing early school leaving rate to below 10 per cent, and • Completion of third level education by at least 40 per cent of 30-34 year-olds.
In th˝is section we will look at progress towards achieving these targets along with thesituation in relation to lifelong learning and adult literacy. As mentioned in Section 1,above, Social Justice Ireland includes the right to relevant education amongst its core rightsthat need to guide policy-making in the future.
Early School-LeavingIt is recognised that improved educational achievement of young people is a cross-cuttingmeasure that addresses two priority areas of the Europe 2020 Strategy - that for ‘smartgrowth’ by improving skills levels, and ‘inclusive growth’ by tackling one of the major riskfactors for unemployment and poverty. Reducing early school-leaving is therefore seen as a‘gateway’ to achieving other Europe 2020 Strategy targets.
Leaving school before completing upper secondary education is often the outcome of aprocess of disengagement triggered by problems that can be related to the course of study,the school, or to certain health, personal, or emotional difficulties young people face. It canbe associated with the socioeconomic or family background of pupils, to limited access toquality education or to an individual’s preferred choice of study, which may be especiallyproblematic in rural or disadvantaged areas (European Commission 2013c). There are also
54Key Services
E U R O P E A N R E S E A R C H S E R I E S
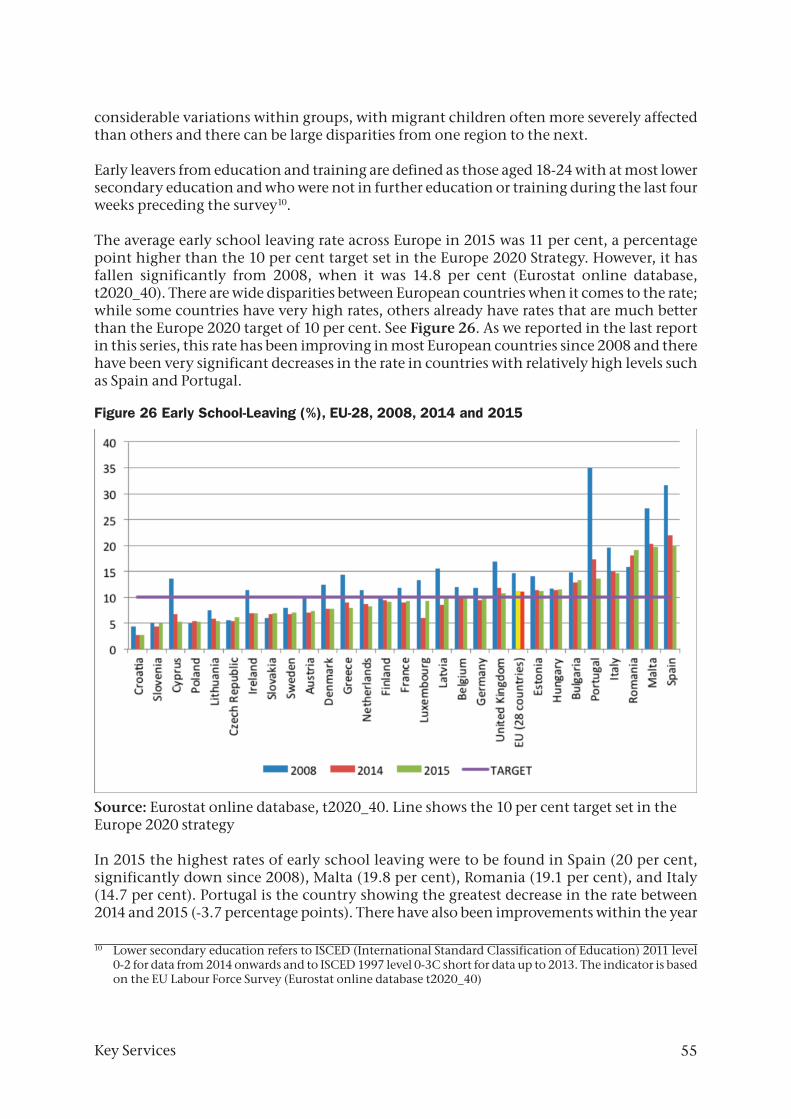
considerable variations within groups, with migrant children often more severely affectedthan others and there can be large disparities from one region to the next.
Early leavers from education and training are defined as those aged 18-24 with at most lowersecondary education and who were not in further education or training during the last fourweeks preceding the survey10.
The average early school leaving rate across Europe in 2015 was 11 per cent, a percentagepoint higher than the 10 per cent target set in the Europe 2020 Strategy. However, it hasfallen significantly from 2008, when it was 14.8 per cent (Eurostat online database,t2020_40). There are wide disparities between European countries when it comes to the rate;while some countries have very high rates, others already have rates that are much betterthan the Europe 2020 target of 10 per cent. See Figure 26. As we reported in the last reportin this series, this rate has been improving in most European countries since 2008 and therehave been very significant decreases in the rate in countries with relatively high levels suchas Spain and Portugal.
Figure 26 Early School-Leaving (%), EU-28, 2008, 2014 and 2015
Source: Eurostat online database, t2020_40. Line shows the 10 per cent target set in theEurope 2020 strategy
In 2015 the highest rates of early school leaving were to be found in Spain (20 per cent,significantly down since 2008), Malta (19.8 per cent), Romania (19.1 per cent), and Italy(14.7 per cent). Portugal is the country showing the greatest decrease in the rate between2014 and 2015 (-3.7 percentage points). There have also been improvements within the year
55Key Services
10 Lower secondary education refers to ISCED (International Standard Classification of Education) 2011 level0-2 for data from 2014 onwards and to ISCED 1997 level 0-3C short for data up to 2013. The indicator is basedon the EU Labour Force Survey (Eurostat online database t2020_40)
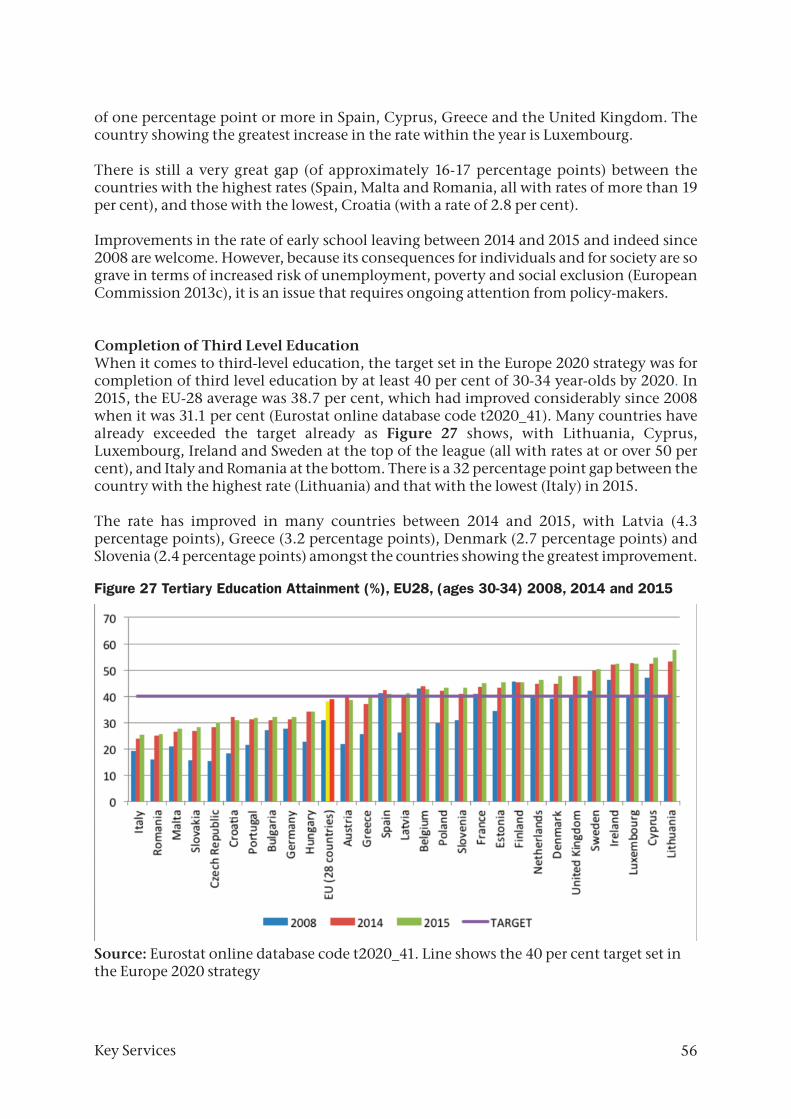
of one percentage point or more in Spain, Cyprus, Greece and the United Kingdom. Thecountry showing the greatest increase in the rate within the year is Luxembourg.
There is still a very great gap (of approximately 16-17 percentage points) between thecountries with the highest rates (Spain, Malta and Romania, all with rates of more than 19per cent), and those with the lowest, Croatia (with a rate of 2.8 per cent).
Improvements in the rate of early school leaving between 2014 and 2015 and indeed since2008 are welcome. However, because its consequences for individuals and for society are sograve in terms of increased risk of unemployment, poverty and social exclusion (EuropeanCommission 2013c), it is an issue that requires ongoing attention from policy-makers.
Completion of Third Level EducationWhen it comes to third-level education, the target set in the Europe 2020 strategy was forcompletion of third level education by at least 40 per cent of 30-34 year-olds by 2020. In2015, the EU-28 average was 38.7 per cent, which had improved considerably since 2008when it was 31.1 per cent (Eurostat online database code t2020_41). Many countries havealready exceeded the target already as Figure 27 shows, with Lithuania, Cyprus,Luxembourg, Ireland and Sweden at the top of the league (all with rates at or over 50 percent), and Italy and Romania at the bottom. There is a 32 percentage point gap between thecountry with the highest rate (Lithuania) and that with the lowest (Italy) in 2015.
The rate has improved in many countries between 2014 and 2015, with Latvia (4.3percentage points), Greece (3.2 percentage points), Denmark (2.7 percentage points) andSlovenia (2.4 percentage points) amongst the countries showing the greatest improvement.
Figure 27 Tertiary Education Attainment (%), EU28, (ages 30-34) 2008, 2014 and 2015
Source: Eurostat online database code t2020_41. Line shows the 40 per cent target set inthe Europe 2020 strategy
56Key Services

One of the problems that Europe now faces is that progress not only needs to continue tobe made to address the Europe 2020 strategy targets in education, but also to manageproblems that have emerged/worsened, especially since 2008. For example, a phenomenonthat needs to be addressed is the cohort of young people neither in education noremployment – or NEETs, as discussed in Section 2 of this report. As mentioned, this isconsidered one of the most concerning indicators relative to young people. The EU averagerate in 2015 was 12 per cent and this rate was highest in Italy at 21.4 per cent (those aged 15-24) (Eurostat edat_lfse_20). One commentator describes the emergence of this phenomenonas leaving the Europe 2020 targets ‘wide of the mark’ (Hemerijck 2014:2). A recent reviewfrom Eurofound concerned with NEETS identified education as playing a key role in keepingpeople out of this category as the probability of becoming NEET decreased as educationallevel increased (Eurofound 2016).
In Section 2 of this report, we referred to the assessment of the OECD that the transitionfrom school to employment had become almost impossible for millions of young people inOECD countries (2015). Among the factors that they point to in terms of integrating youngpeople into the world of work are education systems that are flexible and responsive to theneeds of the labour market, access to high-quality career guidance and further educationthat can help young people to match their skills to prospective jobs (OECD 2015).
Lifelong LearningLifelong learning can play many important roles in the life of an individual, not leastoffering a second chance for people who may not have had good experiences in school firsttime around. In economic terms it is recognised that countries need to invest not just ininitial education and training systems but also in lifelong learning to ensure that skills areused, maintained and updated (European Commission 2015a). This is obviously ofparticular importance in ageing societies, not just in human terms, but also because thereis more and more emphasis on extending working lives. Furthermore, reviewing the verygreat difficulties that some young people (millions within OECD countries) have intransitioning from school to the world of work, the OECD notes how many leave educationwithout the skills needed for the labour market or to continue further in education (2015).Hence, they argue, efforts should concentrate on ensuring that low-skilled adults participatein adult learning as well as improving adult learning programmes.
European countries with the highest levels of participation in lifelong learning for bothemployed and unemployed people also have the highest labour market performance interms of hav ing the highest transition rates out of unemployment and lowest transitionrates from employment to unemploy ment, which obviously has positive implications forthe prevention of long-term unemployment (European Commission 2015a). Lowparticipation in lifelong learning and training especially affects the low-skilled whosechances of finding a job tend to be rather bleak because they lack the skills needed(European Commission 2016a). Despite their apparent greater need for training, theparticipation of low-skilled people in lifelong learning/training activities (both whenemployed and unemployed) is much lower than for other groups (European Commission2016a).
In 2015 the average rate of participation in lifelong learn ing was 10.7 per cent (measuredthrough the participation rate for people aged 25-64 in training and education in the past
57Key Services
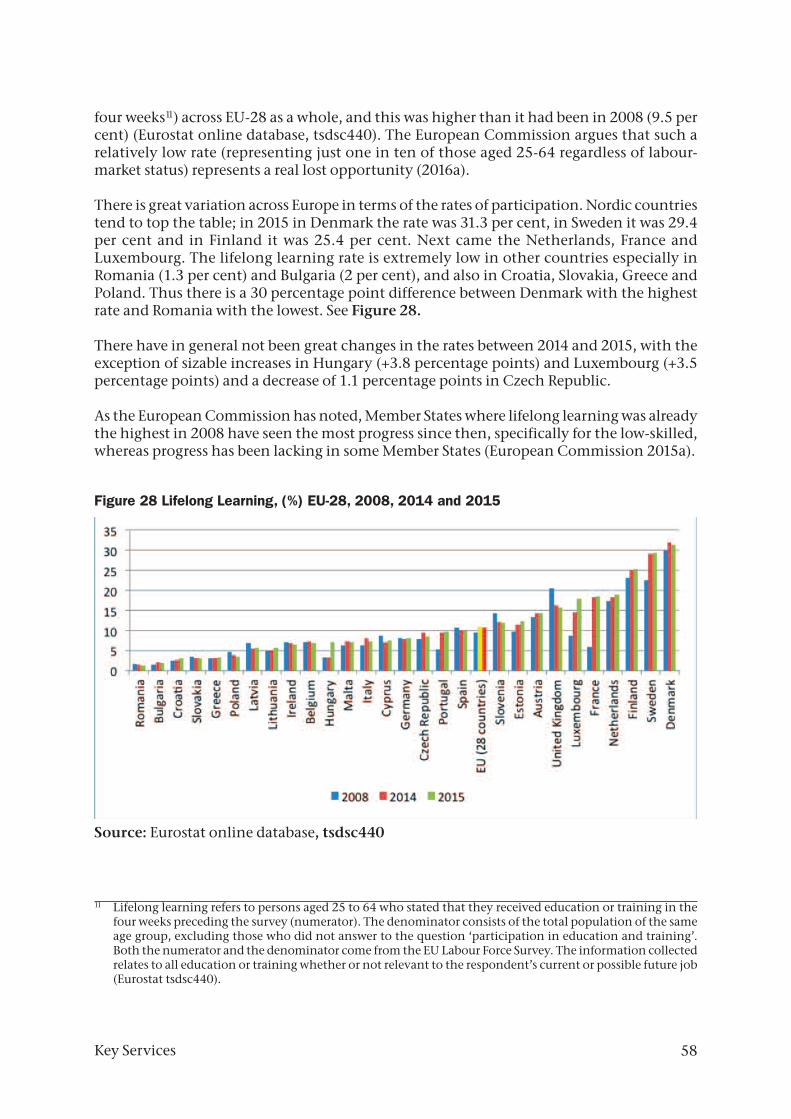
four weeks11) across EU-28 as a whole, and this was higher than it had been in 2008 (9.5 percent) (Eurostat online database, tsdsc440). The European Commission argues that such arelatively low rate (representing just one in ten of those aged 25-64 regardless of labour-market status) represents a real lost opportunity (2016a).
There is great variation across Europe in terms of the rates of participation. Nordic countriestend to top the table; in 2015 in Denmark the rate was 31.3 per cent, in Sweden it was 29.4per cent and in Finland it was 25.4 per cent. Next came the Netherlands, France andLuxembourg. The lifelong learning rate is extremely low in other countries especially inRomania (1.3 per cent) and Bulgaria (2 per cent), and also in Croatia, Slovakia, Greece andPoland. Thus there is a 30 percentage point difference between Denmark with the highestrate and Romania with the lowest. See Figure 28.
There have in general not been great changes in the rates between 2014 and 2015, with theexception of sizable increases in Hungary (+3.8 percentage points) and Luxembourg (+3.5percentage points) and a decrease of 1.1 percentage points in Czech Republic.
As the European Commission has noted, Member States where lifelong learning was alreadythe highest in 2008 have seen the most progress since then, specifically for the low-skilled,whereas progress has been lacking in some Member States (European Commission 2015a).
Figure 28 Lifelong Learning, (%) EU-28, 2008, 2014 and 2015
Source: Eurostat online database, tsdsc440
58Key Services
11 Lifelong learning refers to persons aged 25 to 64 who stated that they received education or training in thefour weeks preceding the survey (numerator). The denominator consists of the total population of the sameage group, excluding those who did not answer to the question ‘participation in education and training’.Both the numerator and the denominator come from the EU Labour Force Survey. The information collectedrelates to all education or training whether or not relevant to the respondent’s current or possible future job(Eurostat tsdsc440).
59
The European Commission draws attention to the fact that several of the countries with thehighest rates of participation in lifelong learning are also the world’s most competitive(European Commission 2015a). This is evidenced by the fact that in 2016, Sweden, Denmarkand the Netherlands, which are amongst the top four countries in terms of lifelong learningparticipation rates, are also ranked as 5th and 6th and 8th, respectively, amongst 61 economiesin terms of competitiveness (IMD Competiveness Scoreboard 2016).
The Commission notes that lifelong learning is a key part of a package (along withinvestment in activation and effective unemployment benefits) that enabled some countries(Austria, United Kingdom, Germany, Denmark and Sweden) to fare better in terms ofemployment during the crisis with high levels of returns to employment (EuropeanCommission 2016a). The Commission sees lifelong learning/training as a key part of helpinglong-term unemployed people back to work (European Commission 2016a).
Adult LiteracyProblems relating to adult literacy represent a challenge for individuals and for societiesand are a potentially significant barrier to achieving the aims of the 2020 Strategy forinclusive growth, given that those with low literacy skills are almost twice as likely to beunemployed than others, are more likely than those with better literacy skills to report poorhealth, to believe that they have little impact on political processes, and not to participatein communal or volunteer activities (OECD, 2013). The OECD has shown the importanceof literacy, numeracy and problem-solving in technology-rich environments on labour-market outcomes (2013). As the OECD puts it, adults are expected to use information incomplex ways and to maintain and enhance their literacy skills to adapt to ever changingtechnologies. Literacy is important not only for personal development, but also for positiveeducational, social and economic outcomes (OECD 2016). According to the OECD (2015),even amongst new graduates, 10 per cent have poor literacy skills and 14 per cent have poornumeracy skills, while more than 40 per cent of those who left school before completingtheir upper secondary education have poor numeracy and literacy skills.
Assessments of literacy across countries tend to be complicated processes and a number areavailable. We look briefly at one indicator of adult literacy across Europe – the OECD’sSurvey of Adult Skills (OECD, 2013). In last year’s report in this series, we looked at theaverage performance in literacy and in this year’s report we also include average performancein numeracy.
The Survey of Adult Skills (PIAAC) defines literacy as the ability to ‘understand, evaluate,use and engage with written texts to participate in society, achieve one’s goals, and developone’s knowledge and potential’ (OECD 2013: 61). Conducted in 40 countries, it alsoexamined reading digital texts, and involved 5 levels of skill graded from below level 1 tolevel 4/5. Each level of proficiency is described within the study. For example, an indicationof the types of tasks that respondents can complete at below level 1 is as follows:
‘The tasks at this level require the respondent to read brief texts on familiar topics tolocate a single piece of specific information. There is seldom any competing informationin the text and the requested information is identical in form to information in thequestion or directive. ….. Only basic vocabulary knowledge is required, and the reader isnot required to understand the structure of sentences or paragraphs or make use of othertext features. Tasks below Level 1 do not make use of any features specific to digital texts’(OECD 2013: 64).
Key Services
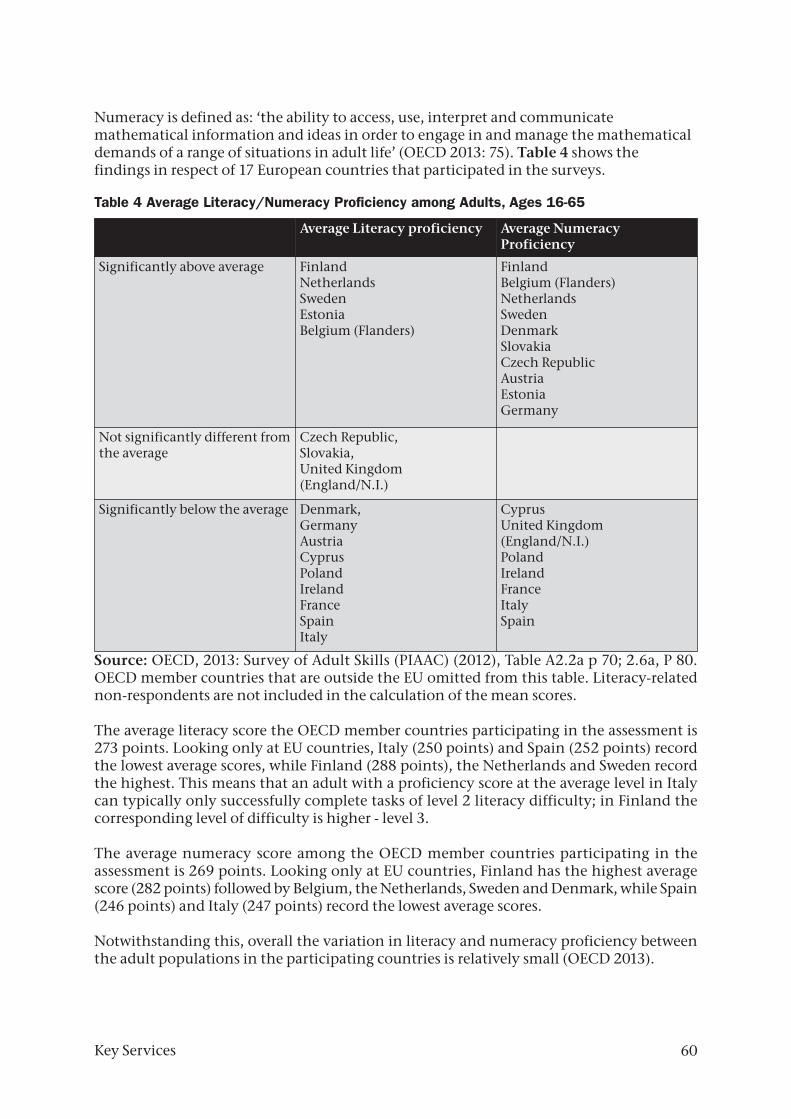
Numeracy is defined as: ‘the ability to access, use, interpret and communicatemathematical information and ideas in order to engage in and manage the mathematicaldemands of a range of situations in adult life’ (OECD 2013: 75). Table 4 shows thefindings in respect of 17 European countries that participated in the surveys.
Table 4 Average Literacy/Numeracy Proficiency among Adults, Ages 16-65
Source: OECD, 2013: Survey of Adult Skills (PIAAC) (2012), Table A2.2a p 70; 2.6a, P 80.OECD member countries that are outside the EU omitted from this table. Literacy-relatednon-respondents are not included in the calculation of the mean scores.
The average literacy score the OECD member countries participating in the assessment is273 points. Looking only at EU countries, Italy (250 points) and Spain (252 points) recordthe lowest average scores, while Finland (288 points), the Netherlands and Sweden recordthe highest. This means that an adult with a proficiency score at the average level in Italycan typically only successfully complete tasks of level 2 literacy difficulty; in Finland thecorresponding level of difficulty is higher - level 3.
The average numeracy score among the OECD member countries participating in theassessment is 269 points. Looking only at EU countries, Finland has the highest averagescore (282 points) followed by Belgium, the Netherlands, Sweden and Denmark, while Spain(246 points) and Italy (247 points) record the lowest average scores.
Notwithstanding this, overall the variation in literacy and numeracy proficiency betweenthe adult populations in the participating countries is relatively small (OECD 2013).
Average Literacy proficiency Average NumeracyProficiency
Significantly above average FinlandNetherlands Sweden Estonia Belgium (Flanders)
FinlandBelgium (Flanders)NetherlandsSwedenDenmarkSlovakiaCzech RepublicAustriaEstoniaGermany
Not significantly different fromthe average
Czech Republic, Slovakia, United Kingdom(England/N.I.)
Significantly below the average Denmark, GermanyAustriaCyprusPolandIrelandFrance SpainItaly
CyprusUnited Kingdom(England/N.I.)PolandIrelandFranceItaly Spain
60Key Services

Certain limitations in the survey are acknowledged, thus there is a degree of uncertaintyrelative to these estimates. It is also to be remembered that only 17 out of 28 EU countriesparticipated.
In both literacy and numeracy proficiency five participating countries do significantly betterthan average – Finland, Netherlands, Sweden, Estonia and Belgium. We can look at thesecountries in light of the education indicators already discussed (early school leaving, thirdlevel attainment of 30-34 year olds, and participation in lifelong learning of adults). It isinteresting to note that they also tend to be better performers across all indicators (lookingat their performance in 2015). Specifically, all five have rates for tertiary attainment (by 30-34 year olds) that are better than the EU average. All but Estonia have rates that are betterthan the EU average for early school leaving and the rate for Estonia is very similar to theEU-28 average. All but one (Belgium) also have rates of participation in lifelong learningthat are better than the EU average and three of them (Finland, Netherlands and Sweden)are amongst the countries with the highest rates of participation in lifelong learning. Thisexamination suggests that the policies pursued by some countries, seem to impact a rangeof different groups positively, most notably Finland, the Netherlands, Sweden, Estonia andBelgium.
Finland and Estonia are singled out in the latest survey of social justice from BertelsmannStiftung for education systems that provide both equity and quality education wherechildren even from socially disadvantaged family homes experience prospects equal to thoseof children from socially better-off families (Schraad-Tischler 2015). In Finland acommitment to the prevention of poverty, inequality and exclusion is a feature of thecurrent education-policy programme (2011-2016) even though the Finnish educationsystem is shown to already demonstrate a high degree of justice and equality (Schraad-Tischler and Kroll, 2014).
There are six countries which are considered significantly worse than average for bothliteracy and numeracy performance – Cyprus, Poland, Ireland, France, Spain and Italy.When we look at the performance of these countries across the other three indicators, it ismore mixed (looking at rates for 2015). Four of them have a better rate for early schoolleaving than the EU average, Spain and Italy being the exceptions (and the rate in Cyprushas improved only in recent years). Five of them score above average for third levelattainment by 30-34 year olds. In this case Italy is the exception, and in fact Italy has thelowest rate amongst EU countries (again looking at rates for 2015). However, when it comesto lifelong learning, all but one of them perform at levels lower than the EU average – theonly exception being France (and France displays a very big improvement in its performanceon this indicator since 2008).
It is clear that these are complex and dynamic issues involving policy impacts on differentgroups and age cohorts over time and in which the policies pursued can have quite differentoutcomes in relation to different indicators and for different groups.
61Key Services
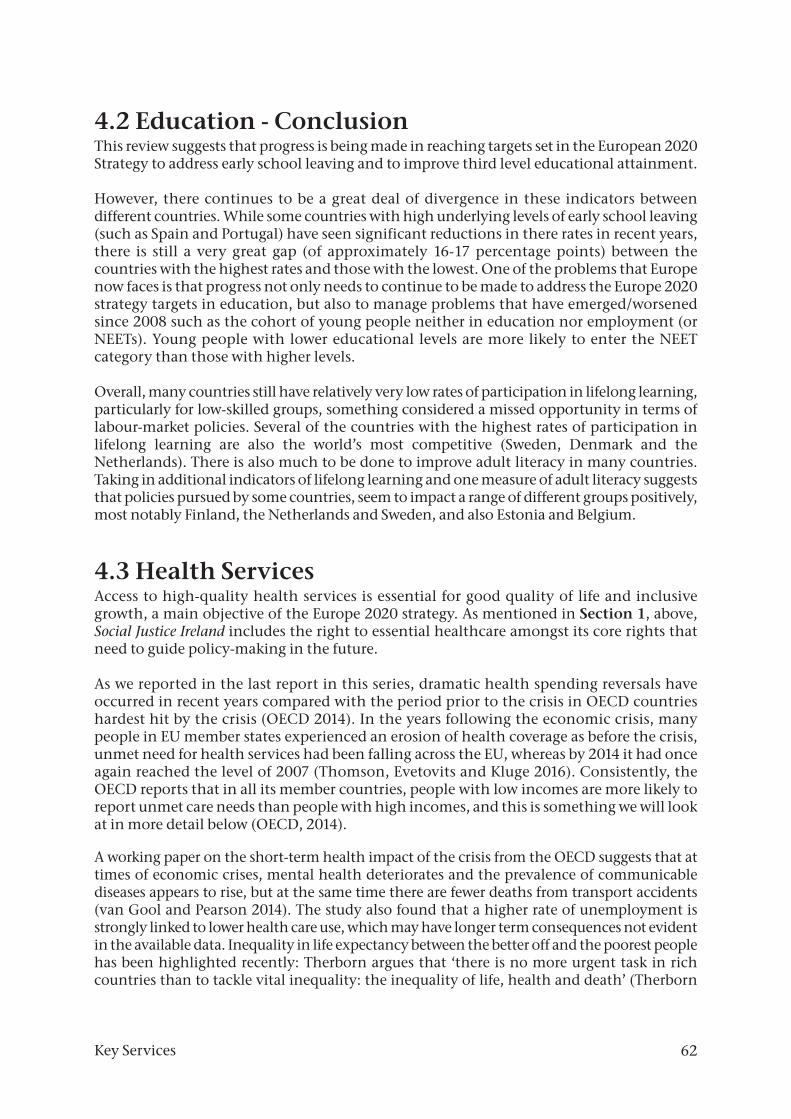
4.2 Education - ConclusionThis review suggests that progress is being made in reaching targets set in the European 2020Strategy to address early school leaving and to improve third level educational attainment.
However, there continues to be a great deal of divergence in these indicators betweendifferent countries. While some countries with high underlying levels of early school leaving(such as Spain and Portugal) have seen significant reductions in there rates in recent years,there is still a very great gap (of approximately 16-17 percentage points) between thecountries with the highest rates and those with the lowest. One of the problems that Europenow faces is that progress not only needs to continue to be made to address the Europe 2020strategy targets in education, but also to manage problems that have emerged/worsenedsince 2008 such as the cohort of young people neither in education nor employment (orNEETs). Young people with lower educational levels are more likely to enter the NEETcategory than those with higher levels.
Overall, many countries still have relatively very low rates of participation in lifelong learning,particularly for low-skilled groups, something considered a missed opportunity in terms oflabour-market policies. Several of the countries with the highest rates of participation inlifelong learning are also the world’s most competitive (Sweden, Denmark and theNetherlands). There is also much to be done to improve adult literacy in many countries.Taking in additional indicators of lifelong learning and one measure of adult literacy suggeststhat policies pursued by some countries, seem to impact a range of different groups positively,most notably Finland, the Netherlands and Sweden, and also Estonia and Belgium.
4.3 Health ServicesAccess to high-quality health services is essential for good quality of life and inclusivegrowth, a main objective of the Europe 2020 strategy. As mentioned in Section 1, above,Social Justice Ireland includes the right to essential healthcare amongst its core rights thatneed to guide policy-making in the future.
As we reported in the last report in this series, dramatic health spending reversals haveoccurred in recent years compared with the period prior to the crisis in OECD countrieshardest hit by the crisis (OECD 2014). In the years following the economic crisis, manypeople in EU member states experienced an erosion of health coverage as before the crisis,unmet need for health services had been falling across the EU, whereas by 2014 it had onceagain reached the level of 2007 (Thomson, Evetovits and Kluge 2016). Consistently, theOECD reports that in all its member countries, people with low incomes are more likely toreport unmet care needs than people with high incomes, and this is something we will lookat in more detail below (OECD, 2014).
A working paper on the short-term health impact of the crisis from the OECD suggests that attimes of economic crises, mental health deteriorates and the prevalence of communicablediseases appears to rise, but at the same time there are fewer deaths from transport accidents(van Gool and Pearson 2014). The study also found that a higher rate of unemployment isstrongly linked to lower health care use, which may have longer term consequences not evidentin the available data. Inequality in life expectancy between the better off and the poorest peoplehas been highlighted recently: Therborn argues that ‘there is no more urgent task in richcountries than to tackle vital inequality: the inequality of life, health and death’ (Therborn
62Key Services
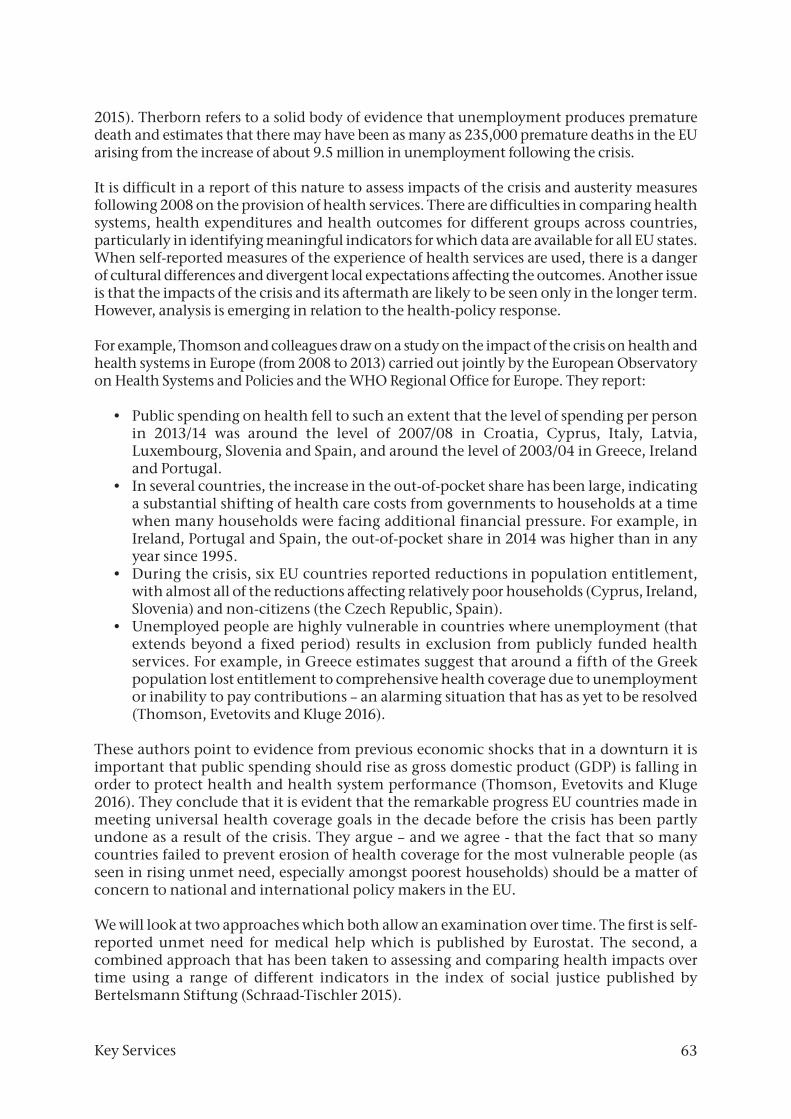
2015). Therborn refers to a solid body of evidence that unemployment produces prematuredeath and estimates that there may have been as many as 235,000 premature deaths in the EUarising from the increase of about 9.5 million in unemployment following the crisis.
It is difficult in a report of this nature to assess impacts of the crisis and austerity measuresfollowing 2008 on the provision of health services. There are difficulties in comparing healthsystems, health expenditures and health outcomes for different groups across countries,particularly in identifying meaningful indicators for which data are available for all EU states.When self-reported measures of the experience of health services are used, there is a dangerof cultural differences and divergent local expectations affecting the outcomes. Another issueis that the impacts of the crisis and its aftermath are likely to be seen only in the longer term.However, analysis is emerging in relation to the health-policy response.
For example, Thomson and colleagues draw on a study on the impact of the crisis on health andhealth systems in Europe (from 2008 to 2013) carried out jointly by the European Observatoryon Health Systems and Policies and the WHO Regional Office for Europe. They report:
• Public spending on health fell to such an extent that the level of spending per personin 2013/14 was around the level of 2007/08 in Croatia, Cyprus, Italy, Latvia,Luxembourg, Slovenia and Spain, and around the level of 2003/04 in Greece, Irelandand Portugal.
• In several countries, the increase in the out-of-pocket share has been large, indicatinga substantial shifting of health care costs from governments to households at a timewhen many households were facing additional financial pressure. For example, inIreland, Portugal and Spain, the out-of-pocket share in 2014 was higher than in anyyear since 1995.
• During the crisis, six EU countries reported reductions in population entitlement,with almost all of the reductions affecting relatively poor households (Cyprus, Ireland,Slovenia) and non-citizens (the Czech Republic, Spain).
• Unemployed people are highly vulnerable in countries where unemployment (thatextends beyond a fixed period) results in exclusion from publicly funded healthservices. For example, in Greece estimates suggest that around a fifth of the Greekpopulation lost entitlement to comprehensive health coverage due to unemploymentor inability to pay contributions – an alarming situation that has as yet to be resolved(Thomson, Evetovits and Kluge 2016).
These authors point to evidence from previous economic shocks that in a downturn it isimportant that public spending should rise as gross domestic product (GDP) is falling inorder to protect health and health system performance (Thomson, Evetovits and Kluge2016). They conclude that it is evident that the remarkable progress EU countries made inmeeting universal health coverage goals in the decade before the crisis has been partlyundone as a result of the crisis. They argue – and we agree - that the fact that so manycountries failed to prevent erosion of health coverage for the most vulnerable people (asseen in rising unmet need, especially amongst poorest households) should be a matter ofconcern to national and international policy makers in the EU.
We will look at two approaches which both allow an examination over time. The first is self-reported unmet need for medical help which is published by Eurostat. The second, acombined approach that has been taken to assessing and comparing health impacts overtime using a range of different indicators in the index of social justice published byBertelsmann Stiftung (Schraad-Tischler 2015).
63Key Services
Eurostat publishes rates of self-reported unmet need for medical examination or treatmentover time, an indicator defined as the share of the population perceiving an unmet need formedical examination or treatment (online database code tsdph270). This is one of the socialprotection indicators used in the social protection performance monitor (SPPM) by theSocial Protection Committee of the European Commission. In its latest reports, theCommittee has highlighted increases in self-reported unmet need for medical care (9member states) as a major negative trend seen since 2008 (The Social Protection Committee2015; 2016). A number of reasons may be given for inability to avail of medical treatment,but in this case we look at reasons associated with problems of access (could not afford to,waiting list, too far to travel).
Figure 29 Self-reported unmet need for Medical Examination or Treatment Due to Problemof Access (%), EU-28, 2007-2014, By income Quintile
Source: Eurostat online database tsdph270/ hlth_silc_08. Reasons associated with problemsof access: ‘could not afford to, waiting list, too far to travel’. Rates prior to 2010 refer to EU27,thereafter EU28.
The average rate of perceived unmet need for medical treatment (due to difficulties withaccess) was falling up until 2009 when it started to increase again. It rose from 3 per cent(EU27) in 2009 to 3.6 per cent in 2014 (EU28) (the latest year in respect of which rates arepublished by Eurostat (Eurostat online database code hlth_silc-08). However, as Figure 29and Figure 30 show, the perception is very different between different income quintileswith more perceived, unmet need in the poorer quintiles. While the perception of unmetneed rose across all income quintiles between 2009 and 2014, it was least perceived in thetop (or 5th) quintile and most in the bottom quintile. Figure 30 indicates the increasedperceptions of unmet need across the 5 quintiles between 2009 and 2014.
Over 3 million more people reported unmet need for health care in 2014 than in 2009(Thomson, Evetovits and Kluge 2016). Since the onset of the crisis, unmet need due to cost,distance and waiting time has risen across the whole population in 22 out of 28 EU memberstates and was higher in 2014 than in 2009 among the poorest quintile in 21 out of 28countries (Thomson, Evetovits and Kluge 2016).
64Key Services
Figure 30 Self-Reported Unmet Need for Medical Examination or Treatment Due to Problemof Access, EU-28. PP change, 2009-2014
Source: Eurostat online database tsdph270/ hlth_silc_08. Reasons associated with problemsof access: ‘could not afford to, waiting list, too far to travel’. Rates prior to 2010 refer to EU27,thereafter EU28.
When we look at changes between 2013 and 2014, the average perception of unmet needhas remained at the same level (3.6 per cent). There has been no change perceived amongstthe first and 5th quintile. Of the other three quintiles, the perception of unmet need hasreduced amongst those in the 2nd and 4th quintiles and there is slightly more perceivedunmet need amongst those in the 3rd quintile (Eurostat online database code hlth_silc-08).
Eurostat warns that due to cultural differences between countries, this indicator should notbe used to make international comparisons and for that reason we are not doing so. Also forthis reason, we go on to look at the other, more comprehensive assessment, alreadymentioned.
The second approach to the performance of health systems in recent years that we look athere is the social justice index from Bertelsmann Stiftung.
First it is necessary to say a word about the approach taken to assessment of health systems.That report used five indicators to arrive at a basic impression of differing degrees of fairness,inclusiveness and quality between health systems in EU countries and it allocates a score toeach country (Schraad-Tischler 2015). There are four quantitative indicators used and onequalitative. One captures the outcome performance of each country’s health system; thesecond addresses the question of accessibility and range of services. (These two are from theEHCI, European Health Consumer Index). Two come from Eurostat using the indicators“healthy life expectancy at birth” and “self-reported unmet needs for medical help” (thelatter being the indicator already discussed above). The qualitative indicator looks at policyand is drawn from a Sustainable Governance Indicators survey assessing to what extentpolicies provide high-quality, inclusive and cost-efficient health care; of the three criteria –quality, inclusiveness and cost efficiency – quality and inclusiveness are given priority overcost efficiency.
65Key Services
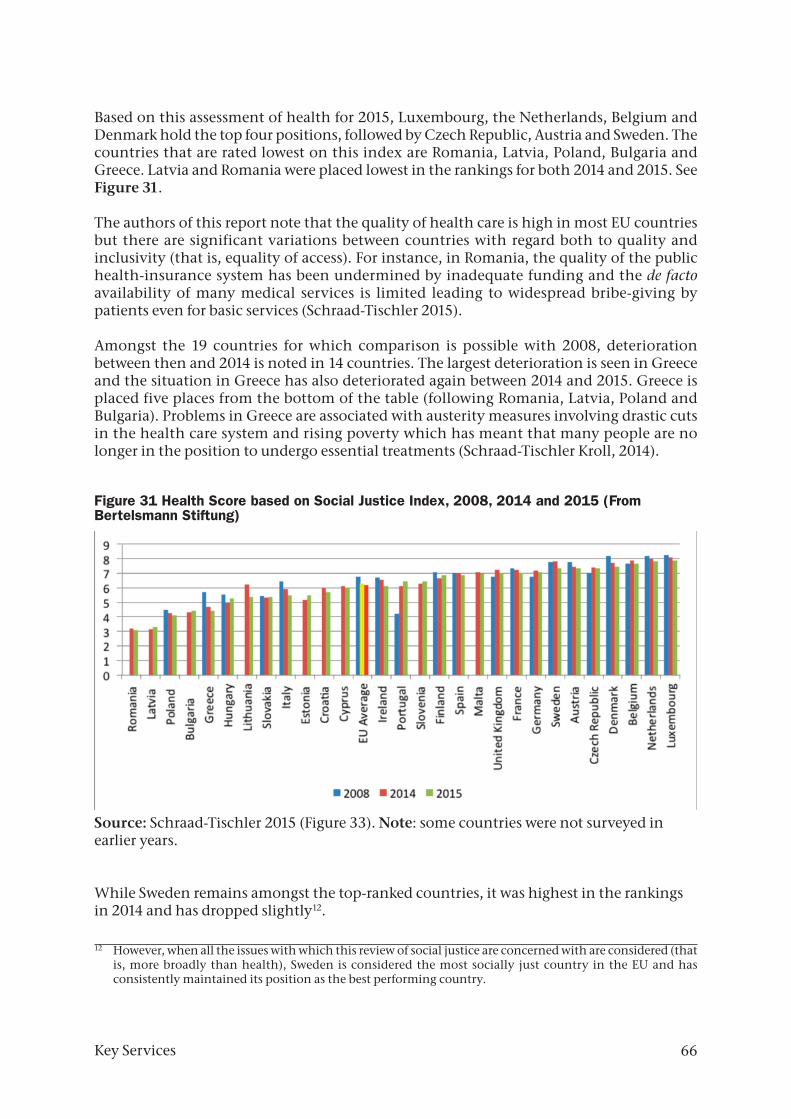
Based on this assessment of health for 2015, Luxembourg, the Netherlands, Belgium andDenmark hold the top four positions, followed by Czech Republic, Austria and Sweden. Thecountries that are rated lowest on this index are Romania, Latvia, Poland, Bulgaria andGreece. Latvia and Romania were placed lowest in the rankings for both 2014 and 2015. SeeFigure 31.
The authors of this report note that the quality of health care is high in most EU countriesbut there are significant variations between countries with regard both to quality andinclusivity (that is, equality of access). For instance, in Romania, the quality of the publichealth-insurance system has been undermined by inadequate funding and the de factoavailability of many medical services is limited leading to widespread bribe-giving bypatients even for basic services (Schraad-Tischler 2015).
Amongst the 19 countries for which comparison is possible with 2008, deteriorationbetween then and 2014 is noted in 14 countries. The largest deterioration is seen in Greeceand the situation in Greece has also deteriorated again between 2014 and 2015. Greece isplaced five places from the bottom of the table (following Romania, Latvia, Poland andBulgaria). Problems in Greece are associated with austerity measures involving drastic cutsin the health care system and rising poverty which has meant that many people are nolonger in the position to undergo essential treatments (Schraad-Tischler Kroll, 2014).
Figure 31 Health Score based on Social Justice Index, 2008, 2014 and 2015 (FromBertelsmann Stiftung)
Source: Schraad-Tischler 2015 (Figure 33). Note: some countries were not surveyed inearlier years.
While Sweden remains amongst the top-ranked countries, it was highest in the rankingsin 2014 and has dropped slightly12.
66Key Services
12 However, when all the issues with which this review of social justice are concerned with are considered (thatis, more broadly than health), Sweden is considered the most socially just country in the EU and hasconsistently maintained its position as the best performing country.
4.4 Health - ConclusionIn the years following the economic crisis, many people in EU member states experiencedan erosion of health coverage and those who are poorer have experienced more unmet needthan others. The fact that so many countries failed to prevent erosion of health coverage forthe most vulnerable people (as seen in rising unmet need, especially amongst poorerhouseholds) should be a matter of concern to national and international policy makers inthe EU.
Two indicators that we have reviewed suggest that:
• Perception of unmet need for health care is greater amongst poorer people in Europethan richer; it has risen most in recent years amongst the lowest income groups; Over3 million more people reported unmet need for health care in 2014 than in 2009.
• One assessment of the performance of health systems under a range of indicators(from Berteslmann Stiftung) suggests that while the quality of health care is high inmost EU countries, there are significant variations between countries with regard bothto quality and inclusivity (that is equality of access). Those systems that performedbest in 2015 were Luxembourg, the Netherlands, Belgium and Denmark, CzechRepublic, Austria and Sweden. Those performing worst were Romania, Latvia, Poland,Bulgaria and Greece.
67Key Services
5.
TAXAT ION
Taxation plays a key role in shaping societies by funding public services, supportingeconomic activity and redistributing resources to make societies more equal. Appropriateand equitable taxation levels and their targeting is also a subject of much debate andcontestation within individual countries. Eurostat publishes information on taxes whichallows comparison across countries and we will look at total taxation across countries inthis section. We will then consider this in light of some indicators of social inclusion andsocial investment.
5.1 Total Taxation as a percentage of GDPTaxation can be analysed as including or excluding compulsory social securitycontributions. One definition used by Eurostat encompasses all direct and indirect taxesreceived including social security contributions13 – and that is the one used in this section.The tax-take of each country is established by calculating the ratio of total taxation revenueto national income as measured by gross domestic product (GDP).
Ratios are currently available up to 2014 when the average amongst EU-28 countries was 40per cent (similar to the 2013 rate of 39.9 per cent). Taken as a whole, the European Union isa high-tax area relative to some other countries such as the United States and Japan.However, as Figure 32 shows, there is considerable variation between member states in theEU in respect of total taxes as a proportion of GDP. Seven countries have total taxation ratiosgreater than the EU average of 40 per cent (in 2014). This ranges from Denmark (50.8 percent) France, and Belgium (both at 47.9 per cent), to, at the other end of the scale, Romania(27.7 per cent), Bulgaria (27.8 per cent) Lithuania (28 per cent) and also Latvia and Ireland.
Eurostat appears to take 35 per cent of GDP as a ratio that represents a relatively low-taxapproach (Eurostat 2008:5).
Already before the 2004 enlargement, several member states had tax ratios close to 50 percent (such as the Scandinavian countries and Belgium), and also several low-tax MemberStates (such as Ireland, Spain, the UK and Greece) (Eurostat 2008). However, given thegenerally lower tax ratios in the accession countries, the 2004 and 2007 enlargementresulted in a significant decline for the EU average value. The highest ratios tend to be foundin the ‘old’ 15 members of the EU. As is seen in Figure 32, the first ten highest positions interms of overall tax ratio (in 2014) are all found amongst these countries.
68Taxation
E U R O P E A N R E S E A R C H S E R I E S
13 That is, taxes on production and imports, income and wealth, capital taxes, and compulsory socialcontributions paid by employers and employees (see Eurostat 2014:268)
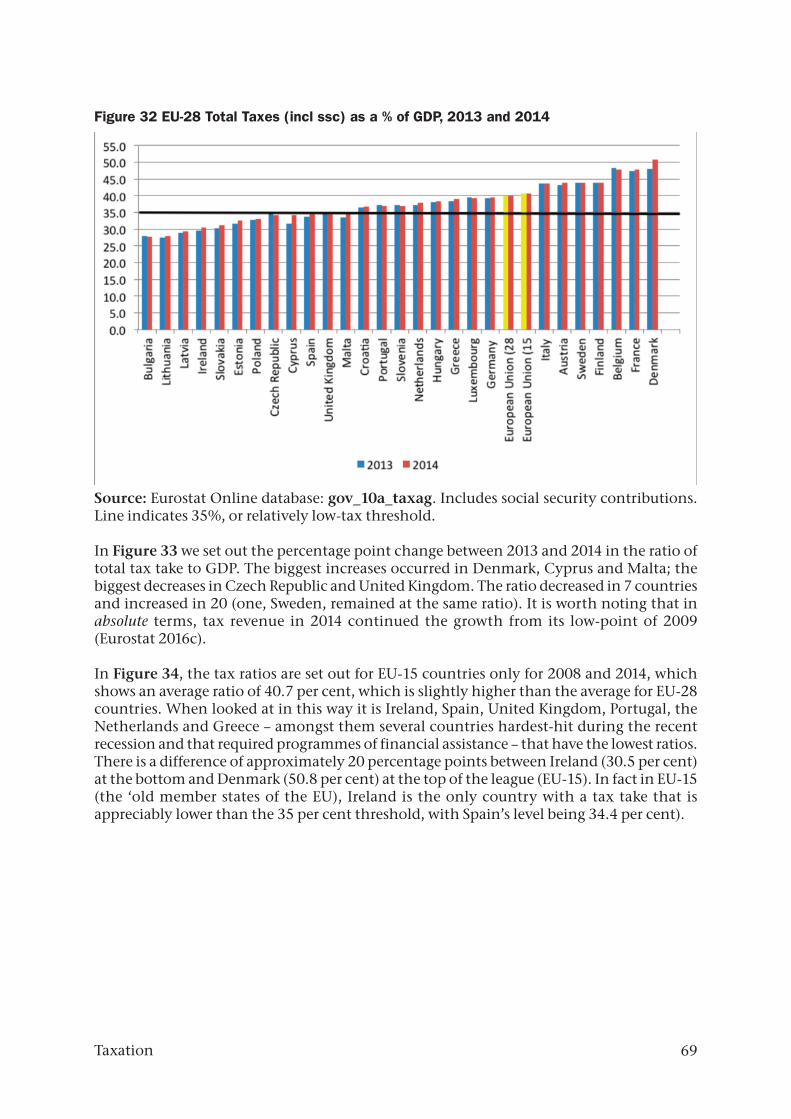
Figure 32 EU-28 Total Taxes (incl ssc) as a % of GDP, 2013 and 2014
Source: Eurostat Online database: gov_10a_taxag. Includes social security contributions.Line indicates 35%, or relatively low-tax threshold.
In Figure 33 we set out the percentage point change between 2013 and 2014 in the ratio oftotal tax take to GDP. The biggest increases occurred in Denmark, Cyprus and Malta; thebiggest decreases in Czech Republic and United Kingdom. The ratio decreased in 7 countriesand increased in 20 (one, Sweden, remained at the same ratio). It is worth noting that inabsolute terms, tax revenue in 2014 continued the growth from its low-point of 2009(Eurostat 2016c).
In Figure 34, the tax ratios are set out for EU-15 countries only for 2008 and 2014, whichshows an average ratio of 40.7 per cent, which is slightly higher than the average for EU-28countries. When looked at in this way it is Ireland, Spain, United Kingdom, Portugal, theNetherlands and Greece – amongst them several countries hardest-hit during the recentrecession and that required programmes of financial assistance – that have the lowest ratios.There is a difference of approximately 20 percentage points between Ireland (30.5 per cent)at the bottom and Denmark (50.8 per cent) at the top of the league (EU-15). In fact in EU-15(the ‘old member states of the EU), Ireland is the only country with a tax take that isappreciably lower than the 35 per cent threshold, with Spain’s level being 34.4 per cent).
69Taxation
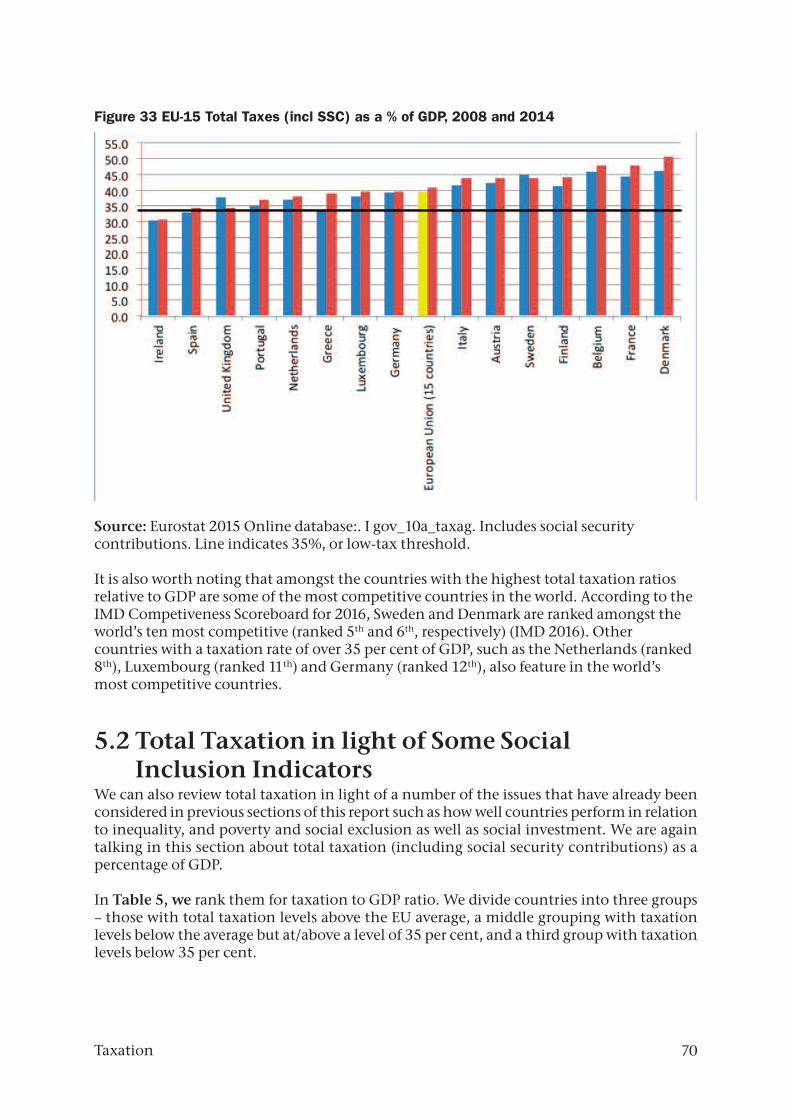
Figure 33 EU-15 Total Taxes (incl SSC) as a % of GDP, 2008 and 2014
Source: Eurostat 2015 Online database:. I gov_10a_taxag. Includes social securitycontributions. Line indicates 35%, or low-tax threshold.
It is also worth noting that amongst the countries with the highest total taxation ratiosrelative to GDP are some of the most competitive countries in the world. According to theIMD Competiveness Scoreboard for 2016, Sweden and Denmark are ranked amongst theworld’s ten most competitive (ranked 5th and 6th, respectively) (IMD 2016). Othercountries with a taxation rate of over 35 per cent of GDP, such as the Netherlands (ranked8th), Luxembourg (ranked 11th) and Germany (ranked 12th), also feature in the world’smost competitive countries.
5.2 Total Taxation in light of Some Social Inclusion Indicators
We can also review total taxation in light of a number of the issues that have already beenconsidered in previous sections of this report such as how well countries perform in relationto inequality, and poverty and social exclusion as well as social investment. We are againtalking in this section about total taxation (including social security contributions) as apercentage of GDP.
In Table 5, we rank them for taxation to GDP ratio. We divide countries into three groups– those with total taxation levels above the EU average, a middle grouping with taxationlevels below the average but at/above a level of 35 per cent, and a third group with taxationlevels below 35 per cent.
70Taxation
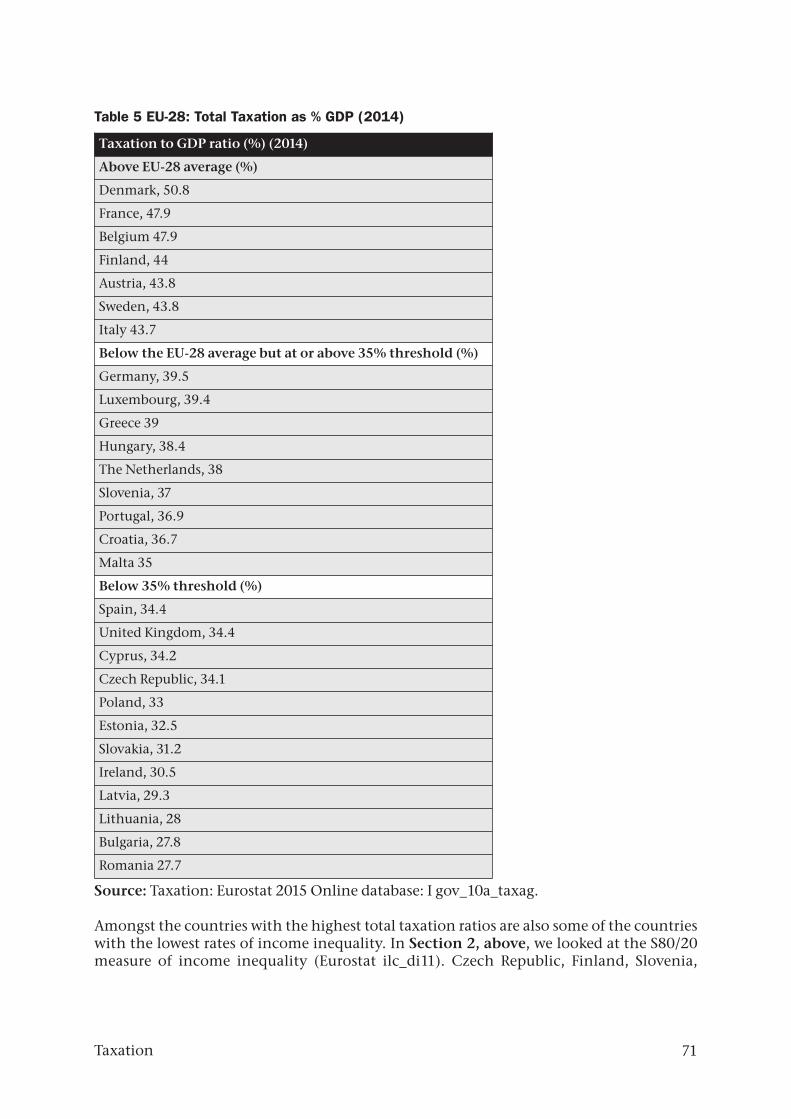
Table 5 EU-28: Total Taxation as % GDP (2014)
Source: Taxation: Eurostat 2015 Online database: I gov_10a_taxag.
Amongst the countries with the highest total taxation ratios are also some of the countrieswith the lowest rates of income inequality. In Section 2, above, we looked at the S80/20measure of income inequality (Eurostat ilc_di11). Czech Republic, Finland, Slovenia,
Taxation to GDP ratio (%) (2014)
Above EU-28 average (%)
Denmark, 50.8
France, 47.9
Belgium 47.9
Finland, 44
Austria, 43.8
Sweden, 43.8
Italy 43.7
Below the EU-28 average but at or above 35% threshold (%)
Germany, 39.5
Luxembourg, 39.4
Greece 39
Hungary, 38.4
The Netherlands, 38
Slovenia, 37
Portugal, 36.9
Croatia, 36.7
Malta 35
Below 35% threshold (%)
Spain, 34.4
United Kingdom, 34.4
Cyprus, 34.2
Czech Republic, 34.1
Poland, 33
Estonia, 32.5
Slovakia, 31.2
Ireland, 30.5
Latvia, 29.3
Lithuania, 28
Bulgaria, 27.8
Romania 27.7
71Taxation

Belgium, the Netherlands, Sweden and Slovakia all have relatively low ratios (below 4 in2014), which means that they have relatively low rates of difference between those at thetop 20 per cent and the bottom 20 per cent of income. Slovenia, the Netherlands, Sweden,Finland and Belgium all had total taxation rates at or above 35 per cent of GDP in 2014.Czech Republic is an interesting case – although they have a total tax ratio below 35 percent, they score well on income inequality. The Czech Republic does very well at preventingpoverty ‘despite only having average economic performance levels,’ evidencing theimportance of public policy choices (Schraad-Tischler, 2015).
Conversely, some of the countries with the lowest total taxation ratios also have the highestlevels of income inequality (again using the S80/20 indicator and for 2014) – notablyRomania (7.2), Spain (8.6), and Bulgaria (6.8) and also Estonia and Latvia. While Spain hasa high 20/20 ratio (8.6, second only to Romania at 7.2 amongst EU-28 countries), there is abig difference between the two countries in the total taxation to GDP ratio. Spain’s is 34.4per cent of GDP, while that of Romania is the lowest in the EU at 27.7 per cent – both ratiosare lower than the average and indeed both are lower than the 35 per cent low taxationthreshold but only marginally so in the case of Spain.
We can also look again at the levels of poverty or social exclusion set out above. There are 14countries that have below average rates (in 2014) of poverty or social exclusion. Eleven outof the fourteen have taxation ratios above 35 per cent. The only countries with taxationlevels above 35 per cent that also have below average rates of poverty or social exclusion areCzech Republic, Slovakia and the United Kingdom. In the case of the United Kingdom, itspoverty or social exclusion rate is only marginally below the EU average, and its totaltaxation to GDP ratio is just below the 35 per cent threshold (34.4 per cent, 2014). CzechRepublic, as we already noted, is considered to perform extremely well in preventingpoverty; Slovakia is also considered to perform relatively well in poverty prevention duemainly to the country’s comparatively even income distribution patterns (Schraad-Tischler,2015). As part of the context, it must be acknowledged, that income levels in post-communist countries are still considerably below those in Western Europe. In addition tothe overall level of taxation, a range of historical and institutional factors are probably alsorelevant to the outcomes achieved as are the social policies pursued (Schraad-Tischler andKroll 2014).
It is also of interest, that, as discussed earlier, the 2015 social justice index use by BertelsmannStiftung found that opportunities for every individual to participate broadly (in things likeeducation, health services and the labour market) are best developed in Sweden, Denmark,Finland and the Netherlands (Schraad-Tischler, 2015) – all countries with total taxation ratesabove 35 per cent, some of them with rates considerably higher. The authors note thatdifferent dimensions of social justice are linked. So weak educational opportunities translateinto weaker opportunities on the labour market and – as a consequence – into weakeropportunities to achieve higher incomes.
Social InvestmentHow well countries perform on social investment is discussed in Section 1.4, above. InTable 6 we compare countries’ rankings for total taxation against the way that they havebeen ranked on their approach to social investment (following the schema of Bouget et al2015 – see above).
72Taxation

Table 6 EU-28 Total Taxation as % of GDP and Social Investment Approaches
Source: Taxation: Eurostat 2015 Online database: I gov_10a_taxag. Approach to Social investment:Bouget et al 2015.
Taxation to GDP ratio (%) (2014) Social Investment Approach
Above EU-28 average (%)
Denmark, 50.8
France, 47.9
Belgium 47.9
Finland, 44
Austria, 43.8
Sweden, 43.8
Italy 43.7
Below the EU-28 average but at or above 35% threshold (%)
Germany, 39.5
Luxembourg, 39.4
Greece 39
Hungary, 38.4
The Netherlands, 38
Slovenia, 37
Portugal, 36.9
Croatia, 36.7
Malta 35
Below 35% threshold (%)
Spain, 34.4
United Kingdom, 34.4
Cyprus, 34.2
Czech Republic, 34.1
Poland, 33
Estonia, 32.5
Slovakia, 31.2
Ireland, 30.5
Latvia, 29.3
Lithuania, 28
Bulgaria, 27.8
Romania 27.7
Well established Social Investment ApproachPartial development of Social Investment approach; but still to develop a predominantly SocialInvestment ApproachSocial Investment Approach has not yet made inroads
73Taxation

All of the countries that are in Group 1 for social investment (identified by the EuropeanSocial Policy Network as having a well-established approach to many social policies, Bougetet al 2015), have tax takes that are above the 35 per cent line, and most are also above the EUaverage. These countries are Austria, Belgium, Germany, Denmark, Finland, France,Netherlands, Sweden and Slovenia.
When it comes to how the countries that are in Group 3 in relation to social investment(that is, the social investment approach has not made significant inroads into the overallpolicy agenda), it appears that seven out of ten of them have taxation rates that are belowthe 35 per cent line (many of them considerably so).
All but one of these countries (Italy) have taxation levels that are below the EU average. ThusItaly represents an exception, having a taxation rate above the EU-28 average and stillappearing in the worst grouping in terms of the development of a social investmentapproach.
5.3 Taxation - ConclusionWithout raising resources, countries cannot invest in infrastructure and services requiredto promote inclusion and to sustain development.
There is considerable variation between member states in the EU in respect of total taxes asa proportion of GDP. The highest ratios tend to be found in the ‘old’ 15 members of the EU.At the top end, 7 countries have total taxation ratios greater than the EU average of 40 percent. They include Denmark, France and Belgium (in 2014). The countries with the lowestratios are Romania, Bulgaria, Lithuania, Latvia and Ireland.
All of the countries that are identified by the European Social Policy Network as having awell-established approach to many social policies (Bouget et al 2015), have tax takes that areabove 35 per cent of GDP, and most are also above the EU average.
Countries in Scandinavia and Central Europe tend to demonstrate higher levels of taxation,and better protection of their populations from poverty and social exclusion. Amongst thesecountries are several deemed the world’s most competitive notwithstanding their relativelyhigh taxation levels. They also include countries that demonstrate the greatest incomeequality (based on the S80/20 indicator) and that are associated with the highest levels ofsocial justice – that is to say, they create the greatest opportunities for their populations toparticipate in society in a broad range of areas like education and health services.
In general, countries in the south and periphery of Europe tend to have lower levels oftaxation and also less well-developed social investment approaches, and higher rates ofpoverty or social exclusion. Amongst the newer accession countries – with a taxation ratiojust below the 35 per cent of GDP line in 2014– Czech Republic is notable for its performancein relation to prevention of poverty or social exclusion.
74Taxation
6.
ALTERNAT I VES : SOME I SSUES FORD ISCUSS ION
6.1 IntroductionWellbeing is a fundamental objective of EU policies: Article 3 of the Treaty on the Functioningof the European Union states that the Union’s aim is to promote ‘the well-being of its peoples’. The European Commission has noted how the best performing Member States in economicterms have developed more ambitious and efficient social policies, not just as a result ofeconomic development, but as a central part of their growth model (European Commission2016b). Good social protection systems are vital not only to social wellbeing but also toeconomic development. The European Commission acknowledges that countries providinghigh quality jobs and effective social protection as well as investment in human capital haveproved more resilient in the economic crisis (European Commission 2015a).
As already alluded to, during the recent crisis years the political discourse at European levelhas focused on fiscal consolidation and economic recovery as well as on protecting the euro.People in many countries have been affected by the economic crisis followed by harshausterity policies and they associate this with the European Union. Meanwhile talk of aneconomic recovery has yet to be experienced by many people in Europe and the EU’s effortsto create a more socially just Europe have not been as comprehensive, visible or as effective.Added to all of this is the fact that societies are now faced with profound questions for publicpolicy based on emerging technologies, the changing nature of the work force, and thedifferential impact on various demographic groups (West 2015).
This is the context in which the future of the EU must be decided – and in the opinion ofSocial Justice Ireland, it must be one in which it is recognised that economic development,social development and environmental protection are complementary and interdependent.This means that Europe must be seen as not only concerned with the goal of budgetaryconsolidation and the resolution of the debt crisis, but also with promoting justice andpromoting equality and social inclusion. Action to achieve this is required at European level.
As we outlined in the introduction to this report, for Social Justice Ireland, every person hasseven core rights that need to be part of the vision for the future: right to sufficient incometo live with dignity, to meaningful work, to appropriate accommodation; to relevanteducation, to essential healthcare, to real participation and the right to cultural respect. Inthis report, we have looked at how these rights are currently being realised or otherwise inthe areas of income, work, education and healthcare. In this Section, we wish to discusssome current debates and to point to some potential policy alternatives in the areas of
75
E U R O P E A N R E S E A R C H S E R I E S
Alternatives: Some Issues for Discussion
76
income, work and service-provision. Our intention is not to prescribe any particularapproaches, but rather to outline some pointers toward strategies that are currently beingemployed or are currently the subject of increasing debate and consideration.
6.2 Right to Sufficient Income Debates about how to achieve adequate income often involve discussions of (1) minimumwage, and increasingly the living wage, (2) minimum income schemes, and (3) basic incomeschemes. We will briefly discuss each of these approaches.
Minimum Wage and Living WageAs part of its Decent Work Agenda, the International Labour Organization encourages theuse of a minimum wage to reduce working poverty and provide social protection forvulnerable employees (2013). A minimum wage is the lowest remuneration (set hourly, dailyor monthly) that employers may legally pay to workers. It is recognised that settingminimum wages at appropriate levels can help prevent growing in-work poverty (EuropeanCommission, 2012). According to the International Monetary Fund, minimum wage policytypically aims to improve income distribution and it may also have important implicationsfor economic efficiency (2016).
Twenty-two out of 28 EU countries apply a generally binding statutory minimum wage(Eurofound 2016a). In the majority of EU Member States where there is no statutoryminimum wage, the minimum wage level is de facto set in (sectoral) collective agreements.Thus countries tend to have different mechanisms for setting the minimum levels and theirimpact can differ considerably. Bulgaria and Romania have the lowest minimum wage inthe EU, while Luxembourg has the highest (Eurofound 2016a). However, the IMF points toresearch showing that non-compliance is widespread in both advanced and emergingeconomies; they instance, for example, a report from the U.K. which found that 11 per centof workers in the social care sector were paid less than the minimum wage (Low PayCommission 2014 cited in IMF 2016).
There are different opinions on the usefulness of minimum wages, one criticism being thatthey only apply to those in paid employment, not self-employed or those doing family workor caring (International Labour Organization, 2013). Despite limitations, the InternationalLabour Organization has concluded that they remain a relevant tool for poverty reduction.
The Living Wage assumes that work should provide an adequate income to enable peopleto afford a socially acceptable minimum standard of living. It differs from the minimumwage approach, in being an evidence-based rate grounded in consensual budget standardsbased on research to establish the cost of a minimum essential standard of living. It providesan income floor, representing a figure that allows employees to pay for the essentials of life.The concept is derived from the United Nations Convention on Human Rights whichdefined the minimum as ‘things which are necessary for a person’s physical, mental,spiritual, moral and social well-being’. A Living Wage is intended to meet physical,psychological and social needs at a minimum but acceptable level (Living Wage TechnicalGroup, 2014). Earning below the living wage suggests that employees are forced to dowithout certain essentials to make ends meet.
The cost of a minimum essential standard of living or minimum income standard will varyby household type and composition, location, and employment pattern. Its calculation
Alternatives: Some Issues for Discussion
follows clearly stated and transparent processes specified for specific householdcompositions and situations (Living Wage Technical Group, 2014).
The Living Wage idea is not a new one. However, support is growing for it and research onit is expanding. Over 2,800 organisations have committed to pay a living wage and havebeen accredited by the U.K. Living Wage Foundation. They include FTSE 100 companiessuch as Barclays, HSBC, Pearson and Legal and General, as well as county and city councils,local authorities, charities, universities and diverse private sector companies of differentsizes and scales. While small businesses are usually perceived as having fewer resourcesavailable and thus to be less able to afford to pay higher wages, research from the U.Ksuggests that private sector SMEs constitute over half of all accredited Living Wage employers(Werner and Lim 2016). SMEs that have adopted a living wage perceive benefits related toemployee motivation and productivity, staff retention, employee relations and ability toattract high quality staff as well as benefits for business reputations (Werner and Lim 2016).It is interesting to note that the SMEs concerned were operating in so-called low-wagedsectors such as hospitality, retail, social care and manufacturing in England, Wales andScotland.
Minimum Income SchemesAdequate and effective social protection systems are the bedrock of a truly Social Europe,within which minimum income schemes are a safety net of last resort to ensure that no onefalls below an adequate minimum income (Frazer and Marlier 2016). Minimum incomeschemes are protection schemes of last resort aimed at ensuring a minimum standard ofliving for people of working age and their families when they have no other means ofsupport. They vary in coverage, comprehensiveness (that is, their availability generally tolow-income people) and effectiveness. As we discussed in last year’s report in this series, thelack of adequate minimum income schemes in several countries has been highlighted sincethe crisis in Europe. A recent review of minimum income schemes across Europe found thatthey play a vital role in alleviating the worst impacts of poverty and social exclusion.However, in many countries
• their contribution is still limited; • progress since 2009 has been disappointing, and • lack of adequate payments coupled with limited coverage and poor take-up (due
inter alia to poor administration, inadequate access to information, excessivebureaucracy and stigmatisation) means that they fall very far short of ensuring adecent life for the most vulnerable in society (Frazer and Marlier 2016).
Concerns about minimum income schemes focus on affordability and about fears that theywill disincentivise work. However, according to the Independent Network of Experts onSocial Inclusion, in countries with the most generous and effective minimum incomeschemes, there is also a clear recognition that they play a vital role in ensuring that peopledo not become so demoralized and excluded that they are incapable of participation inactive inclusion measures and in seeking work (Frazer & Marlier, 2009).
The issue of a minimum income scheme across Europe is now receiving attention atEuropean level. The consultation draft of the European Pillar of Social Rights refers to theintegration of social benefits and services and suggests that: ‘Adequate minimum incomebenefits shall be ensured for those who lack sufficient resources for a decent standard ofliving’ (European Commission 2016b, Annex I: 15).
77Alternatives: Some Issues for Discussion

78
However, as mentioned in the introduction to this report, we do not yet know what formthe Pillar of Social Rights will ultimately take or how effective it will be. A Communicationfrom the European Commission on the issue of strengthening the social dimension of theEMU raised the issue of a stabilization scheme to absorb shocks - an insurance system topool the risks of economic shocks across member states (2013d).
The opinion of the EU Network of Independent Experts on Social Inclusion is that aFramework Directive is one of the best options for a legislative initiative on minimumincome (Frazer and Marlier 2016). The European Parliament has called on the EuropeanCommission to launch a consultation on the possibility of a legislative initiative. However,there are also debates about whether the European Commission has the capacity tointroduce a Framework Directive to achieve this (Frazer and Marlier 2016). A report for theJacques Delors Institute argued that “a European common framework to improve onminimum income protection would give substance to the discourse on the ‘Triple ‘A’ SocialRating14’ (Rinaldi 2016:73/74).
Basic Income SchemesThe inability to tackle unemployment with conventional means has led to the idea of a basicincome being discussed throughout Europe and more widely. The Basic Income concept isreceiving more attention in recent times partly in response to new technologicaldevelopments including artificial intelligence and robotics, which are expected to transformthe nature of work and the type and number of jobs. Put succinctly, if more jobs becomeobsolete, there still have to be ways for people to get health care, pensions, disability, andincome supplements outside of full-time employment (West 2015). It is argued that a basicincome scheme offers ‘a powerful way of protecting all citizens from the great winds ofchange to be ushered in by the fourth industrial age, and of sharing the potentially massiveproductivity gains that it will bring’ (Reed and Lansley 2016:8). Another argument in favourof changing our system of income generation is that it can address growing inequality and,it is argued, a universal basic income that grows in line with capital productivity wouldensure that the benefits of automation go to the many, not just to the few (Skidelsky 2016a).
A basic income is very different to a minimum income. A minimum income seeks to ensurea minimum standard of living for people of working age and their families with no othermeans of support. By contrast, a basic income involves giving everyone a modest, yetunconditional income, and letting them top it up at will with income from other sources(Van Parijs, 2000). It is paid directly with a smaller payment for children, a standard paymentfor every adult of working age and a larger payment for older people. It is never taxed but inessence replaces tax credits (for those with jobs) and social welfare payments (for thosewithout jobs). Additional payments would be maintained for those with particular needs(such as those who are ill or have a disability). As defined by the Basic Income Earth Network,a basic income is: an income unconditionally granted to all on an individual basis, withoutmeans test or work requirement. It is a form of minimum income guarantee that differs fromthose that now exist in various European countries in three important ways:
a. it is being paid to individuals rather than households;b. it is paid irrespective of any income from other sources;
Alternatives: Some Issues for Discussion
14 The Five Presidents’ Report on Completing Europe’s EMU stresses that “Europe’s ambition should be to earn a‘social triple A’”

c. it is paid without requiring the performance of any work or the willingness to accepta job if offered.
If social policy and economic policy are no longer conceived of separately, then basicincome is increasingly viewed, according to the Basic Income Earth Network, as the onlyfeasible way of reconciling two of their central objectives: poverty relief and fullemployment. Every person receives a weekly tax-free payment from the Exchequer whileall other personal income is taxed. The basic income would replace income from socialwelfare for a person who is unemployed and replace tax credits for a person who is employed(Healy et al, 2012).
Amongst its advantages is lack of stigma - there is nothing stigmatising about benefits givento all as a matter of citizenship, something that cannot be said, even with well-designedprocesses, about benefits reserved for ‘the needy, the destitute, those identified as unable tofend for themselves’ (Van Parijs, 2000). So it helps to overcome the problem of non-take-upof benefits, something which is observed in some EU countries (Eurofound 2015). It alsoremoves unemployment traps because it does not cease if someone takes up employment –one is bound to be better off working as you can keep the basic income and earnings on topof it - and it incentivizes increasing one’s income while employed. It promotes genderequality also because everyone is treated equally and it respects forms of work other thanpaid work – like work in the home or informal caring. It is also considered more guaranteed,simple and transparent than current tax and welfare systems (Healy et al, 2012).
There are a range of basic income proposals. They differ in many respects including as tothe amounts involved, the source of funding, the nature and size of the reductions in othertransfers. Some propose financing through tax and welfare systems. In practice this wouldmean that those on low and middle-income would see net gains while the richest would berequired to pay more tax as many tax breaks would be removed. Others propose that a BasicIncome be financed by environmental taxation or a financial transactions tax. Currentdiscussion is focusing increasingly on so-called partial basic income schemes, which wouldnot be full substitutes for present guaranteed income schemes but would provide a low - andslowly increasing - basis to which other incomes, including the remaining social securitybenefits and means-tested guaranteed income supplements, could be added.
Proponents of basic income see it as an inclusion measure to address the problem of largenumbers of people excluded from modern economies, including people who do not havepaid work and in a world where paid employment cannot be permanently guaranteed foreveryone seeking it – thus it is intended to provide meaningful participation by movingbeyond a wage-based society.
Opponents of basic income focus on perceived restrictions of freedom or on a perceivedhigh tax rate to finance it and one of the features of the international debate revolves aroundthe role of society as against the role of markets (Government of Ireland, 2002).
A range of countries have introduced basic income schemes (or partial schemes) or areconsidering doing so. In Switzerland, a national referendum on the implementation of ascheme was rejected in 2016, something associated with fears that it had not beencomprehensively costed (Editorial, the Guardian, 6.6.2016). A partial basic income systemhas existed for decades in the US state of Alaska financed by taxes paid on oil produced inthe State. In 2012 The World Bank published a detailed study which identified 123 BasicIncome systems in various parts of Sub-Saharan Africa (Garcia and Moore, 2012). In Finland,
79Alternatives: Some Issues for Discussion

a basic income pilot project was authorised by parliament in December 201615. The pilot wasdesigned to assess whether basic income can be used to reform social security, specificallyto reduce incentive traps relating to working (Ministry for Social Affairs and Health 2016).In the Netherlands city of Utrecht and other municipalities, a pilot project called “WetenWat Werkt,” or “Know What Works” is due to roll-out in 2017.
A recent U.K report estimated the net annual cost of a modified (transitional) basic incomescheme there at around £8bn or just under 0.5 per cent of GDP, something that may bejudged as a relatively modest sum in relation to the huge benefits and the reduction inpoverty and inequality that it delivers such as a sharp increase in average income amongstthe poorest; a cut in child poverty of 45 per cent; and a modest reduction in inequality (Reedand Lansley 2016). During 2016 Britain’s Labour Party committed to exploring the issuefurther and the idea is already backed by the Green Party and the SNP and the pro-marketthink-tank, the Adam Smith Institute (Lansley and Reed 2016).
The experience in Ontario in Canada illustrates that support for a universal basic incomecan come from both right and left-wing perspectives. There a pilot is about to be rolled outchampioned by amongst others Hugh Segal, a Conservative political strategist (TheGuardian 2016). One of the things that is persuasive of this idea in Ontario is how in the1970s a universal pension scheme for older people reduced poverty and led to a series ofother positive effects such as increased longevity and independence of the health system,something achieved without adding more bureaucracy.
6.3 Right to Meaningful WorkThe dominant policy framework in Europe and elsewhere in response to persistent highunemployment focuses on the notion of full-employability and understands unemploymentin terms of skills shortages, bad attitudes of individuals and/or disincentives to work that existin welfare systems or other alleged rigidities like minimum wages or employment legislation(Mitchell and Flanagan 2014). Thus it is a supply-side understanding, which can be consideredto ignore other causes – such as lack of jobs and spatial spill-overs (Mitchell and Flanagan 2014).
Progressive approaches to jobs policy are investigating how to achieve full employment, asa key to well-being (there being evidence that high well-being is associated with low levelsof unemployment and high levels of job security), something that involves satisfying workin the right quantities within a broader economy that respects environmental limits(Greenham et al, 2011).
Thus basic questions are now being asked about whether the market economy is capable ofdelivering what is now needed, particularly in light of the move away from industry andmanufacturing towards a knowledge economy. Increasing developments in artificialintelligence also evoke anxiety about potential job losses. One influential study publishedin 2013, estimating that 47 per cent of workers in America had jobs at high risk of potentialautomation (Economist 2016). All of this poses the question whether the ‘trickle-downeffect,’ that is, the wealth and job creation potential of entrepreneurs and wealthyindividuals, can really deliver even full employment.
80Alternatives: Some Issues for Discussion
15 http://www.kela.fi/web/en/basic-income-objectives-and-implementation

One of the debates that arises in this context is the need to recognise and value all work.Another relates to government guaranteeing work as a response to widespreadunemployment, particularly long-term unemployment which has damaging consequencesfor individuals and for the wellbeing of society. A further approach relates to reductions inhours worked by everyone. Finally, the need for investment by government will beconsidered.
Valuing All WorkIdeas about who we are and what we value are shaped by ideas about paid employment andthe priority given to paid work is a fundamental assumption of current culture and policy-making. Other work, while even more essential for human survival and wellbeing, such ascaring for children or sick/disabled people, often done by women, is almost invisible inpublic discourse. But because well-being relies on work and relationships (and other things),there must be a fair distribution of the conditions needed for satisfactory work andrelationships – and this is particularly important for gender equality.
There is a need to recognise all work, including work in the home, work done by voluntarycarers and by volunteers in the community and voluntary sector. Their contribution tosociety is significant in terms of social and individual well-being, and in economic terms.The European Commission estimates that the time spent on housework and care per daycould represent +/-830million hours per day in the EU or nearly 100 million full-timeequivalent jobs (European Commission, 2012a). Research from the UK suggests that if theaverage time spent on unpaid housework and childcare in 2005 was valued in terms of theminimum wage it would be worth the equivalent of 21 per cent of GDP (Coote et al, 2010).Introduction of a basic income (see above) is one means of enabling the recognition of allmeaningful work in practice.
Jobs Guarantee SchemesMany job guarantee proponents see employment as a right. Unemployed people cannotfind jobs that are not there, notwithstanding activation measures. Thus thinking has beendeveloped around the idea of jobs guarantee schemes. High levels of unemployment co-exist with significant potential employment opportunities, especially in areas such asconservation, community and social care. A jobs guarantee scheme involves governmentpromising to make a job available to any qualifying individual who is ready and willing towork. Jobs guarantee schemes are envisaged in different ways with the most broad approachbeing a universal job guarantee, sometimes also called an employer of last resort scheme inwhich government promises to provide a job to anyone legally entitled to work. Apart froma broad, universal approach, other schemes envisage qualifications required of participantssuch as being within a given age range (i.e. teens or under, say, 25), gender, family status(i.e. heads of households), family income (i.e. below poverty line), educational attainmentand so on.
The concept involves government absorbing workers displaced from private sectoremployment. It involves payment at the minimum wage, which sets a wage floor for theeconomy. Government employment and spending automatically increases as jobs are lostin the private sector.
Amongst those championing the idea is the Centre of Full Employment and Equity,University of Newcastle, Australia. Based on an analysis across countries, they argue that
81Alternatives: Some Issues for Discussion
the private sector has always only been able to employ around 77 per cent of the labourforce; unless the public sector provides jobs for the remaining workers seeking employment,unemployment will remain high16 (Centre of Full Employment and Equity, undated). Costsof Jobs Guarantee Schemes have been calculated for a number of countries and it isconsidered relatively cheap, in comparison with the costs associated with unemployment17.It also results in a multiplier effect from the contributions to the economy of the workersconcerned (Centre of Full Employment and Equity, undated). Furthermore, such schemesare considered to promote economic and price stability, acting as an automatic stabilizer asemployment (within the scheme) grows in recession and shrinks in economic expansion,to counteract private sector employment fluctuations (Wray 2009).
The Job Guarantee proposal acknowledges the environmental problem and the need tochange the composition of final economic output towards environmentally sustainableactivities. The required jobs could provide immediate benefits to society, and are unlikely tobe produced by the private sector - they include urban renewal projects and otherenvironmental and construction schemes (reforestation, sand dune stabilisation, river valleyerosion control and the like), personal assistance to older people, assistance in communitysports schemes, and many more (Centre of Full Employment and Equity, undated).
Such schemes are not intended to subsidise private sector jobs or to threaten to undercutunionised public sector jobs. Any jobs with a set rate of pay or in the private sector shouldnot be considered. Only those jobs that directly benefit the public and do not impinge onother workers should be considered. Neither is a Job Guarantee Scheme intended to replaceother social programmes. However, Job Guarantee Schemes could complement a socialsupport system such as a Basic Income scheme (see above).
Job creation schemes have been implemented in different parts of the world, some narrowlytargeted, others broadly-based. Examples include, the 1930s American New Deal whichcontained several moderately inclusive programmes; a broad based employmentprogramme existed in Sweden until the1970s; Argentina created Plan Jefes y Jefas thatguaranteed a job for poor heads of households; and India also has a scheme (Wray 2009).The EU Youth Guarantee scheme, in which member states committed to ensure that allyoung people up to the age of 25 receive a high-quality offer of a job, an apprenticeship ora traineeship within four months of becoming unemployed or leaving formal education isan example of a partial jobs guarantee scheme. While a valuable initiative, one problem thatarises in schemes such as this, often introduced in difficult economic times, is that theadditional resources required to be provided at national level are often taken from otherservices that may well have been supporting other unemployed or vulnerable people whowere long-term unemployed or were outside the age group to whom the new initiativeapplies. The end result may not reduce the overall problem of unemployment or socialexclusion.
82Alternatives: Some Issues for Discussion
16 Excluding, presumably, recent examples such as Ireland in the 2000s, where with hindsight it is evident thatthe very high levels of employment were based on an enormous boom in construction based on recklesslending and fuelled by what became one of the biggest banking crisis in the world.
17 For example, in Ireland, Social Justice Ireland has made proposals to Government for a Part-Time JobOpportunities Programme that has already been piloted and costed. Also a costed proposal has beenpublished in Greece by the Observatory of Economic and Social Development and other organisations(Antonopoulos et al, 2014).
Shorter Working-WeekThe starting point for debates about shortening the working week is that there is nothing‘normal’ or inevitable about what is considered a typical working day today, and that whatwe consider normal in terms of time spent working is a legacy of industrial capitalism thatis out of step with today’s conditions. A number of proposals exist. The New EconomicsFoundation proposed a rebalancing of work and time involving a new industrial and labourmarket strategy to achieve high-quality and sustainable jobs for all, with a stronger role foremployees in decision-making and a gradual move towards shorter and more flexible hoursof paid work for all, aiming for 30 hours (4 days) as the new standard working week.
These proposals are intended to address problems of overwork, unemployment, over-consumption, high carbon emissions, low well-being, entrenched inequalities and lack of timeto live sustainably, to care for each other or to enjoy life. Crucial to this kind of proposal is thatmade already about moving toward valuing both paid work and unpaid work; it is intended tospread paid work more evenly across the population, reducing unemployment and its associatedproblems, long working hours and too little control over time. It is also intended to allow forunpaid work to be distributed more evenly between men and women, and for people to spendmore time with their children and in contributing to community activities.
Mexican telecoms billionaire Carlos Slim (often identified as one of the richest people inthe world) is amongst those who have expressed support for this, suggesting that a newthree-day working week could and should become the norm as a way to improve people’squality of life and create a more productive labour force. A UK doctor, John Aston, Presidentof the UK Faculty of Public Health (a body that represents over 3,000 public health expertsin the UK), also called for a four day week to deal with the problem of some people workingtoo little others too much and to improve the health of the public (Guardian, 2014).
InvestmentKeynesian economic policies require active government intervention in ways that are‘countercyclical’. In other words, deficit spending when an economy suffers from recessionor when unemployment is persistently high, and suppression of inflation during boomtimes by either cutting expenditure or increasing taxes: ‘the boom, not the bust, is the righttime for austerity at the treasury.’
With some European countries still implementing austerity measures, growth levels stillsubdued and unemployment still high in many countries, there is a need for policy-makersto consider investment on a sufficiently large scale to create growth required to generate thejobs. Many observers believe Europe’s nascent recovery is far too feeble to seriously overcomethe dramatic social crisis that Europe is confronted with today (Hemerijck 2014).
Due to the new EU governance rules, any such investment might now have to come fromoff-balance sheet sources (such as Commercial Semi-State borrowing or EuropeanInvestment Fund or pension fund investments). The areas for investment would need to becarefully chosen aiming for job-intensive investment in essential sectors with potentiallysubstantial returns. Examples include building new infrastructure and facilities, whichmight include social housing, better public health or education facilities, investment in keyinfrastructure like water or in sustainable energy sources. Substantial investment of this kindwould of itself lift economic growth rates and there would be a multiplier effect by creatingfurther economic activity and growth, increases in taxes and decreases in social welfarespending.
83Alternatives: Some Issues for Discussion
It should be possible for the European fiscal governance rules to accommodate and indeedto encourage, when appropriate, investment of this nature as a basic tool of economic policywithin the capacity of governments. In this context it is of interest that the OECD hasrecently recommended a stronger collective policy response to economic challenges,including a commitment to raising public investment to support future growth and makeup for the shortfall in investment following the cuts imposed across advanced countries inrecent years (2016c).
6.4 Right to Access to Quality ServicesAccess to high-quality ‘services of general interest’ is an important aspect of social protection,contributing to ‘inclusive growth’, a main objective of the Europe 2020 strategy. At least fivetypes of welfare system are recognised as operating in Europe18 and change happens all thetime (Abrahamson, 2010). General trends that have been observed include expansionism(from the 1950s to the 1970s) followed by uncertainty and challenge associated with neo-liberalism and a newer trend, which can be described as ‘productivist’ (Taylor-Gooby, 2008).The ‘productivist’ approach, called a ‘new social investment state’ is promoted by the EU andthe OECD and emphasises social investment with a desire to maintain the range of massservices but with pressure for cost-efficiency (Taylor-Gooby, 2008).
Following the economic crisis, policy-makers in Europe have sought to learn from theexperience. Amongst the positives that have emerged is the commitment to the SocialInvestment Package as well as further debate about a genuine ‘social’ dimension to the EMU.We have discussed the Social Investment Package in the introduction to this report, Typicalsocial investment policies include gender-related child and elder-care, family-friendly labourmarket regulation, allowing especially women to move back and forth between full-timeand part-time employment in relation to evolving informal care responsibilities (Hemerijck2014). Social investment is not, however, a substitute for social protection and adequateminimum income protection is a critical precondition for an effective social investmentstrategy as a ‘buffer’ helping to mitigate social inequity while at the same time stabilizingthe business cycle (Hemerijck 2014).
Ongoing challenges exist regarding quality and equity of public services, includinghealthcare, and to their sustainability. European population ageing, increased expectationsof citizens, and other factors impinge on demand for services and require a range ofresponses across the life-course. Similar investments by different countries have differentoutcomes in terms of poverty, employment and health, suggesting that there is variationin the ways that resources are used (European Commission, 2013e).
Some of the issues that are informing current debates include the following:
Securing Adequate Investment? Support for social investment in recent decades is basedon the aspiration of men and women of all socio-economic backgrounds to be employedand to raise children. Consequently, they have been willing to provide the investmentrequired to provide services capable of making that possible. In difficult economic times,however, there is more and more scrutiny of social spending. In the years ahead there is a
84Alternatives: Some Issues for Discussion
18 The regimes can be categorised in different ways; typically five are recognised: Continental North-westernEurope, Scandinavian model, Southern/Mediterranean model, Atlantic Europe (UK and Ireland) and EasternEuropean (Abrahamson, 2010).

real danger that in hard-hit countries there will be a growing marginalization of socialspending. This danger is exacerbated in the Eurozone because national and EU monetaryauthorities have very little room for manoeuvre. The emphasis is on deficit reduction, whichwill continue to starve social provision of the financing required for ongoing development.There is a strong risk that support for social investment will decline. This situation isworsened as electorates seem to forget that the crisis of recent years originated in the excessesin deregulated financial markets, not in excess welfare spending. This leads to a rejection ofwelfare spending because they misunderstand it as being the cause of the crisis which itwasn’t.
Who Provides? Public services are not synonymous with the public sector. A wide range ofactors are now involved in service provision and the mix differs from country to country(and has done so historically). As well as the public sector, these include:
• people and families, • non-profit organizations and social enterprises, and • the private sector.
While it is considered that there is now more scope for private and civil society to beinvolved in service provision, the state is still in charge of regulation and to a large extentalso in the financing of social entitlements (Abrahamson, 2010). In relation to the privatesector, the European Commission notes that there needs to be encouragement to use thepotential of social investment more through on-the-job training, in-house childcarefacilities, health promotion and family-friendly workplaces (2013e).
Public Value? The central plank of the influential ‘public value’ approach to the publicsector is that public resources should be used to increase value not only in an economicsense but also in terms of what is valued by citizens and communities. It is associated withMoore, who argues that public services are directly accountable to citizens and theirrepresentatives and it requires ongoing public engagement and dialogue as well as rigorousmeasurement of outcomes (1995). The approach involves the following building blocks:
• providing quality services for users, which are cost effective,• ensuring fairness in service provision, • concentrating more on the outcomes as well as on the costs and inputs,• building trust and legitimacy by convincing people that policy is geared toward
serving the overall public interest (NESF, 2006).
These building blocks are linked and the improvement of public services is intended togenerate support for them amongst users and others who pay for them indirectly throughtaxation. User satisfaction is shaped by factors such as customer service (that is, how wellthey are treated), information, choice, availability and advocacy (that is, knowing that theservices will be available to them when needed and that they will be supported in gettingaccess to them).
Social wage: Public services such as healthcare and schooling, childcare and adult socialcare, can be said to comprise a ‘social wage’ that helps to determine how much earnedincome people consider ‘enough’ (Coote et al 2010). The extent to which these servicesrelieve pressures on household income depends on their accessibility, reliability, quality,and overall affordability. In recent times in many countries, public services have beencurtailed/targeted and in some countries stripped to essentials by outsourcing andcompetitive tendering, or have had some costs transferred to the user – as is the case inrelation to healthcare costs in some European countries (European Observatory on Health
85Alternatives: Some Issues for Discussion
Systems and Policies, 2012). While there are different definitions, discussions of the ‘socialwage’ generally define it as disposable income plus public provision of goods and services(such as health care and education). It is sometimes used in discussions of governmentspending and it can be a way of characterising the contribution that public services maketo individuals and households. For example, the South African National Development plan(to 2030) references the social wage and characterises is as complementing employmentearnings and contributing to more equitable and inclusive economic growth (South AfricanNational Planning Commission, 2012).
It is a measure of how much better-off individuals are with the provision of publicly fundedwelfare services than they would be without these ‘in kind’ benefits (i.e. if they had to paythe full cost of these services). Thus the value of services such as health and social care,education and housing can be thought of as an income in-kind – or a ‘social wage’ – thatrepresents a substantial addition to people’s cash incomes (Sefton 2002). Although mostmeasures of poverty and inequality do not take account of the value of these kinds ofbenefits in kind, their inclusion is potentially significant in monitoring the impact of publicpolicies on the poorest households (Sefton 2002).
Reduced public spending and a corresponding diminished social wage requireindividuals/households to spend on essential services and this increases barriers to accessfor poorer people (McCarthy 2015). Obviously, maintaining the social wage requires thestate’s revenue base is protected. More, better and free public services – for everyone, notjust the very poor – would certainly make it easier to live on lower levels of earned income,but this would depend very largely on increasing tax revenues (Coote et al 2010) in manycountries.
6.5 Other Key IssuesThere are other issues of overarching importance that we are not focusing on in this report.However, we wish to refer to two of them briefly - the need for greater representation inpolicy-making and the need for environmental sustainability.
RepresentationAny new policy directions are affected by the fact that Europeans are experiencing a senseof frustration with consequent risks of alienation and social disruption. There is evidenceof declining trust in public institutions and increases in social tensions and increases ineuro-scepticism. Many voters felt that the EU’s dominance of national economic policy inthe crisis meant they could change government but not policy (Leonard & Torreblanca,2013) and, as discussed in the introduction to this report, this lesson has been underlinedby the rise of Euroscepticism across Europe.
Ways of addressing this are associated with the concept of ‘deliberative democracy’ whichchampions informed debate, emphasising politics as an open-ended and continuouslearning process (Held, 2006). The Europe 2020 Strategy envisages a partnership approachthat would aim to foster joint ownership. But the views of the weaker stakeholders must beable to be heard and be capable of influencing decisions and results.
Potentially very valuable is the Charter on Shared Social Responsibilities which argues thathaving a well-defined deliberative process can ensure, among other things, that individual
86Alternatives: Some Issues for Discussion
preferences are reconciled with widespread priorities in the field of social, environmentaland intergenerational justice. It can also reduce the imbalances of power betweenstakeholders (Council of Europe, 2014).
SustainabilityAs already stated, Social Justice Ireland believes that the future must be one in which it isrecognised that economic development, social development and environmental protectionare complementary and interdependent. Pollution and depletion of resources have throwninto doubt the reliance on untrammeled market forces as the key driver of wellbeing foreveryone. The current approach is patently unsustainable and economic policy must bedesigned to prevent catastrophe. Indeed several of the alternatives that we have outlinedabove have been developed taking account of environmental limitations.
A successful transition to sustainability requires a vision of a viable future societal modeland also the ability to overcome obstacles such as vested economic interests, political powerstruggles and the lack of open social dialogue (Hämäläinen, 2013). A number of approachesto a sustainable economy have been outlined, all involving transformative change (forexample the ‘performance economy’ associated with Stahel and the ‘circular economy’associated with Wijkman). Another is the concept of the ‘Economy of the Common Good’,based on the idea that economic success should be measured in terms of human needs,quality of life and the fulfilment of fundamental values (Felber 2010). This model proposesa new form of social and economic development based on human dignity, solidarity,sustainability, social justice and democratic co-determination and transparency andinvolving the concept of the common good balance sheet showing the extent to which acompany abides by values like human dignity, solidarity and economic sustainability.
All three pillars – economic, social and environmental - must be addressed in a balancedmanner if development is to be sustainable and sustainability must be a criterion for allfuture public policies.
87Alternatives: Some Issues for Discussion

7.
SUMMARY,CONCLUS IONS ANDRECOMMENDAT IONS
7.1 Summary of FindingsThis report has examined social developments in Europe under a range of indicators ofpoverty and income, employment and unemployment, and has also looked at howEuropean countries perform on certain indicators in respect of education and health. Wealso examined levels of total taxation as a proportion of GDP amongst European countriesin light of these indicators and also in light of their respective approaches to socialinvestment. Finally, we set out some alternative policy approaches in the previous sectionof this report.
In this final Section, we summarise our findings, draw some conclusions and finish withsome recommendations for European and national leaders.
Poverty and IncomeIn relation to poverty or social exclusion we find that Europe moved further away from thetargets set in the Europe 2020 Strategy in the years following its adoption. The picture thatemerges in the 2013-2014 period (the latest for which Eurostat has published rates) suggeststhat, following years of dis-improvement, there is now stagnation in many of the indicatorsused to measure progress under the strategy while some continue to worsen. See Table 7.
Levels of poverty or social exclusion are still higher than prior to 2008, while showing avery slight improvement between 2013 and 2014 (the greatest improvements occurring inthe newer accession states of Bulgaria, Lithuania, Hungary and Latvia). In 2014 the numbersaffected still amounted to over 122 million people (EU-28) or 24.2 per cent of the populationof the EU (that is, almost 1 in 4 people). There are very great divergences between thecountries: differences of the order of 25 percentage points exist between the countries withthe highest rates (Bulgaria and Romania) and those with the lowest rates (Czech Republicand the Netherlands).
Amongst the groups most affected are the unemployed, while amongst household types,single parents have significantly higher rates.
It is notable that those countries identified by the European Social Policy Network as havinga well-established approach to social investment tend to do well at protecting their
88Summary, Conclusions and Recommendations
E U R O P E A N R E S E A R C H S E R I E S

populations from poverty or social exclusion relative to other countries with a less welldeveloped social investment approach.
In 2014, over 86 million people in Europe were experiencing income poverty (measured bythe at risk of poverty indicator – 60 per cent threshold), a slight increase on the 2013 rate.In six member states one fifth or more of the population was at risk of poverty. There is anindication that the depth of poverty worsened between 2013 and 2014 with an increase inthe rate of risk of poverty at the 40 per cent threshold (that is, those with an income at orbelow 40 per cent of the national median equivalised income). Those living at this low levelamounted to more than 31 million people in 2014.
When we look at the severe material deprivation indicator, there is great divergence acrosscountries, with particularly high rates amongst the newer accession countries. However,between 2013 and 2014 the rates rose (albeit very slightly in some cases) in countries withinEU-15 – that is, ‘old’ members of the union. The greatest deterioration between 2013 and2014 in this rate occurred in Greece.
Children (that is, under 18s) were strongly affected by the economic crisis and their positionis highlighted by the Social Protection Committee as one of the areas where there has beengreatest deterioration since 2008 – something that has long-term consequences for thepeople and families concerned as well as for the EU as a whole. Children in poverty or socialexclusion amounted over 26 million in 2014 (which is over a quarter of all children). Thereis great divergence in the rates across the EU and the lowest rates are in the Nordic countriesof Denmark, Finland and Sweden. Between 2013 and 2014, the greatest increase occurred inSpain. However, Czech Republic and Finland, countries with relatively low overall rates, alsohad increases of a similar magnitude.
When we look at income poverty, the at risk of poverty rate in children rose between 2013and 2014, and approximately one fifth of Europe’s children were affected in 2014 (that is,living below the 60 per cent threshold of median income in their countries). When we lookat severe material deprivation (that is, lacking certain key resources) approximately 10 percent of children were affected in 2014.
Where older people are concerned (those over 65), about one in 6 were affected by povertyor social exclusion in 2014, representing nearly 16.3 million people (EU-28). Betweendifferent countries, there is great variation in the rates, and this is also true in respect ofsevere material deprivation amongst this group. When we look at income poverty in 2014(or the at risk of poverty rate, 60 per cent threshold), the highest rates occurred in some ofthe newer accession countries. Where severe material deprivation is concerned, there is anapproximately 40 percentage points difference between the country with the highest rate,Bulgaria (notwithstanding a recent, significant decrease in the rate), and those with thelowest rates, Luxembourg and Sweden.
Rates of both income poverty and severe material deprivation are considerably higher forolder women than older men and, because women tend to live longer than men, this meansthat very much larger numbers of women are affected.
The rate for working poor – those who have a job but still live in poverty - increased between2013 and 2014 and the Social Protection Committee has identified this as a negative trendto watch (2016).
89Summary, Conclusions and Recommendations
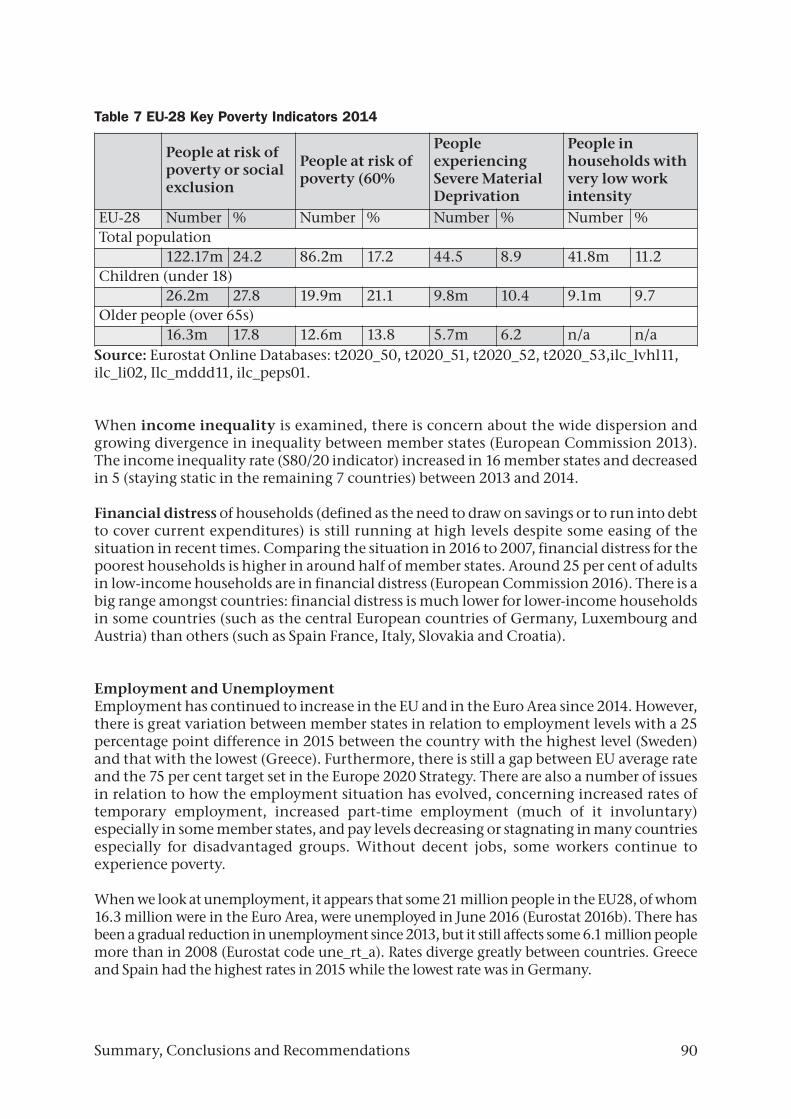
Table 7 EU-28 Key Poverty Indicators 2014
Source: Eurostat Online Databases: t2020_50, t2020_51, t2020_52, t2020_53,ilc_lvhl11,ilc_li02, Ilc_mddd11, ilc_peps01.
When income inequality is examined, there is concern about the wide dispersion andgrowing divergence in inequality between member states (European Commission 2013).The income inequality rate (S80/20 indicator) increased in 16 member states and decreasedin 5 (staying static in the remaining 7 countries) between 2013 and 2014.
Financial distress of households (defined as the need to draw on savings or to run into debtto cover current expenditures) is still running at high levels despite some easing of thesituation in recent times. Comparing the situation in 2016 to 2007, financial distress for thepoorest households is higher in around half of member states. Around 25 per cent of adultsin low-income households are in financial distress (European Commission 2016). There is abig range amongst countries: financial distress is much lower for lower-income householdsin some countries (such as the central European countries of Germany, Luxembourg andAustria) than others (such as Spain France, Italy, Slovakia and Croatia).
Employment and UnemploymentEmployment has continued to increase in the EU and in the Euro Area since 2014. However,there is great variation between member states in relation to employment levels with a 25percentage point difference in 2015 between the country with the highest level (Sweden)and that with the lowest (Greece). Furthermore, there is still a gap between EU average rateand the 75 per cent target set in the Europe 2020 Strategy. There are also a number of issuesin relation to how the employment situation has evolved, concerning increased rates oftemporary employment, increased part-time employment (much of it involuntary)especially in some member states, and pay levels decreasing or stagnating in many countriesespecially for disadvantaged groups. Without decent jobs, some workers continue toexperience poverty.
When we look at unemployment, it appears that some 21 million people in the EU28, of whom16.3 million were in the Euro Area, were unemployed in June 2016 (Eurostat 2016b). There hasbeen a gradual reduction in unemployment since 2013, but it still affects some 6.1 million peoplemore than in 2008 (Eurostat code une_rt_a). Rates diverge greatly between countries. Greeceand Spain had the highest rates in 2015 while the lowest rate was in Germany.
People at risk ofpoverty or socialexclusion
People at risk ofpoverty (60%
PeopleexperiencingSevere MaterialDeprivation
People inhouseholds withvery low workintensity
EU-28 Number % Number % Number % Number %Total population
122.17m 24.2 86.2m 17.2 44.5 8.9 41.8m 11.2Children (under 18)
26.2m 27.8 19.9m 21.1 9.8m 10.4 9.1m 9.7Older people (over 65s)
16.3m 17.8 12.6m 13.8 5.7m 6.2 n/a n/a
90Summary, Conclusions and Recommendations

The long-term unemployment picture continues to be worrying – around 11 million peopleor almost half of unemployed people in EU-28 are long-term unemployed. Whileunemployment has been declining since 2013, long-term unemployment has only recentlystopped rising (European Commission 2016a). Long-term unemployment has not affectedall groups equally and the low-skilled, the young and young adults as well as workers bornin a third country are particularly affected. In terms of age groups, the youngest and oldestworkers have been hardest hit by long-term unemployment.
Very steep increases in youth unemployment occurred in many countries following 2008.Improvements have occurred in the position in most EU countries between 2014 and 2015.Nonetheless, at the end of 2015 some 4.6 million young people (under 25) were unemployedin the EU-28 (Eurostat une_rt_a). Rates in countries such as Greece and Spain have improvedsince their extremely high rates in 2013, but, unfortunately, they are still relatively very high.Eurostat figures suggest that in 2015 there were still more that 400,000 young peopleunemployed in EU-28 than in 2008 (Eurostat une_rt_a).
The long-term unemployment rate for young people has improved but is also still higherthan in 2008. Twelve per cent of the age group 15-24 (approx. 6.6 million people) wasneither in employment nor in education or training in 2015 and this rate is still higher thanit was in 2008. Over 14 per cent or some 14 million young people aged 15-29 were in thiscategory. This (known as the NEET rate) is one of the most concerning indicators relative toyoung people with its indication of detachment and discouragement in relation to bothwork and education.
One of the most serious divergences between European countries that the crisis and theyears following it have highlighted is that there are serious gaps in the social welfare systemsof many European countries, which often leave people who are unemployed or long-termunemployed with little or no safety net and cause great hardship in some countries, typicallyin the south. The European Commission has noted that some of the Member States that have been mostresilient during the crisis have high levels of employment protection legislation, particularlyGermany, Sweden, the Netherlands and the Czech Republic (2015a).
EducationThis review suggests that where early school leaving and third level educational attainmentis concerned, progress is being made in reaching targets set in the European 2020 Strategy.However, there continues to be a great deal of divergence in these indicators betweendifferent countries. While some countries with high underlying levels of early school leaving(such as Spain and Portugal) have seen significant reductions in there rates in recent years,there is still a very great gap (of approximately 16-17 percentage points) between thecountries with the highest rates and those with the lowest.
One of the problems that Europe now faces is that progress not only needs to continue tobe made to address the Europe 2020 strategy targets in education, but also to manageproblems that have emerged/worsened since 2008 such as the cohort of young peopleneither in education nor employment (or NEETs). Young people with lower educationallevels are more likely to enter the NEET category than those with higher levels.
Overall, many countries still have relatively very low rates of participation in lifelonglearning, particularly for low-skilled groups. Several of the countries with the highest rates
91Summary, Conclusions and Recommendations
of participation in lifelong learning are also the world’s most competitive (Sweden, Denmarkand the Netherlands). There is also much to be done to improve adult literacy in manycountries. Taking in additional indicators of lifelong learning and one measure of adultliteracy suggests that policies pursued by some countries, seem to impact a range of differentgroups positively, most notably Finland, the Netherlands and Sweden, and also Estonia andBelgium.
HealthIn the years following the economic crisis, many people in EU member states experiencedan erosion of health coverage and those who are poorer have experienced more unmet needthan others. The fact that so many countries failed to prevent erosion of health coverage forthe most vulnerable people (as seen in rising unmet need, especially amongst poorerhouseholds) should be a matter of concern to national and international policy makers inthe EU.
Two indicators that we have reviewed suggest that:• Perception of unmet need for health care is greater amongst poorer people in Europe
than richer; it has risen most in recent years amongst the lowest income groups; Over3 million more people reported unmet need for health care in 2014 than in 2009.
• One assessment of the performance of health systems under a range of indicators(from Berteslmann Stiftung) suggests that while the quality of health care is high inmost EU countries, there are significant variations between countries with regard bothto quality and inclusivity (that is equality of access). Those systems that performedbest in 2015 were Luxembourg, the Netherlands, Belgium and Denmark, CzechRepublic, Austria and Sweden. Those performing worst were Romania, Latvia, Poland,Bulgaria and Greece.
TaxationWithout raising resources, countries cannot invest in infrastructure and services requiredto promote inclusion and to sustain development. In this report we examined total taxes asa proportion of GDP (encompassing all direct and indirect taxes received including socialsecurity contributions) and noted the considerable variation that exists between memberstates. The highest ratios tend to be found in the ‘old’ 15 members of the EU. At the top end,7 countries have total taxation ratios greater than the EU average of 40 per cent. Theyinclude Denmark, France and Belgium (in 2014). The countries with the lowest ratios wereRomania, Bulgaria, Lithuania, Latvia and Ireland.
We found that all of the countries that have a well-established approach to many socialpolicies (as identified by the European Social Policy Network, Bouget et al 2015), have taxtakes that are above 35 per cent of GDP, and most are also above the EU average.
Countries in Scandinavia and Central Europe tend to demonstrate higher levels of taxation,and better protection of their populations from poverty and social exclusion. Amongst thesecountries are several deemed the world’s most competitive, notwithstanding their relativelyhigh taxation levels. They also include countries that demonstrate the greatest incomeequality (based on the S80/20 indicator) and that are associated with the highest levels ofsocial justice – that is to say, they create the greatest opportunities for their populations toparticipate in society in a broad range of areas like education and health services.
92Summary, Conclusions and Recommendations

In general, countries in the south and periphery of Europe tend to have lower levels oftaxation and also less well-developed social investment approaches, and higher rates ofpoverty or social exclusion. Amongst the newer accession countries Czech Republic isnotable for its performance in relation to prevention of poverty or social exclusion and ithad a taxation ratio just below the 35 per cent of GDP line in 2014.
7.2 Conclusions and RecommendationsIn the introduction to this report we outlined how the global economy has entered a periodof stagnation, and how, according to the OECD, with few exceptions, economies are notrecovering but facing another year of stagnation (OECD 2016c; European Parliament 2016a).This forms the backdrop against which this review evidences very great differences in thesocial situation across European countries and between different groups. Some countrieshave been more affected by the economic crisis than others, and some countries have beenable to benefit more from recent economic improvements than others.
The poverty indicators examined in this report suggest no improvement in the positon forvery many people living in Europe, with dis-improvement observed in the case of somegroups. Nearly one quarter of the population was experiencing poverty or social exclusion(over 122 million people) (EU-28). Over a quarter of all children experienced poverty or socialexclusion. Any recovery has yet to be felt more generally across social groups. The picture thatemerges in the 2014 is one where levels of poverty or social exclusion are still much higherthan prior to 2008 while showing a very slight improvement between 2013 and 2014.
Despite recent, welcome improvements, Europe still faces some very significantemployment challenges including the fact that there continue to be divergent experiencesacross countries. Exclusion from the labour market substantially limits individualopportunities for self-realization, contributes to an increased risk of poverty, and can leadto serious health stresses (Schraad-Tischler 2015). As the European Commission comments(2016), the employment recovery is far from robust in some countries.
Where education is concerned, progress has been made in recent years in respect of the Europe2020 strategy indicators for early school leaving and third level educational attainment.However, there is great divergence between countries. Now progress not only needs tocontinue to be made in these areas, but also to manage problems that have emerged/worsenedsince 2008 such as the cohort of young people neither in education nor employment (orNEETs). Additionally very low rates of participation in lifelong learning and adult literacy,particularly for low-skilled groups, must now be addressed in many countries.
Erosion of universal access to healthcare in many countries since 2008 represents a problemwhose effects may manifest most significantly in the longer term. Perception of unmet needfor health care is greater amongst poorer people in Europe.
Countries must raise resources to invest in infrastructure and services in order to promoteinclusion and to sustain development. Reviewing the total taxation to GDP ratios of EUcountries suggests that countries in Scandinavia and Central Europe tend to demonstratehigher levels of taxation and better protection of their populations from poverty and socialexclusion than others.
93Summary, Conclusions and Recommendations
94
Divergences in Europe’s social situation bring risks of a breakdown in social cohesion bothwithin and between countries. Great disparities in wealth and power divide society into richand poor, powerful and powerless, and this weakens the bond between people and dividessociety between the lucky and the left out. As one review of developments in social justicein the EU19 has argued, the gap between opportunities to participate in society in still-wealthy countries of northern Europe and in other parts of the union, notably thecrisis-struck southern nations, has widened creating a ‘highly explosive situation withregard to social cohesion and social stability within the European Union,’ one which if itcontinues threatens the viability of the entire European integration project (Schraad-Tischler Kroll, 2014).
As we stated in the introduction to this report, for Social Justice Ireland seven core rights needto be part of the vision for the future of Europe: right to sufficient income to live withdignity, to meaningful work, to appropriate accommodation; to relevant education, toessential healthcare, to real participation and the right to cultural respect. For Social JusticeIreland economic development, social development and environmental protection arecomplementary and interdependent – three sides of the same reality - and we have longargued that all three must be given attention rather than allowing economic considerationsto dominate.
Unfortunately, in Europe, economic priorities still dominate social priorities. There is aperception the European technocrats are insulated from the experience of the poorer peopleof Europe – something that is corrosive of trust in the whole European project. Leadershipat EU level in relation to vulnerable groups will prove critical not just to the future economicand social outlook but also to the democratic future of Europe.
7.2.1 RecommendationsWe make the following recommendations aimed at EU Leaders and EU Institutions:
1. Ensure Coherence of European Policy and the European Semester by integratingthe social objectives of the Europe 2020 strategy in the economic processes of theEuropean Semester. The priorities of Annual Growth Surveys should focus on long-term social objectives of the Europe 2020 Strategy, and on building adequate, effectivesocial systems that include both investment and protection dimensions and are betteraligned to the EU Social Investment Package. This could be facilitated by• Supporting efforts to promote growth and jobs while meeting deficit reduction
targets in the medium rather than the short term.• Taking account of the social impact when making Country Specific
Recommendations, especially those requiring fiscal consolidation measures. • Making country-specific recommendations that seek to achieve reductions in
poverty and unemployment where rates are high or rising.
2. Strengthen the EU 2020 Strategy: This requires:
Summary, Conclusions and Recommendations
19 The study examined six dimensions of the goals of social justice: poverty prevention, equitable education,access to the labour market, social cohesion and non-discrimination, health and intergenerational justice.

• Ex-ante appraisals: Fiscal consolidation and structural measures must be designedwith ex-ante knowledge of their longer term and cumulative impact on vulnerablegroups.
• Improved Targeting: Incorporate further sub-targets into the Europe 2020 Strategyprocess. Sub-targets for poverty reduction should be added relative to groups mostat high risk of poverty or social exclusion (such as children). Work with memberstates to ensure that their targets are adequate and to establish national sub-targetsfor poverty reduction amongst groups most at risk (based on the identification ofthe most appropriate groups in each country).
• Further Targets: Consideration should also be given to incorporating furthertargets relative to unemployment, especially long-term unemployment and youthunemployment, and to address serious problems in some countries in respect ofyoung people neither in employment nor education
• Ensuring Meaningful Input by Civil Society and Potentially Marginalisedpeople into the framing of National Reform programmes and Social Reports,including for countries in receipt of programmes of financial assistance.
3. Address inappropriate EU governance structures that prohibit or inhibit legitimateinvestment by national governments.
4. Advance proposals for a guarantee of an adequate minimum income or social floorin the EU under a framework directive, and for minimum standards on other socialprotection measures (access to child care, access to basic health) across member states.
5. Monitor and Address Child Poverty: Child poverty is such a serious issue that itrequires further action. Monitor implementation of the Commission’sRecommendation on Investing in Children through a strengthened process establishedunder the Europe 2020 strategy and work with member states with high levels of childpoverty to help them access and deploy structural funds to address the issue.
6. Focus on Youth Unemployment: Youth unemployment continues to be a seriousproblem despite the Youth Guarantee initiative, which requires more resources tomake a significant impact20.
7. Support Developments in the Social Economy: Leadership and support from theEU for social initiatives would benefit both people in need of support (through healthand social care programmes) and societies generally. This would be consistent withthe Social Investment Package and could provide valuable employment opportunitiesfor people who are long-term unemployed.
8. Improve Representation: EU policy-making must engage meaningfully withstakeholders representing poorer people and those most affected by the financial crisisand austerity measures since 2008.
9. Structural Funds: Structural funds must be of a sufficient scale to make an impact andshould be given greater priority so as to ensure significant progress is made in bridging
95Summary, Conclusions and Recommendations
20 One estimate of the cost to implement a youth guarantee programme across the Eurozone was €21billion(International Labour Organisation 2012). The estimated loss to society of the disengagement of youngpeople from the labour market is €153billion (2011) corresponding to 1.2% of European GDP (The EuropeanFoundation for the Improvement of Living and Working Conditions 2012).
the gap between the economic and social dimensions of policy and in promoting asocial investment approach to public policies where this is absent or insufficient.
10. Develop a Strong European Pillar of Social Rights:The Pillar needs to confer socialrights and include clear-cut indicators to measure and compare the social performanceof member states.
11. Adopt a Human Rights Strategy to prevent the violation of the human rights ofEurope’s population.
We make the following recommendations for National Governments (and relevant local/regional authorities):
1. Prioritise Investment: Large-scale, investment programmes that operate in job-intensive areas could assist growth and address social and infrastructural deficits. Thefocus would need to be tailored to each individual country/ region but might includedevelopment of renewable energy sources, health and social care infrastructure,housing, education and early childhood care infrastructure. As already stated,inappropriate EU rules currently blocking needed, viable investment need to beadjusted.
2. Strengthen Welfare Systems: Governments now need to introduce social protectionschemes that are more resilient and that tackle inequalities within the present systems,ensuring equal access to services and to strengthen social cohesion. Where inadequateminimum income schemes exist they need to be strengthened.
3. Adopt Effective Labour Market Measures: Activation measures need to focus onsupporting unemployed people, aiming to maintain and develop appropriate skillsand to not be accompanied by the threatened loss of welfare benefits or assistance.Employment measures must not be implemented in a way that removes incomesecurity and increases in-work poverty.
4. Tackle Low Pay by supporting the Living Wage concept and moving toward aBasic Income System: Start to tackle low-paid employment by supporting thewidespread adoption of the Living Wage, including giving public recognition toorganisations (including SMEs) that commit to paying the Living Wage, and considermoving toward a basic income system.
5. Develop Sustainable Approaches to taxation: Sustainable and inclusive growthrequires approaches to raising revenue that generate enough to support vital servicesand to move to a social investment approach (where that is absent or insufficientlyrealised). Measures should not disproportionately negatively affect low incomegroups, which means, amongst other things, avoiding increases in indirect taxes onessential items.
6. Tackle Tax Evasion: Tax evasion and the grey economy are a particular problem insome countries where a disproportionate burden of adjustments falls on complianttax-payers. Tax evasion must be tackled and fair taxation systems introduced in whichall sectors of society, including the corporate sector, contribute a fair share and thosewho can afford to do pay more.
96Summary, Conclusions and Recommendations
7. Consider how Government could become an employer of last resort: Given thehuge fall in employment and its ongoing impact on unemployed people of every age,governments in badly affected countries should consider being an employer of lastresort through voluntary programmes framed so as not to distort the market economy.
8. Ensure Inclusive Governance: Engage with key stakeholders to ensure that groups atrisk of poverty and social exclusion, and unemployed people can influence policy-direction and implementation, and that their experiences become part of the dialoguewith European institutions to try and repair social cohesion and political legitimacy.
9. Poverty Proofing and Monitoring: All Government decisions should be subject to apoverty-proofing process that ensures actions taken will not increase poverty underany heading or cumulatively impact negatively on any particular groups. Integratesocial assessments of the impacts of cuts to services into decision-making processesthat focus beyond short-term cost saving. Use macroeconomic modelling processesto assess the impact of proposed changes in social policies
10. Avail of the social investment aspects of the programming of EU funds, 2014-2020to fund measures that address the social situation, including support for initiatives setout in the EU’s Social Investment Package such as supporting social enterprises orfacilitating the implementation of the Recommendation on Investing in Children.
97Summary, Conclusions and Recommendations
REFERENCESAbrahamson, P., 2010. ‘European Welfare States Beyond Neoliberalism: Toward the Social
Investment State’. Development and Society. Volume 39, Number 1, June 2010, 61-95
Antonopoulis, R., Adam, S., Kijong, K., Masterson, T., Papadimitriou, D.B., 2014. Respondingto the Unemployment Challenge: A Job Guarantee Proposal for Greece. Observatory of Economicand Social Development, Labour Institute, Greek General Confederation of Labour
Basic Income Earth Network, n.d., About Basic Income [Online]http://www.basicincome.org/bien/aboutbasicincome.html
Bouget, D., Frazer, H., Marlier, E., Sabato, S., and Vanhercke, B., 2015. Social Investment inEurope: A Study of national Policies. Brussels: European Commission
Centre of Full Employment and Equity, (n.d.) Full Employment via a Jobs Guarantee. [Online]http://e1.newcastle.edu.au/coffee/job_guarantee/JobGuarantee.cfm
Coote, A., Franklin, J., Simms, A., 2010. 21 hours: Why a shorter working week can help us all toflourish in the 21st Century. New Economics Foundation
Council of Europe, 2014. Charter on Shared Social Responsibilities. RecommendationCM/Rec(2014)1. Strasburg: Council of Europe
Cournede, B, Denk, O and Hoeller, P. 2015. Finance and Inclusive Growth. Authorised forpublication by Catherine L. Mann, OECD Chief Economist and G20 Finance Deputy.OECD Publishing.
Dabla-Norris, E., Kochhar,K.,Suphaphiphat, N., Ricka, F.,Tsounta, E., 2015. Causes andConsequences of Income Inequality: A Global Perspective. SDN/15/13. International MonetaryFund. June
Economist 2016. ‘Automation and Anxiety: Will smarter machines cause massunemployment?’ 25 June. http://www.economist.com/news/special-report/21700758-will-smarter-machines-cause-mass-unemployment-automation-and-anxiety [accessed17 October 2016]
Eurofound and Bertelsmann Stiftung, 2014. Social Cohesion and Wellbeing in the EU.
Eurofound 2015. Access to benefits in times of crisis [online]http://www.eurofound.europa.eu/access-to-benefits-in-times-of-crisis [Accessed 16October 2016]
Eurofound 2016. Exploring the diversity of NEETs. Publications Office of the European Union:Luxembourg.
Eurofound 2016a. Statutory Minimum Wages in the EU 2016. 29 January
European Commission, 2008. Commission Recommendation of 3 October 2008 on the ActiveInclusion of People Excluded from the Labour Market. C2008/867/EC. Official Journal of theEuropean Union.
European Commission, 2010. Europe 2020: A Strategy for smart, sustainable and inclusivegrowth. COM (2010) 2020. Brussels: European Commission
European Commission, 2012. Communication from the Commission to the European Parliament,the Council, the European Economic and Social Committee and the Committee of the Regions.Towards a Job Rich Recovery. Strasbourg, 18.4.2012. COM(2012) 173 final.
98References
E U R O P E A N R E S E A R C H S E R I E S
European Commission, 2012a. Commission Staff Working Document on Exploiting theemployment potential of the personal and household services. Strasbourg 18.4.2012. SWD(2012) 95 final
European Commission, 2013. Draft Joint Employment Report accompanying the Communicationfrom the Commission on Annual Growth Survey 2014. COM(2013) 801 final. Brussels13.11.2013
European Commission, 2013b. Communication from the Commission to the EuropeanParliament, the Council, the European Economic & Social Committee and the Committee of theRegions: Towards Social Investment for Growth and Cohesion – including implementing theEuropean Social Fund, 2014-2020. Brussels 20.2.2013. COM(2013) 83 final.
European Commission, 2013c. Reducing Early School Leaving: Key Messages and Policy Support:Final Report of the Thematic Working Group in Early School Leaving. November
European Commission, 2013d. Communication from the Commission to the European
Parliament and the Council: Strengthening the Social Dimension of the Economic and MonetaryUnion. COM(2013)690. 2.10.13
European Commission, 2013e. Communication from the Commission to the EuropeanParliament, the Council, the European Economic & Social Committee and the Committee of theRegions: Towards Social Investment for Growth and Cohesion – including implementing theEuropean Social Fund, 2014-2020. Brussels 20.2.2013. COM(2013) 83 final.
European Commission, 2014. Employment and Social Developments in Europe, 2013.Brussels: European Commission D-G for Employment, Social Affairs and Inclusion.
European Commission, 2015a. EU Employment and Social Developments in Europe 2014.Directorate-General for Employment, Social Affairs and Inclusion. Luxembourg:Publications Office of the European Union
European Commission, 2015b. European Platform Against Poverty and Social ExclusionStakeholder Group, 10th meeting of the Stakeholder Dialogue of the European Platform AgainstPoverty and Social Exclusion. Briefing, 18 March 2015
European Commission 2015c. Toward adequate and accessible Minimum Income Schemes inEurope: Analysis of Minimum Income Schemes and roadmaps in 30 countries participating inthe EMIN project – synthesis report. January
European Commission, 2015d. Wage and Income Inequality in the European Union. DirectorateGeneral for Internal Policies, Policy Department A; Economic and Scientific Policy.Brussels: European Union
European Commission 2016. Employment and Social Developments in Europe .Quarterly Review,Summer 2016. Luxembourg: Publications Office of the European Union
European Commission, 2016a. EU Employment and Social Developments in Europe 2015(21/01/2016). Directorate-General for Employment, Social Affairs and Inclusion.Luxembourg: Publications Office of the European Union. January 2016
European Commission 2016b. Communication From The Commission To The EuropeanParliament, The Council, The European Economic And Social Committee And The CommitteeOf The Regions Launching a consultation on a European Pillar of Social Rights
Strasbourg, including Annex I. 8.32016. COM(2016) 127 final.
99References
European Foundation for the Improvement of Living and Working Conditions, 2012. NEETs:Young People not in employment, education or training: Characteristics, costs and policyresponses in Europe
European Observatory on Health Systems and Policies, 2012. Health Policy Responses to theFinancial Crisis in Europe. Denmark: World Health Organisation
European Parliament, 2014. Wage and Income Inequality in the European Union: Study forthe EMPL Committee. IP/A/EMPL/2013-05
European Parliament, 2016. Briefing: Secular Stagnation and the Euro Area. EPRS/EuropeanParliamentary Research Service. PE 573.972 February 2016.
European Parliament, 2016a. Briefing: The OECD Interim Economic Outlook:
Stronger collective fiscal policy needed. EPRS/European Parliamentary Research Service. PE580.906. April
Eurostat 2008. Taxation Trends in the European Union: Data for the EU Member States andNorway2008 Edition. Luxembourg: Publications Office of the European Union
Eurostat 2014. Taxation Trends in the European Union: Data for the EU Member States, Icelandand Norway. 2014 Edition. Luxembourg: Publications Office of the European Union
Eurostat 2014a. Living Conditions in Europe. 2014 Edition. Luxembourg: Publications Officeof the European Union
Eurostat 2015a. Median Income. [online]http://ec.europa.eu/eurostat/c/portal/layout?p_l_id=6517812&p_v_l_s_g_id=0. Accessed 2August 2016
Eurostat 2015b. Statistics Explained: Living Standards [online]http://ec.europa.eu/eurostat/statistics-explained/index.php/Living_standard_statistics.Data extracted, April 2015 [Accessed 3 August 2016]
Eurostat 2016. Europe 2020 Indicators – Poverty and Social Exclusion. Data from March 2016.[online] http://ec.europa.eu/eurostat/statistics-explained/index.php/Europe_2020_indicators [ Accessed 30 July 2016]
Eurostat 2016a. Statistics Explained: Income Distribution Statistics.http://ec.europa.eu/eurostat/statistics-explained/index.php/Income_distribution_statistics
[online] Data extraction, Feb 2015; Accessed 3 August 2016
Eurostat 2016b. Euro Area Unemployment rate at 10.1% Newsrelease Euroindicators. 150/2016 -29 July 2016
Eurostat 2016c. Tax Revenue Statistics. http://ec.europa.eu/eurostat/statistics-explained/index.php/Tax_revenue_statistics Data from 11 February 2016. [accessed 14 Sept 2016]
Eurostat Online Databases:
Eurostat .gov_10a_taxagMain National accounts tax aggregates.http://appsso.eurostat.ec.europa.eu/nui/show.do Last update: 26.04.2016. [Accessed 14Sept 2016]
Eurostat t2020_50. Headline Targets. People at Risk of Poverty or Social Exclusion.http://ec.europa.eu/eurostat/tgm/table.do?tab=table&init=1&plugin=0&language=en&pcode=t2020_50 Last update: 15.6.2016 [Accessed 16 June 2016]
100References
Eurostat, t2020_52. People at Risk of Poverty After Social Transfershttp://ec.europa.eu/eurostat/tgm/table.do?tab=table&init=1&plugin=1&language=en&pcode=t2020_52 Last update: 15.06.2016 [Accessed 16 June 2015]
Eurostat t2020_51. People Living in Households with Very Low Work Intensity.http://ec.europa.eu/eurostat/tgm/table.do?tab=table&init=1&plugin=1&language=en&pcode=t2020_51 Last update: 15.06.2016 [Accessed 16 June 2015]
Eurostat. ilc_peps01. People at risk of poverty or social exclusion by age and sex.http://appsso.eurostat.ec.europa.eu/nui/show.do Last update: 14.07.2015 [Accessed 1 August2016]
Eurostat t2020_53. Severely materially deprived people.http://ec.europa.eu/eurostat/tgm/table.do?tab=table&init=1&plugin=1&language=en&pcode=t2020_53 Last update: 15.06.2016 [Accessed 16 June 2015]
Eurostat. Ilc_mddd11. Severe material deprivation rate by age and sex [ilc_mddd11]http://appsso.eurostat.ec.europa.eu/nui/show.do Last update: 15.7.2016 [Accessed 1August 2016]
Eurostat. ilc_li02. At-risk-of-poverty rate by poverty threshold, age and sex (source: SILC).http://appsso.eurostat.ec.europa.eu/nui/show.do Last update: 14.7.2016 [Accessed 1August 2016]
Eurostat. ilc_lvhl11. People living in households with very low work intensity by age and sex(population aged 0 to 59 years) http://appsso.eurostat.ec.europa.eu/nui/show.do Last update:14.07.2016 [Accessed 2 August 2016]
Eurostat, ilc_iw01. In-work at-risk-of-poverty rate (source: SILC). Age group 18-64 yearshttp://appsso.eurostat.ec.europa.eu/nui/submitViewTableAction.do Last update:12.5.2016 [Accessed 30 May 2016]
Eurostat. Ilc_di12. Gini coefficient of equivalised disposable income (source: SILC)http://appsso.eurostat.ec.europa.eu/nui/show.do Last update: 14.7.2016. [Accessed 2August 2016]
Eurostat, ilc_di11 S80/S20 income quintile share ratio by sex and selected age group (source: SILC)http://appsso.eurostat.ec.europa.eu/nui/show.do?dataset=ilc_di11&lang=en Last update:14.7.2016. [Accessed 2 August 2016]
Eurostat t2020_10. Employment rate by sex, age group 20-64http://ec.europa.eu/eurostat/tgm/table.do?tab=table&init=1&plugin=0&language=en&pcode=t2020_10 Last update: 27.5.2016 [Accessed 30 May 2016]
Eurostat une_rt_a. Unemployment rate by sex and age groups - annual average, %http://appsso.eurostat.ec.europa.eu/nui/setupDownloads.do Last update: 29.7.16[Accessed 8 August 2016]
Eurostat une_rt_a. Unemployment rate by sex and age groups - annual average, % AgeGroup Under 25. http://appsso.eurostat.ec.europa.eu/nui/setupDownloads.do Lastupdate: 31.8.16 [Accessed 1 September 2016]
Eurostat. edat_lfse_20. Young People neither in employment nor in education and training by sexand age (NEETs rate). http://appsso.eurostat.ec.europa.eu/nui/show.do Last update27.6.2016. [Accessed 2 September 2016]
Eurostat. lfsq_upgal. Long-term unemployment (12 months or more) as a percentage of the totalunemployment, by sex and age (%).http://appsso.eurostat.ec.europa.eu/nui/show.do Lastupdate: 25.8.16 [Accessed 1 September 16]
101References

102
Eurostat. tsdsc440. Lifelong Learning.http://ec.europa.eu/eurostat/tgm/table.do?tab=table&init=1&language=en&pcode=tsdsc440&plugin=1 Last update: 30.8.2016 [Accessed 2 September 2016]
Eurostat t2020_40. Early leavers from education and training by sex.http://ec.europa.eu/eurostat/tgm/table.do?tab=table&init=1&language=en&pcode=t2020_40&plugin=1Last update: 30.8.2016 [Accessed 2 Sept 2016]
Eurostat. t2020_41. Tertiary educational attainment by sex, age group 30-34.http://ec.europa.eu/eurostat/tgm/table.do?tab=table&init=1&language=en&pcode=t2020_41&plugin=1Last Update: 30.8.2016 [Accessed 2 September 2016]
Eurostat. [ilc_di03] Mean and median income (source: SILC)http://appsso.eurostat.ec.europa.eu/nui/show.do?dataset=ilc_di03&lang=enLastupdate: 14.7.2016 [Accessed 2 August 2016]
Eurostat. hlth_silc-08. Self-Reported unmet needs for medical examination by sex, age,detailed reason and income quintile. http://appsso.eurostat.ec.europa.eu/nui/show.dolast update: 21.07.16 [accessed 9 Sept 2016]
Fazi, T. 2016. ‘Alternatives to the Crisis: Why Civil Society Has Been Mostly Right’. SocialEurope. 1 November. [online] https://www.socialeurope.eu/2016/11/alternatives-crisis-civil-society-mostly-right/ [accessed 1 November 2016]
Felber, C., 2010. Die Gemeinwohl-Ökonomie – Das Wirtschaftsmodell der Zukunft. Deuticke.ISBN 978-3-552-06137-8.
Frazer, H., & Marlier, E., 2009. Minimum Income Schemes Across EU Member States: SynthesisReport. EU Network of Independent Experts on Social Inclusion. October
Frazer, H., & Marlier, E., 2016. Minimum Income Schemes in Europe: A Study of National Policies2015.European Commission: Brussels. January
Frazer, H. and Marlier, E. with Natali, D., Van Dam, R., and Vanhercke, B. 2010. ‘Europe 2020Towards a More Social EU?’. in Marlier, E., Natali, D. and Van Dam, R. (eds) Europe 2020:Towards a More Social EU? (Work & Society, 69) ps. 11-40 Brussels: Peter Lang.
Government of Ireland, 2002. Basic Income: A Green Paper. September.
Garcia, M. and Moore, C. 2012, The cash dividend: the rise of cash transfer programs in Sub-Saharan Africa. World Bank Publications.
Greenham, T., Johnson, V., Meadway, J., Seaford, C., and Wallis, S., 2011. The Good Jobs Plan:A New Approach to Industrial Policy. New Economics Foundation
Guardian, 2014; 2016. Various Articles. [Online] http://www.theguardian.com/
Hämäläinen, T. (2013) Towards a Sustainable Well-being Society version 1.0. Sitra: Helsinki
Healy, S., Murphy, M., Ward, S., & Reynolds, B., 2012. ‘Basic Income – Why and How inDifficult Economic Times: Financing a BI in Ireland,’ Paper to the BIEN Congress, 2012,Munich
Held, D., 2006. Models of Democracy. Third ed. Cambridge: Polity Press.
Hemerijck, A. 2014. Social Investment ‘stocks’, ‘flows’ and ‘buffers’.
IMD, 2016. World Competitiveness Yearbook 2016. Switzerland: IMD
References
International Labour Organization, 2013. Global Wage Report 2012/2013: Wages and EquitableGrowth. International Labour Office: Geneva.
International Labour Organization, 2016. World Employment and Social Outlook 2016:Transforming jobs to end poverty. International Labour Office: Geneva
International Monetary Fund (IMF), 2016. Cross-Country Report on Minimum Wages. IMFCountry Report No. 26/151. Washington DC: International Monetary Fund
Kern, Christian. 2016. ‘Repowering Europe: How To Combat Austerity, Alienation andBrexit’. 27 September. in Social Europe [online]https://www.socialeurope.eu/2016/09/europe-must-become-fair-again/
Lansley, S., and Reed, H., 2016. ‘How to Make a Universal Basic Income a Reality’. SocialEurope. 19 October. [online] https://www.socialeurope.eu/2016/10/how-to-make-universal-basic-income-a-reality/ [accessed 19 October]
Leahy, A., Healy, S., and Murphy, M. 2015. Poverty and Inequalities on the Rise: Just SocialModels Needed as the Solution. Brussels: Caritas Europa
Leonard, M., & Torreblanca, J.I., 2013. The Continent-Wide Rise of Euroscepticism. PolicyMemo. London: European Council on Foreign Relations
Living Wage Technical Group, 2014. Living Wage Technical Document: Calculating a LivingWage for Republic of Ireland. July 2014. wwwlivingwage.ie
McCarthy, D., 2015. The Social Wage as a Mechanism for a Widespread Recovery in LivingStandards. NERI Research inBrief. Dublin: Nevin Economic Research Institute.
Mazower, M. 2015. ‘Why the Eurozone crisis is just part of our long struggle for peace’ TheGuardian. 12 July
Ministry of Social Affairs and Health 2016. Ministry of Social Affairs and Health requestsopinions on a basic income experiment. Press Release. 25.8 [online] http://stm.fi/artikkeli/-/asset_publisher/sosiaali-ja-terveysministerio-pyytaa-lausuntoja-osittaisen-perustulokokeilun-toteuttamisesta?_101_INSTANCE_yr7QpNmlJmSj_languageId=en_US [accessed 16October 2016]
Mitchell, W., and Flanagan, M., 2014. The Changing Patterns of Labour Underutilisation inEurope in the Face of Policy Austerity. Working Paper No 01-14.Newcastle, Australia: Centreof Full Employment and Equity
Moore, M., 1995. Creating Public Value. Massachusetts: Harvard Kennedy School ofGovernment.
NESF (National Economic and Social Forum), 2006. Improving the Delivery of Quality PublicServices. Report 34. December
OECD, 2013, OECD Skills Outlook 2013: First Results from the Survey of Adult Skills. OECDPublishing
OECD 2014. Income inequality Update – June 2014, OECD publishing.
OECD, 2015. OECD Skills Outlook 2015: Youth, Skills and Employability. OECD Publishing
OECD, 2015a. Focus on Minimum wages after the crisis: Making them Pay. OECD Directoratefor Employment, Labour and Social Affairs.
OECD 2015b. Household disposable income has outpaced GDP growth for the OECD area since2007. [online] www.oecd.org/newsroom/household-disposable-income-has-outpaced-gdp-growth-for-the-oecd-area-since-2007.htm [Accessed 1 September 2016]
103References
104
OECD 2015c. Final NAEC Synthesis: New Approaches to Economic Challenges. Meeting of theOECD Council at Ministerial Level. Paris, 3-4 June 2015. OECD Publishing.
OECD, 2016 Adult Literacy. [Online] http://www.oecd.org/edu/innovation-education/adultliteracy.htm [accessed 2 September 2016]
OECD 2016a. OECD Employment Outlook 2016 Summary in English. doi:10.1787/empl_outlook-2016-en. OECD Publishing
OECD 2016b, Debate the Issues: New Approaches to Economic Challenges, OECD Insights, OECDPublishing, Paris. http://dx.doi.org/10.1787/9789264264687-en
OECD 2016c. Interim Economic Outlook. 18 February 2016 OECD Publishing
Offe, C., 2003. ‘The European Model of Social Capitalism: Can it Survive EuropeanIntegration?’ Journal of Political Philosophy, 11(4): 437–69.
Piketty, T. 2013. Capital in the 21st Century. Belknap Press.
Reed, H., and Lansley, S. 2016. Universal Basic Income: An idea whose time has come? Apublication by Compass. Compass: London
Rinaldi, D. 2016, “A new start for Social Europe”, Studies & Reports, No. 108, Brussels: TheJacques Delors Institute
Poulou, A. 2016. ‘Towards a European Pillar of Social Rights: An Opportunity Not to beSquandered’. Social Europe. 27 May. [online]https://www.socialeurope.eu/2016/05/45300/ [accessed 1 October]
Sanden, F and Schluter, B. 2016. ‘A Step In The Right Direction: The New European Pillar Of SocialRights’. in Social Europe. 3 October. [online] https://www.socialeurope.eu/2016/10/step-right-direction-new-european-pillar-social-rights/
Schmit, N. 2016. ‘Preface’. In Rinaldi, D. “A new start for Social Europe”, Studies & Reports, No.108. Brussels: The Jacques Delors Institute
Schraad-Tischler, D.,and Kroll, C., 2014. Social Justice in the EU-A Cross-National Comparison:Social Inclusion Monitor Europe (SIM) Index Report2014. Bertelsmann Stiftung
Schraad-Tischler, D. , C., 2015. Social Justice in the EU-A Cross-National Comparison: SocialInclusion Monitor Europe (SIM) Index Report 2015. Bertelsmann Stiftung
Sefton, T. 2002. Recent Changes in the Distribution of the Social Wage. Centre for Analysis ofSocial Exclusion, London School of Economics and Political Science.
Sen, A., 2015. ‘The economic consequences of austerity’. New Statesman, 4 June.
Siekel, D. 2016. ‘The European Pillar of Social Rights – No ‘Social Triple A’ for Europe’. SocialEurope. 24 March. [online] https://www.socialeurope.eu/2016/03/european-pillar-social-rights-no-social-triple-europe/ [Accessed 2 October 2016]
Skidelsky, R., 2016. ‘Answering the Queen’s question: New Approaches to EconomicChallenges’. In OECD, Debate the Issues: New Approaches to Economic Challenges, OECDInsights, OECD Publishing: Paris. http://dx.doi.org/10.1787/9789264264687-en
Skidelsky, R., 2016a. ‘A basic income could be the best way to tackle inequality’. TheGuardian. [online] https://www.theguardian.com/business/2016/jun/23/universal-basic-income-could-be-the-best-way-to-tackle-inequality [accessed 28 Oct 2016]
References

Social Protection Committee, 2012. Social Protection Performance (SPPM) – methodologicalreport by the Indicators Sub-group of the Social Protection Committee. 17 October.
Social Protection Committee, 2012a. The Social Impact of the economic crisis and ongoing fiscalconsolidation: Third Report of the Social Protection Committee (2011). Directorate-Generalfor Employment, Social Affairs and Inclusion.
Social Protection Committee, 2014. Europe 2020 Strategy: Mid-term Review, including theevaluation of the Europe 2020 Semester: Joint Opinion of the Employment Committee and of theSocial Protection Committee. SOC 662; EMPL 120; EDUC 297; ECOFIN 876. Brussels: 3October
Social Protection Committee, 2015. 2014 Social Protection Performance Monitor (SPPM)Dashboard results.
Social Protection Committee, 2015a. Social Europe: Aiming for Inclusive Growth: Annual Reportof the Social Protection Committee on the Social Situation in the European Union (2014).Luxembourg: Publications Office of the European Union
Social Protection Committee 2015b. Review of Recent Social Policy Reforms: 2015 Report ofthe Social Protection Committee. Luxembourg: Publications Office of the EuropeanUnion
Social Protection Committee 2016. 2015 Social Protection Performance Monitor (SPPM)dashboard results. SPC/ISG/2016/02/4 FIN
South African National Planning Commission, 2012. Our Future – Make it Work. NationalDevelopment Plan 2030.
Stiglitz, J., 2009. ‘The Global crisis, social protection and jobs.’ International Labour Review,Vol 148 (2009) No. 1-2, ps 1-13
Sundaram, R., Hoerning, U., Falcao, Natasha De Andrade, Millan, N., Tokman, C., Zini, M.2014. Portraits of labor market exclusion. Washington, DC: World Bank Group.
Taylor-Gooby, P., 2008. ‘The New Welfare State Settlement in Europe’. European Societies.10(1): 3-24
Therborn, G.2015. ‘The Inequality of Life and Death’. Social Europe 2019. Social Europe, theHans-Böckler-Stiftung and the Friedrich-Ebert-Stiftung. e-book. March
Thomson,S., Evetovits, T., and, Kluge, H. 2016, ‘Universal Health Coverage and theEconomonic Crisis in Europe’. EUROHEALTH, Quarterly of the European Observatory onHealth Systems and Policies. Vol 22. Issue 2.
Vaalavuo, M., 2015. Poverty Dynamics in Europe: From What to Why. Working Paper 03/2015.European Commission. Luxembourg: Publications Office of the European Union
van Gool, K. and M. Pearson 2014, “Health, Austerity and Economic Crisis: Assessing theShort-term Impact in OECD countries”, OECD Health Working Papers, No. 76, OECDPublishing
Van Parijs, P., 2000. Basic Income: A simple and powerful idea for the twenty first century.Paper prepared for international seminar organized under the aegis of the PortuguesePresidency of the European Union
Werner, A., and Lim, M. 2016. Putting the Living Wage to Work: Strategies and Practices in Smalland Medium Sized Enterprises (SMEs). Barrow Cadbury Trust; Middlesex University Londonand University of Liverpool.
105References
West, D.M. 2015. What happens if robots take jobs: The impact of emerging techonoloiges onEmployment and Public Policy. Brookings Institute.ttps://www.brookings.edu/research/what-happens-if-robots-take-the-jobs-the-impact-of-emerging-technologies-on-employment-and-public-policy/ [accessed 17 Oct 2016]
Wilkinson, R. and Pickett, K., 2007. The Spirit Level: Why more equal societies almost
always do better. London: Allen Lane
Wray, L.R. 2009. Jobs Guarantee. New Economics Perspectives. [online]http://neweconomicperspectives.org/2009/08/job-guarantee.html
106References

GLOSSARYSPPM or Social Protection Performance Monitor: A set of indicators known as adashboard developed by the Social Protection Committee intended to give a comprehensivepicture of the main changes in the social situation of Europe and to lead to identifyingimportant trends to watch (negative and positive developments) (Social ProtectionCommittee 2012). They include the headline indicators used in monitoring the Europe 2020strategy, namely risk of poverty or social exclusion and its three constituent indicators. Theyalso include a number of indicators intended to capture the following: intensity of poverty,income inequalities, child poverty, effectiveness of social protection systems, socialconsequences of labour market situation, youth exclusion, active ageing, pensions’adequacy, access to decent housing, health.
The S80/S20 ratio (also known as the income quintile share ratio) is a measure of theinequality of income distribution. It is calculated as the ratio of total income received bythe 20 per cent of the population with the highest income (the top quintile) to that receivedby the 20 per cent of the population with the lowest income (the bottom quintile). Thecalculation is based on equivalised disposable income, which is the total income of ahousehold after tax and other deductions, that is available for spending or saving, dividedby the number of household members converted into equalised adults; household membersare equalised or made equivalent by weighting each according to their age.
GINI Coefficient: The Gini coefficient is defined as the relationship of cumulative sharesof the population arranged according to the level of equivalised disposable income, to thecumulative share of the equivalised total disposable income received by them.
Europe 2020 Strategy - Adopted in 2010, the Europe 2020 Strategy aims to turn the EU intoa ‘smart, sustainable and inclusive economy delivering high levels of employment,productivity and social cohesion’. It sets targets to reduce poverty, raise employment, andraise educational levels amongst other things.
European Semester - A yearly cycle of economic policy coordination which involves theEuropean Commission undertaking a detailed analysis of EU Member States’ programmesof economic and structural reforms and provides them with recommendations for the next12-18 months. The European semester starts when the Commission adopts its AnnualGrowth Survey, usually towards the end of the year, which sets out EU priorities for thecoming year. For more: http://ec.europa.eu/europe2020/making-it-happen/index_en.htm
Eurostat – the statistical office of the European Union
GDP - Gross domestic product, which is a measure of the economic activity, defined as thevalue of all goods and services produced less the value of any goods or services used in theircreation (Eurostat, tec00115)
Household disposable income is established by Eurostat by summing up all monetaryincomes received from any source by each member of the household (including incomefrom work, investment and social benefits) — plus income received at the household level— and deducting taxes and social contributions paid. In order to reflect differences inhousehold size and composition, this total is divided by the number of ‘equivalent adults’
107
E U R O P E A N R E S E A R C H S E R I E S
Glossary

using a standard (equivalence) scale, which attributes a weight of 1.0 to the first adult in thehousehold, a weight of 0.5 to each subsequent member of the household aged 14 and over,and a weight of 0.3 to household members aged less than 14. The resulting figure is calledequivalised disposable income and is attributed to each member of the household. For alone-person household it is equal to household income. For a household comprising morethan one person, it is an indicator of the household income that would be needed by a loneperson household to enjoy the same level of economic wellbeing. Source: Eurostat StatisticsExplained: Living Standards Statistics: http://ec.europa.eu/eurostat/statistics-explained/index.php/Living_standard_statistics
In work at risk of poverty rate (or working poor) - The share of employed persons of 18years or over with an equivalised disposable income below the risk-of-poverty threshold,which is set at 60 per cent of the national median equivalised disposable income (after socialtransfers) (Eurostat, tsdsc320)
NEET rate - The indicator on young people neither in employment nor in education andtraining (NEET) corresponds to the percentage of the population of a given age group notemployed and not involved in further education or training (Eurostat, explanatory text,Code:yth_empl-150)
OECD - The Organisation for Economic Cooperation and Development, which has 34member countries.
People at risk-of-poverty - Persons with an equivalised disposable income below the risk-of-poverty threshold, which is often set at 60 % of the national median equivaliseddisposable income (after social transfers) (Eurostat, t2020_50). The 60% threshold is adoptedin the Europe 2020 Strategy. It is also possible to examine incomes at other thresholds suchas 40 per cent, 50 per cent or 70 per cent.
People at Risk of poverty or social exclusion - The Europe 2020 strategy promotes socialinclusion by aiming to lift at least 20 million people out of the ‘risk of poverty and socialexclusion’. This indicator corresponds to the sum of persons who are: (1) at risk of povertyor (2) severely materially deprived or (3) living in households with very low work intensity.Persons are only counted once even if they are present in several sub-indicators. (Eurostat,t2020_50)
Severe Material deprivation Severely materially deprived people have living conditionsseverely constrained by a lack of resources, they experience at least 4 out of 9 followingdeprivations items: cannot afford i) to pay rent or utility bills, ii) to keep home adequatelywarm, iii) to face unexpected expenses, iv) to eat meat, fish or a protein equivalent everysecond day, v) a week holiday away from home, vi) a car, vii) a washing machine, viii) acolour TV, or ix) a telephone (Eurostat, t2020_50).
Very Low Work Intensity People living in households with very low work intensity arethose aged 0-59 living in households where the adults (aged 18-59) work less than 20% oftheir total work potential during the past year (Eurostat, t2020_50).
108Glossary

STAT IST ICAL I SSUESA number of issues are to be noted:
Time lag: The main source of comparable data on poverty and social exclusion, the EUSurvey on Income and Living Conditions (EU-SILC), has a significant time-lag. Most of thedata available as this report is prepared relate to 2014, being the latest year for which Europe-wide data are available as we prepare this report. Data from any given year relates to datacollected during the previous year. Thus, there is virtually a two year time lag in the dataand the most recent data available does not give the latest picture.
Indicators: Another important point relative to the data presented here is that there aredifferent approaches to the measurement of poverty and social exclusion. Under the EU2020 Strategy, headline targets have been set for reductions in poverty or social exclusion.The indicator, ‘poverty or social exclusion’ is based on a combination of three individualindicators:
(1) persons who are at risk of poverty - people with an equivalised disposable incomebelow the risk-of-poverty threshold set at 60 per cent of the national median (ormiddle) equivalised disposable income (after social transfers) (Eurostat, t2020_50)21.
(2) people severely materially deprived have living conditions severely constrained by alack of resources; they experience at least 4 out of a list of 9 deprivation items (SeeGlossary for the full list). (Eurostat, t2020_50), or
(3) people living in households with very low work intensity are those aged 0-59 livingin households where the adults (aged 18-59) work less than 20 per cent of their totalwork potential during the past year (Eurostat, t2020_50).
Relative Poverty: The first of the three indicators used in the Europe 2020 Strategy, ‘at riskof poverty,’ is a relative income poverty threshold, which means that it is used to assesspoverty levels relative to the national median income, something that relates it to localconditions and that shifts in line with changes in general income/salary levels. It is also recognised that because relative poverty measures are related to current median (ormiddle, not average) income, it can be difficult to interpret during recessions when theincomes of all households often decline. In fact where the incomes of all households fall ina recession, but they fall by less at the bottom than at the middle, relative poverty canactually decline. This can mask or delay the full picture of poverty emerging.
Comparable Data:There can occasionally be slight differences of definition and differencesof interpretation between national bodies and Eurostat. Using the figures from Eurostatmakes it possible to compare like with like across countries.
109
E U R O P E A N R E S E A R C H S E R I E S
Statistical Issues
21 The 60% threshold is adopted in the Europe 2020 Strategy. It is also possible to examine incomes below otherthresholds such as 40%, 50% or 70%.
Social Justice Ireland is an independent think-tank and justiceadvocacy organisation of that advances the lives of people andcommunities through providing independent social analysis andeffective policy development to create a sustainable future for everymember of society and for societies as a whole.
Support Social Justice IrelandIf you wish to become a member of Social Justice Ireland or make a donation to support our work you may do so through our website www.socialjustice.ie/members or by contacting our offices directly.
Social Justice Ireland, Arena House, Arena Road, Sandyford, Dublin D18 V8P6Phone: 01 213 0724Email: [email protected] number 19486Registered Charity Number: 20076481www.socialjustice.ie