Embed Size (px)
Citation preview

INDUSTRY NOTE
Europe | Themes & Tactics
Europe Insights 18 December 2015
Europe InsightsUK Mid Market 16 for '16
EQU
ITY R
ESEARC
H EU
ROPE
Jefferies Int'l Ltd. Equity Research *International Analyst
+44 (0) 20 7029 8685 [email protected] Marden *
Equity Analyst+44 (0) 20 7029 8038 [email protected]
Andy Douglas *Equity Analyst
+44 (0) 20 7029 8166 [email protected] Spence, CFA *
Equity Analyst+44 (0) 20 7029 8311 [email protected]
Caroline Gulliver *Equity Analyst
+44 (0) 20 7029 8226 [email protected] Vane-Tempest *
Equity Analyst+44 (0) 20 7029 8275 [email protected]
Joe Spooner *Equity Analyst
+44 (0)20 7029 8183 [email protected] Deboo *
Equity Analyst+44 (0) 20 7029 8670 [email protected]
Mark Wilson, CEng *Equity Analyst
+44 (0) 20 7029 8691 [email protected] Virdee *Equity Analyst
+44 (0) 20 7548 4123 [email protected] Reynolds *
Equity Analyst44 (0)20 7029 8694 [email protected]
Anthony Codling *Equity Analyst
+44 0 (20) 7029 8677 [email protected] Kirkness *
Equity Analyst+44 (0) 20 7029 8201 [email protected]
Alexander Bowden *Equity Research Team
+44 (0) 20 7898 7050 [email protected]
* Jefferies International Limited
Key Takeaway
Our Research team has selected 16 ideas that play particularly strongly to oneof four investment themes, and offer an attractive risk/reward balance overthe year. RESTRUCTURING: Serco, Bodycote, Acacia, Debenhams. INFLECTIONPOINTS: UDG Healthcare, BBA, Tate & Lyle, Cairn. GROWTH: Essentra, Just Eat,Diploma, Greencore. VALUATION: Zoopla, Northgate, Poundland, Pendragon.
Business Restructuring: For Kean Marden, recent senior hires at Serco add credenceto the restructuring story. Early stage pipeline prospects are expanding, and balance sheetderisking is close with the Intelenet disposal. Andy Douglas sees further progress in ROCEand earnings resilience at Bodycote as Specialist Technologies growth continues and theOperational Improvement Plan is more fully rolled out across the group. Alan Spenceexpects a better cost structure and FCF profile for Acacia as operational measures take effectat its Bulyanhulu mine in Tanzania. Debenhams is set to make fresh strides in 2016 with itsonline offer, momentum in its 'Designers at Debenhams' range and further cost efficiencies.
Inflection Points: UDG Healthcare is poised to create value through reinvestment ofproceeds (at <10x EBITDA) from recent disposals (sold at 13.3x). James Vane-Tempest'srecent visit to its Sharp business in the US also confirmed underappreciated scope forcapacity additions. BBA's Landmark acquisition will boost its Fixed Base Operations (FBO)to 75% of group EBIT over time. Joe Spooner expects this in turn to drive a higher multiple,supported by post acquisition deleveraging. Martin Deboo notes that 80%+ of Tate &Lyle's profits are now derived from the rational and high returning US Corn Wet Milling(CWM) industry, positioning it better for the future. Affirmative action in Sucralose capacityalongside demand growth also offer a growth kicker, and suggest an EPS upgrade cycle for2016 and beyond. Cairn Energy is currently drilling the first of three appraisal wells intothe SNE-1 discovery offshore Senegal. Mark Wilson sees this as the only example of a currentmaterial discovery offering exposure to a clear path to commercialisation.
Growth: Essentra has achieved over 9% OCC revenue growth since 2011 and Rob Virdeeexpects market share gains, self-help driven margin expansion and value accretive M&Ato continue. Achieving its 2020 targets could justify a doubling of the valuation. JustEat's 'marketplace model' is a compelling one for David Reynolds. With dominance in itscategory, growth should remain robust (39.5% 14-17e revenue CAGR) as margins expand by670bps to 35.3% in 2017. Diploma has averaged 13% top-line growth over the last decade.Will Kirkness believes solid organic growth and potential high single-digit EPS accretionfrom M&A should see the shares well supported next year. Greencore's growth prospectsremain undimmed in the 'Food to Go' market both in the UK and increasingly in the US asit builds out its platform.
Narrowing Valuation Discount: Anthony Codling believes Zoopla will benefit fromdwindling momentum at challenger portal On the Market, as well as its strategic moveinto other property services (uSwitch). This should help narrow the gap to Rightmove.Weakening trends at Northgate have seen the shares punished. However, when JoeSpooner marks to market the over-zealously depreciated fleets in the UK and Spain, resultingTNAV of 372p/shr sits the multiple at an unwarranted level barely over book. Pendragonshould enjoy a strong tailwind from the recent wave of new car registrations, as thosevehicles drop into the used and aftersales markets where it derives 60% of gross profit.The current valuation prices in little for this dynamic. Finally, Poundland has fallen 40%since CAM approval of its 99p Stores deal, as competition intensifies and the warm weatherimpacts high street footfall. Caroline Gulliver believes the synergy potential from the dealis real, and has confidence in the European rollout opportunity. At 13x 16e P/E, its currentdiscount to the UK General Retail sector (15x) offers an attractive long-term entry point.
Jefferies does and seeks to do business with companies covered in its research reports. As a result, investors should be aware that Jefferies may have a conflictof interest that could affect the objectivity of this report. Investors should consider this report as only a single factor in making their investment decision.Please see analyst certifications, important disclosure information, and information regarding the status of non-US analysts on pages 24 to 28 of this report.

Summary of Contents Page
Serco (PT: 157p, 62% upside) – Kean Marden, Business Services 4
Tel: +44 207 029 8038, email: [email protected]
Bodycote (PT: 630p, 20% upside) – Andy Douglas, UK Industrials 5
Tel: +44 207 029 8166, email [email protected]
Acacia (PT: 280p, 67% upside) – Alan Spence, Metals & Mining 6
Tel: +44 207 029 8311, email: [email protected]
Debenhams (PT: 105p, 42% upside) – Caroline Gulliver, Retail 7
Tel: +44 207 029 8226, email: [email protected]
UDG Healthcare (PT: 630p, 37% upside) – James Vane-Tempest, Spec Pharma 9
Tel: +44 207 029 8275, email: [email protected]
BBA Aviation (PT: 273p, 56% upside) – Joe Spooner, UK Transport, Industrials 10
Tel: +44 207 029 8183, email: [email protected]
Tate & Lyle (PT: 680p, 14% upside) – Martin Deboo, Consumer Staples 11
Tel: +44 207 029 8670, email: [email protected]
Cairn Energy (PT: 175p, 25% upside) – Mark Wilson, E&Ps, Oil Field Services 12
Tel: +44 207 029 8691, email: [email protected]
Essentra (PT: 1000p, 21% upside) – Rob Virdee, UK Industrials 14
Tel; +44 207 548 4123, email: [email protected]
Just Eat (PT: 515p, 10% upside) – David Reynolds, Internet 15
Tel: +44 207 029 8694, email: [email protected]
Diploma (PT: 825p, 16% upside) – Will Kirkness, Business Services 16
Tel: +44 207 029 8201, email: [email protected]
Greencore (PT: 370p, 7% upside) – Martin Deboo, Consumer Staples 17
Tel: +44 207 029 8670, email: [email protected]
Zoopla (PT: 400p, 72% upside) – Anthony Codling, UK Housebuilders & Estate Agents 19
Tel: +44 207 029 8677, email: [email protected]
Northgate (PT: 530p, 37% upside) – Joe Spooner, UK Transport, Industrials 20
Tel: +44 207 029 8183, email: [email protected]
Poundland (PT: 300p, 40% upside) – Caroline Gulliver, Retail 21
Tel: +44 207 029 8226, email: [email protected]
Pendragon (PT: 55p, 22% upside) – Will Kirkness, Business Services 22
Tel: +44 207 029 8201, email: [email protected]
Narrowing Valuation Discount
Business Restructuring
Points of Inflection
Growth Opportunities
Themes & Tactics
Europe Insights
18 December 2015
page 2 of 28 , International Analyst, +44 (0) 20 7029 8685, [email protected] Jefferies Int'l Ltd. Equity Research
Please see important disclosure information on pages 24 - 28 of this report.

Business Restructuring
Serco – Contrarian and deep value
Bodycote – A significantly better ‘through-the-cycle’ biz
Acacia – The year we’ve been waiting for
Debenhams – Designing a recovery
Themes & Tactics
Europe Insights
18 December 2015
page 3 of 28 , International Analyst, +44 (0) 20 7029 8685, [email protected] Jefferies Int'l Ltd. Equity Research
Please see important disclosure information on pages 24 - 28 of this report.

Serco – Contrarian and deep value (PT: 157p, 62% upside)
Investment case for 2016
We acknowledge that Serco is an above average risk investment, that FY16E will be an ugly year and the road to recovery will be lengthy
and bumpy. But, given an 8x PE and 9.5% FCF yield on recovered earnings, we believe risk/reward is more favourable now than it has
been for two years. We have a long-term investment horizon and are encouraged by recent hiring activity and an increase in the early
stage prospects list.
Rebuilding the bid pipeline, repairing the balance sheet and high calibre operational management hires
Serco can’t shrink and cost cut its way to medium-term recovery, so reviving the £5bn bid pipeline is essential. In its recent IMS,
management stressed that the early stage prospects list (the first wave that it can influence) has expanded, is “better quality” than before
and has benefited from the new Business Excellence Teams. Reassuringly, business development and bid costs have been ring-fenced.
In addition to the new CEO and CFO team, the calibre of Serco’s recent hires to support its revival has exceeded our expectations. In
particular, we would highlight Kate Steadman (who was recently recruited from Sodexo’s successful UK public sector division as Strategy
Director), Liz Benison (whose CV includes turnarounds at CSC, Capgemini and Druid) and Kevin Craven (CEO Central Government, ex
Balfour Beatty).
Judging by Blackstone’s recent financing activities, the Intelenet acquisition is on track to complete soon, which would derisk Serco’s
balance sheet. In our view, ND/EBITDA will peak at 2.3x next year (well inside the 3x covenant). Favourable renegotiation of loss-making
contracts, similar to the Australian patrol boats, could lead to an improvement in the £447m onerous contract provision.
Key Catalysts and Financial Data (Calendarised)
Source: Company data, Jefferies estimates, Factset
A decade of outsourcer EBITA margins
Source: Jefferies estimates
Valuation
On a recovered basis, the shares currently trade on an 8x PE and 9.5% FCF yield. Our 157p price target assumes 12.4p recovered EPS in
FY19E (using the mid-point of management’s 5%-6% EBITA margin target) and a 16x PE multiple (in the bottom half of the 11-25x 10-year
range), discounted back at 8%.
Valuation Scenarios
Source: Jefferies estimates
Themes & Tactics
Europe Insights
18 December 2015
page 4 of 28 , International Analyst, +44 (0) 20 7029 8685, [email protected] Jefferies Int'l Ltd. Equity Research
Please see important disclosure information on pages 24 - 28 of this report.

Bodycote – A significantly better ‘through-the-cycle’ biz (PT: 630p, 20% upside)
Investment case for 2016
For those who have not revisited the Bodycote investment case (we find that there are many investors who haven’t ‘properly’ looked at the
business for a number of years), we would strongly recommend it. FY16 is not going to be an easy year for the group and, as with most
UK Industrials, there are risks as we contemplate next year’s outlook/earnings, but we back management to deliver another year of resilient
EBITA margins and cash flow, with the prospect of a 10p special dividend/potential acquisition on the agenda. Against a soggy top-line
outlook, we expect further operational progress (as management continue the roll-out of the Operational Improvement Plan), improved
earnings quality and a continuation of the positive mix shift (driven by Specialist Technologies and greater ‘self-help’ focus). We back
management to make sensible acquisitions – we would particularly welcome a deal in Specialist Technologies area – and there is a very
strong/clean balance sheet to allow them to do that. Bodycote may need to again prove itself to the market in 1H16, but on the
assumption that earnings/margins/cash flow remain robust, we think Bodycote could be a very attractive stock as the year progresses. The
shares currently trade on a FY16F PER of 14.5x and EV/EBITA of 10.2x, and with a strong balance sheet we still believe that Bodycote is a
potential takeover target.
Earnings profile evolving
Bodycote is a very different beast relative to 5-6 years ago. Heat Treatment continues to be the largest part of the group, however the
emergence of the group’s Specialist Technologies (which accounted for c38% of group EBITA in FY14) is a key evolution. CEO Stephen
Harris, who joined the group in Jan-09, has also brought about considerable change from an operational perspective, and the impact on
Bodycote’s earnings profile has been incredibly impressive. There is a lot more to go for, however, as the Operational Improvement Plan
has yet to be fully rolled out/implemented across the group’s operations, and the mix towards Specialist Technologies should continue
going forward (especially if there is an acquisition). Along with strong cash generation, this underpins our positive thesis.
Key Catalysts and Financial Data (Calendarised)
Source: Company data, Jefferies estimates, Factset
Healthier and more resilient margins/ROCE
Source: Jefferies, company data
Valuation
Based on our current forecasts, the shares trade on a FY16F PER of 14.5x and EV/EBITA of 10.2x, which look good value to us in absolute
and relative terms. The shares also offer a 2.9% dividend yield and a 6.3% FCF yield (again, based on FY16 forecasts). Our 630p price target
is struck at a level (c11.8x EV/EBITA) that we believe is appropriate and, in our view, is not overly demanding relative to the sector (and its
closest peers). We believe that the group can grow into this valuation as the market gets more comfortable with the prospect of further
earnings resilience, above-average EBITA margins and sector-leading cash flow generation (this won’t happen overnight, however). An
acquisition – working on the assumption that it is a sensible deal at an appropriate multiple – should also help the group’s valuation.
Valuation Scenarios
Source: Jefferies estimates
Themes & Tactics
Europe Insights
18 December 2015
page 5 of 28 , International Analyst, +44 (0) 20 7029 8685, [email protected] Jefferies Int'l Ltd. Equity Research
Please see important disclosure information on pages 24 - 28 of this report.

Acacia – The year we’ve been waiting for (PT: 280p, 67% upside)
Investment case for 2016
ACA’s main asset, the Bulyanhulu gold mine in Tanzania, is widely recognised as a world-class deposit but has operationally
underwhelmed in the past. With a multi-year operational review and strategy set to drive significant improvements in 2016, ACA enters as
a stronger producer with a rock-solid balance sheet and cheap valuation. We rate the stock as a Buy with a PT of 280p and view current
trading levels as an attractive entry point.
Bulyanhulu the key driver to 2016 performance
Bulyanhulu is a large, high-grade gold mine in Tanzania that has underperformed its geological potential in the past. Since being spun out
from Barrick Gold in 2010, FCF has been weak as high costs and a declining gold price weighed on profitability. 2016 is forecast to be the
tipping point for ACA as efforts that have been underway since 2013 come to fruition and will materially improve the cost structure and
FCF, leading to improving shareholder returns. The current team has made strong operational progress since 2013 in improving the mined
grade, decreasing stoping widths and increasing production, while also focusing on the development work that will be critical to strong
production in 2016.
Looking forward, ACA enters 2016 in a significantly stronger position with AISC forecast to decrease >15% YoY, benefiting from improved
grades and higher gold production (+15% YoY). ACA is moving further away from its capex peak and the capital requirements will
decrease c7% YoY and stand nearly 50% below its 2013 peak. With production, costs and capex all moving in the right direction, FCF is set
to materially improve and average >10% in 2016 and 2017. The dividend payout is directly linked to FCF generation, and consequently
will improve from a near-nil yield in 2015 to a c3% yield in 2016. Improving FCF will also serve to further strengthen an already high-
quality balance sheet. ACA has a net cash position of $99m as of Sept 2015 with just one debt facility, a low interest rate and favourable
repayment terms. With the forecast improvements highlighted above, we believe the argument for a discounted valuation erodes and the
multiple discount will begin to narrow relative to the sector.
Key Catalysts and Financial Data (Calendarised)
Source: Company data, Jefferies estimates, Factset
FCF is forecast to significantly improve in 2016 and 2017
Source: Jefferies estimates
Valuation
Our 280p PT is derived through a 50/50 weighting between EV/EBITDA and P/NPV multiples. At our price target, ACA would trade on 6.0x
2016 EV/EBITDA, a discount to the sector at 6.4x. We believe that as operational improvements at Bulyanhulu and decreasing capex
requirements drive improve FCF, the discount to the sector should narrow.
Valuation Scenarios
Source: Jefferies estimates
-15%
-10%
-5%
0%
5%
10%
15%
20%
2010 2011 2012 2013 2014 2015E 2016E 2017E
Themes & Tactics
Europe Insights
18 December 2015
page 6 of 28 , International Analyst, +44 (0) 20 7029 8685, [email protected] Jefferies Int'l Ltd. Equity Research
Please see important disclosure information on pages 24 - 28 of this report.

Debenhams – Designing a recovery (PT: 105p, 42% upside)
Investment case for 2016
Jefferies’ consumer survey results give us confidence that Debenhams’ restructuring strategy is on-track, and that online improvements,
combined with cost efficiencies can drive a recovery in the stock in 2016. Volatile and unseasonal weather patterns can cause trading
difficulties (and present buying opportunities), but we expect Debenhams to reap the benefits of its multi-channel investments and
anticipate a new CEO will build on the current mobile-first strategy and the sub-leasing of unproductive space. Sector-wide trading
concerns following the mild autumn have led to Debenhams’ stock price falling back to 73p. Trading on only 8.2x our cal 17 EPS and
offering 12% TSR including a 4.8% dividend yield, we believe the longer-term risk/reward is attractive.
The restructuring opportunity
Over the past decade, Debenhams has been hit by the twin problems of recession-induced higher markdowns combined with the
incremental costs of becoming a multi-channel retailer. As a result, the company’s gross margin fell 660bps to 43% (FY05-FY14) while its
opex/sales ratio rose 320bps to 37.3% (FY05-FY15). Now the company has started to improve its gross margin by weaning customers off
the breadth and depth of promotions while improving its store productivity by sub-leasing surplus space to a variety of complementary
concessions (e.g. Patisserie Valerie, Chi Kitchen, Monsoon, Sports Direct). At the same time, Debenhams continues to expand its unique
“Designers at Debenhams” to c.40% of the offer, with new brands like “Nine by Savannah Miller” and Ben de Lisi and Jamie Oliver in
homewares.
Debenhams has also extensively invested in becoming a mobile-first omni-channel retailer (rather than a legacy store based retailer). From
restructuring the supply chain to enable online orders and store replenishment to be served together to in-store improvements like touch
screen kiosks and dedicated click & collect areas with changing rooms, the systems investments should pay off for Debenhams in 2016.
Jefferies’ 2015 consumer survey results show that 34% of Debenhams’s online customers would highly rate the retailer, up from 29% in
2014. We forecast a modest three-year CAGR in sales of c.3%, combined with c.60bps of margin expansion leading to c.8% EPS CAGR.
Key Catalysts and Financial Data (Calendarised)
Source: Company data, Jefferies estimates, Factset
Margins finally moving in the right direction
Source: Company data, Jefferies estimates
Valuation
Our 105p PT is based on c.12.5x our cal 16 EPS forecast, equivalent to c.1x TSR (FY15E-18E). We also believe the 4.8% dividend yield
provides support at this level (9.2% free cashflow yield and net debt/EBITDA 1.2x for FY16E). Risks include the appointment of a new CEO
that is not taken well by investors, any delay in multi-channel improvements, increased competition (including poor weather induced
promotions), consumer headwinds (including terrorist acts and potential interest rate rises), FX and COGS pressures and opex pressures
(like living wage increases, though Debenhams is working to mitigate these).
Valuation Scenarios
Source: Jefferies estimates
34.0
36.0
38.0
40.0
42.0
44.0
46.0
48.0
50.0
0.0
2.0
4.0
6.0
8.0
10.0
12.0
14.0
16.0
Gro
ss m
arg
in (
%)
Gro
up
EB
IT m
arg
in (
%)
Year ending Aug
Group EBIT margin (%)
Gross margin (%)
Themes & Tactics
Europe Insights
18 December 2015
page 7 of 28 , International Analyst, +44 (0) 20 7029 8685, [email protected] Jefferies Int'l Ltd. Equity Research
Please see important disclosure information on pages 24 - 28 of this report.
Points of Inflection
UDG Healthcare – A new look for 2016 and beyond
BBA – To deleverage through FBO focus
Tate & Lyle – Clean Slate & Lyle
Cairn Energy – Senegal appraisal for true Alpha
Themes & Tactics
Europe Insights
18 December 2015
page 8 of 28 , International Analyst, +44 (0) 20 7029 8685, [email protected] Jefferies Int'l Ltd. Equity Research
Please see important disclosure information on pages 24 - 28 of this report.

UDG Healthcare – A new look for 2016 and beyond (PT: 630p, 37% upside)
Investment case for 2016
At the recent FY results, UDG provided a strong set of annual numbers that underlined a year in which the company executed on its desire
to focus on higher growth and more profitable areas. We continue to believe UDG can unlock significant value through reinvesting the
proceeds of the Supply Chain businesses & MASTA disposal. The continuing group will be a faster growing and more profitable business.
We currently forecast a Sales CAGR of 7.5% (2015-19) and earnings CAGR of 10.2%.
The inflection point - transformation lays foundation for value creation
Sharp has multiple growth prospects, change in < 1 year has been remarkable: We recently revisited Allentown, HQ of Sharp
in the US, and were impressed with progress and potential for growth given recent investments. This is an area of the business where we
believe the opportunity is typically overlooked by investors. The business is differentiated, has several USPs and is also investing sensibly in
our view, with gradual continuous investment as capacity is increased gradually to catch up with demand and new capabilities are added.
UDG expects >10% EBIT growth from Sharp (JEFe +13.0% 2015-2020E; 11.8% CER)
Proceeds to be reinvested; UDG has a track-record: We see the potential to unlock significant shareholder value, as UDG can
reinvest proceeds realised at 13.4x EBITDA at <10x, for which the company has a track record, in our view. We believe the main risk to the
investment case is a delay to reinvestment, which could potentially erode shareholder returns given the “short to medium-term” utilisation
of net proceeds. Targeted areas for expansion include acquiring additional complementary services as well as capitalising on existing
market positions as the demand for specialist outsourced services in the healthcare sector increases.
Seamless CEO succession planning: UDG’s CEO, Liam FitzGerald, is to retire on 31 March 2016 after 23 years; he will be replaced by
the current COO, Brendan McAtamney, who is known to the market. Mr FitzGerald will remain as a consultant/director until 30 September
2016.
Key Catalysts and Financial Data (Calendarised)
Source: Company data, Jefferies estimates, Factset 1Multiples
adjusted for proceeds to be received on completion of disposal.
Makeup and margin evolution
Source: Jefferies estimates
Valuation
Our 630p PT is derived by applying an equal weight to our DCF and an 18.0x 2017E P/E, adjusted for the disposal and with 25% of the
value from potential M&A. The risks remain any stall to US expansion in its outsourcing businesses and a protracted delay until
redeployment of disposal proceeds once the deal is complete.
Valuation Scenarios
Source: Jefferies estimates
2014 2016E
Adj. EBITA Margin: 4.8% 10.4%
EBITA Split
42%
19%
39%
2014 Pre-Disposal
Ashfield Sharp SCS
60%
32%
8%
2016E
Ashfield Sharp SCS
Themes & Tactics
Europe Insights
18 December 2015
page 9 of 28 , International Analyst, +44 (0) 20 7029 8685, [email protected] Jefferies Int'l Ltd. Equity Research
Please see important disclosure information on pages 24 - 28 of this report.

BBA – To deleverage through FBO focus (PT: 273p, 56% upside)
Investment case for 2016
We expect the Landmark acquisition announced in September 2015 to prove to be transformational for BBA. On closure of the transaction
(we assume by the end of January 2016), the scale of Signature’s network significantly steps up and FBO becomes the dominant activity
for the group (we estimate contributing c75% of future group EBIT). Our sense is that historically, among investors, FBO has ranked as the
most preferred activity among BBA’s group of businesses, so we look for the skewing of the group further towards this segment to help
drive a re-rating of the shares in time. As the path to get there, we look to the closure of the acquisition and delivery of the targeted $35m
of cost synergies to plan, plus strong evidence of post-deal cash generation.
Expect fast deleveraging to follow the transformational Landmark acquisition
The key impacts from the acquisition of Landmark will be to raise BBA’s debt in the immediate term and further increase the importance of
FBO within the group mix. The group, and Signature within it, remains focused on North America, so business jet flying activity in the US
will have increased influence on group prospects. As explained in full in our note FBO Focus (12 Nov 2015), business jet fleet growth
expected ahead underpins the longer-term outlook for business jet activity, but with plane utilisation still at historically low levels, reasons
to fly the existing fleet more intensively are key to build on that base outlook. For us, that remains a function of the business cycle, and
while expectations remain for ongoing economic growth in the US, we believe the pressure on business jet utilisation in the key market
continues to reside to the upside. So we expect the trend of market activity to remain in growth and for Signature’s organic revenue
progress to continue to exceed that base level. That should enable the group to deleverage its balance sheet to more typical levels over
the next two years (on a pro-forma basis from around c3.6x at the outset to 3.1x in FY16 and 2.5x FY17 in our forecasts), in turn allowing
the re-rating we look for to materialise.
Key Catalysts and Financial Data (Calendarised)
Source: Company data, Jefferies estimates, Factset
FAA forecasts rising jet fuel volumes (gallons, m)
Source: FAA, Jefferies
Valuation
BBA’s historical PE rating has averaged 12.2x since the demerger of Fiberweb in November 2006 that left the group as a focused aviation
group. We set our target multiple at 14.5x, a premium to that historical average to reflect the improved mix of group activities towards
FBO post completion of the Landmark purchase, but also to bring the group’s shares back to a 12% discount to the FTSE 250 PE rating
(16.4x). Without an obvious direct peer, we’ve previously shown that BBA’s typical relative range to that market valuation has been
between a 15% discount and 5% premium. The group’s FY16F dividend (covered 1.9x by earnings) also yields robustly at 4.9%.
Valuation Scenarios
Source: Jefferies estimates
0
200
400
600
800
1000
1200
1400
1600
1800
2000
2012 2013 2014 2015F2016F2017F2018F2019F2020F2021F2022F
Business Jet TurboProp Rotorcraft
Themes & Tactics
Europe Insights
18 December 2015
page 10 of 28 , International Analyst, +44 (0) 20 7029 8685, [email protected] Jefferies Int'l Ltd. Equity Research
Please see important disclosure information on pages 24 - 28 of this report.

Tate & Lyle – Clean Slate & Lyle (PT: 680p, 14% upside)
Investment case for 2016
Tate is a cyclical opportunity with a secular overlay. Together we think these are capable of driving positive earnings surprises during 2016
and a credible path to £10 per share in the years beyond. This is an opportunity predicated on positive upgrade momentum in the near
term, as opposed to multiple expansion. We think that sentiment is poised to improve, following an annus horribilis in 2014/15 when Tate
posted three sequential profit warnings. Meanwhile, the 4.8% dividend yield, which we think is sustainable, offers downside protection.
Cyclical rebound underway in US CWM, plus a growth kicker in Sucralose
Around 80% of profits now arise from Corn Wet Milling (CWM) in the US, where c.£1.25bn of assets in the form of four big mills in the
MidWest power Tate’s Bulk & Speciality Starches & Sweeteners business. We view CWM as a ‘rational’ industry, led by Cargill and ADM
(Tate is #3) with high capital barriers (c.$500m per mill) and a history of high returns. Cargill and ADM have a history of retiring capacity to
match demand. Cargill’s closure of its Memphis, TN, wet mill in November 2014 has improved industry utilisation by 5 to 10 percentage
points, to 90%+. This sort of level has been associated historically with peak profitability for Tate (see chart). The recently concluded
pricing round for High Fructose Corn Syrup, the most visible and transparent indicator of CWM health, has been one of the best we can
remember.
The growth kicker in Tate’s FY17 (year to March 2017) profit equation is Sucralose. Following the entry of Chinese generics, Sucralose
profits have gone from £65m to almost zero in three years. But Tate has taken decisive action to restructure this business by closing one of
its two plants (equivalent to a 25% reduction in industry capacity) just as Pepsi’s decision to switch Diet Pepsi in the US out of Aspartame
and into Sucralose has increased global demand by 10%. Along with Tate’s strategy of targeting less price-sensitive customers, we think a
path back to modest but sustainable profitability for Sucralose has been revealed.
Relative to a current consensus of c. £220m, we believe a plausible upside case on Tate’s EBIT in FY17/18 is in the high £200m’s. This
would equate to c.50p of EPS, relative to the current consensus of 38p. Beyond that, Tate’s ‘Vision 2020’ strategy calls for 70% of profits to
arise from higher value Speciality Food Ingredients (SFI) by 2020. A valuation of £10 per share at that point would require an EV:EBITDA of
14x, when an SFI specialist like Kerry trades on close to 17x.
Key Catalysts and Financial Data
Source: FactSet; Jefferies analysis & estimates
Tate US profits vs. capacity utilisation
Source: Tate & Lyle; McKeany Flavell; Jefferies analysis
Valuation
Our 680p PT is based on a SOTP that values Tate at 10.4x prospective 12-month EBITDA and 18x earnings. This compares with SFI players
such as Kerry on 16.7x EBITDA/23.0x PER and Glanbia on 16.4x EBITDA/21.4x PER. US peer Ingredion trades on 8.8x EBITDA/16.6x PER.
Valuation Scenarios
Source: Jefferies estimates
FY95
FY96FY97FY98
FY99
FY00
FY01FY02FY03
FY04FY05
FY06
FY07FY08
FY09FY10
FY11
$0m
$50m
$100m
$150m
$200m
$250m
$300m
$350m
$400m
$450m
70% 75% 80% 85% 90% 95% 100%
EB
ITA
HFCS utilisation
Themes & Tactics
Europe Insights
18 December 2015
page 11 of 28 , International Analyst, +44 (0) 20 7029 8685, [email protected] Jefferies Int'l Ltd. Equity Research
Please see important disclosure information on pages 24 - 28 of this report.
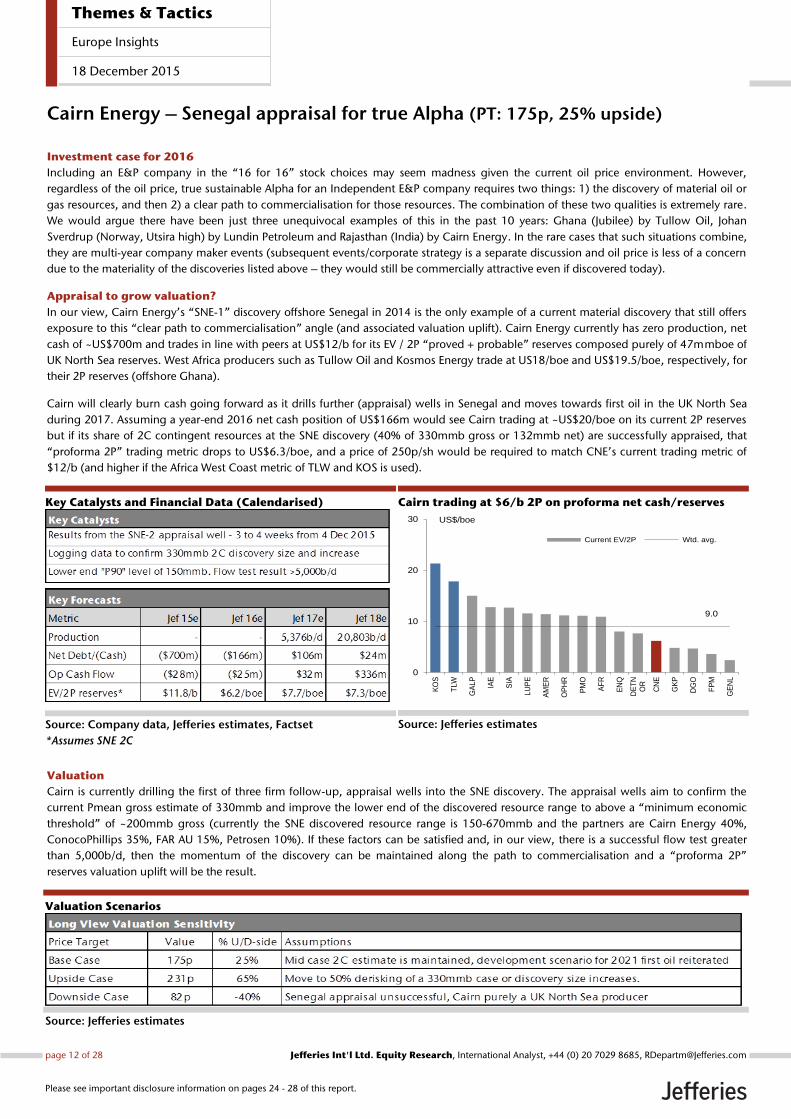
Cairn Energy – Senegal appraisal for true Alpha (PT: 175p, 25% upside)
Investment case for 2016
Including an E&P company in the “16 for 16” stock choices may seem madness given the current oil price environment. However,
regardless of the oil price, true sustainable Alpha for an Independent E&P company requires two things: 1) the discovery of material oil or
gas resources, and then 2) a clear path to commercialisation for those resources. The combination of these two qualities is extremely rare.
We would argue there have been just three unequivocal examples of this in the past 10 years: Ghana (Jubilee) by Tullow Oil, Johan
Sverdrup (Norway, Utsira high) by Lundin Petroleum and Rajasthan (India) by Cairn Energy. In the rare cases that such situations combine,
they are multi-year company maker events (subsequent events/corporate strategy is a separate discussion and oil price is less of a concern
due to the materiality of the discoveries listed above – they would still be commercially attractive even if discovered today).
Appraisal to grow valuation?
In our view, Cairn Energy’s “SNE-1” discovery offshore Senegal in 2014 is the only example of a current material discovery that still offers
exposure to this “clear path to commercialisation” angle (and associated valuation uplift). Cairn Energy currently has zero production, net
cash of ~US$700m and trades in line with peers at US$12/b for its EV / 2P “proved + probable” reserves composed purely of 47mmboe of
UK North Sea reserves. West Africa producers such as Tullow Oil and Kosmos Energy trade at US18/boe and US$19.5/boe, respectively, for
their 2P reserves (offshore Ghana).
Cairn will clearly burn cash going forward as it drills further (appraisal) wells in Senegal and moves towards first oil in the UK North Sea
during 2017. Assuming a year-end 2016 net cash position of US$166m would see Cairn trading at ~US$20/boe on its current 2P reserves
but if its share of 2C contingent resources at the SNE discovery (40% of 330mmb gross or 132mmb net) are successfully appraised, that
“proforma 2P” trading metric drops to US$6.3/boe, and a price of 250p/sh would be required to match CNE’s current trading metric of
$12/b (and higher if the Africa West Coast metric of TLW and KOS is used).
Key Catalysts and Financial Data (Calendarised)
Source: Company data, Jefferies estimates, Factset
*Assumes SNE 2C
Cairn trading at $6/b 2P on proforma net cash/reserves
Source: Jefferies estimates
Valuation
Cairn is currently drilling the first of three firm follow-up, appraisal wells into the SNE discovery. The appraisal wells aim to confirm the
current Pmean gross estimate of 330mmb and improve the lower end of the discovered resource range to above a “minimum economic
threshold” of ~200mmb gross (currently the SNE discovered resource range is 150-670mmb and the partners are Cairn Energy 40%,
ConocoPhillips 35%, FAR AU 15%, Petrosen 10%). If these factors can be satisfied and, in our view, there is a successful flow test greater
than 5,000b/d, then the momentum of the discovery can be maintained along the path to commercialisation and a “proforma 2P”
reserves valuation uplift will be the result.
Valuation Scenarios
Source: Jefferies estimates
9.0
0
10
20
30
KO
S
TLW
GA
LP
IAE
SIA
LU
PE
AM
ER
OP
HR
PM
O
AF
R
EN
Q
DE
TN
OR
CN
E
GK
P
DG
O
FP
M
GE
NL
US$/boe
Current EV/2P Wtd. avg.
Themes & Tactics
Europe Insights
18 December 2015
page 12 of 28 , International Analyst, +44 (0) 20 7029 8685, [email protected] Jefferies Int'l Ltd. Equity Research
Please see important disclosure information on pages 24 - 28 of this report.

Growth Opportunities
Essentra – What price consistent EPS growth?
JUST EAT – Just buy
Diploma – Flexing the growth drivers
Greencore – Growth to Go
Themes & Tactics
Europe Insights
18 December 2015
page 13 of 28 , International Analyst, +44 (0) 20 7029 8685, [email protected] Jefferies Int'l Ltd. Equity Research
Please see important disclosure information on pages 24 - 28 of this report.

Essentra – What price consistent EPS growth? (PT: 1000p, 21% upside) Investment case for 2016
Essentra has been on a terrific journey since CEO Colin Day took the helm in April 2011, with the market capitalisation up more than
fourfold. The journey so far has created a unified company with a scalable business model, transforming its growth profile, something we
believe the market only partly recognises. Management’s initial targets (set under Vision 2015) were a resounding success and the
medium-term strategy (and share price driver) has been outlined in the ‘Drive for 2020’ strategic plan – namely to double revenues by
2020, through at least mid-single digit organic revenue growth and continued acquisitions. In our view, the structural and cultural
changes that have taken places have laid the foundations for continued future earnings growth, and the current share price offers an
attractive opportunity to invest in a company with a visible earnings trajectory driven primarily by self-help.
Essentra can deliver 13.1% EPS CAGR 2014-2017
Essentra has achieved a 9.1% OCC revenue growth CAGR and 18.0% EPS CAGR 2011-2014, and we believe there remains significant
opportunities for organic revenue growth through continued market share gains, margin progression and value-accretive M&A. The
Clondalkin acquisition (completed in Feb 15) has been transformational and cost synergies of $24m (with scope for additional upside)
over the next two years will help drive margins to 16.2%. Furthermore, the new group structure provides the platform for execution of the
‘Drive for 2020’ strategy unlocking additional cross-selling revenue synergies and further footprint rationalisation synergies. Perhaps the
biggest single change at Essentra has been (and will continue to be) the change in employee culture, right the way through the whole
organisation. Only c10 of the original 40 ‘senior management team’ in 2011 are currently in the same role. The culture of the company
has become more entrepreneurial and a focus on Key Account management, investment into range / geographic expansion and marketing
should continue to drive market share gains. We forecast Essentra will report 13.1% EPS growth CAGR 2014-2017F.
Key Catalysts and Financial Data (Calendarised)
Source: Company data, Jefferies estimates, Factset
A terrific journey since 2011... with more to come
Source: Jefferies estimates
Valuation
Essentra currently trades on 2016F PER of 16.5x and 13.0x EV/EBITA, a small premium to the UK Industrials but an unwarranted c17%
discount to other Pan-European Industrial stocks with similar EPS profiles. Our 1,000p PT is based upon an equal weighted 19.5x PER and
15.0x EV/EBITA applied to FY16F forecasts. In the near term, we believe consistent execution and merely meeting consensus earnings
estimates should be sufficient to re-rate the share to our PT. Over the medium term, we highlight that our analysis of Essentra achieving the
‘Drive for 2020’ targets would offer material (c45%) upside to our 1,200p upside scenario PT.
Valuation Scenarios
Source: Jefferies estimates
0.0%
5.0%
10.0%
15.0%
20.0%
25.0%
30.0%
£0m
£200m
£400m
£600m
£800m
£1000m
£1200m
£1400m
£1600m
£1800m
20
05
20
06
20
07
20
08
20
09
20
10
20
11
20
12
20
13
20
14
20
15
F
20
16
F
20
17
F
Revenue (LHS) Underlying EBITA margins (RHS)
2005-2011
Rev CAGR (1.0%)
EBITA CAGR +5.3%
EPS CAGR +7.0%
2011-2014
Rev CAGR +15.3%
EBITA CAGR +17.4%
EPS CAGR +18.0%
2014-2017F
Rev CAGR +13.7%
EBITA CAGR +15.0%
EPS CAGR +13.1%
Themes & Tactics
Europe Insights
18 December 2015
page 14 of 28 , International Analyst, +44 (0) 20 7029 8685, [email protected] Jefferies Int'l Ltd. Equity Research
Please see important disclosure information on pages 24 - 28 of this report.

JUST EAT – Just Buy (PT: 515p, 10% upside)
Investment case for 2016
We are big fans of marketplace models; those businesses that list products for sale by third parties and take a commission or a subscription
fee in return. In that bucket, we include the likes of AutoTrader, Scout24, Zoopla, and JUST EAT. In JUST EAT’s case, its website lists
restaurants for consumers to order food for delivery or collection and then relays that order onto the restaurant. It differs by market, but in
the UK, 12% of the transaction amount is retained by JUST EAT in the form of a commission. Being the market leader of a marketplace
model has a number of benefits, not least the network effect. The more listings you have, the more consumers you will attract, which in
turn makes it more interesting for a retailer to list. A number 1 player is likely to have the most listings and the most eyeballs, meaning, as
well as generating the most revenue, it can also spend less on marketing, a double boost for the bottom line. When we see JUST EAT at
around 10x the size of the number two player in the UK, Hungry House, the benefits speak for themselves.
The continued opportunity for growth and margin expansion
Since 2014's IPO, CEO David Buttress has clearly executed well on the business model. Back then, consensus FY16 revenue estimates
centred on c.£230m; today that pretty much represents current consensus for FY15. H115 UK order growth c. +49%, 69% of those orders
from mobile form factor, H115 UK EBITDA margin 44.5%, up +540 bps YoY. FY14 revenue +62.2%, £157.0m, and H115 revenue +54.4%,
£107.8m; JEF has upgraded numbers three times in 2015. Current FY15 guide for revenues ‘around £230m’ appear intuitively
conservative. Looking forward, we forecast more strong revenue growth, +36.6% in 2016E and +25.2% in 2017E, leading to a very healthy
+39.5% 14/17 revenue CAGR. As for EBITDA, margin expansion is set to continue as scale becomes more and more relevant. We forecast a
28.6% EBITDA margin in 2016E, a +470 bps increase from 2015E, and a further +670 bps increase in 2017 to 35.3%.
Key Catalysts and Financial Data (Calendarised)
Source: Company data, Jefferies estimates, Factset
Strong growth and super-normal margins
Source: Jefferies estimates
Valuation
Our 515p price target comes from a simple average of the implied valuations from EV/Sales, EV/EBITDA, P/E, and PEG; we are firm buyers
of this stock. Our 515p price target infers a 32x 2017 P/E and a 0.6 PEG on our estimates, which compares to our marketplace peer group
average of 24x 2017 P/E. However, the premium implied for JE is mitigated when we look at the peer group PEG at 1.1x.
Valuation Scenarios
Source: Jefferies estimates
34
60,
+77%
97,
+62%
157,
+62%
249,
+59%
341,
+37%
427,
+25%
4%
15%
21%
24%
29%
35%
0%
5%
10%
15%
20%
25%
30%
35%
40%
0
50
100
150
200
250
300
350
400
450
2011 2012 2013 2014 2015 2016 2017
Revenue EBITDA margin
Themes & Tactics
Europe Insights
18 December 2015
page 15 of 28 , International Analyst, +44 (0) 20 7029 8685, [email protected] Jefferies Int'l Ltd. Equity Research
Please see important disclosure information on pages 24 - 28 of this report.

Diploma – Flexing the growth drivers (PT: 825p, 16% upside)
Investment case for 2016
Diploma faces a diverse range of niche end markets, but there is long-term appeal from the resilient consumable nature of the technical
products it distributes. With net cash on the balance sheet and high FCF generation, Diploma remains a quality self-financing
compounding story, and we expect M&A will be an important growth driver in FY16. The stock has de-rated slightly through 2015 on
fears over slowing organic growth and weaker margins, and we believe this is a good time to enter a quality compounding name that,
through the cycle, should be able to offer 10%-15% EPS growth.
Growth - one way or another
Looking back over the last 10 years shows a top line that has grown on average by 13% and in no year moved backwards. In some years
the bias is organic, in others M&A. In FY14, when organic growth was 8%, there was a relatively modest 5% contribution from M&A, while
in FY15 the slowing of organic growth to 1% was met with a step-up in M&A growth to 11%.
In FY16, we anticipate that, one way or another, top line will again grow strongly. The organic growth backdrop looks steady in the US
and improving in Europe, while the easy 2H comps will provide some assistance. We forecast net cash of £16m in FY16, which combined
with a debt facility and strong FCF (£44m) provides the means for high single-digit EPS accretion from M&A. Comments from
management suggest the pipeline is in good shape with some sizeable opportunities, although as ever conversion will be key as the
business remains disciplined in achieving its targeted 13% post tax IRR on deals.
Importantly, the group demonstrates strong gross margin stability (10-year range: 35%-38%) combined with good operational cost
control, which has driven steady operating margins despite transactional FX issues, investments and a moderation in organic growth. We
see some upside risk to margins from better organic growth, work with suppliers and integration of FY15 acquisitions.
Key Catalysts and Financial Data (Calendarised)
Source: Company data, Jefferies estimates, Factset
Self-financing compounding machine
Source: Jefferies estimates
Valuation
We apply a 14x EV/EBITA multiple to CY16, which drives an 825p price target and Buy recommendation. This multiple is more in line with
the premium operators in the distribution sub-sector given superior returns, margins and FCF dynamics. There is also a useful 3% dividend
yield. Please note we include £50m of hidden value from land in our EV, which is held on the balance sheet with a NBV of £Nil. At our price
target the stock would trade on 20x CY16F EPS. Main risk: slowing US industrial markets.
Valuation Scenarios
Source: Jefferies estimates
Themes & Tactics
Europe Insights
18 December 2015
page 16 of 28 , International Analyst, +44 (0) 20 7029 8685, [email protected] Jefferies Int'l Ltd. Equity Research
Please see important disclosure information on pages 24 - 28 of this report.

Greencore – Growth to Go (PT: 370p, 7% upside)
Investment case for 2016
GNC represents that rare thing within today’s food space: the opportunity to invest behind structural growth in low-risk markets. GNC is
the leading provider of Foods-to-Go (FtG, sandwiches, sushi & panini etc.) both to the UK’s leading food retailers such as M&S and,
increasingly, on the other side of the Atlantic, to Starbucks & 7-11. We view Greencore not as an ‘own label supplier’ vulnerable to
contract volatility and a margin squeeze, but instead as a ‘strategic solutions provider’ operating within a category that is increasingly
mission-critical for major retailers and food service operators. The Foods to Go market in the UK is growing high single digits. In the US,
GNC’s growing partnership with Starbucks positions it ideally to ride on their coat-tails.
Structural growth in low-risk markets
FtG is one of the hotspots in the otherwise challenging UK Foods Space. Sandwiches, wraps & sushi are key to the offer in Convenience
Stores such as M&S Simply Food, where store numbers are set to grow by double digits. However, the FtG category is complex to service
given the perishable nature of the product and the potential for product quality, availability and food safety to impact the reputation of the
store brand. Thus growing chain convenience stores want to do business with professional providers with national capability like GNC.
Over in the US FtG is more nascent, and fragmented. However, Starbucks has identified the space as key to its LFL growth agenda, given
that Food represents only 20% of store sales and only 26% of transactions have a food component. Current committed contracts with
Starbucks and 7-11 represent run-rate revenues for GNC of $400m and GNC has total revenue capacity on the ground in the US of $600m.
This all adds up to forecast top-line growth of 6% on a three-year horizon and operating profit growth of 10% as the UK expands margins
modestly and US contract profitability migrates towards the group average. Conversion of operating profit to operating cash post capex
should improve from less than 30% in FY16 to more than 70% in FY18 as recent new investments in the UK and US mature. GNC pays
virtually no cash tax and has substantial unutilised deferred tax assets.
Key Catalysts and Financial Data
Source: FactSet; Jefferies analysis & estimates
The UK Foods to Go market
Source: Greencore
Valuation
Our 370p PT values the UK at 12.5x EBITDA and the US at 1.2x sales, both on a 12-24 month horizon. This resolves to a PER of 18x and an
EV:EBITDA of 13.3x at the same horizon. We believe that GNC should trade at a premium to its UK Food Processing peers due to superior
growth and lower ultimate capital intensity. We think solutions providers such as Compass and SSP are more relevant benchmarks.
Valuation Scenarios
Source: Jefferies estimates
Themes & Tactics
Europe Insights
18 December 2015
page 17 of 28 , International Analyst, +44 (0) 20 7029 8685, [email protected] Jefferies Int'l Ltd. Equity Research
Please see important disclosure information on pages 24 - 28 of this report.

Narrowing Valuation Discount
Zoopla – Moving the game on from simple search
Northgate – Opportunity to bounce from asset value
Poundland – A discounted discounter
Pendragon – Driving upgrades and a re-rating
Themes & Tactics
Europe Insights
18 December 2015
page 18 of 28 , International Analyst, +44 (0) 20 7029 8685, [email protected] Jefferies Int'l Ltd. Equity Research
Please see important disclosure information on pages 24 - 28 of this report.

Zoopla – Moving the game on from simple search (PT: 400p, 72% upside) Investment case for 2016
Zoopla is leading rather than following the market as it seeks to be the 'one-stop shop' for the homebuyer, the Amazon of UK residential,
with services ranging across property to tradesmen to utilities. In our view, two catalysts are likely to lead to a material re-rating of
Zoopla's shares in the coming months: challenger portal 'On The Market' failing to live up to its own hype of being the UK's number two
portal by January 2016, leading to customers returning to Zoopla; and uSwitch continuing to perform ahead of expectations. Our PT of
400p appears somewhat academic at present, but underlines our conviction in the attractions of Zoopla's shares.
Moving the property search game on with ‘Find Move Manage’
We recognise the UK's fascination with online property search. The simple fact is that currently a home sells once every 22 years in the UK;
the overwhelming majority of the millions of eyeballs viewing property online are a long way from the point of monetisation. However,
with utility, communications and financial services product contract cycles typically 12-24 months, eyeballs here are therefore much closer
to the holy grail of monetisation. Following its acquisition of uSwitch, Zoopla is ahead of the curve in helping households manage their
homes, and we believe that these more frequent touch adjacent markets will drive traffic to the property portal and vice versa. Add services
to help the buyer move home and all bases will be covered. With bases covered, the buyer controls the game, and Rightmove and OTM
may be found wanting.
Key Catalysts and Financial Data (Financial Year)
Source: Company data, Jefferies estimates, Bloomberg
Broad revenue mix ‘Find Move Manage’, not just property
search (Proforma 2015 revenue mix, %)
Source: Company data
Valuation
Our PT of 400p is based on a DCF valuation weighted 50% to our Neutral Case, 40% to our Bull Case and 10% to our Downside Case. At
the current price of 230p, Zoopla trades on a CY2016E PER of 17.3x and a CY2016E EV/EBITDA of 15.2x. This compares favourably with
RMV on a CY2016E PER of 32.9x and a CY2016E EV/EBITDA of 25.7x, particularly when you consider Zoopla’s JEFe Cal16e 40% EPS growth
vs RMV’s JEFe 9%.
Valuation Scenarios
Source: Jefferies estimates
Themes & Tactics
Europe Insights
18 December 2015
page 19 of 28 , International Analyst, +44 (0) 20 7029 8685, [email protected] Jefferies Int'l Ltd. Equity Research
Please see important disclosure information on pages 24 - 28 of this report.

Northgate – Opportunity to bounce from asset value (PT: 530p, 37% upside)
Investment case for 2016
After marking to market the value of Northgate’s fleet, we think the group’s tangible net asset value (TNAV) is equivalent to 372.5p per
share, and we see that growing c20p+ pa from here. The shares are currently priced by the market around that level (i.e. 1.0x adj BV),
when we believe that the group’s returns outlook can justify 1.3-1.75x. There are complexities in the story (including accounting that
blurs the picture and a mix of trends across the group), but with de-fleeting framing the downside scenario (which would realise the group
adjusted TNAV around which the shares are currently priced), valuation risk looks to us to reside to the upside. The dividend provides
compensation while we wait for a catalyst to emerge. We see that yielding 4% on our April 2016 forecasts and being covered 3.2x by
reported earnings. We further expect enhanced dividend growth as cover is moved lower within the group’s target 3.75x-2.5x range.
Back at TNAV
While we have been consistent and taken a somewhat different view, we believe that the broader market newsflow around Northgate has
transitioned from momentum to a more sombre tone. Before this year, group developments had included vehicle on hire [VoH] growth,
strengthening residual values, financing gains realised and boosts (at least cosmetically) from changes in the group depreciation policy.
More recent company updates have reflected VoH declines and softening residual values (mostly within the UK unit), as well as play-
through of the depreciation policy changes that are now forming an accounting headwind in the years post change. We believe it has
been this transition that the market has used to justify the share price retrenchment. But, in both the UK and Spain, the group continues to
achieve considerable profits on the disposal of its vehicles, telling us that they have been over zealously depreciated on the balance sheet.
We think marking to market that fleet points to an adj TNAV of c372.5p per share – around current market price levels. As the chart below
shows, outside of panic periods, Northgate’s shares have rarely traded below that reference point. In a worst-case scenario that
Northgate’s business were to shrink and de-fleet from here, it is the adjusted TNAV that is realised and the share price is already broadly
there. We think group return on equity (we expect at 12.4% this year on our adjusted measure) and benefits to come from the UK new
site programme can justify these shares on 1.3-1.75x adj BV. Valuation risk, we believe, resides to the upside. For our full view, see our
note Ready for a Risk/Reward Rebound (26 Oct 15)
Key Catalysts and Financial Data (Calendarised)
Source: Company data, Jefferies estimates, Factset
NTG’s P/BV has rarely sustained <1x outside panic periods
Source: Datastream, Jefferies
Valuation
Starting from a mid-point within the 1.3-1.75x adj BV range that we think can be justified for Northgate, we apply a discount to provide
some cushion for the uncertainties of the accounting adjustments that we think are necessary for this group. Our 530p price target
represents 1.35x our FY16F adj BV accordingly.
Valuation Scenarios
Source: Jefferies estimates
0.0
0.5
1.0
1.5
2.0
2.5
3.0
May
-00
May
-01
May
-02
May
-03
May
-04
May
-05
May
-06
May
-07
May
-08
May
-09
May
-10
May
-11
May
-12
May
-13
May
-14
May
-15
Spai
nco
nce
rns
Cre
dit
cri
sis
Themes & Tactics
Europe Insights
18 December 2015
page 20 of 28 , International Analyst, +44 (0) 20 7029 8685, [email protected] Jefferies Int'l Ltd. Equity Research
Please see important disclosure information on pages 24 - 28 of this report.

Poundland – A discounted discounter (PT: 300p, 40% upside)
Investment case for 2016
We believe investor sentiment towards Poundland has turned from being overly bullish to overly negative, and expect this to correct in
2016. A volatile 21 months as a public company has seen investors lose trust in the story and lose confidence in profit forecasts. We believe
the rapid integration of 99p stores and the consequent build towards £25m EBITDA synergies will help restore investor faith in the
business model. We forecast 15% EPS CAGR for FY15-18E, rising to 19% for FY16E-19E post the current year, leading to 23% TSR including
a 3.3% dividend yield. Trading on under 11x our cal 17 EPS, a far cry from the 20x+ multiple Poundland enjoyed until recently, we see the
risk/reward as attractive.
The valuation discount opportunity
Poundland’s share price has been hit by two factors in its relatively short life as a public company. The first is that against high expectations
at IPO in March 2014, underlying trading has disappointed as bumper LFL sales growth at IPO proved to be temporary and the low 4%
operating margin has shown itself to be vulnerable to adverse FX moves and living wage increases. The second is the acquisition of 99p
stores. The share price rose in anticipation of the deal being approved by the CMA, but has fallen nearly 40% since the deal was given
approval – in the best possible manner for Poundland, i.e. being able to keep all stores and leaving the way clear for possible future deals.
Part of this de-rating is due to current trading concerns, as Poundland is likely to be suffering from lower footfall on the high-street given
unseasonably warm weather this autumn. However, we think the more important factor is the positive impact of 50+ new store openings
pre-Christmas and the quick integration of c.250 99p stores. Another investor concern is that industry competition is accelerating in the UK
and that Poundland is reaching maturity. We partly agree with this as we know from Jefferies’ survey results that c.60% of the UK
population already shop at Poundland and just over 30% shop at 99p stores, with c.84% overlap for the 99p store customers. For this
reason, we forecast that the 99p stores conversion cannibalises existing Poundland stores. Yet we still believe in the cost synergies
Poundland can extract from the deal, and our recent trip to see Dealz in Spain gave us confidence that a European roll-out could be
successful for Poundland. Hence with Poundland trading on only 13x our cal 16 EPS and 11x our cal 17 EPS versus the UK General Retail
sector on c.15x, we see a buying opportunity.
Key Catalysts and Financial Data (Calendarised)
Source: Company data, Jefferies estimates, Factset
From overly bullish to overly negative
Source: Factset, Jefferies estimates
Valuation
Our 300p PT equates to c.15x our cal 17 EPS forecast, in line with 0.7x 3 year TSR FY16E-FY19E, a discount to the sector for its operational
leverage. We also believe the cashflow build is attractive – estimated to grow from cash neutral in FY16E to £33m in FY17E and £68m in
FY18E, underpinning the 3.3% dividend yield. Risks include issues with the integration of 99p stores not leading to the anticipated £25m
EBITDA synergies, industry competition increasing (including weather impacts), FX hits worsening, COGS and opex increases (like living
wage increases, though Poundland is working to mitigate these).
Valuation Scenarios
Source: Jefferies estimates
Themes & Tactics
Europe Insights
18 December 2015
page 21 of 28 , International Analyst, +44 (0) 20 7029 8685, [email protected] Jefferies Int'l Ltd. Equity Research
Please see important disclosure information on pages 24 - 28 of this report.

Pendragon – Driving upgrades and a re-rating (PT: 55p, 22% upside)
Investment case for 2016
For us, the equity story remains simple. The growth of the UK new car market will stabilise in 2016 but the strength witnessed over the last
four years will continue to feed into the used car market and the UK car parc, which will drive a powerful performance in aftersales. The
Used and Aftersales divisions of Pendragon account for 60% of group gross profits and have really only started to witness an uplift in the
last 12-18 months. With estimates conservatively set, we believe there is ongoing upside risk to consensus EPS, which should drive a re-
rating in the equity. Augmenting the underlying story is a conservative balance sheet, underleveraged versus management’s targets, and
this provides optionality around M&A and/or additional returns to shareholders.
Ongoing EPS upgrade cycle will close the valuation gap to peers
Annualised new car registrations in the UK have increased from 1.8m in 2009 to 2.6m currently, in line with historical peaks. While the
November growth rate was a healthy 4% and there is an argument for further growth, given the 2.0m ‘missing’ registrations between
2008 and 2013, we expect growth to stabilise in 2016.
The more important implication for the wave of new car registrations seen over the last four years is clear when viewed with the fact that
the average length of car ownership in the UK is 3-4 years. Essentially we are only starting to see the benefits in the used and aftersales
markets, which account for 60% of Pendragon’s gross profit. We believe upside risk to estimates exists from stronger-than-expected
volumes in used and aftersales. Increased volumes could see pricing pressure in used sales, although we believe that Pendragon’s pricing
strategy should allow it to be a little more protected.
In addition to a robust underlying story, Pendragon is rolling out an additional eight used and aftersales led dealerships per annum, for
which the capex drawdown is reflected in the cash flow but with no contribution to earnings - providing upside risk in outer years. Finally,
we forecast net debt to EBITDA at 0.5x, some way below the 1.0-1.5x range targeted by management, which leaves scope for additional
M&A, likely in the UK to accelerate the roll-out or for specific US assets, and/or special returns to shareholders. Visibility and confidence
over an elongated upgrade cycle, beyond the cyclical new car market strength, should re-rate the stock.
Key Catalysts and Financial Data (Calendarised)
Source: Company data, Jefferies estimates, Factset
The wave of new cars to hit the used market
Source: Jefferies estimates
Valuation
We value Pendragon on 6.5x Ev/EBITDA, similar to peers, which drives a 55p price target and Buy recommendation. At our price target,
the stock would trade on 14x FY16F EPS versus 11.5x now. We consider the current valuation, supported by a helpful 3% dividend yield,
extremely compelling given the point in the cycle, earnings momentum, balance sheet optionality and ongoing upside risk to consensus.
Downside risk is from falling used car margins.
Valuation Scenarios
Source: Jefferies estimates
Themes & Tactics
Europe Insights
18 December 2015
page 22 of 28 , International Analyst, +44 (0) 20 7029 8685, [email protected] Jefferies Int'l Ltd. Equity Research
Please see important disclosure information on pages 24 - 28 of this report.

Performance Summary of the UK Mid Market 15 for ‘15
Last Year’s Picks
Last year, we selected 15 ideas across five different themes. Those themes and stocks were:
Dividend/Cash Return: Synthomer, Intermediate Capital, Countrywide
Restructuring/Portfolio Change: Dechra, IMI, Monitise
Growth Opportunities: Greencore, B&M European Value Retail, NMC Health
Unjustified Valuation Discount: Paragon, National Express, Keller
Points of Inflection: N Brown Group, Telecity, Cairn Energy
Performance
It has been a year of contrasting fortunes for our selected stocks. While six of our 15 picks have seen 25%+ increases in their shares in
the year following publication, two have lost 25% or more of their value. Our highest outperformer (NMC Health) rose 87%, but this
was still insufficient to offset the disappointments and ensuing performance of Monitise (-91%), where the restructuring we had hoped
to see in the business failed to materialise, and significant management change seriously impacted sentiment. Even within sectors,
performance diverged, with our other software and service pick – Telecity – rising almost 53%.
15 for ’15 Stock Performance Table
StockPrice at
Inception (GBp)
Price on
11/12/14
Absolute
% Move
Rel % Move
v FTSE250
B&M Value Retail 276.3 287.0 3.9 -3.9
Cairn Energy 164.5 138.5 -15.8 -23.6
Countrywide 453.2 416.5 -8.1 -15.9
Dechra Pharmaceuticals 796.0 998.0 25.4 17.6
Greencore 294.0 331.1 12.6 4.9
IMI 1213.0 898.5 -25.9 -33.7
Intermediate Capital 439.5 590.5 34.4 26.6
Keller 834.5 810.0 -2.9 -10.7
Monitise 28.8 2.6 -91.1 -98.8
National Express 248.2 313.0 26.1 18.4
N Brown 340.5 319.8 -6.1 -13.8
NMC Health 485.0 907.0 87.0 79.3
Paragon Group 407.7 363.9 -10.7 -18.5
Synthomer 225.5 311.1 38.0 30.2
Telecity 790.5 1209.0 52.9 45.2
Themes & Tactics
Europe Insights
18 December 2015
page 23 of 28 , International Analyst, +44 (0) 20 7029 8685, [email protected] Jefferies Int'l Ltd. Equity Research
Please see important disclosure information on pages 24 - 28 of this report.

Analyst Certification:I, Jefferies Int'l Ltd. Equity Research, certify that all of the views expressed in this research report accurately reflect my personal views about the subjectsecurity(ies) and subject company(ies). I also certify that no part of my compensation was, is, or will be, directly or indirectly, related to the specificrecommendations or views expressed in this research report.I, Kean Marden, certify that all of the views expressed in this research report accurately reflect my personal views about the subject security(ies) andsubject company(ies). I also certify that no part of my compensation was, is, or will be, directly or indirectly, related to the specific recommendationsor views expressed in this research report.I, Andy Douglas, certify that all of the views expressed in this research report accurately reflect my personal views about the subject security(ies) andsubject company(ies). I also certify that no part of my compensation was, is, or will be, directly or indirectly, related to the specific recommendationsor views expressed in this research report.I, Alan Spence, CFA, certify that all of the views expressed in this research report accurately reflect my personal views about the subject security(ies) andsubject company(ies). I also certify that no part of my compensation was, is, or will be, directly or indirectly, related to the specific recommendationsor views expressed in this research report.I, Caroline Gulliver, certify that all of the views expressed in this research report accurately reflect my personal views about the subject security(ies) andsubject company(ies). I also certify that no part of my compensation was, is, or will be, directly or indirectly, related to the specific recommendationsor views expressed in this research report.I, James Vane-Tempest, certify that all of the views expressed in this research report accurately reflect my personal views about the subjectsecurity(ies) and subject company(ies). I also certify that no part of my compensation was, is, or will be, directly or indirectly, related to the specificrecommendations or views expressed in this research report.I, Joe Spooner, certify that all of the views expressed in this research report accurately reflect my personal views about the subject security(ies) andsubject company(ies). I also certify that no part of my compensation was, is, or will be, directly or indirectly, related to the specific recommendationsor views expressed in this research report.I, Martin Deboo, certify that all of the views expressed in this research report accurately reflect my personal views about the subject security(ies) andsubject company(ies). I also certify that no part of my compensation was, is, or will be, directly or indirectly, related to the specific recommendationsor views expressed in this research report.I, Mark Wilson, CEng, certify that all of the views expressed in this research report accurately reflect my personal views about the subject security(ies) andsubject company(ies). I also certify that no part of my compensation was, is, or will be, directly or indirectly, related to the specific recommendationsor views expressed in this research report.I, Rob Virdee, certify that all of the views expressed in this research report accurately reflect my personal views about the subject security(ies) andsubject company(ies). I also certify that no part of my compensation was, is, or will be, directly or indirectly, related to the specific recommendationsor views expressed in this research report.I, David Reynolds, certify that all of the views expressed in this research report accurately reflect my personal views about the subject security(ies) andsubject company(ies). I also certify that no part of my compensation was, is, or will be, directly or indirectly, related to the specific recommendationsor views expressed in this research report.I, Anthony Codling, certify that all of the views expressed in this research report accurately reflect my personal views about the subject security(ies) andsubject company(ies). I also certify that no part of my compensation was, is, or will be, directly or indirectly, related to the specific recommendationsor views expressed in this research report.I, Will Kirkness, certify that all of the views expressed in this research report accurately reflect my personal views about the subject security(ies) andsubject company(ies). I also certify that no part of my compensation was, is, or will be, directly or indirectly, related to the specific recommendationsor views expressed in this research report.I, Alexander Bowden, certify that all of the views expressed in this research report accurately reflect my personal views about the subject security(ies) andsubject company(ies). I also certify that no part of my compensation was, is, or will be, directly or indirectly, related to the specific recommendationsor views expressed in this research report.Registration of non-US analysts: Jefferies Int'l Ltd. Equity Research is employed by Jefferies International Limited, a non-US affiliate of Jefferies LLCand is not registered/qualified as a research analyst with FINRA. This analyst(s) may not be an associated person of Jefferies LLC, a FINRA member firm,and therefore may not be subject to the NASD Rule 2711 and Incorporated NYSE Rule 472 restrictions on communications with a subject company,public appearances and trading securities held by a research analyst.
Registration of non-US analysts: Kean Marden is employed by Jefferies International Limited, a non-US affiliate of Jefferies LLC and is not registered/qualified as a research analyst with FINRA. This analyst(s) may not be an associated person of Jefferies LLC, a FINRA member firm, and therefore maynot be subject to the NASD Rule 2711 and Incorporated NYSE Rule 472 restrictions on communications with a subject company, public appearancesand trading securities held by a research analyst.
Registration of non-US analysts: Andy Douglas is employed by Jefferies International Limited, a non-US affiliate of Jefferies LLC and is not registered/qualified as a research analyst with FINRA. This analyst(s) may not be an associated person of Jefferies LLC, a FINRA member firm, and therefore maynot be subject to the NASD Rule 2711 and Incorporated NYSE Rule 472 restrictions on communications with a subject company, public appearancesand trading securities held by a research analyst.
Registration of non-US analysts: Alan Spence, CFA is employed by Jefferies International Limited, a non-US affiliate of Jefferies LLC and is notregistered/qualified as a research analyst with FINRA. This analyst(s) may not be an associated person of Jefferies LLC, a FINRA member firm, andtherefore may not be subject to the NASD Rule 2711 and Incorporated NYSE Rule 472 restrictions on communications with a subject company, publicappearances and trading securities held by a research analyst.
Registration of non-US analysts: Caroline Gulliver is employed by Jefferies International Limited, a non-US affiliate of Jefferies LLC and is notregistered/qualified as a research analyst with FINRA. This analyst(s) may not be an associated person of Jefferies LLC, a FINRA member firm, andtherefore may not be subject to the NASD Rule 2711 and Incorporated NYSE Rule 472 restrictions on communications with a subject company, publicappearances and trading securities held by a research analyst.
Registration of non-US analysts: James Vane-Tempest is employed by Jefferies International Limited, a non-US affiliate of Jefferies LLC and is notregistered/qualified as a research analyst with FINRA. This analyst(s) may not be an associated person of Jefferies LLC, a FINRA member firm, and
Themes & Tactics
Europe Insights
18 December 2015
page 24 of 28 , International Analyst, +44 (0) 20 7029 8685, [email protected] Jefferies Int'l Ltd. Equity Research
Please see important disclosure information on pages 24 - 28 of this report.
therefore may not be subject to the NASD Rule 2711 and Incorporated NYSE Rule 472 restrictions on communications with a subject company, publicappearances and trading securities held by a research analyst.
Registration of non-US analysts: Joe Spooner is employed by Jefferies International Limited, a non-US affiliate of Jefferies LLC and is not registered/qualified as a research analyst with FINRA. This analyst(s) may not be an associated person of Jefferies LLC, a FINRA member firm, and therefore maynot be subject to the NASD Rule 2711 and Incorporated NYSE Rule 472 restrictions on communications with a subject company, public appearancesand trading securities held by a research analyst.
Registration of non-US analysts: Martin Deboo is employed by Jefferies International Limited, a non-US affiliate of Jefferies LLC and is not registered/qualified as a research analyst with FINRA. This analyst(s) may not be an associated person of Jefferies LLC, a FINRA member firm, and therefore maynot be subject to the NASD Rule 2711 and Incorporated NYSE Rule 472 restrictions on communications with a subject company, public appearancesand trading securities held by a research analyst.
Registration of non-US analysts: Mark Wilson, CEng is employed by Jefferies International Limited, a non-US affiliate of Jefferies LLC and is notregistered/qualified as a research analyst with FINRA. This analyst(s) may not be an associated person of Jefferies LLC, a FINRA member firm, andtherefore may not be subject to the NASD Rule 2711 and Incorporated NYSE Rule 472 restrictions on communications with a subject company, publicappearances and trading securities held by a research analyst.
Registration of non-US analysts: Rob Virdee is employed by Jefferies International Limited, a non-US affiliate of Jefferies LLC and is not registered/qualified as a research analyst with FINRA. This analyst(s) may not be an associated person of Jefferies LLC, a FINRA member firm, and therefore maynot be subject to the NASD Rule 2711 and Incorporated NYSE Rule 472 restrictions on communications with a subject company, public appearancesand trading securities held by a research analyst.
Registration of non-US analysts: David Reynolds is employed by Jefferies International Limited, a non-US affiliate of Jefferies LLC and is notregistered/qualified as a research analyst with FINRA. This analyst(s) may not be an associated person of Jefferies LLC, a FINRA member firm, andtherefore may not be subject to the NASD Rule 2711 and Incorporated NYSE Rule 472 restrictions on communications with a subject company, publicappearances and trading securities held by a research analyst.
Registration of non-US analysts: Anthony Codling is employed by Jefferies International Limited, a non-US affiliate of Jefferies LLC and is notregistered/qualified as a research analyst with FINRA. This analyst(s) may not be an associated person of Jefferies LLC, a FINRA member firm, andtherefore may not be subject to the NASD Rule 2711 and Incorporated NYSE Rule 472 restrictions on communications with a subject company, publicappearances and trading securities held by a research analyst.
Registration of non-US analysts: Will Kirkness is employed by Jefferies International Limited, a non-US affiliate of Jefferies LLC and is not registered/qualified as a research analyst with FINRA. This analyst(s) may not be an associated person of Jefferies LLC, a FINRA member firm, and therefore maynot be subject to the NASD Rule 2711 and Incorporated NYSE Rule 472 restrictions on communications with a subject company, public appearancesand trading securities held by a research analyst.
Registration of non-US analysts: Alexander Bowden is employed by Jefferies International Limited, a non-US affiliate of Jefferies LLC and is notregistered/qualified as a research analyst with FINRA. This analyst(s) may not be an associated person of Jefferies LLC, a FINRA member firm, andtherefore may not be subject to the NASD Rule 2711 and Incorporated NYSE Rule 472 restrictions on communications with a subject company, publicappearances and trading securities held by a research analyst.
As is the case with all Jefferies employees, the analyst(s) responsible for the coverage of the financial instruments discussed in this report receivescompensation based in part on the overall performance of the firm, including investment banking income. We seek to update our research asappropriate, but various regulations may prevent us from doing so. Aside from certain industry reports published on a periodic basis, the large majorityof reports are published at irregular intervals as appropriate in the analyst's judgement.
Company Specific DisclosuresFor Important Disclosure information on companies recommended in this report, please visit our website at https://javatar.bluematrix.com/sellside/Disclosures.action or call 212.284.2300.
Explanation of Jefferies RatingsBuy - Describes securities that we expect to provide a total return (price appreciation plus yield) of 15% or more within a 12-month period.Hold - Describes securities that we expect to provide a total return (price appreciation plus yield) of plus 15% or minus 10% within a 12-month period.Underperform - Describes securities that we expect to provide a total return (price appreciation plus yield) of minus 10% or less within a 12-monthperiod.The expected total return (price appreciation plus yield) for Buy rated securities with an average security price consistently below $10 is 20% or morewithin a 12-month period as these companies are typically more volatile than the overall stock market. For Hold rated securities with an averagesecurity price consistently below $10, the expected total return (price appreciation plus yield) is plus or minus 20% within a 12-month period. ForUnderperform rated securities with an average security price consistently below $10, the expected total return (price appreciation plus yield) is minus20% or less within a 12-month period.NR - The investment rating and price target have been temporarily suspended. Such suspensions are in compliance with applicable regulations and/or Jefferies policies.CS - Coverage Suspended. Jefferies has suspended coverage of this company.NC - Not covered. Jefferies does not cover this company.Restricted - Describes issuers where, in conjunction with Jefferies engagement in certain transactions, company policy or applicable securitiesregulations prohibit certain types of communications, including investment recommendations.Monitor - Describes securities whose company fundamentals and financials are being monitored, and for which no financial projections or opinionson the investment merits of the company are provided.
Valuation Methodology
Themes & Tactics
Europe Insights
18 December 2015
page 25 of 28 , International Analyst, +44 (0) 20 7029 8685, [email protected] Jefferies Int'l Ltd. Equity Research
Please see important disclosure information on pages 24 - 28 of this report.

Jefferies' methodology for assigning ratings may include the following: market capitalization, maturity, growth/value, volatility and expected totalreturn over the next 12 months. The price targets are based on several methodologies, which may include, but are not restricted to, analyses of marketrisk, growth rate, revenue stream, discounted cash flow (DCF), EBITDA, EPS, cash flow (CF), free cash flow (FCF), EV/EBITDA, P/E, PE/growth, P/CF,P/FCF, premium (discount)/average group EV/EBITDA, premium (discount)/average group P/E, sum of the parts, net asset value, dividend returns,and return on equity (ROE) over the next 12 months.
Jefferies Franchise PicksJefferies Franchise Picks include stock selections from among the best stock ideas from our equity analysts over a 12 month period. Stock selectionis based on fundamental analysis and may take into account other factors such as analyst conviction, differentiated analysis, a favorable risk/rewardratio and investment themes that Jefferies analysts are recommending. Jefferies Franchise Picks will include only Buy rated stocks and the numbercan vary depending on analyst recommendations for inclusion. Stocks will be added as new opportunities arise and removed when the reason forinclusion changes, the stock has met its desired return, if it is no longer rated Buy and/or if it triggers a stop loss. Stocks having 120 day volatility inthe bottom quartile of S&P stocks will continue to have a 15% stop loss, and the remainder will have a 20% stop. Franchise Picks are not intendedto represent a recommended portfolio of stocks and is not sector based, but we may note where we believe a Pick falls within an investment stylesuch as growth or value.
Risks which may impede the achievement of our Price TargetThis report was prepared for general circulation and does not provide investment recommendations specific to individual investors. As such, thefinancial instruments discussed in this report may not be suitable for all investors and investors must make their own investment decisions basedupon their specific investment objectives and financial situation utilizing their own financial advisors as they deem necessary. Past performance ofthe financial instruments recommended in this report should not be taken as an indication or guarantee of future results. The price, value of, andincome from, any of the financial instruments mentioned in this report can rise as well as fall and may be affected by changes in economic, financialand political factors. If a financial instrument is denominated in a currency other than the investor's home currency, a change in exchange rates mayadversely affect the price of, value of, or income derived from the financial instrument described in this report. In addition, investors in securities suchas ADRs, whose values are affected by the currency of the underlying security, effectively assume currency risk.
Other Companies Mentioned in This Report• Acacia Mining PLC (ACA LN: p159.80, BUY)• B&M European Value Retail SA (BME LN: p299.00, BUY)• BBA Aviation Plc (BBA LN: p177.80, BUY)• Bodycote plc (BOY LN: p539.50, BUY)• Cairn Energy (CNE LN: p137.90, BUY)• Countrywide (CWD LN: p399.00, BUY)• Debenhams PLC (DEB LN: p73.10, BUY)• Dechra Pharmaceuticals (DPH LN: p1,000.00, BUY)• Diploma (DPLM LN: p740.00, BUY)• Essentra Plc (ESNT LN: p832.50, BUY)• Greencore Plc (GNC LN: p346.40, BUY)• IMI plc (IMI LN: p853.50, HOLD)• Intermediate Capital Group (ICP LN: p604.00, BUY)• JUST EAT plc (JE/ LN: p468.30, BUY)• Keller (KLR LN: p841.00, BUY)• Monitise PLC (MONI LN: p2.88, HOLD)• National Express Group plc (NEX LN: p326.90, BUY)• N Brown Group (BWNG LN: p303.00, BUY)• NMC Health (NMC LN: p883.00, BUY)• Northgate plc (NTG LN: p391.80, BUY)• Paragon Group of Companies (PAG LN: p363.70, BUY)• Pendragon (PDG LN: p45.75, BUY)• Poundland Group PLC (PLND LN: p210.40, BUY)• Serco Group PLC (SRP LN: p93.80, BUY)• Synthomer PLC (SYNT LN: p324.60, BUY)• Tate & Lyle (TATE LN: p589.00, BUY)• TelecityGroup (TCY LN: p1,228.00, BUY)• UDG Healthcare Plc (UDG LN: p571.00, BUY)• Zoopla (ZPLA LN: p239.40, BUY)
Distribution of RatingsIB Serv./Past 12 Mos.
Rating Count Percent Count Percent
BUY 1162 54.02% 332 28.57%HOLD 828 38.49% 161 19.44%UNDERPERFORM 161 7.48% 19 11.80%
Themes & Tactics
Europe Insights
18 December 2015
page 26 of 28 , International Analyst, +44 (0) 20 7029 8685, [email protected] Jefferies Int'l Ltd. Equity Research
Please see important disclosure information on pages 24 - 28 of this report.

Other Important DisclosuresJefferies Equity Research refers to research reports produced by analysts employed by one of the following Jefferies Group LLC (“Jefferies”) groupcompanies:United States: Jefferies LLC which is an SEC registered firm and a member of FINRA.United Kingdom: Jefferies International Limited, which is authorized and regulated by the Financial Conduct Authority; registered in England andWales No. 1978621; registered office: Vintners Place, 68 Upper Thames Street, London EC4V 3BJ; telephone +44 (0)20 7029 8000; facsimile +44 (0)207029 8010.Hong Kong: Jefferies Hong Kong Limited, which is licensed by the Securities and Futures Commission of Hong Kong with CE number ATS546; locatedat Suite 2201, 22nd Floor, Cheung Kong Center, 2 Queen’s Road Central, Hong Kong.Singapore: Jefferies Singapore Limited, which is licensed by the Monetary Authority of Singapore; located at 80 Raffles Place #15-20, UOB Plaza 2,Singapore 048624, telephone: +65 6551 3950.Japan: Jefferies (Japan) Limited, Tokyo Branch, which is a securities company registered by the Financial Services Agency of Japan and is a memberof the Japan Securities Dealers Association; located at Hibiya Marine Bldg, 3F, 1-5-1 Yuraku-cho, Chiyoda-ku, Tokyo 100-0006; telephone +813 52516100; facsimile +813 5251 6101.India: Jefferies India Private Limited (CIN - U74140MH2007PTC200509), which is licensed by the Securities and Exchange Board of India as a MerchantBanker (INM000011443), Research Analyst (INH000000701) and a Stock Broker with Bombay Stock Exchange Limited (INB011491033) and NationalStock Exchange of India Limited (INB231491037) in the Capital Market Segment; located at 42/43, 2 North Avenue, Maker Maxity, Bandra-KurlaComplex, Bandra (East) Mumbai 400 051, India; Tel +91 22 4356 6000.This material has been prepared by Jefferies employing appropriate expertise, and in the belief that it is fair and not misleading. The information setforth herein was obtained from sources believed to be reliable, but has not been independently verified by Jefferies. Therefore, except for any obligationunder applicable rules we do not guarantee its accuracy. Additional and supporting information is available upon request. Unless prohibited by theprovisions of Regulation S of the U.S. Securities Act of 1933, this material is distributed in the United States ("US"), by Jefferies LLC, a US-registeredbroker-dealer, which accepts responsibility for its contents in accordance with the provisions of Rule 15a-6, under the US Securities Exchange Act of1934. Transactions by or on behalf of any US person may only be effected through Jefferies LLC. In the United Kingdom and European EconomicArea this report is issued and/or approved for distribution by Jefferies International Limited and is intended for use only by persons who have, or havebeen assessed as having, suitable professional experience and expertise, or by persons to whom it can be otherwise lawfully distributed. JefferiesInternational Limited has adopted a conflicts management policy in connection with the preparation and publication of research, the details of whichare available upon request in writing to the Compliance Officer. Jefferies International Limited may allow its analysts to undertake private consultancywork. Jefferies International Limited’s conflicts management policy sets out the arrangements Jefferies International Limited employs to manage anypotential conflicts of interest that may arise as a result of such consultancy work. For Canadian investors, this material is intended for use only byprofessional or institutional investors. None of the investments or investment services mentioned or described herein is available to other personsor to anyone in Canada who is not a "Designated Institution" as defined by the Securities Act (Ontario). In Singapore, Jefferies Singapore Limited isregulated by the Monetary Authority of Singapore. For investors in the Republic of Singapore, this material is provided by Jefferies Singapore Limitedpursuant to Regulation 32C of the Financial Advisers Regulations. The material contained in this document is intended solely for accredited, expert orinstitutional investors, as defined under the Securities and Futures Act (Cap. 289 of Singapore). If there are any matters arising from, or in connectionwith this material, please contact Jefferies Singapore Limited, located at 80 Raffles Place #15-20, UOB Plaza 2, Singapore 048624, telephone: +656551 3950. In Japan this material is issued and distributed by Jefferies (Japan) Limited to institutional investors only. In Hong Kong, this report isissued and approved by Jefferies Hong Kong Limited and is intended for use only by professional investors as defined in the Hong Kong Securities andFutures Ordinance and its subsidiary legislation. In the Republic of China (Taiwan), this report should not be distributed. The research in relation tothis report is conducted outside the PRC. This report does not constitute an offer to sell or the solicitation of an offer to buy any securities in the PRC.PRC investors shall have the relevant qualifications to invest in such securities and shall be responsible for obtaining all relevant approvals, licenses,verifications and/or registrations from the relevant governmental authorities themselves. In India this report is made available by Jefferies India PrivateLimited. In Australia this information is issued solely by Jefferies International Limited and is directed solely at wholesale clients within the meaning ofthe Corporations Act 2001 of Australia (the "Act") in connection with their consideration of any investment or investment service that is the subject ofthis document. Any offer or issue that is the subject of this document does not require, and this document is not, a disclosure document or productdisclosure statement within the meaning of the Act. Jefferies International Limited is authorised and regulated by the Financial Conduct Authorityunder the laws of the United Kingdom, which differ from Australian laws. Jefferies International Limited has obtained relief under Australian Securitiesand Investments Commission Class Order 03/1099, which conditionally exempts it from holding an Australian financial services licence under theAct in respect of the provision of certain financial services to wholesale clients. Recipients of this document in any other jurisdictions should informthemselves about and observe any applicable legal requirements in relation to the receipt of this document.
This report is not an offer or solicitation of an offer to buy or sell any security or derivative instrument, or to make any investment. Any opinion orestimate constitutes the preparer's best judgment as of the date of preparation, and is subject to change without notice. Jefferies assumes no obligationto maintain or update this report based on subsequent information and events. Jefferies, its associates or affiliates, and its respective officers, directors,and employees may have long or short positions in, or may buy or sell any of the securities, derivative instruments or other investments mentioned ordescribed herein, either as agent or as principal for their own account. Upon request Jefferies may provide specialized research products or servicesto certain customers focusing on the prospects for individual covered stocks as compared to other covered stocks over varying time horizons orunder differing market conditions. While the views expressed in these situations may not always be directionally consistent with the long-term viewsexpressed in the analyst's published research, the analyst has a reasonable basis and any inconsistencies can be reasonably explained. This materialdoes not constitute a personal recommendation or take into account the particular investment objectives, financial situations, or needs of individualclients. Clients should consider whether any advice or recommendation in this report is suitable for their particular circumstances and, if appropriate,seek professional advice, including tax advice. The price and value of the investments referred to herein and the income from them may fluctuate. Pastperformance is not a guide to future performance, future returns are not guaranteed, and a loss of original capital may occur. Fluctuations in exchangerates could have adverse effects on the value or price of, or income derived from, certain investments. This report has been prepared independently ofany issuer of securities mentioned herein and not in connection with any proposed offering of securities or as agent of any issuer of securities. Noneof Jefferies, any of its affiliates or its research analysts has any authority whatsoever to make any representations or warranty on behalf of the issuer(s).Jefferies policy prohibits research personnel from disclosing a recommendation, investment rating, or investment thesis for review by an issuer priorto the publication of a research report containing such rating, recommendation or investment thesis. Any comments or statements made herein arethose of the author(s) and may differ from the views of Jefferies.
This report may contain information obtained from third parties, including ratings from credit ratings agencies such as Standard & Poor’s. Reproductionand distribution of third party content in any form is prohibited except with the prior written permission of the related third party. Third party content
Themes & Tactics
Europe Insights
18 December 2015
page 27 of 28 , International Analyst, +44 (0) 20 7029 8685, [email protected] Jefferies Int'l Ltd. Equity Research
Please see important disclosure information on pages 24 - 28 of this report.

providers do not guarantee the accuracy, completeness, timeliness or availability of any information, including ratings, and are not responsible forany errors or omissions (negligent or otherwise), regardless of the cause, or for the results obtained from the use of such content. Third party contentproviders give no express or implied warranties, including, but not limited to, any warranties of merchantability or fitness for a particular purpose oruse. Third party content providers shall not be liable for any direct, indirect, incidental, exemplary, compensatory, punitive, special or consequentialdamages, costs, expenses, legal fees, or losses (including lost income or profits and opportunity costs) in connection with any use of their content,including ratings. Credit ratings are statements of opinions and are not statements of fact or recommendations to purchase, hold or sell securities. Theydo not address the suitability of securities or the suitability of securities for investment purposes, and should not be relied on as investment advice.
Jefferies research reports are disseminated and available primarily electronically, and, in some cases, in printed form. Electronic research issimultaneously available to all clients. This report or any portion hereof may not be reprinted, sold or redistributed without the written consent ofJefferies. Neither Jefferies nor any officer nor employee of Jefferies accepts any liability whatsoever for any direct, indirect or consequential damagesor losses arising from any use of this report or its contents.
For Important Disclosure information, please visit our website at https://javatar.bluematrix.com/sellside/Disclosures.action or call 1.888.JEFFERIES
© 2015 Jefferies Group LLC
Themes & Tactics
Europe Insights
18 December 2015
page 28 of 28 , International Analyst, +44 (0) 20 7029 8685, [email protected] Jefferies Int'l Ltd. Equity Research
Please see important disclosure information on pages 24 - 28 of this report.


![S A OPE 19 U A E 19 OPE 196 T · 2020-03-09 · A I SP L A S A U A E OPE 9HQH]XHOD OPE OPE OPE T T T A I IR I SP L A N U A E S A 196 191 199 196 2000 196 19 196 200 19 OPE 196 P E](https://img.pdfslide.us/doc/110x75/5eb193773ed8566dce459833/s-a-ope-19-u-a-e-19-ope-196-t-2020-03-09-a-i-sp-l-a-s-a-u-a-e-ope-9hqhxhod-ope.jpg)