Embed Size (px)
Citation preview

EURONEXT INVESTOR TOOLBOX
Updated on 13 April 2018

Overview

Euronext Investor Toolbox
RENEWAL OF CLEARING AGREEMENT AND 11.1% of LCH SA
EURONEXT’S DEVELOPMENT SINCE 2000
MERGER OF AMSTERDAM, BRUSSELS & PARIS EXCHANGES
ACQUISITION OF LIFFE ACQUISITION OF LISBON EXCHANGE
MERGER WITH NYSE GROUP
ACQUISITION BY ICE CARVE-OUT CREATION OF “NEW EURONEXT”
2000 2002 2007 2013 03/2014
« Old Euronext N.V.» NYSE Euronext ICE Group, Inc.
2001 IPO
06/2014 IPO
LAUNCH OF “AGILITY FOR GROWTH”
05/2016
2003
DISPOSAL OF CLEARNET DISPOSAL OF LIFFE
03/2014
Fixed income technology
• Information matching system that directs buyers to sellers and provides data for fixed income markets
March 2017
FX trading
• US electronic communication network platform for spot FX
• Acquisition of a 90% stake in FastMatch
May 2017
September 2017
• Launch of a European Tech SME initiative beyond core domestic markets, opening offices in four new countries – Germany, Italy, Spain and Switzerland – and deploying teams on the ground
• All four countries to benefit from new dedicated solutions for Tech SMEs and the extension of existing successful programs
• Main target: becoming the reference listing venue for Tech companies in Europe
Tech Hub Initiative Corporate services
February 2017
• Acquisition of 51% • Comprehensive
range of webcast, webinar and conference call services for Investor Relations and corporate events
Corporate services
• Acquisition of 60% • Dematerialized
board portal solution and decision making tool for corporates and public organisations
July 2017
• Acquisition of a 20% stake in EuroCCP
December 2016
Equity clearing
• Acquisition of an 11.1% stake in LCH SA
• Renewal of 10-year clearing of financial derivatives contract
August 2017
Multi-asset clearing
2017 developments
Overview Agility for Growth
Capital & Governance
Expansion 2017 results
2018
ACQUISITION OF THE IRISH STOCK EXCHANGE
3
2017

Euronext Investor Toolbox
LISTING
CASH & DERIVATIVES TRADING
MARKET DATA
Equity and debt issuers (large caps,
SMEs)
Brokers , traders and retail & institutional
Investors1)
Index users, Data providers, banks
Single Order Book
Harmonized rule book
AMSTERDAM | BRUSSELS | LISBON | LONDON | PARIS | DUBLIN Hong Kong | New-York | Porto
CAC 40
AEX
BEL20
PSI20
Home of the:
TECHNOLOGY Exchanges, banks
POST TRADE Banks (securities services), issuers
1) Indirect users 2) Spot FX trading on FastMatch trading platform
€324bn raised on our markets in 2017
Investors
Issuers
4
EURONEXT: AN OPERATING MODEL, HIGHLY SCALABLE
UTP / Optiq
SPOT FX TRADING2) Brokers, traders &
institutional Investors1)
• A unique gateway for investors to access our markets
• State-of-the-art new trading platform Optiq®
• Transparent cross-border trading of securities on one single trading line
• Ability to easily integrate and support local products and specificities
• Enabling issuers to remain multi-listed more efficiently
Overview Agility for Growth
Capital & Governance
Expansion 2017 results

Euronext Investor Toolbox
THE LEADING PAN-EUROPEAN EXCHANGE IN THE EUROZONE
LISTING TRADING
POST-TRADE MARKET DATA & INDICES
TECHNOLOGY
Cash 2017 Cash Equity Market Share: 64.4%
2017 Cash ADV : €7.5bn on four regulated markets
Second to none market quality: 80% presence time at EBBO on Blue Chips (Dec. 2017)
Derivatives
2017 Derivatives ADV: 550k lots
Large range of options on stock and derivatives on indexes such as the CAC40, AEX, BEL20 and PSI20
CAC40 futures contract, Europe’s second most heavily traded index future overall
Strong offer of commodity derivatives: Milling wheat contract, European benchmark for physical milling wheat
Spot FX
2017 spot FX ADV: $18.4bn
Leading edge technology
Largest listing franchise in continental Europe, as of December 2017, with
1,300 issuers worth
€3.6trn in market capitalization
Strong debt, funds and ETFs listing franchise
Over 5,500 corporate, financial and government listed securities
Strong presence within the Morningstar® Eurozone 50 Index℠ , listing 24 out of 50 companies
Pan European Market Data offering ~140k screens ~430 vendors1)
Complete market data for over 300
real time Indices compiled by Euronext including the key national indices for the Euronext markets: AEX, CAC40, BEL 20 and PSI 20
Proprietary leading-edge trading technology Optiq Innovative projects:
Disruptive trading platform with fintech Algomi Blockchain initiative with LiquidShare Big Data platform
Clearing Cash equities clearing: user preferred
model with LCH S.A and EuroCCP Derivatives products clearing through
LCH S.A
Custody & Settlement Interbolsa: the Portuguese Central
Securities Depository, connected to Target 2 Securities
1) As of end of 2017
Overview Agility for Growth
Capital & Governance
Expansion 2017 results
5

Euronext Investor Toolbox
USA
France
Switzerland
The Netherlands
United Kingdom
Japan
Germany
Ireland
Portugal
Belgium
Others
Italy
A STRONG AND DIVERSIFIED COMPANY: AT A GLANCE
Revenue in 2017
€532.3m Cash trading
Derivatives trading
Client flow origins1) (ADV as of 31/12/2017)
2017 financials are unaudited and excluding Euronext Dublin. Spot FX trading revenue from FastMatch consolidated for 4.6 months in 2017 1) Both legs of the transaction are counted (double counted) 2) As of 28/03/18
EBITDA MARGIN
55.9%
HEADCOUNT
687 (as of 31st Dec.
2017)
EURONEXT MARKET CAP.
€4.2bn2)
NET PROFIT
€241.3m
Overview Agility for Growth
Capital & Governance
Expansion 2017 results
Listing 84.2
Cash trading 190.3
Derivatives trading 40.3
FX Spot trading 7.2
Market Data & Indices
104.7
Clearing 51.1
Custody & Settlement
20.6
Market Solutions &
Other revenue
33.8
45%
18%
11%
8%
7%
4%
3% 2% 0% 0%
1%
28%
16%
6%
30%
12%
2%
6%
0% 0% 0% 0%
6
Euronext Investor Toolbox
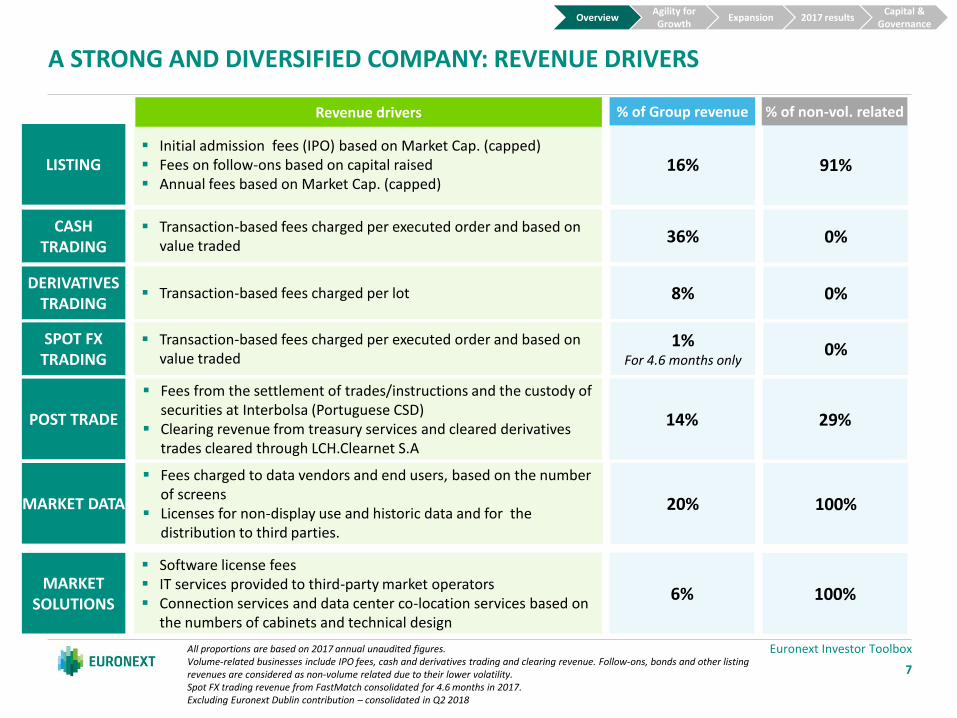
Initial admission fees (IPO) based on Market Cap. (capped) Fees on follow-ons based on capital raised Annual fees based on Market Cap. (capped)
Transaction-based fees charged per executed order and based on value traded
Transaction-based fees charged per lot
Fees from the settlement of trades/instructions and the custody of securities at Interbolsa (Portuguese CSD)
Clearing revenue from treasury services and cleared derivatives trades cleared through LCH.Clearnet S.A
Fees charged to data vendors and end users, based on the number of screens
Licenses for non-display use and historic data and for the distribution to third parties.
Software license fees IT services provided to third-party market operators Connection services and data center co-location services based on
the numbers of cabinets and technical design
A STRONG AND DIVERSIFIED COMPANY: REVENUE DRIVERS
LISTING
CASH TRADING
MARKET DATA
POST TRADE
DERIVATIVES TRADING
MARKET SOLUTIONS
Revenue drivers % of Group revenue
16%
36%
8%
14%
20%
6%
% of non-vol. related
91%
0%
0%
29%
100%
100%
All proportions are based on 2017 annual unaudited figures. Volume-related businesses include IPO fees, cash and derivatives trading and clearing revenue. Follow-ons, bonds and other listing revenues are considered as non-volume related due to their lower volatility. Spot FX trading revenue from FastMatch consolidated for 4.6 months in 2017. Excluding Euronext Dublin contribution – consolidated in Q2 2018
Overview Agility for Growth
Capital & Governance
Expansion 2017 results
Transaction-based fees charged per executed order and based on value traded
SPOT FX TRADING
1% For 4.6 months only
0%
7

Euronext Investor Toolbox
STRONG CASH FLOW GENERATION AND LIQUIDITY POSITION “A” RATING BY STANDARDS AND POORS (OUTLOOK STABLE)
EBITDA / operating cash flow conversion rate Balance sheet
Liquidity Debt
Assets Liabilities & Equity
60% 72%
In €m In €m
In €m
64% 72%
In €m
2017
213.1
297.8
2016
181.1
283.9
Net operating cash flow
EBITDA
2017
1,065.6
266.2
515.1
96.4 187.8
2016
757.5
172.6
321.2
89.2 174.5
Other non-current assets
Goodwill & other intangibles
Other current assets
Cash & Cash Equivalent
2017
1,065.6
729.5
164.7 46.6
124.8
2016
757.5
548.0
69.0 20.3 120.2
Equity
Borrowings
Other non-current liabilities
Current liabilities
31 Dec. 2017
-23
165
Net debt Gross debt
€110m Targeted cash for operation
Cash & Cash equivalent
RCF
Liquidity 2017
437.8
RCF facility
250.0
Cash in 2017
187.8
Other
4.7
Dividends
98.8
Acquistions
167.3
Capex
23.9
Net
borrowings
95.0
Operating
CF
213.1
Cash in 2016
174.5
8
Overview Agility for Growth
Capital & Governance
Expansion 2017 results
Launch on 11 April 2018 of an inaugural €500m 7-year bond
Coupon @1.0%
Oversubscribed 4.4x

Euronext Investor Toolbox Note: Share price evolution rebased on Euronext share price as of 20 June 2014 (IPO) Source: Thomson One as of 09/03/2018
Euronext +203%
LSEG +121%
DB +99%
BME -20%
CAC40 +16%
EURONEXT STOCK PRICE HAS INCREASED BY 203% SINCE IPO
Overview Agility for Growth
Capital & Governance
Expansion 2017 results
9
€ 10.00
€ 15.00
€ 20.00
€ 25.00
€ 30.00
€ 35.00
€ 40.00
€ 45.00
€ 50.00
€ 55.00
€ 60.00
€ 65.00
Jun-14 Sep-14 Dec-14 Mar-15 Jun-15 Sep-15 Dec-15 Mar-16 Jun-16 Sep-16 Dec-16 Mar-17 Jun-17 Sep-17 Dec-17

Agility for Growth strategic plan

Euronext Investor Toolbox
Euronext’s core mission is to power pan-European capital markets to finance the real economy
EURONEXT’S STRATEGIC PLAN: “AGILITY FOR GROWTH”
1) Excluding clearing activities
Objectives
Transform Euronext into a more flexible, client-centric and future-oriented business Client centricity, group-wide transformational program launched early 2017 Cost management discipline, €22m gross efficiencies, €15m net of inflation M&A framework, €100m to 150m for bolt-on acquisitions and development costs Strengthened IT platform, Optiq™ delivered in 2017 and 2018
Agility
Resilience
Growth
Value creation
Continue to meet obligations to clients today while constantly reaching for change Continued core business growth, +2% CAGR revenues 2015-19 Preserved market share, >60% in cash equity trading, >50% in French equity
options Maintain and expand listings, market data & index businesses
Add value to issuers and investors through 7 core initiatives Add value to issuers, 2 initiatives Add value to investors, 5 initiatives Grow revenues, incremental revenues contribution of €55m, at 50% EBITDA Margin Create optionality in post-trade solutions, investment in EuroCCP
Convert opportunities into value for our shareholders1)
Revenue growth, 5% CAGR 2015-19 EBITDA margin strengthen, 61% to 63% EBITDA margin in 2019, excluding
FastMatch and Irish Stock Exchange Disciplined capital allocation, 50% pay out, with a floor at €1.42 per share
Enablers
Client centricity
Innovation discipline
Talent development
Entrepreneurial culture
Open federal model
Overview Agility for Growth
Capital & Governance
Expansion 2017 results
11

Euronext Investor Toolbox
Continue to meet obligations to clients today while constantly reaching for change tomorrow
Listing
Cash trading
Market data and Indices
Derivative trading
Largest European venue
Deepest liquidity pool
Solution for changing needs
OTC, strong commodity offer
Recurring revenues
Revenue consolidation
Revenue growth
Diversification of business
STRENGTHEN RESILIENCE OF THE CORE BUSINESS TO CREATE VALUE …
Value for clients Value for shareholders Strategy description
Expand the largest continental European venue to meet client financing needs and deliver a resilient and diversified source of revenue
Continue optimization strategy to drive growth and remain the market of reference with >60% market share
Extend derivatives product mix, maintain >50% market share on equity options in France, strengthen commodities and expand into OTC
Leverage a customizable index business and data service to offset general trends of a decreasing number of screens
Overview Agility for Growth
Capital & Governance
Expansion 2017 results
12

Euronext Investor Toolbox
… AND APPLY A DISCIPLINED APPROACH TO INCREASE SCALE AND DIVERSIFY REVENUE STREAMS
• Adding value to issuers and investors
• Leveraging our assets: technology infrastructure, network, brand, neutrality, product portfolio and industry positioning
• Growing organically and accelerating growth through acquisitions
• Implementing our strategy in a disciplined and agile manner
Through seven growth initiatives in selected segments, we aim to deliver an uplift in top line of €55m, at 50% EBITDA margin, by 2019 while continuing to strengthen the profitability of our businesses
Adding value to investors
One-stop-shop pan-European ETF platform
The modular corporate services provider
The exchange for European Tech SMEs
Specialist content provider on agricultural commodities
European family of indices with an open source model
Adding value to issuers
Creating options and diversified post-trade solutions
Cash
Listing
Listing
Derivatives
Derivatives
Post-Trade
New corporate fixed income trading platform Fixed Income
Our ambition is to accelerate our top-line growth through a consistent strategy
Overview Agility for Growth
Capital & Governance
Expansion 2017 results
13
Euronext Investor Toolbox
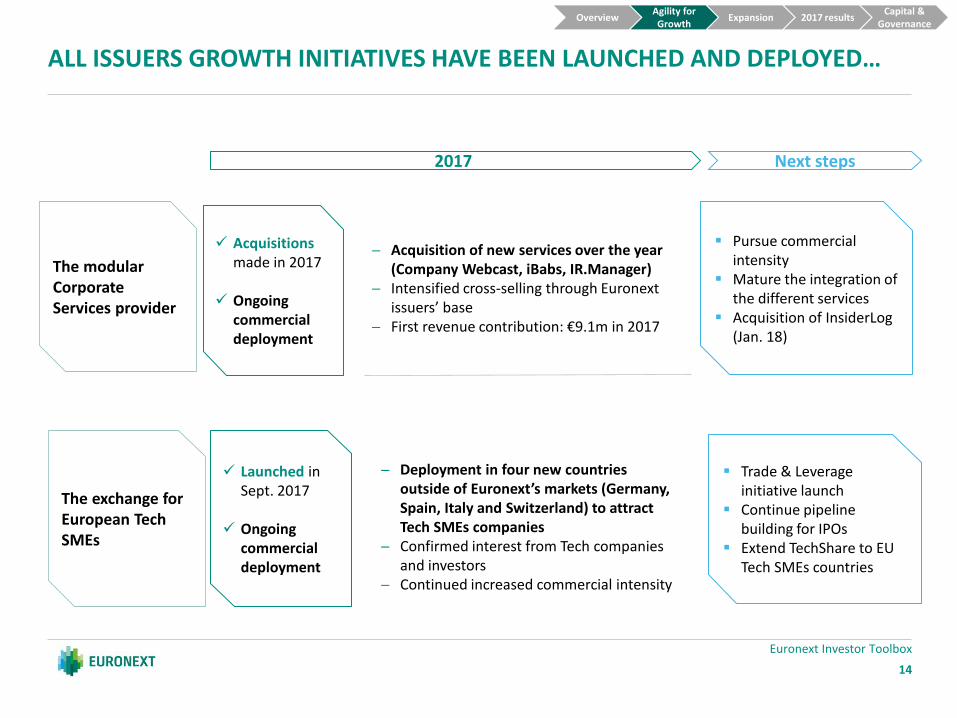
ALL ISSUERS GROWTH INITIATIVES HAVE BEEN LAUNCHED AND DEPLOYED…
─ Deployment in four new countries
outside of Euronext’s markets (Germany, Spain, Italy and Switzerland) to attract Tech SMEs companies
─ Confirmed interest from Tech companies and investors
─ Continued increased commercial intensity
Trade & Leverage initiative launch
Continue pipeline building for IPOs
Extend TechShare to EU Tech SMEs countries
The exchange for European Tech SMEs
─ Acquisition of new services over the year (Company Webcast, iBabs, IR.Manager)
─ Intensified cross-selling through Euronext issuers’ base
─ First revenue contribution: €9.1m in 2017
Pursue commercial intensity
Mature the integration of the different services
Acquisition of InsiderLog (Jan. 18)
The modular Corporate Services provider
2017 Next steps
Launched in Sept. 2017
Ongoing commercial deployment
Acquisitions made in 2017
Ongoing commercial deployment
Overview Agility for Growth
Capital & Governance
Expansion 2017 results
14

Euronext Investor Toolbox
…AND MAJOR GROWTH INITIATIVES FOR INVESTORS ARE READY
─ Client interest confirmed ─ Go-live postponed after Optiq delivery
Delivery of the platform Client onboarding
One-stop-shop pan-European ETF platform
─ New indices launched with Morningstar:
─ Morningstar Eurozone 50 IndexTM
─ Morningstar Developed markets Europe 100 IndexTM
Launch of new future contract in Jan.18 on the Morningstar Eurozone 50 IndexTM
European family of indices
─ Capture OTC Flows: Ongoing IT development
─ Commodities data provider: paused
OTC flow: delivery of IT and post-trade solution and go live
Specialist content on agricultural commodities
─ Launch of Euronext Synapse MTF in Dec. 2017 in Europe
─ US platform waiting regulators approval
US regulatory approval Continued clients
onboarding in Europe Fixed income
─ RiskGuard: main features of derivatives launched and first clients invoiced
─ APA/ARM: live ─ Inventory management: Ongoing
development. Collateral abandoned.
APA/ARM: continued onboarding of customers
Inventory management: Adoption of the platform
Post-trade
2017 Next steps
To be launched in H2 2018
Ongoing commercial deployment
Tradable since July 2017
Ongoing commercial deployment
EU platform live in Dec. 17
Ongoing commercial deployment
RiskGuard and APA/ARM services launched in 2017
Ongoing commercial deployment
Overview Agility for Growth
Capital & Governance
Expansion 2017 results
15

Euronext Investor Toolbox
2019 FINANCIAL TARGETS
+2.0% CAGR2015-2019, i.e. 505m€ Core Business revenue in 2019 excluding clearing (unchanged)
€55m incremental revenue in 2019 (excluding clearing) (vs. €70m in May 2016),
50 % EBITDA margin (unchanged)
61 to 63% EBITDA margin in 2019 excl. clearing (unchanged), excluding FastMatch and ISE
22m€ of gross costs savings on Core Business (unchanged), i.e. €15m net of inflation
Core business costs reduction expected to start in H2 2018
Dividend policy: 50% Pay-out of reported net income, with a floor at €1.42 per share
(unchanged)
ROCE>WACC in year 3 (unchanged) Full-year contribution of FastMatch and
the Irish Stock Exchange2) in 2019
€505m +4.3% CAGR17-19
€55m revenue €27.5m costs
-€22m gross savings -€15m net of inflation
61-63%
50% pay-out 1.42€/share floor
Not applicable
Deliver strong operating performance in Core Business
Focus on most value creating organic initiatives
Improve company efficiency
Deploy the balance sheet through targeted M&A to create value
Continue capital return to shareholders
Continue cost control
2019 TARGETS
€464m
€9.8m rev. €11m costs
57.5%
-€10.9m savings
€121m proposed for distribution1)
~€300m capital
deployed
2017
1) Subject to the approval of the AGM on 15 May 2018 2) Closing of ISE acquisition done on 27 March 2018
Overview Agility for Growth
Capital & Governance
Expansion 2017 results
16

Expansion strategy

Euronext Investor Toolbox
EURONEXT CAPITAL ALLOCATION POLICY
Disciplined approach to capital management
Key principles of capital allocation
Preserve Euronext financial and strategic agility and create value for investors
Disciplined and focused approach to capital allocation
Flexibility to take advantage from selected strategic opportunities
Proactive and periodic re-assessment of Euronext financial structure
Targets
Investment grade profile
Investments / M&A thresholds:
• ROCE > WACC in year 3
Capital return to shareholders:
• Dividend payout: 50% of reported net earnings or floor as in 2017
• Possibility to consider extraordinary capital return to shareholders should material M&A not materialise
Overview Agility for Growth
Capital & Governance
Expansion 2017 results
18

Euronext Investor Toolbox
19
EURONEXT, A GROUP IN TRANSFORMATION
1) Euronext London is recognised as a Recognised Investment Exchange (RIE) by the Financial Conduct Authority (FCA)
Fixed income technology
• Joint-venture creation and minority investment
• New trading facility to improve liquidity in pan-European corporate bond trading
March 2017
FX trading
• Fastest growing electronic communication network in the spot FX market
• Acquisition of a 90% stake
August 2017
Deployment of Agility for
Growth initiatives
Post-trade development
Asset class diversification
Corporate services
February 2017
• Acquisition of 51% • Comprehensive range of
webcast, webinar and conference call services for Investor Relations and corporate events
Corporate services
• Acquisition of 60% • Dematerialized board
portal solution and decision making tool for corporates and public organisations
July 2017
• Acquisition of a 20% stake in EuroCCP
• User Choice Clearing Model for Equity Markets
December 2016
Equity clearing
• 11.1% minority stake in LCH SA
December 2017
Multi-asset clearing
• 10-year agreement for the clearing of derivatives products
Madrid
Zurich
Munich
Frankfurt
Milan
Euronext historical presence Euronext recent Tech hub expansion
Paris
London1) Brussels
Amsterdam
Lisbon
Regulated markets Technology center
Porto
Sales office
Dublin
• Acquisition of 100% of the shares
• Expansion of Euronext federal model and debt franchise
November 2017
Irish Stock Exchange
Corporate services
• Acquisition of 80% • Management of insider
lists
€5.8m investment
January 2018
Expansion of the federal
model and of our debt franchise
• European post-trading blockchain infrastructure for the Small and Medium Enterprise (SME) market
July 2017
Blockchain
LIQUIDSHARE
Tech Hub Initiative September 2017
• Launch of a European Tech SME initiative beyond core domestic markets, opening offices in four new countries – Germany, Italy, Spain and Switzerland – and deploying teams on the ground
• All four countries to benefit from new dedicated solutions for Tech SMEs and the extension of existing successful programs
• Main target: becoming the reference listing venue for Tech companies in Europe
Overview Agility for Growth
Capital & Governance
Expansion 2017 results

Euronext Investor Toolbox
NEW ACQUISITIONS1) FEED VALUE CREATION POTENTIAL
1) ISE acquisition closed on 27 March 2018 2) Company Webcast, iBabs, IR.Soft 3) For 12 months of 2017. Unaudited accounts 4) Margin of acquisitions related to Agility for Growth. Do not include the costs of organic initiatives 5) Excluding cash
Rationale
FastMatch - FY173)
19.4
Irish Stock Exchange - FY173)
32.3
Acquisitions related to Agility for Growth 2)3)
11.8
Euronext excl. Agility for Growth initiatives
515.3
Capital invested or committed
Revenue for FY 2017 (€m)
For illustration purposes only
€137m5) $153m5) €33.9m
Expand the federal model
Diversify into new asset classes
EBITDA margin 57.6% ~50%4) 31.9% 40.7%
Non volume related revenue
20
Overview Agility for Growth
Capital & Governance
Expansion 2017 results

Euronext Investor Toolbox
Non-Electronic
20%
Electronic 80%
55% 65% 66%
45% 35% 34%
2010 2013 2016
Electronic Spot Voice Spot
A SIZEABLE MARKET OPPORTUNITY SUPPORTED BY STRONG TAILWINDS
Clients and regulation driving the market towards ECNs
Expectations of market participants
Efficient and timely comparison of quotes from multiple liquidity sources
Liquidity in all major currency pairs
Low connection costs
Transparent transaction fee scheme
Regulatory requirements
Regulatory mandate for best execution (MiFID II and Dodd Frank)
Clear separation between agency execution and market making
Independent transaction audit trail
Management of operational risks
Spot FX is ~4x bigger than equities
$1,652bn $5,067bn
x4
Significant potential for continuing electronification
Cash Equities Total FX
Electronic 56%
Voice/Hybrid 44%
Fast growing use of electronic orders in Spot FX
Cash Equity FX Spot Total FX
$443bn
ADV1) 2016
2010-2016E Electronic Spot Volume CAGR: +4.9%
Sources: Bank For international Settlements, World Federation of Exchanges, Aite Group 1) Traded volume in $ as of FY16 2) 2010 share of electronic trading per Aite Group due to a change in BIS methodology
2)
Overview Agility for Growth
Capital & Governance
Expansion 2017 results
21

Euronext Investor Toolbox
EURONEXT ACQUIRED THE IRISH STOCK EXCHANGE AND EXPAND ITS FEDERAL MODEL – 29 NOVEMBER 2017 AND CLOSING ON 27 MARCH 2018
1) WFE Statistics – October 2017, ‘Funds’ include Investment Funds and ETFs 2) Enterprise value on a debt-free cash free basis and excluding existing regulatory capital requirements (estimated at €21.8m) 3) To be proposed at the next Euronext general shareholders meeting
• Acquisition of 100% of the shares and voting rights of the Irish Stock Exchange (ISE) by Euronext: ISE is the #1 pool of liquidity for Irish equities (51 listed companies, c. €122bn total equity market capitalisation), the #1 debt listing venue globally (30,000+ securities and listings from 90 countries) and the #1 fund listing venue globally (5,242 Investment Funds Securities and 227 ETFs)1)
• Major milestone in the expansion of Euronext’s federal model, with Ireland becoming the 6th core European country, while enhancing Euronext’s post-Brexit strategic positioning as an open and international venue
• Strengthening of Euronext’s profile with the addition of highly complementary and leading activities in debt, funds and ETFs listings
• Significant growth and development opportunities for ISE, by joining Euronext’s federal model
A step to continue the construction of a major European global exchange player
Key transaction highlights
Optimised deal structure
• Transaction of €137m2) for 100% of the shares and voting rights of the Irish Stock Exchange (ISE)
• Optimisation of the balance sheet structure while retaining financial flexibility, with a transaction fully financed by debt (pro forma net leverage of c.0.5x LTM as of September 2017)
• Closing on 27 March 2018
Significant value creation for
shareholders
• Additional growth and cross-selling opportunities for the combined group, leveraging on ISE’s integration in Euronext pan-European network
• Estimated pre-tax run-rate operating cost synergies of €6m
• Expected return on capital employed above cost of capital in year 3, in line with the Group’s M&A discipline
• Recurring earnings accretion in 1st year
Integrated governance
• Deirdre Somers (CEO of Euronext Dublin) to join Euronext’s Managing Board3) with group-wide responsibility for Debt, Funds listings and ETF
• Proposal for the Chairman of ISE to join Euronext’s Supervisory Board3)
Overview Agility for Growth
Capital & Governance
Expansion 2017 results
22 22
1) WFE Statistics – October 2017, ‘Funds’ include Investment Funds and ETFs 2) Enterprise value on a debt-free cash free basis and excluding existing regulatory capital requirements (estimated at €21.8m) 3) To be proposed at the next Euronext general shareholders meeting and subject to regulatory approvals

Euronext Investor Toolbox
EURONEXT DUBLIN (FORMER IRISH STOCK ECHANGE) AT A GLANCE
• Focused on debt, funds and ETF listing proposition while retaining its position as the dominant market for Irish cash equities:
• Debt: #1 global debt listing venue1)
• Traded markets: #1 pool of liquidity for Irish equities • Corporate listing: Attractive listing venue for both large cap and SME issuers • Funds: A leading fund listing venue, globally #1 by funds listed1)
1) WFE Statistics, ‘Funds’ include Investment Funds and ETFs – October 2017 2) Remaining 20% owned by Malta Stock Exchange
• Based in Dublin, and established in 1995 when ISE demerged from the London Stock Exchange. ISE was demutualised in April 2014 to form a Public Limited Company and employs 135 people
• Euronext Dublin is the #1 pool of liquidity for Irish equities, the #1 debt listing venue globally and the #1 fund listing venue globally1), and operates 5 listing markets
Key
features
Business
Key financials
Revenue EBITDA Net income
Margin
ISE’s 5 listing markets
• Main Securities Market (MSM)
− Issuers listing debt, equity, funds & ETFs on an EU regulated market
• Global Exchange Market (GEM)
− Banks, companies & sovereigns listing debt and investment fund managers listing funds or ETFs
• Atlantic Securities Market (ASM)
− Multi-national corporations that intend to raise USD & EUR pools of capital, and attain dual listing on ISE and NASDAQ/NYSE
• Enterprise Securities Market (ESM)
− High growth companies in early stages of development
• European Wholesale Securities Market (EWSM) (80% stake2))
− Wholesale-denominated debt securities market
14.9
3.4
27.8
9.5
29.4
3.1
10.8
15.6
2015
+6.0%
2016
Funds
Traded Markets
Debt
2016
+19.9%
2015
9.6
8.0
2015 2016
8.0
6.7
+19.3%
28.9% 32.7%
In €m
Overview Agility for Growth
Capital & Governance
Expansion 2017 results
23 23

2017 Financials
Euronext Investor Toolbox
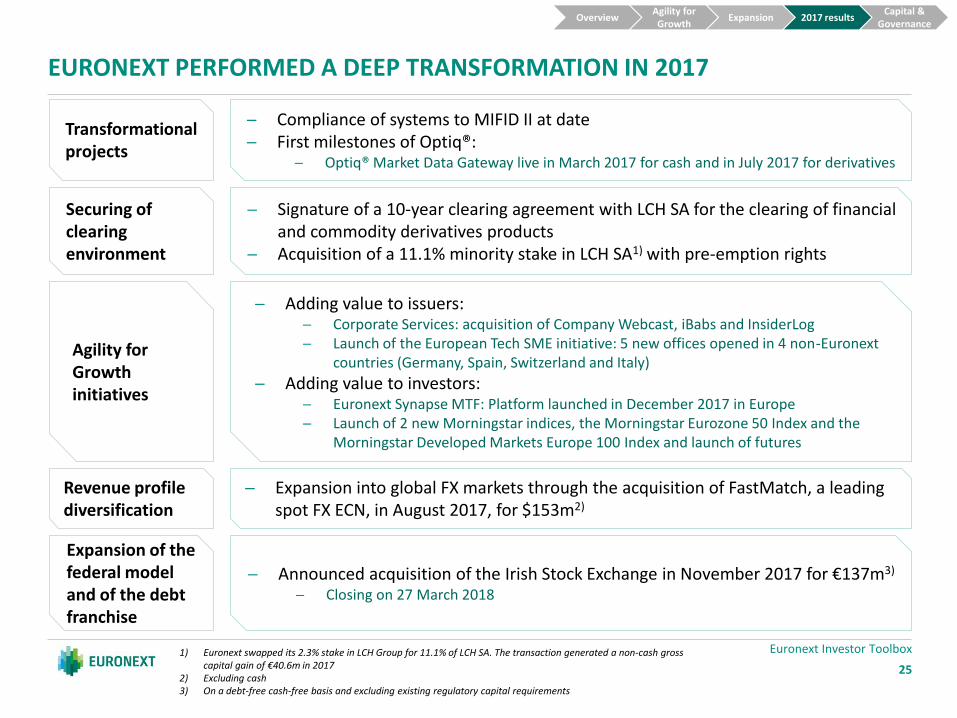
EURONEXT PERFORMED A DEEP TRANSFORMATION IN 2017
Securing of clearing environment
Transformational projects
Expansion of the federal model and of the debt franchise
Revenue profile diversification
Agility for Growth initiatives
─ Signature of a 10-year clearing agreement with LCH SA for the clearing of financial and commodity derivatives products
─ Acquisition of a 11.1% minority stake in LCH SA1) with pre-emption rights
─ Compliance of systems to MIFID II at date ─ First milestones of Optiq®:
─ Optiq® Market Data Gateway live in March 2017 for cash and in July 2017 for derivatives
─ Announced acquisition of the Irish Stock Exchange in November 2017 for €137m3)
─ Closing on 27 March 2018
─ Expansion into global FX markets through the acquisition of FastMatch, a leading spot FX ECN, in August 2017, for $153m2)
─ Adding value to issuers: ─ Corporate Services: acquisition of Company Webcast, iBabs and InsiderLog ─ Launch of the European Tech SME initiative: 5 new offices opened in 4 non-Euronext
countries (Germany, Spain, Switzerland and Italy)
─ Adding value to investors: ─ Euronext Synapse MTF: Platform launched in December 2017 in Europe ─ Launch of 2 new Morningstar indices, the Morningstar Eurozone 50 Index and the
Morningstar Developed Markets Europe 100 Index and launch of futures
1) Euronext swapped its 2.3% stake in LCH Group for 11.1% of LCH SA. The transaction generated a non-cash gross capital gain of €40.6m in 2017
2) Excluding cash 3) On a debt-free cash-free basis and excluding existing regulatory capital requirements
Overview Agility for Growth
Capital & Governance
Expansion 2017 results
25

Euronext Investor Toolbox
EURONEXT GENERATED A STRONG OPERATIONAL PERFORMANCE IN 2017
‒ Improved cash market share at 64.4% ‒ Strong growth in listing revenue ‒ First revenue from Agility For Growth initiatives and FastMatch
‒ Strong operating performance: EBITDA up 4.9%, +€14m, to €297.8m
‒ Continued costs discipline, despite ramp up of acquisitions, MIFID II and Optiq projects costs
‒ Net income at €241.3m, benefitting from good operating performance, capital gain related to LCH SA swap2) and exceptional items
‒ Adjusted EPS up +4.8% at €3.09
Continued value creation for shareholders, with a proposed dividend3) up 21.8% (+31cts / share)
1) Unless stated otherwise, % compare Full Year 2017 data to Full Year 2016 data 2) Euronext swapped its 2.3% stake in LCH Group for 11.1% of LCH SA. The transaction generated a non-cash gross
capital gain of €40.6m in 2017 3) Subject to the approval of the AGM on 15 May 2018
55.9% EBITDA margin
+€36m
revenue growth
+22.4% reported EPS
€1.73 2017 dividend3)
Strong increase in revenue +7.2%1) at €532.3m
Robust EBITDA margin
Significant increase in reported EPS to €3.47
Overview Agility for Growth
Capital & Governance
Expansion 2017 results
26

Euronext Investor Toolbox
2017 REVENUE UP 7.2% TO €532.3M KEY DRIVERS: VOLUMES GROWTH AND ACQUISITIONS
1) Volume-related businesses include IPO revenue, cash, derivatives and Spot FX trading and clearing revenues. Follow-ons, bonds and other listing revenues are considered as non-volume related due to their lower volatility
2) Include other income of €0.4m in 2017 and €0.6m in 2016 3) Non-volume related businesses revenue divided by operating costs (excluding D&A)
Revenue In €m
2)
Market Solutions & Other revenue
190.3
84.2
2016
496.4
33.6 19.6
+7.2%
FX Spot trading
48.0
Market Data & Indices
Custody & Settlement
180.7
68.7
33.8
Listing
Clearing
2017
Derivatives trading
Cash trading
532.3
20.6
51.1
7.2 40.3
105.7 104.7
40.1
+22.6%
+5.3%
+0.6%
+6.5%
+4.7%
+0.8%
-1.0%
Vol Related1)
56% 56%
2017 revenue up 7.2% to €532.3m (+€35.9m)
Positive impact from Corporate Services (€9.1m revenue) due to the acquisition of iBabs in July 2017 and Company Webcast in February 2017
Improved cash trading volumes (+6.7% ADV) and market share (64.4%) translated into revenue growth of +€9.5m
Diversification in spot FX trading revenue (+€7.2m) with FastMatch acquisition in August 2017
Robustness of Market Data revenue (-€1.0m), with organic performance intact offset by lower contractual audit findings compared to last year
Operating cost coverage ratio3) at 100% in 2017
Overview Agility for Growth
Capital & Governance
Expansion 2017 results
27

Euronext Investor Toolbox
LISTING REVENUE UP 22.6% TO €84.2M STRONG REVENUE SUPPORTED BY FOLLOW-ONS AND POSITIVE IMPACT OF CORPORATE SERVICES
Money raised2)
Growing primary market activity
26 new listings
Continued trend of large capitalisations returning to Euronext’s markets such as ALD and Volkerwessels
Strong secondary market activity
Follow-on revenue up +9.1% reflecting the growing use of equity financing through the year
Strong dynamism of SMEs with 531 deals
Dynamic bond market, revenue up +38.0%
Successful launch of the European Tech SME initiative and confirmed interests from Tech companies and investors
Increased commercial intensity of the Corporate Services offering and fine-tuning of the value proposition following the acquisitions to complement the suite
# of listings
In €bn
1) ‘Corporate Services’ revenue previously reported as part of ‘Other’ 2) Total money raised figures revised as from January 2017. Corporate bonds figures revised as from January 2017 to
exclude Euronext listed financials issuers and to regroup them in a broader newly created financial bonds category. Total money raised also now includes Public/Semi-Public bonds category not reported before, created as from January 2017
Listing revenue1)
In €m
+9.4%
+9.1%
-3.7%
+12.1%
+38%
28 26
Follow ons
Annual fees
2017
84.2
6.8 6.4
7.8
21.5
32.6
2016
68.7
4.9 5.7
8.1
19.7
29.8
+22.6%
Bond fees
Other
IPOs
0.5 9.1
+6.5%
SMEs
Large Caps
2017
323.9
8.1
315.8
2016
304.1
10.2
293.9
Corporate services
Overview Agility for Growth
Capital & Governance
Expansion 2017 results
28

Euronext Investor Toolbox
CASH TRADING REVENUE UP 5.3% TO €190.3M STRENGTHENED MARKET SHARE AT 64.4% AND GROWTH IN VOLUMES
Average daily turnover
Improved cash market share at 64.4%, to its strongest yearly level since IPO, supported by:
the continued optimisation of the SLP programme,
the innovative Omega pack for non members
and the Best of Book service for retail flows
Robust yield at 0.50bps, stable compared to 2016
80% present at EBBO in December 2017, with deepest market depth
Significant achievements in key Core Business projects: Launch of Euronext Fund services Launch of Euronext Block, the new block trading
service for equities, and first trades executed on the platform
Launch of Euronext Synapse for Europe in Dec.17
74 new ETF products listed over 2017, bringing the total numbers of ETFs to 804, and declining ETF trading due to low volatility
Revenue per trade Cash trading
Market share for 2017
In €m, single counted
In bps, single counted
64.4%
Vs. 61.0% in 2016
Market share for Q4 2017 at 67.1%
554
473
ETF
Structured Products
Bonds
2017
7,478
6,939
40 26
2016
7,012
6,395
37 26
+6.7%
Equities
-0.5%
2017
0.50
2016
0.50
Overview Agility for Growth
Capital & Governance
Expansion 2017 results
29

Euronext Investor Toolbox
IMPROVED POSITIONING IN DERIVATIVES TRADING AND FIRST REVENUE FROM SPOT FX TRADING
Average daily volume Revenue per lot
Increasing trading activity in financial derivatives, despite a low volatility environment
Improvement of Dutch options volumes following TOM wind down since Q2 2017
Recovery in commodities with an improved competitive landscape from H2 2017:
Success of the New Market Participant programme with over 150 new traders joining Euronext market for the first time
2017 derivatives yield down YoY following TOM migration completion in June
Spot FX ADV up 44.7% to $18.4bn
Revenue from spot FX trading: €7.2m (for 4.6 months)
Successful launch of Consolidated Data Tape, and FastMatch proprietary market data first revenue booked in 2018
Derivatives trading
Spot FX trading Average daily volume
In ‘000 lots, single counted In €, double counted
In $bn, single counted
Revenue contribution
In €m
4.6 months revenue
contribution in 2017
172 164
222 275Equity options
Index futures
Commodities
Index options
2017
+12.0%
52 58
2016
54 42
550 491
2017
0.29 0.32
-9.4%
2016
18.4
2016
12.7
+44.7%
2017
7.2
2017
1) The planned non-recurring migration of open interest from TOM to Euronext over June 2017 took place at marginal rates due to the exceptional circumstances of the TOM closure
Overview Agility for Growth
Capital & Governance
Expansion 2017 results
30

Euronext Investor Toolbox
OTHER BUSINESSES ROBUST MARKET DATA PERFORMANCE DESPITE NEGATIVE BASE EFFECTS
Continued benefits from MiFID II projects and related work for commercial technology clients
Launch and first milestones of the Optiq® delivery projects for clients in the Middle East, North Africa and Brazil
Decrease in revenue due to negative base effect (large contractual audit findings in Q2 2016 and Q3 2016), while organic performance intact
New market data agreements to comply with MiFID II data disaggregation requirements in 2018
─ Launch of two indices with Morningstar (Morningstar Eurozone 50 IndexTM & Morningstar Developed markets Europe 100 IndexTM)
Clearing revenues benefited from stronger derivatives trading activity and higher treasury income
Numerous contracts signed for Euronext’s APA/ARM services live since December 2017
Revenue growth in Interbolsa driven by an increase of settlement, public debt and equities under custody
Market Data and Indices In €m
Market solutions & Others In €m
Post trade In €m
-1.0%
2017
104.7
2016
105.7
+1.4%
2017
33.5
2016
33.0
19.6 20.6
Clearing Custody & Settlement
+4.7%
+6.5%
48.0 51.1
2016
2017
31

Euronext Investor Toolbox
EBITDA UP 4.9% TO €297.8M ROBUST EBITDA MARGIN AT 55.9%
297.8
+€13.9m
EBITDA 2016
283.9
EBITDA 2017 Other
-3.3
Clearing expenses
-1.6
Professional Services
-7.2
Systems and Comms.
-5.3
Staff expenses
-4.6
Revenue 2017
35.9
€10.9m of costs savings achieved since 1 April 2016, slightly down compared to 2016 (€15.6M) due to IT and regulation projects
Core business costs reduction expected to start in H2 2018
Agility for Growth initiatives: €9.8m of revenue and €11.0m of costs, with well-established initiatives funding earlier stage ones
In €m
55.9%
57.2% EBITDA margin
Mainly acquisitions’ staff impact
Projects costs (MIFID II, Optiq,
Acquisitions)
Overview Agility for Growth
Capital & Governance
Expansion 2017 results
32

Euronext Investor Toolbox
2017 NET INCOME DRIVEN BY GOOD OPERATING PERFORMANCE, CAPITAL GAINS AND EXCEPTIONAL ITEMS
In €m
2.7
Capital gains or losses
(LCH SA)
40.6
Exceptional items
-14.8
Intangible assets adj. related to
acquisitions (PPA)
2016 Exceptional
items
10.0
Net Income
2016
197.0
-4.5
Adj. EPS +4.8%
EBITDA Other items
13.9
Net Income
Adj. 2016
215.2
205.2
Adj. In tax Net Income
Adjusted 2017
D&A
-1.9
241.3
+22.5%
Net income
Adj 2017
-2.4
Adj. In tax
0.6
Incl. Non-recurring tax release for
€20.4m in 2017 and €16.3m in
2016
Incl. FastMatch and iBabs
PPA
Incl. €5m of ICE break-up fee
33
Overview Agility for Growth
Capital & Governance
Expansion 2017 results

Capital and Governance

Euronext Investor Toolbox
EURONEXT SHARE AND CAPITAL STRUCTURE
Shareholding structure (Ref Shareholders Locked up until June 2019) Reference Shareholders
Market Capitalization as of 29/03//18 €4.2bn Bloomberg / Reuters: ENX:FP / ENX.PA Indices presence: SBF120, NEXT 150, CAC MID 60
% ownership
Euroclear Plc 8.00%
BNP Paribas SA 2.22%
SFPI-FPIM 4.50%
Bpifrance Participations SA 3.00%
Caisse Des Dépôts & Consignations 3.00%
Société Générale SA 1.50%
ABN AMRO Bank NV 1.64%
Total reference shareholders 23.86%
€59,4 +203%
+17%
Share price
Overview Agility for Growth
Capital & Governance
Expansion 2017 results
Price at IPO €20.00
Reference Shareholders
23.86%
Treasury shares 0.59%
Employees 0.22%
Free Float 75.33%
35
0
10
20
30
40
50
60
70
20
/06
/20
14
20
/07
/20
14
20
/08
/20
14
20
/09
/20
14
20
/10
/20
14
20
/11
/20
14
20
/12
/20
14
20
/01
/20
15
20
/02
/20
15
20
/03
/20
15
20
/04
/20
15
20
/05
/20
15
20
/06
/20
15
20
/07
/20
15
20
/08
/20
15
20
/09
/20
15
20
/10
/20
15
20
/11
/20
15
20
/12
/20
15
20
/01
/20
16
20
/02
/20
16
20
/03
/20
16
20
/04
/20
16
20
/05
/20
16
20
/06
/20
16
20
/07
/20
16
20
/08
/20
16
20
/09
/20
16
20
/10
/20
16
20
/11
/20
16
20
/12
/20
16
20
/01
/20
17
20
/02
/20
17
20
/03
/20
17
20
/04
/20
17
20
/05
/20
17
20
/06
/20
17
20
/07
/20
17
20
/08
/20
17
20
/09
/20
17
20
/10
/20
17
20
/11
/20
17
20
/12
/20
17
20
/01
/20
18
20
/02
/20
18
20
/03
/20
18
ENX SBF 120 rebased

Euronext Investor Toolbox
EXPERIENCED MANAGEMENT TEAM
Paulo Rodrigues Da Silva CEO Euronext Lisbon, CEO Interbolsa Head of Market Solutions
Stéphane Boujnah Group Chief Executive Officer
Maurice van Tilburg CEO Euronext Amsterdam, Head of Market Operations
Anthony Attia CEO Euronext Paris, Head of Global Listing
Vincent Van Dessel CEO Euronext Brussels
Giorgio Modica Chief Financial Officer
Amaury Houdart Chief Talent Officer
SUPERVISORY BOARD 9 seats o/w 3 appointed by Reference Shareholders
MANAGING BOARD
Catherine Langlais General Counsel
Alain Courbebaisse Chief Information & Technology Officer
Overview Agility for Growth
Capital & Governance
Expansion 2017 results
1) In January 2018, Euronext announced the departure of Lee Hodgkinson in April 2018 2) Subject to shareholder and regulatory approval 36
(Pending appointment)1)
CEO Euronext London, Head of Markets and Global Sales
Deirdre Somers2)
CEO Euronext Dublin, Head of Debt and funds listings and ETF

Euronext Investor Toolbox
Euronext Group N.V.
College of Regulators (COR)
REGULATION GOVERNANCE: A FEDERAL MODEL
Euronext Paris
Euronext Amsterdam
Euronext Brussels
Euronext Lisbon
Euronext London
Local Regulator AFM
Local Regulator FSMA
Local Regulator CMVM
Local Regulator AMF
One Holding Company (Euronext Group N.V.), with separate legal entities in each of the jurisdictions, having a national licence to operate markets
Objectives of the MoU between the Euronext Regulators (updated MoU, June 2015)
Co-ordinated supervision of the Euronext group
Co-ordination with regard to approval of rules and regulations (dedicated working groups, Steering and Chairmen committees)
Co-operation between Regulators enhances harmonization in the context of the E.U. directives implementation
In addition, in the continental jurisdictions, also supervisory role and powers of the Ministries of Finance
Local Regulator FCA
Overview Agility for Growth
Capital & Governance
Expansion 2017 results
37

Euronext Investor Toolbox
Appendix
38

Euronext Investor Toolbox
CASH AND DERIVATIVES TRADING PERFORMANCE
Cash trading
ADV (in €m)
2015 2016 2017
+6.7%
2017 2016
7,478
-15.3%
7,012
2015
8,282
Yield
Market Share
63.6% 60.9%
2015
64.4%
2017 2016
0.50 0.50
2016 2017
0.47
2015
Derivatives trading
ADV (in €m)
Yield
529
2015 2016
550
2017
+12.0% -7.2%
491
0.33
2016 2017
0.29 0.32
2015
Improved volumes:
Best of Book Non-member Omega
pack Optimisation of the SLP
programme
Efficient yield management
Market share > 60% on equity
Improved competitive landscape
39

Euronext Investor Toolbox
CASH – MARKET QUALITY AND SHARE
Market share
Market quality
2017 market share: 64.4%
20%
40%
60%
80%
Jan-14 Jul-14 Jan-15 Jul-15 Jan-16 Jul-16 Jan-17 Jul-17
EURONEXT MTF
Blue Chips Presence time at EBBO (%) EBBO with greatest size (%) EBBO setter (%) Relative spread (bps) Displayed market depth (€)
(31 December 2017) Euronext
80% 43% 65% 3.72 58,289 BATS Europe
34% 0% 3% 8.01 14,620 Chi-X
55% 2% 10% 6.29 18,375 Equiduct
2% 0% 0% 61.8 23,984 Turquoise
41% 0% 5% 7.3 16,737
40

Euronext Investor Toolbox
FINANCIAL PERFORMANCE SINCE IPO
2017 figures are unaudited and include 4.6 months of consolidated spot FX trading revenue 2014 Total revenue and other income do not include ICE transitional revenue for an amount of €34m Dividend for 2017 subject to the approval of the next General Meeting of Shareholders
41.7% 54.7% 57.2%
Reported earnings and dividend per share
EBITDA (in €m, based on 3rd party revenue)
Revenue (in €m, 3rd party revenue only) in €m 2014 2015 2016 2017 2016/17 Var
Listing 61.7 70.5 68.7 84.2 22.6%
Trading revenue 212.0 241.7 220.8 237.9 7.7%
of which Cash trading 165.6 197.2 180.7 190.3 5.3%
of which Derivatives trading 46.4 44.5 40.1 40.3 0.6%
of which Spot FX trading - - - 7.2 n/a
Market data & indices 93.3 99.8 105.7 104.7 -1.0%
Post-trade 57.3 71.7 67.6 71.7 6.0%
Market solutions & other revenue 33.4 34.1 33.0 33.5 1.4%
Other income 0.6 0.7 0.6 0.4 -36.2%
Total revenue and other income 458.5 518.5 496.4 532.3 7.2%
Operational expenses (267.1) (234.7) (212.5) (234.5) 10.3%
EBITDA 191.4 283.8 283.9 297.8 4.9%
EBITDA margin 41.7% 54.7% 57.2% 55.9% +121 bps
Depreciation and amortisation (16.6) (17.1) (15.1) (16.9) 12.2%
Operating profit before exceptional items 208.8 266.8 268.8 280.8 4.5%
Exceptional items (44.6) (28.7) (10.0) (14.8) 47.3%
Other items (1.9) 0.5 5.2 45.0 -33.9%
Profit before income tax 162.3 238.6 264.0 311.1 17.8%
Income tax expense (44.1) (65.9) (67.0) (68.9) 2.9%
Minority interests - - - (0.9) n/a
Profit for the year 118.2 172.7 197.0 241.3 22.5%
458
2014 2015
496
2017
532 519
2016
2017 2014
298 284
2015
191
284
2016
55.9%
1.42 1.73
3.47
1.69
2017 2015
2.83
1.24
2016
2.47
0.84
2014
41

Euronext Investor Toolbox
BALANCE SHEET
Assets 2014 2015 2016 2017
Goodwill and other intangible assets 321.3 321.4 321.2 515.1
Other non-current assets 151.0 163.2 172.6 266.2
Total non-current assets 472.2 484.6 493.8 781.4
Other current assets 143.2 106.7 89.2 96.4
Cash and cash equivalents 241.6 158.6 174.5 187.8
Total current assets 384.8 265.3 263.7 284.2
Total assets 857.1 749.9 757.5 1,065.6
Equity and liabilities
Total equity 341.8 447.2 548.0 729.5
Borrowings 248.4 108.2 69.0 164.7
Other non-current liabilities 49.3 15.8 20.3 46.6
Total non-current liabilities 297.7 124.0 89.3 211.3
Total current liabilities 217.6 178.7 120.2 124.8
Total equity and liabilities 857.1 749.9 757.5 1,065.6
Dividend paid (with regards to fiscal year, in €m)
Cash and cash equivalents (in €m)
Total equity (in €m)
Total debt (in €m)
729
548447
342
2015 2014 2016 2017
165
69108
248
2014 2015 2016 2017
2017
121
2016
99
2015
86
2014
59
242
2017
188
2016
175
2015
159
2014
42

Euronext Investor Toolbox
ADJUSTED EPS DEFINITION
In €m unless stated otherwise 2017 2016
Net Income Reported 241.3 197.0
EPS Reported (€ per share) 3.47 2.83
Intangible assets adj. related to acquisitions (PPA) - 2.4 -
Exceptional items - 14.8 - 10.0
Capital gains or losses (LCH SA swap) 40.6 -
Tax related to those items 2.7 1.9
Adjusted for intangible assets related to acquisitions, capital gains or losses
and exceptional items, incl. tax
Adj. Net Income 215.2 205.2
Adj. EPS (€ per share) 3.09 2.95
43

Euronext Investor Toolbox
DISCLAIMER AND CONTACTS
This presentation is for information purposes only and is not a recommendation to engage in investment activities. The information and materials contained in this presentation are provided ‘as is’ and Euronext does not warrant as to the accuracy, adequacy or completeness of the information and materials and expressly disclaims liability for any errors or omissions. This presentation contains materials (including videos) produced by third parties and this content has been created solely by such third parties with no creative input from Euronext. It is not intended to be, and shall not constitute in any way a binding or legal agreement, or impose any legal obligation on Euronext. All proprietary rights and interest in or connected with this publication shall vest in Euronext. No part of it may be redistributed or reproduced without the prior written permission of Euronext. This presentation may include forward-looking statements, which are based on Euronext’s current expectations and projections about future events. By their nature, forward-looking statements involve known and unknown risks, uncertainties, assumptions and other factors because they relate to events and depend on circumstances that will occur in the future whether or not outside the control of Euronext. Such factors may cause actual results, performance or developments to differ materially from those expressed or implied by such forward-looking statements. Accordingly, no undue reliance should be placed on any forward-looking statements. Forward-looking statements speak only as at the date at which they are made. Euronext expressly disclaims any obligation or undertaking to update, review or revise any forward-looking statements contained in this presentation to reflect any change in its expectations or any change in events, conditions or circumstances on which such statements are based unless required to do so by applicable law. Financial objectives are internal objectives of the Company to measure its operational performance and should not be read as indicating that the Company is targeting such metrics for any particular fiscal year. The Company’s ability to achieve these financial objectives is inherently subject to significant business, economic and competitive uncertainties and contingencies, many of which are beyond the Company’s control, and upon assumptions with respect to future business decisions that are subject to change. As a result, the Company’s actual results may vary from these financial objectives, and those variations may be material. Efficiencies are net, before tax and on a run-rate basis, ie taking into account the full-year impact of any measure to be undertaken before the end of the period mentioned. The expected operating efficiencies and cost savings were prepared on the basis of a number of assumptions, projections and estimates, many of which depend on factors that are beyond the Company’s control. These assumptions, projections and estimates are inherently subject to significant uncertainties and actual results may differ, perhaps materially, from those projected. The Company cannot provide any assurance that these assumptions are correct and that these projections and estimates will reflect the Company's actual results of operations Euronext refers to Euronext N.V. and its affiliates. Information regarding trademarks and intellectual property rights of Euronext is located at https://www.euronext.com/terms-use. © 2018, Euronext N.V. - All rights reserved.
Website: www.euronext.com/en/investors Contact: Aurélie Cohen, Euronext Head of Investor Relations - [email protected] - +33 1 70 48 24 17
44