Embed Size (px)
Citation preview

EURONEXT INVESTOR ESG -TOOLBOX
│ 2
7 local markets
France, Belgium, the Netherlands, Ireland, Portugal, Norway, UK
€679 million
Revenue in 2019
Optiq®
State-of-the-art proprietary trading
platform
€1.3 trillion
Total money raised on Euronext markets
over 2019
17 countries
Including technology centres, sales office,
matching engines
58.8%
EBITDA margin in 2019
Single-order book
Single gateway to the largest liquidity pool
in Europe
€7.8 billion
Average daily traded volume on Euronext cash markets in 2019
+1,000
Employees across the world
€5.6 billion
Market capitalization as of February 2020
Let’s grow together2022
Euronext new strategic plan for 2019-2022
Best in class regulationcompliance
Collegial supervision with a College of
Regulators
EURONEXT AT A GLANCE
│ 3
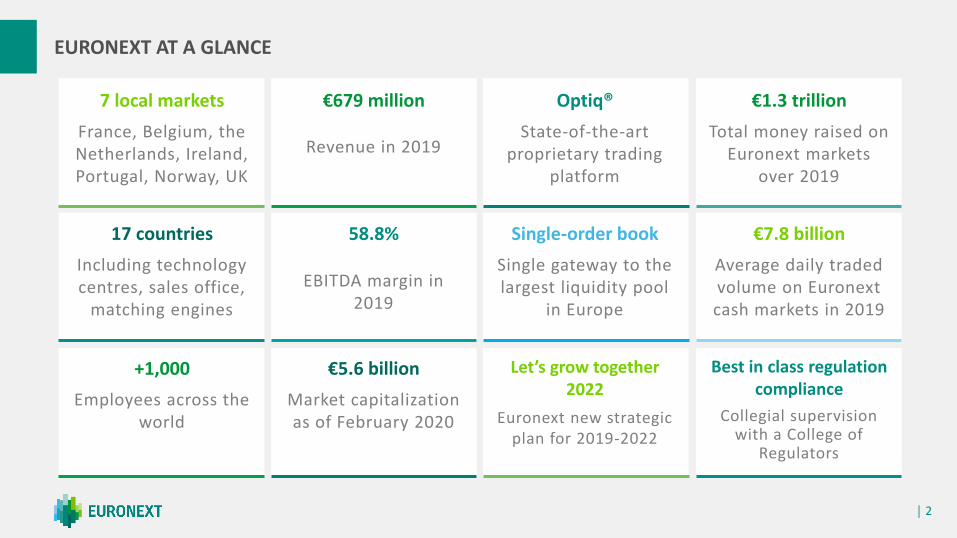
EURONEXT’S DEVELOPMENT SINCE 2000
RENEWAL OF CLEARING AGREEMENT AND 11.1% of LCH SA
CARVE-OUTCREATION OF “NEW EURONEXT”
03/2014
06/2014IPO
LAUNCH OF “AGILITY FOR GROWTH”
05/2016
DISPOSAL OF LIFFE
03/20142018
ACQUISITION OF THE IRISH STOCK EXCHANGE
2017
ACQUISITION OFOSLO BØRS VPS
2019
LAUNCH OF “LET’S GROW TOGETHER 2022”
10/2019
▪ 2000 – Merger of Amsterdam, Brussels and Paris exchanges
▪ 2001 – IPO
▪ 2002 – Acquisition of Liffe, acquisition of Lisbon exchange
▪ 2003 – Disposal of Clearnet
▪ 2007 – Merger with NYSE Group
▪ 2013 – Acquisition by ICE
│ 4│ 1) Indirect users│ 2) Spot FX trading on EuronextFX trading platform│ 3) Power trading on Nord Pool platform, consolidated from 15 January 2020
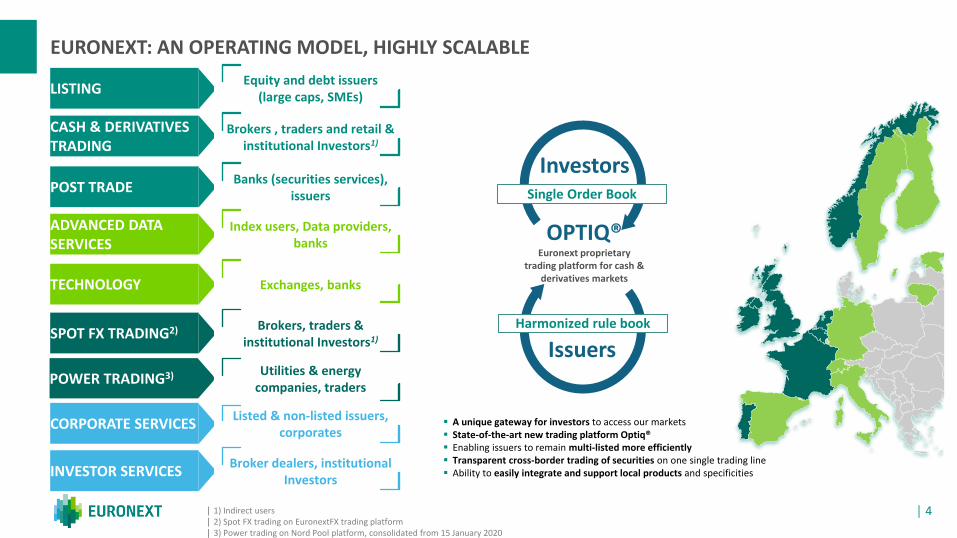
EURONEXT: AN OPERATING MODEL, HIGHLY SCALABLE
LISTING
CASH & DERIVATIVES TRADING
ADVANCED DATA SERVICES
Equity and debt issuers (large caps, SMEs)
Brokers , traders and retail & institutional Investors1)
Index users, Data providers, banks
TECHNOLOGY Exchanges, banks
POST TRADEBanks (securities services),
issuers
SPOT FX TRADING2) Brokers, traders & institutional Investors1)
CORPORATE SERVICESListed & non-listed issuers,
corporates
INVESTOR SERVICESBroker dealers, institutional
Investors
OPTIQ®Euronext proprietary
trading platform for cash & derivatives markets
Investors
Issuers
Single Order Book
Harmonized rule book
▪ A unique gateway for investors to access our markets▪ State-of-the-art new trading platform Optiq®▪ Enabling issuers to remain multi-listed more efficiently▪ Transparent cross-border trading of securities on one single trading line▪ Ability to easily integrate and support local products and specificities
POWER TRADING3) Utilities & energy companies, traders
│ 5
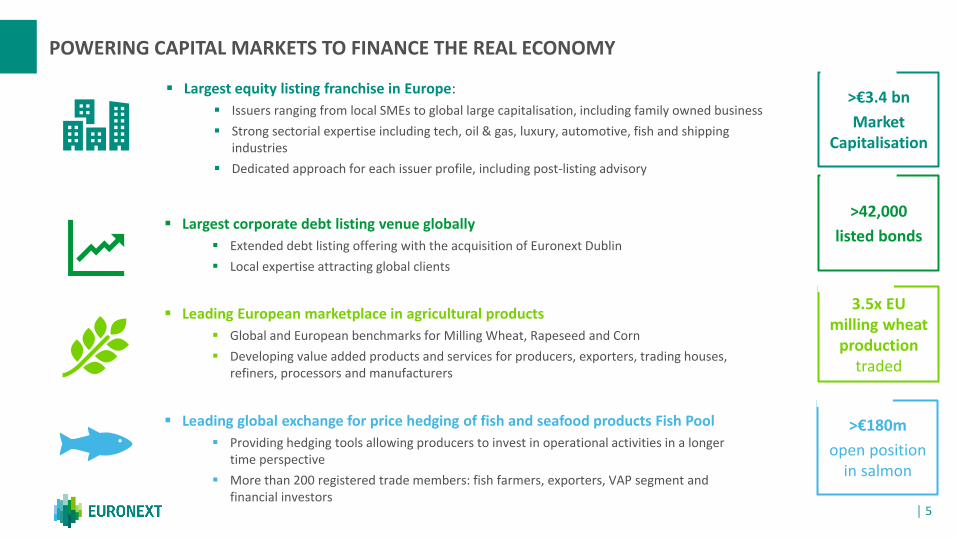
POWERING CAPITAL MARKETS TO FINANCE THE REAL ECONOMY
▪ Largest equity listing franchise in Europe:
▪ Issuers ranging from local SMEs to global large capitalisation, including family owned business
▪ Strong sectorial expertise including tech, oil & gas, luxury, automotive, fish and shipping industries
▪ Dedicated approach for each issuer profile, including post-listing advisory
▪ Leading European marketplace in agricultural products
▪ Global and European benchmarks for Milling Wheat, Rapeseed and Corn
▪ Developing value added products and services for producers, exporters, trading houses, refiners, processors and manufacturers
▪ Largest corporate debt listing venue globally
▪ Extended debt listing offering with the acquisition of Euronext Dublin
▪ Local expertise attracting global clients
▪ Leading global exchange for price hedging of fish and seafood products Fish Pool
▪ Providing hedging tools allowing producers to invest in operational activities in a longer time perspective
▪ More than 200 registered trade members: fish farmers, exporters, VAP segment and financial investors
>€3.4 bn
Market Capitalisation
>42,000
listed bonds
3.5x EU milling wheat
production traded
>€180m
open position in salmon
│ 6│ 2018 pro forma revenue and EBITDA rebased for the adoption of IFRS 16, including 2018 FY Commcise, Oslo Bors VPS and Euronext Dublin, with an average EUR/NOK at 9.5975 over 2018│ 2019 revenue include 6.5 months of consolidation of Oslo Bors VPS│ 2019 dividend to be approved at May 2020 Annual General Meeting
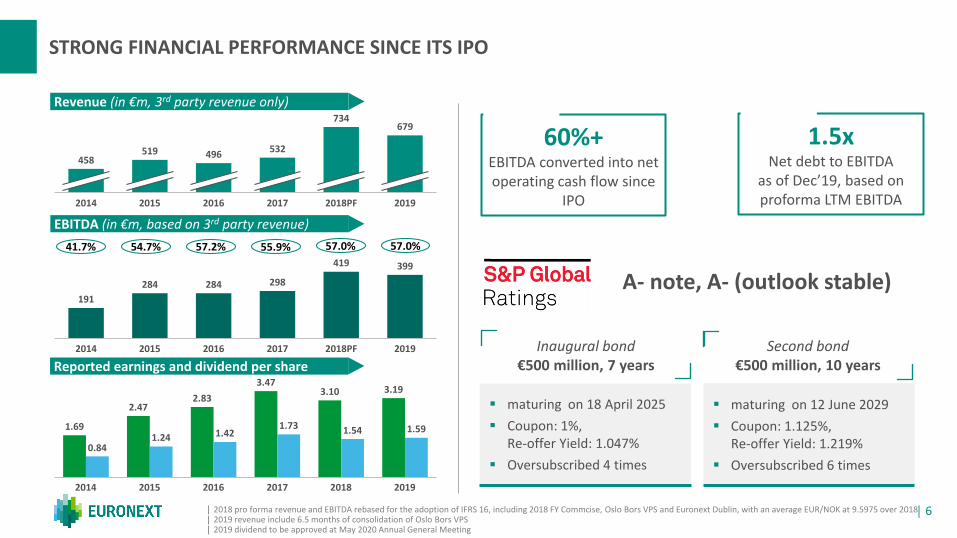
STRONG FINANCIAL PERFORMANCE SINCE ITS IPO
41.7% 54.7% 57.2%
Reported earnings and dividend per share
EBITDA (in €m, based on 3rd party revenue)
Revenue (in €m, 3rd party revenue only)
679
458532
20192014 2015 2016 2017 2018PF
519
734
496
191
284 284 298
419 399
20162014 2018PF2015 20192017
55.9%
1.69
2.472.83
3.473.10 3.19
0.841.24 1.42
1.73 1.54 1.59
2014 20162015 2017 20192018
57.0%
▪ maturing on 18 April 2025
▪ Coupon: 1%, Re-offer Yield: 1.047%
▪ Oversubscribed 4 times
Inaugural bond€500 million, 7 years
Second bond€500 million, 10 years
A- note, A- (outlook stable)
▪ maturing on 12 June 2029
▪ Coupon: 1.125%, Re-offer Yield: 1.219%
▪ Oversubscribed 6 times
60%+EBITDA converted into net operating cash flow since
IPO
1.5xNet debt to EBITDA
as of Dec’19, based on proforma LTM EBITDA
57.0%
│ 7
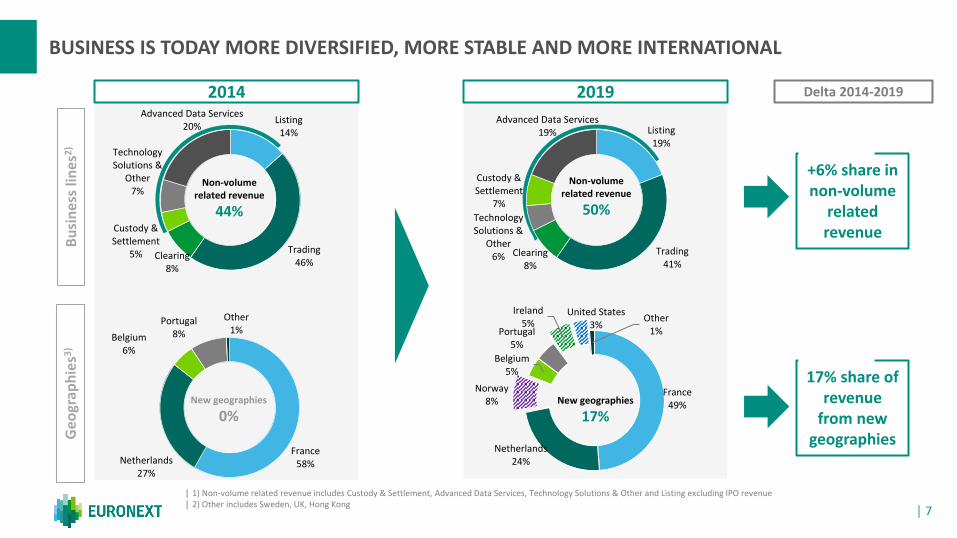
BUSINESS IS TODAY MORE DIVERSIFIED, MORE STABLE AND MORE INTERNATIONAL
France58%Netherlands
27%
Belgium6%
Portugal8%
Other1%
2014 2019
│ 1) Non-volume related revenue includes Custody & Settlement, Advanced Data Services, Technology Solutions & Other and Listing excluding IPO revenue│ 2) Other includes Sweden, UK, Hong Kong
Non-volume related revenue
44%
Non-volume related revenue
50%
Bu
sin
ess
lin
es2
)G
eo
grap
hie
s3)
Listing14%
Trading46%
Clearing8%
Custody & Settlement
5%
Technology Solutions &
Other7%
Advanced Data Services20% Listing
19%
Trading41%
Clearing8%
Technology Solutions &
Other6%
Custody & Settlement
7%
Advanced Data Services19%
+6% share in non-volume
related revenue
17% share of revenue
from new geographies
New geographies
17%New geographies
0%
Delta 2014-2019
France49%
Netherlands24%
Norway8%
Belgium5%
Portugal5%
Ireland5%
United States3%
Other1%

‘LET’S GROW TOGETHER 2022’ EURONEXT STRATEGIC PLAN
│ 8
│ 9
Paris
Porto
Lisbon
Dublin
London*
MunichZurich
Amsterdam
Brussels
Milan
Madrid
Stockholm
Oslo
│ Euronext London is recognised as a Recognised Investment Exchange (RIE) by the Financial Conduct Authority (FCA)
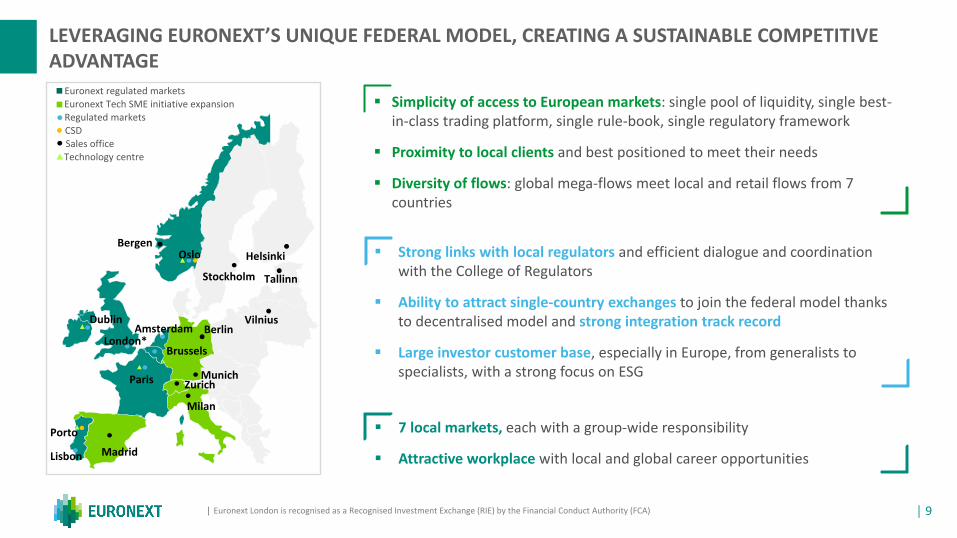
LEVERAGING EURONEXT’S UNIQUE FEDERAL MODEL, CREATING A SUSTAINABLE COMPETITIVE ADVANTAGE
▪ Strong links with local regulators and efficient dialogue and coordination with the College of Regulators
▪ Ability to attract single-country exchanges to join the federal model thanks to decentralised model and strong integration track record
▪ Large investor customer base, especially in Europe, from generalists to specialists, with a strong focus on ESG
▪ Simplicity of access to European markets: single pool of liquidity, single best-in-class trading platform, single rule-book, single regulatory framework
▪ Proximity to local clients and best positioned to meet their needs
▪ Diversity of flows: global mega-flows meet local and retail flows from 7 countries
▪ 7 local markets, each with a group-wide responsibility
▪ Attractive workplace with local and global career opportunities
Euronext regulated marketsEuronext Tech SME initiative expansionRegulated markets
Technology centreSales officeCSD
HelsinkiBergen
Vilnius
Tallinn
Berlin
│ 10
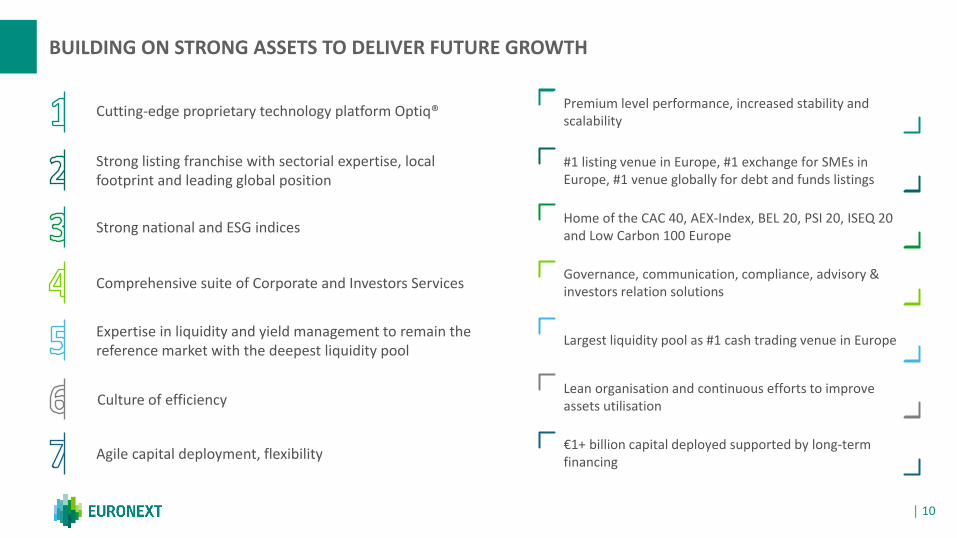
BUILDING ON STRONG ASSETS TO DELIVER FUTURE GROWTH
Strong listing franchise with sectorial expertise, local footprint and leading global position
Strong national and ESG indices
Comprehensive suite of Corporate and Investors Services
Cutting-edge proprietary technology platform Optiq®
Expertise in liquidity and yield management to remain the reference market with the deepest liquidity pool
Culture of efficiency
Agile capital deployment, flexibility
Premium level performance, increased stability and scalability
#1 listing venue in Europe, #1 exchange for SMEs in Europe, #1 venue globally for debt and funds listings
Home of the CAC 40, AEX-Index, BEL 20, PSI 20, ISEQ 20 and Low Carbon 100 Europe
Governance, communication, compliance, advisory & investors relation solutions
Largest liquidity pool as #1 cash trading venue in Europe
Lean organisation and continuous efforts to improve assets utilisation
€1+ billion capital deployed supported by long-term financing
│ 11
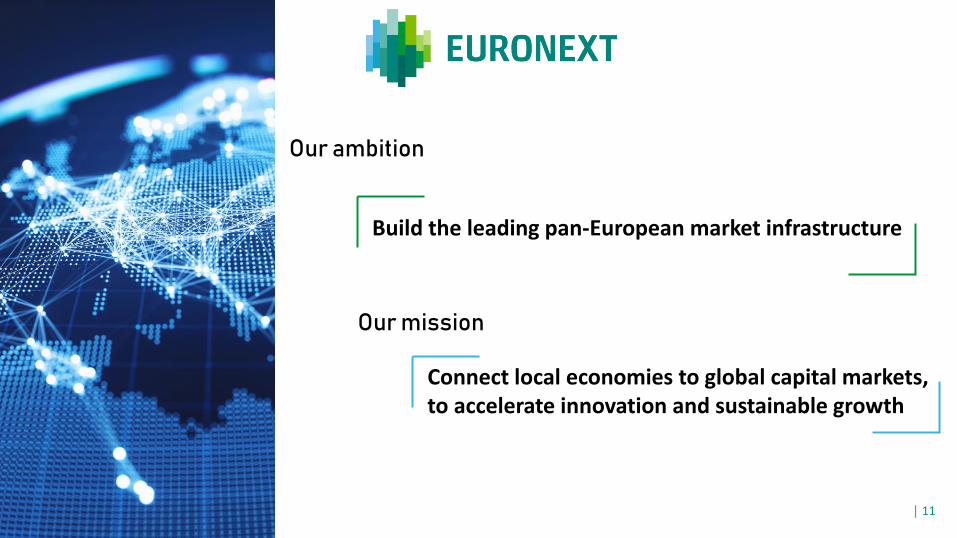
Connect local economies to global capital markets, to accelerate innovation and sustainable growth
Build the leading pan-European market infrastructure
Our ambition
Our mission
│ 12
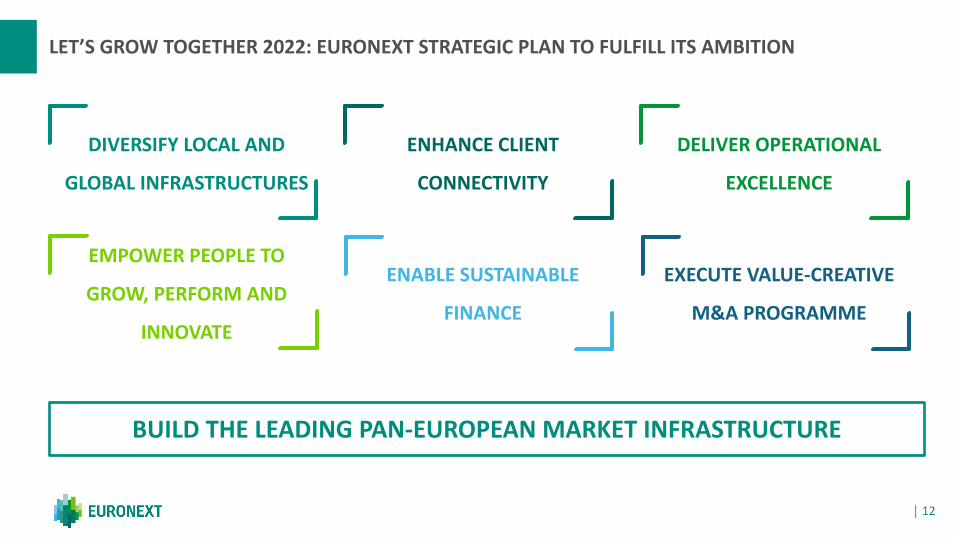
LET’S GROW TOGETHER 2022: EURONEXT STRATEGIC PLAN TO FULFILL ITS AMBITION
ENABLE SUSTAINABLE
FINANCE
DIVERSIFY LOCAL AND
GLOBAL INFRASTRUCTURES
DELIVER OPERATIONAL
EXCELLENCE
EMPOWER PEOPLE TO
GROW, PERFORM AND
INNOVATE
EXECUTE VALUE-CREATIVE
M&A PROGRAMME
ENHANCE CLIENT
CONNECTIVITY
BUILD THE LEADING PAN-EUROPEAN MARKET INFRASTRUCTURE
│ 13
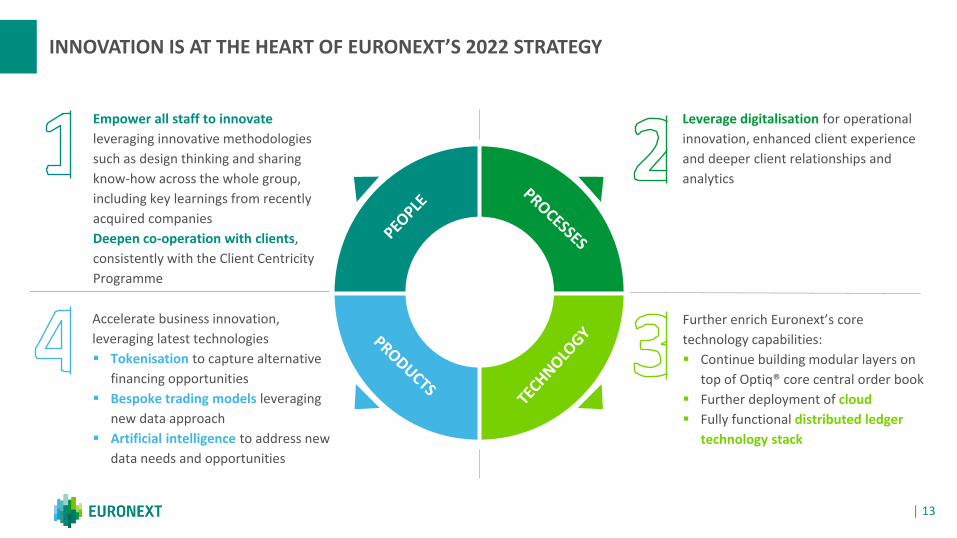
INNOVATION IS AT THE HEART OF EURONEXT’S 2022 STRATEGY
Accelerate business innovation,
leveraging latest technologies
▪ Tokenisation to capture alternative
financing opportunities
▪ Bespoke trading models leveraging
new data approach
▪ Artificial intelligence to address new
data needs and opportunities
Further enrich Euronext’s core
technology capabilities:
▪ Continue building modular layers on
top of Optiq® core central order book
▪ Further deployment of cloud
▪ Fully functional distributed ledger
technology stack
Leverage digitalisation for operational
innovation, enhanced client experience
and deeper client relationships and
analytics
Empower all staff to innovate
leveraging innovative methodologies
such as design thinking and sharing
know-how across the whole group,
including key learnings from recently
acquired companies
Deepen co-operation with clients,
consistently with the Client Centricity
Programme
│ 14
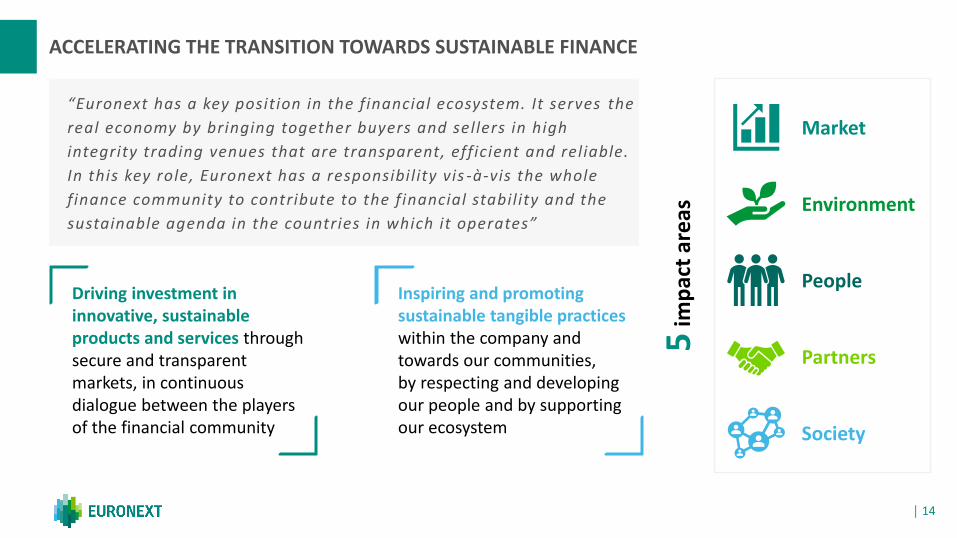
ACCELERATING THE TRANSITION TOWARDS SUSTAINABLE FINANCE
“Euronext has a key position in the financial ecosystem. It serves the
real economy by bringing together buyers and sellers in high
integrity trading venues that are transparent, efficient and reliable.
In this key role, Euronext has a responsibil ity vis -à-vis the whole
finance community to contribute to the financial stabil ity and the
sustainable agenda in the countries in which it operates”
Driving investment in innovative, sustainable products and services through secure and transparent markets, in continuous dialogue between the players of the financial community
Inspiring and promoting sustainable tangible practices within the company and towards our communities, by respecting and developing our people and by supporting our ecosystem
Environment
People
Society
Partners
Market
5im
pac
t ar
eas
│ 15
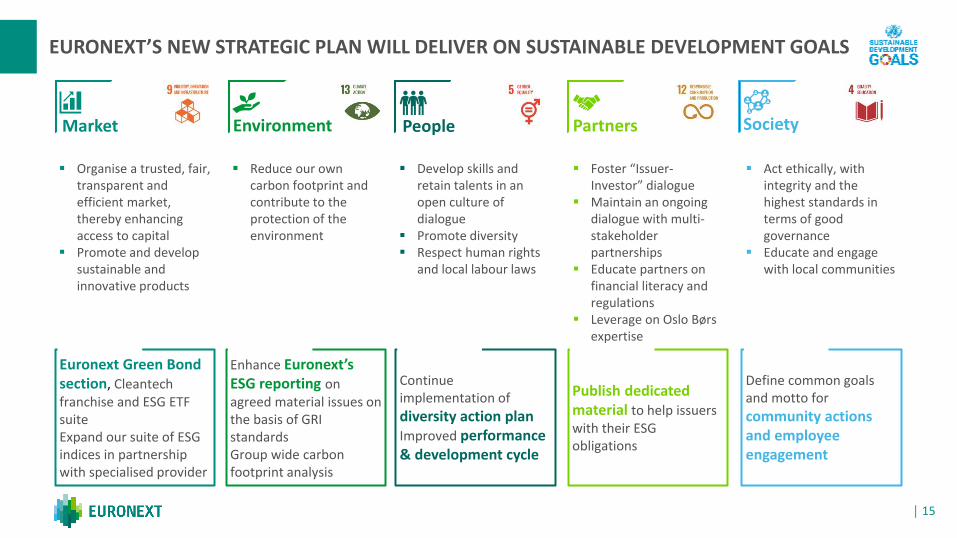
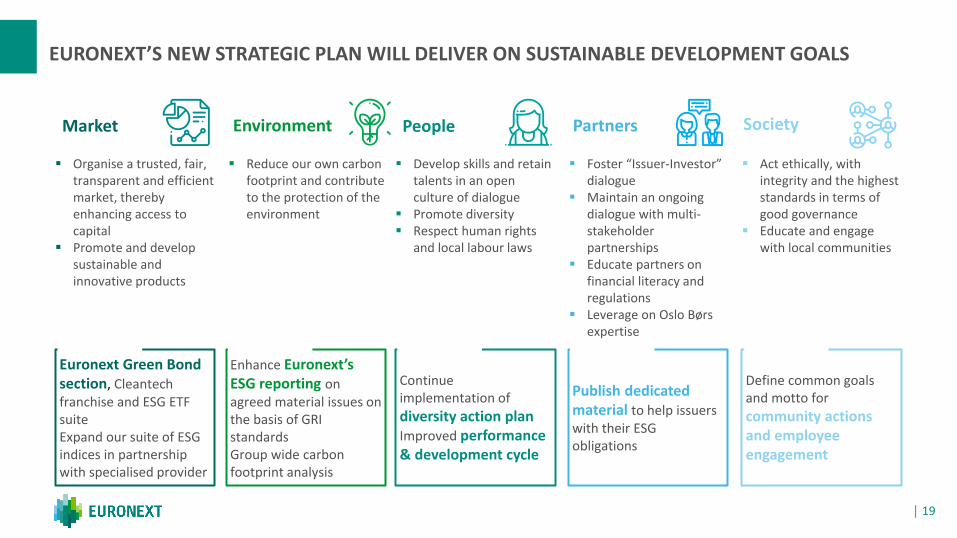
EURONEXT’S NEW STRATEGIC PLAN WILL DELIVER ON SUSTAINABLE DEVELOPMENT GOALS
Euronext Green Bond section, Cleantech franchise and ESG ETF suiteExpand our suite of ESG indices in partnership with specialised provider
Enhance Euronext’s ESG reporting on agreed material issues on the basis of GRI standardsGroup wide carbon footprint analysis
Continue implementation of
diversity action planImproved performance & development cycle
Publish dedicated material to help issuers with their ESG obligations
Define common goals and motto for
community actions and employee engagement
Environment People SocietyPartnersMarket
▪ Organise a trusted, fair, transparent and efficient market, thereby enhancing access to capital
▪ Promote and developsustainable and innovative products
▪ Reduce our owncarbon footprint and contribute to the protection of the environment
▪ Develop skills and retain talents in an open culture of dialogue
▪ Promote diversity▪ Respect human rights
and local labour laws
▪ Foster “Issuer-Investor” dialogue
▪ Maintain an ongoing dialogue with multi-stakeholder partnerships
▪ Educate partners on financial literacy and regulations
▪ Leverage on Oslo Børsexpertise
▪ Act ethically, with integrity and the highest standards in terms of good governance
▪ Educate and engage with local communities
│ 16│ Pro forma include full-year 2018 of Commcise, Euronext Dublin and Oslo Børs VPS│ 2018 pro forma EBITDA margin rebased for the adoption of IFRS 16
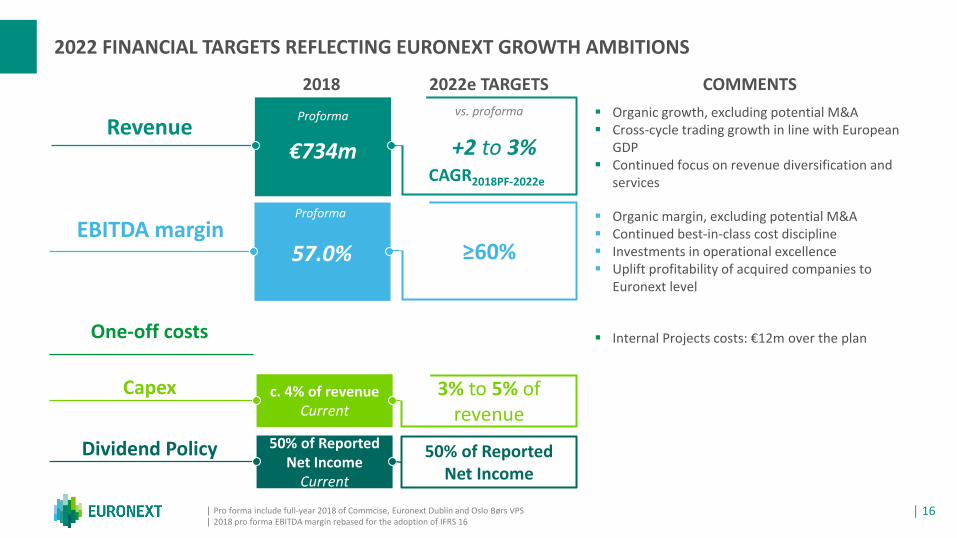
2022 FINANCIAL TARGETS REFLECTING EURONEXT GROWTH AMBITIONS
▪ Internal Projects costs: €12m over the plan
▪ Organic margin, excluding potential M&A▪ Continued best-in-class cost discipline ▪ Investments in operational excellence▪ Uplift profitability of acquired companies to
Euronext level
▪ Organic growth, excluding potential M&A▪ Cross-cycle trading growth in line with European
GDP▪ Continued focus on revenue diversification and
services
Revenue
EBITDA margin
One-off costs
Proforma
€734m
≥60%
2022e TARGETS2018 COMMENTS
57.0%
Proforma
+2 to 3%
vs. proforma
CAGR2018PF-2022e
Capex c. 4% of revenue Current
3% to 5% of revenue
Dividend Policy 50% of Reported Net Income
Current
50% of Reported Net Income
EURONEXT, A SUSTAINABLE EXCHANGE
│ 18
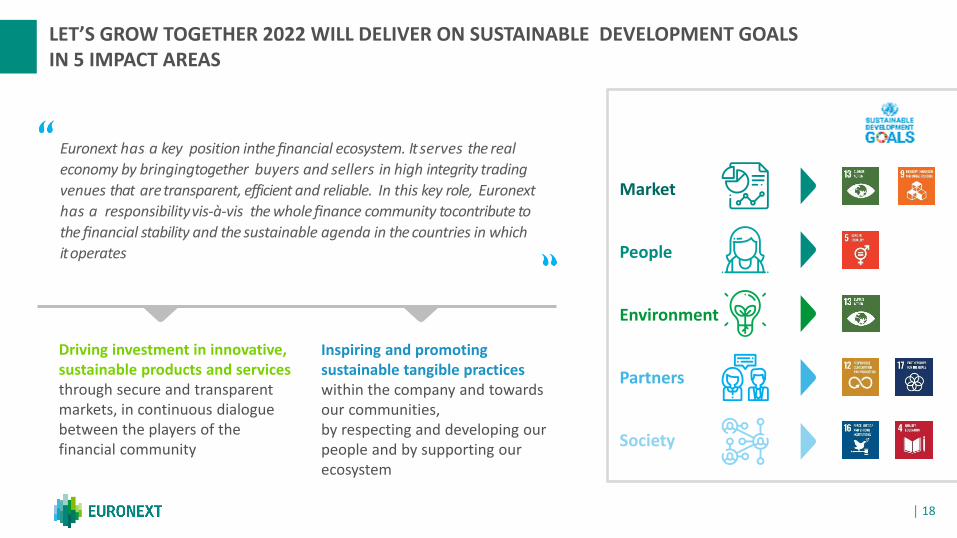
LET’S GROW TOGETHER 2022 WILL DELIVER ON SUSTAINABLE DEVELOPMENT GOALS IN 5 IMPACT AREAS
Euronext has a key position inthe financial ecosystem. It serves the real
economy by bringingtogether buyers and sellers in high integrity trading
venues that aretransparent, efficient and reliable. In this key role, Euronext
has a responsibilityvis-à-vis the wholefinance community tocontribute to
the financial stability and the sustainable agenda in the countries in which
it operates
Driving investment in innovative, sustainable products and services through secure and transparent markets, in continuous dialogue between the players of the financial community
Inspiring and promoting sustainable tangible practices within the company and towards our communities, by respecting and developing our people and by supporting our ecosystem
Environment
People
Society
Partners
Market
│ 19
EURONEXT’S NEW STRATEGIC PLAN WILL DELIVER ON SUSTAINABLE DEVELOPMENT GOALS
Euronext Green Bond section, Cleantech franchise and ESG ETF suiteExpand our suite of ESG indices in partnership with specialised provider
Enhance Euronext’s ESG reporting on agreed material issues on the basis of GRI standardsGroup wide carbon footprint analysis
Continue implementation of
diversity action planImproved performance & development cycle
Publish dedicated material to help issuers with their ESG obligations
Define common goals and motto for
community actions and employee engagement
Environment People SocietyPartnersMarket
▪ Organise a trusted, fair, transparent and efficient market, thereby enhancing access to capital
▪ Promote and developsustainable and innovative products
▪ Reduce our own carbonfootprint and contributeto the protection of the environment
▪ Develop skills and retain talents in an open culture of dialogue
▪ Promote diversity▪ Respect human rights
and local labour laws
▪ Foster “Issuer-Investor” dialogue
▪ Maintain an ongoing dialogue with multi-stakeholder partnerships
▪ Educate partners on financial literacy and regulations
▪ Leverage on Oslo Børsexpertise
▪ Act ethically, with integrity and the highest standards in terms of good governance
▪ Educate and engage with local communities
│ 20
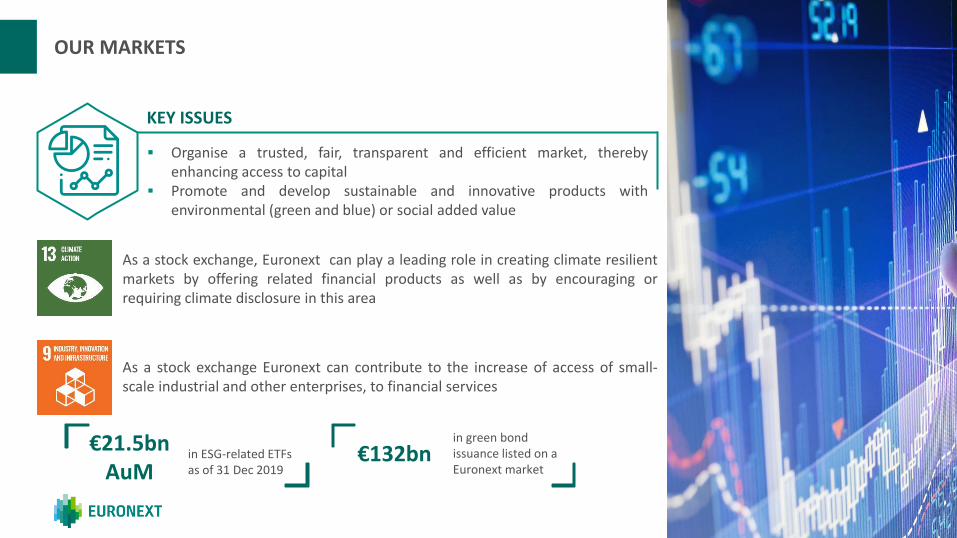
OUR MARKETS
▪ Organise a trusted, fair, transparent and efficient market, therebyenhancing access to capital
▪ Promote and develop sustainable and innovative products withenvironmental (green and blue) or social added value
KEY ISSUES
As a stock exchange, Euronext can play a leading role in creating climate resilientmarkets by offering related financial products as well as by encouraging orrequiring climate disclosure in this area
As a stock exchange Euronext can contribute to the increase of access of small-scale industrial and other enterprises, to financial services
€21.5bn AuM
in ESG-related ETFs as of 31 Dec 2019
€132bnin green bond issuance listed on a Euronext market
│ 21
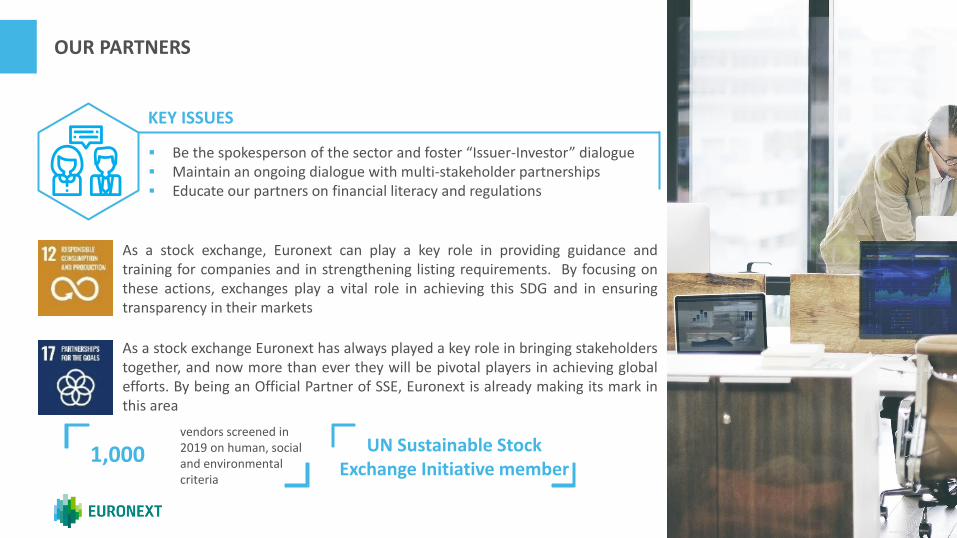
OUR PARTNERS
▪ Be the spokesperson of the sector and foster “Issuer-Investor” dialogue▪ Maintain an ongoing dialogue with multi-stakeholder partnerships▪ Educate our partners on financial literacy and regulations
KEY ISSUES
As a stock exchange, Euronext can play a key role in providing guidance andtraining for companies and in strengthening listing requirements. By focusing onthese actions, exchanges play a vital role in achieving this SDG and in ensuringtransparency in their markets
As a stock exchange Euronext has always played a key role in bringing stakeholderstogether, and now more than ever they will be pivotal players in achieving globalefforts. By being an Official Partner of SSE, Euronext is already making its mark inthis area
1,000vendors screened in 2019 on human, socialand environmentalcriteria
UN Sustainable Stock Exchange Initiative member
│ 22
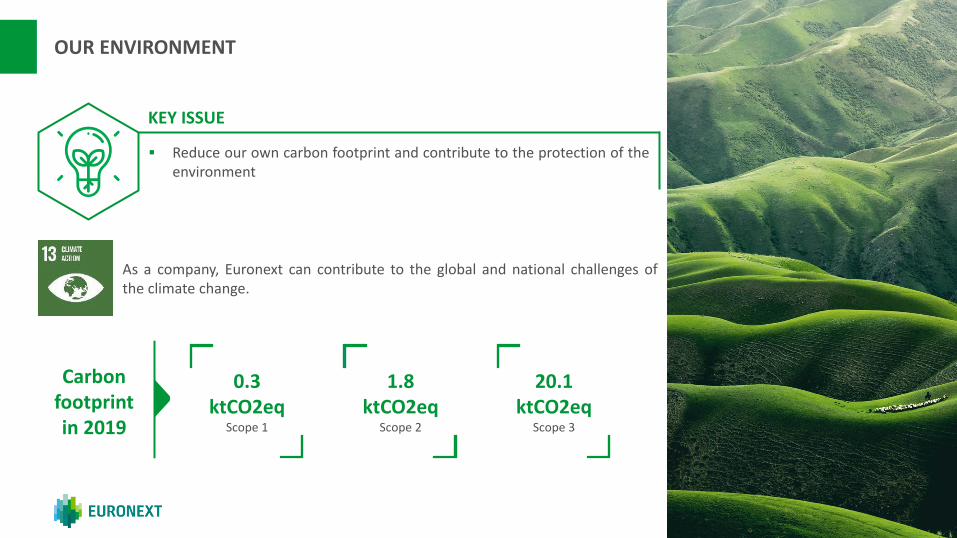
OUR ENVIRONMENT
▪ Reduce our own carbon footprint and contribute to the protection of theenvironment
KEY ISSUE
As a company, Euronext can contribute to the global and national challenges ofthe climate change.
Carbon footprint in 2019
0.3 ktCO2eq
Scope 1
1.8 ktCO2eq
Scope 2
20.1 ktCO2eq
Scope 3
│ 23│ « Index de l’égalité professionnelle 2019 »
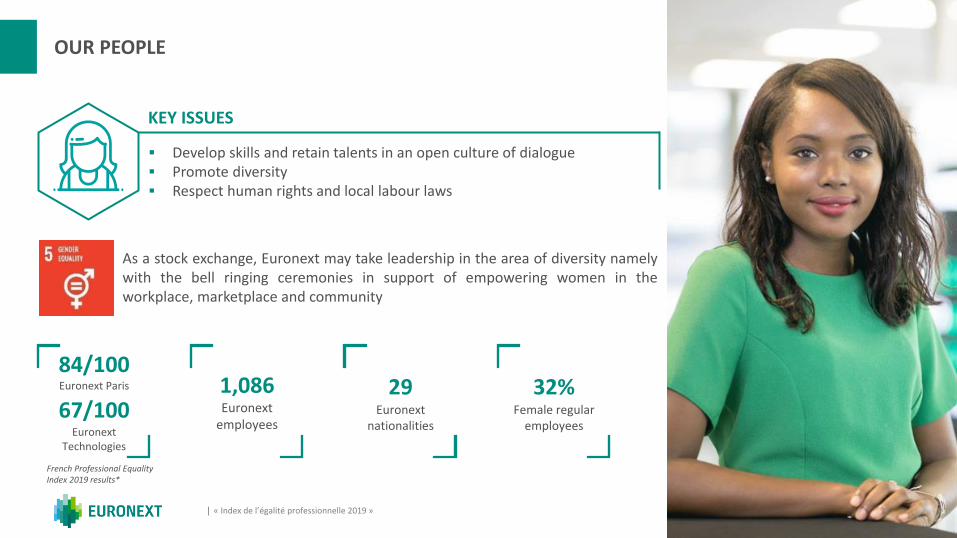
OUR PEOPLE
▪ Develop skills and retain talents in an open culture of dialogue▪ Promote diversity▪ Respect human rights and local labour laws
KEY ISSUES
As a stock exchange, Euronext may take leadership in the area of diversity namelywith the bell ringing ceremonies in support of empowering women in theworkplace, marketplace and community
French Professional EqualityIndex 2019 results*
84/100Euronext Paris
67/100Euronext
Technologies
1,086Euronext
employees
29Euronext
nationalities
32%Female regular
employees
│ 24
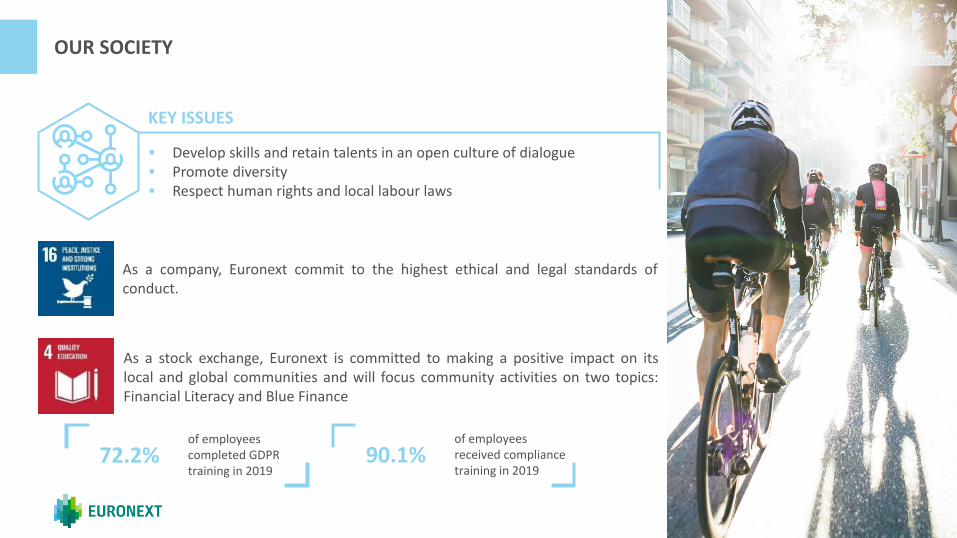
OUR SOCIETY
▪ Develop skills and retain talents in an open culture of dialogue▪ Promote diversity▪ Respect human rights and local labour laws
KEY ISSUES
As a company, Euronext commit to the highest ethical and legal standards ofconduct.
As a stock exchange, Euronext is committed to making a positive impact on itslocal and global communities and will focus community activities on two topics:Financial Literacy and Blue Finance
72.2%of employees completed GDPR training in 2019
90.1%of employees received compliance training in 2019

EXPANSION STRATEGY
│ 26
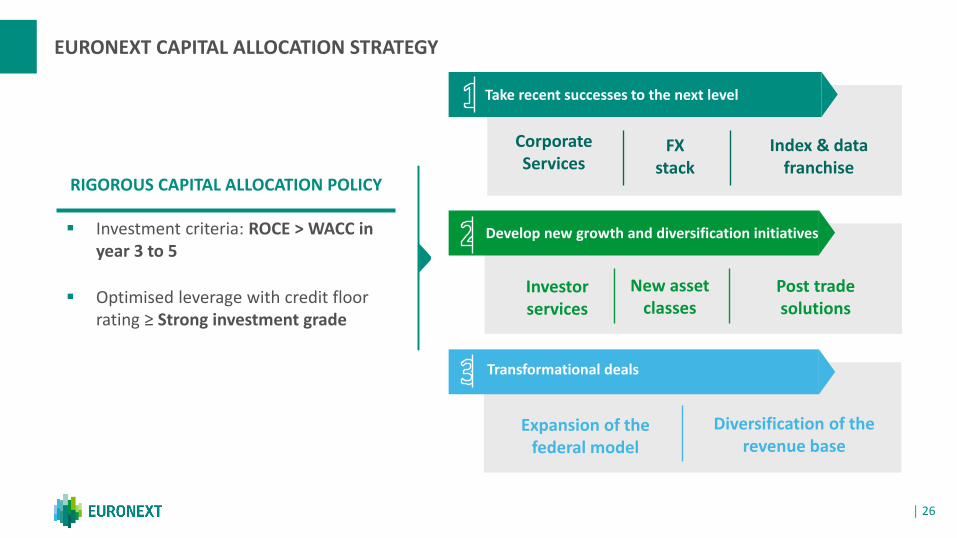
EURONEXT CAPITAL ALLOCATION STRATEGY
RIGOROUS CAPITAL ALLOCATION POLICY
▪ Investment criteria: ROCE > WACC in year 3 to 5
▪ Optimised leverage with credit floor rating ≥ Strong investment grade
Corporate Services
Develop new growth and diversification initiatives
Transformational deals
FX stack
Index & data franchise
Investor services
New asset classes
Post trade solutions
Diversification of the revenue base
Expansion of the federal model
Take recent successes to the next level
│ 27
Paris
Porto
Lisbon
Dublin
London*
MunichZurich
Amsterdam
Brussels
Milan
Madrid
Stockholm
Oslo
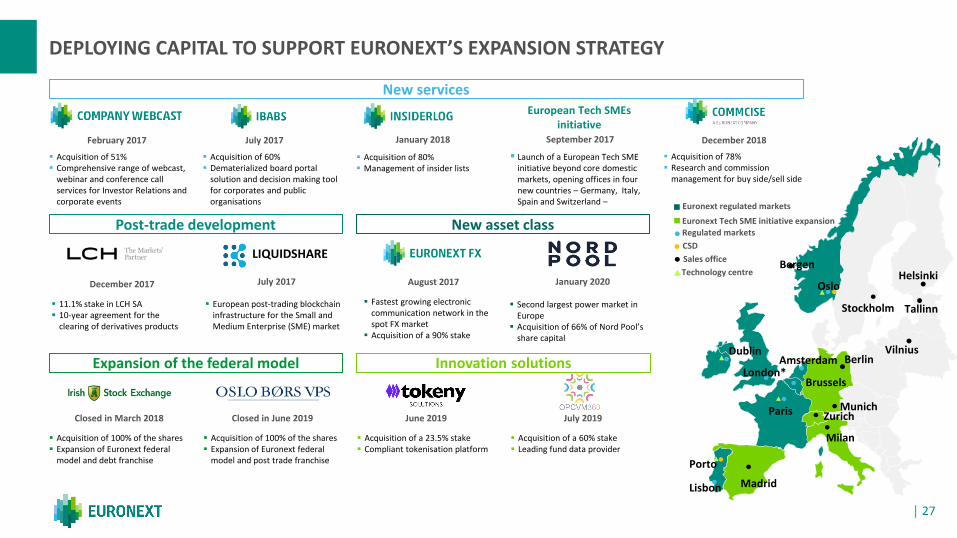
DEPLOYING CAPITAL TO SUPPORT EURONEXT’S EXPANSION STRATEGY
▪ Acquisition of 51% ▪ Comprehensive range of webcast,
webinar and conference call services for Investor Relations and corporate events
▪ Acquisition of 60%▪ Dematerialized board portal
solution and decision making tool for corporates and public organisations
▪ Acquisition of 80%▪ Management of insider lists
▪ Launch of a European Tech SME initiative beyond core domestic markets, opening offices in four new countries – Germany, Italy, Spain and Switzerland –
▪ Acquisition of 78%▪ Research and commission
management for buy side/sell side
▪ 11.1% stake in LCH SA▪ 10-year agreement for the
clearing of derivatives products
▪ European post-trading blockchain infrastructure for the Small and Medium Enterprise (SME) market
▪ Acquisition of 100% of the shares▪ Expansion of Euronext federal
model and debt franchise
▪ Acquisition of 100% of the shares▪ Expansion of Euronext federal
model and post trade franchise
▪ Acquisition of a 23.5% stake▪ Compliant tokenisation platform
▪ Acquisition of a 60% stake▪ Leading fund data provider
LIQUIDSHARE
Euronext regulated markets
Euronext Tech SME initiative expansionRegulated markets
Technology centre
Sales office
CSD
Closed in March 2018 Closed in June 2019 June 2019 July 2019
December 2017 January 2020
New services
Post-trade development New asset class
Expansion of the federal model Innovation solutions
February 2017 July 2017 January 2018 December 2018September 2017
European Tech SMEs initiative
▪ Fastest growing electronic communication network in the spot FX market
▪ Acquisition of a 90% stake
August 2017
▪ Second largest power market in Europe
▪ Acquisition of 66% of Nord Pool’s share capital
July 2017
BergenHelsinki
Vilnius
Tallinn
Berlin
│ 28
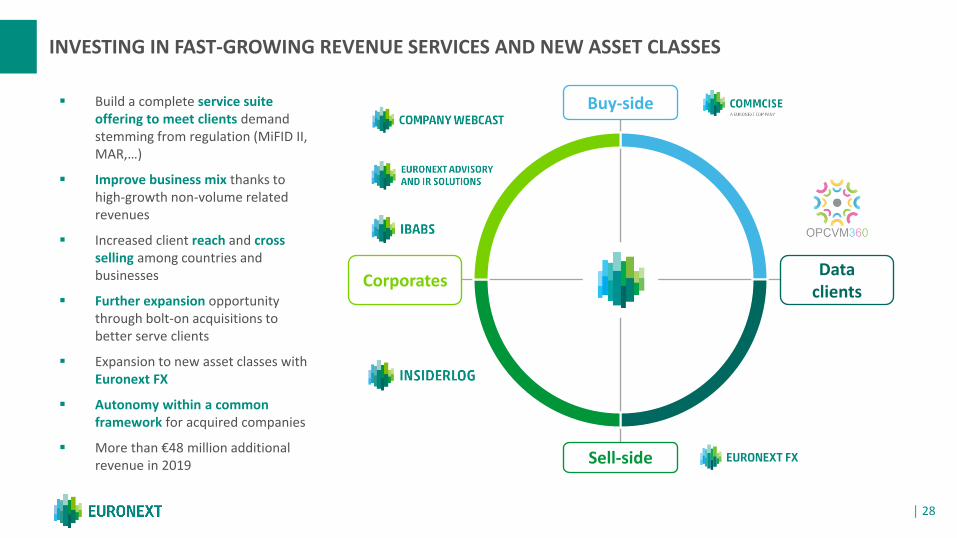
INVESTING IN FAST-GROWING REVENUE SERVICES AND NEW ASSET CLASSES
▪ Build a complete service suite offering to meet clients demandstemming from regulation (MiFID II, MAR,…)
▪ Improve business mix thanks to high-growth non-volume relatedrevenues
▪ Increased client reach and cross selling among countries and businesses
▪ Further expansion opportunitythrough bolt-on acquisitions to better serve clients
▪ Expansion to new asset classes withEuronext FX
▪ Autonomy within a commonframework for acquired companies
▪ More than €48 million additionalrevenue in 2019
CorporatesData
clients
Sell-side
Buy-side
COMBINE OSLO BØRS VPS WITH EURONEXT TO ENHANCE GROWTH
│ 29
│ 30
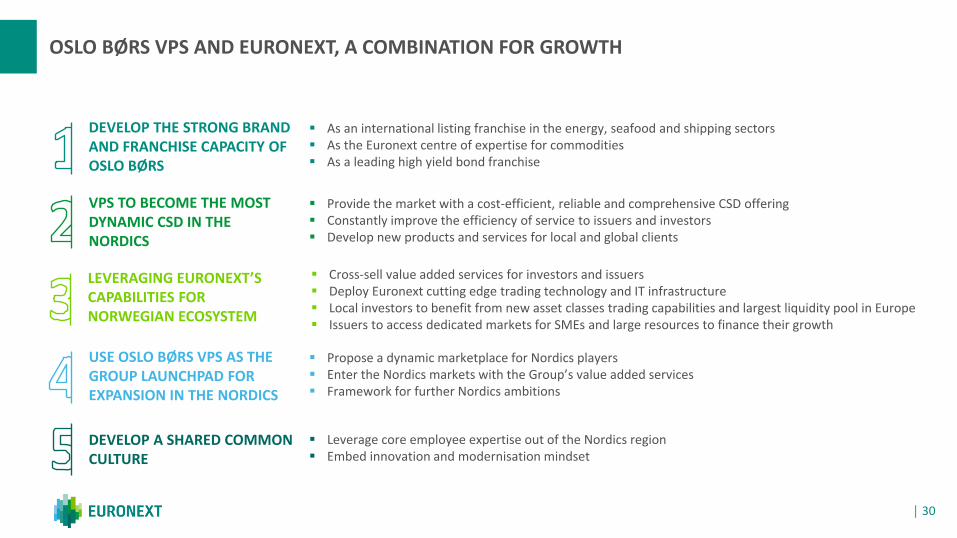
OSLO BØRS VPS AND EURONEXT, A COMBINATION FOR GROWTH
▪ Cross-sell value added services for investors and issuers▪ Deploy Euronext cutting edge trading technology and IT infrastructure▪ Local investors to benefit from new asset classes trading capabilities and largest liquidity pool in Europe▪ Issuers to access dedicated markets for SMEs and large resources to finance their growth
▪ Leverage core employee expertise out of the Nordics region▪ Embed innovation and modernisation mindset
▪ Propose a dynamic marketplace for Nordics players▪ Enter the Nordics markets with the Group’s value added services▪ Framework for further Nordics ambitions
▪ Provide the market with a cost-efficient, reliable and comprehensive CSD offering ▪ Constantly improve the efficiency of service to issuers and investors▪ Develop new products and services for local and global clients
▪ As an international listing franchise in the energy, seafood and shipping sectors▪ As the Euronext centre of expertise for commodities▪ As a leading high yield bond franchise
LEVERAGING EURONEXT’S CAPABILITIES FOR NORWEGIAN ECOSYSTEM
DEVELOP A SHARED COMMON CULTURE
USE OSLO BØRS VPS AS THE GROUP LAUNCHPAD FOR EXPANSION IN THE NORDICS
VPS TO BECOME THE MOST DYNAMIC CSD IN THE NORDICS
DEVELOP THE STRONG BRAND AND FRANCHISE CAPACITY OF OSLO BØRS
│ 31│ Photographer: Stein Henningsen
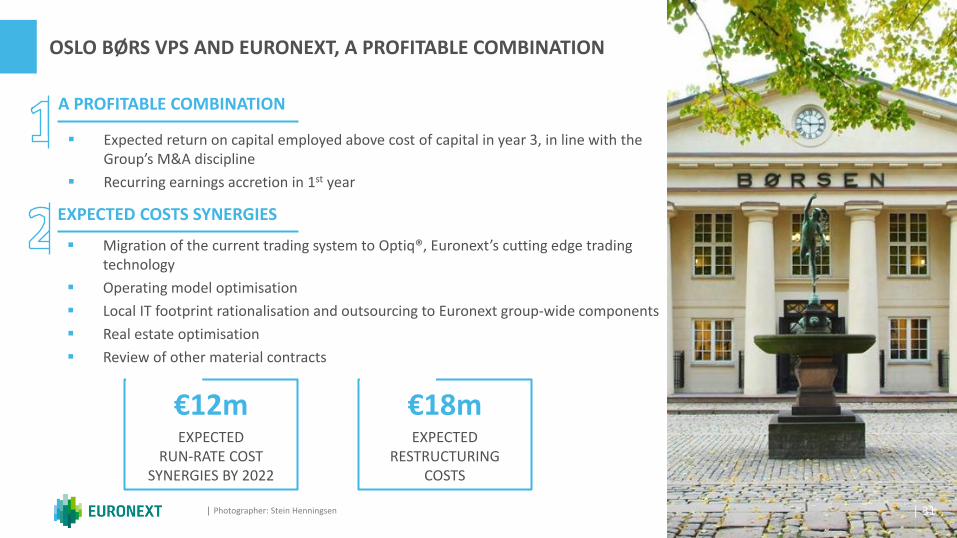
OSLO BØRS VPS AND EURONEXT, A PROFITABLE COMBINATION
€12m EXPECTED
RUN-RATE COST SYNERGIES BY 2022
€18m EXPECTED
RESTRUCTURING COSTS
│ 31
▪ Expected return on capital employed above cost of capital in year 3, in line with the Group’s M&A discipline
▪ Recurring earnings accretion in 1st year
A PROFITABLE COMBINATION
▪ Migration of the current trading system to Optiq®, Euronext’s cutting edge trading technology
▪ Operating model optimisation
▪ Local IT footprint rationalisation and outsourcing to Euronext group-wide components
▪ Real estate optimisation
▪ Review of other material contracts
EXPECTED COSTS SYNERGIES

EURONEXT BUSINESSES
│ 33
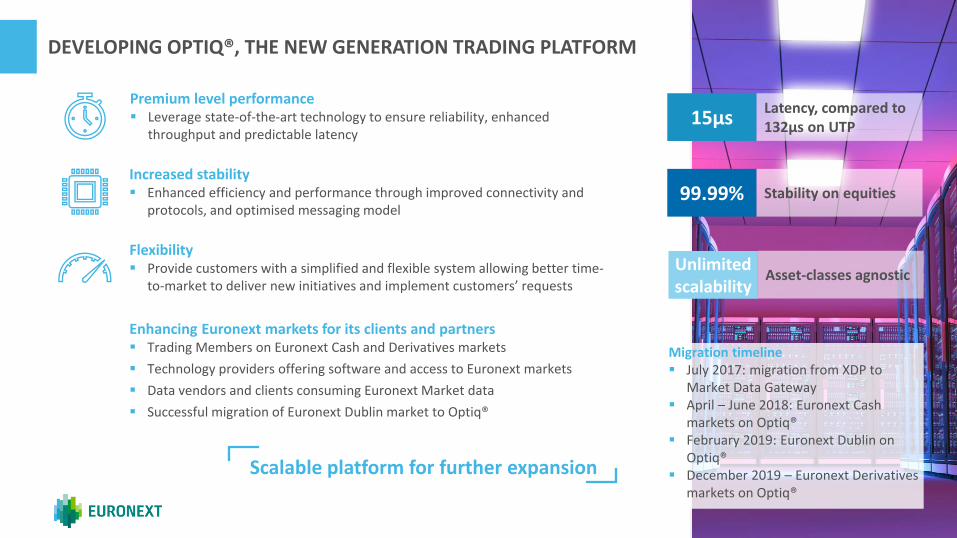
Premium level performance▪ Leverage state-of-the-art technology to ensure reliability, enhanced
throughput and predictable latency
99.99%
15µs
Unlimitedscalability
Stability on equities
Latency, compared to 132µs on UTP
Asset-classes agnostic
DEVELOPING OPTIQ®, THE NEW GENERATION TRADING PLATFORM
Increased stability▪ Enhanced efficiency and performance through improved connectivity and
protocols, and optimised messaging model
Flexibility▪ Provide customers with a simplified and flexible system allowing better time-
to-market to deliver new initiatives and implement customers’ requests
Enhancing Euronext markets for its clients and partners▪ Trading Members on Euronext Cash and Derivatives markets
▪ Technology providers offering software and access to Euronext markets
▪ Data vendors and clients consuming Euronext Market data
▪ Successful migration of Euronext Dublin market to Optiq®
Scalable platform for further expansion
Migration timeline▪ July 2017: migration from XDP to
Market Data Gateway▪ April – June 2018: Euronext Cash
markets on Optiq®▪ February 2019: Euronext Dublin on
Optiq®▪ December 2019 – Euronext Derivatives
markets on Optiq®
│ 34
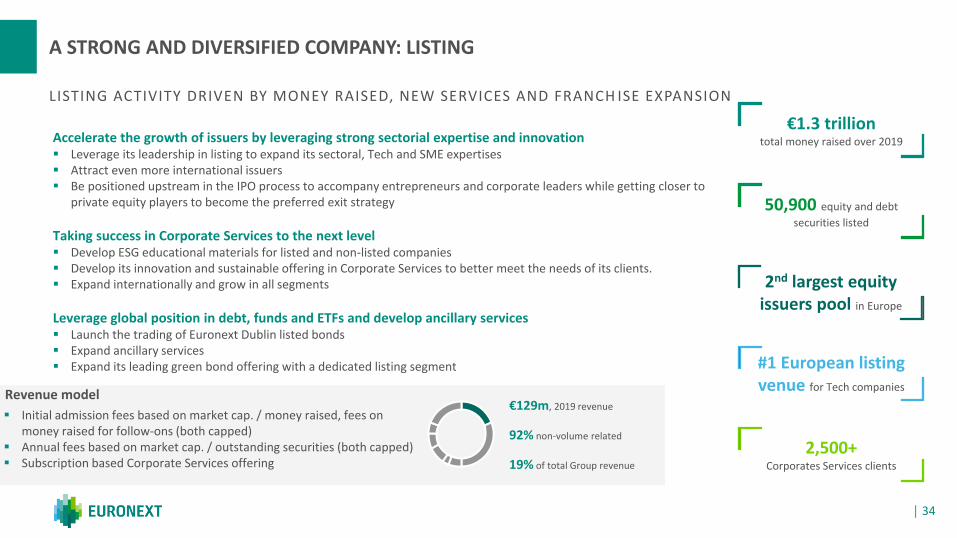
A STRONG AND DIVERSIFIED COMPANY: LISTING
Revenue model
▪ Initial admission fees based on market cap. / money raised, fees on money raised for follow-ons (both capped)
▪ Annual fees based on market cap. / outstanding securities (both capped)▪ Subscription based Corporate Services offering
Accelerate the growth of issuers by leveraging strong sectorial expertise and innovation▪ Leverage its leadership in listing to expand its sectoral, Tech and SME expertises▪ Attract even more international issuers▪ Be positioned upstream in the IPO process to accompany entrepreneurs and corporate leaders while getting closer to
private equity players to become the preferred exit strategy
Taking success in Corporate Services to the next level▪ Develop ESG educational materials for listed and non-listed companies ▪ Develop its innovation and sustainable offering in Corporate Services to better meet the needs of its clients.▪ Expand internationally and grow in all segments
Leverage global position in debt, funds and ETFs and develop ancillary services▪ Launch the trading of Euronext Dublin listed bonds▪ Expand ancillary services ▪ Expand its leading green bond offering with a dedicated listing segment
€1.3 trilliontotal money raised over 2019
50,900 equity and debt
securities listed
2,500+Corporates Services clients
#1 European listing venue for Tech companies
LISTING ACTIVITY DRIVEN BY MONEY RAISED, NEW SERVICES AND FRANCH ISE EXPANSION
2nd largest equity issuers pool in Europe
€129m, 2019 revenue
92% non-volume related
19% of total Group revenue
│ 35│ 2019 ADV excluding Oslo Bors, including Euronext Dublin for the full year
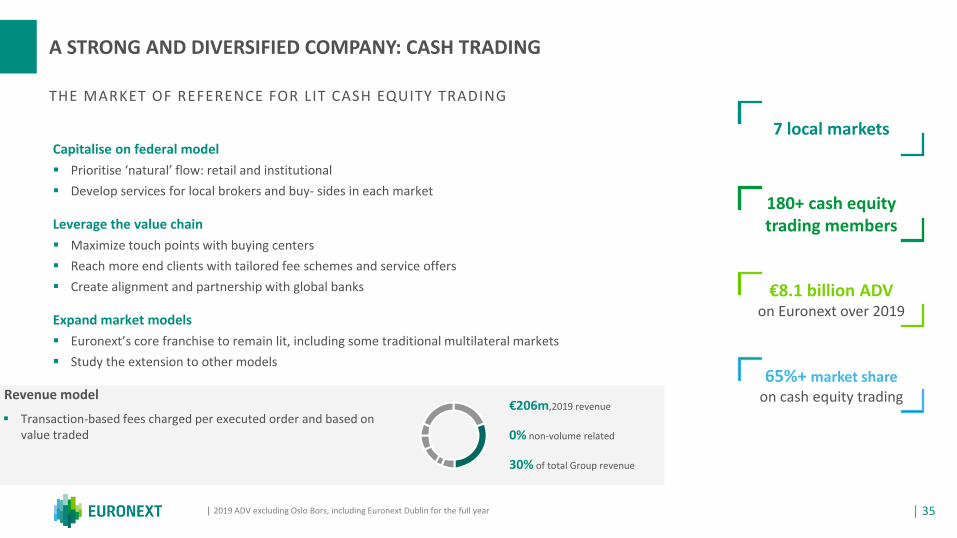
A STRONG AND DIVERSIFIED COMPANY: CASH TRADING
Revenue model
▪ Transaction-based fees charged per executed order and based on value traded
Capitalise on federal model
▪ Prioritise ‘natural’ flow: retail and institutional
▪ Develop services for local brokers and buy- sides in each market
Leverage the value chain
▪ Maximize touch points with buying centers
▪ Reach more end clients with tailored fee schemes and service offers
▪ Create alignment and partnership with global banks
Expand market models
▪ Euronext’s core franchise to remain lit, including some traditional multilateral markets
▪ Study the extension to other models
7 local markets
180+ cash equity trading members
€8.1 billion ADVon Euronext over 2019
65%+ market share on cash equity trading
THE MARKET OF REFERENCE FOR LIT CASH EQUITY TRADING
€206m,2019 revenue
0% non-volume related
30% of total Group revenue
│ 36
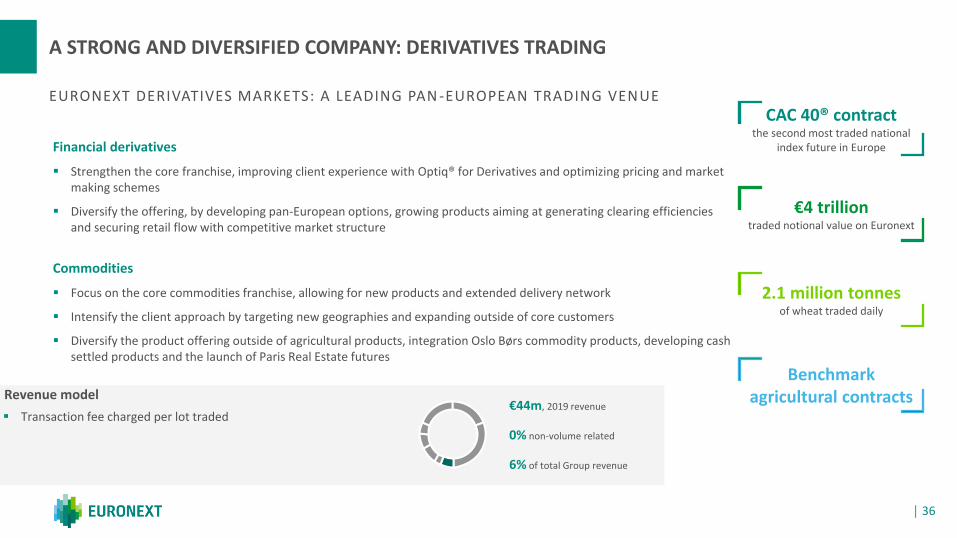
A STRONG AND DIVERSIFIED COMPANY: DERIVATIVES TRADING
Revenue model
▪ Transaction fee charged per lot traded
Financial derivatives
▪ Strengthen the core franchise, improving client experience with Optiq® for Derivatives and optimizing pricing and market making schemes
▪ Diversify the offering, by developing pan-European options, growing products aiming at generating clearing efficiencies and securing retail flow with competitive market structure
Commodities
▪ Focus on the core commodities franchise, allowing for new products and extended delivery network
▪ Intensify the client approach by targeting new geographies and expanding outside of core customers
▪ Diversify the product offering outside of agricultural products, integration Oslo Børs commodity products, developing cash settled products and the launch of Paris Real Estate futures
CAC 40® contractthe second most traded national
index future in Europe
€4 trillion traded notional value on Euronext
2.1 million tonnesof wheat traded daily
Benchmark agricultural contracts
EURONEXT DERIVATIVES MARKETS: A LEADING PAN -EUROPEAN TRADING VENUE
€44m, 2019 revenue
0% non-volume related
6% of total Group revenue
│ 37
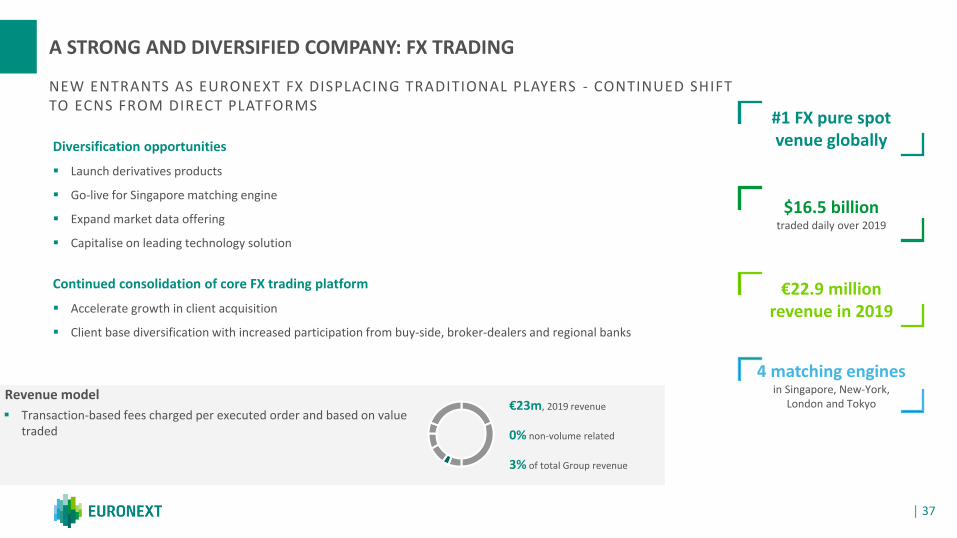
A STRONG AND DIVERSIFIED COMPANY: FX TRADING
Revenue model
▪ Transaction-based fees charged per executed order and based on value traded
Diversification opportunities
▪ Launch derivatives products
▪ Go-live for Singapore matching engine
▪ Expand market data offering
▪ Capitalise on leading technology solution
Continued consolidation of core FX trading platform
▪ Accelerate growth in client acquisition
▪ Client base diversification with increased participation from buy-side, broker-dealers and regional banks
#1 FX pure spot venue globally
$16.5 billiontraded daily over 2019
€22.9 millionrevenue in 2019
4 matching enginesin Singapore, New-York,
London and Tokyo
NEW ENTRANTS AS EURONEXT FX DISPLACING TRADITIONAL PLAYERS - CONTINUED SHIFT TO ECNS FROM DIRECT PLATFORMS
€23m, 2019 revenue
0% non-volume related
3% of total Group revenue
│ 38
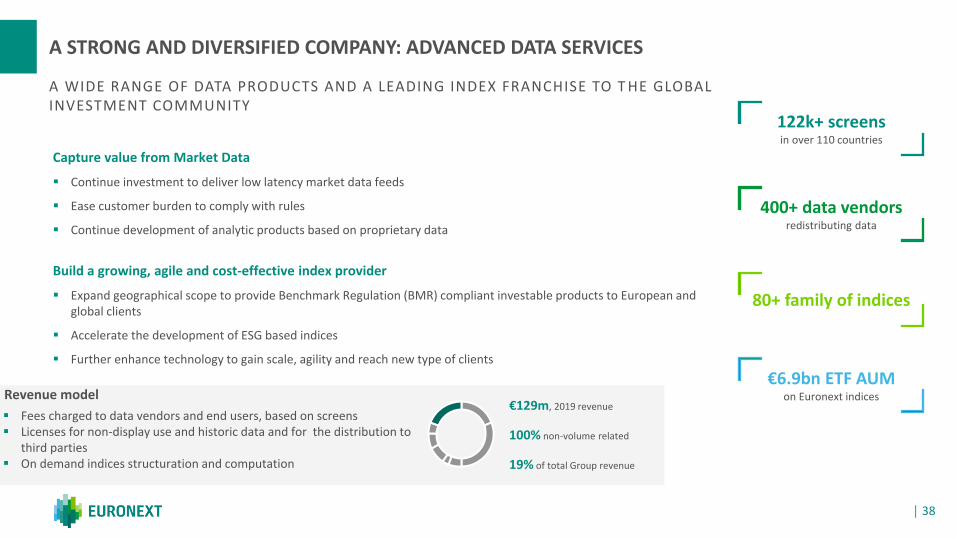
A STRONG AND DIVERSIFIED COMPANY: ADVANCED DATA SERVICES
Revenue model
▪ Fees charged to data vendors and end users, based on screens▪ Licenses for non-display use and historic data and for the distribution to
third parties ▪ On demand indices structuration and computation
Capture value from Market Data
▪ Continue investment to deliver low latency market data feeds
▪ Ease customer burden to comply with rules
▪ Continue development of analytic products based on proprietary data
Build a growing, agile and cost-effective index provider
▪ Expand geographical scope to provide Benchmark Regulation (BMR) compliant investable products to European and global clients
▪ Accelerate the development of ESG based indices
▪ Further enhance technology to gain scale, agility and reach new type of clients
122k+ screens in over 110 countries
400+ data vendors redistributing data
80+ family of indices
€6.9bn ETF AUM on Euronext indices
A WIDE RANGE OF DATA PRODUCTS AND A LEADING INDEX FRANCHISE TO T HE GLOBAL INVESTMENT COMMUNITY
€129m, 2019 revenue
100% non-volume related
19% of total Group revenue
│ 39│ Oslo Børs VPS consolidated for 6.5 months in 2019
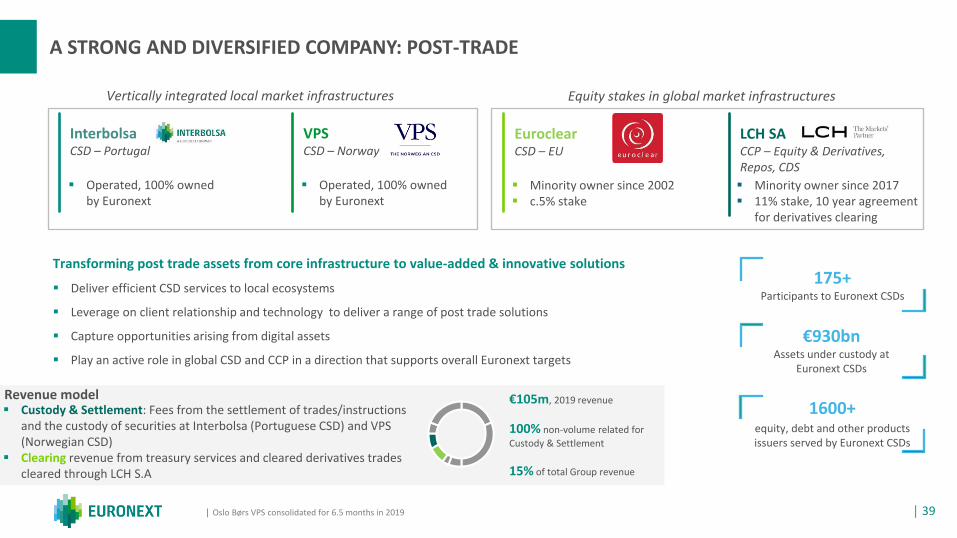
A STRONG AND DIVERSIFIED COMPANY: POST-TRADE
Revenue model▪ Custody & Settlement: Fees from the settlement of trades/instructions
and the custody of securities at Interbolsa (Portuguese CSD) and VPS (Norwegian CSD)
▪ Clearing revenue from treasury services and cleared derivatives trades cleared through LCH S.A
Transforming post trade assets from core infrastructure to value-added & innovative solutions
▪ Deliver efficient CSD services to local ecosystems
▪ Leverage on client relationship and technology to deliver a range of post trade solutions
▪ Capture opportunities arising from digital assets
▪ Play an active role in global CSD and CCP in a direction that supports overall Euronext targets
Vertically integrated local market infrastructures Equity stakes in global market infrastructures
InterbolsaCSD – Portugal
EuroclearCSD – EU
LCH SACCP – Equity & Derivatives, Repos, CDS
▪ Operated, 100% owned by Euronext
▪ Minority owner since 2002 ▪ c.5% stake
▪ Minority owner since 2017 ▪ 11% stake, 10 year agreement
for derivatives clearing
▪ Operated, 100% owned by Euronext
VPSCSD – Norway
175+Participants to Euronext CSDs
€930bnAssets under custody at
Euronext CSDs
1600+equity, debt and other products issuers served by Euronext CSDs
€105m, 2019 revenue
100% non-volume related for
Custody & Settlement
15% of total Group revenue
│ 40
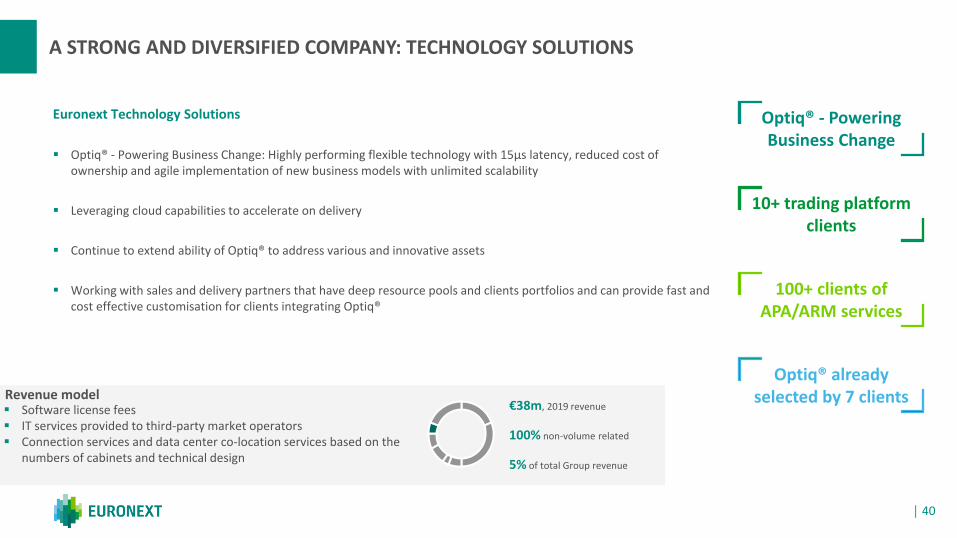
A STRONG AND DIVERSIFIED COMPANY: TECHNOLOGY SOLUTIONS
Revenue model▪ Software license fees▪ IT services provided to third-party market operators▪ Connection services and data center co-location services based on the
numbers of cabinets and technical design
Euronext Technology Solutions
▪ Optiq® - Powering Business Change: Highly performing flexible technology with 15μs latency, reduced cost of ownership and agile implementation of new business models with unlimited scalability
▪ Leveraging cloud capabilities to accelerate on delivery
▪ Continue to extend ability of Optiq® to address various and innovative assets
▪ Working with sales and delivery partners that have deep resource pools and clients portfolios and can provide fast and cost effective customisation for clients integrating Optiq®
€38m, 2019 revenue
100% non-volume related
5% of total Group revenue
Optiq® - Powering Business Change
10+ trading platform clients
100+ clients of APA/ARM services
Optiq® already selected by 7 clients
│ 41│ Nord Pool accounts consolidated from 16 January 2020
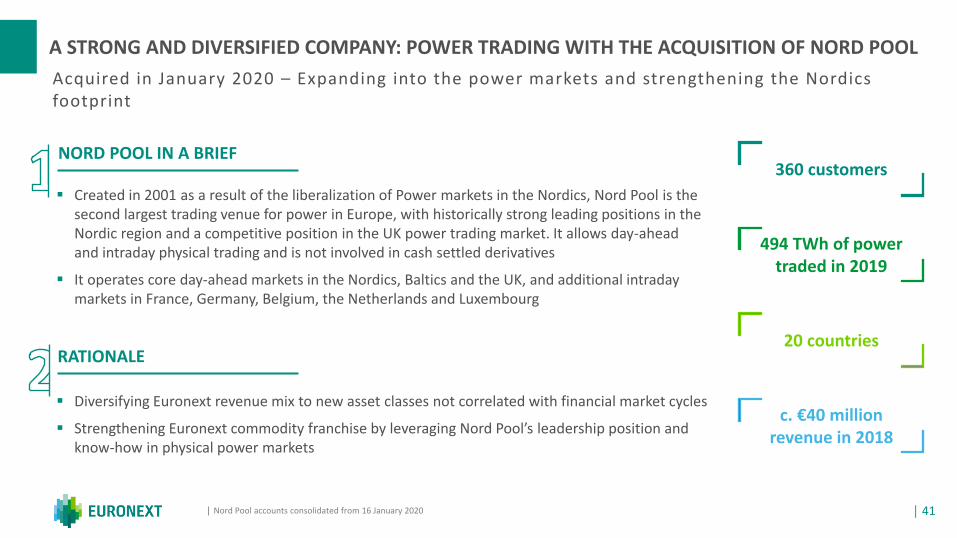
A STRONG AND DIVERSIFIED COMPANY: POWER TRADING WITH THE ACQUISITION OF NORD POOL
▪ Diversifying Euronext revenue mix to new asset classes not correlated with financial market cycles
▪ Strengthening Euronext commodity franchise by leveraging Nord Pool’s leadership position and know-how in physical power markets
360 customers
494 TWh of power traded in 2019
20 countries
c. €40 million revenue in 2018
Acquired in January 2020 – Expanding into the power markets and strengthening the Nordics footprint
NORD POOL IN A BRIEF
RATIONALE
▪ Created in 2001 as a result of the liberalization of Power markets in the Nordics, Nord Pool is the second largest trading venue for power in Europe, with historically strong leading positions in the Nordic region and a competitive position in the UK power trading market. It allows day-ahead and intraday physical trading and is not involved in cash settled derivatives
▪ It operates core day-ahead markets in the Nordics, Baltics and the UK, and additional intraday markets in France, Germany, Belgium, the Netherlands and Luxembourg
GOVERNANCE AND CAPITAL STRUCTURE
│ 42
│ 43│ 1) As of end of December 2019
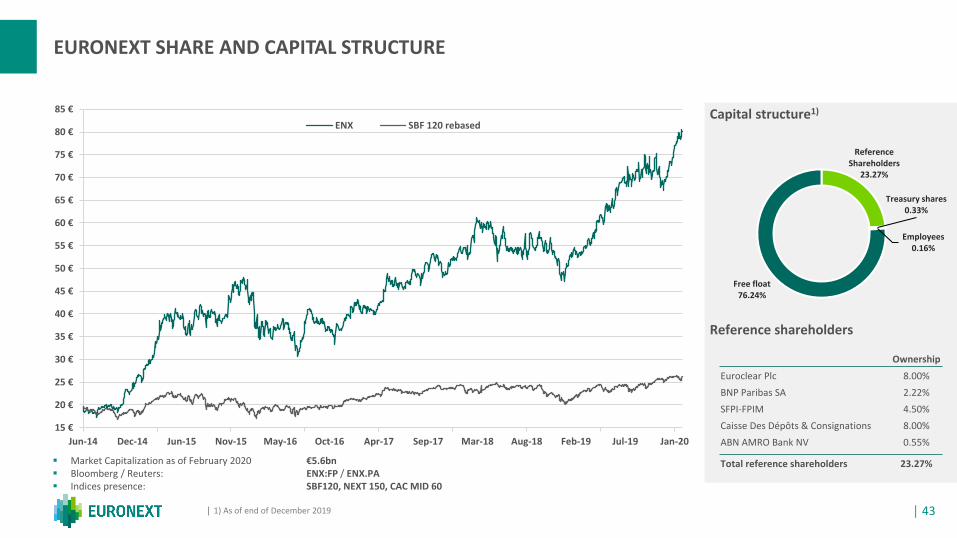
EURONEXT SHARE AND CAPITAL STRUCTURE
Ownership
Euroclear Plc 8.00%
BNP Paribas SA 2.22%
SFPI-FPIM 4.50%
Caisse Des Dépôts & Consignations 8.00%
ABN AMRO Bank NV 0.55%
Total reference shareholders 23.27%
Capital structure1)
Reference shareholders
15 €
20 €
25 €
30 €
35 €
40 €
45 €
50 €
55 €
60 €
65 €
70 €
75 €
80 €
85 €
Jun-14 Dec-14 Jun-15 Nov-15 May-16 Oct-16 Apr-17 Sep-17 Mar-18 Aug-18 Feb-19 Jul-19 Jan-20
ENX SBF 120 rebased
▪ Market Capitalization as of February 2020 €5.6bn ▪ Bloomberg / Reuters: ENX:FP / ENX.PA▪ Indices presence: SBF120, NEXT 150, CAC MID 60
Reference Shareholders
23.27%
Treasury shares0.33%
Employees0.16%
Free float76.24%
│ 44
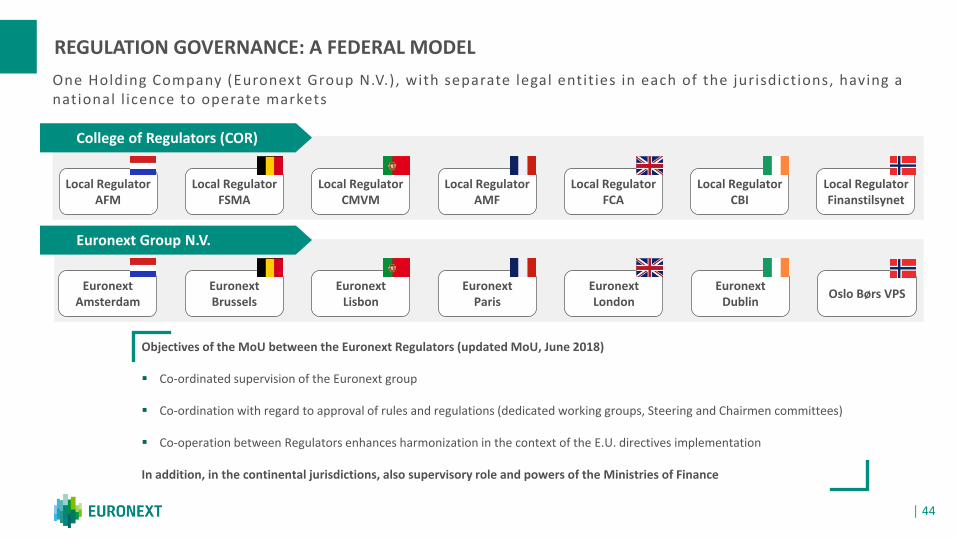
REGULATION GOVERNANCE: A FEDERAL MODEL
EuronextParis
EuronextAmsterdam
EuronextBrussels
EuronextLisbon
EuronextLondon
Local RegulatorAFM
Local RegulatorFSMA
Local Regulator CMVM
Local RegulatorAMF
Local Regulator FCA
EuronextDublin
Local Regulator CBI
Oslo Børs VPS
Local Regulator Finanstilsynet
College of Regulators (COR)
Euronext Group N.V.
One Holding Company (Euronext Group N.V.), with separate legal entit ies in each of the jurisdictions, having a national l icence to operate markets
Objectives of the MoU between the Euronext Regulators (updated MoU, June 2018)
▪ Co-ordinated supervision of the Euronext group
▪ Co-ordination with regard to approval of rules and regulations (dedicated working groups, Steering and Chairmen committees)
▪ Co-operation between Regulators enhances harmonization in the context of the E.U. directives implementation
In addition, in the continental jurisdictions, also supervisory role and powers of the Ministries of Finance
│ 45
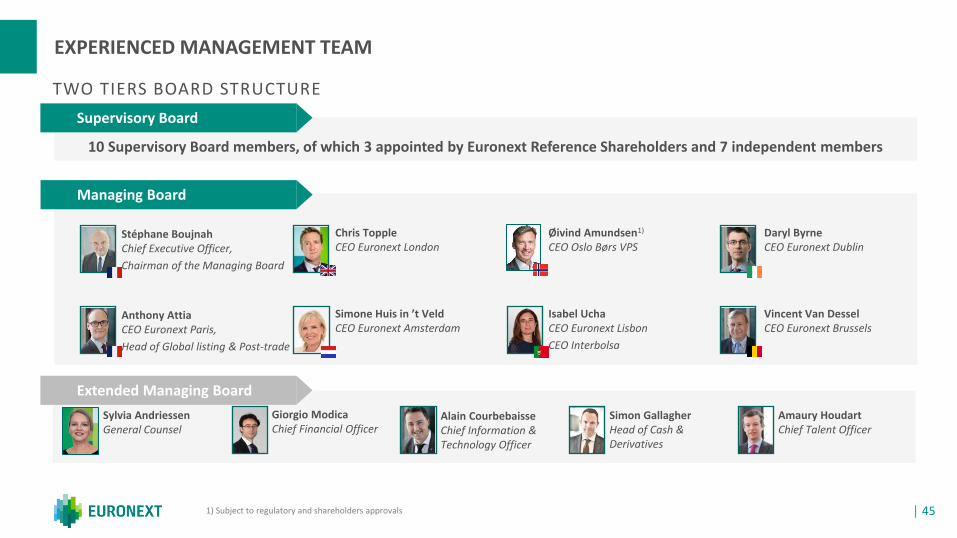
EXPERIENCED MANAGEMENT TEAM
10 Supervisory Board members, of which 3 appointed by Euronext Reference Shareholders and 7 independent members
TWO TIERS BOARD STRUCTURE
Managing Board
Supervisory Board
Chris ToppleCEO Euronext London
Simone Huis in ’t VeldCEO Euronext Amsterdam
Øivind Amundsen1)
CEO Oslo Børs VPS
Isabel UchaCEO Euronext Lisbon
CEO Interbolsa
Daryl ByrneCEO Euronext Dublin
Vincent Van DesselCEO Euronext Brussels
Extended Managing Board
Sylvia AndriessenGeneral Counsel
Giorgio ModicaChief Financial Officer
Alain CourbebaisseChief Information & Technology Officer
Simon GallagherHead of Cash & Derivatives
Amaury HoudartChief Talent Officer
Stéphane BoujnahChief Executive Officer,
Chairman of the Managing Board
Anthony AttiaCEO Euronext Paris,
Head of Global listing & Post-trade
1) Subject to regulatory and shareholders approvals
│ 46
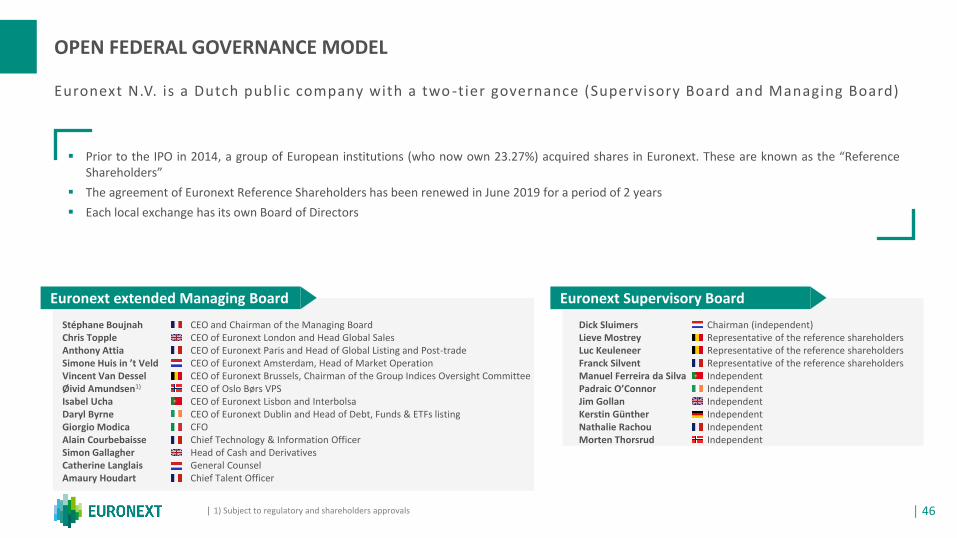
Euronext N.V. is a Dutch public company with a two -tier governance (Supervisory Board and Managing Board)
│ 1) Subject to regulatory and shareholders approvals
OPEN FEDERAL GOVERNANCE MODEL
Stéphane Boujnah CEO and Chairman of the Managing BoardChris Topple CEO of Euronext London and Head Global Sales Anthony Attia CEO of Euronext Paris and Head of Global Listing and Post-trade Simone Huis in ’t Veld CEO of Euronext Amsterdam, Head of Market OperationVincent Van Dessel CEO of Euronext Brussels, Chairman of the Group Indices Oversight CommitteeØivid Amundsen1) CEO of Oslo Børs VPSIsabel Ucha CEO of Euronext Lisbon and InterbolsaDaryl Byrne CEO of Euronext Dublin and Head of Debt, Funds & ETFs listingGiorgio Modica CFOAlain Courbebaisse Chief Technology & Information OfficerSimon Gallagher Head of Cash and DerivativesCatherine Langlais General CounselAmaury Houdart Chief Talent Officer
Dick Sluimers Chairman (independent)Lieve Mostrey Representative of the reference shareholdersLuc Keuleneer Representative of the reference shareholdersFranck Silvent Representative of the reference shareholdersManuel Ferreira da Silva Independent Padraic O’Connor Independent Jim Gollan Independent Kerstin Günther Independent Nathalie Rachou Independent Morten Thorsrud Independent
Euronext extended Managing Board Euronext Supervisory Board
▪ Prior to the IPO in 2014, a group of European institutions (who now own 23.27%) acquired shares in Euronext. These are known as the “ReferenceShareholders”
▪ The agreement of Euronext Reference Shareholders has been renewed in June 2019 for a period of 2 years
▪ Each local exchange has its own Board of Directors

EURONEXT Q4 2019 RESULTS
│ 47
│ 48
9.2 9.9
18.9 33.4
29.5
36.5
69.8
70.8
29.8
33.5
1.6
Q4 2018 Q4 2019
Technology Solutions& Other revenue
Post-trade
Listing
Trading
Advanced DataServices
Investor Services
Q4 2019 consolidatedrevenue growth
Revenue contribution from Oslo Børs VPS
Non-volume relatedrevenue
Non-volume related revenue to operating cost coveragevs 101% in Q4 2018
│ ‘Organic’ and ‘Like-for-like’ referring to Euronext Group perimeter excluding Commcise, OPCVM360 and Oslo Børs VPS as well as any project cost supported by Euronext for the integration of these companies│ Volume related revenue accounting for trading and clearing activities and IPOs revenue│ Operating cost coverage equal to non-volume related revenue divided by operating expenses excluding D&A│ Total revenue also include €0.0m of other income
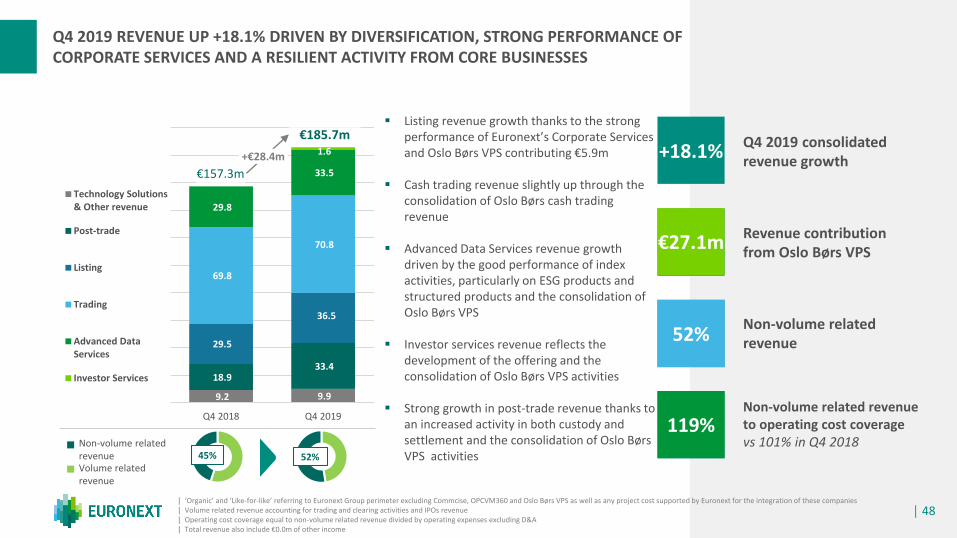
Q4 2019 REVENUE UP +18.1% DRIVEN BY DIVERSIFICATION, STRONG PERFORMANCE OF CORPORATE SERVICES AND A RESILIENT ACTIVITY FROM CORE BUSINESSES
▪ Listing revenue growth thanks to the strong performance of Euronext’s Corporate Services and Oslo Børs VPS contributing €5.9m
▪ Cash trading revenue slightly up through the consolidation of Oslo Børs cash trading revenue
▪ Advanced Data Services revenue growth driven by the good performance of index activities, particularly on ESG products and structured products and the consolidation of Oslo Børs VPS
▪ Investor services revenue reflects the development of the offering and the consolidation of Oslo Børs VPS activities
▪ Strong growth in post-trade revenue thanks to an increased activity in both custody and settlement and the consolidation of Oslo BørsVPS activities
+18.1%
€27.1m
52%
119%Non-volume relatedrevenueVolume relatedrevenue
€185.7m
€157.3m
+€28.4m
45% 52%
│ 49
350.0
321.6
1.9
3.2
Q4 2018 Q4 2019
Large caps SMEs
1.1 4.3
5.9
8.3 5.0
1.6 2.7
3.1 6.1
8.8 3.5
2.9 5.2
7.6
Q4 2018 Q4 2019
Corporate Services ETFs, Funds & Warrants
Debt IPOs
Follow-ons Equity Annual fees
Others
Strong growth of Corporate Services and consolidation of Oslo Børs VPS
│ Unless stated otherwise, percentages compare Q4 2019 to Q4 2018 data │ 1) Including €0.3m in Corporate Services
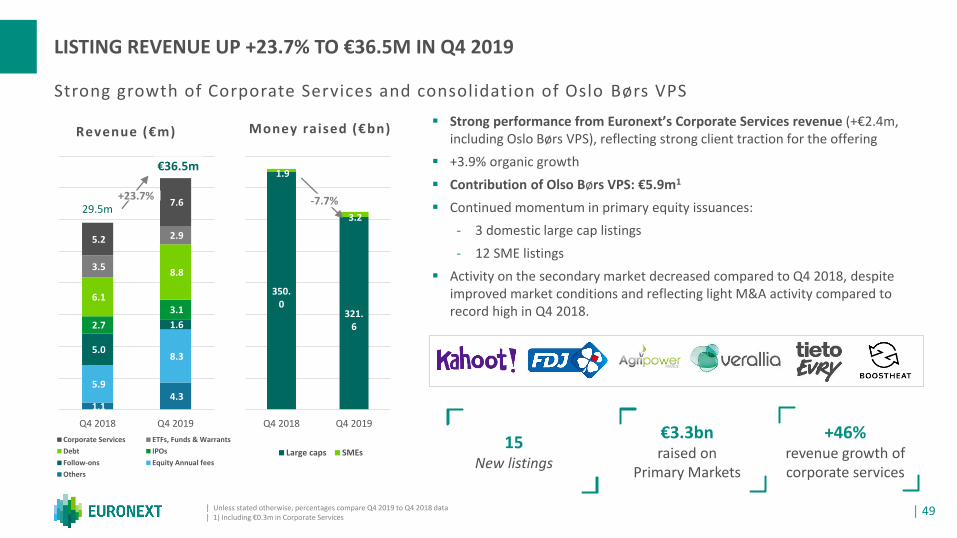
LISTING REVENUE UP +23.7% TO €36.5M IN Q4 2019
▪ Strong performance from Euronext’s Corporate Services revenue (+€2.4m, including Oslo Børs VPS), reflecting strong client traction for the offering
▪ +3.9% organic growth
▪ Contribution of Olso Børs VPS: €5.9m1
▪ Continued momentum in primary equity issuances:
- 3 domestic large cap listings
- 12 SME listings
▪ Activity on the secondary market decreased compared to Q4 2018, despite improved market conditions and reflecting light M&A activity compared to record high in Q4 2018.
Revenue (€m) Money raised (€bn)
€36.5m
29.5m-7.7%
15New listings
+46%revenue growth of corporate services
€3.3bn raised on
Primary Markets
+23.7%
│ 50│ Full volumes breakdown provided in appendix│ Unless stated otherwise, percentages compare Q4 2019 consolidated data to Q4 2018 data excluding Oslo Bors VPS
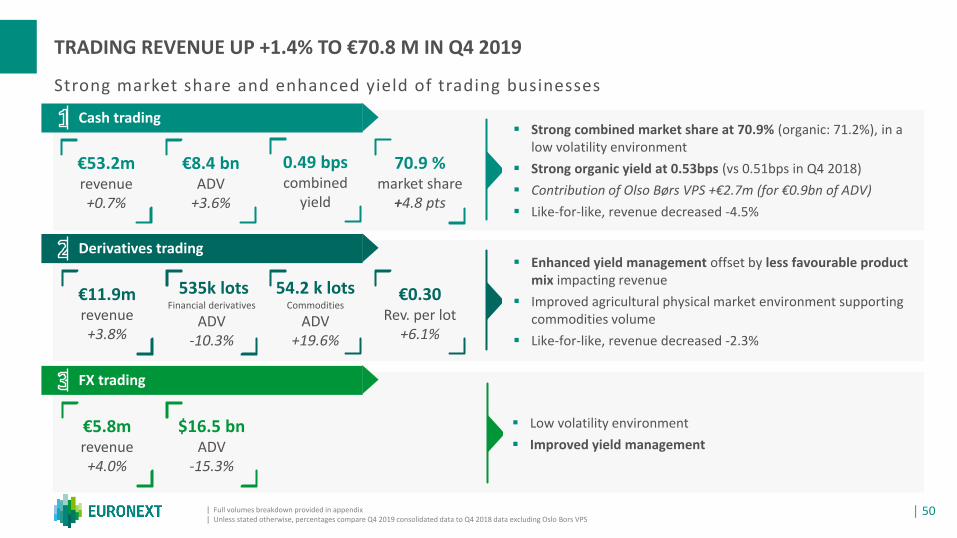
TRADING REVENUE UP +1.4% TO €70.8 M IN Q4 2019
52%
129%
▪ Strong combined market share at 70.9% (organic: 71.2%), in a low volatility environment
▪ Strong organic yield at 0.53bps (vs 0.51bps in Q4 2018)
▪ Contribution of Olso Børs VPS +€2.7m (for €0.9bn of ADV)
▪ Like-for-like, revenue decreased -4.5%
▪ Enhanced yield management offset by less favourable product mix impacting revenue
▪ Improved agricultural physical market environment supporting commodities volume
▪ Like-for-like, revenue decreased -2.3%
▪ Low volatility environment
▪ Improved yield management
Cash trading
Strong market share and enhanced yield of trading businesses
Derivatives trading
FX trading
€53.2mrevenue+0.7%
70.9 %market share
+4.8 pts
0.49 bpscombined
yield
€8.4 bnADV
+3.6%
€11.9mrevenue+3.8%
€0.30Rev. per lot
+6.1%
535k lots Financial derivatives
ADV-10.3%
€5.8mrevenue+4.0%
$16.5 bnADV
-15.3%
54.2 k lots Commodities
ADV+19.6%
│ 51
Consolidation of Oslo Børs VPS, strong settlement activity and higher clearing revenue
│ Unless stated otherwise, percentages compare Q4 2019 to Q4 2018 data
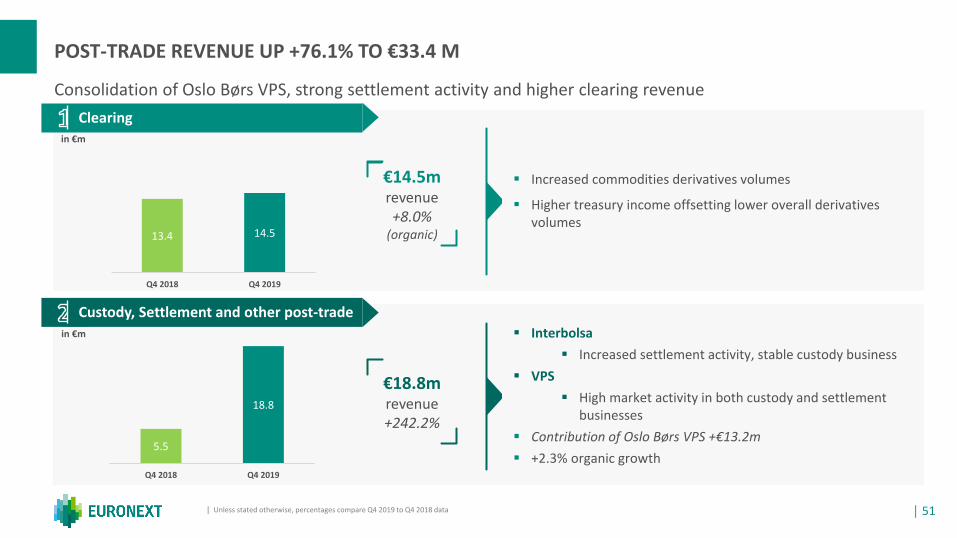
POST-TRADE REVENUE UP +76.1% TO €33.4 M
52%
129%
52%
▪ Increased commodities derivatives volumes
▪ Higher treasury income offsetting lower overall derivatives volumes
▪ Interbolsa
▪ Increased settlement activity, stable custody business
▪ VPS
▪ High market activity in both custody and settlement businesses
▪ Contribution of Oslo Børs VPS +€13.2m
▪ +2.3% organic growth
Clearing
Custody, Settlement and other post-trade
€14.5mrevenue+8.0%
(organic)
€18.8mrevenue+242.2%
13.4 14.5
Q4 2018 Q4 2019
5.5
18.8
Q4 2018 Q4 2019
in €m
in €m
│ 52
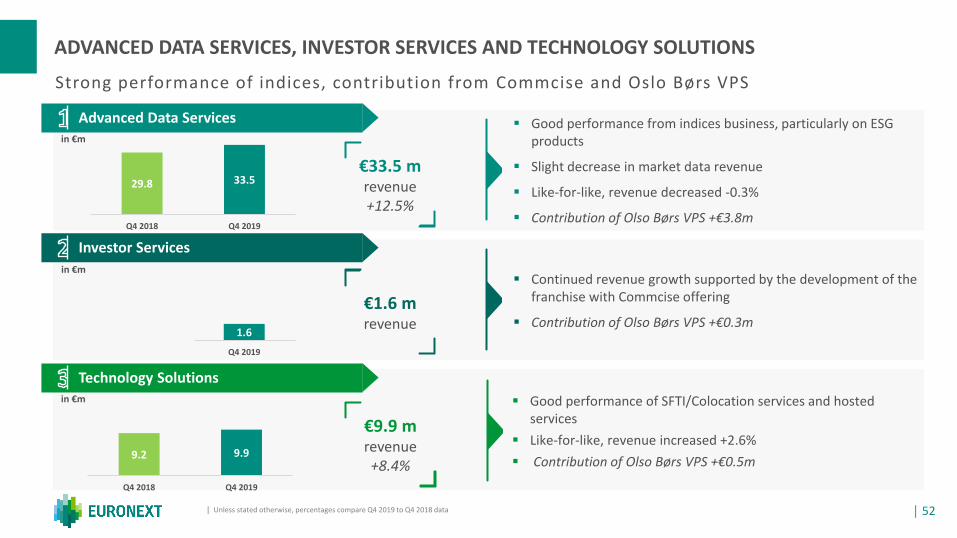
Strong performance of indices, contribution from Commcise and Oslo Børs VPS
│ Unless stated otherwise, percentages compare Q4 2019 to Q4 2018 data
ADVANCED DATA SERVICES, INVESTOR SERVICES AND TECHNOLOGY SOLUTIONS
52%
129%
▪ Good performance from indices business, particularly on ESG products
▪ Slight decrease in market data revenue
▪ Like-for-like, revenue decreased -0.3%
▪ Contribution of Olso Børs VPS +€3.8m
▪ Continued revenue growth supported by the development of the franchise with Commcise offering
▪ Contribution of Olso Børs VPS +€0.3m
▪ Good performance of SFTI/Colocation services and hosted services
▪ Like-for-like, revenue increased +2.6%
▪ Contribution of Olso Børs VPS +€0.5m
Advanced Data Services
Investor Services
Technology Solutions
€33.5 mrevenue+12.5%
€1.6 mrevenue
€9.9 mrevenue+8.4%
in €m
in €m
in €m
29.8 33.5
Q4 2018 Q4 2019
0.01.6
Q4 2018 Q4 2019
9.2 9.9
Q4 2018 Q4 2019
│ 53
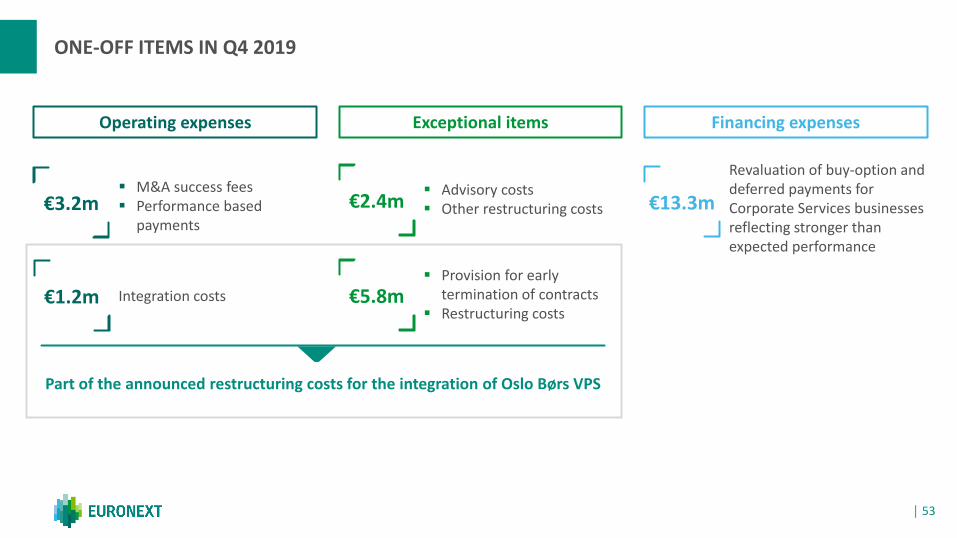
ONE-OFF ITEMS IN Q4 2019
Exceptional items Financing expensesOperating expenses
€5.8m€1.2m
€13.3m€3.2m
Revaluation of buy-option and deferred payments for Corporate Services businesses reflecting stronger than expected performance
▪ Provision for early termination of contracts
▪ Restructuring costsIntegration costs
▪ M&A success fees▪ Performance based
payments
Part of the announced restructuring costs for the integration of Oslo Børs VPS
€2.4m▪ Advisory costs▪ Other restructuring costs
│ 54
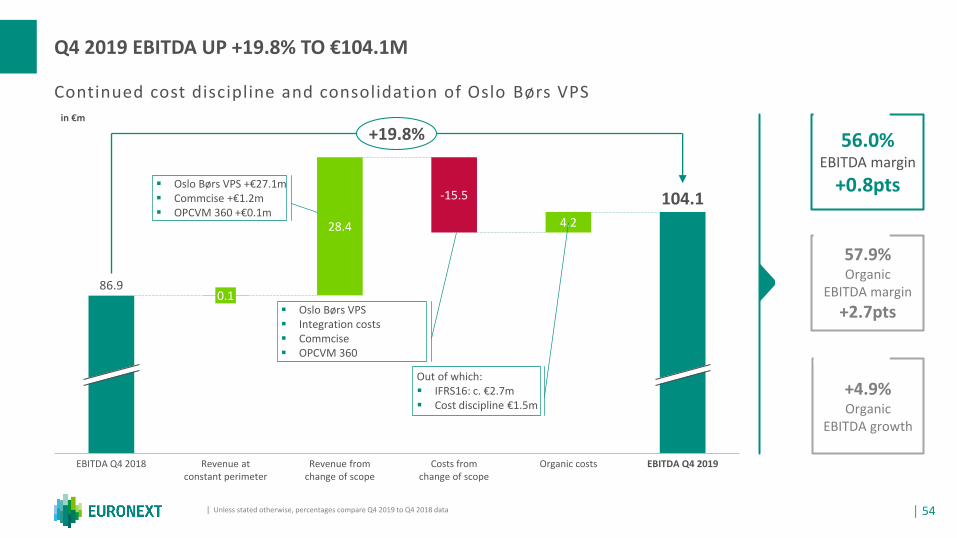
EBITDA Q4 2019
-15.5
EBITDA Q4 2018
0.1
Revenue at constant perimeter
Revenue from change of scope
Costs from change of scope
Organic costs
86.9
104.1
28.4 4.2
+19.8%
Continued cost discipline and consolidation of Oslo Børs VPS
│ Unless stated otherwise, percentages compare Q4 2019 to Q4 2018 data
Q4 2019 EBITDA UP +19.8% TO €104.1M
57.9%Organic
EBITDA margin
+2.7pts
+4.9%Organic
EBITDA growth
56.0%EBITDA margin
+0.8pts▪ Oslo Børs VPS +€27.1m▪ Commcise +€1.2m▪ OPCVM 360 +€0.1m
▪ Oslo Børs VPS▪ Integration costs▪ Commcise▪ OPCVM 360
Out of which:▪ IFRS16: c. €2.7m▪ Cost discipline €1.5m
in €m
│ 55
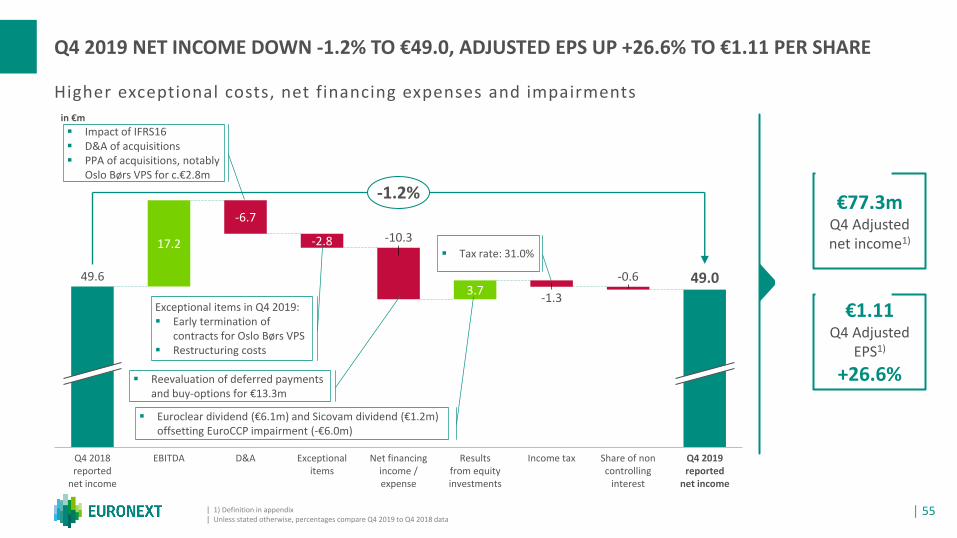
17.2
3.7
Income taxQ4 2018 reported
net income
EBITDA
-6.7
-1.3
Share of non controlling
interest
Q4 2019 reported
net income
49.0
-10.3
Exceptional items
-2.8
D&A
49.6
Results from equity investments
-0.6
Net financing income / expense
-1.2%
Higher exceptional costs, net financing expenses and impairments
│ 1) Definition in appendix│ Unless stated otherwise, percentages compare Q4 2019 to Q4 2018 data
Q4 2019 NET INCOME DOWN -1.2% TO €49.0, ADJUSTED EPS UP +26.6% TO €1.11 PER SHARE
€1.11Q4 Adjusted
EPS1)
+26.6%
€77.3mQ4 Adjusted net income1)
▪ Reevaluation of deferred payments and buy-options for €13.3m
Exceptional items in Q4 2019:▪ Early termination of
contracts for Oslo Børs VPS▪ Restructuring costs
in €m
▪ Impact of IFRS16▪ D&A of acquisitions▪ PPA of acquisitions, notably
Oslo Børs VPS for c.€2.8m
▪ Euroclear dividend (€6.1m) and Sicovam dividend (€1.2m) offsetting EuroCCP impairment (-€6.0m)
▪ Tax rate: 31.0%
│ 56│ 1) Based on LTM proforma EBITDA including Oslo Børs VPS│ Unless stated otherwise, percentages compare Q4 2019 to Q4 2018 data
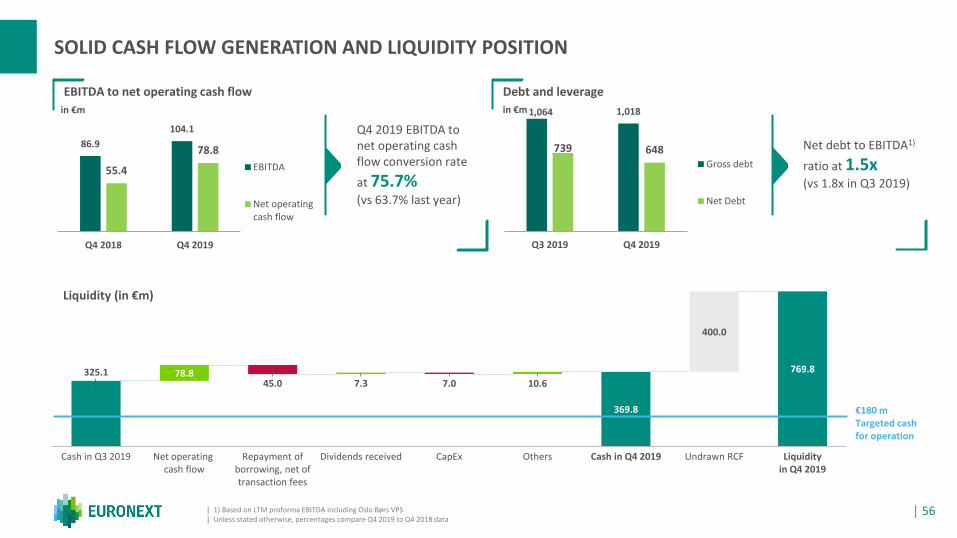
SOLID CASH FLOW GENERATION AND LIQUIDITY POSITION
325.1
369.8
769.878.845.0 7.3 7.0 10.6
400.0
Liquidityin Q4 2019
Undrawn RCFNet operating cash flow
Cash in Q3 2019 Repayment of borrowing, net of transaction fees
Dividends received CapEx Others Cash in Q4 2019
€180 mTargeted cash for operation
EBITDA to net operating cash flow Debt and leverage
Liquidity (in €m)
in €m in €m
Q4 2019 EBITDA to net operating cash flow conversion rate
at 75.7% (vs 63.7% last year)
Net debt to EBITDA1)
ratio at 1.5x(vs 1.8x in Q3 2019)
86.9
104.1
55.4
78.8
Q4 2018 Q4 2019
EBITDA
Net operatingcash flow
1,064 1,018
739 648
Q3 2019 Q4 2019
Gross debt
Net Debt
APPENDIX
│ 57
│ 58
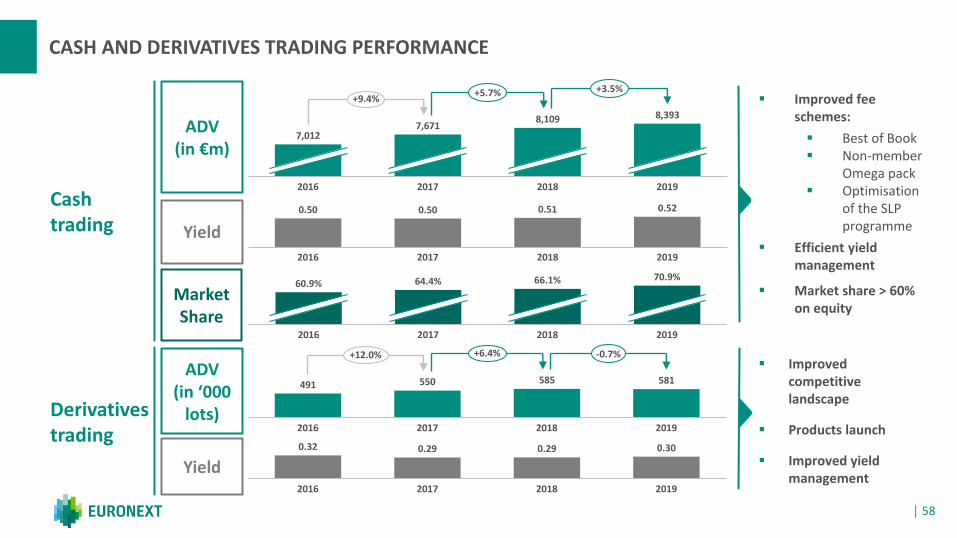
CASH AND DERIVATIVES TRADING PERFORMANCE
Cash trading
ADV(in €m)
2017 2019
7,0127,671
8,109 8,393
20182016
+9.4%+5.7% +3.5%
Yield
Market Share
2016
66.1%
2017 20192018
60.9% 64.4% 70.9%
0.50 0.50 0.51
2016 2017 2018 2019
0.52
Derivatives trading
ADV(in ‘000
lots)
Yield
491 550 585 581
20172016 2018 2019
+12.0% +6.4% -0.7%
0.32 0.29 0.29 0.30
2016 2017 2018 2019
▪ Improved fee schemes:
▪ Best of Book ▪ Non-member
Omega pack▪ Optimisation
of the SLP programme
▪ Efficient yield management
▪ Market share > 60% on equity
▪ Improved competitive landscape
▪ Products launch
▪ Improved yield management
│ 59│ 1) 2019 dividend subject to shareholders approval at 2020 annual general meeting
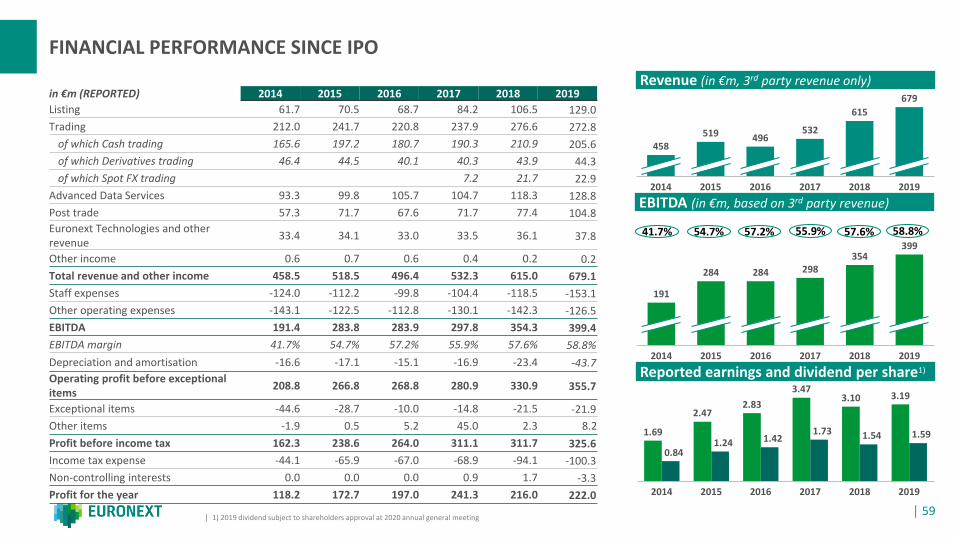
FINANCIAL PERFORMANCE SINCE IPO
in €m (REPORTED) 2014 2015 2016 2017 2018 2019
Listing 61.7 70.5 68.7 84.2 106.5 129.0
Trading 212.0 241.7 220.8 237.9 276.6 272.8
of which Cash trading 165.6 197.2 180.7 190.3 210.9 205.6
of which Derivatives trading 46.4 44.5 40.1 40.3 43.9 44.3
of which Spot FX trading 7.2 21.7 22.9
Advanced Data Services 93.3 99.8 105.7 104.7 118.3 128.8
Post trade 57.3 71.7 67.6 71.7 77.4 104.8
Euronext Technologies and other revenue
33.4 34.1 33.0 33.5 36.1 37.8
Other income 0.6 0.7 0.6 0.4 0.2 0.2
Total revenue and other income 458.5 518.5 496.4 532.3 615.0 679.1
Staff expenses -124.0 -112.2 -99.8 -104.4 -118.5 -153.1
Other operating expenses -143.1 -122.5 -112.8 -130.1 -142.3 -126.5
EBITDA 191.4 283.8 283.9 297.8 354.3 399.4
EBITDA margin 41.7% 54.7% 57.2% 55.9% 57.6% 58.8%
Depreciation and amortisation -16.6 -17.1 -15.1 -16.9 -23.4 -43.7
Operating profit before exceptional items
208.8 266.8 268.8 280.9 330.9 355.7
Exceptional items -44.6 -28.7 -10.0 -14.8 -21.5 -21.9
Other items -1.9 0.5 5.2 45.0 2.3 8.2
Profit before income tax 162.3 238.6 264.0 311.1 311.7 325.6
Income tax expense -44.1 -65.9 -67.0 -68.9 -94.1 -100.3
Non-controlling interests 0.0 0.0 0.0 0.9 1.7 -3.3
Profit for the year 118.2 172.7 197.0 241.3 216.0 222.0
54.7% 57.2% 55.9%
Reported earnings and dividend per share1)
EBITDA (in €m, based on 3rd party revenue)
Revenue (in €m, 3rd party revenue only)
496
20192014 2015 2016 2017 2018
519458
532
615
679
20192014 2015 2016 2017
284
2018
354
191
284 298
399
57.6% 58.8%41.7%
1.69
2.472.83
3.473.10 3.19
0.841.24 1.42
1.73 1.54 1.59
2014 20192015 2016 2017 2018
│ 60
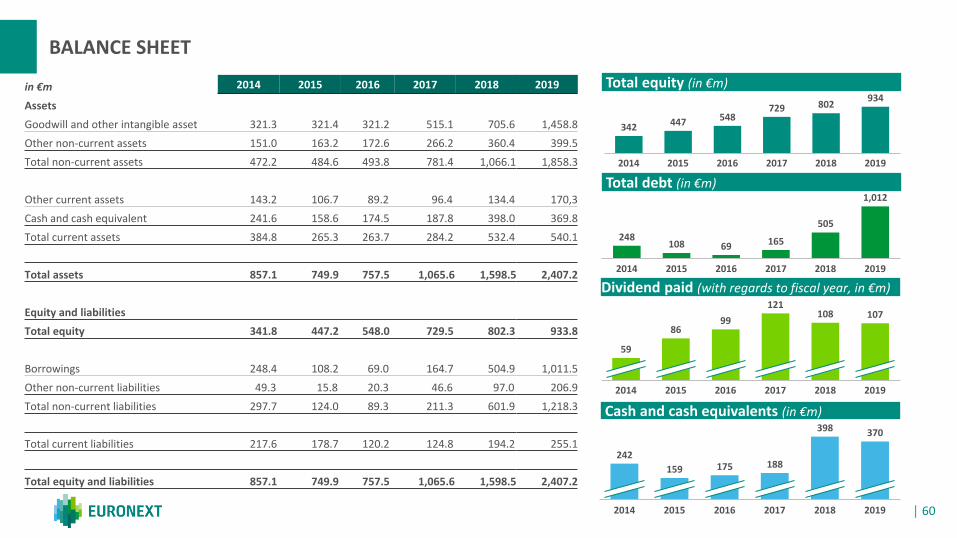
BALANCE SHEET
Dividend paid (with regards to fiscal year, in €m)
Cash and cash equivalents (in €m)
Total equity (in €m)
Total debt (in €m)
342 447 548729 802
934
20182017 20192014 2015 2016
248108 69 165
505
1,012
2014 20192015 2016 2017 2018
2019
108
2018
59
107
20172014 2015 2016
8699
121
159
2014 2015 2018
188
2016 2017 2019
242175
398 370
in €m 2014 2015 2016 2017 2018
Assets
Goodwill and other intangible asset 321.3 321.4 321.2 515.1 705.6
Other non-current assets 151.0 163.2 172.6 266.2 360.4
Total non-current assets 472.2 484.6 493.8 781.4 1,066.1
Other current assets 143.2 106.7 89.2 96.4 134.4
Cash and cash equivalent 241.6 158.6 174.5 187.8 398.0
Total current assets 384.8 265.3 263.7 284.2 532.4
Total assets 857.1 749.9 757.5 1,065.6 1,598.5
Equity and liabilities
Total equity 341.8 447.2 548.0 729.5 802.3
Borrowings 248.4 108.2 69.0 164.7 504.9
Other non-current liabilities 49.3 15.8 20.3 46.6 97.0
Total non-current liabilities 297.7 124.0 89.3 211.3 601.9
Total current liabilities 217.6 178.7 120.2 124.8 194.2
Total equity and liabilities 857.1 749.9 757.5 1,065.6 1,598.5
2019
1,458.8
399.5
1,858.3
170,3
369.8
540.1
2,407.2
933.8
1,011.5
206.9
1,218.3
255.1
2,407.2
│ 61
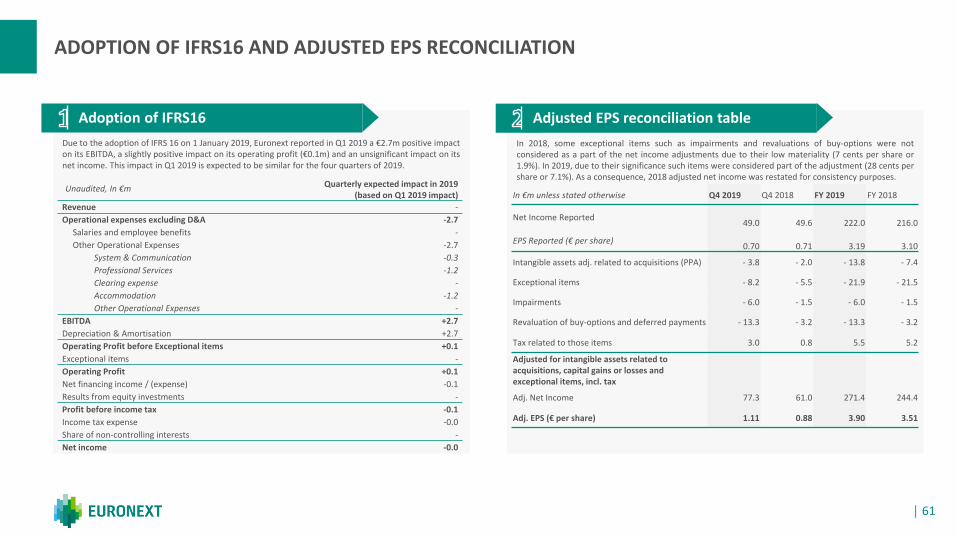
ADOPTION OF IFRS16 AND ADJUSTED EPS RECONCILIATION
Adoption of IFRS16 Adjusted EPS reconciliation table
Due to the adoption of IFRS 16 on 1 January 2019, Euronext reported in Q1 2019 a €2.7m positive impacton its EBITDA, a slightly positive impact on its operating profit (€0.1m) and an unsignificant impact on itsnet income. This impact in Q1 2019 is expected to be similar for the four quarters of 2019.
Unaudited, In €m Quarterly expected impact in 2019(based on Q1 2019 impact)
Revenue -
Operational expenses excluding D&A -2.7
Salaries and employee benefits -
Other Operational Expenses -2.7
System & Communication -0.3
Professional Services -1.2
Clearing expense -
Accommodation -1.2
Other Operational Expenses -
EBITDA +2.7
Depreciation & Amortisation +2.7
Operating Profit before Exceptional items +0.1
Exceptional items -
Operating Profit +0.1
Net financing income / (expense) -0.1
Results from equity investments -
Profit before income tax -0.1
Income tax expense -0.0
Share of non-controlling interests -
Net income -0.0
In €m unless stated otherwise Q4 2019 Q4 2018 FY 2019 FY 2018
Net Income Reported49.0 49.6 222.0 216.0
EPS Reported (€ per share)0.70 0.71 3.19 3.10
Intangible assets adj. related to acquisitions (PPA) - 3.8 - 2.0 - 13.8 - 7.4
Exceptional items - 8.2 - 5.5 - 21.9 - 21.5
Impairments - 6.0 - 1.5 - 6.0 - 1.5
Revaluation of buy-options and deferred payments - 13.3 - 3.2 - 13.3 - 3.2
Tax related to those items 3.0 0.8 5.5 5.2
Adjusted for intangible assets related to acquisitions, capital gains or losses and exceptional items, incl. tax
Adj. Net Income 77.3 61.0 271.4 244.4
Adj. EPS (€ per share) 1.11 0.88 3.90 3.51
In 2018, some exceptional items such as impairments and revaluations of buy-options were notconsidered as a part of the net income adjustments due to their low materiality (7 cents per share or1.9%). In 2019, due to their significance such items were considered part of the adjustment (28 cents pershare or 7.1%). As a consequence, 2018 adjusted net income was restated for consistency purposes.
│ 62
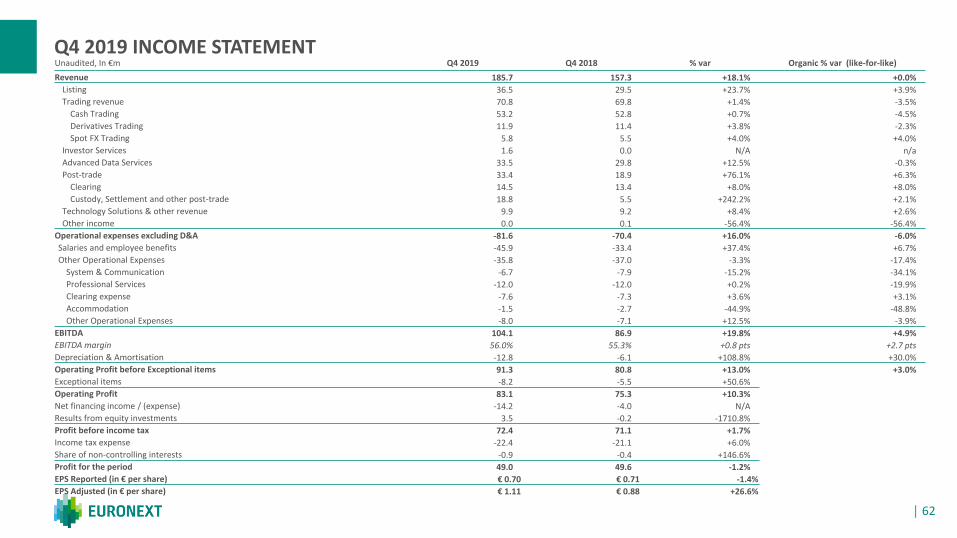
Q4 2019 INCOME STATEMENTUnaudited, In €m Q4 2019 Q4 2018 % var Organic % var (like-for-like)
Revenue 185.7 157.3 +18.1% +0.0%
Listing 36.5 29.5 +23.7% +3.9%
Trading revenue 70.8 69.8 +1.4% -3.5%
Cash Trading 53.2 52.8 +0.7% -4.5%
Derivatives Trading 11.9 11.4 +3.8% -2.3%
Spot FX Trading 5.8 5.5 +4.0% +4.0%
Investor Services 1.6 0.0 N/A n/a
Advanced Data Services 33.5 29.8 +12.5% -0.3%
Post-trade 33.4 18.9 +76.1% +6.3%
Clearing 14.5 13.4 +8.0% +8.0%
Custody, Settlement and other post-trade 18.8 5.5 +242.2% +2.1%
Technology Solutions & other revenue 9.9 9.2 +8.4% +2.6%
Other income 0.0 0.1 -56.4% -56.4%
Operational expenses excluding D&A -81.6 -70.4 +16.0% -6.0%
Salaries and employee benefits -45.9 -33.4 +37.4% +6.7%
Other Operational Expenses -35.8 -37.0 -3.3% -17.4%
System & Communication -6.7 -7.9 -15.2% -34.1%
Professional Services -12.0 -12.0 +0.2% -19.9%
Clearing expense -7.6 -7.3 +3.6% +3.1%
Accommodation -1.5 -2.7 -44.9% -48.8%
Other Operational Expenses -8.0 -7.1 +12.5% -3.9%
EBITDA 104.1 86.9 +19.8% +4.9%
EBITDA margin 56.0% 55.3% +0.8 pts +2.7 pts
Depreciation & Amortisation -12.8 -6.1 +108.8% +30.0%
Operating Profit before Exceptional items 91.3 80.8 +13.0% +3.0%
Exceptional items -8.2 -5.5 +50.6%
Operating Profit 83.1 75.3 +10.3%
Net financing income / (expense) -14.2 -4.0 N/A
Results from equity investments 3.5 -0.2 -1710.8%
Profit before income tax 72.4 71.1 +1.7%
Income tax expense -22.4 -21.1 +6.0%
Share of non-controlling interests -0.9 -0.4 +146.6%
Profit for the period 49.0 49.6 -1.2%
EPS Reported (in € per share) € 0.70 € 0.71 -1.4%
EPS Adjusted (in € per share) € 1.11 € 0.88 +26.6%
│ 63
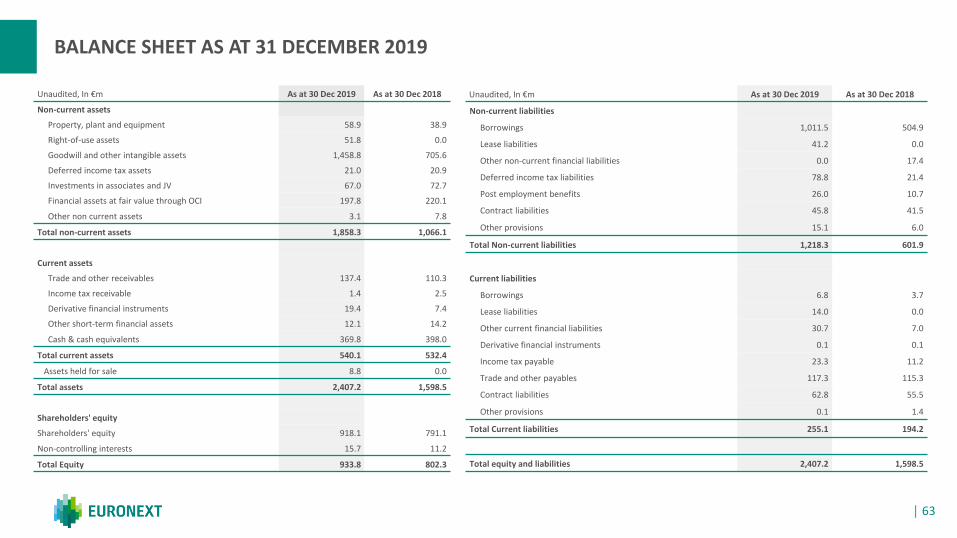
BALANCE SHEET AS AT 31 DECEMBER 2019
Unaudited, In €m As at 30 Dec 2019 As at 30 Dec 2018
Non-current assets
Property, plant and equipment 58.9 38.9
Right-of-use assets 51.8 0.0
Goodwill and other intangible assets 1,458.8 705.6
Deferred income tax assets 21.0 20.9
Investments in associates and JV 67.0 72.7
Financial assets at fair value through OCI 197.8 220.1
Other non current assets 3.1 7.8
Total non-current assets 1,858.3 1,066.1
Current assets
Trade and other receivables 137.4 110.3
Income tax receivable 1.4 2.5
Derivative financial instruments 19.4 7.4
Other short-term financial assets 12.1 14.2
Cash & cash equivalents 369.8 398.0
Total current assets 540.1 532.4
Assets held for sale 8.8 0.0
Total assets 2,407.2 1,598.5
Shareholders' equity
Shareholders' equity 918.1 791.1
Non-controlling interests 15.7 11.2
Total Equity 933.8 802.3
Unaudited, In €m As at 30 Dec 2019 As at 30 Dec 2018
Non-current liabilities
Borrowings 1,011.5 504.9
Lease liabilities 41.2 0.0
Other non-current financial liabilities 0.0 17.4
Deferred income tax liabilities 78.8 21.4
Post employment benefits 26.0 10.7
Contract liabilities 45.8 41.5
Other provisions 15.1 6.0
Total Non-current liabilities 1,218.3 601.9
Current liabilities
Borrowings 6.8 3.7
Lease liabilities 14.0 0.0
Other current financial liabilities 30.7 7.0
Derivative financial instruments 0.1 0.1
Income tax payable 23.3 11.2
Trade and other payables 117.3 115.3
Contract liabilities 62.8 55.5
Other provisions 0.1 1.4
Total Current liabilities 255.1 194.2
Total equity and liabilities 2,407.2 1,598.5
│ 64
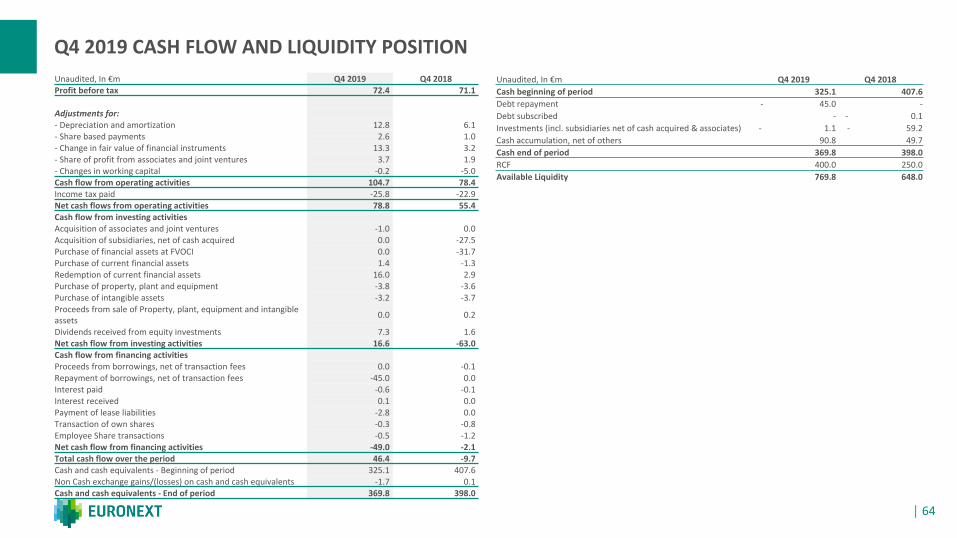
Q4 2019 CASH FLOW AND LIQUIDITY POSITION
Unaudited, In €m Q4 2019 Q4 2018
Cash beginning of period 325.1 407.6
Debt repayment - 45.0 -
Debt subscribed - - 0.1
Investments (incl. subsidiaries net of cash acquired & associates) - 1.1 - 59.2
Cash accumulation, net of others 90.8 49.7
Cash end of period 369.8 398.0
RCF 400.0 250.0
Available Liquidity 769.8 648.0
Unaudited, In €m Q4 2019 Q4 2018Profit before tax 72.4 71.1
Adjustments for:- Depreciation and amortization 12.8 6.1- Share based payments 2.6 1.0- Change in fair value of financial instruments 13.3 3.2- Share of profit from associates and joint ventures 3.7 1.9- Changes in working capital -0.2 -5.0Cash flow from operating activities 104.7 78.4Income tax paid -25.8 -22.9Net cash flows from operating activities 78.8 55.4Cash flow from investing activitiesAcquisition of associates and joint ventures -1.0 0.0Acquisition of subsidiaries, net of cash acquired 0.0 -27.5Purchase of financial assets at FVOCI 0.0 -31.7Purchase of current financial assets 1.4 -1.3Redemption of current financial assets 16.0 2.9Purchase of property, plant and equipment -3.8 -3.6Purchase of intangible assets -3.2 -3.7Proceeds from sale of Property, plant, equipment and intangible assets
0.0 0.2
Dividends received from equity investments 7.3 1.6Net cash flow from investing activities 16.6 -63.0Cash flow from financing activitiesProceeds from borrowings, net of transaction fees 0.0 -0.1Repayment of borrowings, net of transaction fees -45.0 0.0Interest paid -0.6 -0.1Interest received 0.1 0.0Payment of lease liabilities -2.8 0.0Transaction of own shares -0.3 -0.8Employee Share transactions -0.5 -1.2Net cash flow from financing activities -49.0 -2.1Total cash flow over the period 46.4 -9.7Cash and cash equivalents - Beginning of period 325.1 407.6Non Cash exchange gains/(losses) on cash and cash equivalents -1.7 0.1Cash and cash equivalents - End of period 369.8 398.0
│ 65
DISCLAIMER
This presentation is for information purposes only and is not a recommendation to engage in investment activities. The information and materials contained in this presentation are provided ‘asis’ and Euronext does not warrant as to the accuracy, adequacy or completeness of the information and materials and expressly disclaims liability for any errors or omissions. This presentationcontains materials produced by third parties and this content has been created solely by such third parties with no creative input from Euronext. It is not intended to be, and shall not constitutein any way a binding or legal agreement, or impose any legal obligation on Euronext. All proprietary rights and interest in or connected with this publication shall vest in Euronext. No part of itmay be redistributed or reproduced without the prior written permission of Euronext.This presentation may include forward-looking statements, which are based on Euronext’s current expectations and projections about future events. By their nature, forward-looking statementsinvolve known and unknown risks, uncertainties, assumptions and other factors because they relate to events and depend on circumstances that will occur in the future whether or not outsidethe control of Euronext. Such factors may cause actual results, performance or developments to differ materially from those expressed or implied by such forward-looking statements.Accordingly, no undue reliance should be placed on any forward-looking statements. Forward-looking statements speak only as at the date at which they are made. Euronext expressly disclaimsany obligation or undertaking to update, review or revise any forward-looking statements contained in this presentation to reflect any change in its expectations or any change in events,conditions or circumstances on which such statements are based unless required to do so by applicable law.Financial objectives are internal objectives of the Company to measure its operational performance and should not be read as indicating that the Company is targeting such metrics for anyparticular fiscal year. The Company’s ability to achieve these financial objectives is inherently subject to significant business, economic and competitive uncertainties and contingencies, many ofwhich are beyond the Company’s control, and upon assumptions with respect to future business decisions that are subject to change. As a result, the Company’s actual results may vary fromthese financial objectives, and those variations may be material.Efficiencies are net, before tax and on a run-rate basis, ie taking into account the full-year impact of any measure to be undertaken before the end of the period mentioned. The expectedoperating efficiencies and cost savings were prepared on the basis of a number of assumptions, projections and estimates, many of which depend on factors that are beyond the Company’scontrol. These assumptions, projections and estimates are inherently subject to significant uncertainties and actual results may differ, perhaps materially, from those projected. The Companycannot provide any assurance that these assumptions are correct and that these projections and estimates will reflect the Company's actual results of operations
Euronext refers to Euronext N.V. and its affiliates. Information regarding trademarks and intellectual property rights of Euronext is located at https://www.euronext.com/terms-use.© 2020, Euronext N.V. - All rights reserved.

INVESTOR RELATIONS
Aurélie Cohen, Head of Investor Relations
Clément Kubiak, Investor Relations officer
+33 1 70 48 24 27
www.euronext.com/en/investor-relations