Embed Size (px)
Citation preview
1
Thermometry
EUROMET Project No 895
INTERCOMPARISON OF WATER TRIPLE POINT CELLS
Final Report
P.P.M. Steur Intermediate Temperature Laboratory
Phone : 39 011 3919 740 Fax : 39 011 3919 747 Email : [email protected]
Istituto Nazionale di Ricerca Metrologica Strada delle Cacce 91 10135 TORINO Italy
2
INDEX
Abstract 3
Introduction and Background 3
Euromet 895 Results 4 Immersion Profiles 5 Comparison Measurements 11 Bilateral Equivalence 14
Additional (direct) Comparison with Polish Standard 15
Uncertainty 17
References 18
Appendix. 19

3
Abstract In 2002 the Comité Consultatif de Thermométrie (CCT) started a key-comparison of water triple point cells, CCT-K7, where INRIM (at the time still IMGC-CNR) participated among relatively few laboratories on a world-scale. The results of this comparison are now being linked to other national laboratories at the regional scale. In Europe, the regional comparison is organized by Euromet and is designated as Euromet.T-K7. Pilot is NMi-VSL (NL) and INRiM acts as one of several sub-pilots. In Euromet.T-K7 only one national laboratory participates per country. In Poland, however, the National Temperature Scale is maintained by two distinct National Laboratories, by GUM (Warsaw) for long-stem thermometers at temperatures above the Argon Triple Point, and by INTiBS (Wroclaw) for capsule thermometers at temperatures below the Water Triple Point. Since both laboratories use the Water Triple Point but only GUM participates in Euromet.T-K7, a separate bilateral comparison was set up with INRiM, as CCT-K7 participant, in order to create a direct reference to CCT-K7 for INTiBS.
Introduction and Background The triple point of water is the fixed point for the realization of the kelvin and the pivotal reference point for the International Temperature Scale of 1990 (ITS-90). It is therefore of utmost importance to improve the accuracy of its realization. The first really world-over comparison of water triple point (WTP) cells has been initiated by the Comité Consultatif de Thermométrie (CCT) in 2002 as Key Comparison K7 (CCT-K7), and was conducted by the Bureau International des Poids et Mésures (BIPM) itself, acting as pilot. As many as 21 laboratories from all over the world participated. Participation required each lab to select a suitable transfer cell, compare this cell with its National Standards and bring the transfer cell to the BIPM. At the BIPM all these transfer cells were then compared with a set of reference cells of the BIPM. After the comparison at the BIPM, each participating lab then brought their transfer cell back to their own lab where a (return-)comparison was performed against the National Standard. Finally, a Key Comparison Reference Value (KCRV) was determined on the basis of the results from all the cells1. The report of CCT-K7 [1] showed clearly the importance of isotopic composition for the realised temperature of a certain WTP cell, and thus that isotopic analysis on the water content is necessary for each WTP cell. This realisation stimulated the formation of an ad-hoc CCT Task Group on the Triple Point of Water. The terms of reference for the Task Group were:
• to clarify the definition of the realized triple point of water in the ITS-90 with respect to isotopic composition,
• to identify a correction algorithm and associated uncertainty, if deemed appropriate, for deviation of isotopic composition from the defined or nominal composition,
• to identify any necessary changes to the documentation of the ITS-90 or the definition of the kelvin, and
• to prepare recommendations to the CCT on the above topics. The ensuing CCT Recommendation T1 (2005) to the CIPM, subsequently taken over by the CIPM as Recommendation 2 (CI-2005) [2], then clarified the SI definition of the kelvin and the ITS-90 definition of the triple point of water (TPW) by explicitly specifying the isotopic composition of the water. 1 A very limited number of transfer cells showed clear signs of impurity, and were thus not taken into account for the KCRV.

4
Considering that many laboratories have started, since CCT-K7, to acquire cells with known isotopic composition it was expected at the start of Euromet.T-K7 that more information will become available on the dispersion among cells that are corrected for isotopic composition, and, therefore, comply with CCT Recommendation T1 (2005).
Euromet 895 Results In order to maintain as close a link as possible, the Protocols of CCT-K7 and EUROMET.T-K7 were followed. Thus, at INTiBS the transfer cell was compared with the local National Standard, June 2006, before sending it to INRiM, where it was compared with the Italian National Standard, July and October 2006. After return to INTiBS, the transfer cell was once more compared with the local National Standard, July and October 2007. Each comparison used separate ice mantles, with up to 10 measurements on each mantle. The comparison at INRiM occurred in parallel with the EUROMET.T-K7 measurements. During the EUROMET comparison, it was found at INRiM that the cells in the National Standard having a wide thermometer well showed an anomalous behaviour, even though they were equipped with aluminium bushing in order to improve thermal contact. One of these cells had acted as transfer cell for CCT-K7. The anomalous behaviour caused the direct link to CCT-K7 to be put into doubt. Only after many subsequent experiments the cause for this behaviour was found and eliminated [3], thus re-establishing the direct link to CCT-K7. So unfortunately, during the measurements for EUROMET-895, this CCT-K7 transfer cell could not be used, and only two cells, IMGC-31 and IMGC-34 were kept for reference, since they have shown to have remained stable throughout the years. In effect, when the CCT-K7 transfer cell was rehabilitated, it showed a very close agreement with the two IMGC cells, to within a few μK, after correction for isotopic composition and hydrostatic head, thus supplying strong support for the use of the IMGC cells as a substitute link to CCT-K7. The equipment used for the comparison is summarized in Tables 1 and 2, while the measurement results are given in Tables 3-7. All reported values are already corrected for thermometer selfheating and for hydrostatic head. The ice mantles at both INTiBS and at INRiM were prepared with the same method, i.e. using a liquid-nitrogen-cooled copper rod. The INTiBS measurement report is reproduced in Appendix 1. The transfer cell supplied by INTiBS is a relatively small, narrow cell produced by UME (Turkey), cell UME-51, exhibiting an immersion depth of 225 mm, while customary cells have an immersion depth of about 260 mm. Table 1 Equipment used at INTiBS for the comparison
Description of national reference (1 or several cells, purchase or manufacture date, isotopic analysis): Water Triple Point Cell, ISOTECH Type B11/50 Serial No:B11/50/465 Isotopic Composition:
delta 18O= - 0,426 m Mole/Mole; delta 2H = - 18,69 m Mole/Mole resulting in a correction of 12 μK (U = 1.3 μK)
Type of resistance bridge, AC or DC: Measurements International Model 6015T, Serial No:1100328 - DC Measurement current: 1 mA, 1,41 mA Number and sampling frequency of repeated measurements: 100, 4 s Type of reference resistor:

5
25 Ω, Tinsley Type 5685A serial No 274748 with thermostat Type 5648 Is reference resistor temperature-controlled? (If yes, state stability): Yes, control ratio of 30 Type of thermometer, length of sensor: In the first ice mantle: CSPRT L&N 1866336, 5 cm;
In the second and third mantles: SPRT FLUKE - Hart No: 4113, 3,6 cm Storage container for WTP cells: Isotech Model ITL M 18233, No: 2515014-4 Table 2 Equipment used at INRiM for the comparison
Description of national reference (1 or several cells, purchase or manufacture date, isotopic analysis): IMGC-31, IMGC-34 (manufactured before 1993) and HART 1322 (purchased in 2002,
together with HART 1054 which now showed a strong drifting behaviour and is therefore eliminated from the Natl. Standard). Isotopic analysis is provided by IAEA (Vienna) and ISO4 (Torino).
Isotopic Composition: delta 18O= - 11,79 m Mole/Mole; delta 2H = - 81,45 m Mole/Mole resulting in a correction of 58,7 μK (U = 1,6 μK)
Type of resistance bridge, AC or DC: AC (ASL-F18) Measurement current: 2 mA Number and sampling frequency of repeated measurements: 16, with bridge frequency at 25 Hz Type of reference resistor: Tinsley 5685A, 100 Ω Is reference resistor temperature-controlled? (If yes, state stability): Yes, stability is 0.1 °C Type of thermometer, length of sensor: Leeds&Northrup 8167-25, sensor length 25 mm Storage container for WTP cells: ISOTECH Maintenance bath
Immersion Profiles One of the initial requirements of the Protocol(s) to be fulfilled is the measurement of the immersion profile on the transfer cell and the local reference, as a proxy of measurement capability. The profiles measured are shown in Figs. 1 and 2, with the data given in Tables 3 to 7. Table 3 Immersion profile data for the transfer cell as measured at INTiBS.

6
Distance from the bottom / mm Temperature variation / μK ITS-90 variation / μK 0 0 0 20 23 14.6 40 11 29.2 60 21 43.8 80 60 58.4 100 101 73
Table 4 Immersion profile data for the Polish National Standard cell N° 465, as measured at
INTiBS.
Distance from the bottom / mm Temperature variation / μK ITS-90 variation / μK 0 0 0 30 15 21.9 50 9 36.5 70 35 51.1 90 63 65.7 110 77 80.3 130 91 94.9 150 91 109.5 170 121 124.1
Transfer cell immersion profile at INTiBS
0
20
40
60
80
100
120
0 10 20 30 40 50 60 70 80 90 100Distance from bottom / mm
Tem
pera
ture
cha
nge
/ μK
MeasuredITS-90
Fig 1 Immersion profile of the transfer cell as measured at INTiBS.

7
Table 5 Immersion profile data for the transfer cell as measured at INRiM.
Distance from the bottom / mm Temperature variation / μK ITS-90 variation / μK 0 0 0 10 -14 7.3 20 -31 14.6 40 88 29.2 50 60 43.8 80 91 58.4 100 64 73.0 120 115 87.6
Immersion profile for cell INTiBS N° 465
0
20
40
60
80
100
120
140
0 20 40 60 80 100 120 140 160 180
Distance from bottom / mm
Tem
pera
ture
cha
nge
/ μK
MeasuredITS-90
Fig 2 Immersion profile of cell N° 465 (local Standard) as measured at INTiBS
8
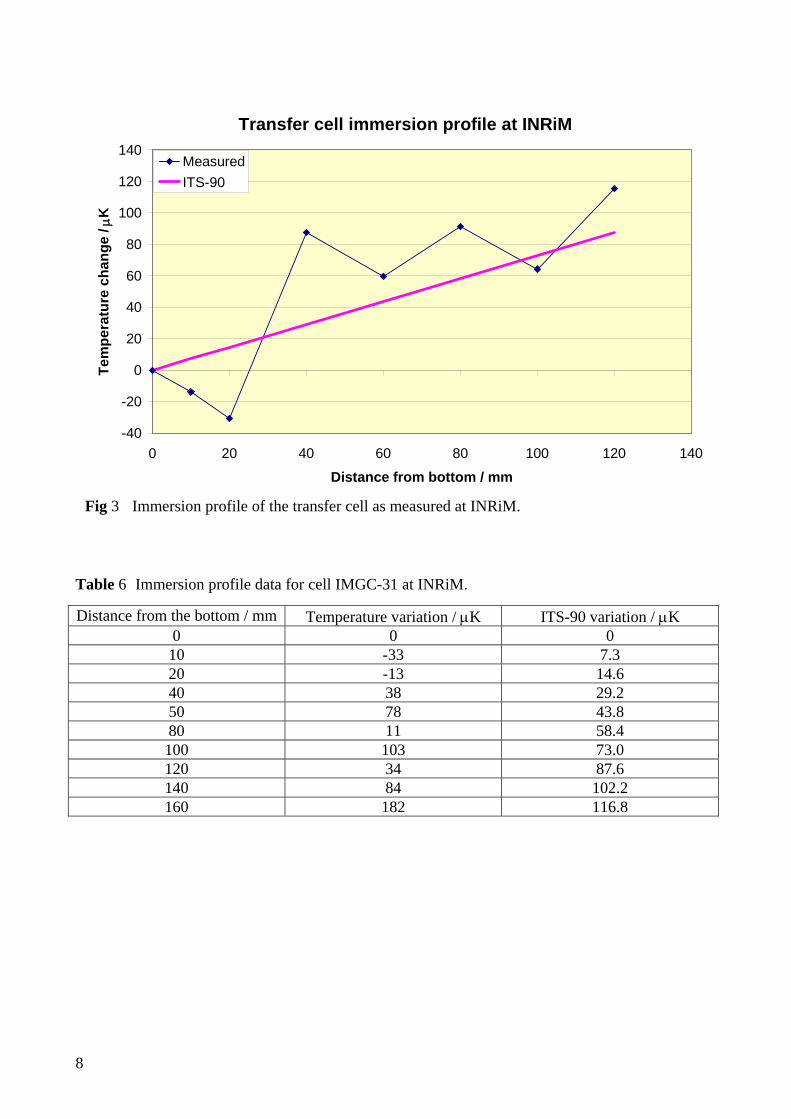
Table 6 Immersion profile data for cell IMGC-31 at INRiM.
Distance from the bottom / mm Temperature variation / μK ITS-90 variation / μK 0 0 0 10 -33 7.3 20 -13 14.6 40 38 29.2 50 78 43.8 80 11 58.4 100 103 73.0 120 34 87.6 140 84 102.2 160 182 116.8
Transfer cell immersion profile at INRiM
-40
-20
0
20
40
60
80
100
120
140
0 20 40 60 80 100 120 140
Distance from bottom / mm
Tem
pera
ture
cha
nge
/ μK
MeasuredITS-90
Fig 3 Immersion profile of the transfer cell as measured at INRiM.

9
Table 7 Immersion profile data for cell IMGC-34 at INRiM.
Distance from the bottom / mm Temperature variation / μK ITS-90 variation / μK 0 0 0 10 -21 7.3 20 2 14.6 40 24 29.2 50 77 43.8 80 80 58.4 100 76 73.0 120 110 87.6 140 138 102.2 160 198 116.8
Immersion profile of cell IMGC-31 at INRiM
-50
0
50
100
150
200
0 20 40 60 80 100 120 140 160 180
Distance from bottom / mm
Tem
pera
ture
cha
nge
/ μK
MeasuredITS-90
Fig. 4 Immersion profile for cell IMGC-31, measured at INRiM

10
As can be seen from Figs. 1 to 5, the immersion profiles measured at INTiBS and INRiM follow the ITS-90 profile quite well, unlike some of the profiles obtained during CCT-K7, thus confirming the measurement capabilities of the two laboratories.
Immersion profile of cell IMGC-34 at INRiM
-50
0
50
100
150
200
250
0 20 40 60 80 100 120 140 160 180
Distance from bottom / mm
Tem
pera
ture
cha
nge
/ μK
MeasuredITS-90
Fig. 5 Immersion profile for cells IMGC-34, measured at INRiM
11
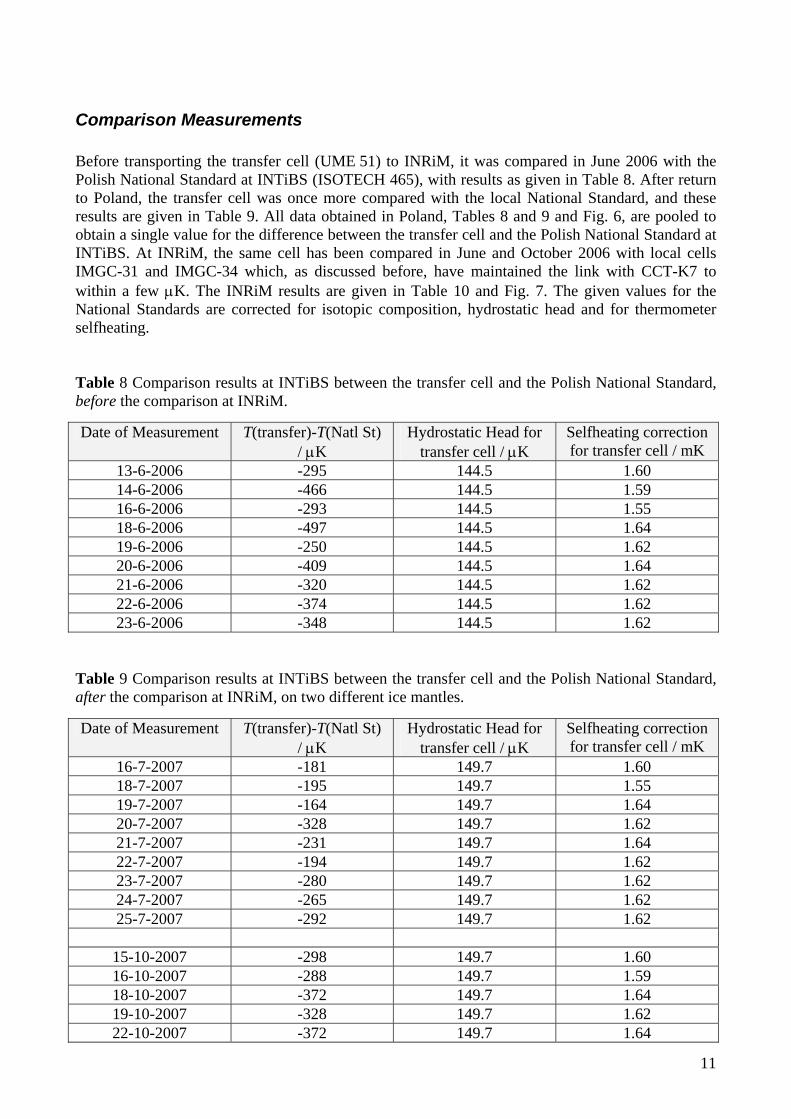
Comparison Measurements Before transporting the transfer cell (UME 51) to INRiM, it was compared in June 2006 with the Polish National Standard at INTiBS (ISOTECH 465), with results as given in Table 8. After return to Poland, the transfer cell was once more compared with the local National Standard, and these results are given in Table 9. All data obtained in Poland, Tables 8 and 9 and Fig. 6, are pooled to obtain a single value for the difference between the transfer cell and the Polish National Standard at INTiBS. At INRiM, the same cell has been compared in June and October 2006 with local cells IMGC-31 and IMGC-34 which, as discussed before, have maintained the link with CCT-K7 to within a few μK. The INRiM results are given in Table 10 and Fig. 7. The given values for the National Standards are corrected for isotopic composition, hydrostatic head and for thermometer selfheating. Table 8 Comparison results at INTiBS between the transfer cell and the Polish National Standard, before the comparison at INRiM.
Date of Measurement T(transfer)-T(Natl St) / μK
Hydrostatic Head for transfer cell / μK
Selfheating correction for transfer cell / mK
13-6-2006 -295 144.5 1.60 14-6-2006 -466 144.5 1.59 16-6-2006 -293 144.5 1.55 18-6-2006 -497 144.5 1.64 19-6-2006 -250 144.5 1.62 20-6-2006 -409 144.5 1.64 21-6-2006 -320 144.5 1.62 22-6-2006 -374 144.5 1.62 23-6-2006 -348 144.5 1.62
Table 9 Comparison results at INTiBS between the transfer cell and the Polish National Standard, after the comparison at INRiM, on two different ice mantles.
Date of Measurement T(transfer)-T(Natl St) / μK
Hydrostatic Head for transfer cell / μK
Selfheating correction for transfer cell / mK
16-7-2007 -181 149.7 1.60 18-7-2007 -195 149.7 1.55 19-7-2007 -164 149.7 1.64 20-7-2007 -328 149.7 1.62 21-7-2007 -231 149.7 1.64 22-7-2007 -194 149.7 1.62 23-7-2007 -280 149.7 1.62 24-7-2007 -265 149.7 1.62 25-7-2007 -292 149.7 1.62
15-10-2007 -298 149.7 1.60 16-10-2007 -288 149.7 1.59 18-10-2007 -372 149.7 1.64 19-10-2007 -328 149.7 1.62 22-10-2007 -372 149.7 1.64

12
23-10-2007 -263 149.7 1.62 24-10-2007 -385 149.7 1.62 25-10-2007 -322 149.7 1.62 26-10-2007 -216 149.7 1.62
The mean value for the difference between the transfer cell and the National Standard at INTiBS, as obtained from Tables 8 and 9, is -304.7 μK, with a standard deviation of 82.7 μK and a standard deviation of the mean (27 values) of 16.2 μK. Table 10 Comparison results at INRiM between the transfer cell and the Italian National Standard, represented by cells IMGC-31 and IMGC34, at two different ice mantles.
Date of Measurement T(transfer)-T(Natl St) / μK
Hydrostatic Head for transfer cell / μK
Selfheating correction for transfer cell / mK
12-7-2006 -80 146.0 2.26 13-7-2006 -212 146.0 2.22 14-7-2006 -90 146.0 2.15 17-7-2006 -119 146.0 2.23 18-7-2006 -91 146.0 2.25
23-10-2006 -83 146.0 2.12 24-10-2006 -89 146.0 2.13 25-10-2006 -180 146.0 2.16
Comparison at INTiBS, UME 51 - ISOTECH 465
-600
-500
-400
-300
-200
-100
0
0 5 10 15 20 25 30
Measurement number
d T / μK
1st ice mantle (before) - June 20061st ice mantle (after) - July 20072nd ice mantle (after) - July 2007
Fig. 6 Comparison results at INTiBS between the transfer cell and the Polish National Standard at INTiBS

13
25-10-2006 -86 146.0 2.12 26-10-2006 -98 146.0 2.07 27-10-2006 -186 146.0 2.22
The mean value for the difference between the transfer cell and the Italian National Standard represented by cells IMGC-31 and IMGC-34 (Table 10) is -119.0 μK, with a standard deviation of 49.5 μK and a standard deviation of the mean (11 values) of 15.7 μK.
Cell(X) - Cell(IMGC34)
-600
-500
-400
-300
-200
-100
0
0 2 4 6 8 10 12Measurement number
d T / μK
IMGC31INTIBS-UME
1st ice mantle ( (July 2007) 2nd ice mantle (October 2007)
Fig.7 Comparison results at INRiM between the transfer cell and the Italian National Standard cells IMGC-31 and IMGC-34

14
Bilateral Equivalence On the basis of the comparison of the transfer cell with the Polish National Standard and the Italian National Standard, the difference between the Polish and Italian National Standards, the degree of equivalence Dij = Ti – Tj, is computed as
DPl-It = + 186 μK, with a standard uncertainty of
uPl-It = 69.9 μK, obtained by summation in quadrature of the individual standard deviations of the mean for the difference between the transfer cell and the local National Standard as measured at INRiM and at INTiBS and the declared uncertainty from the respective budgets (Tables 12 and 13). The extended standard uncertainty is thus
UPl-It = 140 μK. The value for the quantified demonstrated quivalence at the 95% level, QDE0.95, is computed as
QDE0.95 = 301.0 μK, using the expression [4]:
[ ]{ } ijijijij uuDDjiQDE /05.4exp3295.0645.1),(95.0 −∗++= with Dij and uij as defined above, where i = Pl and j = It.
15
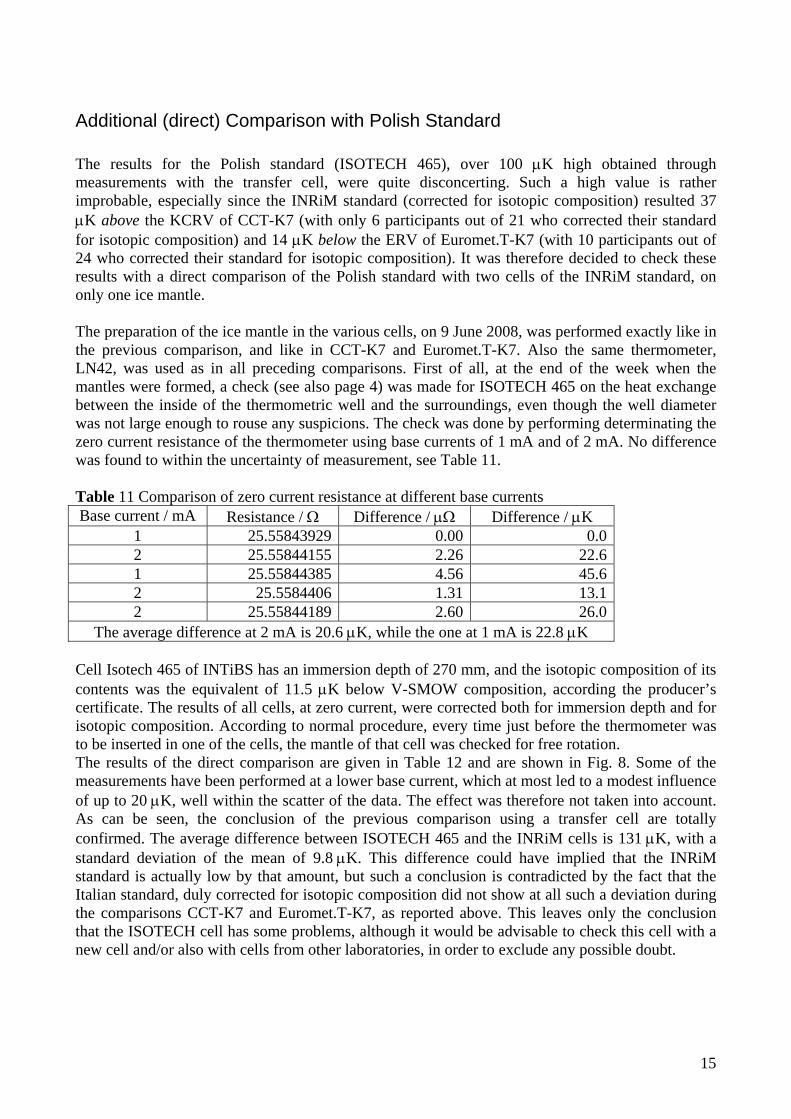
Additional (direct) Comparison with Polish Standard The results for the Polish standard (ISOTECH 465), over 100 μK high obtained through measurements with the transfer cell, were quite disconcerting. Such a high value is rather improbable, especially since the INRiM standard (corrected for isotopic composition) resulted 37 μK above the KCRV of CCT-K7 (with only 6 participants out of 21 who corrected their standard for isotopic composition) and 14 μK below the ERV of Euromet.T-K7 (with 10 participants out of 24 who corrected their standard for isotopic composition). It was therefore decided to check these results with a direct comparison of the Polish standard with two cells of the INRiM standard, on only one ice mantle. The preparation of the ice mantle in the various cells, on 9 June 2008, was performed exactly like in the previous comparison, and like in CCT-K7 and Euromet.T-K7. Also the same thermometer, LN42, was used as in all preceding comparisons. First of all, at the end of the week when the mantles were formed, a check (see also page 4) was made for ISOTECH 465 on the heat exchange between the inside of the thermometric well and the surroundings, even though the well diameter was not large enough to rouse any suspicions. The check was done by performing determinating the zero current resistance of the thermometer using base currents of 1 mA and of 2 mA. No difference was found to within the uncertainty of measurement, see Table 11. Table 11 Comparison of zero current resistance at different base currents Base current / mA Resistance / Ω Difference / μΩ Difference / μK
1 25.55843929 0.00 0.0 2 25.55844155 2.26 22.6 1 25.55844385 4.56 45.6 2 25.5584406 1.31 13.1 2 25.55844189 2.60 26.0
The average difference at 2 mA is 20.6 μK, while the one at 1 mA is 22.8 μK Cell Isotech 465 of INTiBS has an immersion depth of 270 mm, and the isotopic composition of its contents was the equivalent of 11.5 μK below V-SMOW composition, according the producer’s certificate. The results of all cells, at zero current, were corrected both for immersion depth and for isotopic composition. According to normal procedure, every time just before the thermometer was to be inserted in one of the cells, the mantle of that cell was checked for free rotation. The results of the direct comparison are given in Table 12 and are shown in Fig. 8. Some of the measurements have been performed at a lower base current, which at most led to a modest influence of up to 20 μK, well within the scatter of the data. The effect was therefore not taken into account. As can be seen, the conclusion of the previous comparison using a transfer cell are totally confirmed. The average difference between ISOTECH 465 and the INRiM cells is 131 μK, with a standard deviation of the mean of 9.8 μK. This difference could have implied that the INRiM standard is actually low by that amount, but such a conclusion is contradicted by the fact that the Italian standard, duly corrected for isotopic composition did not show at all such a deviation during the comparisons CCT-K7 and Euromet.T-K7, as reported above. This leaves only the conclusion that the ISOTECH cell has some problems, although it would be advisable to check this cell with a new cell and/or also with cells from other laboratories, in order to exclude any possible doubt.

16
Direct comparison between Isotech 465 (INTiBS) and the two INRIM cells(i = 2 mA)
-40
-20
0
20
40
60
80
100
120
140
160
13-giu-08 14-giu-08 15-giu-08 16-giu-08 17-giu-08 18-giu-08 19-giu-08 20-giu-08 21-giu-08
Date
d T / μK
IMGC31Hart1322Isotech 465
1 mA1 mA

17
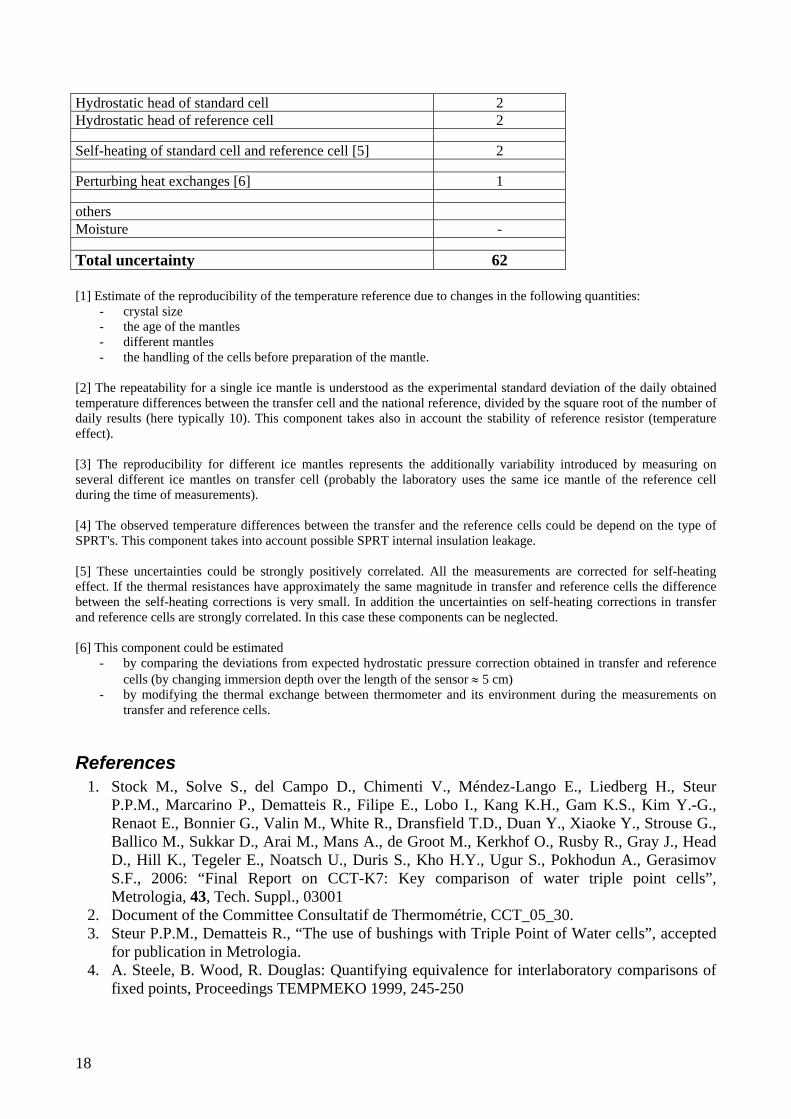
Uncertainty The uncertainty budgets for the comparison at INTiBS and at INRiM are reported in Tables 12 and 13. Table 12 Uncertainty budget, in μK, for the measurements at INRiM, at k = 1. Origin Contribution (k=1) National reference (Uncertainties related only to properties of the reference cell) Chemical impurities (from nr of distillation cycles) 6 Isotopic variation (from analysis certificate) 1 Residual gas pressure in cell 10 Reproducibility [1] 14
Comparison of transfer cell to national reference (Uncertainties related to the comparison of the four cells) Repeatability for a single ice mantel (incl. bridge noise) [2] 11 Reproducibility for different ice mantles [3] 1 Reproducibility for different types of SPRTs [4] - Hydrostatic head of standard cell 3 Hydrostatic head of reference cell 3 Self-heating of standard cell and reference cell [5] 6 Perturbing heat exchanges [6] 1 others Moisture 1
Total uncertainty 23 Table 13 Uncertainty budget, in μK, for the measurements at INTiBS. Origin Contribution (k=1) National reference (Uncertainties related only to properties of the reference cell) Chemical impurities (from certificate) 50 Isotopic variation (from certificate) 2 Residual gas pressure in cell 2 Reproducibility [1] 29
Comparison of transfer cell to national reference (Uncertainties related to the comparison of the four cells) Repeatability for a single ice mantel (incl. bridge noise) [2] 16 Reproducibility for different ice mantles [3] 11 Reproducibility for different types of SPRTs [4] 11
18
Hydrostatic head of standard cell 2 Hydrostatic head of reference cell 2 Self-heating of standard cell and reference cell [5] 2 Perturbing heat exchanges [6] 1 others Moisture -
Total uncertainty 62 [1] Estimate of the reproducibility of the temperature reference due to changes in the following quantities:
- crystal size - the age of the mantles - different mantles - the handling of the cells before preparation of the mantle.
[2] The repeatability for a single ice mantle is understood as the experimental standard deviation of the daily obtained temperature differences between the transfer cell and the national reference, divided by the square root of the number of daily results (here typically 10). This component takes also in account the stability of reference resistor (temperature effect). [3] The reproducibility for different ice mantles represents the additionally variability introduced by measuring on several different ice mantles on transfer cell (probably the laboratory uses the same ice mantle of the reference cell during the time of measurements). [4] The observed temperature differences between the transfer and the reference cells could be depend on the type of SPRT's. This component takes into account possible SPRT internal insulation leakage. [5] These uncertainties could be strongly positively correlated. All the measurements are corrected for self-heating effect. If the thermal resistances have approximately the same magnitude in transfer and reference cells the difference between the self-heating corrections is very small. In addition the uncertainties on self-heating corrections in transfer and reference cells are strongly correlated. In this case these components can be neglected. [6] This component could be estimated
- by comparing the deviations from expected hydrostatic pressure correction obtained in transfer and reference cells (by changing immersion depth over the length of the sensor ≈ 5 cm)
- by modifying the thermal exchange between thermometer and its environment during the measurements on transfer and reference cells.
References 1. Stock M., Solve S., del Campo D., Chimenti V., Méndez-Lango E., Liedberg H., Steur
P.P.M., Marcarino P., Dematteis R., Filipe E., Lobo I., Kang K.H., Gam K.S., Kim Y.-G., Renaot E., Bonnier G., Valin M., White R., Dransfield T.D., Duan Y., Xiaoke Y., Strouse G., Ballico M., Sukkar D., Arai M., Mans A., de Groot M., Kerkhof O., Rusby R., Gray J., Head D., Hill K., Tegeler E., Noatsch U., Duris S., Kho H.Y., Ugur S., Pokhodun A., Gerasimov S.F., 2006: “Final Report on CCT-K7: Key comparison of water triple point cells”, Metrologia, 43, Tech. Suppl., 03001
2. Document of the Committee Consultatif de Thermométrie, CCT_05_30. 3. Steur P.P.M., Dematteis R., “The use of bushings with Triple Point of Water cells”, accepted
for publication in Metrologia. 4. A. Steele, B. Wood, R. Douglas: Quantifying equivalence for interlaboratory comparisons of
fixed points, Proceedings TEMPMEKO 1999, 245-250
19
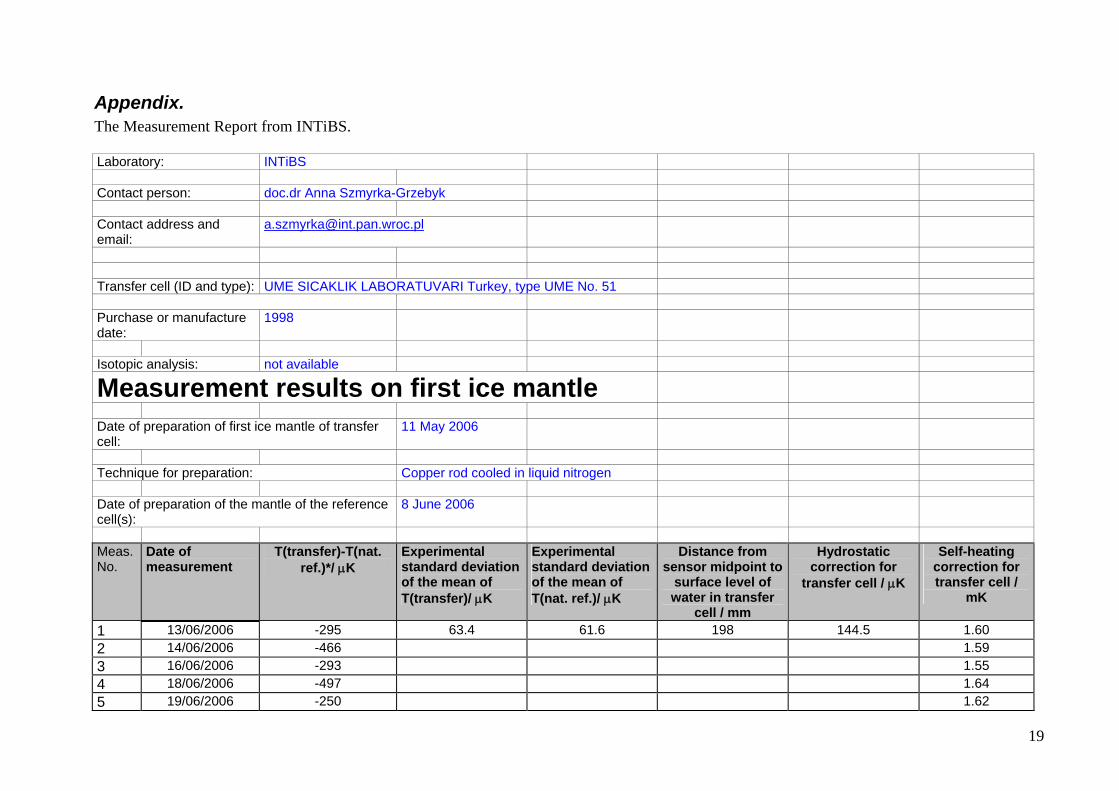
Appendix. The Measurement Report from INTiBS. Laboratory: INTiBS
Contact person: doc.dr Anna Szmyrka-Grzebyk
Contact address and email:
Transfer cell (ID and type): UME SICAKLIK LABORATUVARI Turkey, type UME No. 51
Purchase or manufacture date:
1998
Isotopic analysis: not available
Measurement results on first ice mantle
Date of preparation of first ice mantle of transfer cell:
11 May 2006
Technique for preparation: Copper rod cooled in liquid nitrogen Date of preparation of the mantle of the reference cell(s):
8 June 2006
Meas.No.
Date of measurement
T(transfer)-T(nat. ref.)*/ μK
Experimental standard deviation of the mean of T(transfer)/ μK
Experimental standard deviation of the mean of T(nat. ref.)/ μK
Distance from sensor midpoint to
surface level of water in transfer
cell / mm
Hydrostatic correction for
transfer cell / μK
Self-heating correction for transfer cell /
mK
1 13/06/2006 -295 63.4 61.6 198 144.5 1.60 2 14/06/2006 -466 1.59 3 16/06/2006 -293 1.55 4 18/06/2006 -497 1.64 5 19/06/2006 -250 1.62

20
6 20/06/2006 -409 1.64 7 21/06/2006 -320 1.62 8 22/06/2006 -374 1.62 9 23/06/2006 -348 1.62
* The temperature differences should already be corrected for hydrostatic head and self-heating effects. The temperature of the transfer cell must not be corrected for isotopic composition. The temperature of the national reference should be corrected for isotopic composition in case isotopic analysis is available.
Measurement results on second ice mantle
Date of preparation of second ice mantle of transfer cell:
10 July 2007
Technique for preparation: Copper rod cooled in liquid nitrogen Date of preparation of the mantle of the reference cell(s):
10 July 2007
Meas.No.
Date of measurement
T(transfer)-T(nat. ref.)*/ μK
Experimental standard deviation
of the mean of T(transfer) /μK
Experimental standard deviation
of the mean of T(nat. ref.) / μK
Distance from sensor midpoint to
surface level of water in transfer
cell / mm
Hydrostatic correction for transfer cell / μK
Self-heating correction for
transfer cell /mK
1 2007/07/16 -181 27.1 16.8 205 149.7 1.600 2 2007/07/18 -195 1.550 3 2007/07/19 -164 1.640 4 2007/07/20 -328 1.620 5 2007/07/21 -231 1.640 6 2007/07/22 -194 1.620 7 2007/07/23 -280 1.620 8 2007/07/24 -265 1.620 9 2007/07/25 -292 1.620 10 * The temperature differences should already be corrected for hydrostatic head and self-heating effects. The temperature of the transfer cell
21
must not be corrected for isotopic composition. The temperature of the national reference should be corrected for isotopic composition in case isotopic analysis is available.
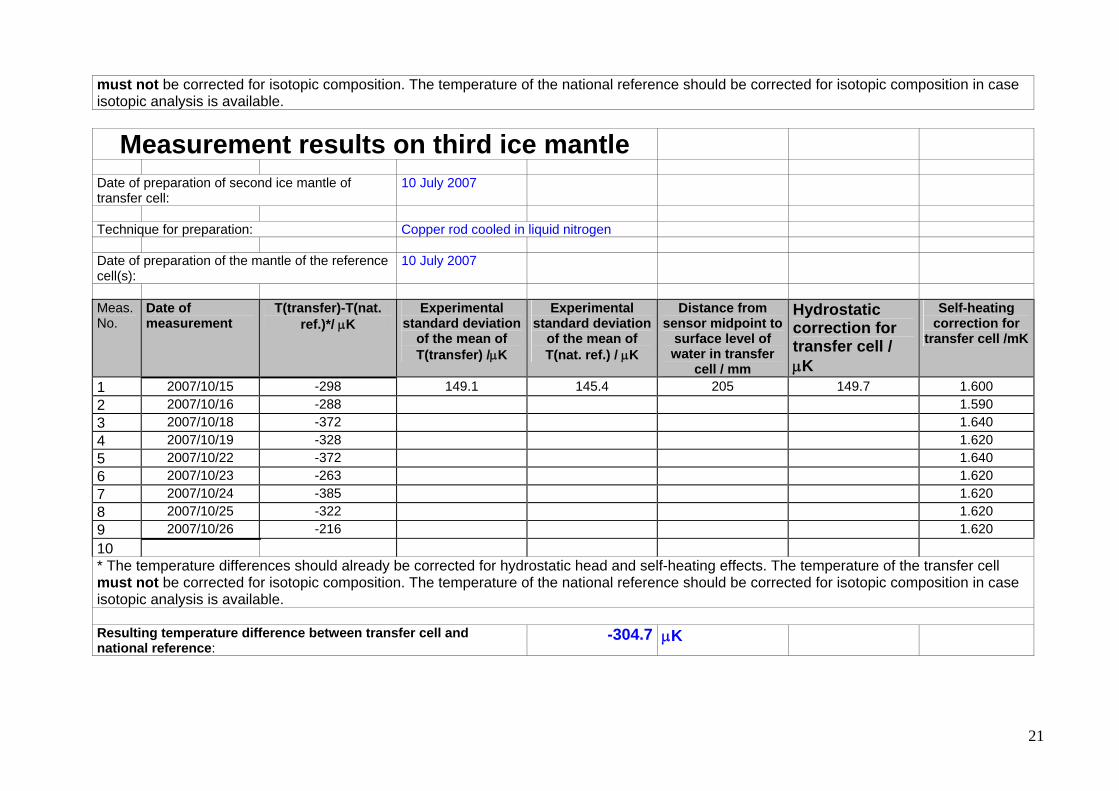
Measurement results on third ice mantle
Date of preparation of second ice mantle of transfer cell:
10 July 2007
Technique for preparation: Copper rod cooled in liquid nitrogen Date of preparation of the mantle of the reference cell(s):
10 July 2007
Meas.No.
Date of measurement
T(transfer)-T(nat. ref.)*/ μK
Experimental standard deviation
of the mean of T(transfer) /μK
Experimental standard deviation
of the mean of T(nat. ref.) / μK
Distance from sensor midpoint to
surface level of water in transfer
cell / mm
Hydrostatic correction for transfer cell / μK
Self-heating correction for
transfer cell /mK
1 2007/10/15 -298 149.1 145.4 205 149.7 1.600 2 2007/10/16 -288 1.590 3 2007/10/18 -372 1.640 4 2007/10/19 -328 1.620 5 2007/10/22 -372 1.640 6 2007/10/23 -263 1.620 7 2007/10/24 -385 1.620 8 2007/10/25 -322 1.620 9 2007/10/26 -216 1.620 10 * The temperature differences should already be corrected for hydrostatic head and self-heating effects. The temperature of the transfer cell must not be corrected for isotopic composition. The temperature of the national reference should be corrected for isotopic composition in case isotopic analysis is available. Resulting temperature difference between transfer cell and national reference:
-304.7 μK