Embed Size (px)
Citation preview

© European Organisation for the Safety of Air Navigation EUROCONTROL 2007
This document is published by EUROCONTROL in the interest of the exchange of information. It may be copied in whole or in part providing that the copyright notice and disclaimer are included. The information contained in this document may not be modified without
prior written permission from EUROCONTROL.
EUROCONTROL makes no warranty, either implied or express, for the information contained in this document, neither does it assume any legal liability or responsibility for the accuracy, completeness or usefulness of this information.
EUROPEAN ORGANISATION FOR THE SAFETY OF AIR NAVIGATION
EUROCONTROL
EUROCONTROL EXPERIMENTAL CENTRE
4D TRAJECTORY MANAGEMENT PILOT SIMULATION
EEC Report n° 408
Project EVP
Issued: June 2008


Page intentionally left blank

REPORT DOCUMENTATION PAGE
Reference: EEC Report No. 408
Security Classification: Unclassified
Originator: ATC Research Area
Originator (Corporate Author) Name/Location: EUROCONTROL Experimental Centre Centre de Bois des Bordes B.P.15 F - 91222 Brétigny-sur-Orge CEDEX FRANCE Telephone: +33 (0)1 69 88 75 00 Internet : www.eurocontrol.int
Sponsor: EUROCONTROL and DG-TREN (EVP programme)
Sponsor (Contract Authority) Name/Location: EUROCONTROL Agency 96, Rue de la Fusée B - 1130 Brussels BELGIUM Telephone: +32 2 729 90 11 Internet : www.eurocontrol.int
TITLE: 4D TRAJECTORY MANAGEMENT PILOT SIMULATION
Author Aymeric Trzmiel (Steria)
Frank Dowling Contributor Karim Zeghal
Date
02/2008 Pages
xii + 48 Figures
27 Tables
6 Annexes
3 References
6
Project
EVP Task No. Sponsor
Period
2007/2008
Distribution Statement: (a) Controlled by: Head of ATC
(b) Special Limitations: None
(c) Copy to NTIS: YES / NO
Descriptors (keywords): 4D trajectory management, Reference Business Trajectory (RBT), Controlled Time of Arrival (CTA), Requested Time of Arrival (RTA), flight crew activity, human in the loop experiment.
Abstract: A flight deck real-time simulation, held in November 2007 at the EUROCONTROL Experimental Centre, investigated 4D trajectory management in cruise and initial descent phases. Adherence to a Reference Business Trajectory time constraint (-2min; +3min) caused no difficulty. A Controlled Time of Arrival window (±30s) was more difficult to achieve and required closer coordination between pilots and controllers plus additional cockpit assistance. The findings from this simulation and from a controller simulation held in March 2007, will be used to help refine 4D trajectory management in the context of SESAR.

Page intentionally left blank
EUROCONTROL 4D Trajectory Management Pilot Simulation
iv EVP - EEC Report n° 408
EVOLUTION SHEET
Date Change status Changes Version
07/01/08 CREATION 1.0
15/01/08 UPDATE Integration of Human Factors results 1.1
04/02/08 UPDATE Integration of objective results 1.2
28/02/08 UPDATE Global review 1.4

4D Trajectory Management Pilot Simulation EUROCONTROL
EVP - EEC Report n° 408 v
EXECUTIVE SUMMARY
This document reports on the 4D trajectory management flight deck simulation conducted in December 2007 at the EUROCONTROL Experimental Centre. The main objective was to perform an initial assessment of the feasibility of 4D trajectory management in en-route from a pilot perspective.
In the context of SESAR, 4D trajectory management is expected to improve air traffic operations, in particular to increase the overall predictability of traffic, with benefits to airlines and air traffic management. The concept relies on a Reference Business Trajectory (RBT) which the airspace user agrees to fly and the service provider agrees to facilitate (subject to separation provision). It implies a target time of arrival over a waypoint of the trajectory, e.g. the initial approach fix (IAF), within a time window tolerance, typically (-2min; +3min). In busy airports during peak periods, to ensure an efficient pre-regulation of traffic and to optimise the runway capacity, the aircraft could be tasked to achieve a Controlled Time of Arrival (CTA) at the IAF with a refined time window tolerance (±30s).
The simulation was conducted on an Airbus A320 fixed based simulator equipped with current Flight Management System (FMS) functionalities. It involved eight pilots from European airlines and from an aircraft manufacturer.
Pilots were exposed to typical situations in which aircraft deviate from the planned trajectory. The situations involved losing or gaining time to achieve RBT or CTA constraints while coping with controller interventions. To achieve the time constraints, the pilots used the Request Time of Arrival (RTA) function of the FMS.
The pilots found adherence to 4D trajectories to be feasible in cruise and initial descent: gaining or losing time in order to respect an RBT time constraint (-2min; +3min) caused no difficulty. The tighter CTA tolerance window (±30s) was reported slightly more difficult to achieve and required closer coordination between pilots and controllers. Pilots suggested they should be in charge of speed control, and the controllers should facilitate or propose lateral changes if speed adjustments were not sufficient.
As anticipated, improvements to the current RTA functions are required. The computation of the managed speed as well as estimated times of arrival should be enhanced to increase the robustness of the guidance, especially during descent. Moreover, additional support (late/early indication on the navigation display, and a “what if” tool) were requested for monitoring and selecting appropriate action.
Although 4D trajectory management implies an additional task on board, especially for the pilot flying, this was felt to be an acceptable increase of workload in cruise. However, in the case that the RTA cannot be met, renegotiation would potentially cause a larger workload increase. Most of the pilots agreed that they would rather use only speed to lose time whereas both speed and lateral actions could be required to gain time. Despite large differences between individuals, the limitations of the current RTA function might explain the large use of the selected speed mode.
In terms of effectiveness, objective results show that all the flight crews always achieved both RBT and CTA time constraints within the tolerance windows. Despite the induced speed variations, the pilots thought that the flight efficiency was similar to today. Speed variations lead to an increase in fuel consumption, although this could be improved by smoother speed guidance. Reduction in holding or vectoring later in the approach area should lead to gains in fuel efficiency.
Most of the pilots agreed that 4D trajectory management could provide a better predictability of traffic flows (for traffic management) and of arrival times (for airlines) assuming adequate planning before take-off. However, the pilots expressed some doubts concerning the overall efficiency of the system since unexpected events may trigger many renegotiations of the RBT.
The findings from this simulation and from the ground simulation conducted previously will be used to help refine the 4D trajectory management concept in the context of SESAR.
EUROCONTROL 4D Trajectory Management Pilot Simulation
vi EVP - EEC Report n° 408
ACKNOWLEDGEMENTS
The present experiment was made in the framework of the EVP programme of the European Commission Directorate General for Transport and Energy Trans-European Network for Transport (DG-TREN). The EUROCONTROL Experimental Centre would like to thank the pilots for their participation and feedback, and all the people who have contributed to the success this experiment.
TABLE OF CONTENTS
1. INTRODUCTION...........................................................................................................1 1.1. PURPOSE OF THIS DOCUMENT................................................................................ 1 1.2. DOCUMENT STRUCTURE .......................................................................................... 1
2. BACKGROUND AND CONTEXT ............................. ....................................................1 2.1. PREVIOUS STUDIES................................................................................................... 1 2.2. SESAR ......................................................................................................................... 1
3. VALIDATION OBJECTIVES.............................. ...........................................................3 3.1. HIGH LEVEL OBJECTIVES.......................................................................................... 3 3.2. LOW LEVEL OBJECTIVES .......................................................................................... 3
4. EXPERIMENTAL SETUP ................................. ............................................................5 4.1. COCKPIT SIMULATOR................................................................................................ 5 4.2. RTA FUNCTION........................................................................................................... 5 4.3. FLIGHT CREW TASKS ................................................................................................ 6 4.4. AIRSPACE ................................................................................................................... 6 4.5. SIMULATED FLIGHT.................................................................................................... 7
5. EXPERIMENTAL DESIGN................................ ............................................................9 5.1. EXPERIMENTAL VARIABLES ..................................................................................... 9 5.2. EXPERIMENTAL RUNS............................................................................................... 9 5.3. MEASURED RUN PLAN ............................................................................................ 11
6. DATA COLLECTION METHOD AND TOOLS................... .........................................12 6.1. DIMENSIONS CONSIDERED .................................................................................... 12
6.1.1. Role and tasks .............................................................................................. 12 6.1.2. Workload....................................................................................................... 12 6.1.3. Effectiveness................................................................................................. 12 6.1.4. Benefits and limitations ................................................................................. 12
6.2. SYNTHESIS ............................................................................................................... 12 6.3. PERIOD OF ANALYSIS.............................................................................................. 13
7. SIMULATION CONDUCT ................................. ..........................................................14 7.1. SIMULATION PROGRAMME ..................................................................................... 14
7.1.1. Participants ................................................................................................... 14 7.1.2. Schedule....................................................................................................... 14
7.2. PROBLEMS ENCOUNTERED ................................................................................... 15

4D Trajectory Management Pilot Simulation EUROCONTROL
EVP - EEC Report n° 408 vii
8. RESULTS....................................................................................................................16 8.1. SIMULATION.............................................................................................................. 16 8.2. ROLE AND TASKS..................................................................................................... 16
8.2.1. Feasibility...................................................................................................... 16 8.2.2. Usability ........................................................................................................ 17 8.2.3. Responsibility................................................................................................ 19 8.2.4. Activity .......................................................................................................... 19 8.2.5. Synthesis ...................................................................................................... 22
8.3. WORKLOAD............................................................................................................... 23 8.4. EFFECTIVENESS ...................................................................................................... 25
8.4.1. Achieving time constraint .............................................................................. 25 8.4.2. Flight efficiency ............................................................................................. 26 8.4.3. Synthesis ...................................................................................................... 30
8.5. BENEFITS AND LIMITATIONS .................................................................................. 31 8.5.1. Benefits......................................................................................................... 31 8.5.2. Limitations..................................................................................................... 32 8.5.3. Synthesis ...................................................................................................... 32
9. CONCLUSION ............................................................................................................33
10. ANNEXES ...................................................................................................................34 10.1. ENTRY QUESTIONNAIRE ......................................................................................... 34 10.2. POST RUN QUESTIONNAIRE................................................................................... 35 10.3. POST EXPERIMENTAL QUESTIONNAIRE ............................................................... 37

EUROCONTROL 4D Trajectory Management Pilot Simulation
viii EVP - EEC Report n° 408
LIST OF FIGURES Figure 1. Overall 4D trajectory management................................................................................... 2 Figure 2. A320 cockpit simulator. .................................................................................................... 5 Figure 3. Examples of the display of RTA information on dedicated MCDU page. .......................... 6 Figure 4. Airspace........................................................................................................................... 7 Figure 5. Overall description of scenario. ........................................................................................ 8 Figure 6. 2D profiles of scenarios.................................................................................................... 8 Figure 7. Timeline description of Run2............................................................................................ 9 Figure 8. Timeline description of Run3.......................................................................................... 10 Figure 9. Timeline description of Run4.......................................................................................... 10 Figure 10. Timeline description of Run5........................................................................................ 10 Figure 11. Feedback on training and simulation realism................................................................ 16 Figure 12. Feedback on feasibility of 4D trajectory management tasks. ........................................ 17 Figure 13. Feedback on usability of RTA function. ........................................................................ 18 Figure 14. Feedback on actors responsibilities for 4D trajectory management.............................. 19 Figure 15. Preferred strategy to perform 4D trajectory management task. .................................... 20 Figure 16. Number of manual actions performed by each crew during each run. .......................... 21 Figure 17. Speed mode duration per crew and per run. ................................................................ 22 Figure 18. Impact of 4D trajectory management on mean score of NASA-TLX. ............................ 24 Figure 19. RTA accuracy over the time constraint waypoint per run.............................................. 25 Figure 20. Feedback on descent efficiency. .................................................................................. 26 Figure 21. Evolution of the ETA and related speed profiles for Run2 (RBT). ................................. 27 Figure 22. Evolution of the ETA and related speed profiles for Run3 (CTA). ................................. 28 Figure 23. Evolution of the ETA and related speed profiles for Run5 (RBT part). .......................... 29 Figure 24. Evolution of the ETA and related speed profiles for Run5 (CTA part). .......................... 30 Figure 25. Benefits of 4D trajectory management. ........................................................................ 31 Figure 26. Limitations of 4D trajectory management. .................................................................... 32
LIST OF TABLES
Table 1. Low levels objectives and associated questions................................................................ 4 Table 2. Run plan.......................................................................................................................... 11 Table 3. Data collection methods and tools................................................................................... 13 Table 4. Participants age distribution. ........................................................................................... 14 Table 5. Participants experience distribution. ................................................................................ 14 Table 6. Session schedule ............................................................................................................ 15

4D Trajectory Management Pilot Simulation EUROCONTROL
EVP - EEC Report n° 408 ix
REFERENCES
[1]. Van Gool, M. and Schröter, H., PHARE Final Report, PHARE/EHQ/MAN/FR; Edition 1.0, Brussels, November 1999. (www.eurocontrol.int/phare/public/subsite_homepage/homepage.html)
[2]. AFAS, www.euroafas.com/afas
[3]. Wichman, K.D.; Carlsson, G.and Lindberg, L.G.V “Flight trials: "runway-to-runway" required time of arrival evaluations for time-based ATM environment”, Digital Avionics Systems Conference, October 2001.
[4]. Guibert, S., Guichard, L., Rihacek, C., Castelli, L., Ranieri, A., “Contract-based Air Transportation System to fulfil the arriving-on-time objective” in the proceedings of the 26th International Congress of the Aeronautical Sciences, ICAS 2008, Anchorage, Alaska, USA, September 2008.
[5]. Chalon, C., Dowling, F., Box, L. and Zeghal, K., “4D Trajectory Management Controller Simulation”, EEC report no 407, July 2008.
[6]. SESAR Consortium, The ATM Target Concept (D3), DLM-0612-001-02-00, September 2007.

EUROCONTROL 4D Trajectory Management Pilot Simulation
x EVP - EEC Report n° 408
ABBREVIATIONS AND ACRONYMS
Abbreviation De-Code
ACC Area Control Center
ADS-B A utomatic Dependant Surveillance – Broadcast
AMAN A rrival MANager
ATC A ir Traffic Control
CI Cost Index
CPDLC Controller-Pilot Data L ink Communications
CTA Controlled Time of Arrival
DCDU Data link Control and Display Unit
ETA Estimated Time of Arrival
FL Flight Level
FMS Flight Management System
IAF Initial Approach Fix
IAS Indicated Air Speed
M Mach
MCDU Multi Purpose Control and Display Unit
ND Navigation Display
nm n autical m ile
PF Pilot Flying
PFD Primary Flight Display
PNF Pilot Not Flying
RBT Reference Business Trajectory
RTA Requested Time of Arrival
VMO/MMO Maximum Operating limit speed
WPT WayPoinT

4D Trajectory Management Pilot Simulation EUROCONTROL
EVP - EEC Report n° 408 1
1. INTRODUCTION
1.1. PURPOSE OF THIS DOCUMENT
This document reports on the 4D trajectory management flight deck simulation conducted in December 2007 at the EUROCONTROL Experimental Centre. The main aim was to perform an initial assessment of the feasibility of 4D trajectory management in en-route from a pilot perspective. This simulation forms part of a series of air and ground validation studies aimed at investigating the feasibility of 4D trajectory management.
1.2. DOCUMENT STRUCTURE
The document is organised as follows:
Section 2 presents the background and context.
Section 3 presents the validation objectives.
Section 4 presents the experimental setup.
Section 5 presents the experimental design.
Section 6 presents the data collection method and tools.
Section 7 presents the simulation conduct.
Section 8 presents the results.
2. BACKGROUND AND CONTEXT
2.1. PREVIOUS STUDIES
Several projects (PHARE, AFAS) were conducted to assess 4D trajectory concepts and capabilities from both air and ground perspectives [1][2]. Some flight trials were also conducted to evaluate the use of the FMS [3]. CATS is an ongoing project also addressing 4D trajectory management [4]. A real-time simulation, held in March 2007 at the Experimental Centre, investigated 4D trajectory management in an en-route environment from a controller perspective [5]. To go a step further, a flight deck simulation was conducted to address the pilot perspective.
2.2. SESAR
In the context of SESAR, 4D trajectory management is expected to improve air traffic operations, in particular to increase the overall predictability of traffic, with benefits to airlines and air traffic management [6].
The concept supposes the adherence to an agreed 4D trajectory for all aircraft, and is comprised of the following stages: planning, agreement, execution and revision (including renegotiation) as shown in Figure 1. The concept relies on a Reference Business Trajectory (RBT) which the airspace user agrees to fly and the service provider agrees to facilitate (subject to separation provision). It implies a target

EUROCONTROL 4D Trajectory Management Pilot Simulation
2 EVP - EEC Report n° 408
time of arrival over a waypoint of the trajectory, e.g. the initial approach fix (IAF), within a time window tolerance, typically [-2min; +3min]. In busy airports during peak periods, the RBT time window tolerance may not be accurate enough to ensure an efficient pre-regulation of traffic and to optimise the runway capacity. In that case, once the aircraft enters the arrival manager (AMAN) horizon (e.g. 30 minutes before landing) of its airport of destination, the aircraft could be tasked to achieve a Controlled Time of Arrival (CTA) at the IAF with a refined time window tolerance (±30s). Based on the same principles used in the controller simulation held in 2007, three situations could occur concerning the time at a reference point:
• Ok: the aircraft is within the time tolerance window. • Drifting: the aircraft is outside the time tolerance window but the situation can be regained
(with speed and/or lateral actions). • Missed: the aircraft is outside the time tolerance window and the situation cannot be
regained, leading to renegotiation.
Figure 1. Overall 4D trajectory management.

4D Trajectory Management Pilot Simulation EUROCONTROL
EVP - EEC Report n° 408 3
3. VALIDATION OBJECTIVES
3.1. HIGH LEVEL OBJECTIVES
The objective of the simulation was to perform an initial assessment of the operational feasibility of the execution of an Reference Business Trajectory (RBT) and a Controlled Time of Arrival (CTA), in cruise and initial descent phases of flight, from a pilot perspective.
It was assumed that responsibility for adhering to RBT and respecting CTA rested with the pilots, who therefore had to initiate and perform appropriate actions in order to do so.
The simulation was conducted on an fixed based cockpit simulator, equipped with current FMS functionalities.
3.2. LOW LEVEL OBJECTIVES
To assess the operational feasibility of 4D trajectory management from a pilots’ perspective, the following four low level objectives were defined:
• Objective 1: Assess the impact of the concept on pilots’ role and tasks.
• Objective 2: Assess the impact of the concept on pilots’ workload.
• Objective 3: Assess the effectiveness of 4D trajectory management tasks.
• Objective 4: Assess the foreseen benefits and limitations of the concept.
The associated data collection and methods for their assessment are described in more detail in §6.
These low level objectives can be broken down into questions (Table 1).

EUROCONTROL 4D Trajectory Management Pilot Simulation
4 EVP - EEC Report n° 408
Table 1. Low levels objectives and associated quest ions.
Low level objectives Questions
What is the impact of the management of the RBT/CTA on pilots’ current role and tasks?
What is the impact of the management of the RBT/CTA on pilots’ current working method?
Is the management of the RBT/CTA compatible with their usual flying tasks?
What is impact of the management of RBT/CTA in terms of manual actions performed by the flight crew?
What is the pilots’ strategy to cope with the RBT/CTA time frame window?
Should the pilot be responsible for the achievements of the RBT/CTA task?
Are the pilots aware that the situation is drifting or will be missed?
Roles and tasks
Is the information conveyed by the system sufficient to monitor and execute the RBT/CTA?
Workload What is the impact of the management of the RBT/CTA on both pilots’ current workload?
What is the level of accuracy achieved compared to the required RBT/CTA time frame window?
What is the impact on flight efficiency (e.g. fuel consumption) Effectiveness
What is the temporal evolution of the estimated RBT and CTA time throughout the flight?
What are the foreseen benefits and limitations of the RBT/CTA concept from a pilot point of view?
Benefits and limitations
Does the concept require additional function on board (e.g. for lateral revision)?

4D Trajectory Management Pilot Simulation EUROCONTROL
EVP - EEC Report n° 408 5
4. EXPERIMENTAL SETUP
4.1. COCKPIT SIMULATOR
The cockpit simulator is an Airbus A320 trainer from FAROS allowing performance of automatic flight, with captain and first officer positions Figure 2. The simulator is composed of the following standard elements: PFD, ND (including a simplified TCAS display), MCDU, FCU, DCDU (for data link interactions), throttle and a simplified ECAM. It is also equipped with an emulation of the current Honeywell RTA function.
Figure 2. A320 cockpit simulator.
4.2. RTA FUNCTION
To meet a time constraint, the RTA function proposes a managed speed mode that can be used by the pilot. This guidance changes engine parameters according to evolution of the weather conditions (difference between current and forecast), aircraft weight and engine thrust index etc. At any time the pilot can decide to switch to speed selected mode to keep the control of the speed by pulling the FCU speed knob. Obviously, the time constraint can only be fulfilled if the aircraft stays within the commercial flight envelope.
As the FMS can only match one time constraint, which means that in cases where multiple time constraints are needed, only the first one is considered by the FMS and when it is over-flown, the next one can be activated. Moreover, once the Top Of Descent (TOD) is reached no modification on the RTA (waypoint or time) can be accepted until the concerned waypoint is overflown.

EUROCONTROL 4D Trajectory Management Pilot Simulation
6 EVP - EEC Report n° 408
To monitor the evolution of time constraints, time and speed information are conveyed via the dedicated MCDU page. As illustrated in Figure 3, the RTA page displays:
• The time constraint waypoint (OTBED) and its current distance (230nm).
• The RTA time entered by the pilot in magenta (00:43:00).
• The ‘suggested’ speed in managed mode (.76).
• The Estimated Time of Arrival (ETA of 00:43:16).
• And the current active mode (selected in Figure 3, left and managed Figure 3, right).
As soon as the ETA is outside the FMS predefined window of [-2min; +2min]1, an error message displays the difference between ETA and RTA in amber (Figure 3, right).
Figure 3. Examples of the display of RTA information on dedicated MCDU page.
4.3. FLIGHT CREW TASKS
Flight crews were tasked to fly the simulator as they would do in a regular flight, performing their usual tasks, including communications with ATC and checklists. Navigation charts, and checklists were provided. The flight crew were tasked to fly to an RBT and later to a CTA with the support of the RTA function included in the FMS. The pilots were instructed to respect the RBT/CTA time over the designated point. The strategy to adhere to the RBT/CTA was left to the pilots’ discretion. They thus could use speed or lateral (e.g. direct) manoeuvres to manage it. Some instructions were issued by data link (typically the uplink of CTA time) and therefore had to be handled through the Data link Control Display Unit (DCDU). Concerning the flight task distribution, following today’s practices, it was suggested that the Pilot Not Flying (PNF) would perform the input of data in the Multipurpose Control Display Unit (MCDU) and that the Pilot Flying (PF) would fly the aircraft. Both pilots would monitor the RBT and CTA situation using RTA functionalities.
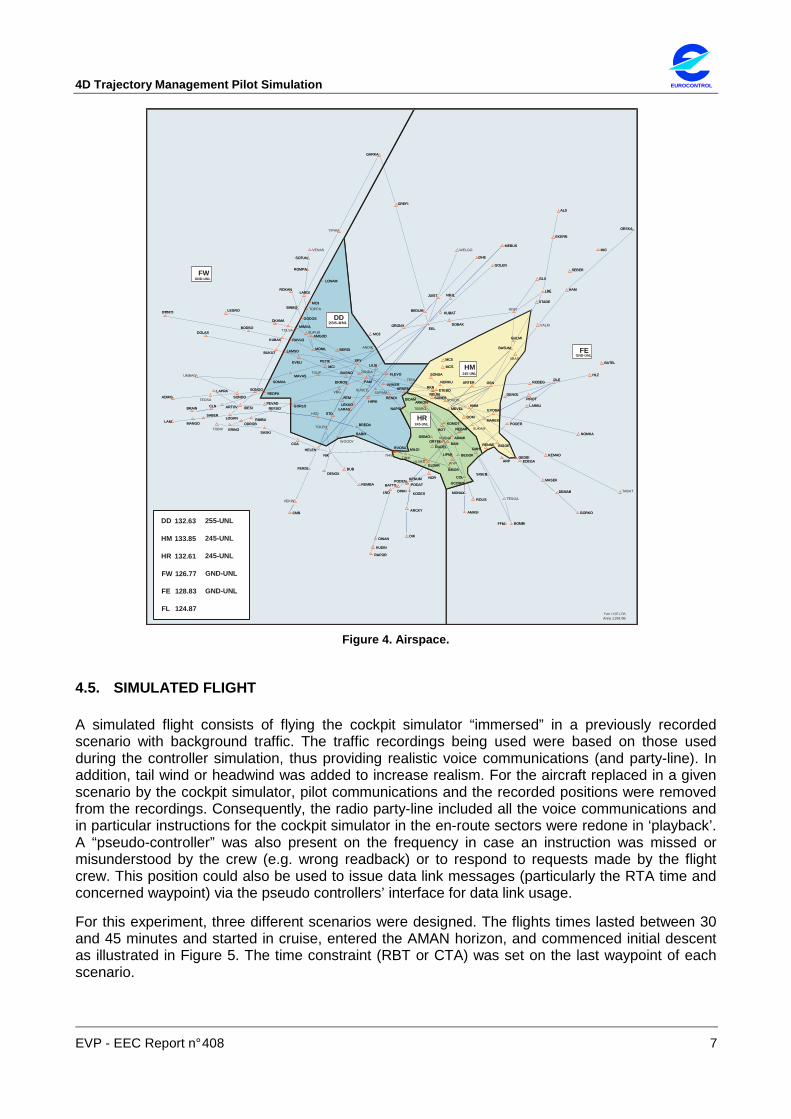
4.4. AIRSPACE
The airspace chosen is a subset of the current Maastricht upper airspace as used during the controller simulation. It comprises three busy high level en-route sectors: Delta (DD) Ruhr (HR) and Munster (HM), from the core area of Europe processing traffic to and from other core areas and busy TMAs.
1 The FMS predefined window could not be modified according to the RBT window.
4D Trajectory Management Pilot Simulation EUROCONTROL
EVP - EEC Report n° 408 7
ABAMI
ADMIS
ALS
AMASI
AMGOD
ARCKY
ARKON
ARNEM
ARP
ARTER
ARTOV
BABIX
BAM
BASNO
BASUM
BATEL
BATTY
BEDUM
BEGOK
BERGI
BIBOS
BIGGE
BINBO
BODSO
BOMBI
BOT
BRAIN
BREDA
BUB
BUKUT
CLN
CMB
COA
COL
DEMAB
DENOL
DENOX
DHE
DIDAM
DIKDINAN
DINKI
DISMO
DLE
DOBAK
DOLAS
DOM
EDEGA
EEL
EKERN
EKROS
ELDAR
ERING
ETEBO
EVELI
EVOSA
EXOBA
FERDI
FFM
FLEVO
GARKA
GCOMO
GEDBI
GESKA
GLX
GMH
GODOS
GOLEN
GORLO
GORKO
GREFI
GRONY
GULMI
HAM
HELEN
HIPIK
HLZ
HMMIDESI
JUIST
KEMAD
KENUM
KOGES
KOMOT
KUBAT
KUBAX
KUDIN
LAM
LAMSO
LAPRA
LARASLARBU
LARDI LBE
LEGRO
LEKKO
LILSI
LIPMI
LNO
LOGAN
LONAM
MANGOMAREK
MASEK
MAVAS
MC
MC3
MC5
MC9
MCS
MEBUS
MEVEL
MIC
MILGI
MIMVA
MONAX
MONIL
NAPSI
NEBAR
NIK
NIKIL
NOMKA
NOR
NORKUNYKER
ODROB
OKAMA
ORTIM
OSNPAM
PETIK
PEVADPIROT
PODATPODEN
PODER
RAPOR
RAVLO
REDFA
REFSO
RELBI
REMBA
RENDI
RENNE
RIMBU
RKN
ROBEG
ROKAN
ROLIS
ROMPA
RTM
RUDEL
SABER
SASKI
SEBER
SIGEN
SOMVA
SONDO SONEB
SONOG
SONSA
SOTUN
SPY
STADE
STD
SUKAM
SUPAM
SUPUR
SUSET
SUVOX
TABAT
TEBRO
TEDSA
TENLI
TESGA
THNTINIK
TIPAN
TOBIXTOLEN
TOLSA
TOPPA
TULIP
ULNES
UMBAG
VALKI
VBG
VEKIN
VENAS
VORNA
WELGO
WOODY
WSR
WYP
XBAS
ZANDA
HSD
ANDIK
2
FWGND-UNL
DD
HR245-UNL
HM245-UNL
FEGND-UNL
Anne 11/01/06
132.63
133.85
132.61
DD
HM
HR
255-UNL
245-UNL
245-UNL
GND-UNL
GND-UNL
FW
FE
FL
126.77
128.83
124.87
ABAMI
ADMIS
ALS
AMASI
AMGOD
ARCKY
ARKON
ARNEM
ARP
ARTER
ARTOV
BABIX
BAM
BASNO
BASUM
BATEL
BATTY
BEDUM
BEGOK
BERGI
BIBOS
BIGGE
BINBO
BODSO
BOMBI
BOT
BRAIN
BREDA
BUB
BUKUT
CLN
CMB
COA
COL
DEMAB
DENOL
DENOX
DHE
DIDAM
DIKDINAN
DINKI
DISMO
DLE
DOBAK
DOLAS
DOM
EDEGA
EEL
EKERN
EKROS
ELDAR
ERING
ETEBO
EVELI
EVOSA
EXOBA
FERDI
FFM
FLEVO
GARKA
GCOMO
GEDBI
GESKA
GLX
GMH
GODOS
GOLEN
GORLO
GORKO
GREFI
GRONY
GULMI
HAM
HELEN
HIPIK
HLZ
HMMIDESI
JUIST
KEMAD
KENUM
KOGES
KOMOT
KUBAT
KUBAX
KUDIN
LAM
LAMSO
LAPRA
LARASLARBU
LARDI LBE
LEGRO
LEKKO
LILSI
LIPMI
LNO
LOGAN
LONAM
MANGOMAREK
MASEK
MAVAS
MC
MC3
MC5
MC9
MCS
MEBUS
MEVEL
MIC
MILGI
MIMVA
MONAX
MONIL
NAPSI
NEBAR
NIK
NIKIL
NOMKA
NOR
NORKUNYKER
ODROB
OKAMA
ORTIM
OSNPAM
PETIK
PEVADPIROT
PODATPODEN
PODER
RAPOR
RAVLO
REDFA
REFSO
RELBI
REMBA
RENDI
RENNE
RIMBU
RKN
ROBEG
ROKAN
ROLIS
ROMPA
RTM
RUDEL
SABER
SASKI
SEBER
SIGEN
SOMVA
SONDO SONEB
SONOG
SONSA
SOTUN
SPY
STADE
STD
SUKAM
SUPAM
SUPUR
SUSET
SUVOX
TABAT
TEBRO
TEDSA
TENLI
TESGA
THNTINIK
TIPAN
TOBIXTOLEN
TOLSA
TOPPA
TULIP
ULNES
UMBAG
VALKI
VBG
VEKIN
VENAS
VORNA
WELGO
WOODY
WSR
WYP
XBAS
ZANDA
HSD
ANDIK
2
FWGND-UNL
DD
HR245-UNL
HM245-UNL
FEGND-UNL
Anne 11/01/06
132.63
133.85
132.61
DD
HM
HR
255-UNL
245-UNL
245-UNL
GND-UNL
GND-UNL
FW
FE
FL
126.77
128.83
124.87
Figure 4. Airspace.
4.5. SIMULATED FLIGHT
A simulated flight consists of flying the cockpit simulator “immersed” in a previously recorded scenario with background traffic. The traffic recordings being used were based on those used during the controller simulation, thus providing realistic voice communications (and party-line). In addition, tail wind or headwind was added to increase realism. For the aircraft replaced in a given scenario by the cockpit simulator, pilot communications and the recorded positions were removed from the recordings. Consequently, the radio party-line included all the voice communications and in particular instructions for the cockpit simulator in the en-route sectors were redone in ‘playback’. A “pseudo-controller” was also present on the frequency in case an instruction was missed or misunderstood by the crew (e.g. wrong readback) or to respond to requests made by the flight crew. This position could also be used to issue data link messages (particularly the RTA time and concerned waypoint) via the pseudo controllers’ interface for data link usage.
For this experiment, three different scenarios were designed. The flights times lasted between 30 and 45 minutes and started in cruise, entered the AMAN horizon, and commenced initial descent as illustrated in Figure 5. The time constraint (RBT or CTA) was set on the last waypoint of each scenario.

EUROCONTROL 4D Trajectory Management Pilot Simulation
8 EVP - EEC Report n° 408
Take-off
Climb
Cruise
Descent
Landing
AMAN Horizon
~45min
IAF
Scenario considered ~ 40min
WPT with time constraint
[-2min; +3min] for RBT[-30s; +30s] for RBT + CTA
Figure 5. Overall description of scenario.
Three different scenarios were extracted from the controller simulation (Figure 6):
• Scenario 1 (S1) : This scenario consisted of a west bound flight from ADRIA to LOGAN crossing HR and then DD sector (red line in Figure 6). The flight started in cruise (FL360) and had to respect the vertical constraint of being at FL260 over its exit point of the DD sector (GORLO).
• Scenario 2 (S2) : This scenario consisted of a west bound flight from ADRIA to OTBED crossing HR and then DD sector (green line in Figure 6). The flight started in cruise (FL340) and had to respect the vertical constraint of being at FL260 over its exit point of the DD sector (RAVLO).
• Scenario 3 (S3) : This scenario consisted of an east bound flight from BRAIN to BOMBI crossing DD and then HR sector (red line in Figure 6). The flight started in cruise (FL330) and had to respect the vertical constraint of being at FL270 on the last point of its routes (BOMBI).
CLN
GMH
SPY
RAVLO
TULIP
OTBED
DAGGA
BRAIN
BASNO
BEKMO
ADRIA
MONIL
Scenario 2
Scenario 3 EHAM
THN
REDFA
REFSO
RENDISUPAM
TEBRO
TINIKULNES
ARNEM
ARTOV
BIBOS
BREDA
DIDAM
DISMO
GORLO
KOMOT
LOGAN
NAPSI
Scenario 1
BOMBI
NEGIX
CLN
GMH
SPY
RAVLO
TULIP
OTBED
DAGGA
BRAIN
BASNO
BEKMO
ADRIA
MONIL
Scenario 2
Scenario 3 EHAM
THN
REDFA
REFSO
RENDISUPAM
TEBRO
TINIKULNES
ARNEM
ARTOV
BIBOS
BREDA
DIDAM
DISMO
GORLO
KOMOT
LOGAN
NAPSI
Scenario 1
BOMBI
NEGIX
HM
HR
DD
Figure 6. 2D profiles of scenarios.

4D Trajectory Management Pilot Simulation EUROCONTROL
EVP - EEC Report n° 408 9
5. EXPERIMENTAL DESIGN
5.1. EXPERIMENTAL VARIABLES
The experiment was built around the following independent variables:
• Type of action: gain or lose time;
• Time frame window dimension: large [-2min; +3min] for RBT or small ±30s for CTA adherence.
Moreover as the strategy to perform the task was left to the pilots’ discretion, a dependent variable was also considered:
• Manoeuvres used to perform the task: speed only (e.g. with RTA function), lateral only (e.g. request ‘direct-to’) or both speed and lateral.
Four measured runs were designed mixing the experimental variables described above. Several measurement techniques (Table 3) were used to assess pilots' performance and behaviour.
The pilots were exposed to a variety of situations rather than comparable ones. Therefore, no statistical comparisons were made between runs at this stage.
5.2. EXPERIMENTAL RUNS
In each run, the time restriction for an RBT and a CTA was assigned to the last waypoint of the route.
• Run1: Scenario 1 (West bound flight) was only used for training purposes. The aircraft started the run 1 minute late compared to the RBT time.
• Run2 (RBT + 1 ATC action) : Scenario 2 (West bound flight) was used with additional tailwind (increasing from 10kts initially, up to 40kts). The aircraft started the run 2 minutes in advance (early) compared to the RBT time. The pilot had to lose time in order to respect the RBT time frame window [-2min; +3min]. Moreover an ATC action (heading instruction) was issued during the first part of the run causing further delay as illustrated on Figure 7.
Initial conditions:Aircraft is 2’ in advance
From East To West
Run2
Time to respect at WPT:45:00 within [-2’; +3’]
AMAN Horizon Nothing
RBT RBT
Controllers’ action (heading instruction for 3’
to solve conflict)
Wind: 10kt Wind: 40kt
0
20’
45’
TOD
24’8’
Initial conditions:Aircraft is 2’ in advance
From East To West
Run2
Time to respect at WPT:45:00 within [-2’; +3’]
AMAN Horizon Nothing
RBT RBT
Controllers’ action (heading instruction for 3’
to solve conflict)
Wind: 10kt Wind: 40kt
0
20’
45’
TOD
24’8’
Figure 7. Timeline description of Run2.

EUROCONTROL 4D Trajectory Management Pilot Simulation
10 EVP - EEC Report n° 408
• Run3 (RBT + CTA) : as the focus in this run was CTA, the latter portion of Scenario 3 (30 minutes eastbound flight) was used with a headwind (40kts). As soon as the aircraft entered the AMAN horizon, the pilots had to gain 1 minute to respect the CTA time frame window ±30s as illustrated on Figure 8.
Initial conditions:Aircraft is on time
From West To East
Run3
Time to respect at WPT:00:30:20 within [-30’’; +30’’]
AMAN Horizon Aircraft has 1’ to gain
RBT CTA
Wind: 40kt
0 30’20’’
8’
TOD
24’
Figure 8. Timeline description of Run3.
• Run4 (RBT + CTA + 1 ATC action) : a subset of Scenario 2 (West bound flight) was used with additional headwind (from 40kts and up to 50kts). The aircraft was already set 1min20s late and as soon as the aircraft entered the AMAN horizon, the pilots had to gain 1 minute to respect the CTA time frame window of ±30s. Moreover an ATC action (heading instruction) was issued during the CTA ‘phase’ causing delay as illustrated on Figure 9.
Initial conditions:Aircraft is 1’20’’ late
From East To West
Run4
AMAN Horizon Aircraft has 1’ to gain
RBT CTA
Wind: 40kt
0 32’
6’
TOD
10’
Wind: 50kt
Controllers’ action (heading instruction for 3’
to solve conflict)
12’
Time to respect at WPT:00:32:00 within [-30’’; +30’’]
Initial conditions:Aircraft is 1’20’’ late
From East To West
Run4
AMAN Horizon Aircraft has 1’ to gain
RBT CTA
Wind: 40kt
0 32’
6’
TOD
10’
Wind: 50kt
Controllers’ action (heading instruction for 3’
to solve conflict)
12’
Time to respect at WPT:00:32:00 within [-30’’; +30’’]
Figure 9. Timeline description of Run4.
• Run5 (RBT + CTA + 2 ATC actions) : Scenario 3 (East bound flight) was used with a tailwind (increasing from 10kts to 40kts). The aircraft was already set 30 seconds late and as soon as the aircraft entered the AMAN horizon, the pilots had to gain 30 seconds to respect the CTA time frame window of ±30s. Moreover two ATC actions (heading instructions) were issued during the RBT and the CTA ‘phase’ causing delays as illustrated on Figure 10.
Initial conditions:Aircraft is 30’’ late
From West To East
Run5
Time to respect at WPT:44:30 within [-30’’; +30’’]
AMAN Horizon Aircraft has 30’’ to gain
RBT CTA
Controllers’ action (heading instruction for 3’
to solve conflict)
Wind: 10kt Wind: 40kt
0
25’
44’30’’
TOD
38’9’
Controllers’ action (heading instruction for 3’
to solve conflict)
28’
Figure 10. Timeline description of Run5.
4D Trajectory Management Pilot Simulation EUROCONTROL
EVP - EEC Report n° 408 11
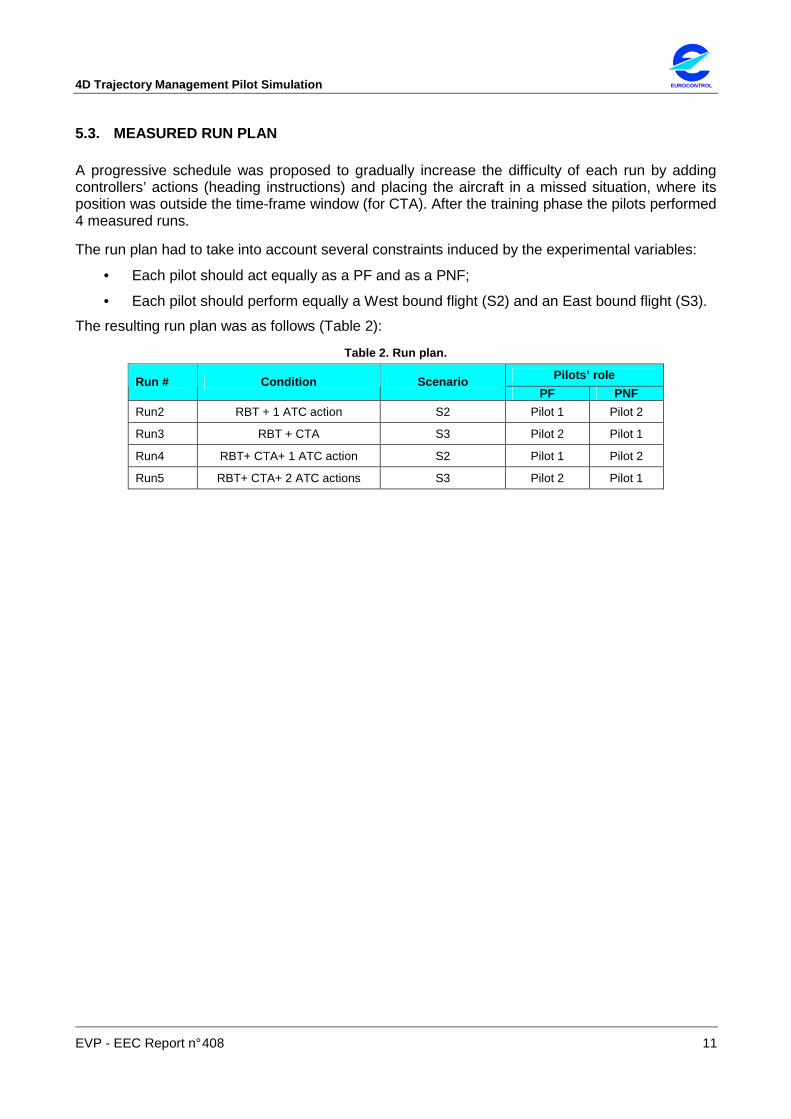
5.3. MEASURED RUN PLAN
A progressive schedule was proposed to gradually increase the difficulty of each run by adding controllers’ actions (heading instructions) and placing the aircraft in a missed situation, where its position was outside the time-frame window (for CTA). After the training phase the pilots performed 4 measured runs.
The run plan had to take into account several constraints induced by the experimental variables:
• Each pilot should act equally as a PF and as a PNF;
• Each pilot should perform equally a West bound flight (S2) and an East bound flight (S3).
The resulting run plan was as follows (Table 2):
Table 2. Run plan.
Pilots’ role Run # Condition Scenario PF PNF
Run2 RBT + 1 ATC action S2 Pilot 1 Pilot 2
Run3 RBT + CTA S3 Pilot 2 Pilot 1
Run4 RBT+ CTA+ 1 ATC action S2 Pilot 1 Pilot 2
Run5 RBT+ CTA+ 2 ATC actions S3 Pilot 2 Pilot 1

EUROCONTROL 4D Trajectory Management Pilot Simulation
12 EVP - EEC Report n° 408
6. DATA COLLECTION METHOD AND TOOLS
The data collection method was build around the low level objectives defined in chapter 3.2. In terms of measurements, objective and subjective data were collected:
• Objective data consisted of system recordings, including aircraft states, pilots’ actions and Estimated Time of Arrival evolution.
• Subjective data consisted of observers’ notes, questionnaires and debriefing items.
Pilots were expected to express their own personal view and not a company policy. It should be emphasised that all results were processed anonymously.
6.1. DIMENSIONS CONSIDERED
6.1.1. Role and tasks
The assessment of the pilots’ role and tasks comprised four aspects: the feasibility of the 4D trajectory management task, the pilots’ activity (e.g. in terms of manual actions), usability of the RTA features and the pilots’ view of their responsibilities in 4D trajectory management. These different aspects were evaluated through questionnaires, de-briefings, means of observations during the exercises (e.g. recording of system interaction problems and spontaneous pilots’ comments) and by objective data (system recordings) mainly for the activity aspects.
Samples of blank questionnaires are presented in the annexes of this document (§10) .
6.1.2. Workload
Pilots’ workload induced by the 4D trajectory management task was mainly evaluated through the NASA-TLX questionnaire (see 10.2).
6.1.3. Effectiveness
The effectiveness of 4D trajectory management comprised two aspects: the accuracy in maintaining the aircraft within the time constraint envelope imposed (assessed by objective data obtained from the simulator recordings) and flight efficiency, including speed variations (also obtained from simulator recordings), and passenger comfort/fuel burn obtained from post experimental questionnaires.
6.1.4. Benefits and limitations
Some pilots indicated that before introducing a system which would imply a new task in the cockpit, it is important for them, as a population, to see the benefits and the limitations of this system. Thus, four items of the post experimental questionnaires and pilots’ comments were used to evaluate the number and significance of perceived benefits and limitations of the 4D trajectory management.
6.2. SYNTHESIS
Table 3 describes the types of data and the method and tools selected to collect them. Note that observations during runs, and pilots’ feedbacks collected during debriefing were also analysed for each dimension.
4D Trajectory Management Pilot Simulation EUROCONTROL
EVP - EEC Report n° 408 13
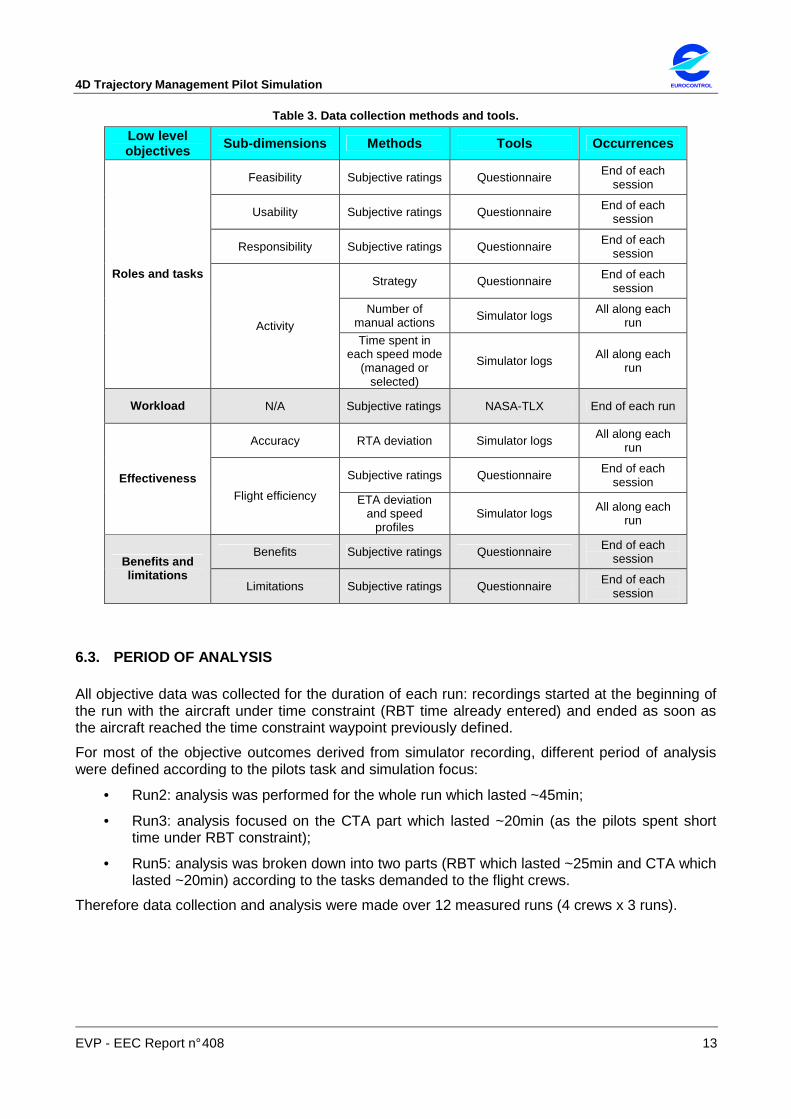
Table 3. Data collection methods and tools.
Low level objectives Sub-dimensions Methods Tools Occurrences
Feasibility Subjective ratings Questionnaire End of each session
Usability Subjective ratings Questionnaire End of each session
Responsibility Subjective ratings Questionnaire End of each session
Strategy Questionnaire End of each session
Number of manual actions Simulator logs All along each
run
Roles and tasks
Activity Time spent in
each speed mode (managed or
selected)
Simulator logs All along each run
Workload N/A Subjective ratings NASA-TLX End of each run
Accuracy RTA deviation Simulator logs All along each run
Subjective ratings Questionnaire End of each session Effectiveness
Flight efficiency ETA deviation and speed
profiles Simulator logs All along each
run
Benefits Subjective ratings Questionnaire End of each session Benefits and
limitations Limitations Subjective ratings Questionnaire End of each
session
6.3. PERIOD OF ANALYSIS
All objective data was collected for the duration of each run: recordings started at the beginning of the run with the aircraft under time constraint (RBT time already entered) and ended as soon as the aircraft reached the time constraint waypoint previously defined.
For most of the objective outcomes derived from simulator recording, different period of analysis were defined according to the pilots task and simulation focus:
• Run2: analysis was performed for the whole run which lasted ~45min;
• Run3: analysis focused on the CTA part which lasted ~20min (as the pilots spent short time under RBT constraint);
• Run5: analysis was broken down into two parts (RBT which lasted ~25min and CTA which lasted ~20min) according to the tasks demanded to the flight crews.
Therefore data collection and analysis were made over 12 measured runs (4 crews x 3 runs).

EUROCONTROL 4D Trajectory Management Pilot Simulation
14 EVP - EEC Report n° 408
7. SIMULATION CONDUCT
7.1. SIMULATION PROGRAMME
The simulation was conducted over four days between the 3rd and the 7th December 2007. Four simulation sessions took place involving one crew of two pilots for one day each.
7.1.1. Participants
The simulation involved eight pilots from European airlines and from an aircraft manufacturer. The pilots made up four crews. Among the eight participants which were all Airbus rated, four were captains (including an experimental test pilot from Airbus) and four were first officers. The age ranges were from 35 to 48 years (mean 40), experience from 2000 to 17000 hours (mean 7100) and experience with Airbus from 1800 to 7000 hours (mean 5500). Although all participants had previous simulation experience none of them had participated in an experiment on 4D trajectory management. The age and experience distributions were as follows:
Table 4. Participants age distribution.
Age [35-40] ]40-45] >45 years
Number of pilots 6 0 2
Table 5. Participants experience distribution.
Experience <5 years [5-10] >10 years <5000 hours [5000-10000] >10000 hours
Flying Airbus aircraft 1 7 0 3 5 0
Flying in airline 1 5 2 2 5 1
7.1.2. Schedule
The simulation runs consisted of two phases As illustrated in Table 6 the programme of each phase covered:
• A training phase (one run)
The objective of training was to ensure that all pilots were familiar enough with the concept, and to minimise the risk of non realistic pilot behaviour during the measured runs. Although the management of the RBT and CTA required no new functions or displays, training was necessary to familiarise flight crew with experimental environment (e.g. airspace and simulator), Data link and RTA function. To do so, a briefing and a practical (hands-on) training was provided. The training run using Scenario 1 (Run1) consisted of flying an RBT (without controllers’ actions) and testing RTA functionalities;

4D Trajectory Management Pilot Simulation EUROCONTROL
EVP - EEC Report n° 408 15
• A measured phase (4 runs)
The participants performed 4 measured runs, enabling pilots to alternate functions (PF and PNF), before completing the final questionnaire and expressing their overall feedback during the final debriefing.
Table 6. Session schedule
Measured schedule
9h00-9h15 Welcome
9h15-10h00 Briefing
10h00-10h40 1 training run
10h40-12h30 2 Measured runs including post run debriefing and questionnaires (2x45’ + margin)
12h30-13h30 Lunch
13h30-15h45 2 Measured runs including post run debriefing and questionnaires (2x45’ + margin)
16h00-17h00 Final debriefing
7.2. PROBLEMS ENCOUNTERED
Two problems were encountered:
• Some inconsistent computations of the Estimated Time of Arrival (ETA) were experienced during Run4 for the first two crews. This was really disturbing for the pilots as the ETA and the speed managed guidance were wrong and therefore impossible to follow. As a result, this run was removed from the run plan for the remaining crews. In addition, during the simulation, the ETA computations were sometimes not consistent with the speed of the aircraft leading to quick jumps.
• A bug in the cockpit simulator was identified concerning the speed managed mode. The speed managed sometimes went towards M.82 (VMO/MMO) when switching from selected to managed speed mode, even though the previous calculation indicated in the MCDU was correct (e.g. M.79).
EUROCONTROL 4D Trajectory Management Pilot Simulation
16 EVP - EEC Report n° 408
8. RESULTS
This section is organized around the low level objectives defined in chapter 3.2 and composed of four dimensions: pilots’ role and tasks, workload, effectiveness and benefits and limitations.
The comments expressed by the pilots during the debriefing, a careful examination of the filled-in questionnaires (post run and post experimental), and the analysis performed on the data recordings constitute the body of this chapter. As previously mentioned, no statistical comparisons were made between runs as the focus was set in performing a variety of situations rather than comparable conditions.
8.1. SIMULATION
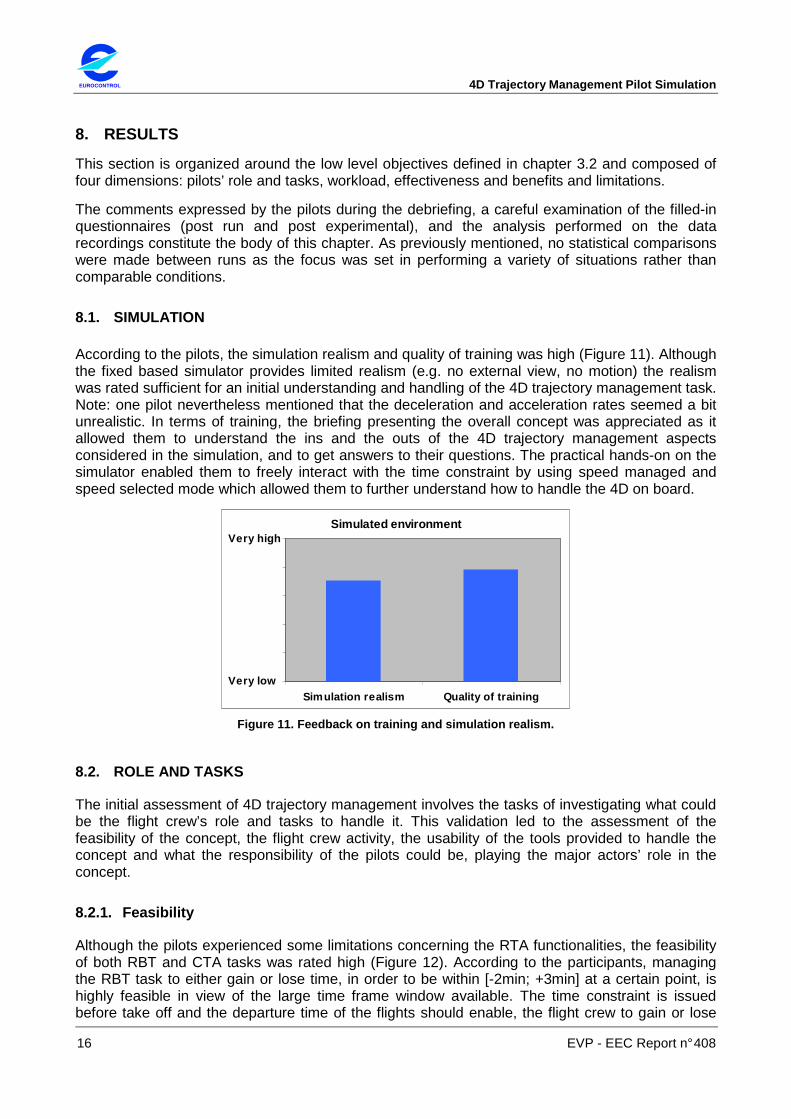
According to the pilots, the simulation realism and quality of training was high (Figure 11). Although the fixed based simulator provides limited realism (e.g. no external view, no motion) the realism was rated sufficient for an initial understanding and handling of the 4D trajectory management task. Note: one pilot nevertheless mentioned that the deceleration and acceleration rates seemed a bit unrealistic. In terms of training, the briefing presenting the overall concept was appreciated as it allowed them to understand the ins and the outs of the 4D trajectory management aspects considered in the simulation, and to get answers to their questions. The practical hands-on on the simulator enabled them to freely interact with the time constraint by using speed managed and speed selected mode which allowed them to further understand how to handle the 4D on board.
Simulated environment
Simulation realism Quality of trainingVery low
Very high
Figure 11. Feedback on training and simulation real ism.
8.2. ROLE AND TASKS
The initial assessment of 4D trajectory management involves the tasks of investigating what could be the flight crew’s role and tasks to handle it. This validation led to the assessment of the feasibility of the concept, the flight crew activity, the usability of the tools provided to handle the concept and what the responsibility of the pilots could be, playing the major actors’ role in the concept.
8.2.1. Feasibility
Although the pilots experienced some limitations concerning the RTA functionalities, the feasibility of both RBT and CTA tasks was rated high (Figure 12). According to the participants, managing the RBT task to either gain or lose time, in order to be within [-2min; +3min] at a certain point, is highly feasible in view of the large time frame window available. The time constraint is issued before take off and the departure time of the flights should enable, the flight crew to gain or lose

4D Trajectory Management Pilot Simulation EUROCONTROL
EVP - EEC Report n° 408 17
enough time to respect the RBT constraint. This can be more easily achieved for short or medium haul flights within Europe as opposed to longer flights.
Concerning the CTA, the participants found the task slightly less feasible than the RBT task because of the reduced time frame widow of ±30s to respect (Figure 12). Indeed, if we assume that the time constraint waypoint is set to the IAF and the CTA is issued as soon as an aircraft enters the AMAN horizon, the time remaining for the flight can be as little as 25 minutes, thus restricting the amount of time an aircraft can gain (~1 minute). Therefore, the participants felt that both pilots and controllers should work together to achieve the same goal of respecting the tight time frame window of the CTA. In addition, unlike the RBT where the time frame window is large, the achievement of the CTA constraint needs further improvements of the RTA functionalities (see next section) in order to provide more information to the pilots to enable them to accurately manage the CTA task.
According to the participants, in any case, this kind of concept induces a new relation between pilots and time to respect as there will be more work if the CTA is missed (e.g. renegotiation). Thus appropriate tools (speed managed and HMI indications) are required to monitor the situation.
Feasibility of 4D trajectory management
RBT [-2mn; +3mn] CTA [-30s; +30s]
Gain time Lose time
Very low
Very high
Feasibility of 4D trajectory management
RBT [-2mn; +3mn] CTA [-30s; +30s]
Gain time Lose time
Very low
Very high
Figure 12. Feedback on feasibility of 4D trajectory management tasks.
8.2.2. Usability
In current operations, the RTA function is seldom used by the flight crew. However, if managing the 4D trajectory becomes a major requirement on both ground and air side in the future, the RTA function should provide useful and usable functionalities and displays. Therefore, one item of the post run questionnaire was used to assess the usability of the current RTA function as well as what could be future requirements.
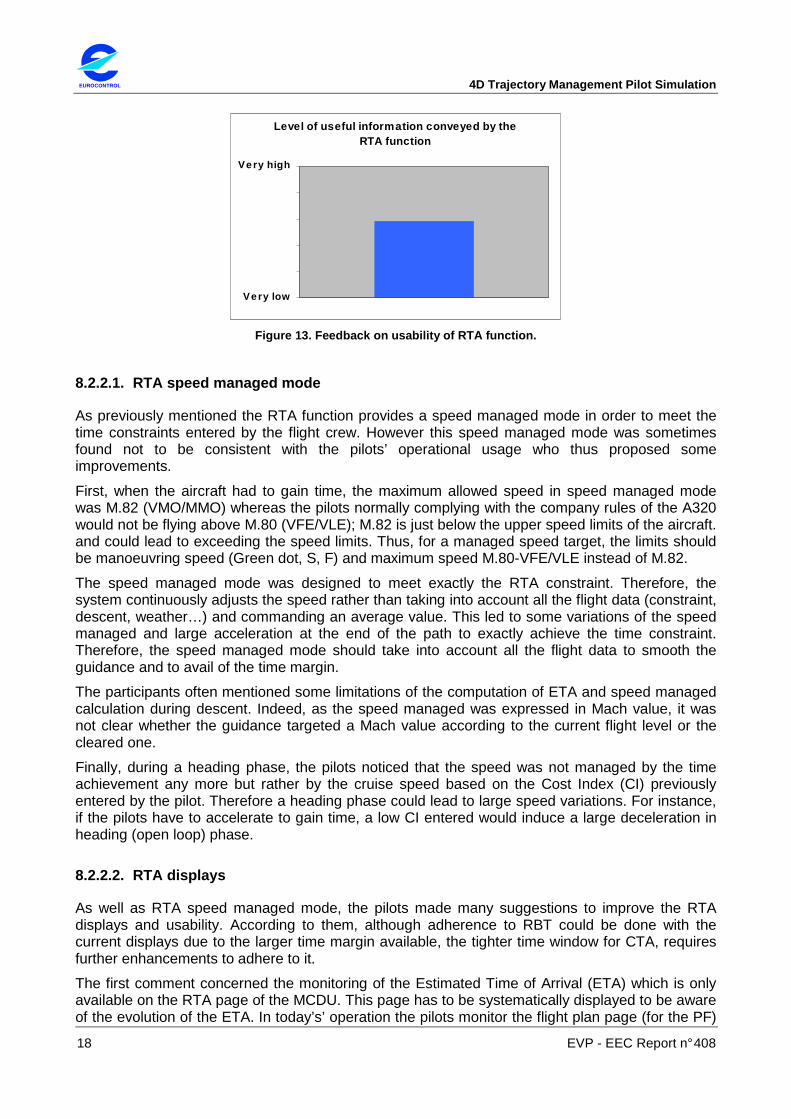
On average, the usability of the RTA function was rated medium by the participants (Figure 13). Although some problems were encountered during one run (see 7.2), the pilots thought that the information conveyed by the RTA function was not helpful enough and thus required further improvements to allow the flight crew to correctly achieve the time constraint. Therefore many suggestions were made to improve the functionalities, mainly on the RTA speed managed mode to meet the time and RTA displays to monitor the situation and elaborate strategies.
EUROCONTROL 4D Trajectory Management Pilot Simulation
18 EVP - EEC Report n° 408
Level of useful information conveyed by the RTA function
Very low
Very high
Figure 13. Feedback on usability of RTA function.
8.2.2.1. RTA speed managed mode
As previously mentioned the RTA function provides a speed managed mode in order to meet the time constraints entered by the flight crew. However this speed managed mode was sometimes found not to be consistent with the pilots’ operational usage who thus proposed some improvements.
First, when the aircraft had to gain time, the maximum allowed speed in speed managed mode was M.82 (VMO/MMO) whereas the pilots normally complying with the company rules of the A320 would not be flying above M.80 (VFE/VLE); M.82 is just below the upper speed limits of the aircraft. and could lead to exceeding the speed limits. Thus, for a managed speed target, the limits should be manoeuvring speed (Green dot, S, F) and maximum speed M.80-VFE/VLE instead of M.82.
The speed managed mode was designed to meet exactly the RTA constraint. Therefore, the system continuously adjusts the speed rather than taking into account all the flight data (constraint, descent, weather…) and commanding an average value. This led to some variations of the speed managed and large acceleration at the end of the path to exactly achieve the time constraint. Therefore, the speed managed mode should take into account all the flight data to smooth the guidance and to avail of the time margin.
The participants often mentioned some limitations of the computation of ETA and speed managed calculation during descent. Indeed, as the speed managed was expressed in Mach value, it was not clear whether the guidance targeted a Mach value according to the current flight level or the cleared one.
Finally, during a heading phase, the pilots noticed that the speed was not managed by the time achievement any more but rather by the cruise speed based on the Cost Index (CI) previously entered by the pilot. Therefore a heading phase could lead to large speed variations. For instance, if the pilots have to accelerate to gain time, a low CI entered would induce a large deceleration in heading (open loop) phase.
8.2.2.2. RTA displays
As well as RTA speed managed mode, the pilots made many suggestions to improve the RTA displays and usability. According to them, although adherence to RBT could be done with the current displays due to the larger time margin available, the tighter time window for CTA, requires further enhancements to adhere to it.
The first comment concerned the monitoring of the Estimated Time of Arrival (ETA) which is only available on the RTA page of the MCDU. This page has to be systematically displayed to be aware of the evolution of the ETA. In today’s’ operation the pilots monitor the flight plan page (for the PF)

4D Trajectory Management Pilot Simulation EUROCONTROL
EVP - EEC Report n° 408 19
and the performance page (for the PNF) during cruise phase. Thus, to avoid a head down situation monitoring an “unusual” page on the MCDU, the pilots proposed to use the ND to display either the ETA value or the difference between RTA and ETA. This information could be added near the RTA value which is already displayed as a constraint (in magenta) close to the concerned waypoint. In addition, there was sometimes some confusion as to whether the pilots were flying to an RBT or a CTA. Therefore, an indication of the available time margin should also be added.
Secondly, most of the pilots complained about the fact that the current RTA function did not allow them to elaborate a “strategy” (i.e. selecting the appropriate manoeuvres) to meet the time constraint. To do so, the participants suggested that the RTA function should include “what if” tools, to see for instance the impact of a shortcut or a heading phase. This would allow the pilots to anticipate their actions and to choose the appropriate manoeuvre (with appropriate clearance from ATC as required) instead of having to perform the action to see its consequences.
8.2.3. Responsibility
As illustrated in Figure 14, the large majority of the participants (7 out of 8) thought that both controllers and pilots should be responsible for managing the 4D trajectory. According to the pilots both actors should work in collaboration towards the same aim. The pilots should be in charge of speed control in order to meet the RTA time constraint, and the controllers in charge of facilitating or proposing lateral deviation (e.g. direct-to to shorten the tracks) if speed adjustments are not sufficient. Note that some pilots thought that the RBT task could be managed by the flight crew due to the larger time frame window, whereas the CTA requires additional collaboration with the controllers to meet the constraint. One of the participants felt that the pilot could be the solely responsible for managing the 4D trajectory as the pilot is more aware of the aircraft performance than the controller. He nevertheless agreed that the controllers could suggest lateral deviation to help gain or lose time.
Responsibilities for 4D trajectory management
0
2
4
6
8
Pilots Controllers Did notmatter
Both pilotsand
controllers
Num
ber o
f ans
wer
s
Figure 14. Feedback on actors responsibilities for 4D trajectory management.
8.2.4. Activity
The following section provides analysis of pilots’ acceptance of 4D trajectory management task in terms of activity. It comprises three aspects: subjective feedback on the pilots’ strategy to meet the time constraint, objective assessments in terms of manual actions performed (speed adjustments and/or lateral actions) and the use of speed modes (selected and managed). Note that for both objective results, the Run5 is broken down into two phases (RBT and CTA phase) according to the task demanded to the pilots. In addition, as the analyses concern the duration of runs, note that Run2 lasted about 45 minutes unlike the other three which lasted about 20 minutes.

EUROCONTROL 4D Trajectory Management Pilot Simulation
20 EVP - EEC Report n° 408
8.2.4.1. Strategy
As anticipated, most of the participants (6 out of 8 pilots) agreed on the fact that they would rather use speed only to lose time whereas both speed and lateral actions could be required to gain time (Figure 15). Indeed, as long as the manoeuvre requires speed within an acceptable window, speed reduction seems to be the most appropriate and easiest way to lose time and allow fuel saving. In the same way, the use of lateral actions (e.g. direct) seems to be the easiest method to gain time and also saves fuel compared to an increase of speed. However, depending on the route structure, the pilots acknowledged that a direct might not be sufficient to gain the required time and therefore an increase in speed (to an acceptable limit) may also be required.
Preffered strategy for 4D trajectory management
0
2
4
6
8
Speed only Lateral only Did notmatter
Both speedand lateral
Num
ber o
f ans
wer
s
Gain time Lose time
Figure 15. Preferred strategy to perform 4D trajecto ry management task.
8.2.4.2. Number of manual actions
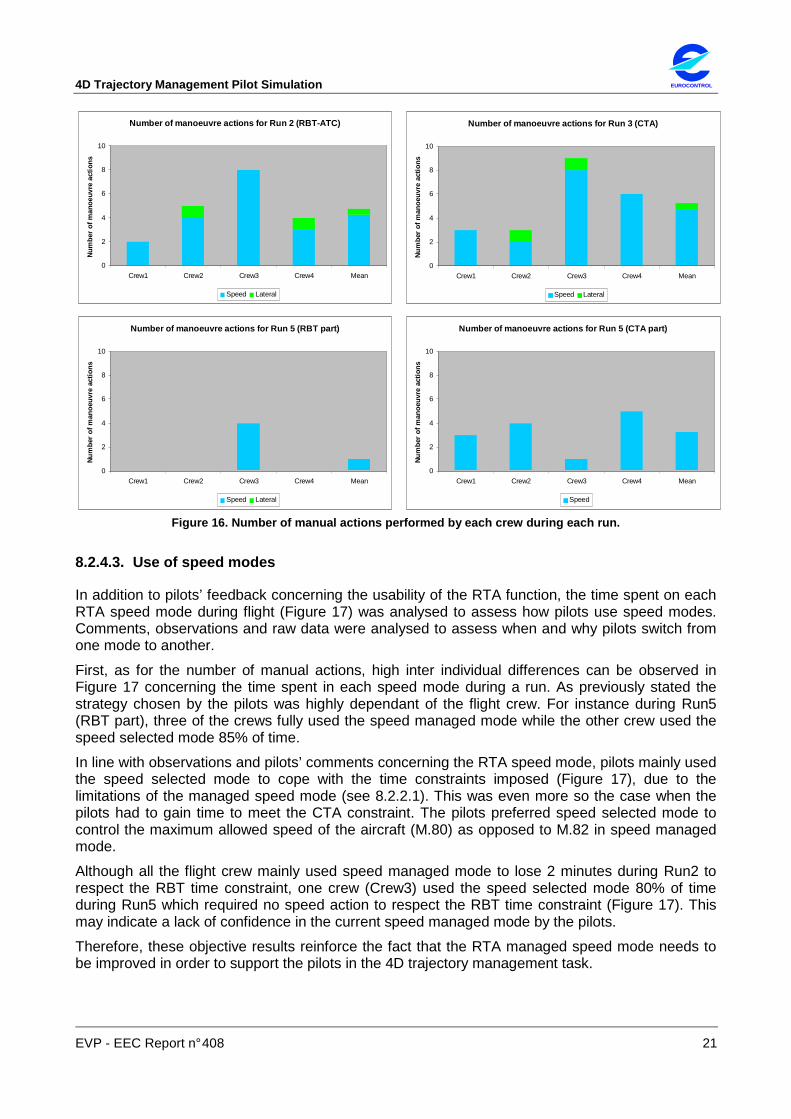
In addition to observations, the number of manual actions performed during each run were analysed to objectively assess how each flight crew managed the 4D trajectory during each run (Figure 16). Manual actions included speed increments and lateral actions (direct-to). A speed action corresponds to a set of selected increments separated by a time interval less than 5 seconds. Although some crews requested direct-to during Run5, this request was rejected by the pseudo controllers, as a planned instruction (heading) in the exercise was to be issued later.
Firstly, high inter individual differences can be observed in Figure 16 for both speed and lateral actions performed by the pilots during a run. The flight crews used different strategies according to the run and the demanded tasks, either by using speed, or both lateral and speed manoeuvres. For instance, during Run3 where the pilots had 1 minute to gain in 20 minutes two of the flight crews (Crew2 and Crew3) used lateral action (by requesting a direct-to) in addition to speed actions whereas both other crews only used speed adjustment to meet the time constraint. Moreover, even when required to lose time (Run2) two flight crews requested a direct to, in order to fly at reduced speed.
In addition, it can be noted that the CTA tasks were more demanding than the RBT task actions in terms of frequency of speed actions. On average, the flight crew performed 4 speed actions in 20’ (Run3 and Run5-CTA part) whereas 4 speed adjustments were performed in 45 minutes during Run2. This can be due to the tighter time frame window requiring more accuracy and thus requiring more speed adjustments.
4D Trajectory Management Pilot Simulation EUROCONTROL
EVP - EEC Report n° 408 21
Number of manoeuvre actions for Run 2 (RBT-ATC)
0
2
4
6
8
10
Crew1 Crew2 Crew3 Crew4 Mean
Num
ber
of m
anoe
uvre
act
ions
Speed Lateral
Number of manoeuvre actions for Run 3 (CTA)
0
2
4
6
8
10
Crew1 Crew2 Crew3 Crew4 Mean
Num
ber
of m
anoe
uvre
act
ions
Speed Lateral
Number of manoeuvre actions for Run 5 (RBT part)
0
2
4
6
8
10
Crew1 Crew2 Crew3 Crew4 Mean
Num
ber
of m
anoe
uvre
act
ions
Speed Lateral
Number of manoeuvre actions for Run 5 (CTA part)
0
2
4
6
8
10
Crew1 Crew2 Crew3 Crew4 Mean
Num
ber
of m
anoe
uvre
act
ions
Speed
Figure 16. Number of manual actions performed by ea ch crew during each run.
8.2.4.3. Use of speed modes
In addition to pilots’ feedback concerning the usability of the RTA function, the time spent on each RTA speed mode during flight (Figure 17) was analysed to assess how pilots use speed modes. Comments, observations and raw data were analysed to assess when and why pilots switch from one mode to another.
First, as for the number of manual actions, high inter individual differences can be observed in Figure 17 concerning the time spent in each speed mode during a run. As previously stated the strategy chosen by the pilots was highly dependant of the flight crew. For instance during Run5 (RBT part), three of the crews fully used the speed managed mode while the other crew used the speed selected mode 85% of time.
In line with observations and pilots’ comments concerning the RTA speed mode, pilots mainly used the speed selected mode to cope with the time constraints imposed (Figure 17), due to the limitations of the managed speed mode (see 8.2.2.1). This was even more so the case when the pilots had to gain time to meet the CTA constraint. The pilots preferred speed selected mode to control the maximum allowed speed of the aircraft (M.80) as opposed to M.82 in speed managed mode.
Although all the flight crew mainly used speed managed mode to lose 2 minutes during Run2 to respect the RBT time constraint, one crew (Crew3) used the speed selected mode 80% of time during Run5 which required no speed action to respect the RBT time constraint (Figure 17). This may indicate a lack of confidence in the current speed managed mode by the pilots.
Therefore, these objective results reinforce the fact that the RTA managed speed mode needs to be improved in order to support the pilots in the 4D trajectory management task.

EUROCONTROL 4D Trajectory Management Pilot Simulation
22 EVP - EEC Report n° 408
Time spent in each speed mode for Run 2 (RBT-ATC)
0%
25%
50%
75%
100%
Crew1 Crew2 Crew3 Crew4 Mean
Per
cent
age
of ti
me
Selected Managed
Time spent in each speed mode for Run 3 (CTA)
0%
25%
50%
75%
100%
Crew1 Crew2 Crew3 Crew4 Mean
Per
cent
age
of ti
me
Selected Managed
Time spent in each speed mode for Run 5 (CTA part)
0%
25%
50%
75%
100%
Crew1 Crew2 Crew3 Crew4 Mean
Per
cent
age
of ti
me
Selected Managed
Time spent in each speed mode for Run 5 (RBT part)
0%
25%
50%
75%
100%
Crew1 Crew2 Crew3 Crew4 Mean
Per
cent
age
of ti
me
Selected Managed
Figure 17. Speed mode duration per crew and per run.
8.2.5. Synthesis
According to the participants, 4D trajectory management induces a new relationship between pilots and time to respect, as there will be more work for the pilots if the RTA is missed (e.g. renegotiation). However, as the time constraint is issued just before take off, the RBT task to either gain or lose time, in order to be within [-2min; +3min] at a given point, was found highly feasible in view of the large time frame window available. The achievement of CTA time constraint within a tighter tolerance (±30s) was nevertheless felt slightly more difficult and required close collaboration with the controller.
Therefore, the large majority of the participants thought that both controllers and pilots should be responsible for managing the 4D trajectory. The pilots should be in charge of speed adjustments in order to meet the RTA time constraint, and the controllers in charge of facilitating or proposing lateral deviations (e.g. direct-to to shorten the tracks) if speed adjustments are not sufficient. As anticipated, most of the participants agreed on the fact that they would rather use only speed to lose time whereas both speed and lateral actions could be required to gain time.
In terms of manual actions, high inter individual differences were observed. The flight crews used different strategies according to the run and the demanded tasks either by using speed only, or both lateral and speed manoeuvres. As for the number of manual actions, the use of speed managed or selected mode was also highly dependant on the flight crew.
In line with the pilots’ comments, the main use of speed selected mode in some runs, especially to meet the CTA constraint (88% of time), reinforces the fact that the RTA function was not totally usable in the simulation setting. The computation of the speed managed as well as ETA should be enhanced to increase the robustness of the system especially during the descent phase. Moreover, additional support (late/early indication on the navigation display, and a ‘what if’ tool) would help to support pilots to monitor the situation and select appropriate action.

4D Trajectory Management Pilot Simulation EUROCONTROL
EVP - EEC Report n° 408 23
8.3. WORKLOAD
To investigate pilots’ workload, pilots’ feedback and NASA-TLX questionnaires were used. The NASA-TLX questionnaires filled at the end of each run addressed six dimensions: mental demand, temporal demand, physical demand, frustration and effort. Mean scores of NASA-TLX questionnaires are presented per run performed (Figure 18).
Overall, Figure 18 shows a good level of acceptability of the 4D trajectory management task in terms of workload for both PF and PNF during the three runs performed. All dimensions assessed by the NASA-TLX questionnaire (except the performance dimension) are below 4 (and below 40 for mental effort) indicating a moderate level of workload. In addition, this moderate level of workload perceived by the pilots did not affect their performance level which was rated around 7. According to the participants, although 4D trajectory management requires an additional task on board, the induced workload is acceptable in cruise phase. However, the RTA function did not perform as expected and so caused additional workload due to inconsistencies in speed managed mode.
Moreover, it should be noted that the 4D trajectory management task caused slightly more workload for the PF than the PNF (Figure 18). The PF being in charge of the trajectory of the aircraft had obviously additional workload in order to follow the required 4D trajectory by adjusting speed and selecting appropriate manoeuvre(s).
Although all the dimensions assessed by the questionnaire were rated quite positively, it can be observed that the Run5 generated slightly more workload and decreased the perceived level of performance compared to the two other runs. Indeed, this run was the most difficult one as the flight crew had to gain 30 seconds in order to respect a CTA constraint while coping with two controller heading instructions deviating the aircraft from the initial route. Once on a heading, in an open loop situation, no information is available to help the pilot achieve the time constraint. Therefore, the pilots pushed the aircraft to the maximum performance limits by increasing speed unaware as to whether this would be sufficient to meet the constraint. The pilots questioned the feasibility of a renegotiation process for a new CTA when the aircraft may be less than 5 minutes from the concerned waypoint. This reinforced their belief of the importance of close collaboration, between both controllers and pilots in order to achieve the original time.

EUROCONTROL 4D Trajectory Management Pilot Simulation
24 EVP - EEC Report n° 408
Mental demand per run
0
30
60
90
120
150
Run 2 Run 3 Run 5
PF PNF
�
☺
Physical demand per run
0
2
4
6
8
10
Run 2 Run 3 Run 5
PF PNF
�
☺
Temporal demand per run
0
2
4
6
8
10
Run 2 Run 3 Run 5
PF PNF
�
☺
Performance per run
0
2
4
6
8
10
Run 2 Run 3 Run 5
PF PNF
�
☺
Effort per run
0
2
4
6
8
10
Run 2 Run 3 Run 5
PF PNF
�
☺
Frustration per run
0
2
4
6
8
10
Run 2 Run 3 Run 5
PF PNF
�
☺
Figure 18. Impact of 4D trajectory management on me an score of NASA-TLX.
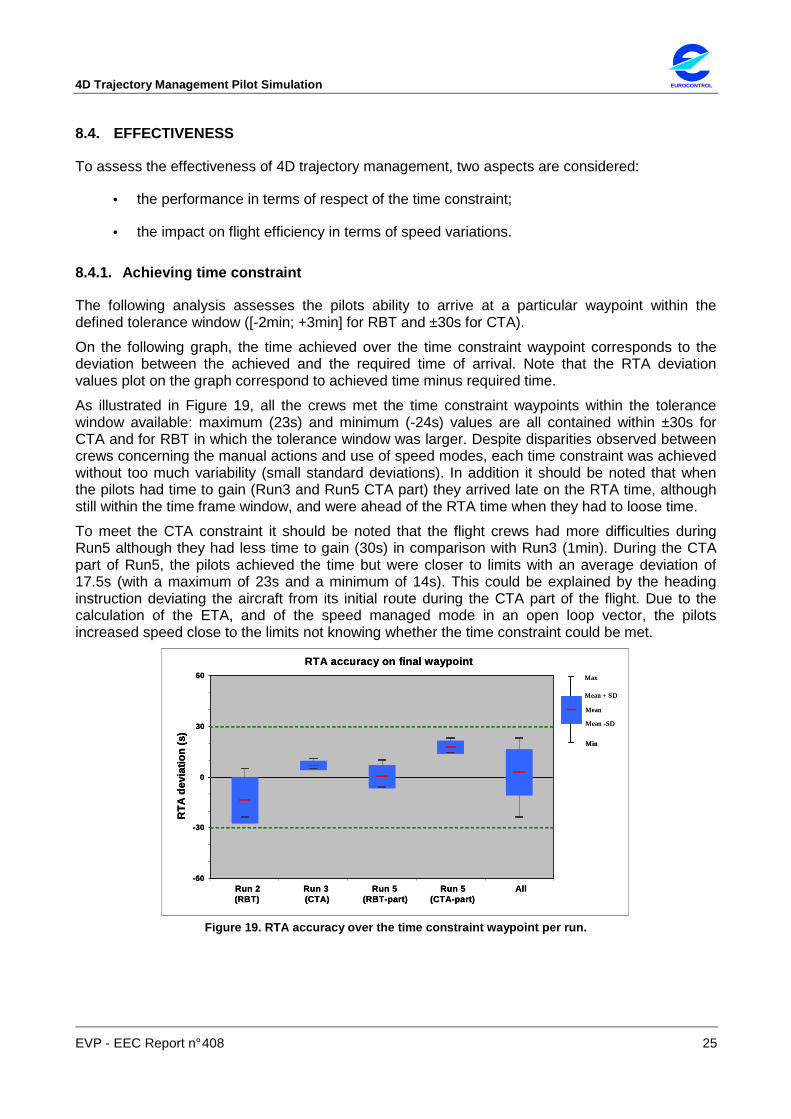
4D Trajectory Management Pilot Simulation EUROCONTROL
EVP - EEC Report n° 408 25
8.4. EFFECTIVENESS
To assess the effectiveness of 4D trajectory management, two aspects are considered:
• the performance in terms of respect of the time constraint;
• the impact on flight efficiency in terms of speed variations.
8.4.1. Achieving time constraint
The following analysis assesses the pilots ability to arrive at a particular waypoint within the defined tolerance window ([-2min; +3min] for RBT and ±30s for CTA).
On the following graph, the time achieved over the time constraint waypoint corresponds to the deviation between the achieved and the required time of arrival. Note that the RTA deviation values plot on the graph correspond to achieved time minus required time.
As illustrated in Figure 19, all the crews met the time constraint waypoints within the tolerance window available: maximum (23s) and minimum (-24s) values are all contained within ±30s for CTA and for RBT in which the tolerance window was larger. Despite disparities observed between crews concerning the manual actions and use of speed modes, each time constraint was achieved without too much variability (small standard deviations). In addition it should be noted that when the pilots had time to gain (Run3 and Run5 CTA part) they arrived late on the RTA time, although still within the time frame window, and were ahead of the RTA time when they had to loose time.
To meet the CTA constraint it should be noted that the flight crews had more difficulties during Run5 although they had less time to gain (30s) in comparison with Run3 (1min). During the CTA part of Run5, the pilots achieved the time but were closer to limits with an average deviation of 17.5s (with a maximum of 23s and a minimum of 14s). This could be explained by the heading instruction deviating the aircraft from its initial route during the CTA part of the flight. Due to the calculation of the ETA, and of the speed managed mode in an open loop vector, the pilots increased speed close to the limits not knowing whether the time constraint could be met.
Run 2(RBT)
Run 3(CTA)
Run 5(RBT-part)
Run 5(CTA-part)
All
RTA accuracy on final waypoint
RT
A d
evia
tion
(s)
Max
Mean
Mean + SD
Mean -SD
-60
-30
0
30
60
Min
Run 2(RBT)
Run 3(CTA)
Run 5(RBT-part)
Run 5(CTA-part)
All
RTA accuracy on final waypoint
RT
A d
evia
tion
(s)
Max
Mean
Mean + SD
Mean -SD
-60
-30
0
30
60
MinMin
Figure 19. RTA accuracy over the time constraint wa ypoint per run.

EUROCONTROL 4D Trajectory Management Pilot Simulation
26 EVP - EEC Report n° 408
8.4.2. Flight efficiency
Flight efficiency was first assessed through the overall feedback concerning the fuel consumption and passenger comfort compared to today. In addition, the cost induced in terms of speed variations to achieve the required time constraint was also analysed.
8.4.2.1. Overall feedback
According to the participants, the pilots rated the level of flight efficiency similar to today in terms of fuel consumption and passenger comfort (Figure 20). However, most of the pilots mentioned that the economical aspects should be taken into account, as well as comfort before the implementation of such a concept. Indeed, 4D trajectory management should avoid aircraft always increasing to maximum speed to meet the time constraint, thus burning more fuel. Moreover, the speed managed mode should be improved by smoothing guidance to avoid brutal speed changes due to rapid changes in wind that might degrade the passenger comfort.
Level of flight efficiency compared to today
Very low
Very high
Figure 20. Feedback on descent efficiency.
8.4.2.2. Speed variations
Although the pilots aim was to meet the time constraint over the time constraint waypoint, the speed variations induced by 4D trajectory management and ETA throughout the flights were also analysed. The RTA function displays an ETA over the concerned waypoint based on calculation made by the FMS.
For a better understanding, the following analyses are presented individually by run performed. On the following graphs, the ETA deviation values plot on the graph correspond to current ETA minus the required time and speed values are expressed in Mach. Note that the scales used for Run2 (ETA and Speed) are different than the others due to the larger ETA and speed variations that occurred. Moreover, the limitations of the RTA function sometimes caused jumps of the speed profiles when starting the descent (Crew4 at 25min on Figure 21, Crew1 at 15min on Figure 22, Crew4 at 15min on Figure 24); in normal operations, the pilots would have disengaged the speed managed mode.

4D Trajectory Management Pilot Simulation EUROCONTROL
EVP - EEC Report n° 408 27
• Run2 (RBT) Globally, it can be observed in Figure 21, bottom that the loss of 2 minutes led to large speed variation especially during and after the Top Of Descent (TOD). All the flight crews had to suddenly decelerate a lot (even down to M.55 for Crew1 and 4) before further reaccelerating to M.67 3 minutes later.
These large speed variations can be due to the jumps of the ETA after the Top Of Descent observed in Figure 21, that may induce an inaccurate speed managed value during that time. It can also be noticed that the RTA continued to command speed adjustments during the last ten minutes although the ETA was contained within the tolerance window of [-2min; +3min] during this phase. This reinforces the fact that the RTA managed speed mode needs to be improved to handle speed adjustments more smoothly.
Note that for Crew2, who requested and received a direct-to instruction (10 minutes into the run), the speed managed guidance decelerated to lose the 2 minutes to M.70. As the flight crew thought the speed too slow for this altitude (FL330), they decided to accelerate to M.76 which resulted in the ETA being 2 minutes early on the RTA time.
ETA Run 2 (RBT)
-150
-120
-90
-60
-30
0
30
60
90
120
0 5 10 15 20 25 30 35 40 45 50Time (mn)
ET
A d
evia
tion
(s)
Crew 1 Crew 2 Crew 3 Crew 4
Top Of DescentController intruction
(heading)
Aircraft is too in advance due to too high speed
ETA Run 2 (RBT)
-150
-120
-90
-60
-30
0
30
60
90
120
0 5 10 15 20 25 30 35 40 45 500 5 10 15 20 25 30 35 40 45 50Time (mn)
ET
A d
evia
tion
(s)
Crew 1 Crew 2 Crew 3 Crew 4
Top Of DescentController intruction
(heading)
Aircraft is too in advance due to too high speed
Speed profiles Run 2 (RBT)
0.52
0.55
0.58
0.61
0.64
0.67
0.7
0.73
0.76
0.79
0.82
Spe
ed (
Mac
h)
Crew 1 Crew 2 Crew 3 Crew 4
0 5 10 15 20 25 30 35 40 45 50Time (mn)
Pilots had to decelerate as they
previsously took a direct-to
Strong deceleration for all crews
due to the descent from FL340 to
FL260
Speed profiles Run 2 (RBT)
0.52
0.55
0.58
0.61
0.64
0.67
0.7
0.73
0.76
0.79
0.82
Spe
ed (
Mac
h)
Crew 1 Crew 2 Crew 3 Crew 4
0 5 10 15 20 25 30 35 40 45 500 5 10 15 20 25 30 35 40 45 50Time (mn)
Pilots had to decelerate as they
previsously took a direct-to
Strong deceleration for all crews
due to the descent from FL340 to
FL260
Figure 21. Evolution of the ETA and related speed pr ofiles for Run2 (RBT).

EUROCONTROL 4D Trajectory Management Pilot Simulation
28 EVP - EEC Report n° 408
• Run3 (CTA) During the Run3 in which pilots had to gain 1 minute, they all started to accelerate to M.80 (which is the maximum speed limit allowed) as observed in Figure 22, bottom. As a reminder, the speed managed mode targeted M.82 (starting for Crew2 and Crew4 in Figure 22, bottom) inducing a switch in speed selected mode manual reduction towards M.80. Then, after the Top Of Descent, both crews that requested a direct-to (Crew2 and Crew3) started to decelerate, whereas both other crews had to maintain M.81 and even to reaccelerate to M.81 for Crew4. Thus, the gain of about 7NM by the direct-to allowed to fly at a lower speed although the speed guidance would have started to reduce earlier.
ETA Run 3 (CTA)
-60
-30
0
30
60
0 5 10 15 20 25
Time (mn)
ET
A d
evia
tion
(s)
Crew 1 Crew 2 Crew 3 Crew 4
Top Of DescentInitialisation
Decrease of the ETA as the crew
took a direct-to
ETA Run 3 (CTA)
-60
-30
0
30
60
0 5 10 15 20 250 5 10 15 20 25
Time (mn)
ET
A d
evia
tion
(s)
Crew 1 Crew 2 Crew 3 Crew 4
Top Of DescentInitialisation
Decrease of the ETA as the crew
took a direct-to
Speed profile Run 3 (CTA)
0.71
0.72
0.73
0.74
0.75
0.76
0.77
0.78
0.79
0.8
0.81
0.82
Spe
ed (
Mac
h)
Crew 1 Crew 2 Crew 3 Crew 4
0 5 10 15 20 25
Time (mn)
Top Of Descent from
FL330 to FL270
Both crews had
to decelerate due
to the direct-to
they previously
took
Took speed in selected speed due
to increase towards M.82 in
managed speed mode
Speed profile Run 3 (CTA)
0.71
0.72
0.73
0.74
0.75
0.76
0.77
0.78
0.79
0.8
0.81
0.82
Spe
ed (
Mac
h)
Crew 1 Crew 2 Crew 3 Crew 4
0 5 10 15 20 250 5 10 15 20 25
Time (mn)
Top Of Descent from
FL330 to FL270
Both crews had
to decelerate due
to the direct-to
they previously
took
Took speed in selected speed due
to increase towards M.82 in
managed speed mode
Figure 22. Evolution of the ETA and related speed pr ofiles for Run3 (CTA).

4D Trajectory Management Pilot Simulation EUROCONTROL
EVP - EEC Report n° 408 29
• Run5 (RBT part) It can be observed in Figure 23, that although the flights were almost at the same speed (M.80), the heading phase (from 9th to 12th minute) had a different impact on the ETA and the speed profiles for each aircraft.
ETA Run 5 (RBT part)
-60
-30
0
30
60
0 5 10 15 20 25 30
Time (mn)
ET
A d
evia
tion
(s)
Crew 1 Crew 2 Crew 3 Crew 4
Back to the initial route after
heading phase
ETA Run 5 (RBT part)
-60
-30
0
30
60
0 5 10 15 20 25 30
Time (mn)
ET
A d
evia
tion
(s)
Crew 1 Crew 2 Crew 3 Crew 4
Back to the initial route after
heading phase
Speed profiles Run 5 (RBT part)
0.71
0.72
0.73
0.74
0.75
0.76
0.77
0.78
0.79
0.8
0.81
0.82
Spe
ed (
Mac
h)
Crew 1 Crew 2 Crew 3 Crew 4
0 5 10 15 20 25 30
Heading phase
Speed profiles Run 5 (RBT part)
0.71
0.72
0.73
0.74
0.75
0.76
0.77
0.78
0.79
0.8
0.81
0.82
Spe
ed (
Mac
h)
Crew 1 Crew 2 Crew 3 Crew 4
0 5 10 15 20 25 30
Heading phase
Figure 23. Evolution of the ETA and related speed pr ofiles for Run5 (RBT part).
• Run5 (CTA part) This run in which the pilots had to gain 30 seconds while coping with a heading phase for 3 minutes was felt the most difficult one to handle. Indeed, for 12 minutes most of the crews had to fly very fast (M.81) after the heading phase to meet the RTA constraint. Therefore the crews expressed difficulties as they were close to the limits in terms of speed and outside the tolerance window (±30s) during the descent (Figure 24). Inaccurate calculation of the speed in managed mode during the descent, which commanded M.77 despite the fact that they were running late (+15s), had a big impact on Crew4. In addition, it can be noticed that the Crew3 was the most accurate in achieving the time without increasing too much speed, by continuously flying at M.80 (Figure 24). Actually, as soon as they felt they would reach the ±30s limits, the crew requested a descent towards an intermediate level (FL290) at the 8th minute. This allowed them to increase the ground speed without increasing the selected speed and therefore fly ‘faster’ to the time constraint waypoint.

EUROCONTROL 4D Trajectory Management Pilot Simulation
30 EVP - EEC Report n° 408
ETA Run 5 (CTA part)
-60
-30
0
30
60
0 5 10 15 20
Time (mn)
ET
A d
evia
tion
(s)
Crew 1 Crew 2 Crew 3 Crew 4
Top Of Descent
Initialisation
Heading phaseETA accurate over the point although no
speed increase (crew 3). Actually requested
descent ealier to increase GS
ETA Run 5 (CTA part)
-60
-30
0
30
60
0 5 10 15 20
Time (mn)
ET
A d
evia
tion
(s)
Crew 1 Crew 2 Crew 3 Crew 4
Top Of Descent
Initialisation
Heading phaseETA accurate over the point although no
speed increase (crew 3). Actually requested
descent ealier to increase GS
Speed profile Run 5 (CTA part)
0.71
0.72
0.73
0.74
0.75
0.76
0.77
0.78
0.79
0.8
0.81
0.82
Spe
ed (
Mac
h)
Crew 1 Crew 2 Crew 3 Crew 4
0 5 10 15 20
Time (mn)
Speed profile Run 5 (CTA part)
0.71
0.72
0.73
0.74
0.75
0.76
0.77
0.78
0.79
0.8
0.81
0.82
Spe
ed (
Mac
h)
Crew 1 Crew 2 Crew 3 Crew 4
0 5 10 15 20
Time (mn)
Top Of Descent
from FL330 to
FL270
Had to accelerate as closed
to the CTA tolerance window
of +/-30sec
Figure 24. Evolution of the ETA and related speed pr ofiles for Run5 (CTA part).
Although all these speed variations caused an additional task load to the pilots in terms of actions, they also induced a cost in terms of fuel burn. A smoothing of the speed guidance could reduce these variations and avoid consuming too much fuel. However, the task of gaining time would obviously lead to an increase of speed and so more fuel consumption.
8.4.3. Synthesis
In terms of effectiveness, objective results shows that all the flight crews accurately achieved the time constraint within the tolerance window (mean of 2.7s and standard deviation of 14s) as maximum (23s) and minimum (-24s) values are contained within ±30s. However, gaining time to achieve the CTA constraint was less accurate and more difficult due to tighter time frame window and controller interventions. Despite less time to gain (30s), the controller instruction (heading) made the CTA constraint more difficult to achieve (mean of 18 and standard deviation of 4s) than gaining 1 minute without any perturbation (mean of 7s and standard deviation of 3s). Once on a heading, in an open loop situation, no information is available to assist the pilot in achieving the time constraint. The current calculation of the ETA which was not robust enough especially during descent led to some speed variations that could be costly in terms of fuel consumption. The calculation of the speed managed mode and related ETA should be therefore improved to smooth the speed variation in order to reduce the cost. Although the task of gaining time would obviously
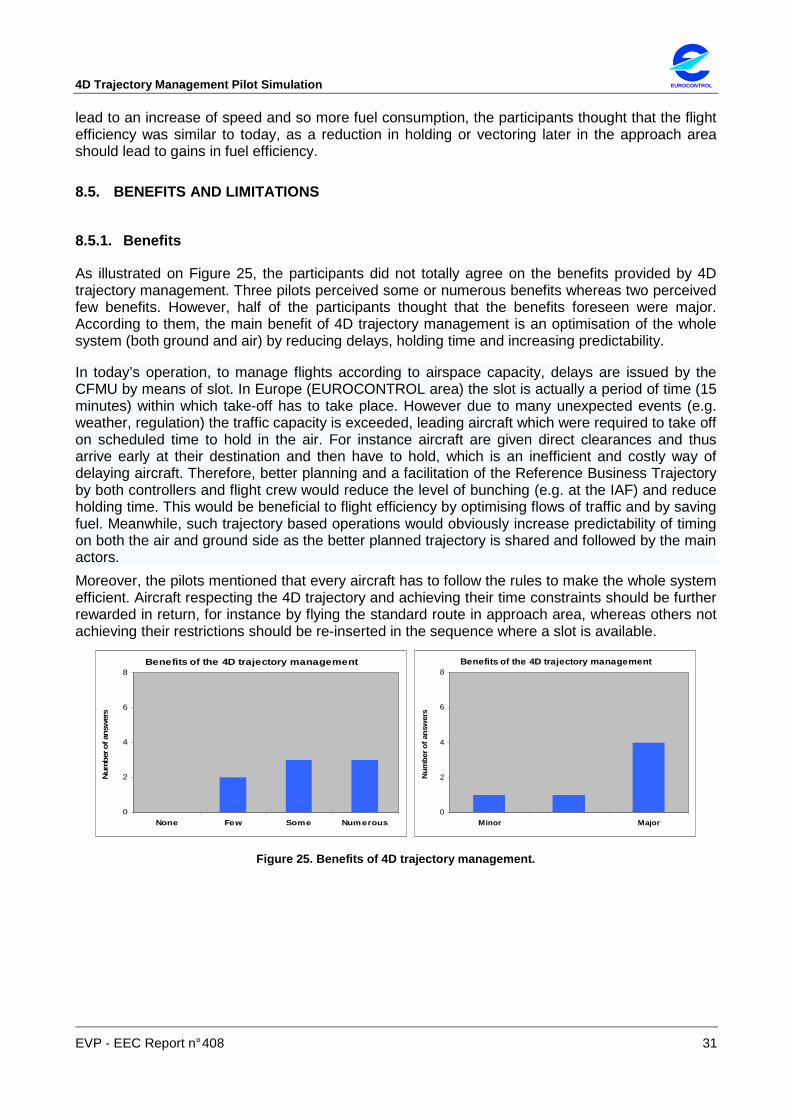
4D Trajectory Management Pilot Simulation EUROCONTROL
EVP - EEC Report n° 408 31
lead to an increase of speed and so more fuel consumption, the participants thought that the flight efficiency was similar to today, as a reduction in holding or vectoring later in the approach area should lead to gains in fuel efficiency.
8.5. BENEFITS AND LIMITATIONS
8.5.1. Benefits
As illustrated on Figure 25, the participants did not totally agree on the benefits provided by 4D trajectory management. Three pilots perceived some or numerous benefits whereas two perceived few benefits. However, half of the participants thought that the benefits foreseen were major. According to them, the main benefit of 4D trajectory management is an optimisation of the whole system (both ground and air) by reducing delays, holding time and increasing predictability.
In today’s operation, to manage flights according to airspace capacity, delays are issued by the CFMU by means of slot. In Europe (EUROCONTROL area) the slot is actually a period of time (15 minutes) within which take-off has to take place. However due to many unexpected events (e.g. weather, regulation) the traffic capacity is exceeded, leading aircraft which were required to take off on scheduled time to hold in the air. For instance aircraft are given direct clearances and thus arrive early at their destination and then have to hold, which is an inefficient and costly way of delaying aircraft. Therefore, better planning and a facilitation of the Reference Business Trajectory by both controllers and flight crew would reduce the level of bunching (e.g. at the IAF) and reduce holding time. This would be beneficial to flight efficiency by optimising flows of traffic and by saving fuel. Meanwhile, such trajectory based operations would obviously increase predictability of timing on both the air and ground side as the better planned trajectory is shared and followed by the main actors.
Moreover, the pilots mentioned that every aircraft has to follow the rules to make the whole system efficient. Aircraft respecting the 4D trajectory and achieving their time constraints should be further rewarded in return, for instance by flying the standard route in approach area, whereas others not achieving their restrictions should be re-inserted in the sequence where a slot is available.
Benefits of the 4D trajectory management
0
2
4
6
8
None Few Some Numerous
Num
ber o
f ans
wer
s
Benefits of the 4D trajectory management
0
2
4
6
8
Minor Major
Num
ber o
f ans
wer
s
Figure 25. Benefits of 4D trajectory management.

EUROCONTROL 4D Trajectory Management Pilot Simulation
32 EVP - EEC Report n° 408
8.5.2. Limitations
As for the benefits foreseen, the participants did not share the same point of view concerning the limitations of 4D trajectory management (Figure 26). Half of the pilots perceived few limitations whereas the other perceived some or numerous limitations. Moreover, the participants did not agree about the impact of these limitations as the same number of pilots (two) rated them as major and minor. According to them, the main limitations concerned the foreseen difficulties to put such a concept in place due to the high inherent variability of the flight operations and the reduced amount of time that the pilots can gain or lose (2 minutes per hour of flight) for short and medium haul flights within Europe. Therefore close collaboration is required between pilots and controllers.
As previously mentioned, the flight crew has already some difficulties to take off within a slot time of 15 minutes due to external reasons (passenger flows, cargo loading…). Therefore, they expressed some doubts concerning the robustness of the whole system to guarantee a CTA time frame window of ±30s at the entry point of the approach areas. Unexpected events could easily lead to a new negotiation and then big problems for companies (e.g. with connecting flights). According to the participants, a lot of things need to be improved on ground operations at the departure airport including taxi solutions, as a key factor is the take off time, which is unpredictable (within 10 minutes) in today’s operation.
Finally, all the pilots perceived limitations coming from the current RTA function which is not consistent and robust enough to correctly perform the task. The usability of RTA managed mode and displays need to be enhanced in order to provide appropriate and reliable support to the flight crew to achieve the time constraint.
Limitations of the 4D trajectory management
0
2
4
6
8
None Few Some Numerous
Num
ber o
f ans
wer
s
Limitations of the 4D trajectory management
0
2
4
6
8
Minor Major
Num
ber o
f ans
wer
s
Figure 26. Limitations of 4D trajectory management.
8.5.3. Synthesis
For both foreseen benefits and limitations of 4D trajectory management, the pilots point of view were quite divided both in terms of number and impact. However, on average, the pilots perceived benefits in terms of a better smoothing of the whole traffic flow and a better predictability of timing. On the other hand, the pilots expressed some doubts concerning the global efficiency of such a concept inducing less flexibility and requiring a strict following of schedules. They also expressed some doubts concerning the overall efficiency of the system since unexpected events (weather, boarding delays…) may trigger many renegotiations of the RBT. In addition, the current RTA function should be improved to support pilots in achieving the time constraints.

4D Trajectory Management Pilot Simulation EUROCONTROL
EVP - EEC Report n° 408 33
9. CONCLUSION
The objective of the simulation was to perform an initial assessment of the operational feasibility of the execution of an Reference Business Trajectory (RBT) and a Controlled Time of Arrival (CTA), in en-route, from a pilot perspective. The simulation was conducted on an Airbus A320 fixed based simulator equipped with current Flight Management System (FMS) functionalities, over a period of one week in December 2007. It involved eight pilots from European airlines and from an aircraft manufacturer.
Pilots were exposed to typical situations in which aircraft deviate from the planned trajectory. The situations involved losing or gaining time to achieve RBT or CTA constraints while coping with controller interventions. To achieve the time constraints, the pilots used the Request Time of Arrival (RTA) function of the FMS. Four dimensions were considered for analysis: feasibility, workload, effectiveness and foreseen benefits and limitations. These dimensions were addressed using both subjective and objective data.
In the simulated situations, the pilots found adherence to 4D trajectories to be feasible in cruise and initial descent phases: gaining or losing time in order to respect an RBT time constraint (-2min; +3min) caused no difficulty. The tighter CTA tolerance window (±30s) was reported slightly more difficult to achieve and required closer coordination between pilots and controllers. Pilots suggested they should be in charge of speed control, and the controllers should facilitate or propose lateral changes if speed adjustments were not sufficient.
As anticipated, improvements to the current RTA functions are required. The computation of the managed speed as well as estimated times of arrival should be enhanced to increase the robustness of the guidance, especially during descent. Moreover, additional support (late/early indication on the navigation display, and a “what if” tool) were requested for monitoring and selecting appropriate action.
Although 4D trajectory management implies an additional task on board, especially for the pilot flying, this was felt to be an acceptable increase of workload in cruise. However, in the case that the RTA cannot be met, renegotiation would potentially cause a larger workload increase. Most of the pilots agreed that they would rather use only speed to lose time whereas both speed and lateral actions could be required to gain time. Despite large differences between individuals, the limitations of the current RTA function might explain the large use of the selected speed mode.
In terms of effectiveness, objective results show that all the flight crews always achieved both RBT and CTA time constraints within the tolerance windows. Despite the induced speed variations, the pilots thought that the flight efficiency was similar to today. Speed variations lead to an increase in fuel consumption, although this could be improved by smoother speed guidance. Reduction in holding or vectoring later in the approach area should lead to gains in fuel efficiency.
Most of the pilots agreed that 4D trajectory management could provide a better predictability of traffic flows (for traffic management) and of arrival times (for airlines) assuming adequate planning before take-off. However, the pilots expressed some doubts concerning the overall efficiency of the system since unexpected events (weather, boarding delays, separation provision…) may trigger many renegotiations of the RBT.
The findings from this simulation and from the ground simulation conducted previously will be used to help refine the 4D trajectory management concept in the context of SESAR.

EUROCONTROL 4D Trajectory Management Pilot Simulation
34 EVP - EEC Report n° 408
10. ANNEXES
10.1. ENTRY QUESTIONNAIRE
Entry questionnaire Name: Date: ___/___/___
1. What is your age?
____ years
2. How long have you been an airline pilot
_________flight hours ____ years
3. What types of aircraft are you rated on?
4. How long have you been flying Airbus?
_________flight hours ____ years
5. What is your current function? � Captain � First-officer � Other:
6. Have you ever participated to a simulation on 4D trajectory management? If yes, which one(s)?
Please briefly describe your pilot experience:
______________________________________________________________________________ ______________________________________________________________________________ ______________________________________________________________________________ ______________________________________________________________________________

4D Trajectory Management Pilot Simulation EUROCONTROL
EVP - EEC Report n° 408 35
10.2. POST RUN QUESTIONNAIRE
Date : Name :
Function : PF /PNF
Run #:
Post-run questionnaire
NASA TLX RATING SHEET INSTRUCTIONS: On each scale, place a mark that represents the magnitude of that factor in the task you just performed. MENTAL DEMAND Description
150
140
130
120
110
100
90
80
70
60
50
40
30
20
10
0
costing lots and lots of effort
costing very much effort
costing much effort
fairly effortful
rather effortful
costing some effort
costing a little effort
hardly effortful
costing no effort
Please indicate, with a cross on the vertical line, how much mental effort it costs to do your work in the run.
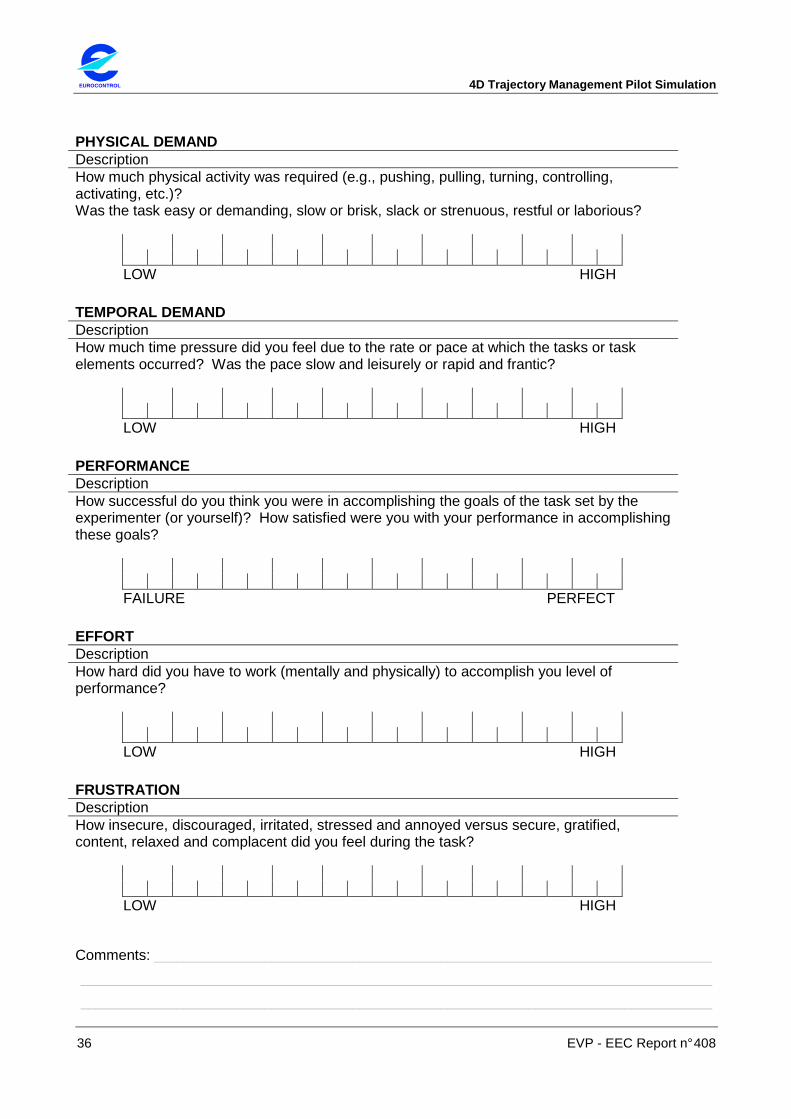
EUROCONTROL 4D Trajectory Management Pilot Simulation
36 EVP - EEC Report n° 408
PHYSICAL DEMAND Description How much physical activity was required (e.g., pushing, pulling, turning, controlling, activating, etc.)? Was the task easy or demanding, slow or brisk, slack or strenuous, restful or laborious?
LOW HIGH
TEMPORAL DEMAND Description How much time pressure did you feel due to the rate or pace at which the tasks or task elements occurred? Was the pace slow and leisurely or rapid and frantic?
LOW HIGH
PERFORMANCE Description How successful do you think you were in accomplishing the goals of the task set by the experimenter (or yourself)? How satisfied were you with your performance in accomplishing these goals?
FAILURE PERFECT
EFFORT Description How hard did you have to work (mentally and physically) to accomplish you level of performance?
LOW HIGH
FRUSTRATION Description How insecure, discouraged, irritated, stressed and annoyed versus secure, gratified, content, relaxed and complacent did you feel during the task?
LOW HIGH
Comments: ____________________________________________________________________________
______________________________________________________________________________________
______________________________________________________________________________________

4D Trajectory Management Pilot Simulation EUROCONTROL
EVP - EEC Report n° 408 37
10.3. POST EXPERIMENTAL QUESTIONNAIRE
Final questionnaire Name: Date: ___/___/___ This questionnaire aims at collecting your overall feedback. After this experiment , how would you rate the following items (place a mark or circle answer)? Do not hesitate to comment when needed. 1. The simulation realism (scenarios, communications)
VERY LOW VERY HIGH
______________________________________________________________________________
______________________________________________________________________________
2. The quality of the training (briefing, training run)
VERY LOW VERY HIGH
______________________________________________________________________________
______________________________________________________________________________
3. The feasibility to recover from a drifting situation by gaining time:
a. To be in RBT time frame window ([-2mn; +3mn])
VERY LOW VERY HIGH
______________________________________________________________________________
______________________________________________________________________________
b. To be in CTA time frame window ([-30s; +30s])
VERY LOW VERY HIGH
______________________________________________________________________________
______________________________________________________________________________
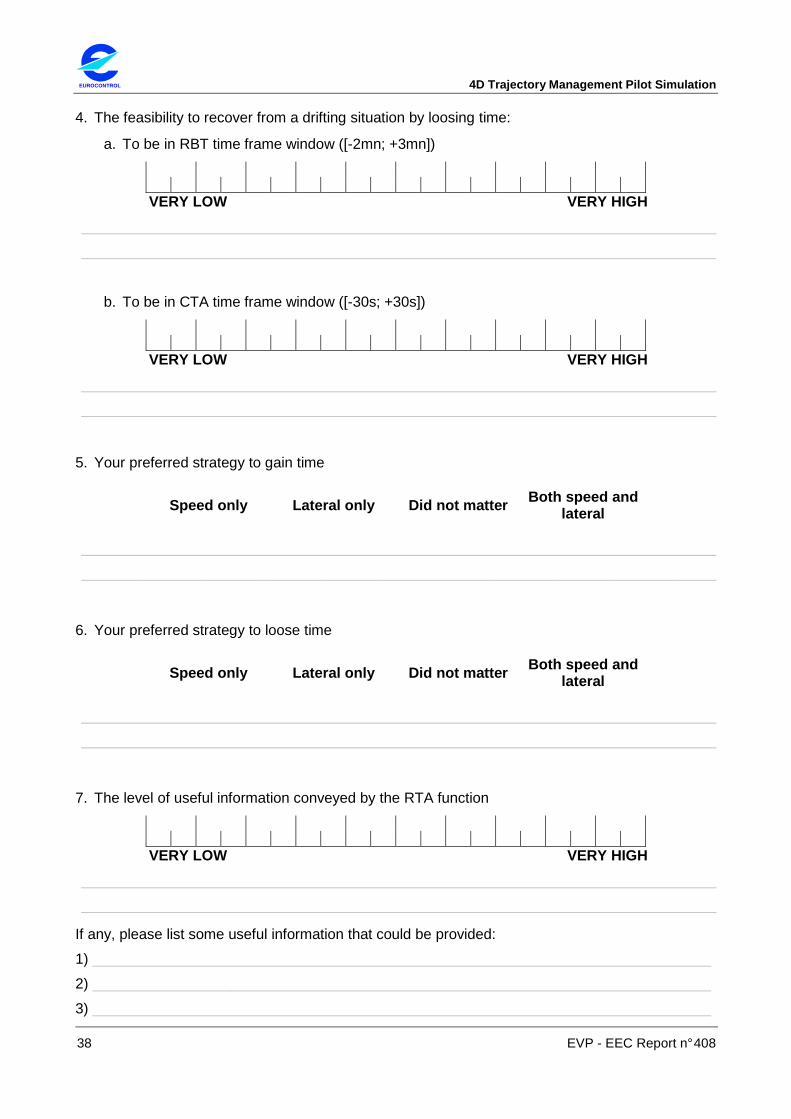
EUROCONTROL 4D Trajectory Management Pilot Simulation
38 EVP - EEC Report n° 408
4. The feasibility to recover from a drifting situation by loosing time:
a. To be in RBT time frame window ([-2mn; +3mn])
VERY LOW VERY HIGH
______________________________________________________________________________
______________________________________________________________________________
b. To be in CTA time frame window ([-30s; +30s])
VERY LOW VERY HIGH
______________________________________________________________________________
______________________________________________________________________________
5. Your preferred strategy to gain time
Speed only Lateral only Did not matter Both speed and lateral
______________________________________________________________________________
______________________________________________________________________________
6. Your preferred strategy to loose time
Speed only Lateral only Did not matter Both speed and lateral
______________________________________________________________________________
______________________________________________________________________________
7. The level of useful information conveyed by the RTA function
VERY LOW VERY HIGH
______________________________________________________________________________
______________________________________________________________________________
If any, please list some useful information that could be provided:
1) ____________________________________________________________________________
2) ____________________________________________________________________________
3) ____________________________________________________________________________

4D Trajectory Management Pilot Simulation EUROCONTROL
EVP - EEC Report n° 408 39
8. The flight efficiency compared to today’s operations (fuel consumption, passenger comfort,
CI…)
VERY LOW VERY HIGH
______________________________________________________________________________
______________________________________________________________________________
9. The responsibility of the actors roles in managing 4D trajectory
Pilots Controller Did not matter Both pilot and controller
Please list the reasons:
1) ____________________________________________________________________________
2) ____________________________________________________________________________
3) ____________________________________________________________________________
10. The benefits of the 4D trajectory management
None Few Some Numerous
And
Minor Major
Please list 3 of them:
1) ____________________________________________________________________________
2) ____________________________________________________________________________
3) ____________________________________________________________________________

EUROCONTROL 4D Trajectory Management Pilot Simulation
40 EVP - EEC Report n° 408
11. The limitations of the 4D trajectory management
None Few Some Numerous
And
Minor Major
Please list 3 of them:
1) ____________________________________________________________________________
2) ____________________________________________________________________________
3) ____________________________________________________________________________
Comments: ______________________________________________________________________
_______________________________________________________________________________
_______________________________________________________________________________
_______________________________________________________________________________
_______________________________________________________________________________
_______________________________________________________________________________
_______________________________________________________________________________
_______________________________________________________________________________
_______________________________________________________________________________
_______________________________________________________________________________
_______________________________________________________________________________
_______________________________________________________________________________
_______________________________________________________________________________
_______________________________________________________________________________
_______________________________________________________________________________
_______________________________________________________________________________
_______________________________________________________________________________
_______________________________________________________________________________
_______________________________________________________________________________
_______________________________________________________________________________
_______________________________________________________________________________
_______________________________________________________________________________
Thank you for your participation

4D Trajectory Management Pilot Simulation EUROCONTROL
EVP - EEC Report n° 408 41
Intentionally left blank

EUROCONTROL 4D Trajectory Management Pilot Simulation
42 EVP - EEC Report n° 408
End of document


![Crew Accommodations - Crew Survival Guide - 29JUL2011[1]](https://img.pdfslide.us/doc/110x75/54f9c32b4a79590b398b479b/crew-accommodations-crew-survival-guide-29jul20111.jpg)