Embed Size (px)
Citation preview
1
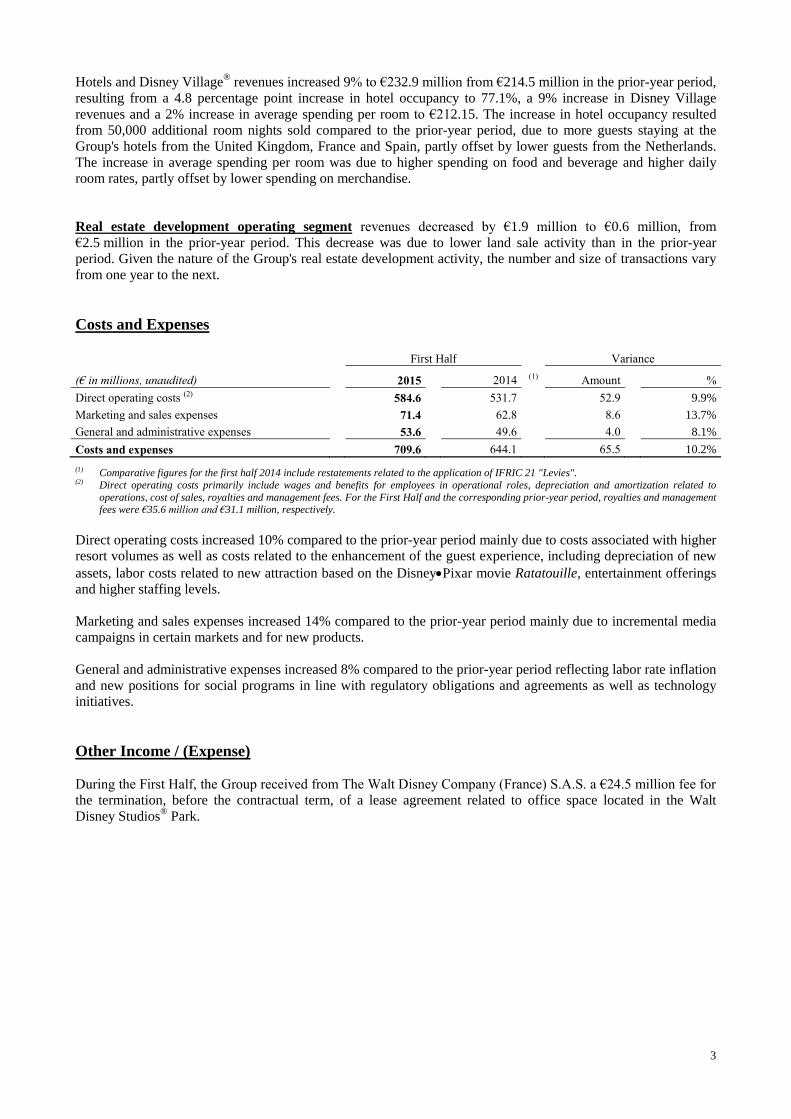
EURO DISNEY S.C.A.
Fiscal Year 2015
Reports First Half Results
Six Months Ended March 31, 2015
Total revenues increased 11% to €592 million due to higher volumes and guest spending in both theme
parks and hotels
Higher costs and expenses reflect increased Resort activity and the Group's continued commitment to
improve the guest experience
EBITDA increased to €4 million and net loss narrowed to €119 million primarily due to a one-time gain
related to the early termination of a lease agreement
€850 million debt reduction to €998 million following the completion of the share capital increases
implemented as part of the Group's recapitalization and debt reduction plan
(Marne-la-Vallée, May 5, 2015) Euro Disney S.C.A. (the "Company"), parent company of Euro Disney
Associés S.C.A. ("EDA"), operator of Disneyland®
Paris, reported today the results of its consolidated group
(the "Group") for the first six months of fiscal year 2015 which ended March 31, 2015 (the "First Half").
Key Financial Highlights First Half
Fiscal Year 2014 1 (€ in millions, unaudited) 2015 2014 1
Revenues 591.7 533.3 1,279.7
Costs and expenses (709.6) (644.1) (1,345.2)
Other income / (expense) 24.5 - -
Operating margin (93.4) (110.8) (65.5)
Plus: Depreciation and amortization 97.4 87.7 179.2
EBITDA 2 4.0 (23.1) 113.7
EBITDA as a percentage of revenues 0.7% (4.3)% 8.9%
Net loss (118.8) (135.8) (113.7)
Cash flow (used in) / generated by operating activities (16.3) (56.7) 78.2
Cash flow used in investing activities (50.3) (67.0) (144.9)
Free cash flow used 2 (66.6) (123.7) (66.7)
Cash flow generated by financing activities 270.7 99.8 38.0
Cash and cash equivalents, end of period 253.4 54.1 49.3
Key Operating Statistics 2 First Half
Fiscal Year 2014 2015 2014
Theme parks attendance (in millions) 6.7 6.3 14.2
Average spending per guest (in €) 50.57 46.83 50.66
Hotel occupancy rate 77.1% 72.3% 75.4%
Average spending per room (in €) 212.15 208.67 232.26
Commenting on the results, Tom Wolber, Président of Euro Disney S.A.S., said:
"We are pleased to announce an 11% growth in revenues for the first semester, reflecting improving performance
across all our key indicators. Theme park attendance and hotel occupancy are up 6% and 5 percentage points, respectively, with growth in average spending per guest and per room. However, we have incurred higher costs,
which reflect our commitment to the guest experience that significantly offset the improved resort performance.
This summer, we are excited to launch new entertainment experiences including Frozen Summer Fun, along with
the Jedi Training Academy where guests can meet the heroes of the Star Wars®
saga.
To continue to invest in the guest experience, as previously announced, we recently completed €1 billion in capital
increases as part of a recapitalization and debt reduction plan. Together with our dedicated team of Cast Members, we are committed to providing an excellent guest experience to achieve the long-term success of
Disneyland Paris."
1 Comparative figures for the first half 2014 and fiscal year 2014 include restatements related to the application of IFRIC 21 "Levies". 2 Please refer to Exhibit 7 for the definition of EBITDA, Free cash flow and key operating statistics.

2
Recapitalization Plan
During the First Half, the Group implemented the recapitalization and debt reduction plan announced on
October 6, 2014, backed by The Walt Disney Company ("TWDC"), which amounted to approximately €1 billion
(the "Recapitalization Plan"). The Recapitalization Plan aimed at improving the Group's financial position and
enabling it to continue investing in Disneyland® Paris so as to improve the guest experience.
The main elements of this Recapitalization Plan are presented below:
- cash infusion of €422.8 million, made through capital increases of the Company and of EDA;
- conversion of €600 million of debt owed to indirect subsidiaries of TWDC into equity through capital
increases of the Company and of EDA;
- deferral of all amortization payments of loans granted by indirect subsidiaries of TWDC until a revised
maturity date in December 2024 (previously 2028); and
- repayment of €250.0 million drawn under the standby revolving credit facilities granted previously by
TWDC, maturing in 2015, 2017 and 2018, replaced by a single €350.0 million revolving credit facility
maturing in December 2023.
For more details on the different steps of the Recapitalization Plan, please refer to the press releases and the other
documents related to this plan, which are available on the Group's website (http://corporate.disneylandparis.com).
Seasonality
The Group's business is subject to the effects of seasonality and the annual results are significantly dependent on
the second half of the fiscal year, which traditionally includes the high season at Disneyland Paris. Consequently,
the operating results for the First Half are not necessarily indicative of results to be expected for the full fiscal
year 2015.
Revenues by Operating Segment
First Half Variance
(€ in millions, unaudited) 2015 2014 Amount %
Theme parks 341.1 298.3 42.8 14.3%
Hotels and Disney Village® 232.9 214.5 18.4 8.6%
Other 17.1 18.0 (0.9) (5.0)%
Resort operating segment 591.1 530.8 60.3 11.4%
Real estate development operating segment 0.6 2.5 (1.9) n/m
Total revenues 591.7 533.3 58.4 11.0%
n/m: not meaningful
Resort operating segment revenues increased 11% to €591.1 million from €530.8 million in the prior-year
period.
Theme parks revenues increased 14% to €341.1 million from €298.3 million in the prior-year period due to
an 8% increase in average spending per guest to €50.57 and a 6% increase in attendance to 6.7 million. The
increase in average spending per guest was due to higher spending on admissions, food and beverage and
merchandise. The increase in attendance was due to more guests visiting from the United Kingdom, France and
Spain.
3
Hotels and Disney Village®
revenues increased 9% to €232.9 million from €214.5 million in the prior-year period,
resulting from a 4.8 percentage point increase in hotel occupancy to 77.1%, a 9% increase in Disney Village
revenues and a 2% increase in average spending per room to €212.15. The increase in hotel occupancy resulted
from 50,000 additional room nights sold compared to the prior-year period, due to more guests staying at the
Group's hotels from the United Kingdom, France and Spain, partly offset by lower guests from the Netherlands.
The increase in average spending per room was due to higher spending on food and beverage and higher daily
room rates, partly offset by lower spending on merchandise.
Real estate development operating segment revenues decreased by €1.9 million to €0.6 million, from
€2.5 million in the prior-year period. This decrease was due to lower land sale activity than in the prior-year
period. Given the nature of the Group's real estate development activity, the number and size of transactions vary
from one year to the next.
Costs and Expenses
First Half Variance
(€ in millions, unaudited) 2015 2014 (1) Amount %
Direct operating costs (2) 584.6 531.7 52.9 9.9%
Marketing and sales expenses 71.4 62.8 8.6 13.7%
General and administrative expenses 53.6 49.6 4.0 8.1%
Costs and expenses 709.6 644.1 65.5 10.2% (1) Comparative figures for the first half 2014 include restatements related to the application of IFRIC 21 "Levies". (2) Direct operating costs primarily include wages and benefits for employees in operational roles, depreciation and amortization related to
operations, cost of sales, royalties and management fees. For the First Half and the corresponding prior-year period, royalties and management fees were €35.6 million and €31.1 million, respectively.
Direct operating costs increased 10% compared to the prior-year period mainly due to costs associated with higher
resort volumes as well as costs related to the enhancement of the guest experience, including depreciation of new
assets, labor costs related to new attraction based on the DisneyPixar movie Ratatouille, entertainment offerings
and higher staffing levels.
Marketing and sales expenses increased 14% compared to the prior-year period mainly due to incremental media
campaigns in certain markets and for new products.
General and administrative expenses increased 8% compared to the prior-year period reflecting labor rate inflation
and new positions for social programs in line with regulatory obligations and agreements as well as technology
initiatives.
Other Income / (Expense)
During the First Half, the Group received from The Walt Disney Company (France) S.A.S. a €24.5 million fee for
the termination, before the contractual term, of a lease agreement related to office space located in the Walt
Disney Studios® Park.
4
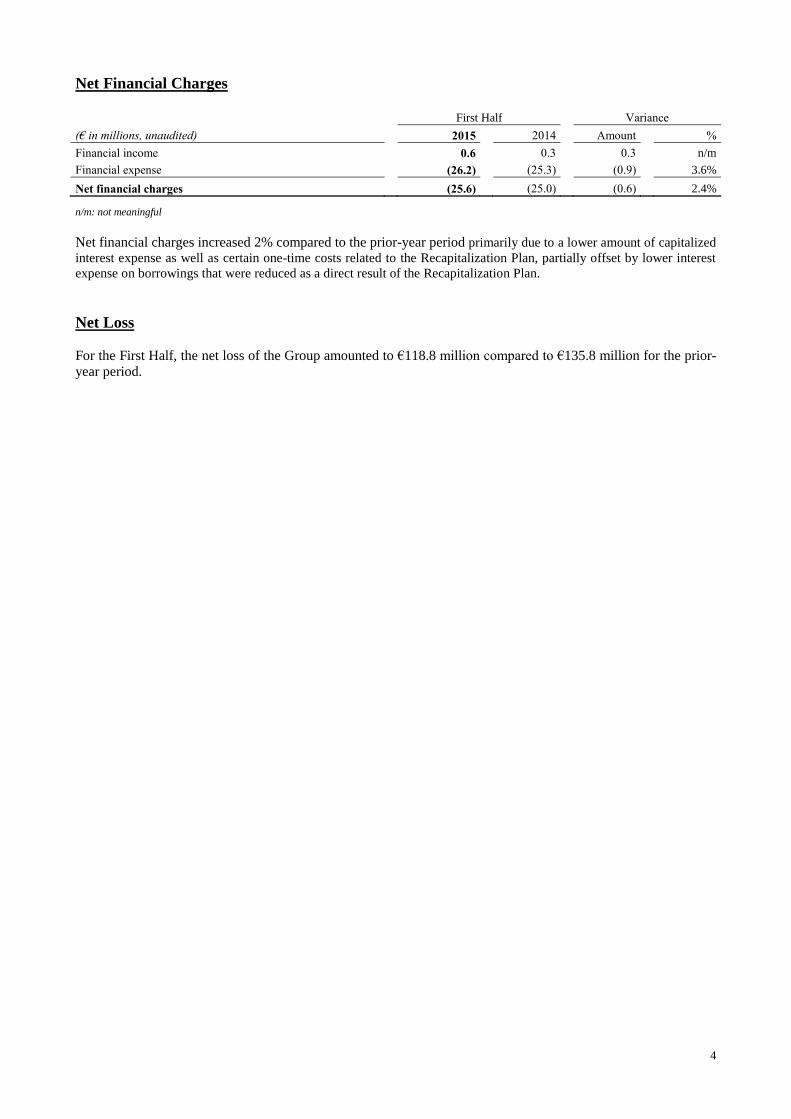
Net Financial Charges
First Half Variance
(€ in millions, unaudited) 2015 2014 Amount %
Financial income 0.6 0.3 0.3 n/m
Financial expense (26.2) (25.3) (0.9) 3.6%
Net financial charges (25.6) (25.0) (0.6) 2.4%
n/m: not meaningful
Net financial charges increased 2% compared to the prior-year period primarily due to a lower amount of capitalized
interest expense as well as certain one-time costs related to the Recapitalization Plan, partially offset by lower interest
expense on borrowings that were reduced as a direct result of the Recapitalization Plan.
Net Loss
For the First Half, the net loss of the Group amounted to €118.8 million compared to €135.8 million for the prior-
year period.
5
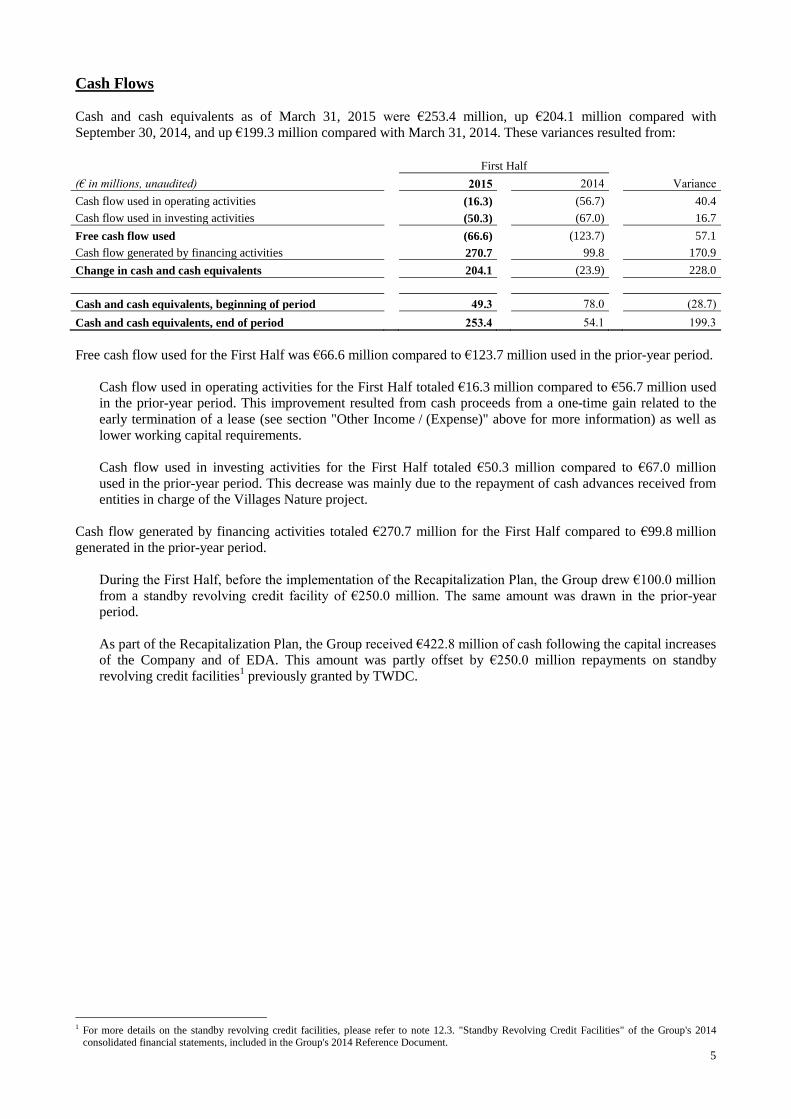
Cash Flows
Cash and cash equivalents as of March 31, 2015 were €253.4 million, up €204.1 million compared with
September 30, 2014, and up €199.3 million compared with March 31, 2014. These variances resulted from:
First Half
Variance (€ in millions, unaudited) 2015 2014
Cash flow used in operating activities (16.3) (56.7) 40.4
Cash flow used in investing activities (50.3) (67.0) 16.7
Free cash flow used (66.6) (123.7) 57.1
Cash flow generated by financing activities 270.7 99.8 170.9
Change in cash and cash equivalents 204.1 (23.9) 228.0
Cash and cash equivalents, beginning of period 49.3 78.0 (28.7)
Cash and cash equivalents, end of period 253.4 54.1 199.3
Free cash flow used for the First Half was €66.6 million compared to €123.7 million used in the prior-year period.
Cash flow used in operating activities for the First Half totaled €16.3 million compared to €56.7 million used
in the prior-year period. This improvement resulted from cash proceeds from a one-time gain related to the
early termination of a lease (see section "Other Income / (Expense)" above for more information) as well as
lower working capital requirements.
Cash flow used in investing activities for the First Half totaled €50.3 million compared to €67.0 million
used in the prior-year period. This decrease was mainly due to the repayment of cash advances received from
entities in charge of the Villages Nature project.
Cash flow generated by financing activities totaled €270.7 million for the First Half compared to €99.8 million
generated in the prior-year period.
During the First Half, before the implementation of the Recapitalization Plan, the Group drew €100.0 million
from a standby revolving credit facility of €250.0 million. The same amount was drawn in the prior-year
period.
As part of the Recapitalization Plan, the Group received €422.8 million of cash following the capital increases
of the Company and of EDA. This amount was partly offset by €250.0 million repayments on standby
revolving credit facilities1 previously granted by TWDC.
1 For more details on the standby revolving credit facilities, please refer to note 12.3. "Standby Revolving Credit Facilities" of the Group's 2014
consolidated financial statements, included in the Group's 2014 Reference Document.
6
UPDATE ON RECENT AND UPCOMING EVENTS
Mandatory Tender Offer
As a result of the Company's capital increases, EDL Holding Company, LLC, Euro Disney Investments S.A.S.
and EDL Corporation S.A.S. reported that their interests in the Company crossed certain thresholds. As a result,
they were required to launch a mandatory tender offer on the Company's shares that they did not own (the
"Mandatory Tender Offer"). The French Autorité des marchés financiers (the "AMF") issued its clearance
decision (décision de conformité) on this Mandatory Tender Offer on March 31, 2015.
The Company was informed that an appeal against the clearance decision has been filed on April 9, 2015 with the
Court of Appeal of Paris (Cour d’appel de Paris). In its notice no. 215C0446 dated April 14, 2015, the AMF has
indicated that, pending the decision of the Court of Appeal of Paris, the Mandatory Tender Offer has been
extended and new information will be published on a modified schedule.
For more details on the Mandatory Tender Offer, please refer to the press release and the other documents which
are available on the Group's website (http://corporate.disneylandparis.com).
Disneyland® Paris continues "Swing into Spring" celebrations for spring 2015
Until May 31, 2015, Disneyland® Paris celebrates the spring season highlighting nature and the awakening of the
season. Disneyland® Park has been transformed into a floral garden with brand new musical performances to give
our guests the ultimate springtime experience.
Frozen returns in 2015, creating the coolest summer
Starting June 1, Disneyland Paris will celebrate a "Frozen Summer Fun" with a brand new show, an ice-themed
musical production combining singing and dancing with guest participation. The famous sisters, Anna and Elsa,
along with their faithful companions, Kristoff and Olaf the funny snowman, will take to the stage to bring the
show to life and expand the unique experience of Frozen live.
The Jedi Training Academy opens at Disneyland Paris
This summer, the Jedi Training Academy will open its doors at Disneyland Paris to aspiring Padawans aged 7 to
12 to learn to use the Force from a true Jedi Master. Kids visiting Disneyland Paris will meet the heroes of the
epic saga through a unique and interactive experience that the whole family can enjoy. The adventure will begin
on July 11.
7
Press Contact
Cathy Pianon
Tel: +331 64 74 58 33
Fax: +331 64 74 59 69
e-mail: [email protected]
Investor Relations
Yoann Nguyen
Tel: +331 64 74 58 55
Fax: +331 64 74 56 36
e-mail: [email protected]
Corporate Communication
François Banon
Tel: +331 64 74 59 50
Fax: +331 64 74 59 69
e-mail: [email protected]
Next scheduled release: Availability of the 2015 Interim Report in May 2015
Additional Financial Information can be found on the Internet at http://corporate.disneylandparis.com
Code ISIN: FR0010540740
Code Reuters: EDLP.PA
Code Bloomberg: EDL:FP
The Group operates Disneyland® Paris, which includes: the Disneyland® Park, the Walt Disney Studios® Park, seven themed hotels with
approximately 5,800 rooms (excluding approximately 2,300 additional third-party rooms located on the site), two convention centers, the Disney
Village®, a dining, shopping and entertainment center, and golf courses. The Group's operating activities also include the development of the 2,230-hectare site, half of which is yet to be developed. Euro Disney S.C.A.'s shares are listed and traded on Euronext Paris.
Attachments: Exhibit 1 – Consolidated Statement of Income Exhibit 2 – Consolidated Segment Statement of Income
Exhibit 3 – Consolidated Statement of Financial Position
Exhibit 4 – Consolidated Statement of Cash Flows Exhibit 5 – Consolidated Statement of Changes in Equity
Exhibit 6 – Statement of Changes in Borrowings
Exhibit 7 – Definitions
8
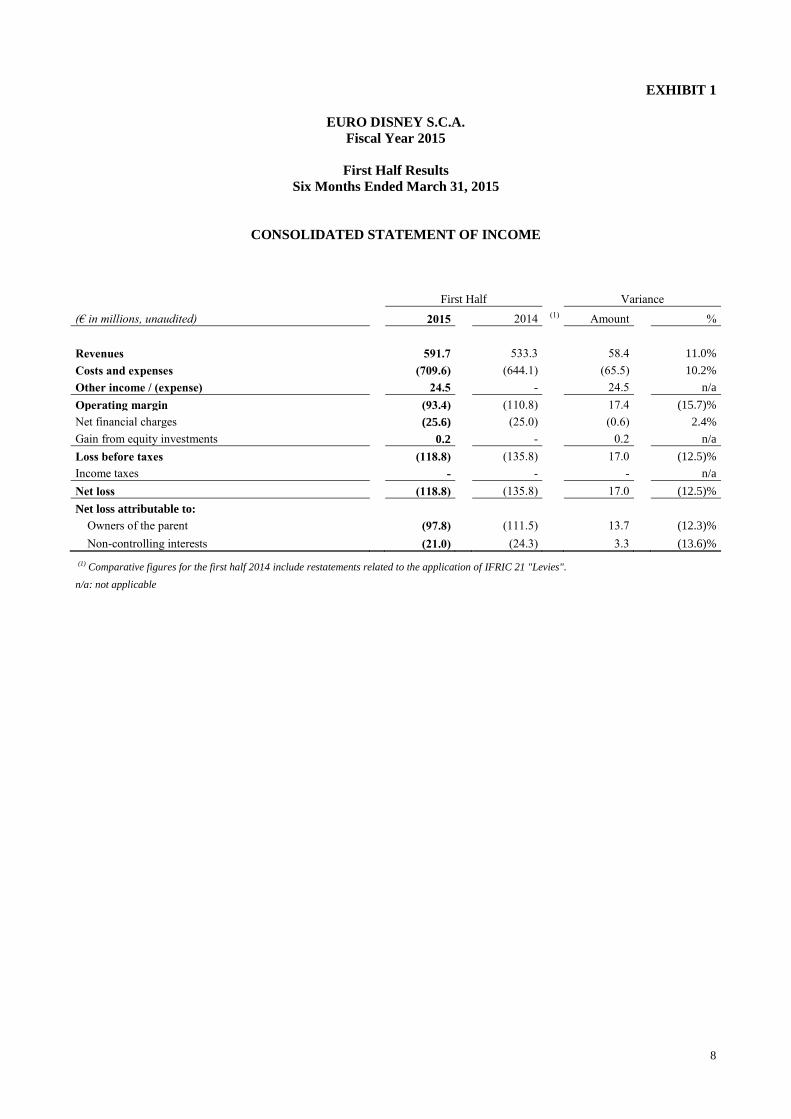
EXHIBIT 1
EURO DISNEY S.C.A.
Fiscal Year 2015
First Half Results
Six Months Ended March 31, 2015
CONSOLIDATED STATEMENT OF INCOME
First Half Variance
(€ in millions, unaudited) 2015 2014 (1) Amount %
Revenues 591.7 533.3 58.4 11.0%
Costs and expenses (709.6) (644.1) (65.5) 10.2%
Other income / (expense) 24.5 - 24.5 n/a
Operating margin (93.4) (110.8) 17.4 (15.7)%
Net financial charges (25.6) (25.0) (0.6) 2.4%
Gain from equity investments 0.2 - 0.2 n/a
Loss before taxes (118.8) (135.8) 17.0 (12.5)%
Income taxes - - - n/a
Net loss (118.8) (135.8) 17.0 (12.5)%
Net loss attributable to:
Owners of the parent (97.8) (111.5) 13.7 (12.3)%
Non-controlling interests (21.0) (24.3) 3.3 (13.6)%
(1) Comparative figures for the first half 2014 include restatements related to the application of IFRIC 21 "Levies".
n/a: not applicable
9
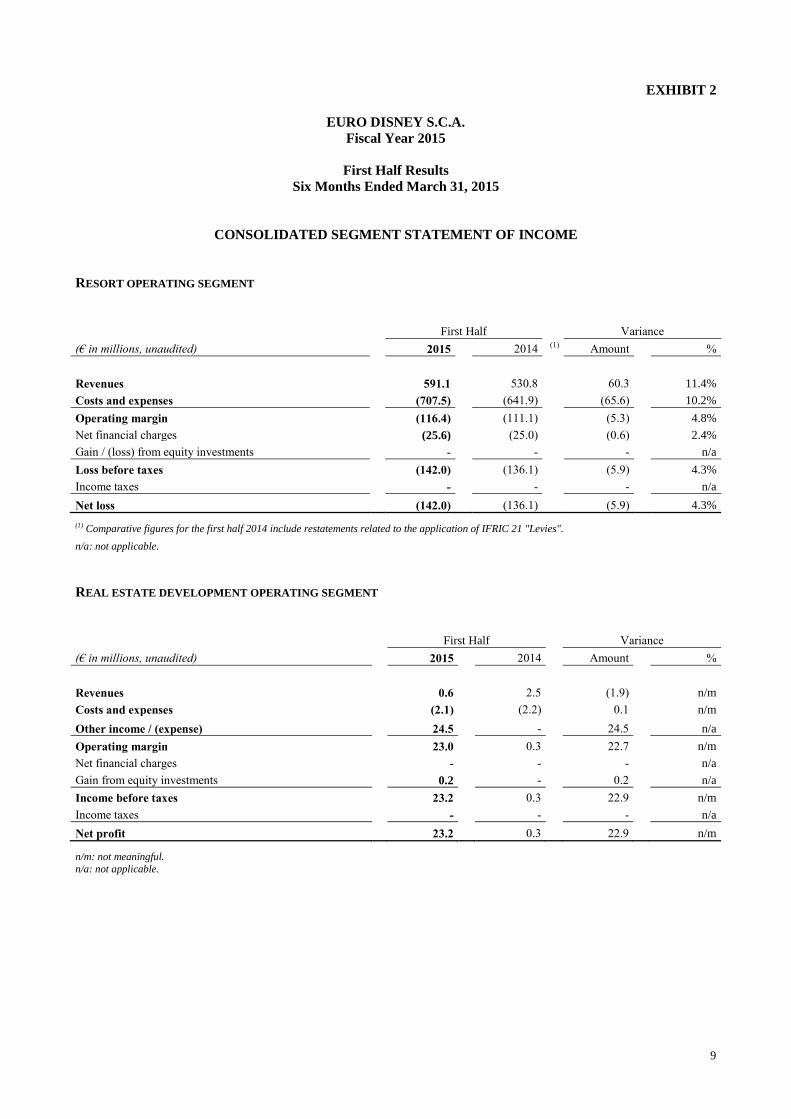
EXHIBIT 2
EURO DISNEY S.C.A.
Fiscal Year 2015
First Half Results
Six Months Ended March 31, 2015
CONSOLIDATED SEGMENT STATEMENT OF INCOME
RESORT OPERATING SEGMENT
First Half Variance
(€ in millions, unaudited) 2015 2014 (1) Amount %
Revenues 591.1 530.8 60.3 11.4%
Costs and expenses (707.5) (641.9) (65.6) 10.2%
Operating margin (116.4) (111.1) (5.3) 4.8%
Net financial charges (25.6) (25.0) (0.6) 2.4%
Gain / (loss) from equity investments - - - n/a
Loss before taxes (142.0) (136.1) (5.9) 4.3%
Income taxes - - - n/a
Net loss (142.0) (136.1) (5.9) 4.3% (1) Comparative figures for the first half 2014 include restatements related to the application of IFRIC 21 "Levies".
n/a: not applicable.
REAL ESTATE DEVELOPMENT OPERATING SEGMENT
First Half Variance
(€ in millions, unaudited) 2015 2014 Amount %
Revenues 0.6 2.5 (1.9) n/m
Costs and expenses (2.1) (2.2) 0.1 n/m
Other income / (expense) 24.5 - 24.5 n/a
Operating margin 23.0 0.3 22.7 n/m
Net financial charges - - - n/a
Gain from equity investments 0.2 - 0.2 n/a
Income before taxes 23.2 0.3 22.9 n/m
Income taxes - - - n/a
Net profit 23.2 0.3 22.9 n/m
n/m: not meaningful.
n/a: not applicable.
10
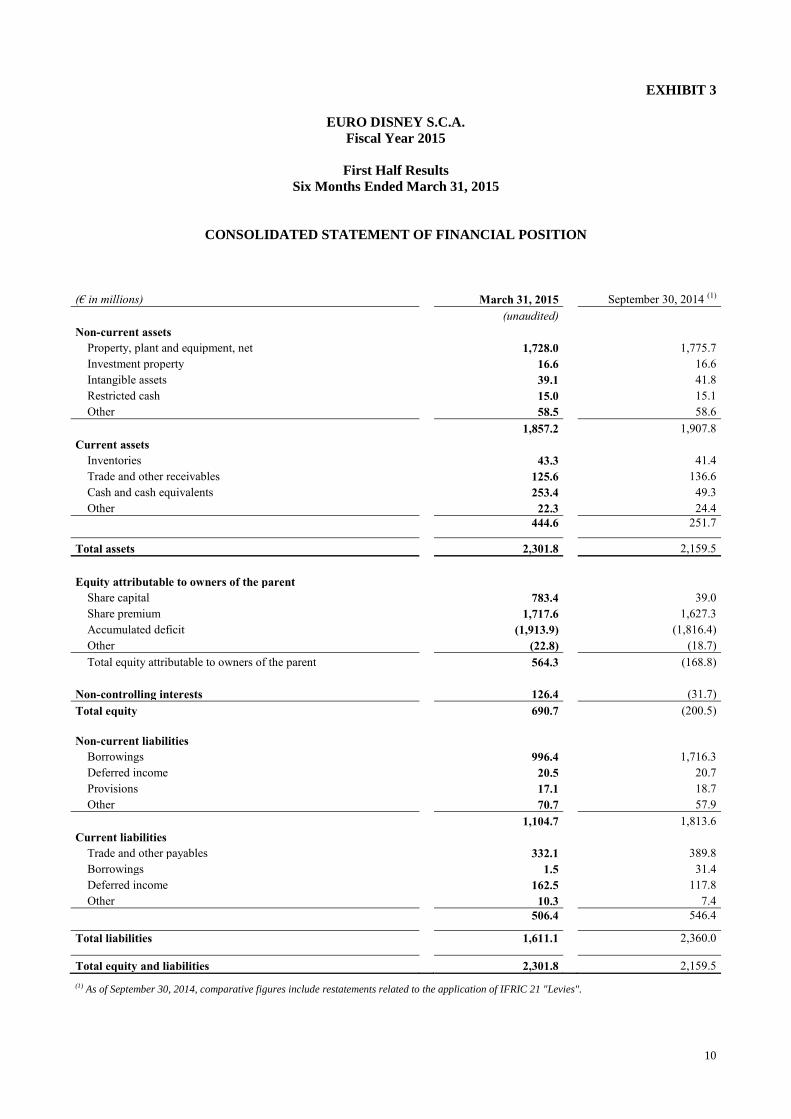
EXHIBIT 3
EURO DISNEY S.C.A.
Fiscal Year 2015
First Half Results
Six Months Ended March 31, 2015
CONSOLIDATED STATEMENT OF FINANCIAL POSITION
(€ in millions) March 31, 2015 September 30, 2014 (1)
(unaudited)
Non-current assets
Property, plant and equipment, net 1,728.0 1,775.7
Investment property 16.6 16.6
Intangible assets 39.1 41.8
Restricted cash 15.0 15.1
Other 58.5 58.6
1,857.2 1,907.8
Current assets
Inventories 43.3 41.4
Trade and other receivables 125.6 136.6
Cash and cash equivalents 253.4 49.3
Other 22.3 24.4
444.6 251.7
Total assets 2,301.8 2,159.5
Equity attributable to owners of the parent
Share capital 783.4 39.0
Share premium 1,717.6 1,627.3
Accumulated deficit (1,913.9) (1,816.4)
Other (22.8) (18.7)
Total equity attributable to owners of the parent 564.3 (168.8)
Non-controlling interests 126.4 (31.7)
Total equity 690.7 (200.5)
Non-current liabilities
Borrowings 996.4 1,716.3
Deferred income 20.5 20.7
Provisions 17.1 18.7
Other 70.7 57.9
1,104.7 1,813.6
Current liabilities
Trade and other payables 332.1 389.8
Borrowings 1.5 31.4
Deferred income 162.5 117.8
Other 10.3 7.4
506.4 546.4
Total liabilities 1,611.1 2,360.0
Total equity and liabilities 2,301.8 2,159.5 (1) As of September 30, 2014, comparative figures include restatements related to the application of IFRIC 21 "Levies".

11
EXHIBIT 4
EURO DISNEY S.C.A.
Fiscal Year 2015
First Half Results
Six Months Ended March 31, 2015
CONSOLIDATED STATEMENT OF CASH FLOWS
First Half
(€ in millions, unaudited) 2015 2014 (1)
Net loss (118.8) (135.8)
Items not requiring cash outlays or with no impact on working capital:
- Depreciation and amortization 97.4 87.7
- Net increase in valuation and reserve allowances 0.4 1.0
- Impact of the Recapitalization Plan on net loss 0.5 -
- Other 1.4 (0.3)
Net change in working capital account balances:
- Change in receivables, deferred income and other assets 50.4 38.7
- Change in inventories (2.6) (0.5)
- Change in payables, prepaid expenses and other liabilities (45.0) (47.5)
Cash flow used in operating activities (16.3) (56.7)
Capital expenditures for tangible and intangible assets (62.9) (64.6)
Equity investments 12.6 (2.4)
Cash flow used in investing activities (50.3) (67.0)
Cash proceeds from TWDC standby revolving credit facility of €250 million 100.0 (2) 100.0
Gross cash proceeds from the Recapitalization Plan 422.8 -
Repayment of borrowings (250.0) (3) (0.1)
Payment of costs incurred for the Recapitalization Plan (2.6) -
Net sales / (purchases) of treasury shares 0.5 (4) (0.1)
Cash flow generated by financing activities 270.7 99.8
Change in cash and cash equivalents 204.1 (23.9)
Cash and cash equivalents, beginning of period 49.3 78.0
Cash and cash equivalents, end of period 253.4 54.1
(1) Comparative figures for the first half 2014 include restatements related to the application of IFRIC 21 "Levies". (2) Amounts drawn during the first quarter of fiscal year 2015, before the implementation of the Recapitalization Plan. (3) Repayments of TWDC standby revolving credit facilities. (4) Including the sales of preferential subscription rights linked to treasury shares during the rights offering.
SUPPLEMENTAL CASH FLOW INFORMATION
First Half
(€ in millions, unaudited) 2015 2014
Supplemental cash flow information:
Interest paid 24.6 26.5

12
EXHIBIT 5
EURO DISNEY S.C.A.
Fiscal Year 2015
First Half Results
Six Months Ended March 31, 2015
CONSOLIDATED STATEMENT OF CHANGES IN EQUITY
(€ in millions) September 30,
2014 (1)
Net capital
increases
Net loss for
the First Half Other March 31,
2015
(unaudited) (unaudited) (unaudited) (unaudited)
Equity attributable to owners of the parent
Share capital 39.0 744.4 - - 783.4
Share premium 1,627.3 90.3 (2) - - 1,717.6
Accumulated deficit (1,816.4) - (97.8) 0.3 (1,913.9)
Other (18.7) - - (4.1) (22.8)
Total equity attributable to owners of the
parent
(168.8) 834.7 (97.8) (3.8) 564.3
Non-controlling interests (31.7) 180.0 (21.0) (0.9) 126.4
Total equity (200.5) 1,014.7 (118.8) (4.7) 690.7 (1) As of September 30, 2014, comparative figures include restatements related to the application of IFRIC 21 "Levies". (2) The increase in share premium includes a negative impact of €8.1 million of costs related to the Company's share capital increases.
EXHIBIT 6
STATEMENT OF CHANGES IN BORROWINGS
First Half 2015 (unaudited)
(€ in millions)
September 30,
2014 Increase
Debt
conversion
Repayment of
lines of credit
March 31,
2015
(unaudited)
Long-term loans 1,191.8 - (208.6) - 983.2
Consolidated promissory note - Disney Enterprises Inc. 268.7 - (268.7) - -
Consolidated promissory note - Euro Disney S.A.S. 92.7 - (92.7) - -
Standby revolving credit facility of €100 million 100.0 - - (100.0) -
Standby revolving credit facility of €250 million 50.0 100.0 - (150.0) -
Loan from TWDC to Centre de Congrès Newport S.N.C. 13.1 - - - 13.1
Sub-total TWDC debt 1,716.3 100.0 (570.0) (250.0) 996.3
Financial lease - 0.1 - - 0.1
Total non current borrowings 1,716.3 100.1 (570.0) (250.0) 996.4
Long-term loans 30.0 - (30.0) - -
Loan from TWDC to Centre de Congrès Newport S.N.C. 1.4 - - - 1.4
Sub-total TWDC debt 31.4 - (30.0) - 1.4
Financial lease - 0.1 - - 0.1
Total current borrowings 31.4 0.1 (30.0) - 1.5
Total borrowings 1,747.7 100.2 (600.0) (1) (250.0) 997.9
(1) As part of the Recapitalization Plan, an amount of €600.0 million of debt was converted into equity.
13
EXHIBIT 7
EURO DISNEY S.C.A.
Fiscal Year 2015
First Half Results
Six Months Ended March 31, 2015
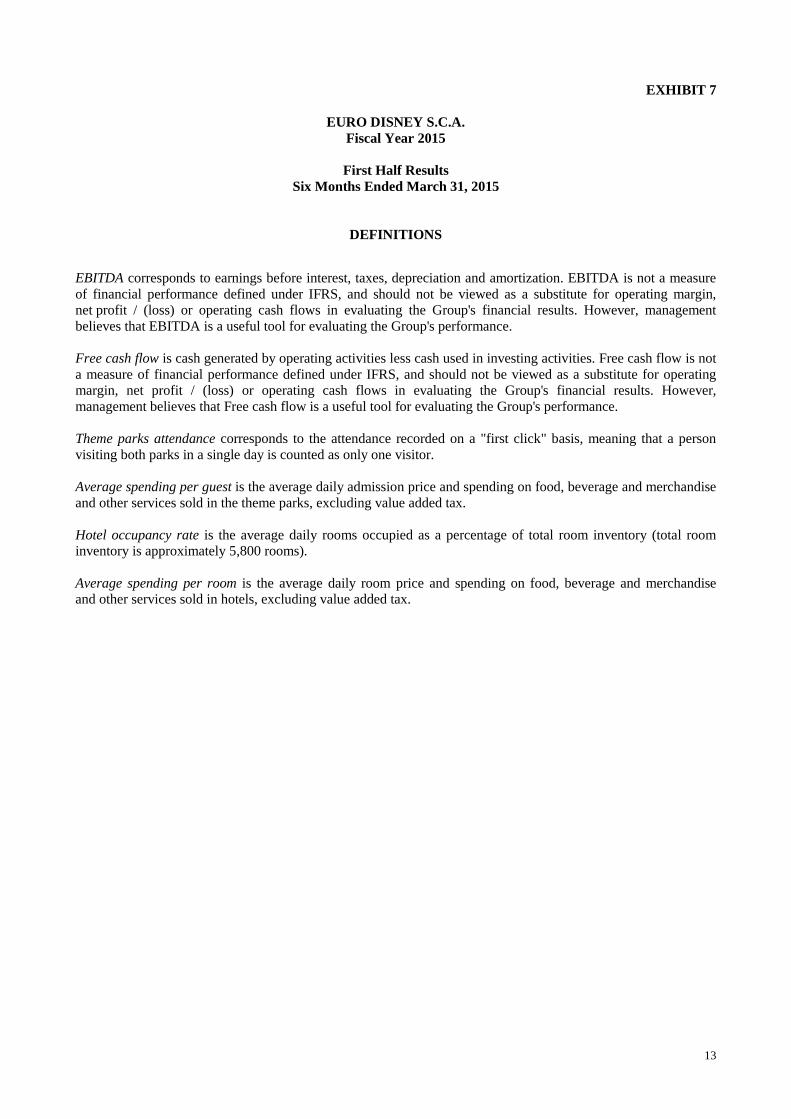
DEFINITIONS
EBITDA corresponds to earnings before interest, taxes, depreciation and amortization. EBITDA is not a measure
of financial performance defined under IFRS, and should not be viewed as a substitute for operating margin,
net profit / (loss) or operating cash flows in evaluating the Group's financial results. However, management
believes that EBITDA is a useful tool for evaluating the Group's performance.
Free cash flow is cash generated by operating activities less cash used in investing activities. Free cash flow is not
a measure of financial performance defined under IFRS, and should not be viewed as a substitute for operating
margin, net profit / (loss) or operating cash flows in evaluating the Group's financial results. However,
management believes that Free cash flow is a useful tool for evaluating the Group's performance.
Theme parks attendance corresponds to the attendance recorded on a "first click" basis, meaning that a person
visiting both parks in a single day is counted as only one visitor.
Average spending per guest is the average daily admission price and spending on food, beverage and merchandise
and other services sold in the theme parks, excluding value added tax.
Hotel occupancy rate is the average daily rooms occupied as a percentage of total room inventory (total room
inventory is approximately 5,800 rooms).
Average spending per room is the average daily room price and spending on food, beverage and merchandise
and other services sold in hotels, excluding value added tax.