Embed Size (px)
Citation preview
1
The World Bank
EU10
Regular Economic Report
Main Report
Working Towards Recovery
April 2010
Focus Notes:
Impact of the crisis on the corporate sector – evidence from a firm-level
survey
Insights for the EU10 and Croatia from the Europe and Central Asia
energy outlook 2030
This report is prepared by a team led by Kaspar Richter ([email protected]) and including Paolo Correa, Stella Ilieva, Mariana
Iooty, Leszek Kąsek, Ewa Korczyc, Matija Laco, Sanja Madzarevic-Sujster, Catalin Pauna, Marcin Piątkowski, Stanislav Polak, Emilia Skrok, and Peter Thomson.
The team is very grateful for the excellent inputs from the World Bank Global Prospect Group, coordinated by Annette De Kleine.
EU10 refers to Bulgaria, the Czech Republic, Estonia, Hungary, Latvia, Lithuania, Poland, Romania, the Slovak Republic and
Slovenia. EU10+1 includes Croatia.
Pub
lic D
iscl
osur
e A
utho
rized
Pub
lic D
iscl
osur
e A
utho
rized
Pub
lic D
iscl
osur
e A
utho
rized
Pub
lic D
iscl
osur
e A
utho
rized
Pub
lic D
iscl
osur
e A
utho
rized
Pub
lic D
iscl
osur
e A
utho
rized
Pub
lic D
iscl
osur
e A
utho
rized
Pub
lic D
iscl
osur
e A
utho
rized
2
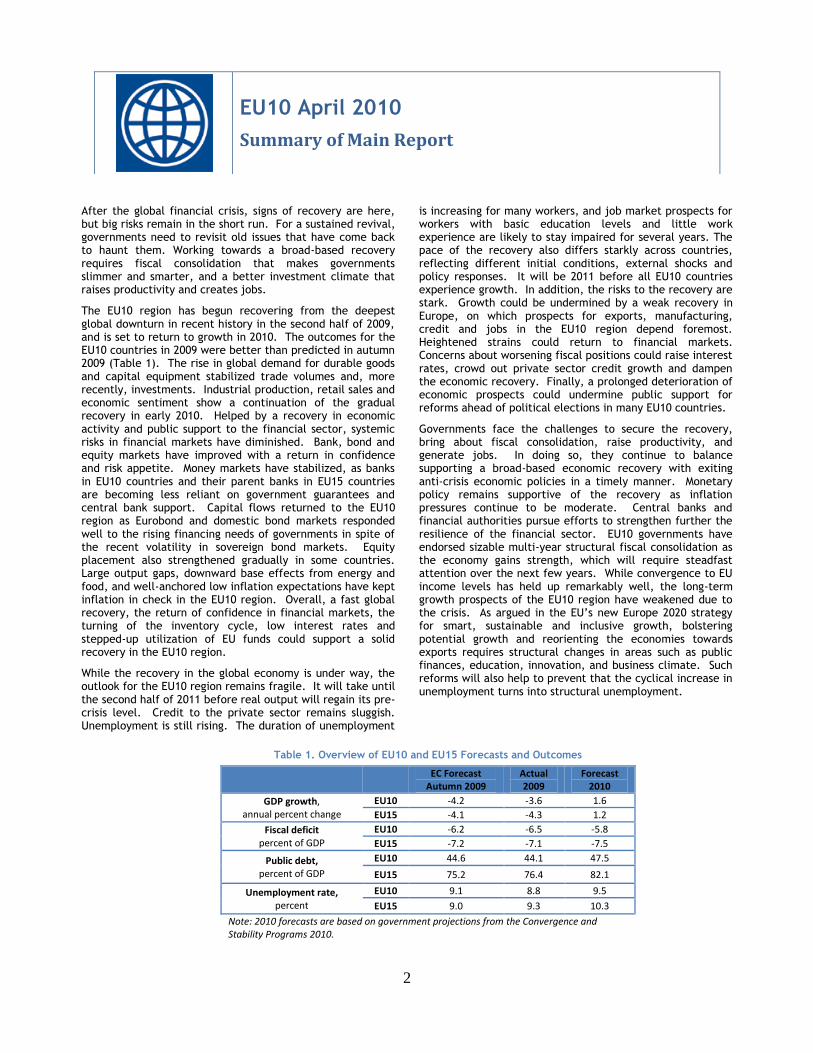
After the global financial crisis, signs of recovery are here, but big risks remain in the short run. For a sustained revival, governments need to revisit old issues that have come back to haunt them. Working towards a broad-based recovery requires fiscal consolidation that makes governments slimmer and smarter, and a better investment climate that raises productivity and creates jobs.
The EU10 region has begun recovering from the deepest global downturn in recent history in the second half of 2009, and is set to return to growth in 2010. The outcomes for the EU10 countries in 2009 were better than predicted in autumn 2009 (Table 1). The rise in global demand for durable goods and capital equipment stabilized trade volumes and, more recently, investments. Industrial production, retail sales and economic sentiment show a continuation of the gradual recovery in early 2010. Helped by a recovery in economic activity and public support to the financial sector, systemic risks in financial markets have diminished. Bank, bond and equity markets have improved with a return in confidence and risk appetite. Money markets have stabilized, as banks in EU10 countries and their parent banks in EU15 countries are becoming less reliant on government guarantees and central bank support. Capital flows returned to the EU10 region as Eurobond and domestic bond markets responded well to the rising financing needs of governments in spite of the recent volatility in sovereign bond markets. Equity placement also strengthened gradually in some countries. Large output gaps, downward base effects from energy and food, and well-anchored low inflation expectations have kept inflation in check in the EU10 region. Overall, a fast global recovery, the return of confidence in financial markets, the turning of the inventory cycle, low interest rates and stepped-up utilization of EU funds could support a solid recovery in the EU10 region.
While the recovery in the global economy is under way, the outlook for the EU10 region remains fragile. It will take until the second half of 2011 before real output will regain its pre-crisis level. Credit to the private sector remains sluggish. Unemployment is still rising. The duration of unemployment
is increasing for many workers, and job market prospects for workers with basic education levels and little work experience are likely to stay impaired for several years. The pace of the recovery also differs starkly across countries, reflecting different initial conditions, external shocks and policy responses. It will be 2011 before all EU10 countries experience growth. In addition, the risks to the recovery are stark. Growth could be undermined by a weak recovery in Europe, on which prospects for exports, manufacturing, credit and jobs in the EU10 region depend foremost. Heightened strains could return to financial markets. Concerns about worsening fiscal positions could raise interest rates, crowd out private sector credit growth and dampen the economic recovery. Finally, a prolonged deterioration of economic prospects could undermine public support for reforms ahead of political elections in many EU10 countries.
Governments face the challenges to secure the recovery, bring about fiscal consolidation, raise productivity, and generate jobs. In doing so, they continue to balance supporting a broad-based economic recovery with exiting anti-crisis economic policies in a timely manner. Monetary policy remains supportive of the recovery as inflation pressures continue to be moderate. Central banks and financial authorities pursue efforts to strengthen further the resilience of the financial sector. EU10 governments have endorsed sizable multi-year structural fiscal consolidation as the economy gains strength, which will require steadfast attention over the next few years. While convergence to EU income levels has held up remarkably well, the long-term growth prospects of the EU10 region have weakened due to the crisis. As argued in the EU’s new Europe 2020 strategy for smart, sustainable and inclusive growth, bolstering potential growth and reorienting the economies towards exports requires structural changes in areas such as public finances, education, innovation, and business climate. Such reforms will also help to prevent that the cyclical increase in unemployment turns into structural unemployment.
Table 1. Overview of EU10 and EU15 Forecasts and Outcomes
EC Forecast
Autumn 2009 Actual 2009
Forecast 2010
GDP growth, annual percent change
EU10 -4.2 -3.6 1.6
EU15 -4.1 -4.3 1.2
Fiscal deficit percent of GDP
EU10 -6.2 -6.5 -5.8
EU15 -7.2 -7.1 -7.5
Public debt, percent of GDP
EU10 44.6 44.1 47.5
EU15 75.2 76.4 82.1
Unemployment rate, percent
EU10 9.1 8.8 9.5
EU15 9.0 9.3 10.3
Note: 2010 forecasts are based on government projections from the Convergence and Stability Programs 2010.
EU10 April 2010
Summary of Main Report
3
Recent Developments and Future Prospects
Output
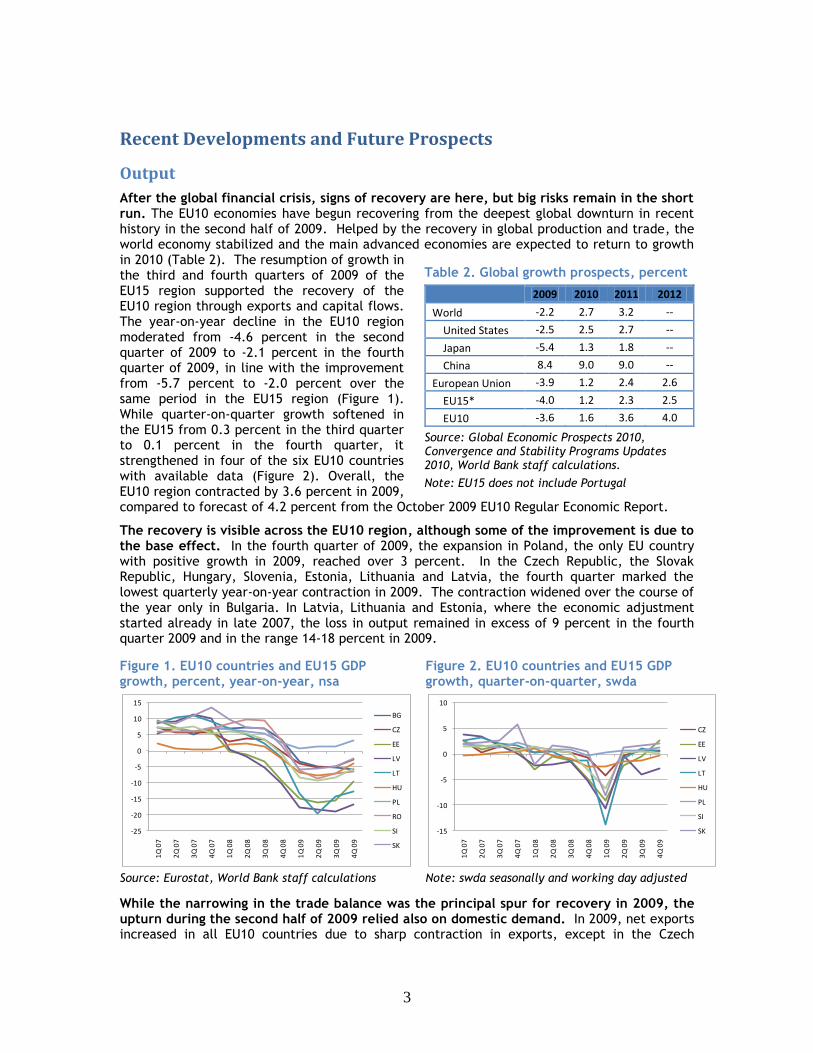
After the global financial crisis, signs of recovery are here, but big risks remain in the short run. The EU10 economies have begun recovering from the deepest global downturn in recent history in the second half of 2009. Helped by the recovery in global production and trade, the world economy stabilized and the main advanced economies are expected to return to growth in 2010 (Table 2). The resumption of growth in the third and fourth quarters of 2009 of the EU15 region supported the recovery of the EU10 region through exports and capital flows. The year-on-year decline in the EU10 region moderated from -4.6 percent in the second quarter of 2009 to -2.1 percent in the fourth quarter of 2009, in line with the improvement from -5.7 percent to -2.0 percent over the same period in the EU15 region (Figure 1). While quarter-on-quarter growth softened in the EU15 from 0.3 percent in the third quarter to 0.1 percent in the fourth quarter, it strengthened in four of the six EU10 countries with available data (Figure 2). Overall, the EU10 region contracted by 3.6 percent in 2009, compared to forecast of 4.2 percent from the October 2009 EU10 Regular Economic Report.
The recovery is visible across the EU10 region, although some of the improvement is due to the base effect. In the fourth quarter of 2009, the expansion in Poland, the only EU country with positive growth in 2009, reached over 3 percent. In the Czech Republic, the Slovak Republic, Hungary, Slovenia, Estonia, Lithuania and Latvia, the fourth quarter marked the lowest quarterly year-on-year contraction in 2009. The contraction widened over the course of the year only in Bulgaria. In Latvia, Lithuania and Estonia, where the economic adjustment started already in late 2007, the loss in output remained in excess of 9 percent in the fourth quarter 2009 and in the range 14-18 percent in 2009.
Figure 1. EU10 countries and EU15 GDP growth, percent, year-on-year, nsa
Figure 2. EU10 countries and EU15 GDP growth, quarter-on-quarter, swda
Source: Eurostat, World Bank staff calculations Note: swda seasonally and working day adjusted
While the narrowing in the trade balance was the principal spur for recovery in 2009, the upturn during the second half of 2009 relied also on domestic demand. In 2009, net exports increased in all EU10 countries due to sharp contraction in exports, except in the Czech
-25
-20
-15
-10
-5
0
5
10
15
1Q
07
2Q
07
3Q
07
4Q
07
1Q
08
2Q
08
3Q
08
4Q
08
1Q
09
2Q
09
3Q
09
4Q
09
BG
CZ
EE
LV
LT
HU
PL
RO
SI
SK
-15
-10
-5
0
5
10
1Q
07
2Q
07
3Q
07
4Q
07
1Q
08
2Q
08
3Q
08
4Q
08
1Q
09
2Q
09
3Q
09
4Q
09
CZ
EE
LV
LT
HU
PL
SI
SK
Table 2. Global growth prospects, percent
2009 2010 2011 2012
World -2.2 2.7 3.2 --
United States -2.5 2.5 2.7 --
Japan -5.4 1.3 1.8 --
China 8.4 9.0 9.0 --
European Union -3.9 1.2 2.4 2.6
EU15* -4.0 1.2 2.3 2.5
EU10 -3.6 1.6 3.6 4.0
Source: Global Economic Prospects 2010, Convergence and Stability Programs Updates 2010, World Bank staff calculations.
Note: EU15 does not include Portugal
4
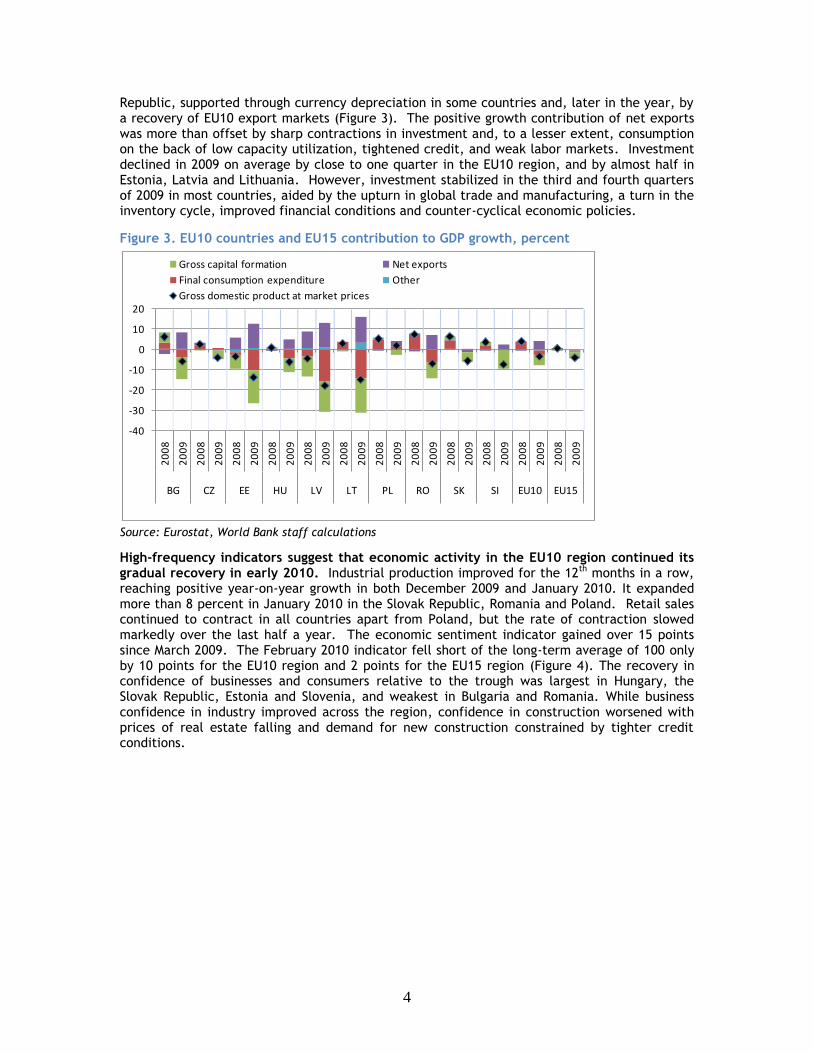
Republic, supported through currency depreciation in some countries and, later in the year, by a recovery of EU10 export markets (Figure 3). The positive growth contribution of net exports was more than offset by sharp contractions in investment and, to a lesser extent, consumption on the back of low capacity utilization, tightened credit, and weak labor markets. Investment declined in 2009 on average by close to one quarter in the EU10 region, and by almost half in Estonia, Latvia and Lithuania. However, investment stabilized in the third and fourth quarters of 2009 in most countries, aided by the upturn in global trade and manufacturing, a turn in the inventory cycle, improved financial conditions and counter-cyclical economic policies.
Figure 3. EU10 countries and EU15 contribution to GDP growth, percent
Source: Eurostat, World Bank staff calculations
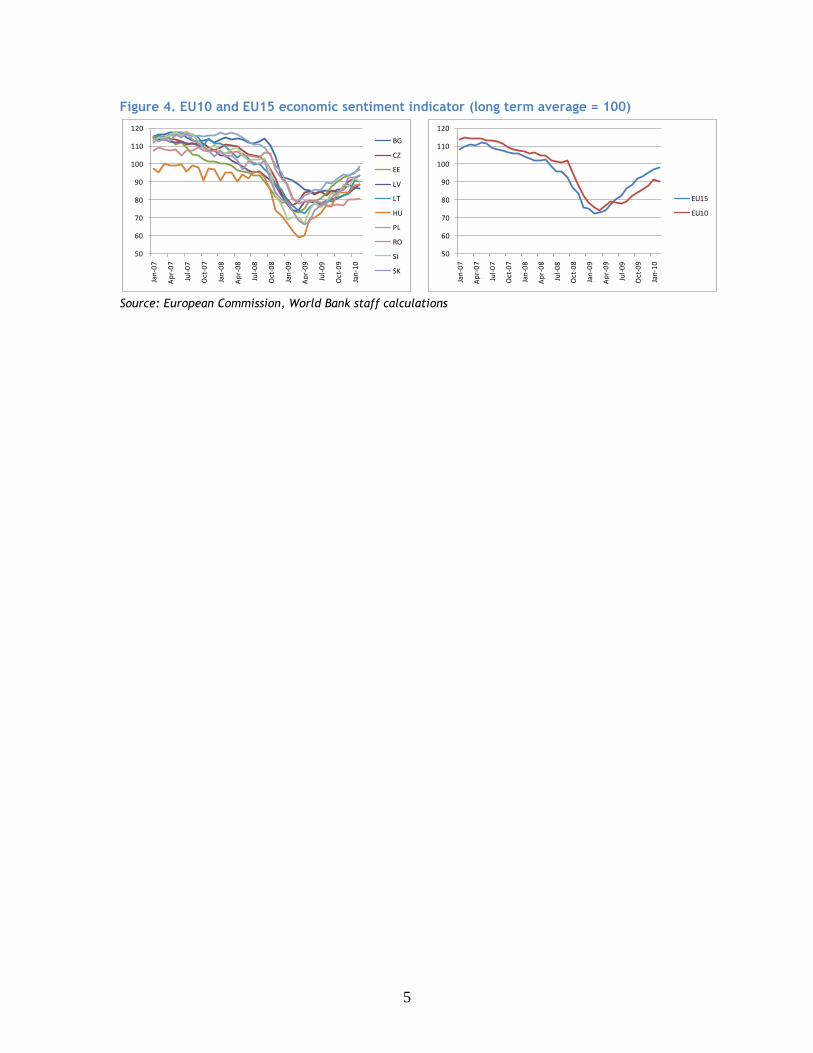
High-frequency indicators suggest that economic activity in the EU10 region continued its gradual recovery in early 2010. Industrial production improved for the 12th months in a row, reaching positive year-on-year growth in both December 2009 and January 2010. It expanded more than 8 percent in January 2010 in the Slovak Republic, Romania and Poland. Retail sales continued to contract in all countries apart from Poland, but the rate of contraction slowed markedly over the last half a year. The economic sentiment indicator gained over 15 points since March 2009. The February 2010 indicator fell short of the long-term average of 100 only by 10 points for the EU10 region and 2 points for the EU15 region (Figure 4). The recovery in confidence of businesses and consumers relative to the trough was largest in Hungary, the Slovak Republic, Estonia and Slovenia, and weakest in Bulgaria and Romania. While business confidence in industry improved across the region, confidence in construction worsened with prices of real estate falling and demand for new construction constrained by tighter credit conditions.
-40
-30
-20
-10
0
10
20
20
08
20
09
20
08
20
09
20
08
20
09
20
08
20
09
20
08
20
09
20
08
20
09
20
08
20
09
20
08
20
09
20
08
20
09
20
08
20
09
20
08
20
09
20
08
20
09
BG CZ EE HU LV LT PL RO SK SI EU10 EU15
Gross capital formation Net exports
Final consumption expenditure Other
Gross domestic product at market prices
5
Figure 4. EU10 and EU15 economic sentiment indicator (long term average = 100)
Source: European Commission, World Bank staff calculations
50
60
70
80
90
100
110
120
Jan
-07
Ap
r-0
7
Jul-
07
Oct
-07
Jan
-08
Ap
r-0
8
Jul-
08
Oct
-08
Jan
-09
Ap
r-0
9
Jul-
09
Oct
-09
Jan
-10
BG
CZ
EE
LV
LT
HU
PL
RO
SI
SK
50
60
70
80
90
100
110
120
Jan
-07
Ap
r-0
7
Jul-
07
Oct
-07
Jan
-08
Ap
r-0
8
Jul-
08
Oct
-08
Jan
-09
Ap
r-0
9
Jul-
09
Oct
-09
Jan
-10
EU15
EU10
6
Trade
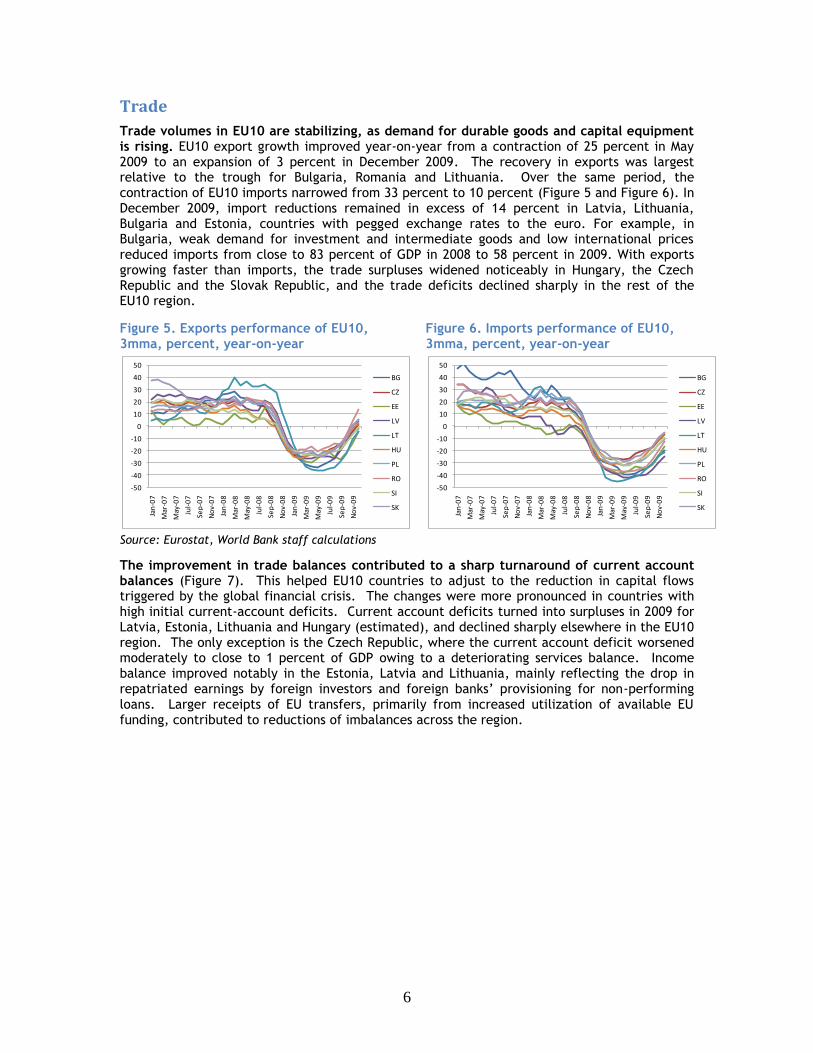
Trade volumes in EU10 are stabilizing, as demand for durable goods and capital equipment is rising. EU10 export growth improved year-on-year from a contraction of 25 percent in May 2009 to an expansion of 3 percent in December 2009. The recovery in exports was largest relative to the trough for Bulgaria, Romania and Lithuania. Over the same period, the contraction of EU10 imports narrowed from 33 percent to 10 percent (Figure 5 and Figure 6). In December 2009, import reductions remained in excess of 14 percent in Latvia, Lithuania, Bulgaria and Estonia, countries with pegged exchange rates to the euro. For example, in Bulgaria, weak demand for investment and intermediate goods and low international prices reduced imports from close to 83 percent of GDP in 2008 to 58 percent in 2009. With exports growing faster than imports, the trade surpluses widened noticeably in Hungary, the Czech Republic and the Slovak Republic, and the trade deficits declined sharply in the rest of the EU10 region.
Figure 5. Exports performance of EU10, 3mma, percent, year-on-year
Figure 6. Imports performance of EU10, 3mma, percent, year-on-year
Source: Eurostat, World Bank staff calculations
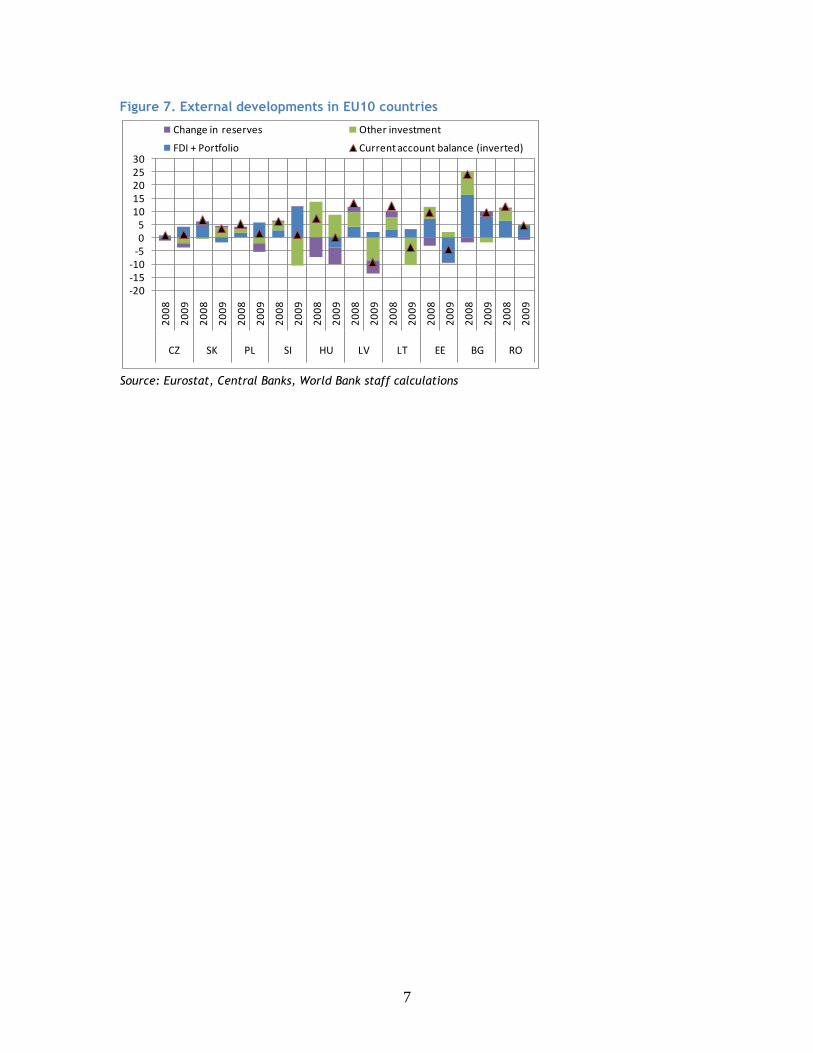
The improvement in trade balances contributed to a sharp turnaround of current account balances (Figure 7). This helped EU10 countries to adjust to the reduction in capital flows triggered by the global financial crisis. The changes were more pronounced in countries with high initial current‐account deficits. Current account deficits turned into surpluses in 2009 for Latvia, Estonia, Lithuania and Hungary (estimated), and declined sharply elsewhere in the EU10 region. The only exception is the Czech Republic, where the current account deficit worsened moderately to close to 1 percent of GDP owing to a deteriorating services balance. Income balance improved notably in the Estonia, Latvia and Lithuania, mainly reflecting the drop in repatriated earnings by foreign investors and foreign banks’ provisioning for non-performing loans. Larger receipts of EU transfers, primarily from increased utilization of available EU funding, contributed to reductions of imbalances across the region.
-50
-40
-30
-20
-10
0
10
20
30
40
50
Jan
-07
Mar
-07
May
-07
Jul-
07
Sep
-07
No
v-0
7
Jan
-08
Mar
-08
May
-08
Jul-
08
Sep
-08
No
v-0
8
Jan
-09
Mar
-09
May
-09
Jul-
09
Sep
-09
No
v-0
9
BG
CZ
EE
LV
LT
HU
PL
RO
SI
SK
-50
-40
-30
-20
-10
0
10
20
30
40
50
Jan
-07
Mar
-07
May
-07
Jul-
07
Sep
-07
No
v-0
7
Jan
-08
Mar
-08
May
-08
Jul-
08
Sep
-08
No
v-0
8
Jan
-09
Mar
-09
May
-09
Jul-
09
Sep
-09
No
v-0
9
BG
CZ
EE
LV
LT
HU
PL
RO
SI
SK
7
Figure 7. External developments in EU10 countries
Source: Eurostat, Central Banks, World Bank staff calculations
-20-15-10
-505
1015202530
20
08
20
09
20
08
20
09
20
08
20
09
20
08
20
09
20
08
20
09
20
08
20
09
20
08
20
09
20
08
20
09
20
08
20
09
20
08
20
09
CZ SK PL SI HU LV LT EE BG RO
Change in reserves Other investment
FDI + Portfolio Current account balance (inverted)
8
Inflation
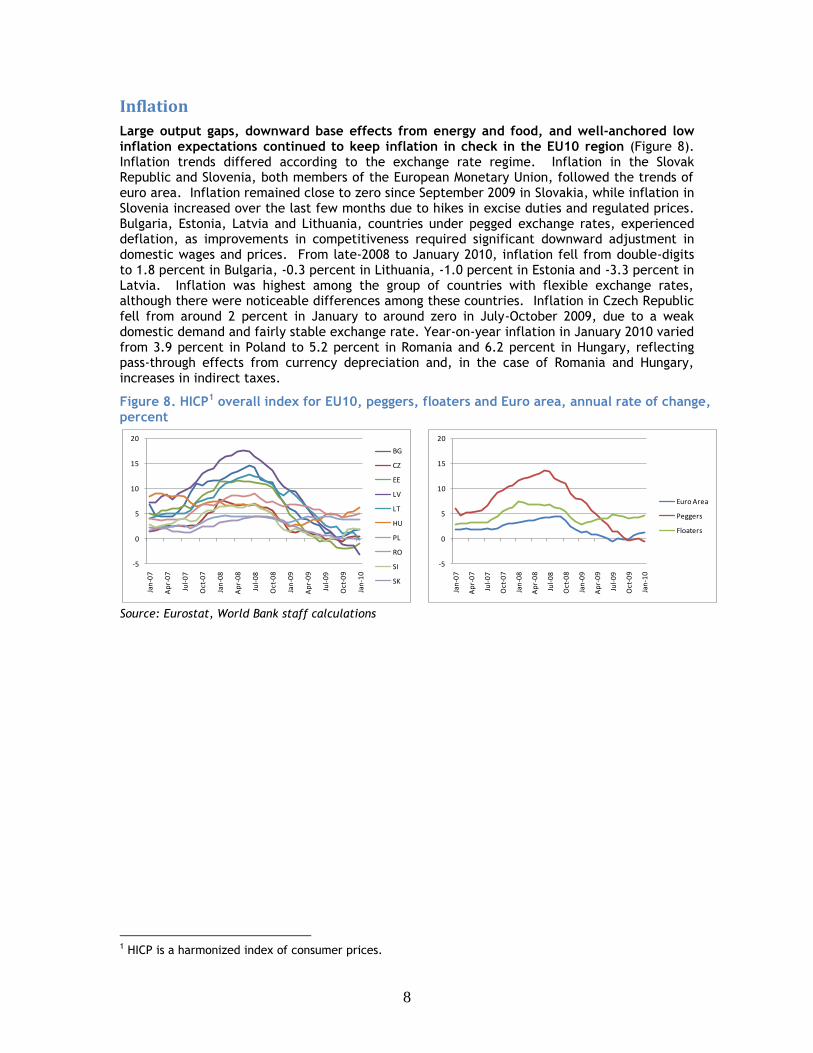
Large output gaps, downward base effects from energy and food, and well-anchored low inflation expectations continued to keep inflation in check in the EU10 region (Figure 8). Inflation trends differed according to the exchange rate regime. Inflation in the Slovak Republic and Slovenia, both members of the European Monetary Union, followed the trends of euro area. Inflation remained close to zero since September 2009 in Slovakia, while inflation in Slovenia increased over the last few months due to hikes in excise duties and regulated prices. Bulgaria, Estonia, Latvia and Lithuania, countries under pegged exchange rates, experienced deflation, as improvements in competitiveness required significant downward adjustment in domestic wages and prices. From late-2008 to January 2010, inflation fell from double-digits to 1.8 percent in Bulgaria, -0.3 percent in Lithuania, -1.0 percent in Estonia and -3.3 percent in Latvia. Inflation was highest among the group of countries with flexible exchange rates, although there were noticeable differences among these countries. Inflation in Czech Republic fell from around 2 percent in January to around zero in July-October 2009, due to a weak domestic demand and fairly stable exchange rate. Year-on-year inflation in January 2010 varied from 3.9 percent in Poland to 5.2 percent in Romania and 6.2 percent in Hungary, reflecting pass-through effects from currency depreciation and, in the case of Romania and Hungary, increases in indirect taxes.
Figure 8. HICP1 overall index for EU10, peggers, floaters and Euro area, annual rate of change, percent
Source: Eurostat, World Bank staff calculations
1 HICP is a harmonized index of consumer prices.
-5
0
5
10
15
20
Jan
-07
Ap
r-0
7
Jul-
07
Oct
-07
Jan
-08
Ap
r-0
8
Jul-
08
Oct
-08
Jan
-09
Ap
r-0
9
Jul-
09
Oct
-09
Jan
-10
BG
CZ
EE
LV
LT
HU
PL
RO
SI
SK
-5
0
5
10
15
20
Jan
-07
Ap
r-0
7
Jul-
07
Oct
-07
Jan
-08
Ap
r-0
8
Jul-
08
Oct
-08
Jan
-09
Ap
r-0
9
Jul-
09
Oct
-09
Jan
-10
Euro Area
Peggers
Floaters
9
Finance
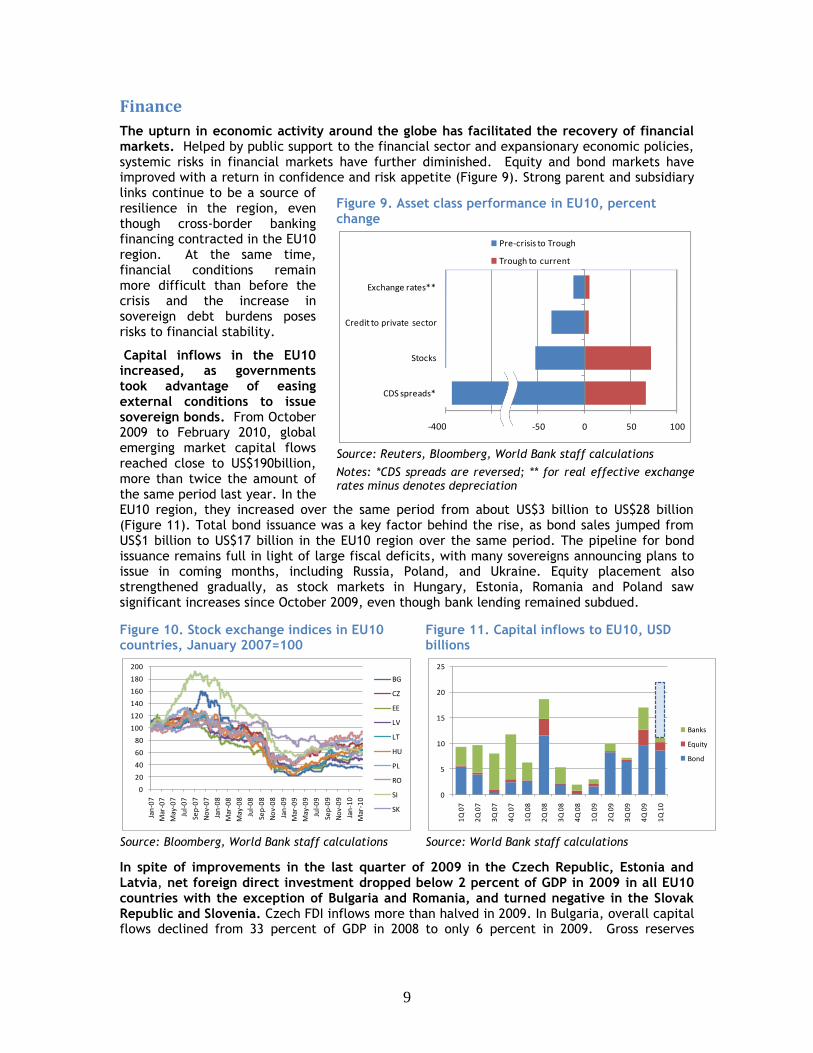
The upturn in economic activity around the globe has facilitated the recovery of financial markets. Helped by public support to the financial sector and expansionary economic policies, systemic risks in financial markets have further diminished. Equity and bond markets have improved with a return in confidence and risk appetite (Figure 9). Strong parent and subsidiary links continue to be a source of resilience in the region, even though cross-border banking financing contracted in the EU10 region. At the same time, financial conditions remain more difficult than before the crisis and the increase in sovereign debt burdens poses risks to financial stability.
Capital inflows in the EU10 increased, as governments took advantage of easing external conditions to issue sovereign bonds. From October 2009 to February 2010, global emerging market capital flows reached close to US$190billion, more than twice the amount of the same period last year. In the EU10 region, they increased over the same period from about US$3 billion to US$28 billion (Figure 11). Total bond issuance was a key factor behind the rise, as bond sales jumped from US$1 billion to US$17 billion in the EU10 region over the same period. The pipeline for bond issuance remains full in light of large fiscal deficits, with many sovereigns announcing plans to issue in coming months, including Russia, Poland, and Ukraine. Equity placement also strengthened gradually, as stock markets in Hungary, Estonia, Romania and Poland saw significant increases since October 2009, even though bank lending remained subdued.
Figure 10. Stock exchange indices in EU10 countries, January 2007=100
Figure 11. Capital inflows to EU10, USD billions
Source: Bloomberg, World Bank staff calculations Source: World Bank staff calculations
In spite of improvements in the last quarter of 2009 in the Czech Republic, Estonia and Latvia, net foreign direct investment dropped below 2 percent of GDP in 2009 in all EU10 countries with the exception of Bulgaria and Romania, and turned negative in the Slovak Republic and Slovenia. Czech FDI inflows more than halved in 2009. In Bulgaria, overall capital flows declined from 33 percent of GDP in 2008 to only 6 percent in 2009. Gross reserves
0
20
40
60
80
100
120
140
160
180
200
Jan
-07
Mar
-07
May
-07
Jul-
07
Sep
-07
No
v-0
7
Jan
-08
Mar
-08
May
-08
Jul-
08
Sep
-08
No
v-0
8
Jan
-09
Mar
-09
May
-09
Jul-
09
Sep
-09
No
v-0
9
Jan
-10
Mar
-10
BG
CZ
EE
LV
LT
HU
PL
RO
SI
SK
0
5
10
15
20
25
1Q
07
2Q
07
3Q
07
4Q
07
1Q
08
2Q
08
3Q
08
4Q
08
1Q
09
2Q
09
3Q
09
4Q
09
1Q
10
Banks
Equity
Bond
Figure 9. Asset class performance in EU10, percent change
Source: Reuters, Bloomberg, World Bank staff calculations
Notes: *CDS spreads are reversed; ** for real effective exchange rates minus denotes depreciation
-150 -100 -50 0 50 100
CDS spreads*
Stocks
Credit to private sector
Exchange rates**
Pre-crisis to Trough
Trough to current
-400
10
remained stable in the last quarter of 2009 in the EU10 region, reflecting a pick-up in capital flows, reduction in external financing needs, and support from international partners.
Gross external debt increased further owning to buoyant debt creating flows and unfavorable debt dynamics. Gross external debt-to-GDP ratios across the EU10 region increased from 65 percent in 2008 to 78 percent of GDP in 2009. They ranged from around 40 percent in the Czech Republic to over 100 percent in Hungary, Estonia, Slovenia, Bulgaria, Latvia, and the Slovak Republic. In many EU10 countries, a growing share of the external debt is created by the public sector, as governments tap the external market for new borrowing and refinancing. However, the share of public external debt in overall external debt remains low in e.g. Bulgaria.
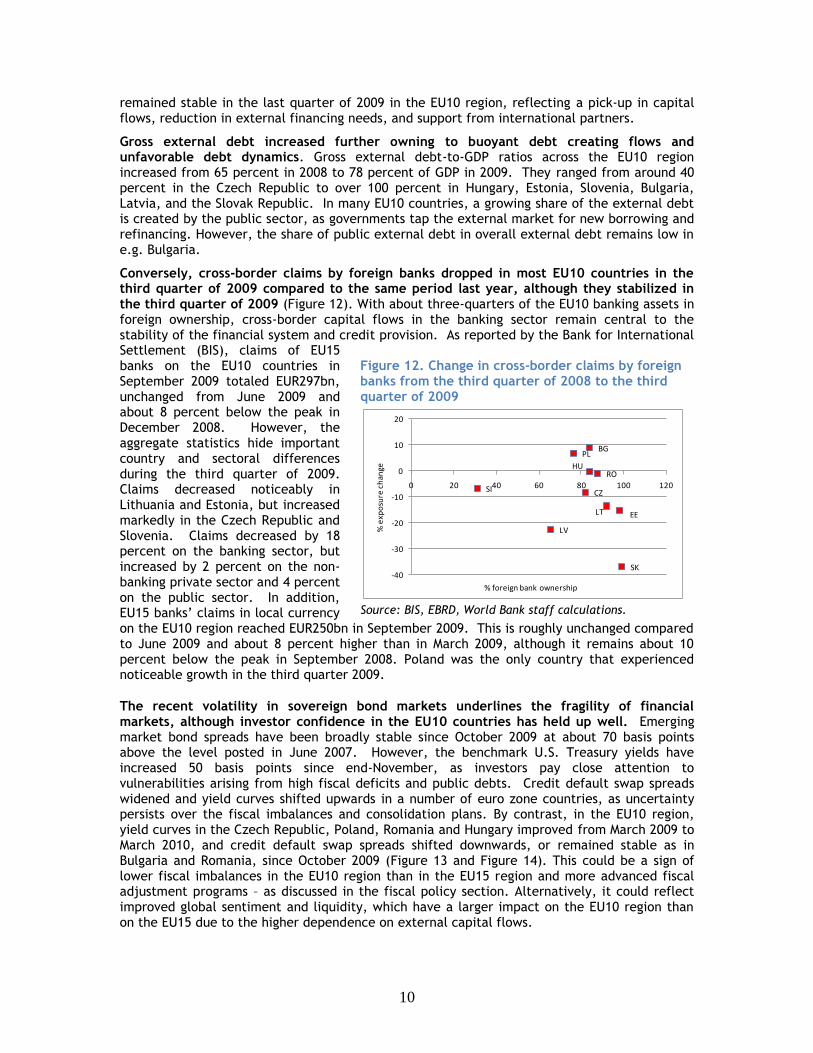
Conversely, cross-border claims by foreign banks dropped in most EU10 countries in the third quarter of 2009 compared to the same period last year, although they stabilized in the third quarter of 2009 (Figure 12). With about three-quarters of the EU10 banking assets in foreign ownership, cross-border capital flows in the banking sector remain central to the stability of the financial system and credit provision. As reported by the Bank for International Settlement (BIS), claims of EU15 banks on the EU10 countries in September 2009 totaled EUR297bn, unchanged from June 2009 and about 8 percent below the peak in December 2008. However, the aggregate statistics hide important country and sectoral differences during the third quarter of 2009. Claims decreased noticeably in Lithuania and Estonia, but increased markedly in the Czech Republic and Slovenia. Claims decreased by 18 percent on the banking sector, but increased by 2 percent on the non-banking private sector and 4 percent on the public sector. In addition, EU15 banks’ claims in local currency on the EU10 region reached EUR250bn in September 2009. This is roughly unchanged compared to June 2009 and about 8 percent higher than in March 2009, although it remains about 10 percent below the peak in September 2008. Poland was the only country that experienced noticeable growth in the third quarter 2009.
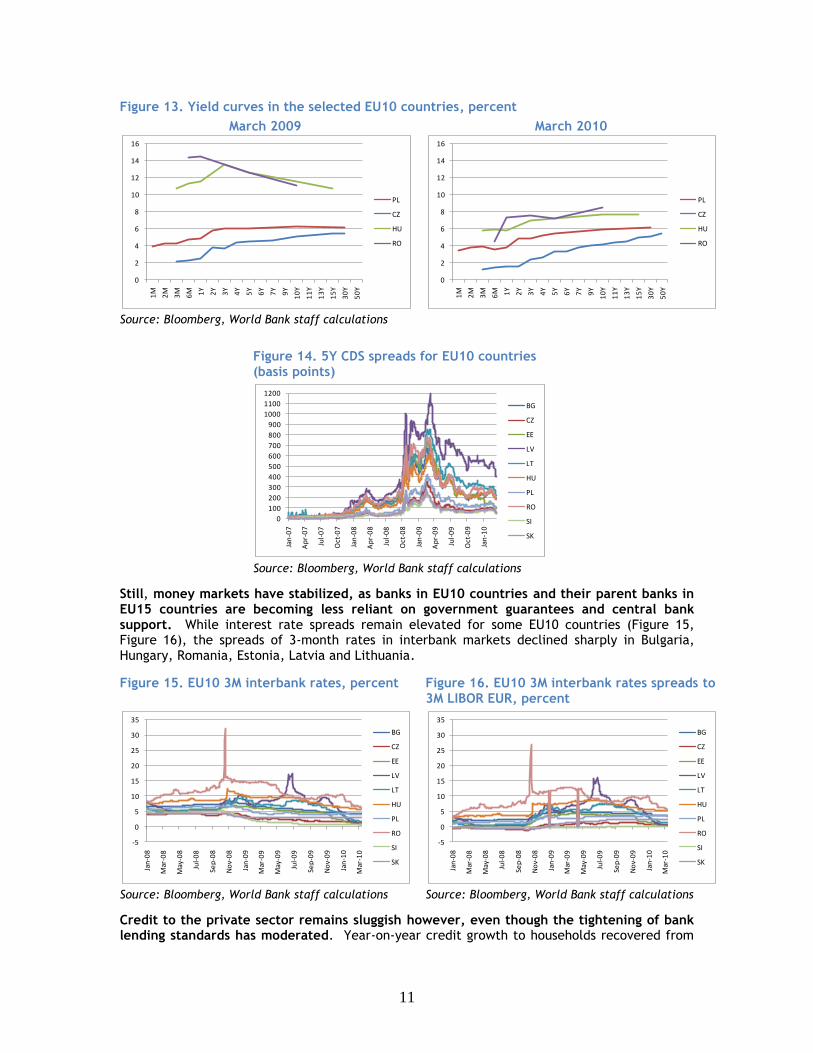
The recent volatility in sovereign bond markets underlines the fragility of financial markets, although investor confidence in the EU10 countries has held up well. Emerging market bond spreads have been broadly stable since October 2009 at about 70 basis points above the level posted in June 2007. However, the benchmark U.S. Treasury yields have increased 50 basis points since end-November, as investors pay close attention to vulnerabilities arising from high fiscal deficits and public debts. Credit default swap spreads widened and yield curves shifted upwards in a number of euro zone countries, as uncertainty persists over the fiscal imbalances and consolidation plans. By contrast, in the EU10 region, yield curves in the Czech Republic, Poland, Romania and Hungary improved from March 2009 to March 2010, and credit default swap spreads shifted downwards, or remained stable as in Bulgaria and Romania, since October 2009 (Figure 13 and Figure 14). This could be a sign of lower fiscal imbalances in the EU10 region than in the EU15 region and more advanced fiscal adjustment programs – as discussed in the fiscal policy section. Alternatively, it could reflect improved global sentiment and liquidity, which have a larger impact on the EU10 region than on the EU15 due to the higher dependence on external capital flows.
Figure 12. Change in cross-border claims by foreign banks from the third quarter of 2008 to the third quarter of 2009
Source: BIS, EBRD, World Bank staff calculations.
SK
SI
BG
CZ
EE
HU
LV
LT
PL
RO
-40
-30
-20
-10
0
10
20
0 20 40 60 80 100 120
% e
xpo
sure
ch
ange
% foreign bank ownership
11
Figure 13. Yield curves in the selected EU10 countries, percent
March 2009 March 2010
Source: Bloomberg, World Bank staff calculations
Figure 14. 5Y CDS spreads for EU10 countries (basis points)
Source: Bloomberg, World Bank staff calculations
Still, money markets have stabilized, as banks in EU10 countries and their parent banks in EU15 countries are becoming less reliant on government guarantees and central bank support. While interest rate spreads remain elevated for some EU10 countries (Figure 15, Figure 16), the spreads of 3-month rates in interbank markets declined sharply in Bulgaria, Hungary, Romania, Estonia, Latvia and Lithuania.
Figure 15. EU10 3M interbank rates, percent Figure 16. EU10 3M interbank rates spreads to 3M LIBOR EUR, percent
Source: Bloomberg, World Bank staff calculations Source: Bloomberg, World Bank staff calculations
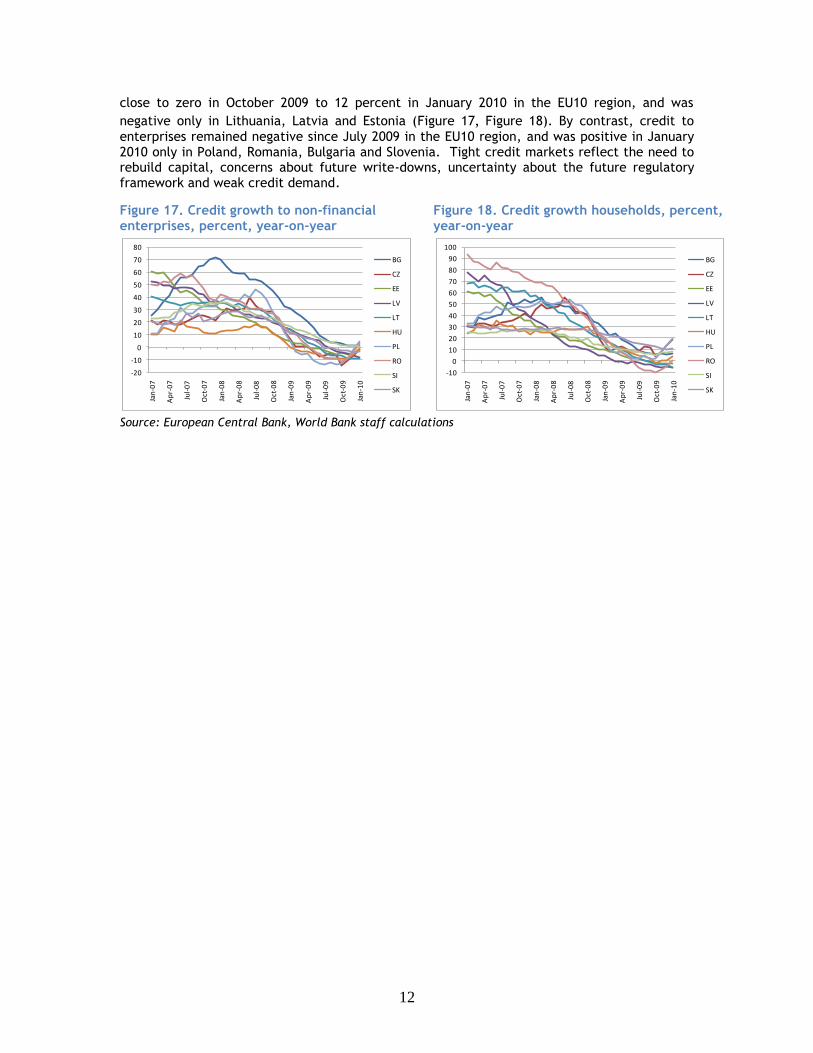
Credit to the private sector remains sluggish however, even though the tightening of bank lending standards has moderated. Year-on-year credit growth to households recovered from
0
2
4
6
8
10
12
14
161
M
2M
3M
6M 1Y
2Y
3Y
4Y
5Y
6Y
7Y
9Y
10
Y
11
Y
13
Y
15
Y
30
Y
50
Y
PL
CZ
HU
RO
0
2
4
6
8
10
12
14
16
1M
2M
3M
6M 1Y
2Y
3Y
4Y
5Y
6Y
7Y
9Y
10
Y
11
Y
13
Y
15
Y
30
Y
50
Y
PL
CZ
HU
RO
0
100
200
300
400
500
600
700
800
900
1000
1100
1200
Jan
-07
Ap
r-0
7
Jul-
07
Oct
-07
Jan
-08
Ap
r-0
8
Jul-
08
Oct
-08
Jan
-09
Ap
r-0
9
Jul-
09
Oct
-09
Jan
-10
BG
CZ
EE
LV
LT
HU
PL
RO
SI
SK
-5
0
5
10
15
20
25
30
35
Jan
-08
Mar
-08
May
-08
Jul-
08
Sep
-08
No
v-0
8
Jan
-09
Mar
-09
May
-09
Jul-
09
Sep
-09
No
v-0
9
Jan
-10
Mar
-10
BG
CZ
EE
LV
LT
HU
PL
RO
SI
SK
-5
0
5
10
15
20
25
30
35
Jan
-08
Mar
-08
May
-08
Jul-
08
Sep
-08
No
v-0
8
Jan
-09
Mar
-09
May
-09
Jul-
09
Sep
-09
No
v-0
9
Jan
-10
Mar
-10
BG
CZ
EE
LV
LT
HU
PL
RO
SI
SK
12
close to zero in October 2009 to 12 percent in January 2010 in the EU10 region, and was
negative only in Lithuania, Latvia and Estonia (Figure 17, Figure 18). By contrast, credit to
enterprises remained negative since July 2009 in the EU10 region, and was positive in January 2010 only in Poland, Romania, Bulgaria and Slovenia. Tight credit markets reflect the need to rebuild capital, concerns about future write-downs, uncertainty about the future regulatory framework and weak credit demand.
Figure 17. Credit growth to non-financial enterprises, percent, year-on-year
Figure 18. Credit growth households, percent, year-on-year
Source: European Central Bank, World Bank staff calculations
-20
-10
0
10
20
30
40
50
60
70
80
Jan
-07
Ap
r-0
7
Jul-
07
Oct
-07
Jan
-08
Ap
r-0
8
Jul-
08
Oct
-08
Jan
-09
Ap
r-0
9
Jul-
09
Oct
-09
Jan
-10
BG
CZ
EE
LV
LT
HU
PL
RO
SI
SK
-10
0
10
20
30
40
50
60
70
80
90
100
Jan
-07
Ap
r-0
7
Jul-
07
Oct
-07
Jan
-08
Ap
r-0
8
Jul-
08
Oct
-08
Jan
-09
Ap
r-0
9
Jul-
09
Oct
-09
Jan
-10
BG
CZ
EE
LV
LT
HU
PL
RO
SI
SK
13
Employment
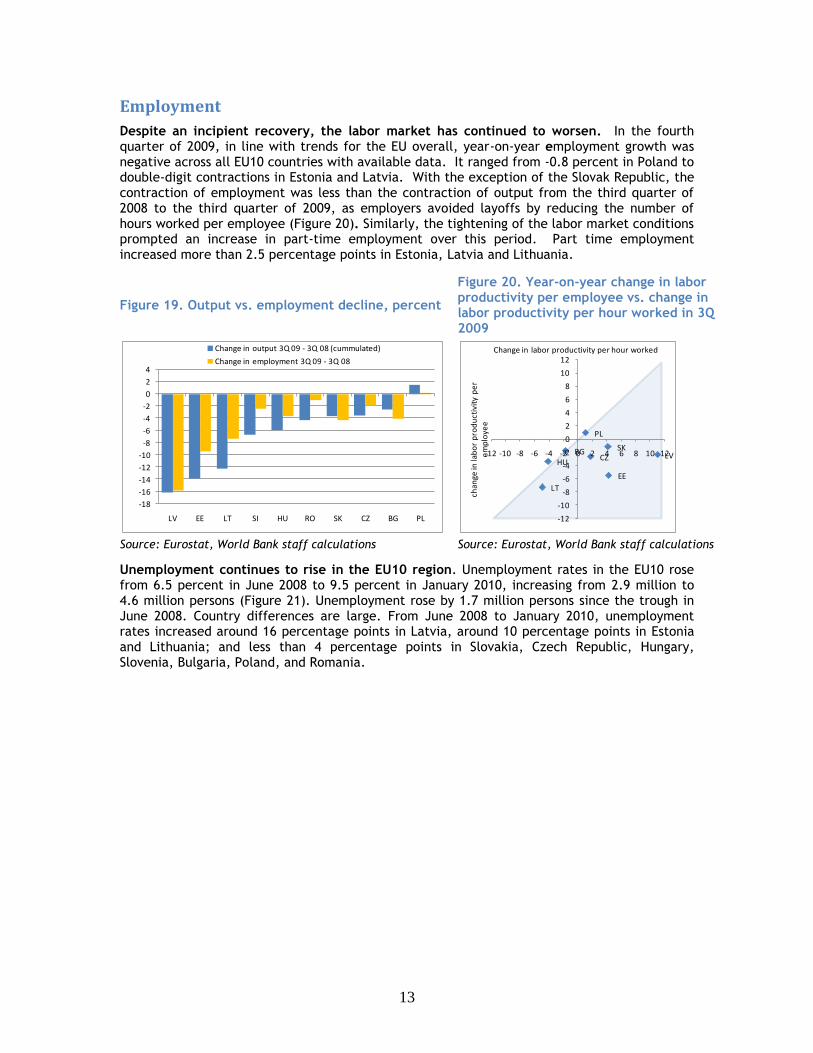
Despite an incipient recovery, the labor market has continued to worsen. In the fourth quarter of 2009, in line with trends for the EU overall, year-on-year employment growth was negative across all EU10 countries with available data. It ranged from -0.8 percent in Poland to double-digit contractions in Estonia and Latvia. With the exception of the Slovak Republic, the contraction of employment was less than the contraction of output from the third quarter of 2008 to the third quarter of 2009, as employers avoided layoffs by reducing the number of hours worked per employee (Figure 20). Similarly, the tightening of the labor market conditions prompted an increase in part-time employment over this period. Part time employment increased more than 2.5 percentage points in Estonia, Latvia and Lithuania.
Figure 19. Output vs. employment decline, percent
Figure 20. Year-on-year change in labor productivity per employee vs. change in labor productivity per hour worked in 3Q 2009
Source: Eurostat, World Bank staff calculations Source: Eurostat, World Bank staff calculations
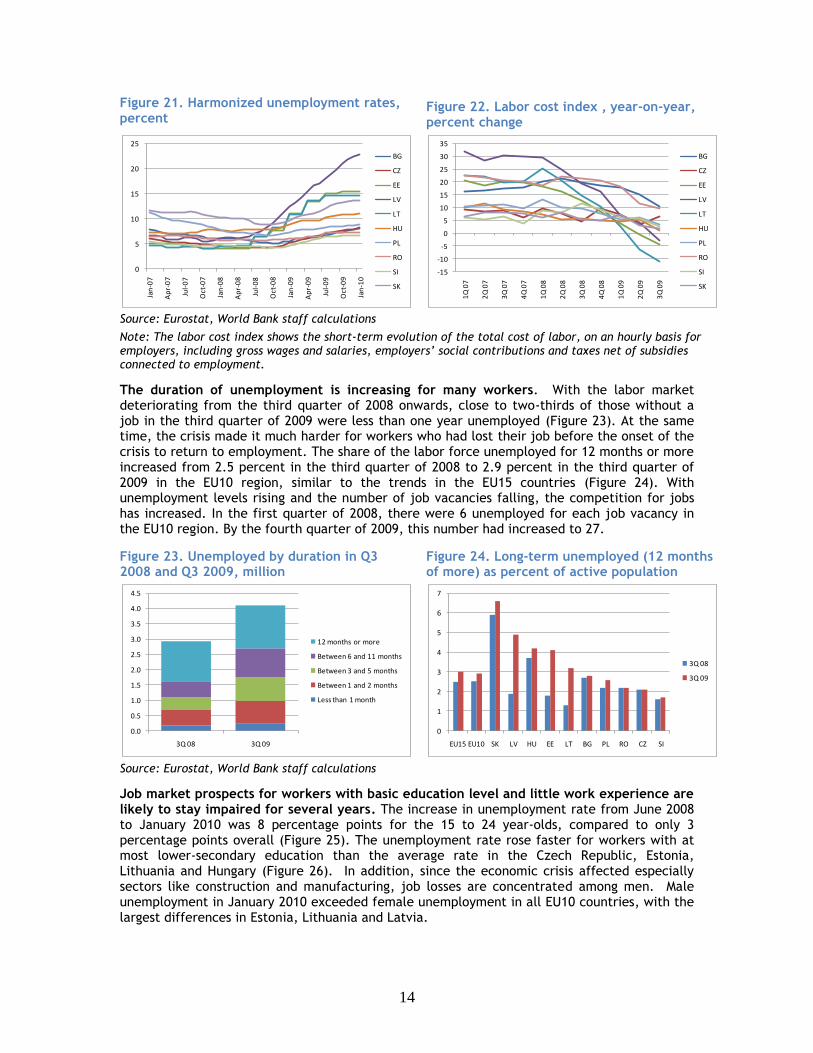
Unemployment continues to rise in the EU10 region. Unemployment rates in the EU10 rose from 6.5 percent in June 2008 to 9.5 percent in January 2010, increasing from 2.9 million to 4.6 million persons (Figure 21). Unemployment rose by 1.7 million persons since the trough in June 2008. Country differences are large. From June 2008 to January 2010, unemployment rates increased around 16 percentage points in Latvia, around 10 percentage points in Estonia and Lithuania; and less than 4 percentage points in Slovakia, Czech Republic, Hungary, Slovenia, Bulgaria, Poland, and Romania.
-18
-16
-14
-12
-10
-8
-6
-4
-2
0
2
4
LV EE LT SI HU RO SK CZ BG PL
Change in output 3Q 09 - 3Q 08 (cummulated)
Change in employment 3Q 09 - 3Q 08
BGCZ
EE
LT
HU
SK
PL
LV
-12
-10
-8
-6
-4
-2
0
2
4
6
8
10
12
-12 -10 -8 -6 -4 -2 0 2 4 6 8 10 12
chan
ge in
lab
or
pro
du
ctiv
ity
pe
r e
mp
loye
e
Change in labor productivity per hour worked
14
Figure 21. Harmonized unemployment rates, percent
Figure 22. Labor cost index , year-on-year, percent change
Source: Eurostat, World Bank staff calculations
Note: The labor cost index shows the short-term evolution of the total cost of labor, on an hourly basis for employers, including gross wages and salaries, employers’ social contributions and taxes net of subsidies connected to employment.
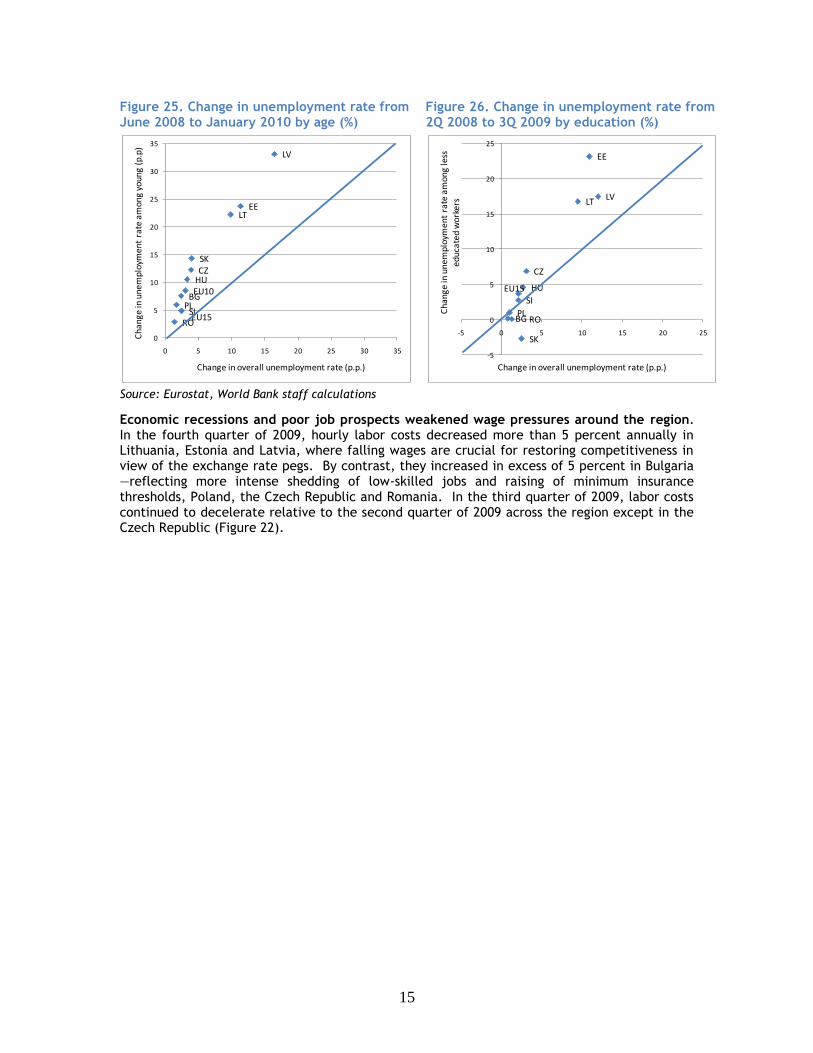
The duration of unemployment is increasing for many workers. With the labor market deteriorating from the third quarter of 2008 onwards, close to two-thirds of those without a job in the third quarter of 2009 were less than one year unemployed (Figure 23). At the same time, the crisis made it much harder for workers who had lost their job before the onset of the crisis to return to employment. The share of the labor force unemployed for 12 months or more increased from 2.5 percent in the third quarter of 2008 to 2.9 percent in the third quarter of 2009 in the EU10 region, similar to the trends in the EU15 countries (Figure 24). With unemployment levels rising and the number of job vacancies falling, the competition for jobs has increased. In the first quarter of 2008, there were 6 unemployed for each job vacancy in the EU10 region. By the fourth quarter of 2009, this number had increased to 27.
Figure 23. Unemployed by duration in Q3 2008 and Q3 2009, million
Figure 24. Long-term unemployed (12 months of more) as percent of active population
Source: Eurostat, World Bank staff calculations
Job market prospects for workers with basic education level and little work experience are likely to stay impaired for several years. The increase in unemployment rate from June 2008 to January 2010 was 8 percentage points for the 15 to 24 year-olds, compared to only 3 percentage points overall (Figure 25). The unemployment rate rose faster for workers with at most lower-secondary education than the average rate in the Czech Republic, Estonia, Lithuania and Hungary (Figure 26). In addition, since the economic crisis affected especially sectors like construction and manufacturing, job losses are concentrated among men. Male unemployment in January 2010 exceeded female unemployment in all EU10 countries, with the largest differences in Estonia, Lithuania and Latvia.
0
5
10
15
20
25Ja
n-0
7
Ap
r-0
7
Jul-
07
Oct
-07
Jan
-08
Ap
r-0
8
Jul-
08
Oct
-08
Jan
-09
Ap
r-0
9
Jul-
09
Oct
-09
Jan
-10
BG
CZ
EE
LV
LT
HU
PL
RO
SI
SK
-15
-10
-5
0
5
10
15
20
25
30
35
1Q
07
2Q
07
3Q
07
4Q
07
1Q
08
2Q
08
3Q
08
4Q
08
1Q
09
2Q
09
3Q
09
BG
CZ
EE
LV
LT
HU
PL
RO
SI
SK
0.0
0.5
1.0
1.5
2.0
2.5
3.0
3.5
4.0
4.5
3Q 08 3Q 09
12 months or more
Between 6 and 11 months
Between 3 and 5 months
Between 1 and 2 months
Less than 1 month
0
1
2
3
4
5
6
7
EU15 EU10 SK LV HU EE LT BG PL RO CZ SI
3Q 08
3Q 09
15
Figure 25. Change in unemployment rate from June 2008 to January 2010 by age (%)
Figure 26. Change in unemployment rate from 2Q 2008 to 3Q 2009 by education (%)
Source: Eurostat, World Bank staff calculations
Economic recessions and poor job prospects weakened wage pressures around the region. In the fourth quarter of 2009, hourly labor costs decreased more than 5 percent annually in Lithuania, Estonia and Latvia, where falling wages are crucial for restoring competitiveness in view of the exchange rate pegs. By contrast, they increased in excess of 5 percent in Bulgaria —reflecting more intense shedding of low-skilled jobs and raising of minimum insurance thresholds, Poland, the Czech Republic and Romania. In the third quarter of 2009, labor costs continued to decelerate relative to the second quarter of 2009 across the region except in the Czech Republic (Figure 22).
EU15
EU10BG
CZ
EE
LV
LT
HU
PL
ROSI
SK
0
5
10
15
20
25
30
35
0 5 10 15 20 25 30 35
Cha
nge
in u
nem
ploy
men
t ra
te a
mon
g yo
ung
(p.p
)
Change in overall unemployment rate (p.p.)
EU15
BG
CZ
EE
LVLT
HU
PLRO
SI
SK
-5
0
5
10
15
20
25
-5 0 5 10 15 20 25
Cha
nge
in u
nem
ploy
men
t ra
te a
mon
g le
ss
educ
ated
wor
kers
Change in overall unemployment rate (p.p.)

16
Outlook
While the recovery in the global economy and trade is under way, the outlook in Europe remains uncertain, as private demand remains subdued. After declining by one third between September 2008 and March 2009, global trade now is growing again very rapidly. Global exports rose in value terms by 21 percent year-on-year in January 2010, supporting a tentative recovery in global GDP. The Euro Zone flash Purchasing Managers’ Index for the manufacturing sector grew in March at the fastest pace since 2007, signaling that the euro area recovery is gathering speed once again after pausing in the fourth quarter. The weakness in the euro, which has dropped about 11 percent against the dollar in the last four months, is making European manufacturing exports more competitive. However, growth is expected to moderate in the coming quarters, as unprecedented policy stimulus measures and temporary factors subside amid strong headwinds from continued high unemployment, low capacity utilization, and tight financial conditions. As these factors abate, high unemployment, low capacity utilization and banking sector deleveraging are expected to weigh on private sector activity.
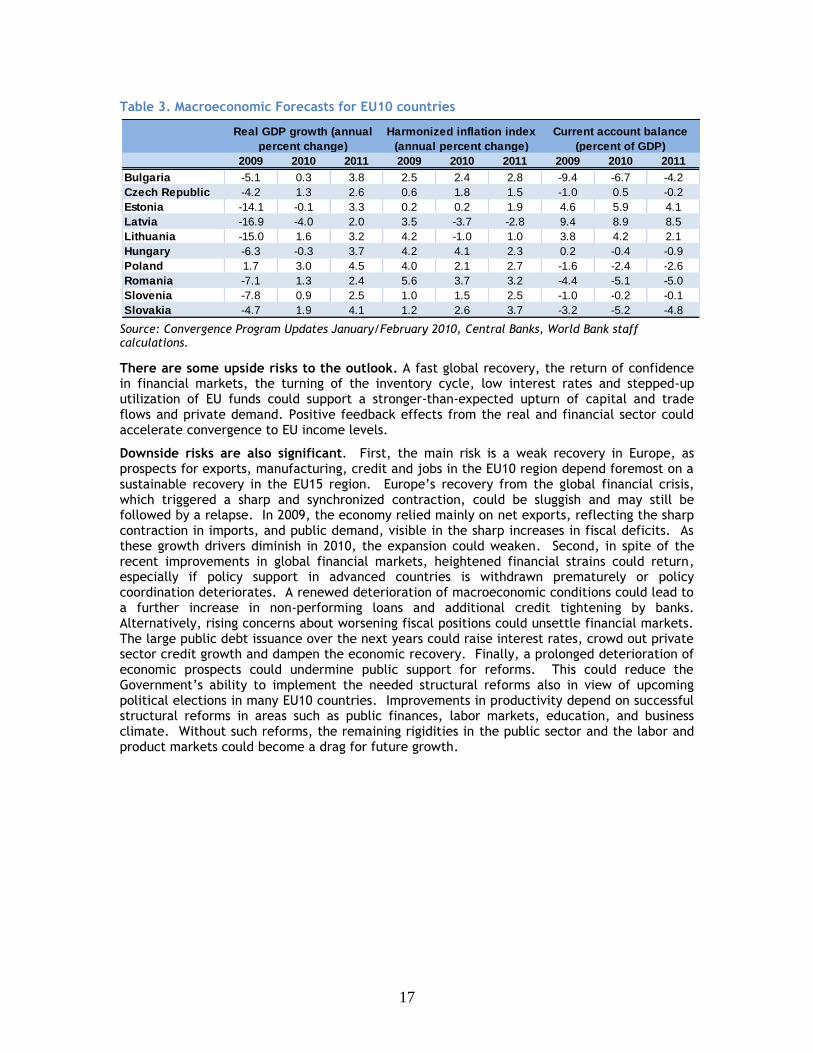
The EU10 region is set to return to growth in 2010 and 2011 but the rate of growth is likely to be lower than the pre-crisis. According to the latest government forecasts, after contracting by 3.6 percent in 2009, the EU10 countries are projected to expand by 1.6 percent in 2010 and 3.6 percent in 2011. While the EU10 region is set to outgrow the EU15 region in both 2010 and 2011, the recovery is weak. It will take until the second half of 2011 before real output will regain its pre-crisis level, and until 2013 or 2014 in most countries before actual output will close the gap to potential output. Even then, the expansion is likely to remain below the pre-crisis growth rate of 6 percent, as potential growth could stay low with the decrease in investment, increase in unemployment, restrained financing of research and development (see Focus Note #1), and ageing of the population. The pace of the recovery will differ across the region, reflecting different initial conditions, external shocks and policy responses. Poland, the Slovak Republic, Lithuania, Romania and the Czech Republic are leading the recovery in 2010, while Latvia is lagging. At the same time, Lithuania, Estonia and Latvia are expected to see the largest improvements in the growth rate from 2009 to 2010, ranging from 13 to 17 percentage points. Only in 2011 will all EU10 countries experience growth. While commodity prices have edged upwards, inflation is likely to remain subdued in view of large output gaps. Current account deficits are likely to remain below pre-crisis levels in view of weak import demand and shallow capital flows (Table 3).
Figure 27. Forecasted GDP growth in EU10 countries and EU15*, year-over-year
Source: Convergence Program Updates January/February 2010, World Bank staff calculations.
Note: EU15 does not include Portugal.
-4.0-3.6
1.21.6
2.3
3.6
-5
-4
-3
-2
-1
0
1
2
3
4
EU15 EU10
2009
2010
2011
-20
-15
-10
-5
0
5
LV LT EE SI RO HU SK BG CZ PL
2009
2010
2011
17
Table 3. Macroeconomic Forecasts for EU10 countries
Source: Convergence Program Updates January/February 2010, Central Banks, World Bank staff calculations.
There are some upside risks to the outlook. A fast global recovery, the return of confidence in financial markets, the turning of the inventory cycle, low interest rates and stepped-up utilization of EU funds could support a stronger-than-expected upturn of capital and trade flows and private demand. Positive feedback effects from the real and financial sector could accelerate convergence to EU income levels.
Downside risks are also significant. First, the main risk is a weak recovery in Europe, as prospects for exports, manufacturing, credit and jobs in the EU10 region depend foremost on a sustainable recovery in the EU15 region. Europe’s recovery from the global financial crisis, which triggered a sharp and synchronized contraction, could be sluggish and may still be followed by a relapse. In 2009, the economy relied mainly on net exports, reflecting the sharp contraction in imports, and public demand, visible in the sharp increases in fiscal deficits. As these growth drivers diminish in 2010, the expansion could weaken. Second, in spite of the recent improvements in global financial markets, heightened financial strains could return, especially if policy support in advanced countries is withdrawn prematurely or policy coordination deteriorates. A renewed deterioration of macroeconomic conditions could lead to a further increase in non-performing loans and additional credit tightening by banks. Alternatively, rising concerns about worsening fiscal positions could unsettle financial markets. The large public debt issuance over the next years could raise interest rates, crowd out private sector credit growth and dampen the economic recovery. Finally, a prolonged deterioration of economic prospects could undermine public support for reforms. This could reduce the Government’s ability to implement the needed structural reforms also in view of upcoming political elections in many EU10 countries. Improvements in productivity depend on successful structural reforms in areas such as public finances, labor markets, education, and business climate. Without such reforms, the remaining rigidities in the public sector and the labor and product markets could become a drag for future growth.
2009 2010 2011 2009 2010 2011 2009 2010 2011
Bulgaria -5.1 0.3 3.8 2.5 2.4 2.8 -9.4 -6.7 -4.2
Czech Republic -4.2 1.3 2.6 0.6 1.8 1.5 -1.0 0.5 -0.2
Estonia -14.1 -0.1 3.3 0.2 0.2 1.9 4.6 5.9 4.1
Latvia -16.9 -4.0 2.0 3.5 -3.7 -2.8 9.4 8.9 8.5
Lithuania -15.0 1.6 3.2 4.2 -1.0 1.0 3.8 4.2 2.1
Hungary -6.3 -0.3 3.7 4.2 4.1 2.3 0.2 -0.4 -0.9
Poland 1.7 3.0 4.5 4.0 2.1 2.7 -1.6 -2.4 -2.6
Romania -7.1 1.3 2.4 5.6 3.7 3.2 -4.4 -5.1 -5.0
Slovenia -7.8 0.9 2.5 1.0 1.5 2.5 -1.0 -0.2 -0.1
Slovakia -4.7 1.9 4.1 1.2 2.6 3.7 -3.2 -5.2 -4.8
Real GDP growth (annual
percent change)
Harmonized inflation index
(annual percent change)
Current account balance
(percent of GDP)
18
Policies for Recovery
Monetary and Financial Policy
Government policies continue to balance supporting a broad-based economic recovery with exiting anti-crisis economic policies in a timely manner. A year and a half after the outbreak of the global financial crisis, the EU10 region has managed successfully to shore up economic growth, strengthen financial markets and limit adverse social outcomes. However, the strength of the recovery is uneven across the region, and there are few signs of a robust upturn of the private sector. A key policy issue is when and how to phase out the extraordinary support to the economy and the financial sector, adopted in response to the European Economic Recovery Program from November 2008, in order to strike an appropriate balance between stabilization and sustainability concerns.
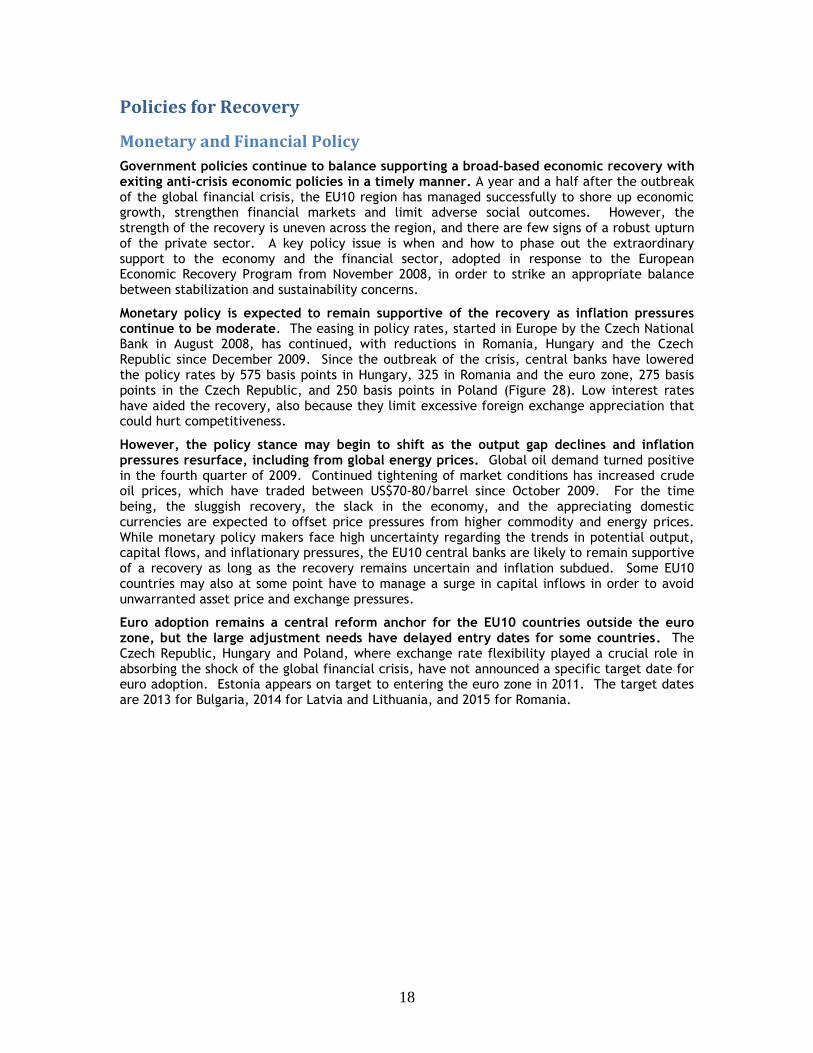
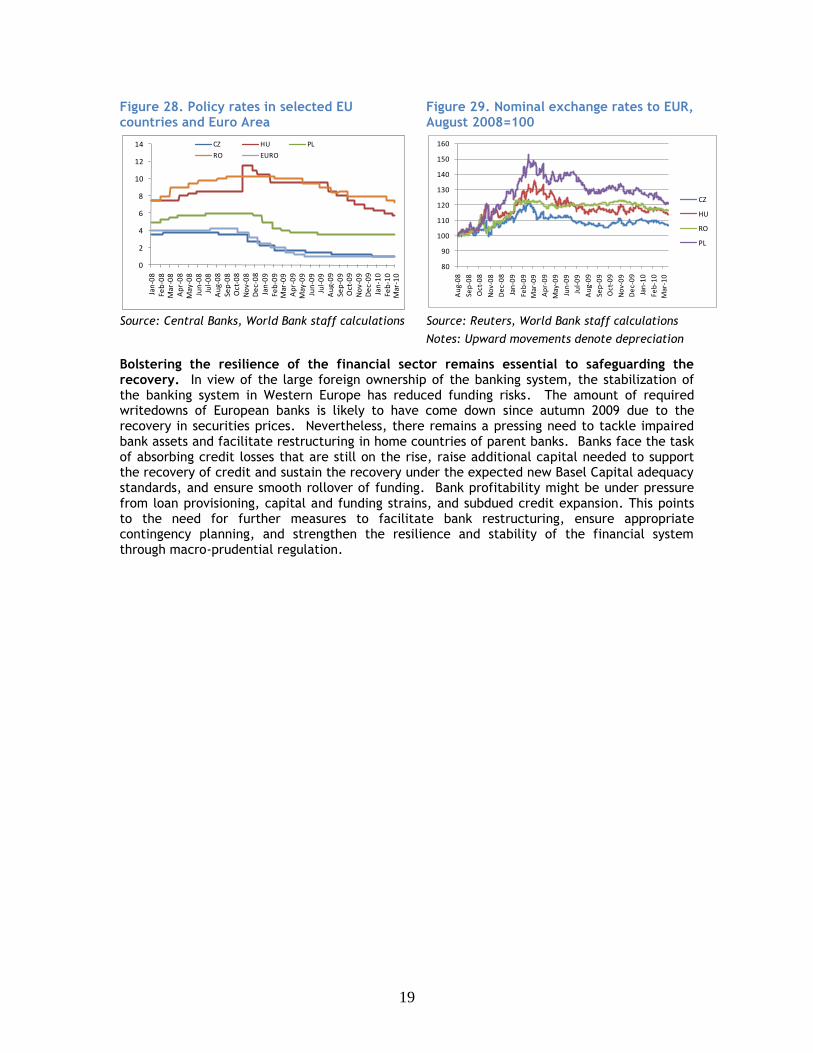
Monetary policy is expected to remain supportive of the recovery as inflation pressures continue to be moderate. The easing in policy rates, started in Europe by the Czech National Bank in August 2008, has continued, with reductions in Romania, Hungary and the Czech Republic since December 2009. Since the outbreak of the crisis, central banks have lowered the policy rates by 575 basis points in Hungary, 325 in Romania and the euro zone, 275 basis points in the Czech Republic, and 250 basis points in Poland (Figure 28). Low interest rates have aided the recovery, also because they limit excessive foreign exchange appreciation that could hurt competitiveness.
However, the policy stance may begin to shift as the output gap declines and inflation pressures resurface, including from global energy prices. Global oil demand turned positive in the fourth quarter of 2009. Continued tightening of market conditions has increased crude oil prices, which have traded between US$70-80/barrel since October 2009. For the time being, the sluggish recovery, the slack in the economy, and the appreciating domestic currencies are expected to offset price pressures from higher commodity and energy prices. While monetary policy makers face high uncertainty regarding the trends in potential output, capital flows, and inflationary pressures, the EU10 central banks are likely to remain supportive of a recovery as long as the recovery remains uncertain and inflation subdued. Some EU10 countries may also at some point have to manage a surge in capital inflows in order to avoid unwarranted asset price and exchange pressures.
Euro adoption remains a central reform anchor for the EU10 countries outside the euro zone, but the large adjustment needs have delayed entry dates for some countries. The Czech Republic, Hungary and Poland, where exchange rate flexibility played a crucial role in absorbing the shock of the global financial crisis, have not announced a specific target date for euro adoption. Estonia appears on target to entering the euro zone in 2011. The target dates are 2013 for Bulgaria, 2014 for Latvia and Lithuania, and 2015 for Romania.
19
Figure 28. Policy rates in selected EU countries and Euro Area
Figure 29. Nominal exchange rates to EUR, August 2008=100
Source: Central Banks, World Bank staff calculations Source: Reuters, World Bank staff calculations
Notes: Upward movements denote depreciation
Bolstering the resilience of the financial sector remains essential to safeguarding the recovery. In view of the large foreign ownership of the banking system, the stabilization of the banking system in Western Europe has reduced funding risks. The amount of required writedowns of European banks is likely to have come down since autumn 2009 due to the recovery in securities prices. Nevertheless, there remains a pressing need to tackle impaired bank assets and facilitate restructuring in home countries of parent banks. Banks face the task of absorbing credit losses that are still on the rise, raise additional capital needed to support the recovery of credit and sustain the recovery under the expected new Basel Capital adequacy standards, and ensure smooth rollover of funding. Bank profitability might be under pressure from loan provisioning, capital and funding strains, and subdued credit expansion. This points to the need for further measures to facilitate bank restructuring, ensure appropriate contingency planning, and strengthen the resilience and stability of the financial system through macro-prudential regulation.
0
2
4
6
8
10
12
14Ja
n-0
8Fe
b-0
8M
ar-0
8A
pr-
08
May
-08
Jun
-08
Jul-
08
Au
g-0
8Se
p-0
8O
ct-0
8N
ov-
08
De
c-0
8Ja
n-0
9Fe
b-0
9M
ar-0
9A
pr-
09
May
-09
Jun
-09
Jul-
09
Au
g-0
9Se
p-0
9O
ct-0
9N
ov-
09
De
c-0
9Ja
n-1
0Fe
b-1
0M
ar-1
0
CZ HU PL
RO EURO
80
90
100
110
120
130
140
150
160
Au
g-0
8
Sep
-08
Oct
-08
No
v-0
8
De
c-0
8
Jan
-09
Feb
-09
Mar
-09
Ap
r-0
9
May
-09
Jun
-09
Jul-
09
Au
g-0
9
Sep
-09
Oct
-09
No
v-0
9
De
c-0
9
Jan
-10
Feb
-10
Mar
-10
CZ
HU
RO
PL
20
Fiscal Policy
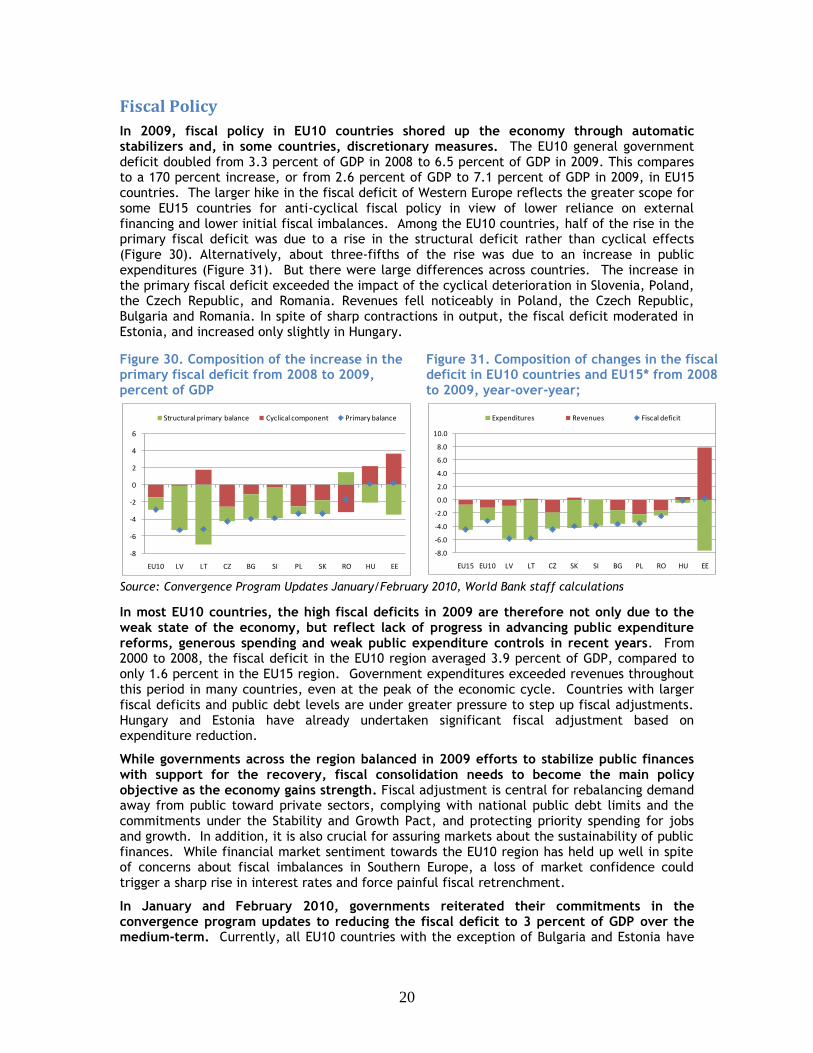
In 2009, fiscal policy in EU10 countries shored up the economy through automatic stabilizers and, in some countries, discretionary measures. The EU10 general government deficit doubled from 3.3 percent of GDP in 2008 to 6.5 percent of GDP in 2009. This compares to a 170 percent increase, or from 2.6 percent of GDP to 7.1 percent of GDP in 2009, in EU15 countries. The larger hike in the fiscal deficit of Western Europe reflects the greater scope for some EU15 countries for anti-cyclical fiscal policy in view of lower reliance on external financing and lower initial fiscal imbalances. Among the EU10 countries, half of the rise in the primary fiscal deficit was due to a rise in the structural deficit rather than cyclical effects (Figure 30). Alternatively, about three-fifths of the rise was due to an increase in public expenditures (Figure 31). But there were large differences across countries. The increase in the primary fiscal deficit exceeded the impact of the cyclical deterioration in Slovenia, Poland, the Czech Republic, and Romania. Revenues fell noticeably in Poland, the Czech Republic, Bulgaria and Romania. In spite of sharp contractions in output, the fiscal deficit moderated in Estonia, and increased only slightly in Hungary.
Figure 30. Composition of the increase in the primary fiscal deficit from 2008 to 2009, percent of GDP
Figure 31. Composition of changes in the fiscal deficit in EU10 countries and EU15* from 2008 to 2009, year-over-year;
Source: Convergence Program Updates January/February 2010, World Bank staff calculations
In most EU10 countries, the high fiscal deficits in 2009 are therefore not only due to the weak state of the economy, but reflect lack of progress in advancing public expenditure reforms, generous spending and weak public expenditure controls in recent years. From 2000 to 2008, the fiscal deficit in the EU10 region averaged 3.9 percent of GDP, compared to only 1.6 percent in the EU15 region. Government expenditures exceeded revenues throughout this period in many countries, even at the peak of the economic cycle. Countries with larger fiscal deficits and public debt levels are under greater pressure to step up fiscal adjustments. Hungary and Estonia have already undertaken significant fiscal adjustment based on expenditure reduction.
While governments across the region balanced in 2009 efforts to stabilize public finances with support for the recovery, fiscal consolidation needs to become the main policy objective as the economy gains strength. Fiscal adjustment is central for rebalancing demand away from public toward private sectors, complying with national public debt limits and the commitments under the Stability and Growth Pact, and protecting priority spending for jobs and growth. In addition, it is also crucial for assuring markets about the sustainability of public finances. While financial market sentiment towards the EU10 region has held up well in spite of concerns about fiscal imbalances in Southern Europe, a loss of market confidence could trigger a sharp rise in interest rates and force painful fiscal retrenchment.
In January and February 2010, governments reiterated their commitments in the convergence program updates to reducing the fiscal deficit to 3 percent of GDP over the medium-term. Currently, all EU10 countries with the exception of Bulgaria and Estonia have
-8
-6
-4
-2
0
2
4
6
EU10 LV LT CZ BG SI PL SK RO HU EE
Structural primary balance Cyclical component Primary balance
-8.0
-6.0
-4.0
-2.0
0.0
2.0
4.0
6.0
8.0
10.0
EU15 EU10 LV LT CZ SK SI BG PL RO HU EE
Expenditures Revenues Fiscal deficit
21
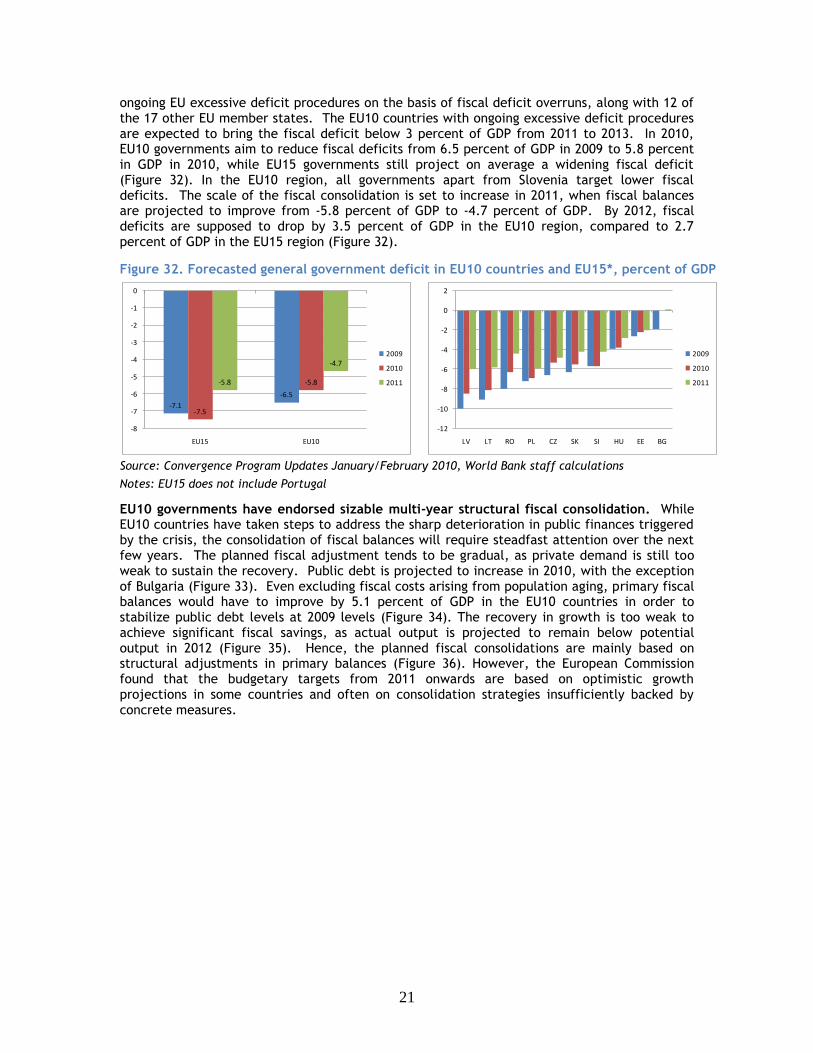
ongoing EU excessive deficit procedures on the basis of fiscal deficit overruns, along with 12 of the 17 other EU member states. The EU10 countries with ongoing excessive deficit procedures are expected to bring the fiscal deficit below 3 percent of GDP from 2011 to 2013. In 2010, EU10 governments aim to reduce fiscal deficits from 6.5 percent of GDP in 2009 to 5.8 percent in GDP in 2010, while EU15 governments still project on average a widening fiscal deficit (Figure 32). In the EU10 region, all governments apart from Slovenia target lower fiscal deficits. The scale of the fiscal consolidation is set to increase in 2011, when fiscal balances are projected to improve from -5.8 percent of GDP to -4.7 percent of GDP. By 2012, fiscal deficits are supposed to drop by 3.5 percent of GDP in the EU10 region, compared to 2.7 percent of GDP in the EU15 region (Figure 32).
Figure 32. Forecasted general government deficit in EU10 countries and EU15*, percent of GDP
Source: Convergence Program Updates January/February 2010, World Bank staff calculations
Notes: EU15 does not include Portugal
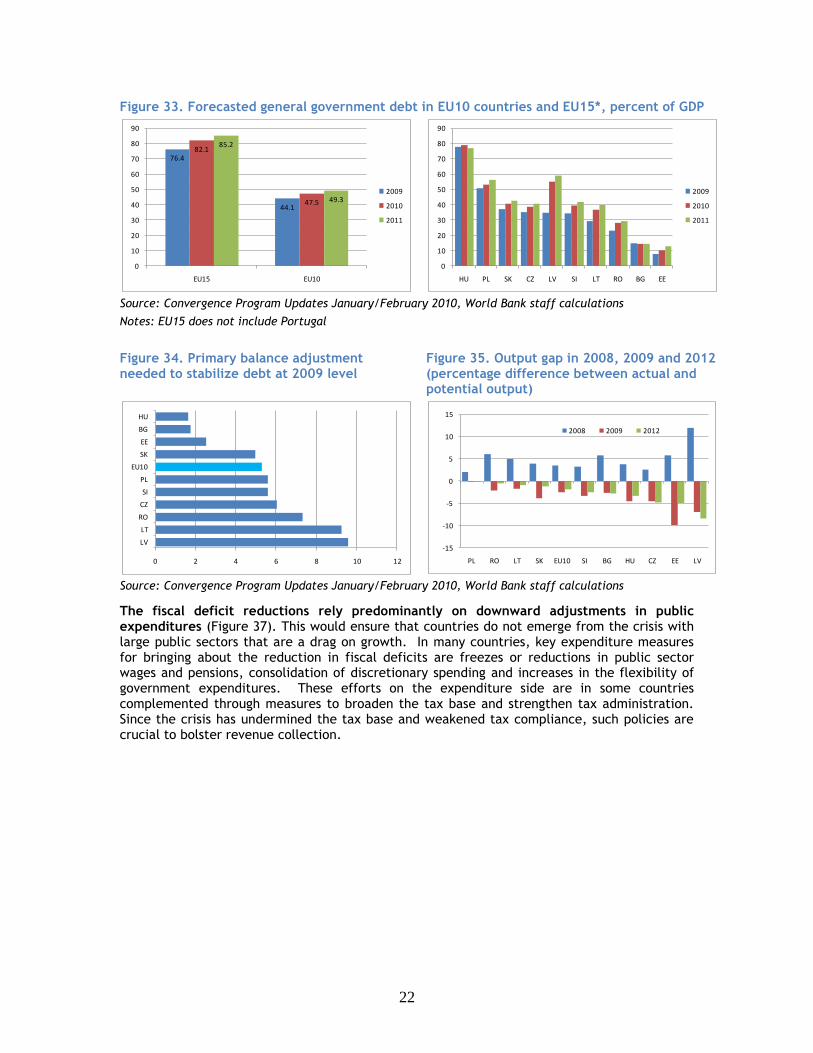
EU10 governments have endorsed sizable multi-year structural fiscal consolidation. While EU10 countries have taken steps to address the sharp deterioration in public finances triggered by the crisis, the consolidation of fiscal balances will require steadfast attention over the next few years. The planned fiscal adjustment tends to be gradual, as private demand is still too weak to sustain the recovery. Public debt is projected to increase in 2010, with the exception of Bulgaria (Figure 33). Even excluding fiscal costs arising from population aging, primary fiscal balances would have to improve by 5.1 percent of GDP in the EU10 countries in order to stabilize public debt levels at 2009 levels (Figure 34). The recovery in growth is too weak to achieve significant fiscal savings, as actual output is projected to remain below potential output in 2012 (Figure 35). Hence, the planned fiscal consolidations are mainly based on structural adjustments in primary balances (Figure 36). However, the European Commission found that the budgetary targets from 2011 onwards are based on optimistic growth projections in some countries and often on consolidation strategies insufficiently backed by concrete measures.
-7.1
-6.5
-7.5
-5.8-5.8
-4.7
-8
-7
-6
-5
-4
-3
-2
-1
0
EU15 EU10
2009
2010
2011
-12
-10
-8
-6
-4
-2
0
2
LV LT RO PL CZ SK SI HU EE BG
2009
2010
2011
22
Figure 33. Forecasted general government debt in EU10 countries and EU15*, percent of GDP
Source: Convergence Program Updates January/February 2010, World Bank staff calculations
Notes: EU15 does not include Portugal
Figure 34. Primary balance adjustment needed to stabilize debt at 2009 level
Figure 35. Output gap in 2008, 2009 and 2012 (percentage difference between actual and potential output)
Source: Convergence Program Updates January/February 2010, World Bank staff calculations
The fiscal deficit reductions rely predominantly on downward adjustments in public expenditures (Figure 37). This would ensure that countries do not emerge from the crisis with large public sectors that are a drag on growth. In many countries, key expenditure measures for bringing about the reduction in fiscal deficits are freezes or reductions in public sector wages and pensions, consolidation of discretionary spending and increases in the flexibility of government expenditures. These efforts on the expenditure side are in some countries complemented through measures to broaden the tax base and strengthen tax administration. Since the crisis has undermined the tax base and weakened tax compliance, such policies are crucial to bolster revenue collection.
76.4
44.1
82.1
47.5
85.2
49.3
0
10
20
30
40
50
60
70
80
90
EU15 EU10
2009
2010
2011
0
10
20
30
40
50
60
70
80
90
HU PL SK CZ LV SI LT RO BG EE
2009
2010
2011
0 2 4 6 8 10 12
LV
LT
RO
CZ
SI
PL
EU10
SK
EE
BG
HU
-15
-10
-5
0
5
10
15
PL RO LT SK EU10 SI BG HU CZ EE LV
2008 2009 2012
23
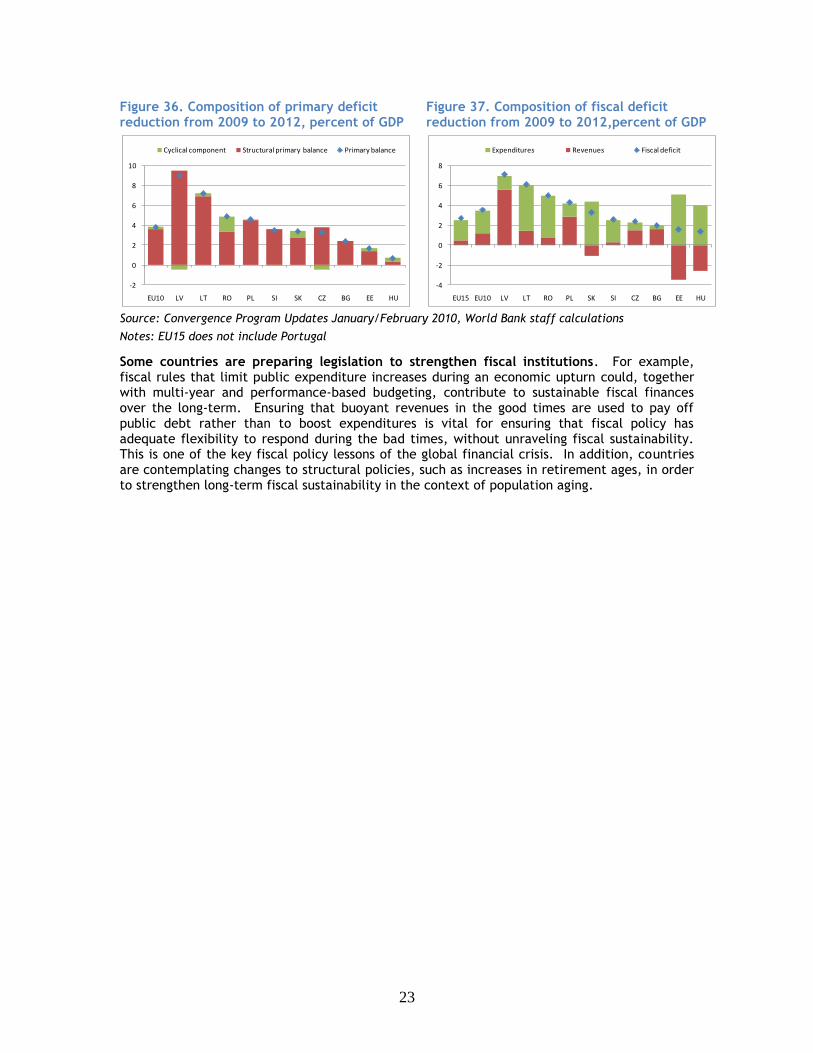
Figure 36. Composition of primary deficit reduction from 2009 to 2012, percent of GDP
Figure 37. Composition of fiscal deficit reduction from 2009 to 2012,percent of GDP
Source: Convergence Program Updates January/February 2010, World Bank staff calculations
Notes: EU15 does not include Portugal
Some countries are preparing legislation to strengthen fiscal institutions. For example, fiscal rules that limit public expenditure increases during an economic upturn could, together with multi-year and performance-based budgeting, contribute to sustainable fiscal finances over the long-term. Ensuring that buoyant revenues in the good times are used to pay off public debt rather than to boost expenditures is vital for ensuring that fiscal policy has adequate flexibility to respond during the bad times, without unraveling fiscal sustainability. This is one of the key fiscal policy lessons of the global financial crisis. In addition, countries are contemplating changes to structural policies, such as increases in retirement ages, in order to strengthen long-term fiscal sustainability in the context of population aging.
-2
0
2
4
6
8
10
EU10 LV LT RO PL SI SK CZ BG EE HU
Cyclical component Structural primary balance Primary balance
-4
-2
0
2
4
6
8
EU15 EU10 LV LT RO PL SK SI CZ BG EE HU
Expenditures Revenues Fiscal deficit
24
Structural and Labor Policy
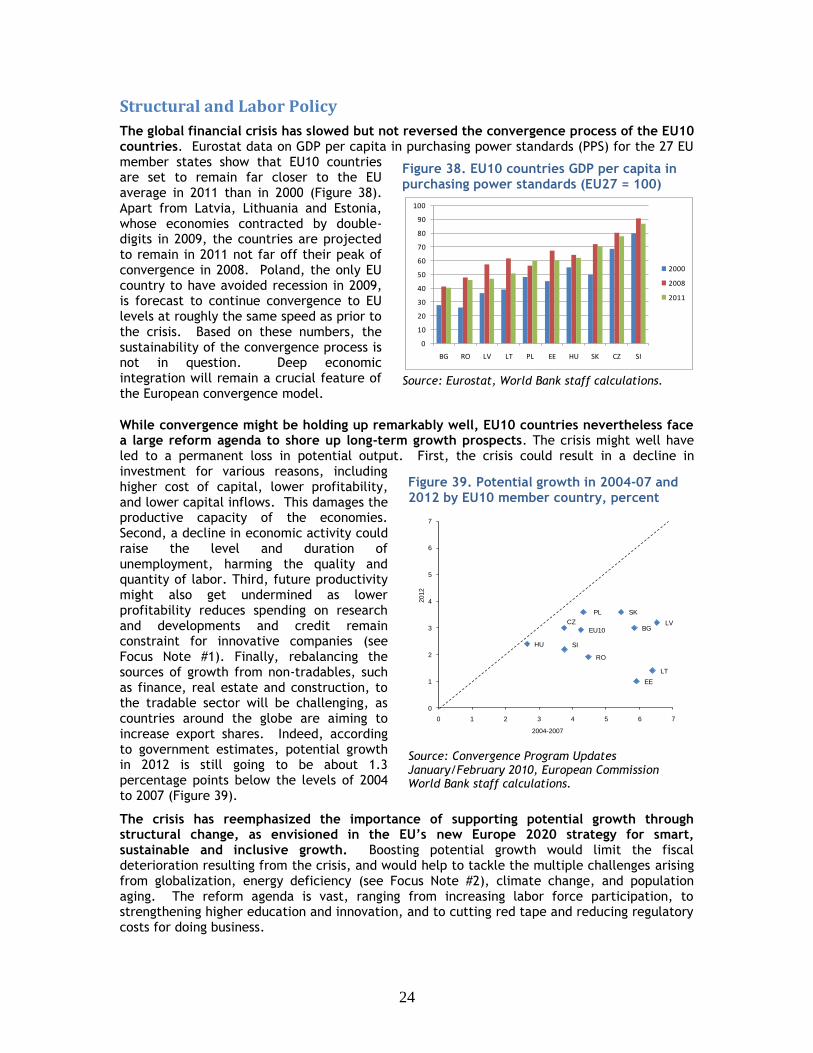
The global financial crisis has slowed but not reversed the convergence process of the EU10 countries. Eurostat data on GDP per capita in purchasing power standards (PPS) for the 27 EU member states show that EU10 countries are set to remain far closer to the EU average in 2011 than in 2000 (Figure 38). Apart from Latvia, Lithuania and Estonia, whose economies contracted by double-digits in 2009, the countries are projected to remain in 2011 not far off their peak of convergence in 2008. Poland, the only EU country to have avoided recession in 2009, is forecast to continue convergence to EU levels at roughly the same speed as prior to the crisis. Based on these numbers, the sustainability of the convergence process is not in question. Deep economic integration will remain a crucial feature of the European convergence model.
While convergence might be holding up remarkably well, EU10 countries nevertheless face a large reform agenda to shore up long-term growth prospects. The crisis might well have led to a permanent loss in potential output. First, the crisis could result in a decline in investment for various reasons, including higher cost of capital, lower profitability, and lower capital inflows. This damages the productive capacity of the economies. Second, a decline in economic activity could raise the level and duration of unemployment, harming the quality and quantity of labor. Third, future productivity might also get undermined as lower profitability reduces spending on research and developments and credit remain constraint for innovative companies (see Focus Note #1). Finally, rebalancing the sources of growth from non-tradables, such as finance, real estate and construction, to the tradable sector will be challenging, as countries around the globe are aiming to increase export shares. Indeed, according to government estimates, potential growth in 2012 is still going to be about 1.3 percentage points below the levels of 2004 to 2007 (Figure 39).
The crisis has reemphasized the importance of supporting potential growth through structural change, as envisioned in the EU’s new Europe 2020 strategy for smart, sustainable and inclusive growth. Boosting potential growth would limit the fiscal deterioration resulting from the crisis, and would help to tackle the multiple challenges arising from globalization, energy deficiency (see Focus Note #2), climate change, and population aging. The reform agenda is vast, ranging from increasing labor force participation, to strengthening higher education and innovation, and to cutting red tape and reducing regulatory costs for doing business.
Figure 38. EU10 countries GDP per capita in purchasing power standards (EU27 = 100)
Source: Eurostat, World Bank staff calculations.
Figure 39. Potential growth in 2004-07 and 2012 by EU10 member country, percent
Source: Convergence Program Updates January/February 2010, European Commission World Bank staff calculations.
0
10
20
30
40
50
60
70
80
90
100
BG RO LV LT PL EE HU SK CZ SI
2000
2008
2011
EU10 BGCZ
EE
LV
LT
HU
PL
RO
SI
SK
0
1
2
3
4
5
6
7
0 1 2 3 4 5 6 7
2012
2004-2007
25
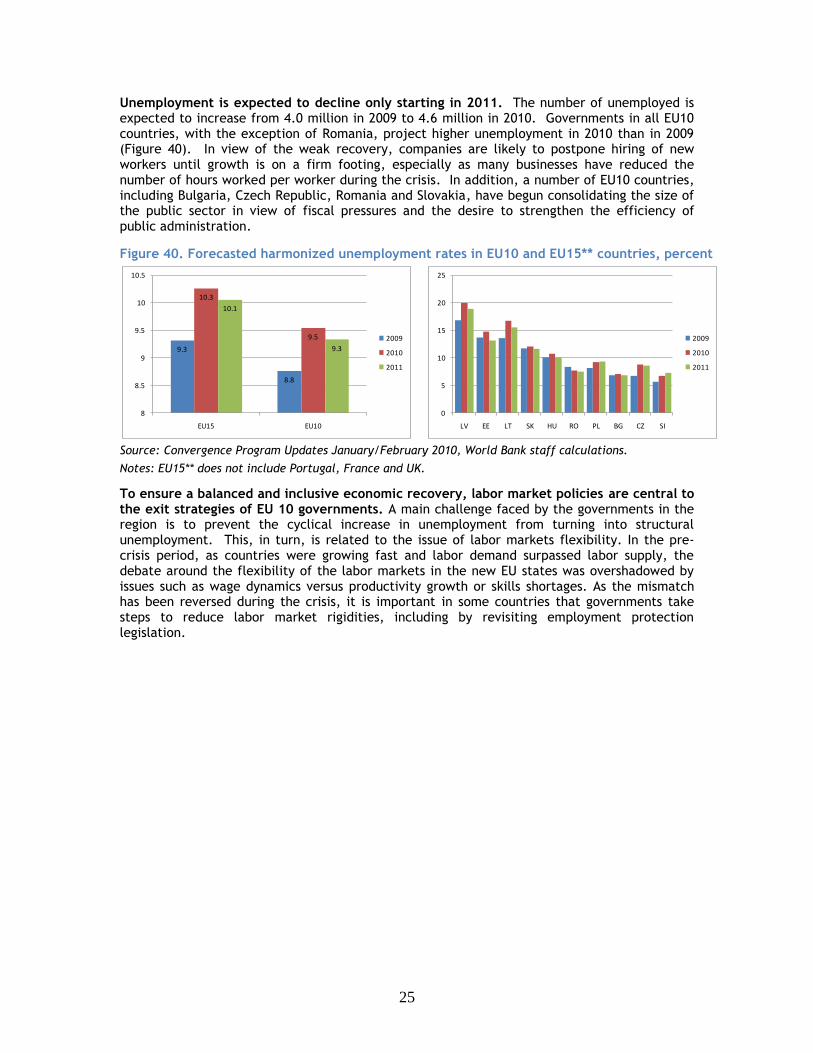
Unemployment is expected to decline only starting in 2011. The number of unemployed is expected to increase from 4.0 million in 2009 to 4.6 million in 2010. Governments in all EU10 countries, with the exception of Romania, project higher unemployment in 2010 than in 2009 (Figure 40). In view of the weak recovery, companies are likely to postpone hiring of new workers until growth is on a firm footing, especially as many businesses have reduced the number of hours worked per worker during the crisis. In addition, a number of EU10 countries, including Bulgaria, Czech Republic, Romania and Slovakia, have begun consolidating the size of the public sector in view of fiscal pressures and the desire to strengthen the efficiency of public administration.
Figure 40. Forecasted harmonized unemployment rates in EU10 and EU15** countries, percent
Source: Convergence Program Updates January/February 2010, World Bank staff calculations.
Notes: EU15** does not include Portugal, France and UK.
To ensure a balanced and inclusive economic recovery, labor market policies are central to the exit strategies of EU 10 governments. A main challenge faced by the governments in the region is to prevent the cyclical increase in unemployment from turning into structural unemployment. This, in turn, is related to the issue of labor markets flexibility. In the pre-crisis period, as countries were growing fast and labor demand surpassed labor supply, the debate around the flexibility of the labor markets in the new EU states was overshadowed by issues such as wage dynamics versus productivity growth or skills shortages. As the mismatch has been reversed during the crisis, it is important in some countries that governments take steps to reduce labor market rigidities, including by revisiting employment protection legislation.
9.3
8.8
10.3
9.5
10.1
9.3
8
8.5
9
9.5
10
10.5
EU15 EU10
2009
2010
2011
0
5
10
15
20
25
LV EE LT SK HU RO PL BG CZ SI
2009
2010
2011
26
Focus Note # 1 Impact of the crisis on the corporate sector – evidence from a firm-level survey
The global economic crisis changed dramatically the market conditions under which the corporate sector operates. The deleveraging of financial institutions increased capital costs and reduced credit availability, while adjustments in the exchange rate for countries with flexible exchange rates raised the price of imported inputs and turned exports more competitive. The contraction in global trade decreased foreign and, as a second round effect, domestic demand. To these steep shifts in market conditions – particularly severe in the EU10 countries - the corporate sector need to respond by either reducing output, increasing their productivity (possibly through restructuring operations) or exiting the market. This process of structural adjustment to new market conditions may in turn have important effects on the potential growth of the EU10 economies. This note will use firm level date to address the main impacts of the crisis on the corporate sector of some of EU10 countries and to discuss the prospects of economic growth for the region.
Focus Note # 2 Insights for the EU10 and Croatia from the Europe and Central Asia energy outlook 2030
The latest Europe and Central Asia (ECA) energy outlook suggests a shortage of both primary and derivative energy supplies if the current policy environment is not changed. Unless ECA countries start to invest much more in energy in coming years, by 2030 the region as a whole will become a net energy importer in contrast to its current role as an exporter. Western Europe is heavily dependent on energy imports from this region, but with the financial capacity to secure the energy supplies it needs (albeit at the expense of others). In contrast, the region’s energy-importing countries are caught between Western Europe, which has increasing import needs, and the region’s exporters, whose exports will likely decline. Energy-importing countries in ECA face the prospect of being squeezed both financially and in terms of energy access. These developments will have significant implications for the EU10 and Croatia. In order to avoid shortages in primary energy supplies (mainly gas), they could increase reliance on coal, which is locally available but more polluting, but such a shift would be in conflict with the EU fight against climate change. Or they may want to postpone shutting down aging nuclear reactors. In this light, the EU climate change and energy policies constitute huge challenges for some of the EU10. The best option for these countries is to focus on energy efficiency, which, despite dramatic improvements over the last two decades, has not yet reached EU15 levels.
EU10 October 2009
Summary of “In Focus” Notes

27
The global economic crisis dramatically changed the market conditions facing the corporate sector2. The deleveraging of financial institutions increased capital costs and reduced credit availability, while the contraction in global trade decreased foreign and, as a second round effect, domestic demand. To these steep shifts in market conditions – particularly severe in the EU10 countries -- the corporate sector had to respond by either reducing output; increasing their productivity (possibly through restructuring operations) or exiting the market.
This note uses firm level data to examine the main impacts of the crisis on the corporate sector of some of EU10 countries and highlights some concerns that need to be addressed for sustained growth going forward.
The Effects of the Global Economic Crisis on the Corporate Sector
What do firm-level data tell us about the crisis impact on the corporate sector in EU10 Region? The World Bank’s Enterprise Financial Crisis Survey (EFCS) - covering 1,686 firms in six countries (Turkey, Romania, Latvia, Lithuania, Hungary and Bulgaria) from manufacturing, retail and other service sectors3 - was conducted in June/July 2009 with the objective of addressing the effects of the crisis on key aspects of the corporate sector, including sales, employment and finances. Despite the magnitude of the credit crunch, the survey indicates that the majority of firms considered the contraction in total demand to be the most important impact of the crisis on their business. More than 70 percent of firms in each of the countries covered cited the drop in demand as the most important effect of the crisis, compared with ―increase in the level of debt,‖ ―increase in input cost,‖ or ―reduced access to credit‖ (Figure 41).
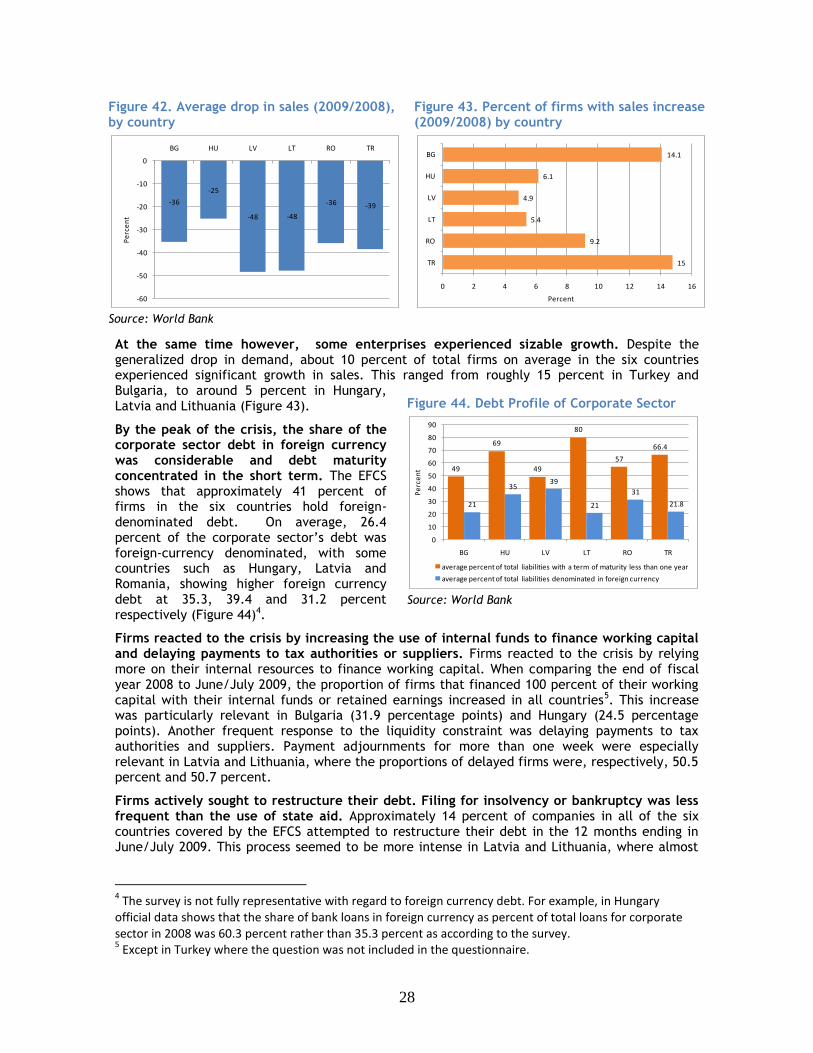
Reflecting the demand-side impact of the crisis, firms in all countries experienced a decline in their sales. The average drop in sales in 2009/2008 was significant in all countries, but was particularly steep in Latvia and Lithuania, where the average sales contraction was 48.4 percent and 48 percent, respectively (Figure 42).
2 Prepared by Paulo Correa and Mariana Iootty. This focus notes draws on the World Bank’s Enterprise Note n.o 9 by the same authors. 3 Turkey is the exception where only the manufacturing sector was targeted.
EU10 April 2010
In Focus: Impact of the crisis on the corporate sector – evidence from a firm-level survey
Figure 41. The main effects of the crisis on enterprises
Source: World Bank
71.3
78.5
70.8
75.4
70.3
78.1
0% 20% 40% 60% 80% 100%
TR
RO
LT
LV
HU
BG
Percent of firms
increased the level of debt
increased input cost
reduced access to credit
drop in demand for its products or services
other
28
Figure 42. Average drop in sales (2009/2008), by country
Figure 43. Percent of firms with sales increase (2009/2008) by country
Source: World Bank
At the same time however, some enterprises experienced sizable growth. Despite the generalized drop in demand, about 10 percent of total firms on average in the six countries experienced significant growth in sales. This ranged from roughly 15 percent in Turkey and Bulgaria, to around 5 percent in Hungary, Latvia and Lithuania (Figure 43).
By the peak of the crisis, the share of the corporate sector debt in foreign currency was considerable and debt maturity concentrated in the short term. The EFCS shows that approximately 41 percent of firms in the six countries hold foreign-denominated debt. On average, 26.4 percent of the corporate sector’s debt was foreign-currency denominated, with some countries such as Hungary, Latvia and Romania, showing higher foreign currency debt at 35.3, 39.4 and 31.2 percent respectively (Figure 44)4.
Firms reacted to the crisis by increasing the use of internal funds to finance working capital and delaying payments to tax authorities or suppliers. Firms reacted to the crisis by relying more on their internal resources to finance working capital. When comparing the end of fiscal year 2008 to June/July 2009, the proportion of firms that financed 100 percent of their working capital with their internal funds or retained earnings increased in all countries5. This increase was particularly relevant in Bulgaria (31.9 percentage points) and Hungary (24.5 percentage points). Another frequent response to the liquidity constraint was delaying payments to tax authorities and suppliers. Payment adjournments for more than one week were especially relevant in Latvia and Lithuania, where the proportions of delayed firms were, respectively, 50.5 percent and 50.7 percent.
Firms actively sought to restructure their debt. Filing for insolvency or bankruptcy was less frequent than the use of state aid. Approximately 14 percent of companies in all of the six countries covered by the EFCS attempted to restructure their debt in the 12 months ending in June/July 2009. This process seemed to be more intense in Latvia and Lithuania, where almost
4 The survey is not fully representative with regard to foreign currency debt. For example, in Hungary
official data shows that the share of bank loans in foreign currency as percent of total loans for corporate sector in 2008 was 60.3 percent rather than 35.3 percent as according to the survey. 5 Except in Turkey where the question was not included in the questionnaire.
-36
-25
-48 -48
-36 -39
-60
-50
-40
-30
-20
-10
0
BG HU LV LT RO TR
Pe
rce
nt
15
9.2
5.4
4.9
6.1
14.1
0 2 4 6 8 10 12 14 16
TR
RO
LT
LV
HU
BG
Percent
Figure 44. Debt Profile of Corporate Sector
Source: World Bank
49
69
49
80
57
66.4
21
3539
21
31
21.8
0
10
20
30
40
50
60
70
80
90
BG HU LV LT RO TR
Pe
rce
nt
average percent of total liabilities with a term of maturity less than one year
average percent of total liabilities denominated in foreign currency
29
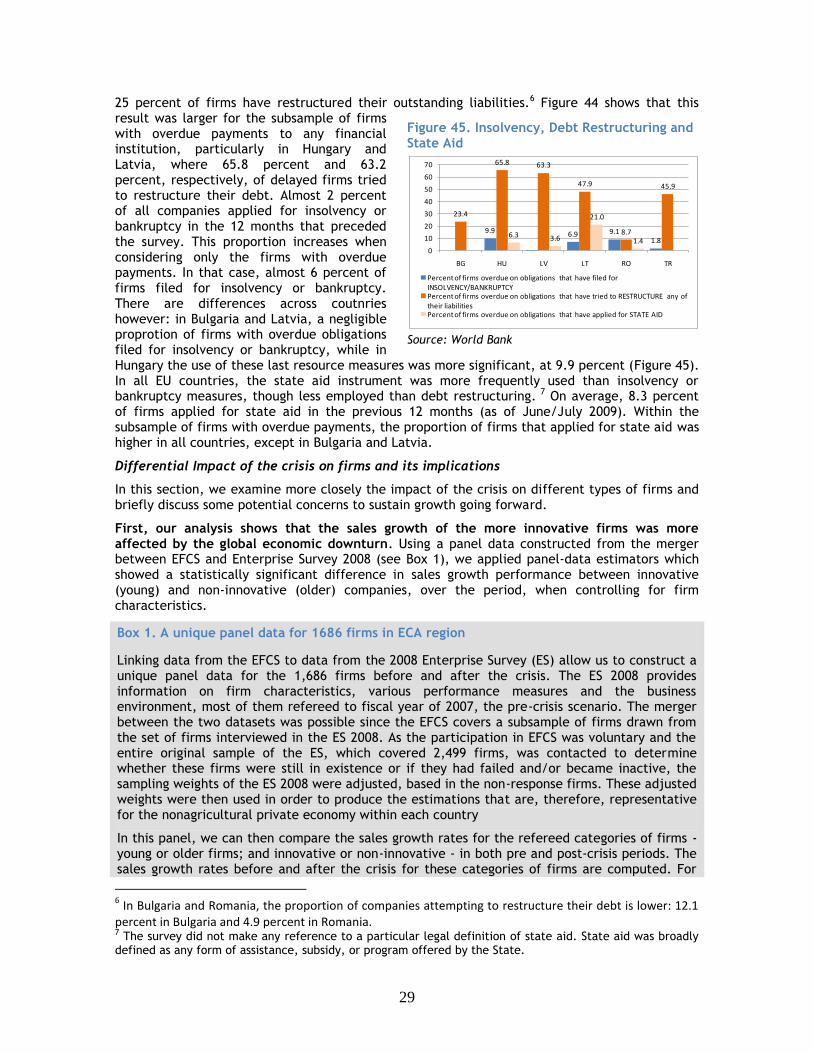
25 percent of firms have restructured their outstanding liabilities.6 Figure 44 shows that this result was larger for the subsample of firms with overdue payments to any financial institution, particularly in Hungary and Latvia, where 65.8 percent and 63.2 percent, respectively, of delayed firms tried to restructure their debt. Almost 2 percent of all companies applied for insolvency or bankruptcy in the 12 months that preceded the survey. This proportion increases when considering only the firms with overdue payments. In that case, almost 6 percent of firms filed for insolvency or bankruptcy. There are differences across coutnries however: in Bulgaria and Latvia, a negligible proprotion of firms with overdue obligations filed for insolvency or bankruptcy, while in Hungary the use of these last resource measures was more significant, at 9.9 percent (Figure 45). In all EU countries, the state aid instrument was more frequently used than insolvency or bankruptcy measures, though less employed than debt restructuring. 7 On average, 8.3 percent of firms applied for state aid in the previous 12 months (as of June/July 2009). Within the subsample of firms with overdue payments, the proportion of firms that applied for state aid was higher in all countries, except in Bulgaria and Latvia.
Differential Impact of the crisis on firms and its implications
In this section, we examine more closely the impact of the crisis on different types of firms and briefly discuss some potential concerns to sustain growth going forward.
First, our analysis shows that the sales growth of the more innovative firms was more affected by the global economic downturn. Using a panel data constructed from the merger between EFCS and Enterprise Survey 2008 (see Box 1), we applied panel-data estimators which showed a statistically significant difference in sales growth performance between innovative (young) and non-innovative (older) companies, over the period, when controlling for firm characteristics.
Box 1. A unique panel data for 1686 firms in ECA region
Linking data from the EFCS to data from the 2008 Enterprise Survey (ES) allow us to construct a unique panel data for the 1,686 firms before and after the crisis. The ES 2008 provides information on firm characteristics, various performance measures and the business environment, most of them refereed to fiscal year of 2007, the pre-crisis scenario. The merger between the two datasets was possible since the EFCS covers a subsample of firms drawn from the set of firms interviewed in the ES 2008. As the participation in EFCS was voluntary and the entire original sample of the ES, which covered 2,499 firms, was contacted to determine whether these firms were still in existence or if they had failed and/or became inactive, the sampling weights of the ES 2008 were adjusted, based in the non-response firms. These adjusted weights were then used in order to produce the estimations that are, therefore, representative for the nonagricultural private economy within each country
In this panel, we can then compare the sales growth rates for the refereed categories of firms - young or older firms; and innovative or non-innovative - in both pre and post-crisis periods. The sales growth rates before and after the crisis for these categories of firms are computed. For
6 In Bulgaria and Romania, the proportion of companies attempting to restructure their debt is lower: 12.1
percent in Bulgaria and 4.9 percent in Romania. 7 The survey did not make any reference to a particular legal definition of state aid. State aid was broadly defined as any form of assistance, subsidy, or program offered by the State.
Figure 45. Insolvency, Debt Restructuring and State Aid
Source: World Bank
9.9 6.9 9.11.8
23.4
65.8 63.3
47.9
8.7
45.9
6.3 3.6
21.0
1.4
0
10
20
30
40
50
60
70
BG HU LV LT RO TR
Percent of firms overdue on obligations that have filed for INSOLVENCY/BANKRUPTCY Percent of firms overdue on obligations that have tried to RESTRUCTURE any of their liabilitiesPercent of firms overdue on obligations that have applied for STATE AID
30
the pre-crisis period, we computed the compound average annual growth rate of sales in the 2004-2007. In this case, we previously converted sales values of 2004 and 2007 (based on ES 2008 data) from original local currencies to current US dollars using exchange rate from International Financial Statistics Database. For the post crisis period, we use annual growth rate of sales in the 2008-2009 period, according to EFCS.
The age classification was made through a dummy for firms up to five years old, while the identification of an innovative company used as a criterion the introduction of new product or process in the period 2004-2007, according to ES 2008. Data show that for all of the six countries covered by the EFCS innovative firms account for an expressive proportion of total firms, while young firms make the smallest groups. The average proportion of innovative companies of these countries was estimated in 49 percent, while young companies accounted for only 8 percent, on average, of the total firms.
In particular, the panel data analysis showed that when comparing the pre and post crisis periods and controlling for firm-specific characteristics (as age, innovation status, size, export orientation, use of skilled workforce, country and sector), the sales growth performance of innovative companies decreased 16 percentage points more than non-innovative companies.8 The results were statistically significant at 5% level. In order to examine if these results are robust to the way innovative firms are classified, the panel data analysis was repeated using the development of R&D activities in the 2004-2007 as an alternative criterion to categorize innovative firms. The results were confirmed. The sales growth performance of companies with R&D activities has decreased 25 percentage points more than firms without R&D activities.9 This difference was statistically significant at 1% level.
Since innovation and R&D tend to positively affect productivity (Aw, Roberts and Xu (2008)10) innovative firms tend to lead growth. (The link between findings from firm-level studies of innovation and theories of aggregate technological change and growth can be found in Klette and Kortum (2004)). Thus the fact that these firms have been disproportionately affected is of some concern
Second, the analysis also finds that young companies suffered significantly more than older firms. Evidence from the same panel data analysis also showed that when differences in age, innovation status, size, export orientation, use of skilled workforce, country and sector are taken into account, the reduction of sales growth performance of young firms was 20 percentage points larger than older firms over time. This result was statistically significant at 1% level.11 Since in general, conditional on size and survival rate, young firms are expected to grow at faster rate than older firms, among other reasons due to diminishing returns from learning (see Klepper and Thompson (2007)12; Dunne, Roberts and Samuelson (1989)13), young firms can play an important role in exerting competitive pressures that are conducive to productivity growth. Conversely, a prematurely ―aging‖ enterprise sector could reduce productivity growth.
8 The FGLS estimator provided a difference of 16.31 percentage points, while through the pooled FGLS estimator the difference was estimated in 15.97 percentage points. The results of these econometric analyses are available upon request. 9 The within pooled FGLS estimator provided a difference of 25 percentage points. The results of these econometric analyses are available upon request. 10 Aw, Bee Y., Mark J. Roberts and Daniel Y. Xu (2008), ―R&D Investments, Exporting and the Evolution of Firm Productivity,‖ American Economic Review, Papers and Proceedings, 98:2, pp. 451-456 11 The FGLS estimator provided a difference of 20.67 percentage points, while through the pooled FGLS estimator the difference was estimated at 17.52 percentage points (and statistically significant at 10% level). The results of these econometric analyses are available upon request. 12 Klepper, S., & Thompson, P. (2007). Submarkets and the evolution of market structure. RAND Journal of Economics 34(4): 862-888 13 Dunne, Timothy, Roberts, Mark. J, and Larry, Samuelson, (1989). "The Growth and Failure of U.S. Manufacturing Plants," The Quarterly Journal of Economics, MIT Press, vol. 104(4): 671-98
31
Third, the more skill intensive firms were more affected—with their employment falling more significantly than those of the less skill intensive firms. Data from EFCS show that full-time employment of skill-intensive enterprises (firms employing more than 20 percent of workers with university degrees) fell in all countries during the crisis, except in Hungary. The average skilled intensive firm showed a reduction of 2 permanent workers when comparing June/July 2009 with December 2007. Turkey experienced the largest average drop in permanent workers, 8.9 workers in the same period. Going forward, should there be persistent (long duration) unemployment of highly skilled workers, this could lead to a deterioration in the human capital base of countries.
Another obstacle for achieving and sustaining higher rates of economic growth relates to an emerging re-specialization towards services and domestic-oriented activities. Productivity gains in service sectors, driven among other factors by the diffusion of information and communication technologies, were one of the major determinants of productivity growth in the US in past decades. In many countries in Europe, however, services sectors productivity gains have lagged behind in comparison to those of the industrial sector. Export-orientated firms also tend to present higher productivity growth than domestic oriented ones, when size, age and skills are controlled for. While is still early to identify a new pattern of economic specialization in the surveyed economies, preliminary results indicates that a likely expansion of domestic oriented firms and firms from the service sector. For instance, data from EFCS show that, among firms reporting sales increase in Turkey, almost 66 percent belonged to the food, textiles, or chemical sectors and were mainly domestic oriented.14 In Bulgaria, on the other hand, more than 50 percent of firms that reported a demand growth were in wholesale and retail activities. The same phenomenon happened in the other four countries, where most of the growing firms were clustered in the retail (10.9 percent) and wholesale (34.9 percent) sectors.
These findings suggest that as the recovery takes hold and demand strengthens, it will be very important to address any obstacles—including for example access to finance—to the resumption of entry and growth of the more innovative and skill intensive firms. As was stressed in EU10 Regular Economic Report from October 2009, sustained growth in the region will need to increasingly rely on the knowledge economy and will require improving the skills of workforce and ensuring that these skills are productively employed.
14 In Turkey, the shares of sales directed to the domestic market in the chemicals, food and textiles sectors were 81.6 percent, 74.5 percent, 47.6 percent, respectively.
32
The latest Europe and Central Asia (ECA) energy outlook suggests a shortage of both primary and derivative energy supplies if the current policy environment is not changed. 15 Unless ECA countries start to invest much more in energy in coming years, by 2030 the region as a whole will become a net energy importer in contrast to its current role as an exporter. Western Europe is heavily dependent on energy imports from this region, but with the financial capacity to secure the energy supplies it needs (albeit at the expense of others). In contrast, the region’s energy-importing countries are caught between Western Europe, which has increasing import needs, and the region’s exporters, whose exports will likely decline. Energy-importing countries in ECA face the prospect of being squeezed both financially and in terms of energy access. These developments will have significant implications for the EU10 and Croatia. In order to avoid shortages in primary energy supplies (mainly gas), they could increase reliance on coal, which is locally available but more polluting, but such a shift would be in conflict with the EU fight against climate change. Or they may want to postpone shutting down aging nuclear reactors. In this light, the EU climate change and energy policies constitute huge challenges for some of the EU10. The best option for these countries is to focus on energy efficiency, which, despite dramatic improvements over the last two decades, has not yet reached EU15 levels.
Wider regional and European context
The ECA region has 15 percent of the world’s primary energy production and substantial energy assets concentrated in a few countries (about 9 percent of world oil reserves and 31 percent of conventional gas reserves). Russia alone accounts for about 10 percent of world primary energy production, 4.5 percent of oil reserves, and 27 percent of gas reserves. Azerbaijan, Kazakhstan (rich in oil), Turkmenistan and Uzbekistan (rich in gas) are also big producers. Coal resources are more evenly distributed with Russia, Ukraine, Kazakhstan, Poland, Czech Republic, Turkey, Serbia and Kosovo having substantial production and/or reserves. The coal quality ranges from high quality thermal and coking coal in Russia to low quality lignite and brown coal in Southeast Europe. Mining conditions also vary from lower cost surface mining in Russia and Central Asia to higher cost underground mining in Central Europe.
The latest ECA energy outlook16, covering Central and Eastern Europe and the Commonwealth of Independent States (CIS) suggests a shortfall in its primary and derivative energy supplies over the next 20 to 25 years. The region has been underinvesting in the sector for years, as maintenance and upgrading of the stock of energy assets became an early investment casualty of the economic decline associated with transition. As the region’s economy recovered, both production and consumption of energy increased. However, the deterioration in the asset base and the associated loss of both capacity and efficiency proved such that by the end of 2007, a number of countries in the region were experiencing periodic energy shortages, and a serious energy crunch appeared imminent. The global financial crisis has dampened energy demand significantly, creating temporary breathing room before energy availability again becomes a serious concern. However, the respite is temporary some 5 to 6 years as it is assumed that the region as a whole will recover to the 2008 level of output by 2013. From 2011, ECA is expected to resume its long term growth rate of almost 5 percent per year, which will translate into 4.4 percent average annual growth for the period 2005-2030 (Table 4). The very recent upturn in energy investments falls short of what will be needed, and given the long lead times
15 This note was written by Leszek Kasek, based on the ECA Energy Flagship, under the guidance of Peter Thomson and the World Bank ECA Energy team. 16 World Bank, Lights Out? Challenges Facing the Emerging Economies of Eastern Europe and the Former Soviet Union, Washington D.C.
EU10 April 2010
In Focus: Insights for the EU10 and Croatia from the Europe and Central Asia energy outlook 2030
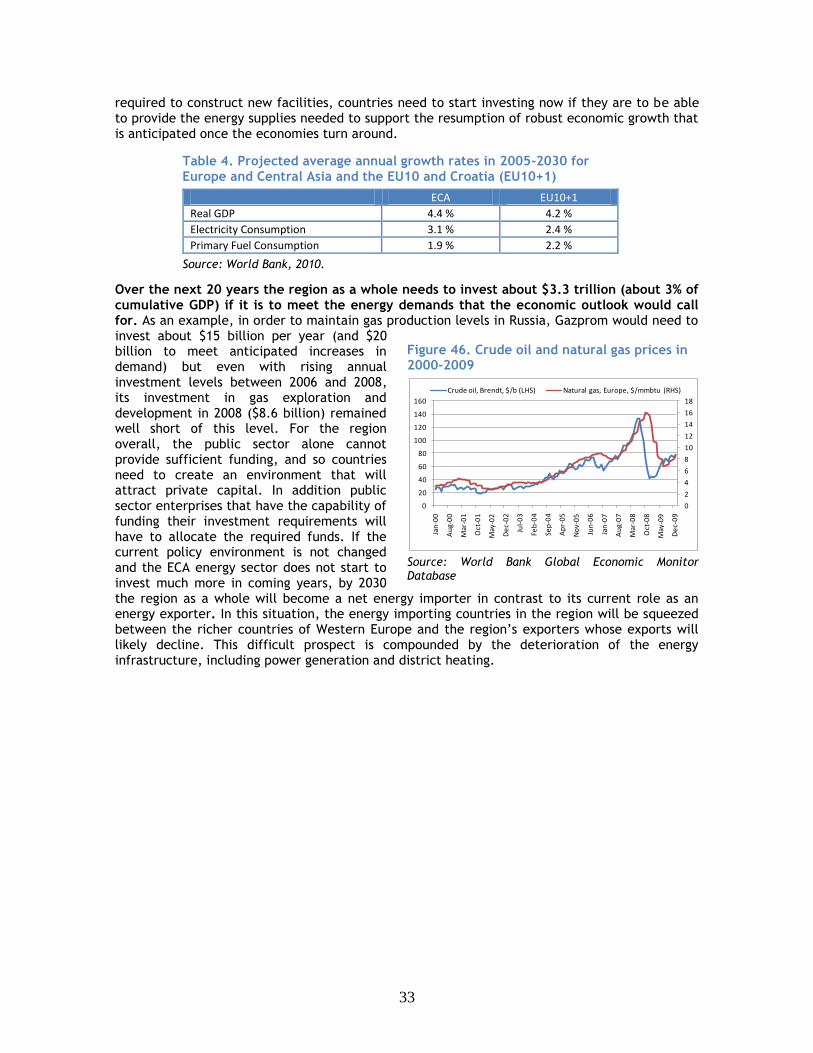
33
required to construct new facilities, countries need to start investing now if they are to be able to provide the energy supplies needed to support the resumption of robust economic growth that is anticipated once the economies turn around.
Table 4. Projected average annual growth rates in 2005-2030 for Europe and Central Asia and the EU10 and Croatia (EU10+1)
ECA EU10+1
Real GDP 4.4 % 4.2 %
Electricity Consumption 3.1 % 2.4 %
Primary Fuel Consumption 1.9 % 2.2 %
Source: World Bank, 2010.
Over the next 20 years the region as a whole needs to invest about $3.3 trillion (about 3% of cumulative GDP) if it is to meet the energy demands that the economic outlook would call for. As an example, in order to maintain gas production levels in Russia, Gazprom would need to invest about $15 billion per year (and $20 billion to meet anticipated increases in demand) but even with rising annual investment levels between 2006 and 2008, its investment in gas exploration and development in 2008 ($8.6 billion) remained well short of this level. For the region overall, the public sector alone cannot provide sufficient funding, and so countries need to create an environment that will attract private capital. In addition public sector enterprises that have the capability of funding their investment requirements will have to allocate the required funds. If the current policy environment is not changed and the ECA energy sector does not start to invest much more in coming years, by 2030 the region as a whole will become a net energy importer in contrast to its current role as an energy exporter. In this situation, the energy importing countries in the region will be squeezed between the richer countries of Western Europe and the region’s exporters whose exports will likely decline. This difficult prospect is compounded by the deterioration of the energy infrastructure, including power generation and district heating.
Figure 46. Crude oil and natural gas prices in 2000-2009
Source: World Bank Global Economic Monitor Database
0
2
4
6
8
10
12
14
16
18
0
20
40
60
80
100
120
140
160
Jan
-00
Au
g-0
0
Mar
-01
Oct
-01
May
-02
De
c-0
2
Jul-
03
Feb
-04
Sep
-04
Ap
r-0
5
No
v-0
5
Jun
-06
Jan
-07
Au
g-0
7
Mar
-08
Oct
-08
May
-09
De
c-0
9
Crude oil, Brendt, $/b (LHS) Natural gas, Europe, $/mmbtu (RHS)
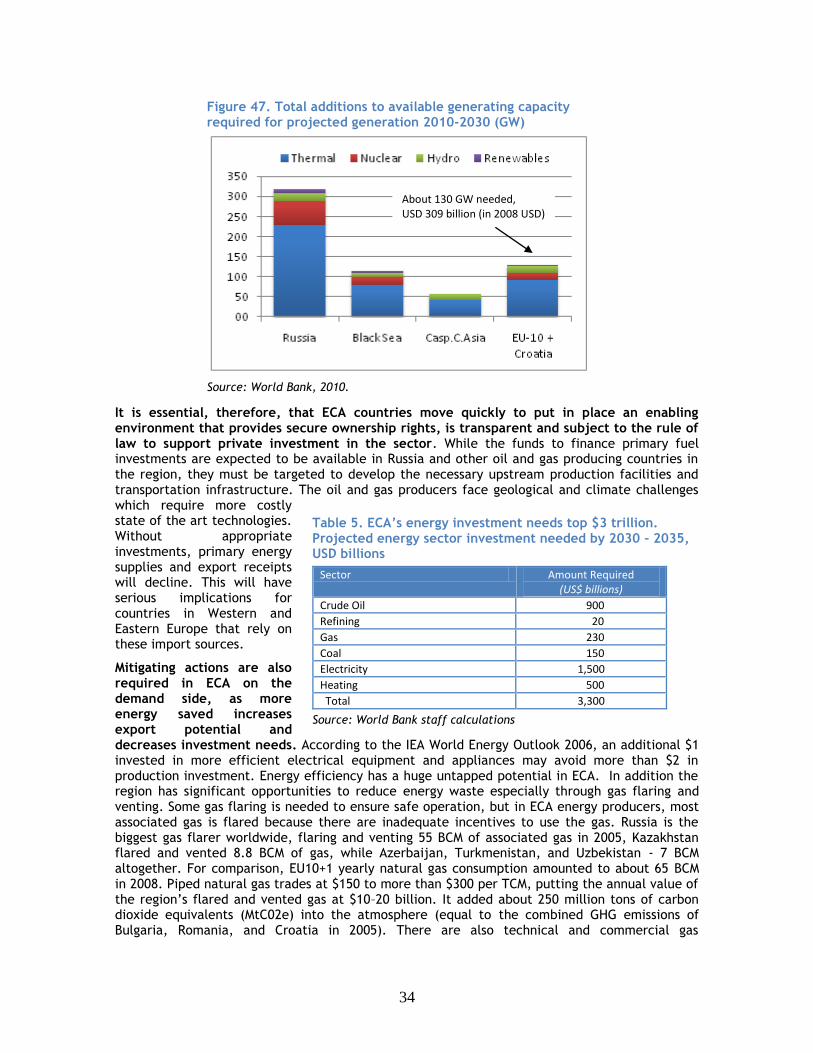
34
Figure 47. Total additions to available generating capacity required for projected generation 2010-2030 (GW)
Source: World Bank, 2010.
It is essential, therefore, that ECA countries move quickly to put in place an enabling environment that provides secure ownership rights, is transparent and subject to the rule of law to support private investment in the sector. While the funds to finance primary fuel investments are expected to be available in Russia and other oil and gas producing countries in the region, they must be targeted to develop the necessary upstream production facilities and transportation infrastructure. The oil and gas producers face geological and climate challenges which require more costly state of the art technologies. Without appropriate investments, primary energy supplies and export receipts will decline. This will have serious implications for countries in Western and Eastern Europe that rely on these import sources.
Mitigating actions are also required in ECA on the demand side, as more energy saved increases export potential and decreases investment needs. According to the IEA World Energy Outlook 2006, an additional $1 invested in more efficient electrical equipment and appliances may avoid more than $2 in production investment. Energy efficiency has a huge untapped potential in ECA. In addition the region has significant opportunities to reduce energy waste especially through gas flaring and venting. Some gas flaring is needed to ensure safe operation, but in ECA energy producers, most associated gas is flared because there are inadequate incentives to use the gas. Russia is the biggest gas flarer worldwide, flaring and venting 55 BCM of associated gas in 2005, Kazakhstan flared and vented 8.8 BCM of gas, while Azerbaijan, Turkmenistan, and Uzbekistan - 7 BCM altogether. For comparison, EU10+1 yearly natural gas consumption amounted to about 65 BCM in 2008. Piped natural gas trades at $150 to more than $300 per TCM, putting the annual value of the region’s flared and vented gas at $10–20 billion. It added about 250 million tons of carbon dioxide equivalents (MtC02e) into the atmosphere (equal to the combined GHG emissions of Bulgaria, Romania, and Croatia in 2005). There are also technical and commercial gas
Table 5. ECA’s energy investment needs top $3 trillion. Projected energy sector investment needed by 2030 – 2035, USD billions
Sector Amount Required (US$ billions)
Crude Oil 900
Refining 20
Gas 230
Coal 150
Electricity 1,500
Heating 500
Total 3,300
Source: World Bank staff calculations
About 130 GW needed, USD 309 billion (in 2008 USD)
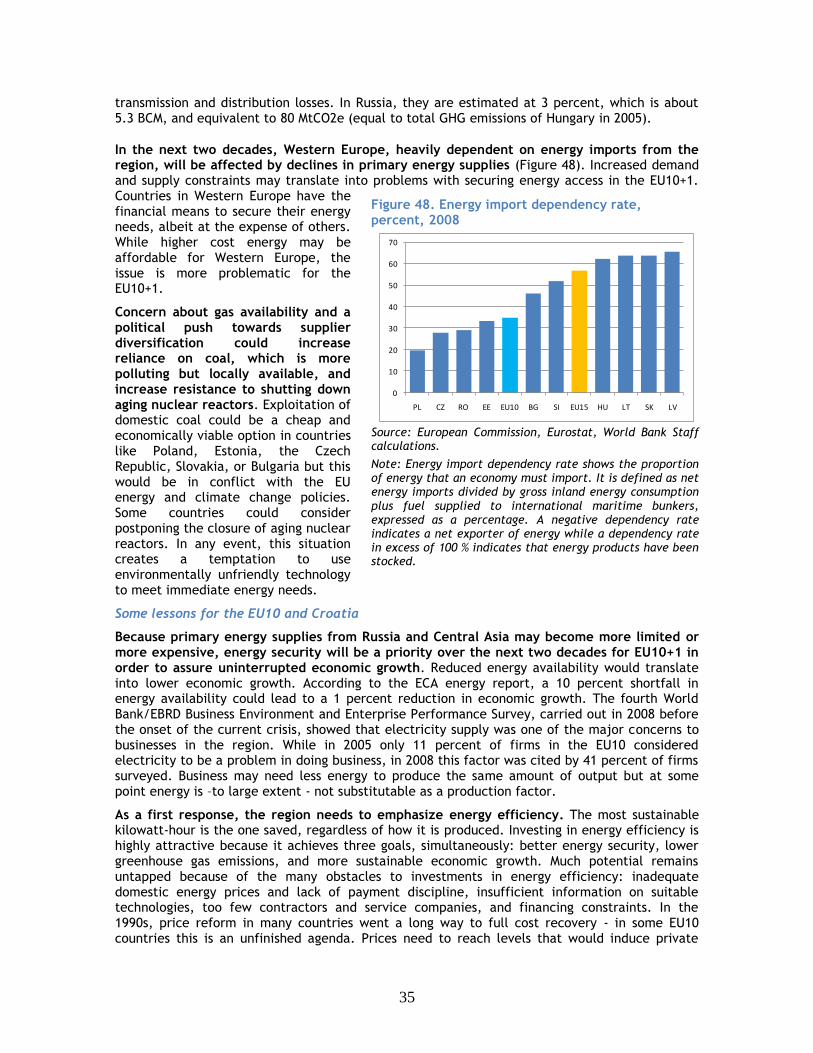
35
transmission and distribution losses. In Russia, they are estimated at 3 percent, which is about 5.3 BCM, and equivalent to 80 MtCO2e (equal to total GHG emissions of Hungary in 2005).
In the next two decades, Western Europe, heavily dependent on energy imports from the region, will be affected by declines in primary energy supplies (Figure 48). Increased demand and supply constraints may translate into problems with securing energy access in the EU10+1. Countries in Western Europe have the financial means to secure their energy needs, albeit at the expense of others. While higher cost energy may be affordable for Western Europe, the issue is more problematic for the EU10+1.
Concern about gas availability and a political push towards supplier diversification could increase reliance on coal, which is more polluting but locally available, and increase resistance to shutting down aging nuclear reactors. Exploitation of domestic coal could be a cheap and economically viable option in countries like Poland, Estonia, the Czech Republic, Slovakia, or Bulgaria but this would be in conflict with the EU energy and climate change policies. Some countries could consider postponing the closure of aging nuclear reactors. In any event, this situation creates a temptation to use environmentally unfriendly technology to meet immediate energy needs.
Some lessons for the EU10 and Croatia
Because primary energy supplies from Russia and Central Asia may become more limited or more expensive, energy security will be a priority over the next two decades for EU10+1 in order to assure uninterrupted economic growth. Reduced energy availability would translate into lower economic growth. According to the ECA energy report, a 10 percent shortfall in energy availability could lead to a 1 percent reduction in economic growth. The fourth World Bank/EBRD Business Environment and Enterprise Performance Survey, carried out in 2008 before the onset of the current crisis, showed that electricity supply was one of the major concerns to businesses in the region. While in 2005 only 11 percent of firms in the EU10 considered electricity to be a problem in doing business, in 2008 this factor was cited by 41 percent of firms surveyed. Business may need less energy to produce the same amount of output but at some point energy is –to large extent - not substitutable as a production factor.
As a first response, the region needs to emphasize energy efficiency. The most sustainable kilowatt-hour is the one saved, regardless of how it is produced. Investing in energy efficiency is highly attractive because it achieves three goals, simultaneously: better energy security, lower greenhouse gas emissions, and more sustainable economic growth. Much potential remains untapped because of the many obstacles to investments in energy efficiency: inadequate domestic energy prices and lack of payment discipline, insufficient information on suitable technologies, too few contractors and service companies, and financing constraints. In the 1990s, price reform in many countries went a long way to full cost recovery - in some EU10 countries this is an unfinished agenda. Prices need to reach levels that would induce private
Figure 48. Energy import dependency rate, percent, 2008
Source: European Commission, Eurostat, World Bank Staff calculations.
Note: Energy import dependency rate shows the proportion of energy that an economy must import. It is defined as net energy imports divided by gross inland energy consumption plus fuel supplied to international maritime bunkers, expressed as a percentage. A negative dependency rate indicates a net exporter of energy while a dependency rate in excess of 100 % indicates that energy products have been stocked.
0
10
20
30
40
50
60
70
PL CZ RO EE EU10 BG SI EU15 HU LT SK LV
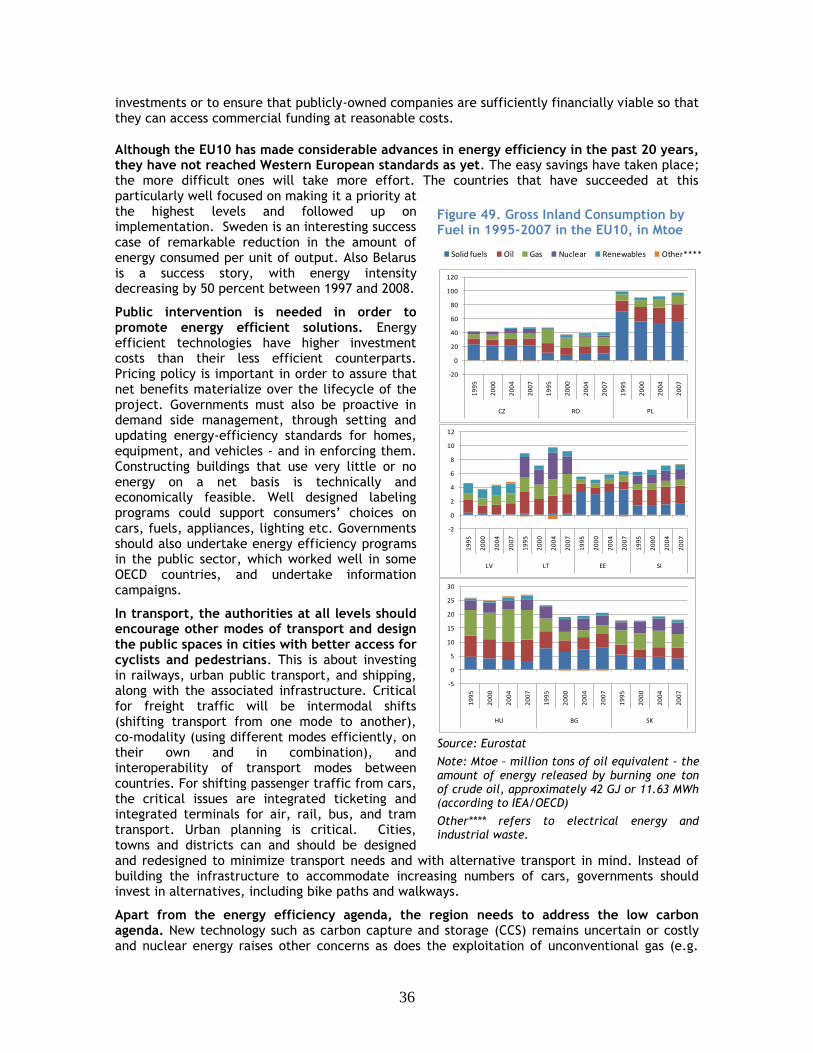
36
investments or to ensure that publicly-owned companies are sufficiently financially viable so that they can access commercial funding at reasonable costs.
Although the EU10 has made considerable advances in energy efficiency in the past 20 years, they have not reached Western European standards as yet. The easy savings have taken place; the more difficult ones will take more effort. The countries that have succeeded at this particularly well focused on making it a priority at the highest levels and followed up on implementation. Sweden is an interesting success case of remarkable reduction in the amount of energy consumed per unit of output. Also Belarus is a success story, with energy intensity decreasing by 50 percent between 1997 and 2008.
Public intervention is needed in order to promote energy efficient solutions. Energy efficient technologies have higher investment costs than their less efficient counterparts. Pricing policy is important in order to assure that net benefits materialize over the lifecycle of the project. Governments must also be proactive in demand side management, through setting and updating energy-efficiency standards for homes, equipment, and vehicles - and in enforcing them. Constructing buildings that use very little or no energy on a net basis is technically and economically feasible. Well designed labeling programs could support consumers’ choices on cars, fuels, appliances, lighting etc. Governments should also undertake energy efficiency programs in the public sector, which worked well in some OECD countries, and undertake information campaigns.
In transport, the authorities at all levels should encourage other modes of transport and design the public spaces in cities with better access for cyclists and pedestrians. This is about investing in railways, urban public transport, and shipping, along with the associated infrastructure. Critical for freight traffic will be intermodal shifts (shifting transport from one mode to another), co-modality (using different modes efficiently, on their own and in combination), and interoperability of transport modes between countries. For shifting passenger traffic from cars, the critical issues are integrated ticketing and integrated terminals for air, rail, bus, and tram transport. Urban planning is critical. Cities, towns and districts can and should be designed and redesigned to minimize transport needs and with alternative transport in mind. Instead of building the infrastructure to accommodate increasing numbers of cars, governments should invest in alternatives, including bike paths and walkways.
Apart from the energy efficiency agenda, the region needs to address the low carbon agenda. New technology such as carbon capture and storage (CCS) remains uncertain or costly and nuclear energy raises other concerns as does the exploitation of unconventional gas (e.g.
Figure 49. Gross Inland Consumption by Fuel in 1995-2007 in the EU10, in Mtoe
Source: Eurostat
Note: Mtoe – million tons of oil equivalent - the amount of energy released by burning one ton of crude oil, approximately 42 GJ or 11.63 MWh (according to IEA/OECD)
Other**** refers to electrical energy and industrial waste.
-200
20406080
100120
19
95
20
00
20
04
20
07
19
95
20
00
20
04
20
07
19
95
20
00
20
04
20
07
CZ RO PL
Solid fuels Oil Gas Nuclear Renewables Other****
-20
0
20
40
60
80
100
120
19
95
20
00
20
04
20
07
19
95
20
00
20
04
20
07
19
95
20
00
20
04
20
07
CZ RO PL
-2
0
2
4
6
8
10
12
19
95
20
00
20
04
20
07
19
95
20
00
20
04
20
07
19
95
20
00
20
04
20
07
19
95
20
00
20
04
20
07
LV LT EE SI
-5
0
5
10
15
20
25
30
19
95
20
00
20
04
20
07
19
95
20
00
20
04
20
07
19
95
20
00
20
04
20
07
HU BG SK

37
shale gas).Renewable energy sources (RES), however, do have potential to replace conventional energy sources gradually, especially if the cost of these renewable energy sources declines. In any event, the EU10 will have to put a much greater emphasis on the use of RES in order to comply with their country-specific 2020 targets.
CCS, although still an emerging technology, is being promoted by the EU. One of the elements of the final EU energy and climate change package - the directive on geological storage of CO2 - provides a legal framework to manage possible environmental risks and liability issues. Up to 300 million allowances in the ―New Entrant Reserve‖ under the EU Emissions Trading Scheme (EU ETS) will be made available to stimulate the construction and operation of up to 12 commercial demonstration projects by 2015. Moreover, the CCS demonstration constructions were also supported by EUR1,050 million from the European Economic Recovery Package, adopted in late 2008. Based on the EU regulations, new large power plants with an output of more than 300 Megawatts need to be CCS-ready from 2015 onwards. In such circumstances, new market opportunities will arise for early adopters of implementable new technologies.
Nuclear energy is becoming more popular in several EU10 countries. There are existing nuclear facilities in 7 of the EU10 (but not in Estonia, Latvia, and Poland). New nuclear generation is expected to increase substantially. Some projects under consideration may involve a consortium of countries (Poland and Latvia as investors in Lithuania as the host country and operator), as well as single country investors (Poland).
Against this backdrop, the EU climate change and energy policies constitute a huge challenge for some of the EU10, although the final political compromise of December 2008 introduced derogations and transitions options available for the EU10. The EU targets are ambitious, requiring stringent measures from individual members. In order to comply with the EU targets and EU ETS implementation agenda, the EU countries will have to undertake huge incremental investments, in particular in the energy sector, on top of already high investment required to meet growing demand. These efforts will have a major impact on economic performance of the EU10 over the next decades17. Transition to a low carbon economy can be costly. The economic and fiscal impact will depend fundamentally on how the additional investments required are to be financed (public versus private, enterprise versus consumer, domestic versus foreign, debt versus (EU) grants).
The EU package extends and deepens the EU commitments to greenhouse gas emission reduction contained in the Kyoto Protocol, which came into force in 2005. The Kyoto targets are being exceeded by most of the EU10 with a large margin and they can sell a part of the excess (―assigned amount units‖) through carbon trading markets. However, the EU targets are more ambitious than Kyoto targets and will require more efforts, sectoral adjustments, and resources from EU members to achieve. In contrast to Kyoto targets, there are no overall country targets. Instead, the Emissions Trading System sets EU targets for energy-intensive sectors, and country-specific targets are set for sectors not covered by the EU ETS. – see Table 6. The ETS sectors generate around 40 percent of the EU-wide CO2 emissions while the remaining 60 percent come from the non-ETS sectors.
17 For Poland, these effects will be analyzed using macroeconomic modeling tools in the forthcoming Country Economic Memorandum: A Low Carbon Growth Path for Poland.
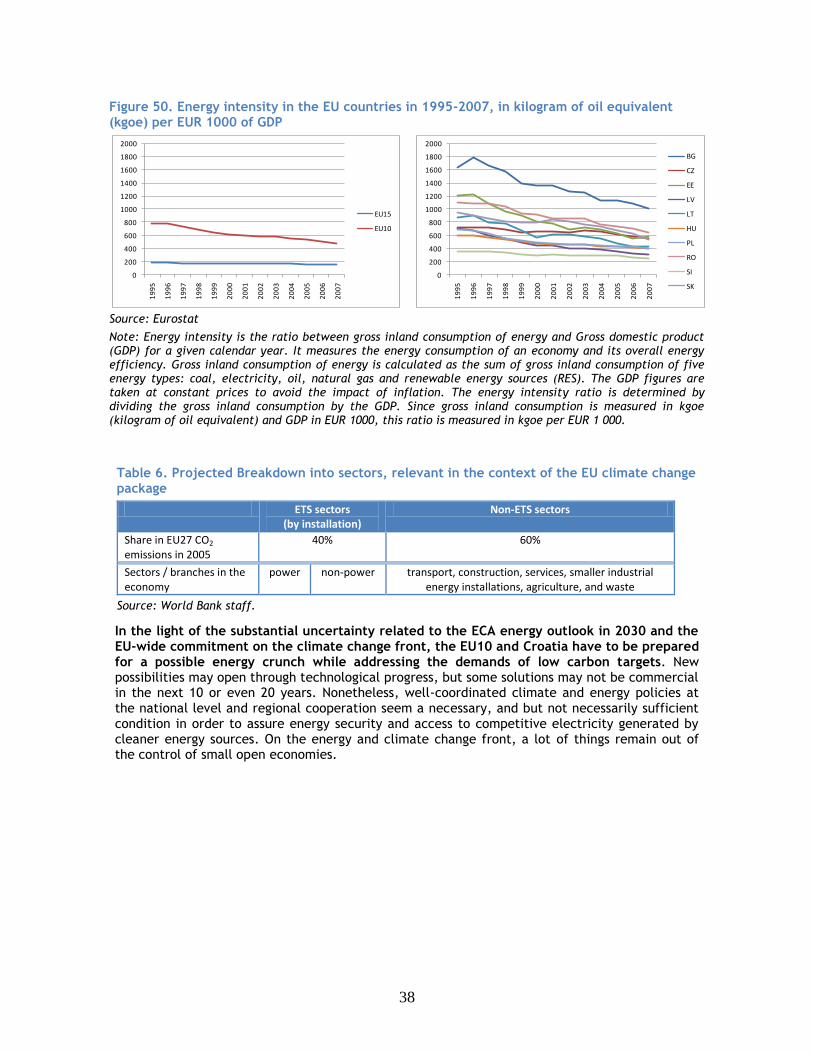
38
Figure 50. Energy intensity in the EU countries in 1995-2007, in kilogram of oil equivalent (kgoe) per EUR 1000 of GDP
Source: Eurostat
Note: Energy intensity is the ratio between gross inland consumption of energy and Gross domestic product (GDP) for a given calendar year. It measures the energy consumption of an economy and its overall energy efficiency. Gross inland consumption of energy is calculated as the sum of gross inland consumption of five energy types: coal, electricity, oil, natural gas and renewable energy sources (RES). The GDP figures are taken at constant prices to avoid the impact of inflation. The energy intensity ratio is determined by dividing the gross inland consumption by the GDP. Since gross inland consumption is measured in kgoe (kilogram of oil equivalent) and GDP in EUR 1000, this ratio is measured in kgoe per EUR 1 000.
Table 6. Projected Breakdown into sectors, relevant in the context of the EU climate change package
ETS sectors (by installation)
Non-ETS sectors
Share in EU27 CO2 emissions in 2005
40% 60%
Sectors / branches in the economy
power non-power transport, construction, services, smaller industrial energy installations, agriculture, and waste
Source: World Bank staff.
In the light of the substantial uncertainty related to the ECA energy outlook in 2030 and the EU-wide commitment on the climate change front, the EU10 and Croatia have to be prepared for a possible energy crunch while addressing the demands of low carbon targets. New possibilities may open through technological progress, but some solutions may not be commercial in the next 10 or even 20 years. Nonetheless, well-coordinated climate and energy policies at the national level and regional cooperation seem a necessary, and but not necessarily sufficient condition in order to assure energy security and access to competitive electricity generated by cleaner energy sources. On the energy and climate change front, a lot of things remain out of the control of small open economies.
0
200
400
600
800
1000
1200
1400
1600
1800
20001
99
5
19
96
19
97
19
98
19
99
20
00
20
01
20
02
20
03
20
04
20
05
20
06
20
07
EU15
EU10
0
200
400
600
800
1000
1200
1400
1600
1800
2000
19
95
19
96
19
97
19
98
19
99
20
00
20
01
20
02
20
03
20
04
20
05
20
06
20
07
BG
CZ
EE
LV
LT
HU
PL
RO
SI
SK
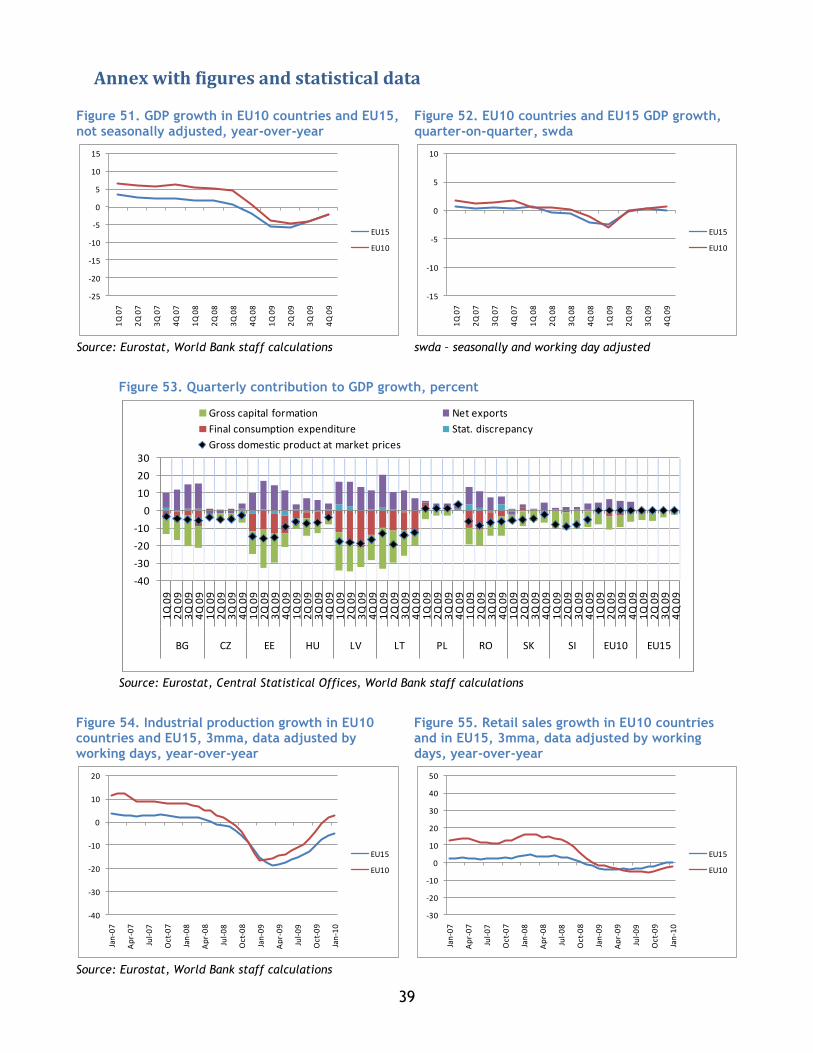
39
Annex with figures and statistical data
Figure 51. GDP growth in EU10 countries and EU15, not seasonally adjusted, year-over-year
Figure 52. EU10 countries and EU15 GDP growth, quarter-on-quarter, swda
Source: Eurostat, World Bank staff calculations swda – seasonally and working day adjusted
Figure 53. Quarterly contribution to GDP growth, percent
Source: Eurostat, Central Statistical Offices, World Bank staff calculations
Figure 54. Industrial production growth in EU10 countries and EU15, 3mma, data adjusted by working days, year-over-year
Figure 55. Retail sales growth in EU10 countries and in EU15, 3mma, data adjusted by working days, year-over-year
Source: Eurostat, World Bank staff calculations
-25
-20
-15
-10
-5
0
5
10
15
1Q
07
2Q
07
3Q
07
4Q
07
1Q
08
2Q
08
3Q
08
4Q
08
1Q
09
2Q
09
3Q
09
4Q
09
EU15
EU10
-15
-10
-5
0
5
10
1Q
07
2Q
07
3Q
07
4Q
07
1Q
08
2Q
08
3Q
08
4Q
08
1Q
09
2Q
09
3Q
09
4Q
09
EU15
EU10
-40
-30
-20
-10
0
10
20
30
1Q
09
2Q
09
3Q
09
4Q
09
1Q
09
2Q
09
3Q
09
4Q
09
1Q
09
2Q
09
3Q
09
4Q
09
1Q
09
2Q
09
3Q
09
4Q
09
1Q
09
2Q
09
3Q
09
4Q
09
1Q
09
2Q
09
3Q
09
4Q
09
1Q
09
2Q
09
3Q
09
4Q
09
1Q
09
2Q
09
3Q
09
4Q
09
1Q
09
2Q
09
3Q
09
4Q
09
1Q
09
2Q
09
3Q
09
4Q
09
1Q
09
2Q
09
3Q
09
4Q
09
1Q
09
2Q
09
3Q
09
4Q
09
BG CZ EE HU LV LT PL RO SK SI EU10 EU15
Gross capital formation Net exports
Final consumption expenditure Stat. discrepancy
Gross domestic product at market prices
-40
-30
-20
-10
0
10
20
Jan
-07
Ap
r-0
7
Jul-
07
Oct
-07
Jan
-08
Ap
r-0
8
Jul-
08
Oct
-08
Jan
-09
Ap
r-0
9
Jul-
09
Oct
-09
Jan
-10
EU15
EU10
-30
-20
-10
0
10
20
30
40
50
Jan
-07
Ap
r-0
7
Jul-
07
Oct
-07
Jan
-08
Ap
r-0
8
Jul-
08
Oct
-08
Jan
-09
Ap
r-0
9
Jul-
09
Oct
-09
Jan
-10
EU15
EU10
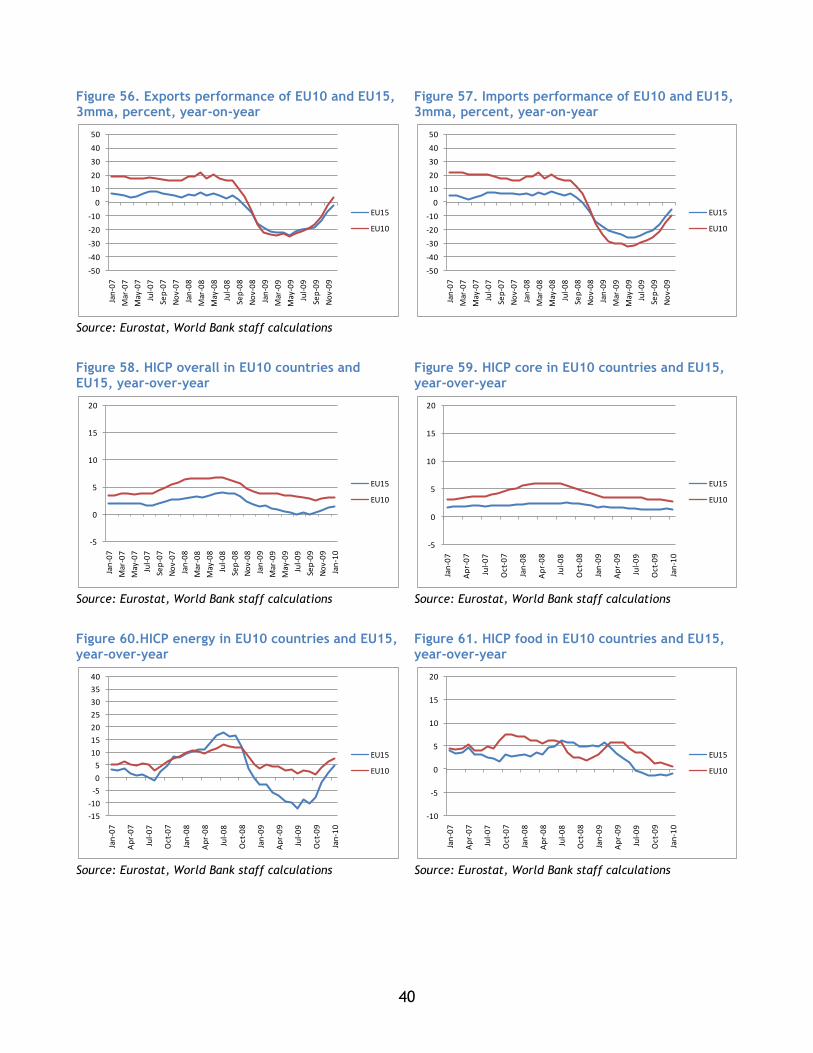
40
Figure 56. Exports performance of EU10 and EU15, 3mma, percent, year-on-year
Figure 57. Imports performance of EU10 and EU15, 3mma, percent, year-on-year
Source: Eurostat, World Bank staff calculations
Figure 58. HICP overall in EU10 countries and EU15, year-over-year
Figure 59. HICP core in EU10 countries and EU15, year-over-year
Source: Eurostat, World Bank staff calculations Source: Eurostat, World Bank staff calculations
Figure 60.HICP energy in EU10 countries and EU15, year-over-year
Figure 61. HICP food in EU10 countries and EU15, year-over-year
Source: Eurostat, World Bank staff calculations Source: Eurostat, World Bank staff calculations
-50
-40
-30
-20
-10
0
10
20
30
40
50
Jan
-07
Mar
-07
May
-07
Jul-
07
Sep
-07
No
v-0
7
Jan
-08
Mar
-08
May
-08
Jul-
08
Sep
-08
No
v-0
8
Jan
-09
Mar
-09
May
-09
Jul-
09
Sep
-09
No
v-0
9
EU15
EU10
-50
-40
-30
-20
-10
0
10
20
30
40
50
Jan
-07
Mar
-07
May
-07
Jul-
07
Sep
-07
No
v-0
7
Jan
-08
Mar
-08
May
-08
Jul-
08
Sep
-08
No
v-0
8
Jan
-09
Mar
-09
May
-09
Jul-
09
Sep
-09
No
v-0
9
EU15
EU10
-5
0
5
10
15
20
Jan
-07
Mar
-07
May
-07
Jul-
07
Sep
-07
No
v-0
7
Jan
-08
Mar
-08
May
-08
Jul-
08
Sep
-08
No
v-0
8
Jan
-09
Mar
-09
May
-09
Jul-
09
Sep
-09
No
v-0
9
Jan
-10
EU15
EU10
-5
0
5
10
15
20
Jan
-07
Ap
r-0
7
Jul-
07
Oct
-07
Jan
-08
Ap
r-0
8
Jul-
08
Oct
-08
Jan
-09
Ap
r-0
9
Jul-
09
Oct
-09
Jan
-10
EU15
EU10
-15
-10
-5
0
5
10
15
20
25
30
35
40
Jan
-07
Ap
r-0
7
Jul-
07
Oct
-07
Jan
-08
Ap
r-0
8
Jul-
08
Oct
-08
Jan
-09
Ap
r-0
9
Jul-
09
Oct
-09
Jan
-10
EU15
EU10
-10
-5
0
5
10
15
20
Jan
-07
Ap
r-0
7
Jul-
07
Oct
-07
Jan
-08
Ap
r-0
8
Jul-
08
Oct
-08
Jan
-09
Ap
r-0
9
Jul-
09
Oct
-09
Jan
-10
EU15
EU10
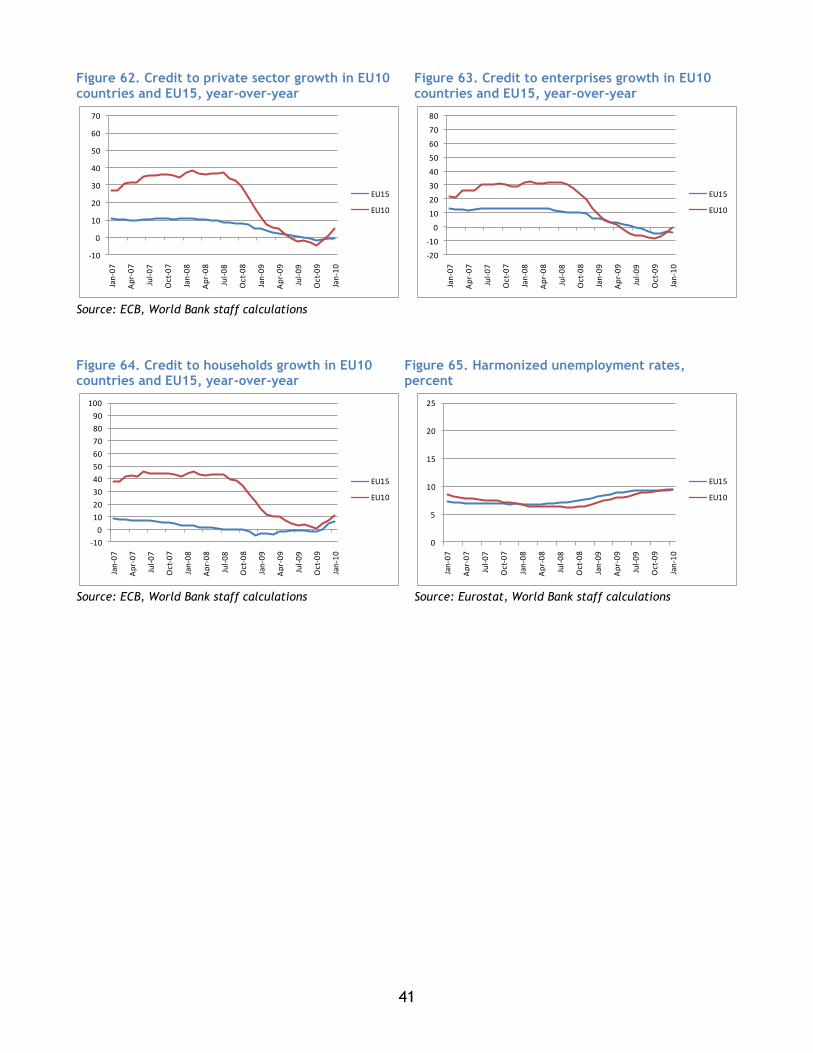
41
Figure 62. Credit to private sector growth in EU10 countries and EU15, year-over-year
Figure 63. Credit to enterprises growth in EU10 countries and EU15, year-over-year
Source: ECB, World Bank staff calculations
Figure 64. Credit to households growth in EU10 countries and EU15, year-over-year
Figure 65. Harmonized unemployment rates, percent
Source: ECB, World Bank staff calculations Source: Eurostat, World Bank staff calculations
-10
0
10
20
30
40
50
60
70Ja
n-0
7
Ap
r-0
7
Jul-
07
Oct
-07
Jan
-08
Ap
r-0
8
Jul-
08
Oct
-08
Jan
-09
Ap
r-0
9
Jul-
09
Oct
-09
Jan
-10
EU15
EU10
-20
-10
0
10
20
30
40
50
60
70
80
Jan
-07
Ap
r-0
7
Jul-
07
Oct
-07
Jan
-08
Ap
r-0
8
Jul-
08
Oct
-08
Jan
-09
Ap
r-0
9
Jul-
09
Oct
-09
Jan
-10
EU15
EU10
-10
0
10
20
30
40
50
60
70
80
90
100
Jan
-07
Ap
r-0
7
Jul-
07
Oct
-07
Jan
-08
Ap
r-0
8
Jul-
08
Oct
-08
Jan
-09
Ap
r-0
9
Jul-
09
Oct
-09
Jan
-10
EU15
EU10
0
5
10
15
20
25
Jan
-07
Ap
r-0
7
Jul-
07
Oct
-07
Jan
-08
Ap
r-0
8
Jul-
08
Oct
-08
Jan
-09
Ap
r-0
9
Jul-
09
Oct
-09
Jan
-10
EU15
EU10
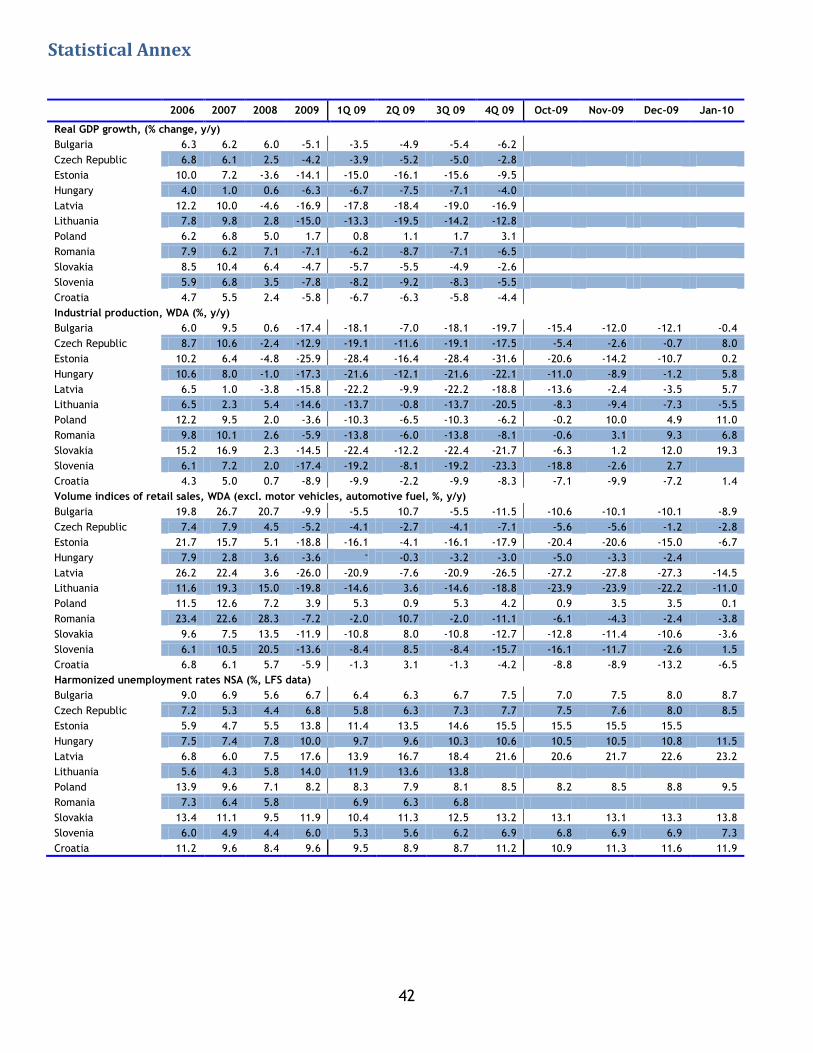
42
Statistical Annex
2006 2007 2008 2009 1Q 09 2Q 09 3Q 09 4Q 09 Oct-09 Nov-09 Dec-09 Jan-10
Real GDP growth, (% change, y/y)
Bulgaria 6.3 6.2 6.0 -5.1 -3.5 -4.9 -5.4 -6.2
Czech Republic 6.8 6.1 2.5 -4.2 -3.9 -5.2 -5.0 -2.8
Estonia 10.0 7.2 -3.6 -14.1 -15.0 -16.1 -15.6 -9.5
Hungary 4.0 1.0 0.6 -6.3 -6.7 -7.5 -7.1 -4.0
Latvia 12.2 10.0 -4.6 -16.9 -17.8 -18.4 -19.0 -16.9
Lithuania 7.8 9.8 2.8 -15.0 -13.3 -19.5 -14.2 -12.8
Poland 6.2 6.8 5.0 1.7 0.8 1.1 1.7 3.1
Romania 7.9 6.2 7.1 -7.1 -6.2 -8.7 -7.1 -6.5
Slovakia 8.5 10.4 6.4 -4.7 -5.7 -5.5 -4.9 -2.6
Slovenia 5.9 6.8 3.5 -7.8 -8.2 -9.2 -8.3 -5.5
Croatia 4.7 5.5 2.4 -5.8 -6.7 -6.3 -5.8 -4.4
Industrial production, WDA (%, y/y)
Bulgaria 6.0 9.5 0.6 -17.4 -18.1 -7.0 -18.1 -19.7 -15.4 -12.0 -12.1 -0.4
Czech Republic 8.7 10.6 -2.4 -12.9 -19.1 -11.6 -19.1 -17.5 -5.4 -2.6 -0.7 8.0
Estonia 10.2 6.4 -4.8 -25.9 -28.4 -16.4 -28.4 -31.6 -20.6 -14.2 -10.7 0.2
Hungary 10.6 8.0 -1.0 -17.3 -21.6 -12.1 -21.6 -22.1 -11.0 -8.9 -1.2 5.8
Latvia 6.5 1.0 -3.8 -15.8 -22.2 -9.9 -22.2 -18.8 -13.6 -2.4 -3.5 5.7
Lithuania 6.5 2.3 5.4 -14.6 -13.7 -0.8 -13.7 -20.5 -8.3 -9.4 -7.3 -5.5
Poland 12.2 9.5 2.0 -3.6 -10.3 -6.5 -10.3 -6.2 -0.2 10.0 4.9 11.0
Romania 9.8 10.1 2.6 -5.9 -13.8 -6.0 -13.8 -8.1 -0.6 3.1 9.3 6.8
Slovakia 15.2 16.9 2.3 -14.5 -22.4 -12.2 -22.4 -21.7 -6.3 1.2 12.0 19.3
Slovenia 6.1 7.2 2.0 -17.4 -19.2 -8.1 -19.2 -23.3 -18.8 -2.6 2.7
Croatia 4.3 5.0 0.7 -8.9 -9.9 -2.2 -9.9 -8.3 -7.1 -9.9 -7.2 1.4
Volume indices of retail sales, WDA (excl. motor vehicles, automotive fuel, %, y/y)
Bulgaria 19.8 26.7 20.7 -9.9 -5.5 10.7 -5.5 -11.5 -10.6 -10.1 -10.1 -8.9
Czech Republic 7.4 7.9 4.5 -5.2 -4.1 -2.7 -4.1 -7.1 -5.6 -5.6 -1.2 -2.8
Estonia 21.7 15.7 5.1 -18.8 -16.1 -4.1 -16.1 -17.9 -20.4 -20.6 -15.0 -6.7
Hungary 7.9 2.8 3.6 -3.6 -
3.2
-0.3 -3.2 -3.0 -5.0 -3.3 -2.4
Latvia 26.2 22.4 3.6 -26.0 -20.9 -7.6 -20.9 -26.5 -27.2 -27.8 -27.3 -14.5
Lithuania 11.6 19.3 15.0 -19.8 -14.6 3.6 -14.6 -18.8 -23.9 -23.9 -22.2 -11.0
Poland 11.5 12.6 7.2 3.9 5.3 0.9 5.3 4.2 0.9 3.5 3.5 0.1
Romania 23.4 22.6 28.3 -7.2 -2.0 10.7 -2.0 -11.1 -6.1 -4.3 -2.4 -3.8
Slovakia 9.6 7.5 13.5 -11.9 -10.8 8.0 -10.8 -12.7 -12.8 -11.4 -10.6 -3.6
Slovenia 6.1 10.5 20.5 -13.6 -8.4 8.5 -8.4 -15.7 -16.1 -11.7 -2.6 1.5
Croatia 6.8 6.1 5.7 -5.9 -1.3 3.1 -1.3 -4.2 -8.8 -8.9 -13.2 -6.5
Harmonized unemployment rates NSA (%, LFS data)
Bulgaria 9.0 6.9 5.6 6.7 6.4 6.3 6.7 7.5 7.0 7.5 8.0 8.7
Czech Republic 7.2 5.3 4.4 6.8 5.8 6.3 7.3 7.7 7.5 7.6 8.0 8.5
Estonia 5.9 4.7 5.5 13.8 11.4 13.5 14.6 15.5 15.5 15.5 15.5
Hungary 7.5 7.4 7.8 10.0 9.7 9.6 10.3 10.6 10.5 10.5 10.8 11.5
Latvia 6.8 6.0 7.5 17.6 13.9 16.7 18.4 21.6 20.6 21.7 22.6 23.2
Lithuania 5.6 4.3 5.8 14.0 11.9 13.6 13.8
Poland 13.9 9.6 7.1 8.2 8.3 7.9 8.1 8.5 8.2 8.5 8.8 9.5
Romania 7.3 6.4 5.8 6.9 6.3 6.8
Slovakia 13.4 11.1 9.5 11.9 10.4 11.3 12.5 13.2 13.1 13.1 13.3 13.8
Slovenia 6.0 4.9 4.4 6.0 5.3 5.6 6.2 6.9 6.8 6.9 6.9 7.3
Croatia 11.2 9.6 8.4 9.6 9.5 8.9 8.7 11.2 10.9 11.3 11.6 11.9
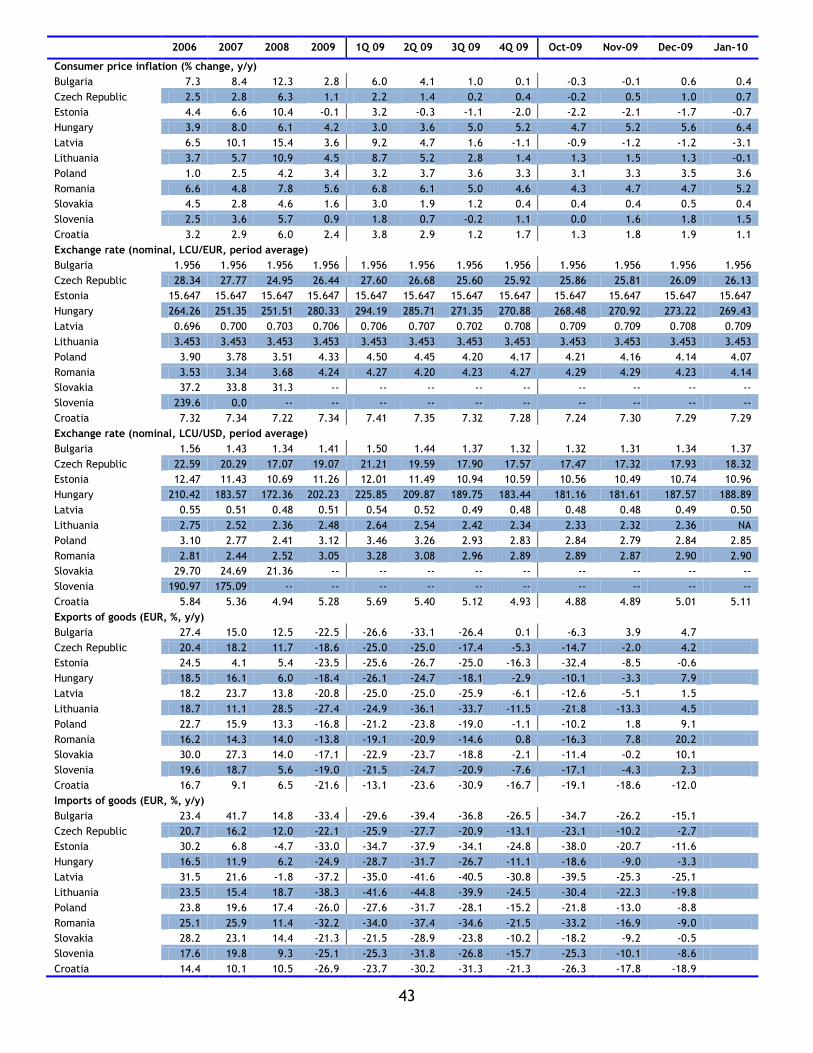
43
2006 2007 2008 2009 1Q 09 2Q 09 3Q 09 4Q 09 Oct-09 Nov-09 Dec-09 Jan-10
Consumer price inflation (% change, y/y)
Bulgaria 7.3 8.4 12.3 2.8 6.0 4.1 1.0 0.1 -0.3 -0.1 0.6 0.4
Czech Republic 2.5 2.8 6.3 1.1 2.2 1.4 0.2 0.4 -0.2 0.5 1.0 0.7
Estonia 4.4 6.6 10.4 -0.1 3.2 -0.3 -1.1 -2.0 -2.2 -2.1 -1.7 -0.7
Hungary 3.9 8.0 6.1 4.2 3.0 3.6 5.0 5.2 4.7 5.2 5.6 6.4
Latvia 6.5 10.1 15.4 3.6 9.2 4.7 1.6 -1.1 -0.9 -1.2 -1.2 -3.1
Lithuania 3.7 5.7 10.9 4.5 8.7 5.2 2.8 1.4 1.3 1.5 1.3 -0.1
Poland 1.0 2.5 4.2 3.4 3.2 3.7 3.6 3.3 3.1 3.3 3.5 3.6
Romania 6.6 4.8 7.8 5.6 6.8 6.1 5.0 4.6 4.3 4.7 4.7 5.2
Slovakia 4.5 2.8 4.6 1.6 3.0 1.9 1.2 0.4 0.4 0.4 0.5 0.4
Slovenia 2.5 3.6 5.7 0.9 1.8 0.7 -0.2 1.1 0.0 1.6 1.8 1.5
Croatia 3.2 2.9 6.0 2.4 3.8 2.9 1.2 1.7 1.3 1.8 1.9 1.1
Exchange rate (nominal, LCU/EUR, period average)
Bulgaria 1.956 1.956 1.956 1.956 1.956 1.956 1.956 1.956 1.956 1.956 1.956 1.956
Czech Republic 28.34 27.77 24.95 26.44 27.60 26.68 25.60 25.92 25.86 25.81 26.09 26.13
Estonia 15.647 15.647 15.647 15.647 15.647 15.647 15.647 15.647 15.647 15.647 15.647 15.647
Hungary 264.26 251.35 251.51 280.33 294.19 285.71 271.35 270.88 268.48 270.92 273.22 269.43
Latvia 0.696 0.700 0.703 0.706 0.706 0.707 0.702 0.708 0.709 0.709 0.708 0.709
Lithuania 3.453 3.453 3.453 3.453 3.453 3.453 3.453 3.453 3.453 3.453 3.453 3.453
Poland 3.90 3.78 3.51 4.33 4.50 4.45 4.20 4.17 4.21 4.16 4.14 4.07
Romania 3.53 3.34 3.68 4.24 4.27 4.20 4.23 4.27 4.29 4.29 4.23 4.14
Slovakia 37.2 33.8 31.3 -- -- -- -- -- -- -- -- --
Slovenia 239.6 0.0 -- -- -- -- -- -- -- -- -- --
Croatia 7.32 7.34 7.22 7.34 7.41 7.35 7.32 7.28 7.24 7.30 7.29 7.29
Exchange rate (nominal, LCU/USD, period average)
Bulgaria 1.56 1.43 1.34 1.41 1.50 1.44 1.37 1.32 1.32 1.31 1.34 1.37
Czech Republic 22.59 20.29 17.07 19.07 21.21 19.59 17.90 17.57 17.47 17.32 17.93 18.32
Estonia 12.47 11.43 10.69 11.26 12.01 11.49 10.94 10.59 10.56 10.49 10.74 10.96
Hungary 210.42 183.57 172.36 202.23 225.85 209.87 189.75 183.44 181.16 181.61 187.57 188.89
Latvia 0.55 0.51 0.48 0.51 0.54 0.52 0.49 0.48 0.48 0.48 0.49 0.50
Lithuania 2.75 2.52 2.36 2.48 2.64 2.54 2.42 2.34 2.33 2.32 2.36 NA
Poland 3.10 2.77 2.41 3.12 3.46 3.26 2.93 2.83 2.84 2.79 2.84 2.85
Romania 2.81 2.44 2.52 3.05 3.28 3.08 2.96 2.89 2.89 2.87 2.90 2.90
Slovakia 29.70 24.69 21.36 -- -- -- -- -- -- -- -- --
Slovenia 190.97 175.09 -- -- -- -- -- -- -- -- -- --
Croatia 5.84 5.36 4.94 5.28 5.69 5.40 5.12 4.93 4.88 4.89 5.01 5.11
Exports of goods (EUR, %, y/y)
Bulgaria 27.4 15.0 12.5 -22.5 -26.6 -33.1 -26.4 0.1 -6.3 3.9 4.7
Czech Republic 20.4 18.2 11.7 -18.6 -25.0 -25.0 -17.4 -5.3 -14.7 -2.0 4.2
Estonia 24.5 4.1 5.4 -23.5 -25.6 -26.7 -25.0 -16.3 -32.4 -8.5 -0.6
Hungary 18.5 16.1 6.0 -18.4 -26.1 -24.7 -18.1 -2.9 -10.1 -3.3 7.9
Latvia 18.2 23.7 13.8 -20.8 -25.0 -25.0 -25.9 -6.1 -12.6 -5.1 1.5
Lithuania 18.7 11.1 28.5 -27.4 -24.9 -36.1 -33.7 -11.5 -21.8 -13.3 4.5
Poland 22.7 15.9 13.3 -16.8 -21.2 -23.8 -19.0 -1.1 -10.2 1.8 9.1
Romania 16.2 14.3 14.0 -13.8 -19.1 -20.9 -14.6 0.8 -16.3 7.8 20.2
Slovakia 30.0 27.3 14.0 -17.1 -22.9 -23.7 -18.8 -2.1 -11.4 -0.2 10.1
Slovenia 19.6 18.7 5.6 -19.0 -21.5 -24.7 -20.9 -7.6 -17.1 -4.3 2.3
Croatia 16.7 9.1 6.5 -21.6 -13.1 -23.6 -30.9 -16.7 -19.1 -18.6 -12.0
Imports of goods (EUR, %, y/y)
Bulgaria 23.4 41.7 14.8 -33.4 -29.6 -39.4 -36.8 -26.5 -34.7 -26.2 -15.1
Czech Republic 20.7 16.2 12.0 -22.1 -25.9 -27.7 -20.9 -13.1 -23.1 -10.2 -2.7
Estonia 30.2 6.8 -4.7 -33.0 -34.7 -37.9 -34.1 -24.8 -38.0 -20.7 -11.6
Hungary 16.5 11.9 6.2 -24.9 -28.7 -31.7 -26.7 -11.1 -18.6 -9.0 -3.3
Latvia 31.5 21.6 -1.8 -37.2 -35.0 -41.6 -40.5 -30.8 -39.5 -25.3 -25.1
Lithuania 23.5 15.4 18.7 -38.3 -41.6 -44.8 -39.9 -24.5 -30.4 -22.3 -19.8
Poland 23.8 19.6 17.4 -26.0 -27.6 -31.7 -28.1 -15.2 -21.8 -13.0 -8.8
Romania 25.1 25.9 11.4 -32.2 -34.0 -37.4 -34.6 -21.5 -33.2 -16.9 -9.0
Slovakia 28.2 23.1 14.4 -21.3 -21.5 -28.9 -23.8 -10.2 -18.2 -9.2 -0.5
Slovenia 17.6 19.8 9.3 -25.1 -25.3 -31.8 -26.8 -15.7 -25.3 -10.1 -8.6
Croatia 14.4 10.1 10.5 -26.9 -23.7 -30.2 -31.3 -21.3 -26.3 -17.8 -18.9
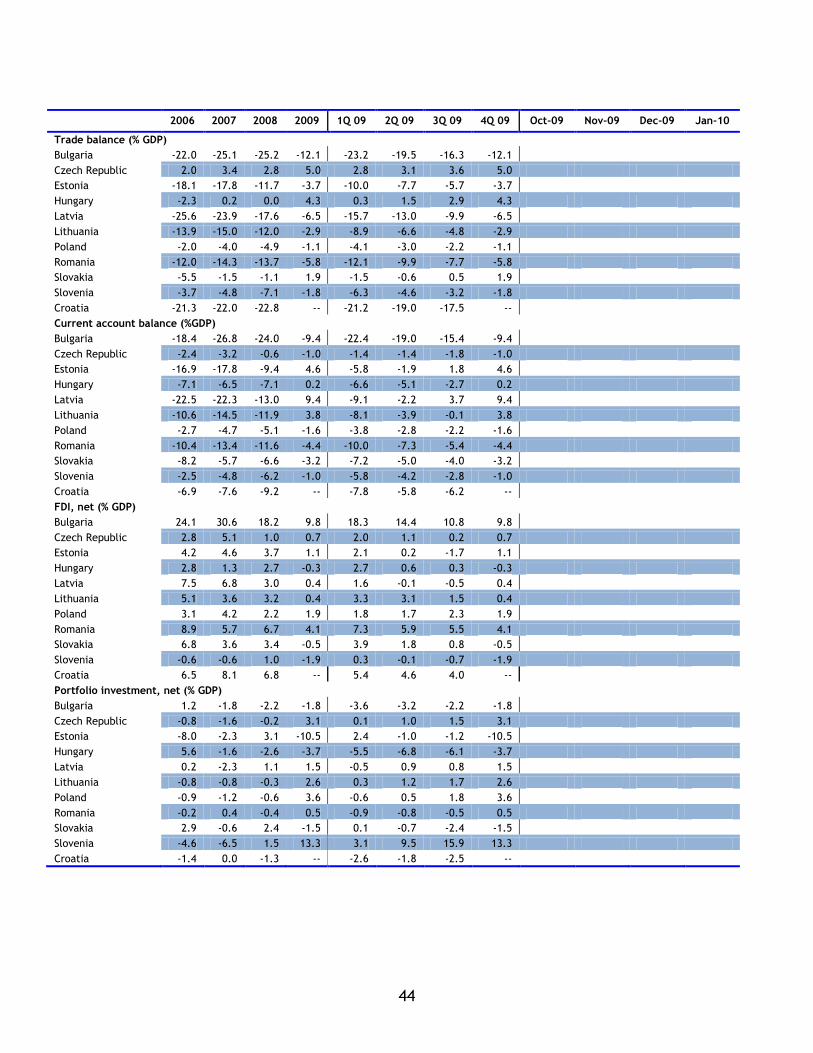
44
2006 2007 2008 2009 1Q 09 2Q 09 3Q 09 4Q 09 Oct-09 Nov-09 Dec-09 Jan-10
Trade balance (% GDP)
Bulgaria -22.0 -25.1 -25.2 -12.1 -23.2 -19.5 -16.3 -12.1
Czech Republic 2.0 3.4 2.8 5.0 2.8 3.1 3.6 5.0
Estonia -18.1 -17.8 -11.7 -3.7 -10.0 -7.7 -5.7 -3.7
Hungary -2.3 0.2 0.0 4.3 0.3 1.5 2.9 4.3
Latvia -25.6 -23.9 -17.6 -6.5 -15.7 -13.0 -9.9 -6.5
Lithuania -13.9 -15.0 -12.0 -2.9 -8.9 -6.6 -4.8 -2.9
Poland -2.0 -4.0 -4.9 -1.1 -4.1 -3.0 -2.2 -1.1
Romania -12.0 -14.3 -13.7 -5.8 -12.1 -9.9 -7.7 -5.8
Slovakia -5.5 -1.5 -1.1 1.9 -1.5 -0.6 0.5 1.9
Slovenia -3.7 -4.8 -7.1 -1.8 -6.3 -4.6 -3.2 -1.8
Croatia -21.3 -22.0 -22.8 -- -21.2 -19.0 -17.5 --
Current account balance (%GDP)
Bulgaria -18.4 -26.8 -24.0 -9.4 -22.4 -19.0 -15.4 -9.4
Czech Republic -2.4 -3.2 -0.6 -1.0 -1.4 -1.4 -1.8 -1.0
Estonia -16.9 -17.8 -9.4 4.6 -5.8 -1.9 1.8 4.6
Hungary -7.1 -6.5 -7.1 0.2 -6.6 -5.1 -2.7 0.2
Latvia -22.5 -22.3 -13.0 9.4 -9.1 -2.2 3.7 9.4
Lithuania -10.6 -14.5 -11.9 3.8 -8.1 -3.9 -0.1 3.8
Poland -2.7 -4.7 -5.1 -1.6 -3.8 -2.8 -2.2 -1.6
Romania -10.4 -13.4 -11.6 -4.4 -10.0 -7.3 -5.4 -4.4
Slovakia -8.2 -5.7 -6.6 -3.2 -7.2 -5.0 -4.0 -3.2
Slovenia -2.5 -4.8 -6.2 -1.0 -5.8 -4.2 -2.8 -1.0
Croatia -6.9 -7.6 -9.2 -- -7.8 -5.8 -6.2 --
FDI, net (% GDP)
Bulgaria 24.1 30.6 18.2 9.8 18.3 14.4 10.8 9.8
Czech Republic 2.8 5.1 1.0 0.7 2.0 1.1 0.2 0.7
Estonia 4.2 4.6 3.7 1.1 2.1 0.2 -1.7 1.1
Hungary 2.8 1.3 2.7 -0.3 2.7 0.6 0.3 -0.3
Latvia 7.5 6.8 3.0 0.4 1.6 -0.1 -0.5 0.4
Lithuania 5.1 3.6 3.2 0.4 3.3 3.1 1.5 0.4
Poland 3.1 4.2 2.2 1.9 1.8 1.7 2.3 1.9
Romania 8.9 5.7 6.7 4.1 7.3 5.9 5.5 4.1
Slovakia 6.8 3.6 3.4 -0.5 3.9 1.8 0.8 -0.5
Slovenia -0.6 -0.6 1.0 -1.9 0.3 -0.1 -0.7 -1.9
Croatia 6.5 8.1 6.8 -- 5.4 4.6 4.0 --
Portfolio investment, net (% GDP)
Bulgaria 1.2 -1.8 -2.2 -1.8 -3.6 -3.2 -2.2 -1.8
Czech Republic -0.8 -1.6 -0.2 3.1 0.1 1.0 1.5 3.1
Estonia -8.0 -2.3 3.1 -10.5 2.4 -1.0 -1.2 -10.5
Hungary 5.6 -1.6 -2.6 -3.7 -5.5 -6.8 -6.1 -3.7
Latvia 0.2 -2.3 1.1 1.5 -0.5 0.9 0.8 1.5
Lithuania -0.8 -0.8 -0.3 2.6 0.3 1.2 1.7 2.6
Poland -0.9 -1.2 -0.6 3.6 -0.6 0.5 1.8 3.6
Romania -0.2 0.4 -0.4 0.5 -0.9 -0.8 -0.5 0.5
Slovakia 2.9 -0.6 2.4 -1.5 0.1 -0.7 -2.4 -1.5
Slovenia -4.6 -6.5 1.5 13.3 3.1 9.5 15.9 13.3
Croatia -1.4 0.0 -1.3 -- -2.6 -1.8 -2.5 --
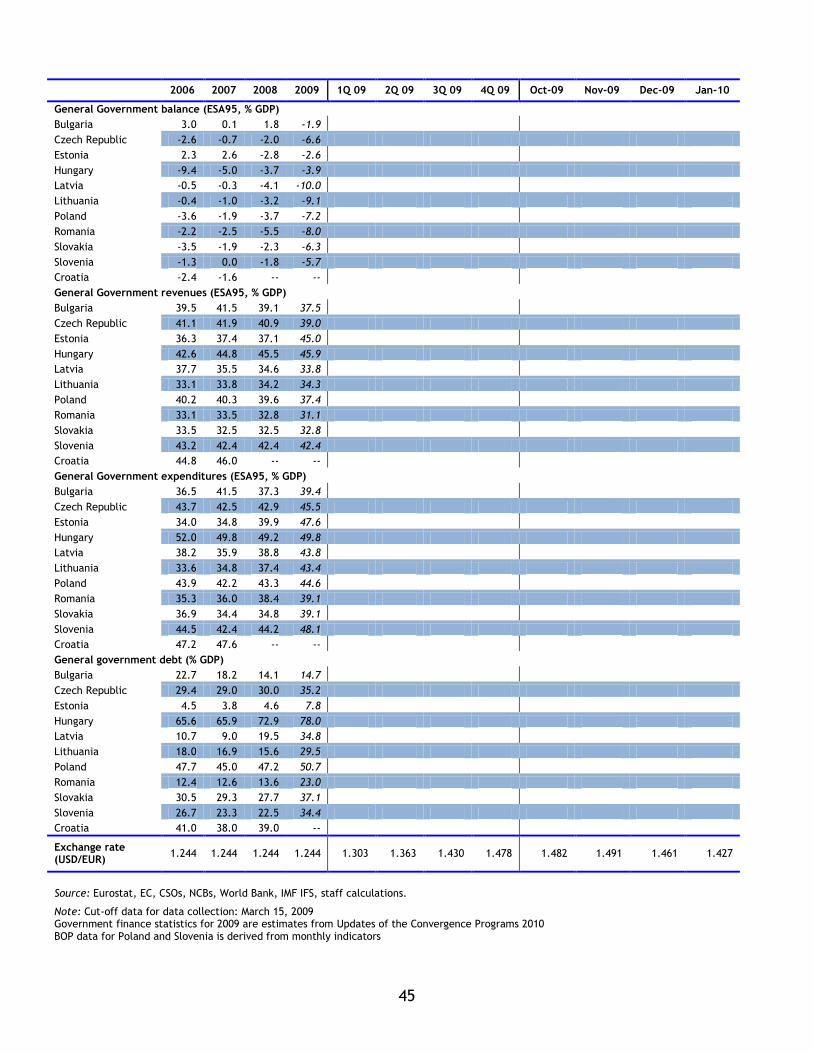
45
2006 2007 2008 2009 1Q 09 2Q 09 3Q 09 4Q 09 Oct-09 Nov-09 Dec-09 Jan-10
General Government balance (ESA95, % GDP)
Bulgaria 3.0 0.1 1.8 -1.9
Czech Republic -2.6 -0.7 -2.0 -6.6
Estonia 2.3 2.6 -2.8 -2.6
Hungary -9.4 -5.0 -3.7 -3.9
Latvia -0.5 -0.3 -4.1 -10.0
Lithuania -0.4 -1.0 -3.2 -9.1
Poland -3.6 -1.9 -3.7 -7.2
Romania -2.2 -2.5 -5.5 -8.0
Slovakia -3.5 -1.9 -2.3 -6.3
Slovenia -1.3 0.0 -1.8 -5.7
Croatia -2.4 -1.6 -- --
General Government revenues (ESA95, % GDP)
Bulgaria 39.5 41.5 39.1 37.5
Czech Republic 41.1 41.9 40.9 39.0
Estonia 36.3 37.4 37.1 45.0
Hungary 42.6 44.8 45.5 45.9
Latvia 37.7 35.5 34.6 33.8
Lithuania 33.1 33.8 34.2 34.3
Poland 40.2 40.3 39.6 37.4
Romania 33.1 33.5 32.8 31.1
Slovakia 33.5 32.5 32.5 32.8
Slovenia 43.2 42.4 42.4 42.4
Croatia 44.8 46.0 -- --
General Government expenditures (ESA95, % GDP)
Bulgaria 36.5 41.5 37.3 39.4
Czech Republic 43.7 42.5 42.9 45.5
Estonia 34.0 34.8 39.9 47.6
Hungary 52.0 49.8 49.2 49.8
Latvia 38.2 35.9 38.8 43.8
Lithuania 33.6 34.8 37.4 43.4
Poland 43.9 42.2 43.3 44.6
Romania 35.3 36.0 38.4 39.1
Slovakia 36.9 34.4 34.8 39.1
Slovenia 44.5 42.4 44.2 48.1
Croatia 47.2 47.6 -- --
General government debt (% GDP)
Bulgaria 22.7 18.2 14.1 14.7
Czech Republic 29.4 29.0 30.0 35.2
Estonia 4.5 3.8 4.6 7.8
Hungary 65.6 65.9 72.9 78.0
Latvia 10.7 9.0 19.5 34.8
Lithuania 18.0 16.9 15.6 29.5
Poland 47.7 45.0 47.2 50.7
Romania 12.4 12.6 13.6 23.0
Slovakia 30.5 29.3 27.7 37.1
Slovenia 26.7 23.3 22.5 34.4
Croatia 41.0 38.0 39.0 --
Exchange rate (USD/EUR)
1.244 1.244 1.244 1.244 1.303 1.363 1.430 1.478 1.482 1.491 1.461 1.427
Source: Eurostat, EC, CSOs, NCBs, World Bank, IMF IFS, staff calculations.
Note: Cut-off data for data collection: March 15, 2009 Government finance statistics for 2009 are estimates from Updates of the Convergence Programs 2010 BOP data for Poland and Slovenia is derived from monthly indicators


![Energies 2012 energies - Semantic Scholar · 2018. 5. 28. · Energies 2012, 5 2992 consumption. In [4] the transformation is predicted to occur in 2009. In [9], it is predicted to](https://img.pdfslide.us/doc/110x75/5fdcaa04106f0a0c7054f31c/energies-2012-energies-semantic-scholar-2018-5-28-energies-2012-5-2992-consumption.jpg)