Embed Size (px)
Citation preview
This proje t is i a ed y the EU.
Per epio s of EU Busi esses a ive i Azer aija
EU Busi ess Cli ate Survey
Azer aija 2016


EU Business Climate Survey Azerbaijan
Report 2016
Perceptions of EU Businesses active in Azerbaijan


EU Business Climate Survey Azerbaijan 2016

EU Business Climate Survey Azerbaijan 2016
1
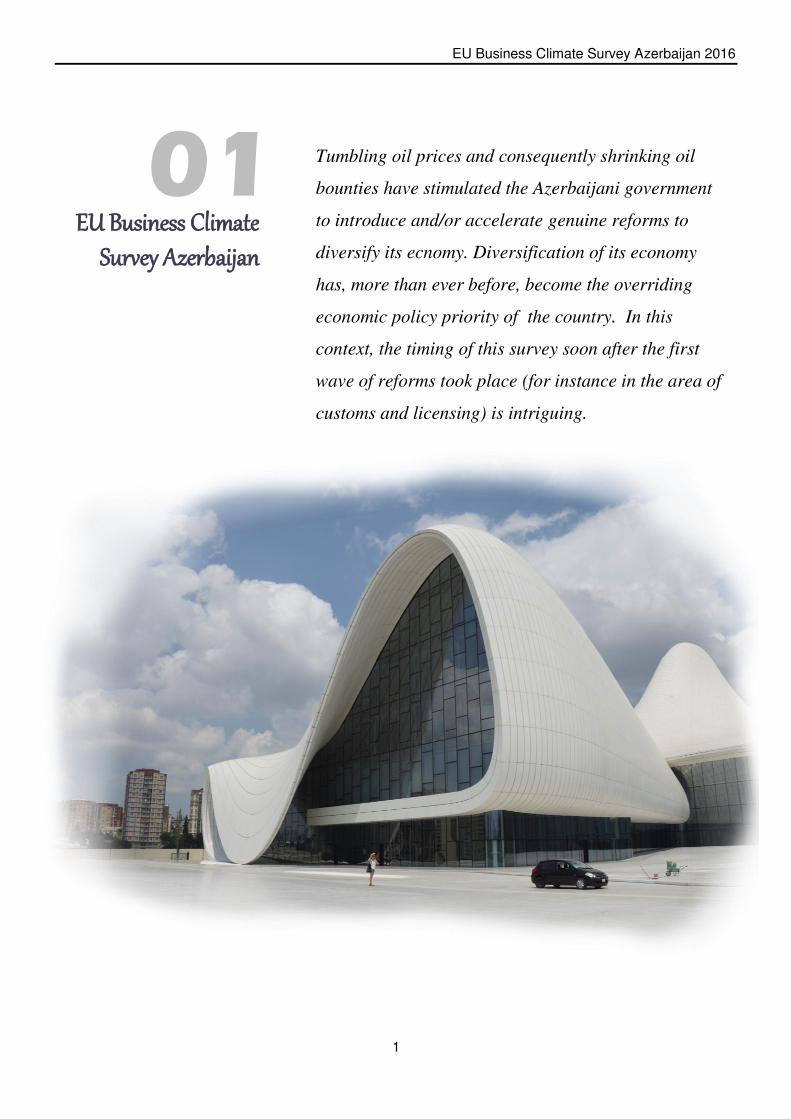
01
EU Business Climate
Survey Azerbaijan
Tumbling oil prices and consequently shrinking oil
bounties have stimulated the Azerbaijani government
to introduce and/or accelerate genuine reforms to
diversify its ecnomy. Diversification of its economy
has, more than ever before, become the overriding
economic policy priority of the country. In this
context, the timing of this survey soon after the first
wave of reforms took place (for instance in the area of
customs and licensing) is intriguing.

EU Business Climate Survey Azerbaijan 2016
2
he present 1st Business Climate Survey Azerbaijan aims to provide unbiased, up-to-date and
comprehensive information on the economic situation and investment conditions in the
Azerbaijani market and on the business climate in the country as perceived by EU businesses
active in Azerbaijan.
The Survey was distributed to more than 300 EU businesses active in Azerbaijan representing 19 EU
countries. 100 of them have chosen to respond, which corresponds to a response rate of around 30%.
The aggregated findings should therefore be sufficiently representative for the views of EU companies
active in Azerbaijan. The survey consisted of mainly two elements, i.e. a questionnaire with nineteen
questions and additional structured interviews of 7 selected respondents.
This report was shaped by the valuable insights of CEOs, General Managers and Department Heads,
among others, regarding the current situation and prospects for short-term growth, business environment
and investment climate in the country, and their company demographics. Individual interviews conducted
with EU business leaders from major economic sectors in Azerbaijan (energy, consulting, tourism, and
construction), served to underpin and further clarify the findings of the questionnaire.
In 2017, following the same methodology 1 , the 2nd Business Climate Survey Azerbaijan will be
conducted. This will allow for contrasting and comparing the results of both surveys and consequently
identifying potential changes from 2016 to 2017, which EU entrepreneurs perceive regarding the
business climate in Azerbaijan.
1 The methodology of the survey is described in Appendix to this report.
T
EU Business Climate Survey Azerbaijan 2016
3

EU Business Climate Survey Azerbaijan 2016
4
EU Business Climate Survey Azerbaijan 2016
5
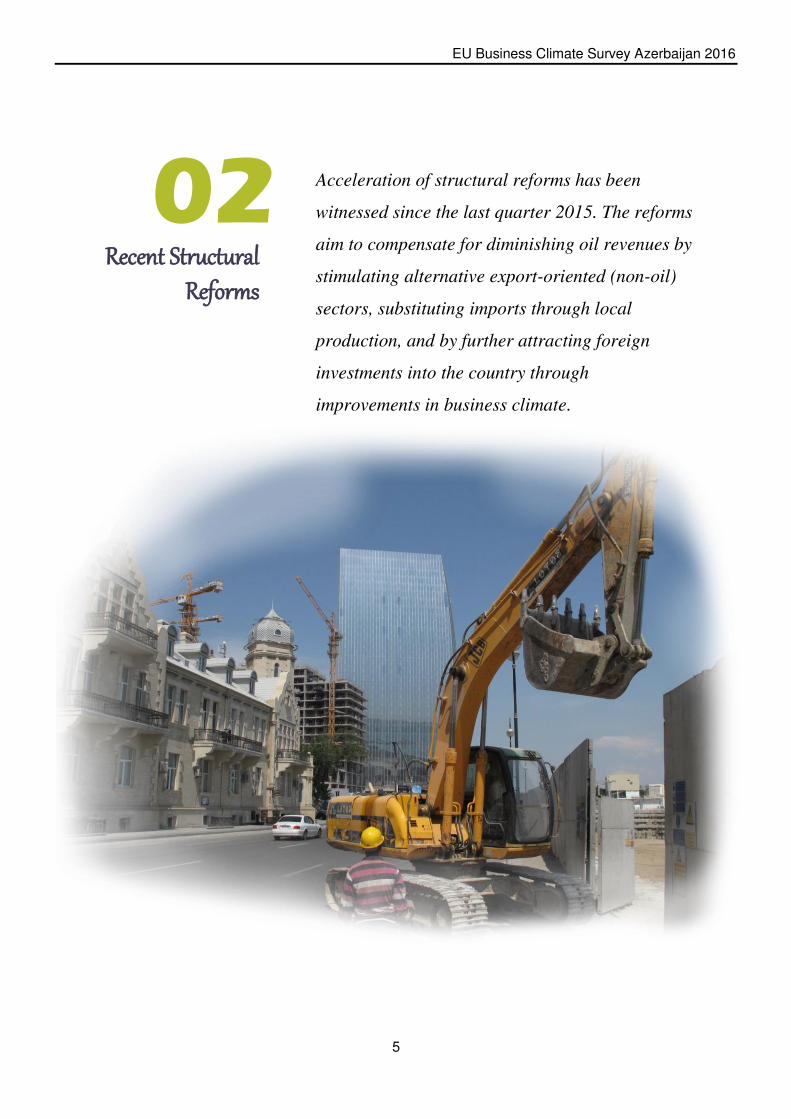
02
Recent Structural
Reforms
Acceleration of structural reforms has been
witnessed since the last quarter 2015. The reforms
aim to compensate for diminishing oil revenues by
stimulating alternative export-oriented (non-oil)
sectors, substituting imports through local
production, and by further attracting foreign
investments into the country through
improvements in business climate.
EU Business Climate Survey Azerbaijan 2016
6
Suspension of inspections and simplification of licensing procedures to
stimulate businesses
One of the key decrees by the President concerned a “suspension of inspections related to
entrepreneurial activities” for two years. As a result, the number of inspections carried out declined
significantly, from 19.300 in the first quarter of 2015 to 34 in the same period of 2016 (excluding tax
audits).
Another decree signed by the President aims to facilitate doing business, by simplifying the
licensing procedure and reducing the number of licensable activities from 56 to 37. Moreover,
particularly welcome is the provision of services related to the issuing of business licenses by
ASAN services (Azerbaijan Service and Assessment Network)2, given that they are
countrywide known for eliminating bribery and corruption in the provision of public services.
Liberalization of customs and taxes is a prerequisite to
ensure transparency
To attract investments from abroad, the President signed a decree on Additional Measures to
Promote Investment modifying tax and customs incentives for investors.
The changes made to the Tax Code, effective from 1 January 2016, aim at simplifying the taxing
system in the construction and trade and the catering sectors and introducing a 7-year exemption
from paying 50% of the income/profit tax and a full exemption from property tax and land tax.
According to the amendments to the Law on Customs Tariffs, investment certificate holders will be
exempt for seven years from paying customs duties and value added tax on machinery,
technological equipment and devices imported for investment purposes in priority branches (e.g.
industrial parks, manufacturing plants, research work).3
2 “ASAN” is the State Agency for Public Service and Social Innovations under the President of the Republic of Azerbaijan meaning “easy”
in English. It is the Azerbaijani model of service delivery mechanism to render public and private services from one single space. 3 Doing Business in Azerbaijan, 2016, Baker McKenzie
Oct
2015
Jan
2016
EU Business Climate Survey Azerbaijan 2016
7
Floating currency and the Financial Supervisory Agency
After using up a considerable amount of its foreign exchange reserves, Azerbaijan started on 21
December, 2015 stopped pegging its currency to a baket of currencies and moved towards a
managed floating exchange rate regime against major international currencies. To stabilize the
financial sector and to alleviate uncertainty in the market, the President signed another decree
establishing the Financial Supervisory Agency which has taken over a number of responsibilities
from the Central Bank of Azerbaijan, while consolidating the banking sector. Furthermore, the
Azerbaijani Deposit Insurance Fund now insures all eligible deposits, regardless of the amount, for
a period of three years.
Yet another step towards improving transparency and the legal framework for appeals of physical
and legal persons engaged in business activities has been the establishment of the Board of
Appeal under the President of Azerbaijan.
Additional measures to stimulate the export of non-oil products
As early as December 2012, the President signed a decree approving the development concept
"Azerbaijan 2020: vision to future". This document foresees the stimulation of local production and
the adoption of an export-oriented economic model.
A decree foresees to maintain growth in the non-oil sectors by expanding their export capabilities
and by providing export incentives with funds from the state budget in the years 2017-2020. In this
context, the government signals further investments into infrastructure, transport corridors and
logistics facilities in the country to prompt trade all the way from Northern Europe to Southeast
Asia.4
Finally, it should be noted that in March 2016 a working group has been established by Presidential
decree that is to advise the President of Azerbaijan on a “strategic roadmap for main directions of
economic reforms”. The working group supported by McKinsey consultants-is to develop a strategy for
economic diversification in the period 2016-2020, a strategic plan covering the years up to 2025, and a
vision for the post 2025 era.
4A major project is the East-West or the Trans-Caspian transport corridor, which is supposed to connect China with Europe via the territories of
Kazakhstan, Azerbaijan and Georgia. In addition to that, the North-South international transport project will connect railways of Russia, Azerbaijan and Iran by reducing the delivery time twofold. The construction of the Alat international Sea Port is pending and introduction of the “free economic zone” is in the government’s agenda.
Mar
2015
Feb
2016

EU Business Climate Survey Azerbaijan 2016
8
EU Business Climate Survey Azerbaijan 2016
9
03
5 Exports to Russia account for about half of Azerbaijan’s non-oil exports while remittances from Russia constitute approximately 1 billion USD a year (World Bank Group, 2016, Global Economic Prospects, p.95)
Azerbaijani Economy
in the wake of falling
oil prices
Sustained low oil prices (oil and gas account for 86% of
exports in Azerbaijan), downward pressure on the
exchange rate and adverse spillovers from Russia5 have
limited the scope for further accommodative monetary
policy and have intensified domestic challenges. A key
policy challenge for the government is to to bring the
country on a more sustainable economic path through the
transformation of its economic growth model led by the
private sector.
EU Business Climate Survey Azerbaijan 2016
10
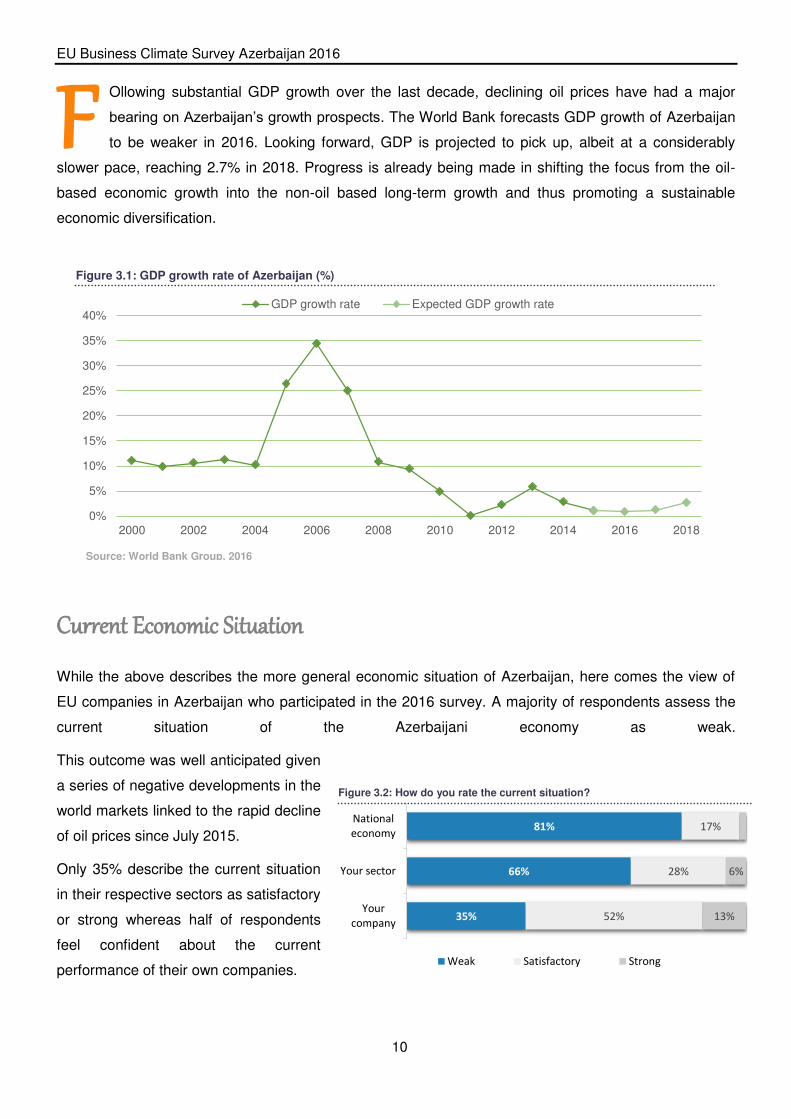
Ollowing substantial GDP growth over the last decade, declining oil prices have had a major
bearing on Azerbaijan’s growth prospects. The World Bank forecasts GDP growth of Azerbaijan
to be weaker in 2016. Looking forward, GDP is projected to pick up, albeit at a considerably
slower pace, reaching 2.7% in 2018. Progress is already being made in shifting the focus from the oil-
based economic growth into the non-oil based long-term growth and thus promoting a sustainable
economic diversification.
Current Economic Situation
While the above describes the more general economic situation of Azerbaijan, here comes the view of
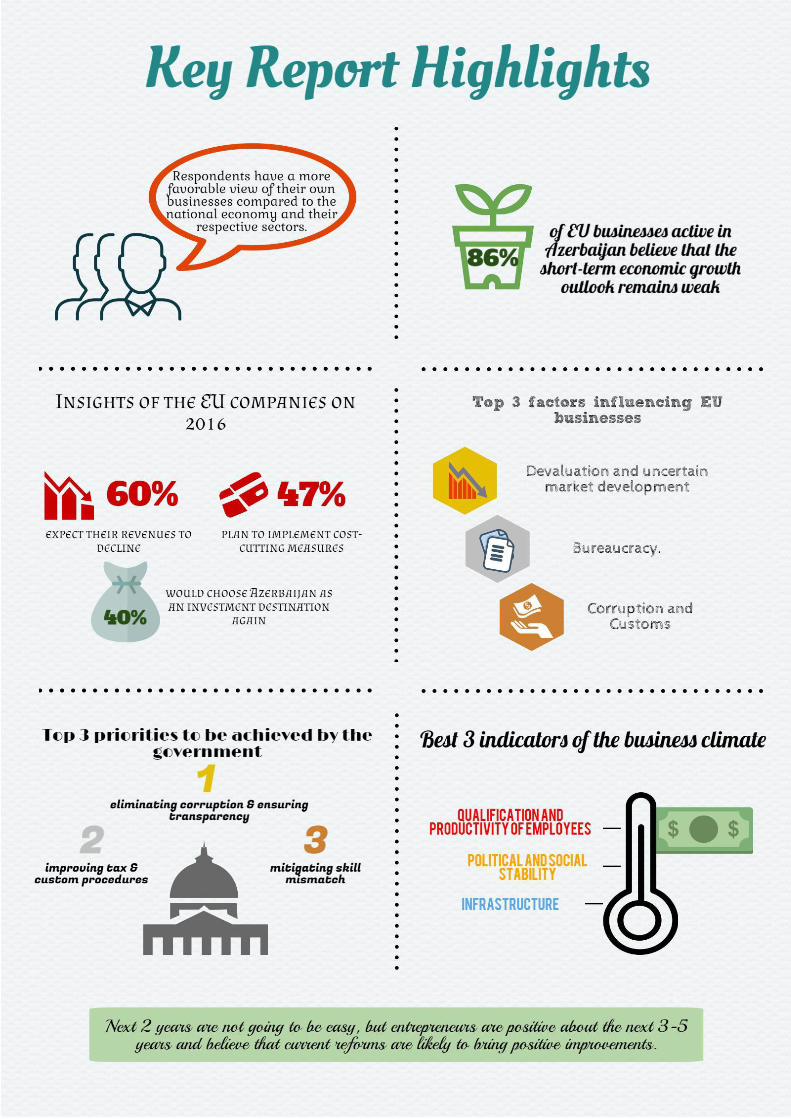
EU companies in Azerbaijan who participated in the 2016 survey. A majority of respondents assess the
current situation of the Azerbaijani economy as weak.
This outcome was well anticipated given
a series of negative developments in the
world markets linked to the rapid decline
of oil prices since July 2015.
Only 35% describe the current situation
in their respective sectors as satisfactory
or strong whereas half of respondents
feel confident about the current
performance of their own companies.
F
Figure 3.1: GDP growth rate of Azerbaijan (%)
0%
5%
10%
15%
20%
25%
30%
35%
40%
2000 2002 2004 2006 2008 2010 2012 2014 2016 2018
GDP growth rate Expected GDP growth rate
Source: World Bank Group, 2016
Figure 3.2: How do you rate the current situation?
81%
66%
35%
17%
28%
52%
6%
13%
National
economy
Your sector
Your
company
Weak Satisfactory Strong
EU Business Climate Survey Azerbaijan 2016
11
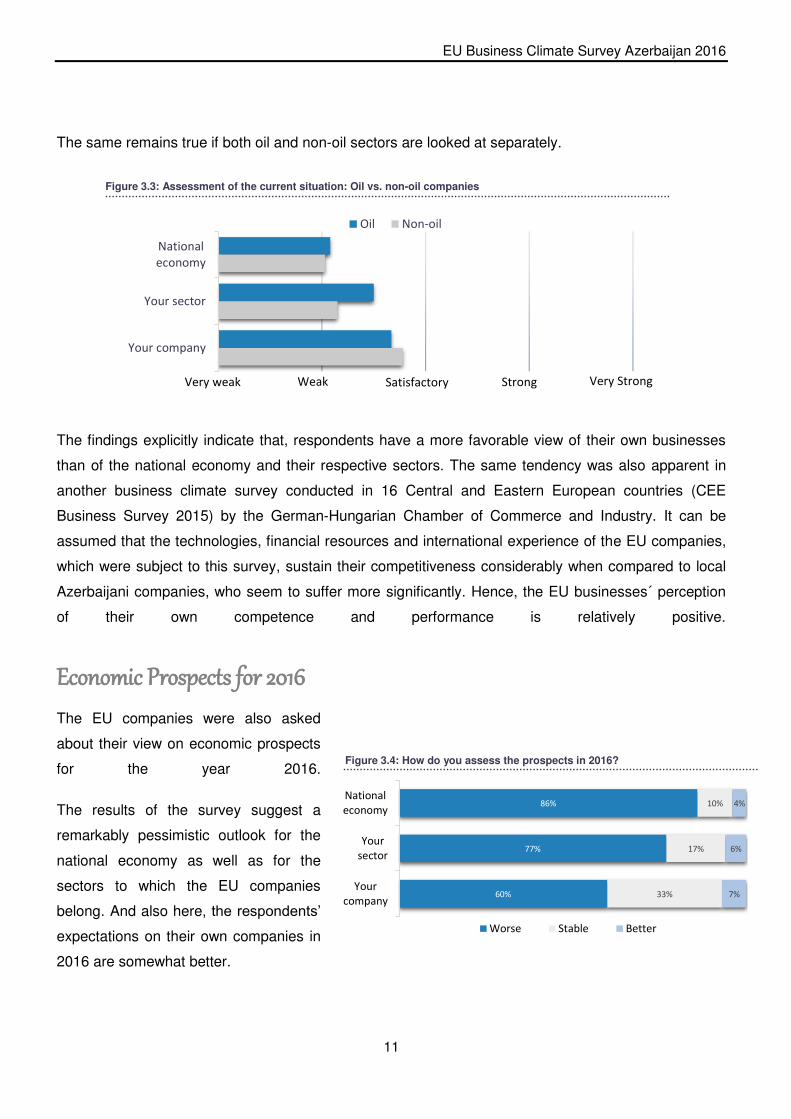
Figure 3.3: Assessment of the current situation: Oil vs. non-oil companies
National
economy
Your sector
Your company
Oil Non-oil
Very weak Very Strong Strong Satisfactory Weak
The same remains true if both oil and non-oil sectors are looked at separately.
The findings explicitly indicate that, respondents have a more favorable view of their own businesses
than of the national economy and their respective sectors. The same tendency was also apparent in
another business climate survey conducted in 16 Central and Eastern European countries (CEE
Business Survey 2015) by the German-Hungarian Chamber of Commerce and Industry. It can be
assumed that the technologies, financial resources and international experience of the EU companies,
which were subject to this survey, sustain their competitiveness considerably when compared to local
Azerbaijani companies, who seem to suffer more significantly. Hence, the EU businesses´ perception
of their own competence and performance is relatively positive.
Economic Prospects for 2016
The EU companies were also asked
about their view on economic prospects
for the year 2016.
The results of the survey suggest a
remarkably pessimistic outlook for the
national economy as well as for the
sectors to which the EU companies
belong. And also here, the respondents’
expectations on their own companies in
2016 are somewhat better.
Figure 3.4: How do you assess the prospects in 2016?
86%
77%
60%
10%
17%
33%
4%
6%
7%
National
economy
Your
sector
Your
company
Worse Stable Better
EU Business Climate Survey Azerbaijan 2016
12
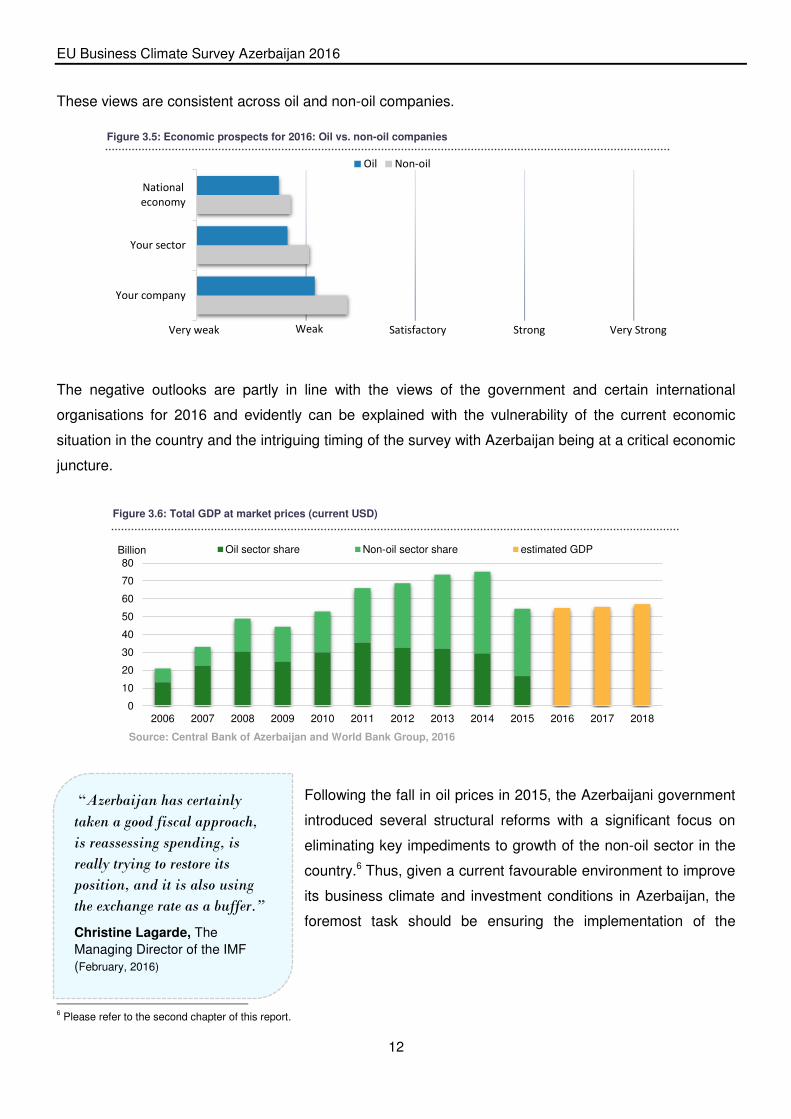
These views are consistent across oil and non-oil companies.
The negative outlooks are partly in line with the views of the government and certain international
organisations for 2016 and evidently can be explained with the vulnerability of the current economic
situation in the country and the intriguing timing of the survey with Azerbaijan being at a critical economic
juncture.
Following the fall in oil prices in 2015, the Azerbaijani government
introduced several structural reforms with a significant focus on
eliminating key impediments to growth of the non-oil sector in the
country.6 Thus, given a current favourable environment to improve
its business climate and investment conditions in Azerbaijan, the
foremost task should be ensuring the implementation of the
6 Please refer to the second chapter of this report.
Figure 3.6: Total GDP at market prices (current USD)
0
10
20
30
40
50
60
70
80
2006 2007 2008 2009 2010 2011 2012 2013 2014 2015 2016 2017 2018
Billion Oil sector share Non-oil sector share estimated GDP
Source: Central Bank of Azerbaijan and World Bank Group, 2016
Figure 3.5: Economic prospects for 2016: Oil vs. non-oil companies
National
economy
Your sector
Your company
Oil Non-oil
Very weak Very Strong Strong Satisfactory Weak
“Azerbaijan has certainly
taken a good fiscal approach,
is reassessing spending, is
really trying to restore its
position, and it is also using
the exchange rate as a buffer.”
Christine Lagarde, The
Managing Director of the IMF
(February, 2016)

EU Business Climate Survey Azerbaijan 2016
13
announced structural reforms, while designing and implementing a roadmap for short-term, medium term
and long-term reforms.

EU Business Climate Survey Azerbaijan
Figure 3.8: Expectation of key performance indicators: Oil vs. non-oil companies
Figure 3.9: Change in number of employees by company size
23%
55%
42%
69%
67%
39%
43%
25%
10%
6%
5%
6%
1-9
10-49
50-250
250+
Nu
mb
er
of
em
plo
ye
es
Decrease Remain stable Increase
Revenues
Expenses
Exports
Imports
Number of employees
Capital expenditure
Decrease
significantly
Decrease
slightly
Remain
stable
Increase
slightly
Increase
significantly
Key Performance Indicators of the companies
Clearly, the expectations of EU
companies in Azerbaijan on their own
performance are also influenced by the
uncertainty about future economic
developments. As the engines driving
the revenues stop functioning, the
businesses are using every opportunity
to cut down their expenses.
Overall, the respondents are pessimistic about the prospects of their own company’s growth in 2016.
60% of the EU companies active in Azerbaijan believe that their revenues will shrink in 2016, and 45%
consider a staff reduction. 63 % and 59% of the companies representing the oil sector and non-oil
sectors respectively think that their revenues will decline. These findings hold true across all companies
independent on their respective sizes.
If we analyse the change in the number of employees by company size, 67% of micro enterprises (up to
9 employees) expect their number of staff to remain stable, whereas 55% of small enterprises (up to 49)
consider a staff reduction.
Figure 3.7: How do you expect your company to perform in 2016?
60%
47%
22%
34%
45%
47%
27%
31%
16%
23%
45%
29%
12%
22%
5%
13%
7%
15%
52%
30%
9%
Revenues
Expenses
Exports
Imports
Number of employees
Capital expenditure
Decrease significantly Remain stable Increase slightly Not applicable
“We are not planning any local lay-offs, but the recruitment of
new staff is frozen”
Vice-President from a company in the
oil and gas sector

EU Business Climate Survey Azerbaijan 2016
15
Figure 3.11: Azerbaijan’s trade with EU countries
3% 3%
9%
11%
20% 40%
4% 4%
6% Austria
Croatia
Czech Republic
France
Germany
Italy
Portugal
Spain
Other
Figure 3.10: Share of EU imports from Azerbaijan
0
2
4
6
8
10
12
14
16
18
2002 2003 2004 2005 2006 2007 2008 2009 2010 2011 2012 2013 2014 2015
Billion € Import Export
52% of respondents state that they are
not involved in exports, and 30% do not
import. Nevertheless, half of all
exporting companies believe that their
exports will drop and imports will
dwindle. While the volume of exports to
the EU (see figure below) has been
declining recently largely as a result of
lower oil prices, the EU remains by far
Azerbaijan's biggest export and import
market with respectively 53 % and 34%
share in total Azerbaijan's exports and
imports.7 Top three EU importers from
Azerbaijan are Italy, Germany and
France.
7 EU-Azerbaijan Fact Sheet, Brussels, 2016
Source: EU Commission, 2016
EU Business Climate Survey Azerbaijan 2016
16
04
Business and Investment
Climate in Azerbaijan
The actual environment in which businesses need
to operate, are decisive considerations while
making investment decisions. The survey aims to
capture the view of EU businesses active in
Azerbaijan with regard to three important
dimensions: conditions in the labour market, the
operational business environment and economic
policies and institutions.

EU Business Climate Survey Azerbaijan 2016
17
Figure 4.1: Average rating of the local business climate indicators
Conditions in the
labour market
Operational
business
environment
Economic Policy
Very
unsatisfactory Unsatisfactory Average Satisfactory
Very
satisfactory
Conditions in the labour market
In our survey the proxy indicators for labour market conditions are qualification and skills
of employees, commitment and productivity of employees, labour costs, availability of
skilled workers, labour law, quality and relevance of academic education and vocational
training, flexibility of immigration policies.
Operational business environment
This section includes factors directly affecting the production process or activities of the
companies, such as infrastructure, payment discipline, access to capital, local suppliers,
conditions for Research and Development (R&D).
Economic policies and institutions
These are the conditions that are directly provided by the state: political and social
stability, public administration, tax burden, predictability of economic stability, legal
certainty, taxation policy and authorities, access to public funds, measures to eliminate
corruption, customs procedures, transparency of public procurement.
When assessing the business climate, the EU companies active in Azerbaijan rate the conditions in the
labour market and operational environment slightly better than the economic policies.

EU Business Climate Survey Azerbaijan 2016
18
Figure 4.2: How do you rate the following local indicators?
Source: World Bank Group, 2016
0
100
200
300
400
500
2006 2007 2008 2009 2010 2011 2012 2013 2014 2015
AZN Average monthly wage Minimum monthly wage
20%
19%
21%
36%
34%
45%
51%
48%
36%
39%
53%
31%
47%
40%
44%
37%
44%
43%
26%
32%
19%
15%
5%
14%
Qualification
Productivity
Labour costs
Skilled workers
Labour law
Education
Vocational training
Visa/work permits
Unsatisfactory Average Satisfactory
Conditions in the labour market
Certainly, labour law or labour costs are not the only factors for an entrepreneur when taking investment
decisions, but the availability of (affordable) qualified professionals does play a role. Of all labour market
indicators, vocational training received the lowest rating from EU entrepreneurs, whereas qualification of
employees is rated best, between “average” and “satisfactory”.
The quality of labour supply depends mainly on qualifications and skills of the workforce. 44% of
respondents believe that the qualification of employees is satisfactory. As the figure above also
suggests, the qualification and the productivity of employees are rated similarly.
Average monthly wages in Azerbaijan tripled in the last ten years, subsequently raising the cost of
labour. In addition, following a new law adopted in May 2010, all employers have to insure their
employees against occupational accidents and diseases. Although labour costs have thus consistently
increased (in AZN terms) during the last six years, more than half of respondents rate labour costs as
average.
Figure 4.3: Average monthly wages

EU Business Climate Survey Azerbaijan 2016
18
Figure 4.4: Conditions in the labour market: Oil vs. non-oil companies
Qualification
Productivity
Labour costs
Skilled workers
Labour law
Academic education
Immigration policies
Vocational training
Oil Non-oil
Very
unsatisfactory Unsatisfactory Average Satisfactory Very
satisfactory
Interestingly, compared to their peers in the non-oil sector with current labour costs in the market than
their peers in the non-oil sector.
The education system in Azerbaijan needs serious reforms
Neither the quality of academic education nor the vocational education and training system comply with
the expectations of respondents. A recent decree by the President (dated April 22, 2016) establishing the
State Agency for Vocational Education and Training (VET) under the Ministry of Education signals that the
government deems the modernisation of its VET system and the supply of a skilled workforce as one of its
priorities.
Considering that the satisfaction rate with the availability of skilled workers is merely 32%, the local
education and training system requires a comprehensive approach and profound reforms in the near
future. On the one hand, this includes legislative and institutional improvements; on the other hand, the
attitude of the population towards vocational training also needs to change.
Inflexible immigration policies may impede foreign investments
Foreign employees working in Azerbaijan (except those who have an employment contract with a legal
entity of a foreign country and fulfil their labour duties in a branch or representative office)8 are subject to
the Azerbaijani labour law; and they asses it mainly as average. In this context, half of respondents are
dissatisfied with immigration policies, which refers to visa regulations and work permits for foreigners. As
also emphasized during the interviews with selected EU business leaders, this is one of the main
barriers to conducting effective business operations in Azerbaijan.
8 Baker McKenzie, Doing Business in Azerbaijan, 2016

EU Business Climate Survey Azerbaijan 2016
19
1
2
3
4
5LPI overall
InternationalShipments
Timeliness
CustomsLogistics
competence
Infrastructure
Tracking andtracing
2012 2014
1
2
3
4
5LPI overall
InternationalShipments
Timeliness
CustomsLogistics
competence
Infrastructure
Tracking andtracing
AZE 2014 EU&Central Asia 2014
25%
38%
45%
51%
59%
51%
45%
44%
40%
30%
25%
17%
11%
9%
11%
Infrastructure
Payment discipline
Access to capital
Local suppliers
Research and
Development
Unsatisfactory Average Satisfactory
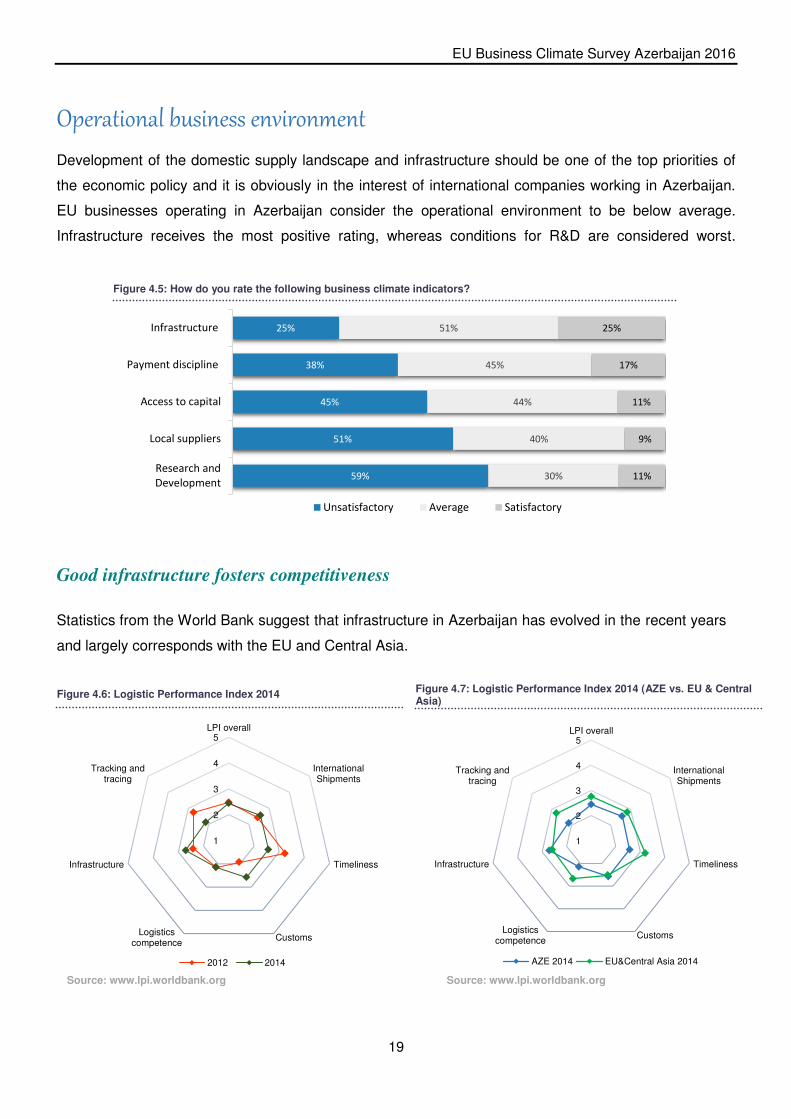
Operational business environment
Development of the domestic supply landscape and infrastructure should be one of the top priorities of
the economic policy and it is obviously in the interest of international companies working in Azerbaijan.
EU businesses operating in Azerbaijan consider the operational environment to be below average.
Infrastructure receives the most positive rating, whereas conditions for R&D are considered worst.
Good infrastructure fosters competitiveness
Statistics from the World Bank suggest that infrastructure in Azerbaijan has evolved in the recent years
and largely corresponds with the EU and Central Asia.
Figure 4.6: Logistic Performance Index 2014 Figure 4.7: Logistic Performance Index 2014 (AZE vs. EU & Central Asia)
Figure 4.5: How do you rate the following business climate indicators?
Source: www.lpi.worldbank.org Source: www.lpi.worldbank.org
EU Business Climate Survey Azerbaijan 2016
20
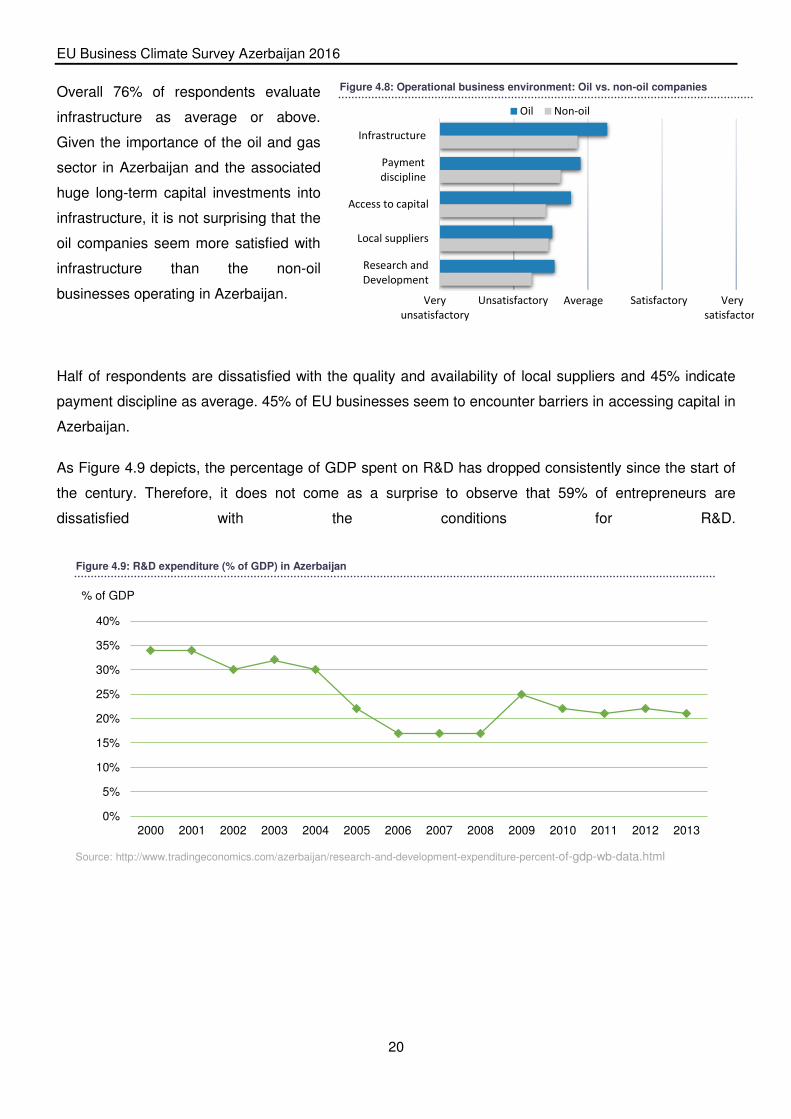
Figure 4.8: Operational business environment: Oil vs. non-oil companies
Source: http://www.tradingeconomics.com/azerbaijan/research-and-development-expenditure-percent-of-gdp-wb-data.html
0%
5%
10%
15%
20%
25%
30%
35%
40%
2000 2001 2002 2003 2004 2005 2006 2007 2008 2009 2010 2011 2012 2013
% of GDP
Figure 4.9: R&D expenditure (% of GDP) in Azerbaijan
Infrastructure
Payment
discipline
Access to capital
Local suppliers
Research and
Development
Oil Non-oil
Very
unsatisfactory
Unsatisfactory Average Satisfactory Very
satisfactory
Overall 76% of respondents evaluate
infrastructure as average or above.
Given the importance of the oil and gas
sector in Azerbaijan and the associated
huge long-term capital investments into
infrastructure, it is not surprising that the
oil companies seem more satisfied with
infrastructure than the non-oil
businesses operating in Azerbaijan.
Half of respondents are dissatisfied with the quality and availability of local suppliers and 45% indicate
payment discipline as average. 45% of EU businesses seem to encounter barriers in accessing capital in
Azerbaijan.
As Figure 4.9 depicts, the percentage of GDP spent on R&D has dropped consistently since the start of
the century. Therefore, it does not come as a surprise to observe that 59% of entrepreneurs are
dissatisfied with the conditions for R&D.
EU Business Climate Survey Azerbaijan 2016
21
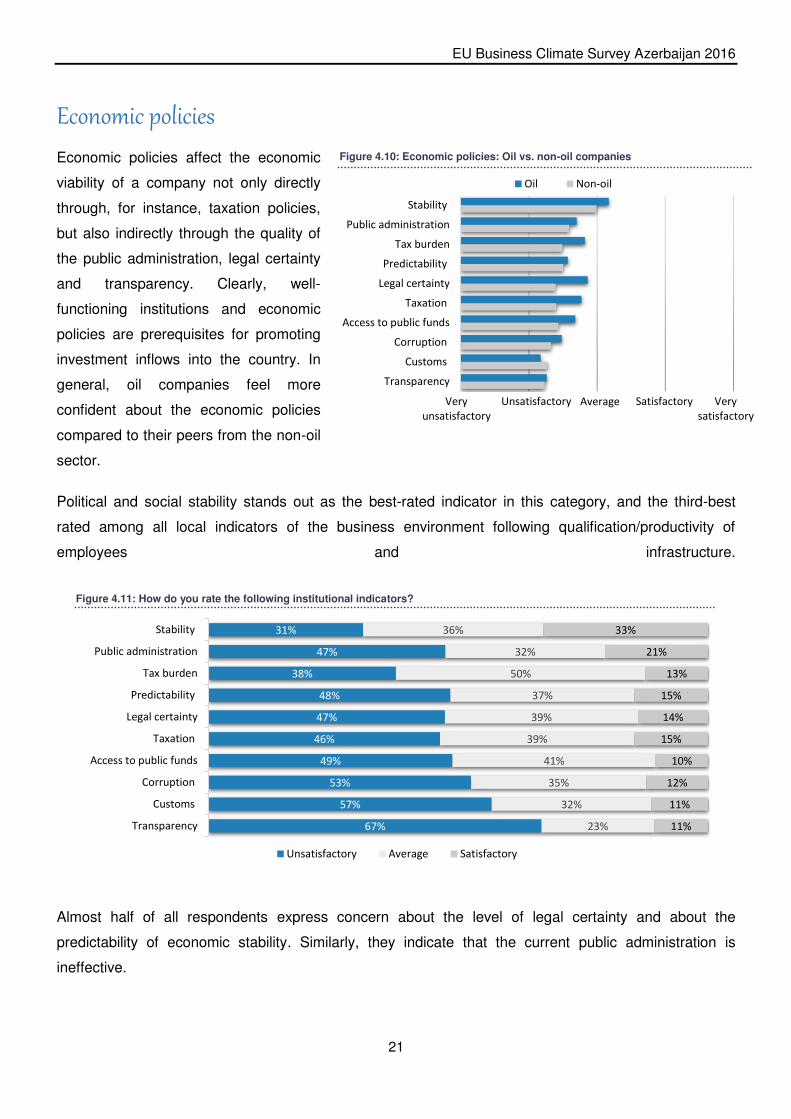
Figure 4.10: Economic policies: Oil vs. non-oil companies
Figure 4.11: How do you rate the following institutional indicators?
Stability
Public administration
Tax burden
Predictability
Legal certainty
Taxation
Access to public funds
Corruption
Customs
Transparency
Oil Non-oil
Very
unsatisfactory
Unsatisfactory Average Satisfactory Very
satisfactory
31%
47%
38%
48%
47%
46%
49%
53%
57%
67%
36%
32%
50%
37%
39%
39%
41%
35%
32%
23%
33%
21%
13%
15%
14%
15%
10%
12%
11%
11%
Stability
Public administration
Tax burden
Predictability
Legal certainty
Taxation
Access to public funds
Corruption
Customs
Transparency
Unsatisfactory Average Satisfactory
Economic policies
Economic policies affect the economic
viability of a company not only directly
through, for instance, taxation policies,
but also indirectly through the quality of
the public administration, legal certainty
and transparency. Clearly, well-
functioning institutions and economic
policies are prerequisites for promoting
investment inflows into the country. In
general, oil companies feel more
confident about the economic policies
compared to their peers from the non-oil
sector.
Political and social stability stands out as the best-rated indicator in this category, and the third-best
rated among all local indicators of the business environment following qualification/productivity of
employees and infrastructure.
Almost half of all respondents express concern about the level of legal certainty and about the
predictability of economic stability. Similarly, they indicate that the current public administration is
ineffective.
EU Business Climate Survey Azerbaijan 2016
22
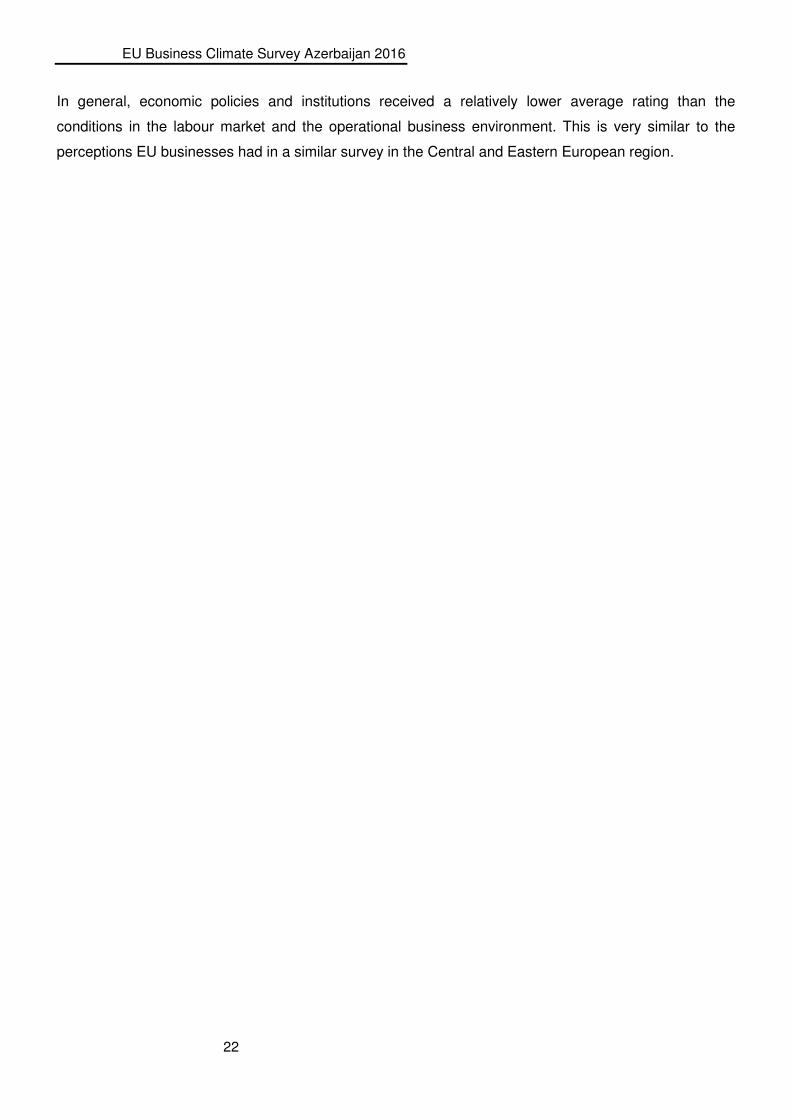
In general, economic policies and institutions received a relatively lower average rating than the
conditions in the labour market and the operational business environment. This is very similar to the
perceptions EU businesses had in a similar survey in the Central and Eastern European region.
EU Business Climate Survey Azerbaijan 2016
23
Figure 4.13: Exchange Rate (AZN vis-à-vis USD)
Figure 4.12: Economic policy indicators: Azerbaijan vs. CEE
0.0
0.2
0.4
0.6
0.8
1.0
1.2
1.4
2014 2015 2016
Stability
Public administration
Tax burden
Predictability
Legal certainty
Taxation
Access to public funds
Corruption
Transparency
Azerbaijan CEE
Very
unsatisfactory Unsatisfactory Average Satisfactory Very
satisfactory
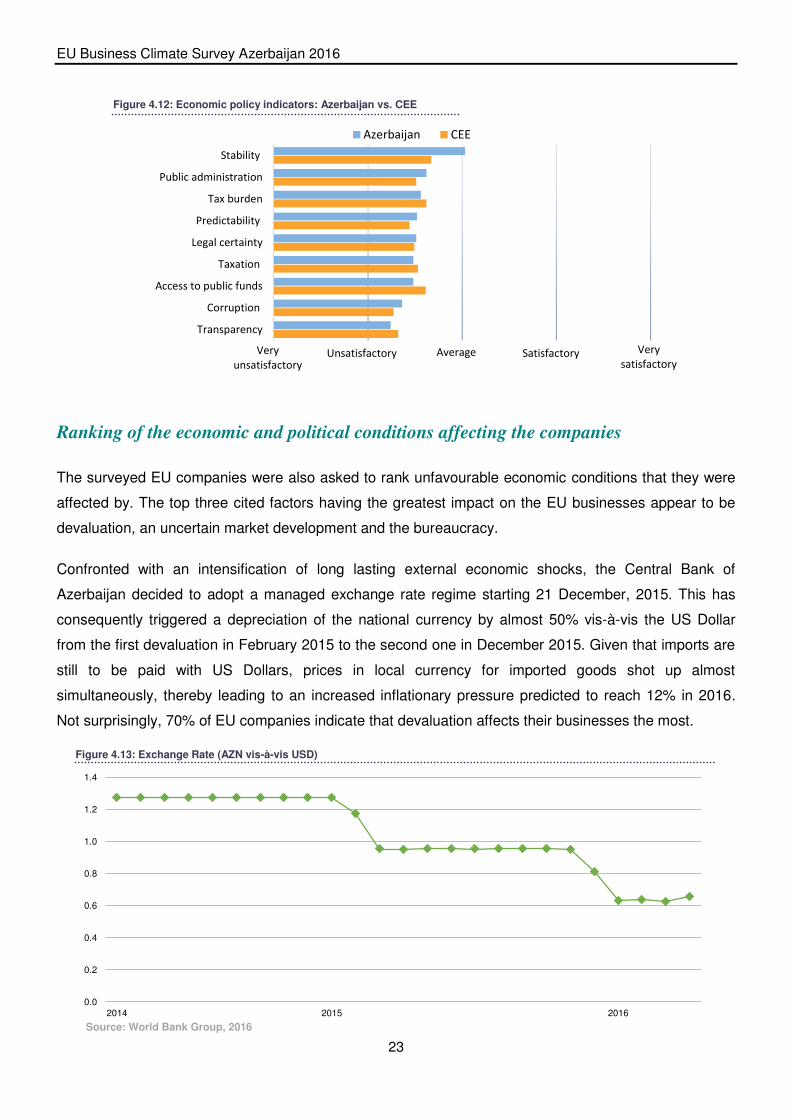
Ranking of the economic and political conditions affecting the companies
The surveyed EU companies were also asked to rank unfavourable economic conditions that they were
affected by. The top three cited factors having the greatest impact on the EU businesses appear to be
devaluation, an uncertain market development and the bureaucracy.
Confronted with an intensification of long lasting external economic shocks, the Central Bank of
Azerbaijan decided to adopt a managed exchange rate regime starting 21 December, 2015. This has
consequently triggered a depreciation of the national currency by almost 50% vis-à-vis the US Dollar
from the first devaluation in February 2015 to the second one in December 2015. Given that imports are
still to be paid with US Dollars, prices in local currency for imported goods shot up almost
simultaneously, thereby leading to an increased inflationary pressure predicted to reach 12% in 2016.
Not surprisingly, 70% of EU companies indicate that devaluation affects their businesses the most.
Source: World Bank Group, 2016
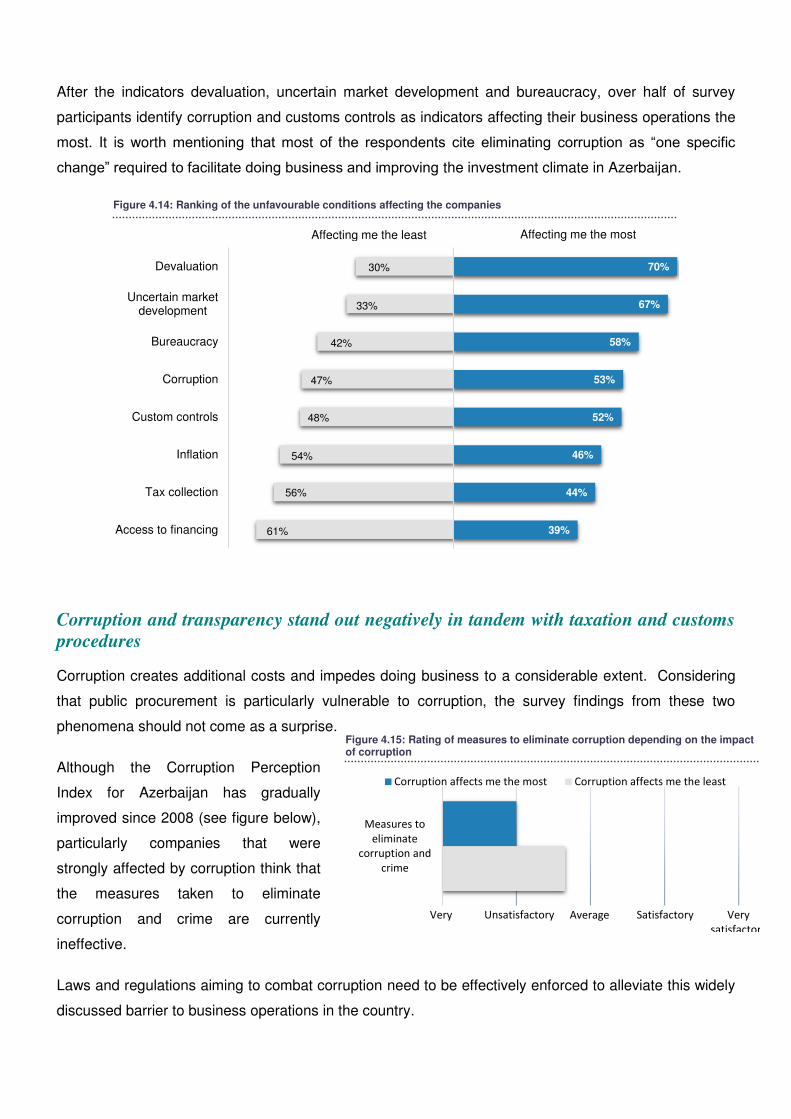
Figure 4.14: Ranking of the unfavourable conditions affecting the companies
70%
67%
58%
53%
52%
46%
44%
39%
Devaluation
Uncertain marketdevelopment
Bureaucracy
Corruption
Custom controls
Inflation
Tax collection
Access to financing
Affecting me the least Affecting me the most
30%
61%
56%
54%
48%
47%
42%
33%
Figure 4.15: Rating of measures to eliminate corruption depending on the impact of corruption
Measures to
eliminate
corruption and
crime
Corruption affects me the most Corruption affects me the least
Very Unsatisfactory Average Satisfactory Very
satisfactory
After the indicators devaluation, uncertain market development and bureaucracy, over half of survey
participants identify corruption and customs controls as indicators affecting their business operations the
most. It is worth mentioning that most of the respondents cite eliminating corruption as “one specific
change” required to facilitate doing business and improving the investment climate in Azerbaijan.
Corruption and transparency stand out negatively in tandem with taxation and customs
procedures
Corruption creates additional costs and impedes doing business to a considerable extent. Considering
that public procurement is particularly vulnerable to corruption, the survey findings from these two
phenomena should not come as a surprise.
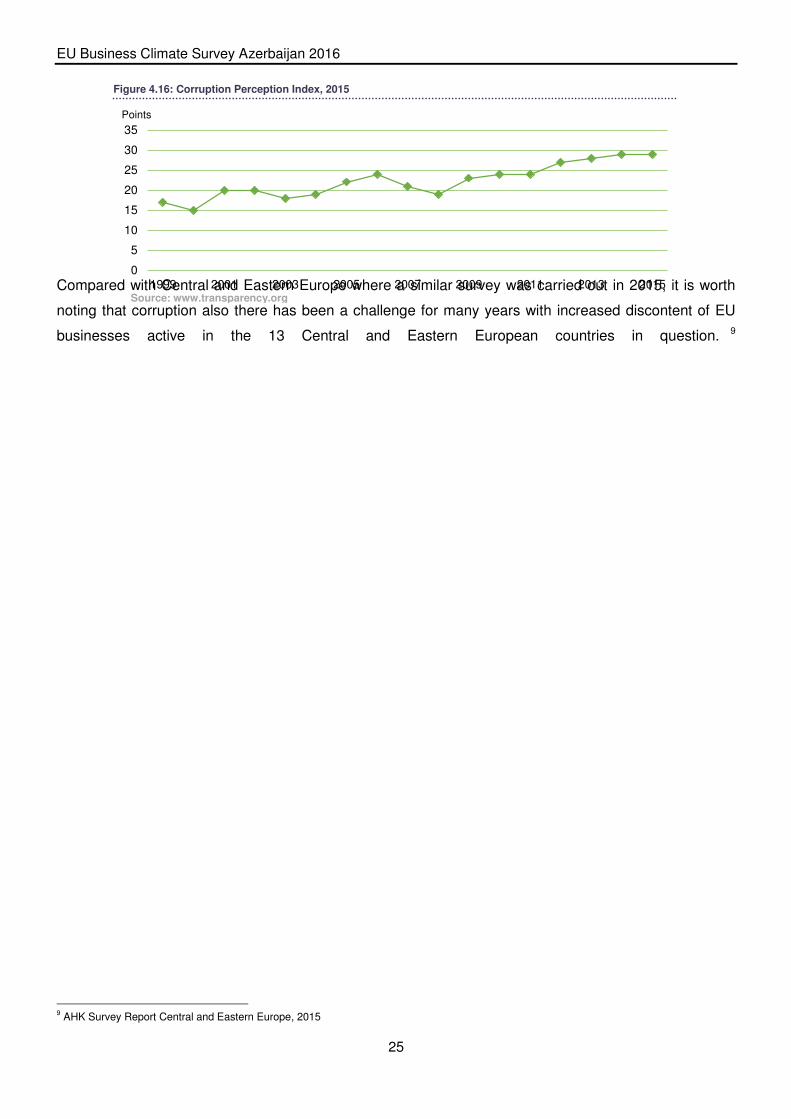
Although the Corruption Perception
Index for Azerbaijan has gradually
improved since 2008 (see figure below),
particularly companies that were
strongly affected by corruption think that
the measures taken to eliminate
corruption and crime are currently
ineffective.
Laws and regulations aiming to combat corruption need to be effectively enforced to alleviate this widely
discussed barrier to business operations in the country.
EU Business Climate Survey Azerbaijan 2016
25
0
5
10
15
20
25
30
35
1999 2001 2003 2005 2007 2009 2011 2013 2015
Points
Source: www.transparency.org
Compared with Central and Eastern Europe where a similar survey was carried out in 2015, it is worth
noting that corruption also there has been a challenge for many years with increased discontent of EU
businesses active in the 13 Central and Eastern European countries in question. 9
9 AHK Survey Report Central and Eastern Europe, 2015
Figure 4.16: Corruption Perception Index, 2015
EU Business Climate Survey Azerbaijan 2016
26
Figure 4.18: Rating of customs procedures depending on the impact of customs
Figure 4.17: Rating of taxation policies depending on the impact of taxes
Rating of
Taxation policy
and authorities
Taxes affect me the most Taxes affect me the least
Very
unsatisfactory
Unsatisfactory Average Satisfactory Very
satisfactory
Customs
procedures and
regulations
Customs affect me the most Customs affect me the least
Very
unsatisfactory Unsatisfactory Average Satisfactory Very
satisfactory
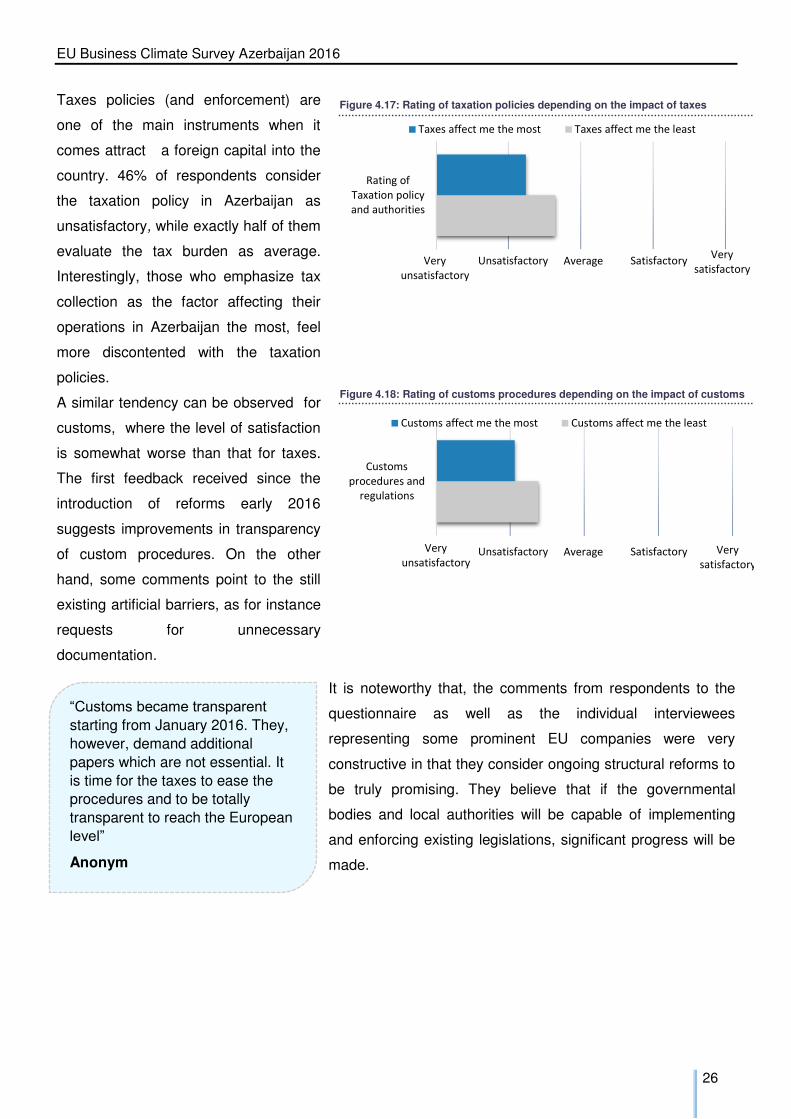
Taxes policies (and enforcement) are
one of the main instruments when it
comes attract a foreign capital into the
country. 46% of respondents consider
the taxation policy in Azerbaijan as
unsatisfactory, while exactly half of them
evaluate the tax burden as average.
Interestingly, those who emphasize tax
collection as the factor affecting their
operations in Azerbaijan the most, feel
more discontented with the taxation
policies.
A similar tendency can be observed for
customs, where the level of satisfaction
is somewhat worse than that for taxes.
The first feedback received since the
introduction of reforms early 2016
suggests improvements in transparency
of custom procedures. On the other
hand, some comments point to the still
existing artificial barriers, as for instance
requests for unnecessary
documentation.
It is noteworthy that, the comments from respondents to the
questionnaire as well as the individual interviewees
representing some prominent EU companies were very
constructive in that they consider ongoing structural reforms to
be truly promising. They believe that if the governmental
bodies and local authorities will be capable of implementing
and enforcing existing legislations, significant progress will be
made.
“Customs became transparent starting from January 2016. They,
however, demand additional
papers which are not essential. It
is time for the taxes to ease the procedures and to be totally
transparent to reach the European
level”
Anonym

EU Business Climate Survey Azerbaijan 2016
27
EU Business Climate Survey Azerbaijan 2016
28
05
Azerbaijan as an
Investment
Destination
The trend of declining non-oil investments
would need to be addressed by taking structural
reform measures that would transform the
economy into a private sector led growth model.
29
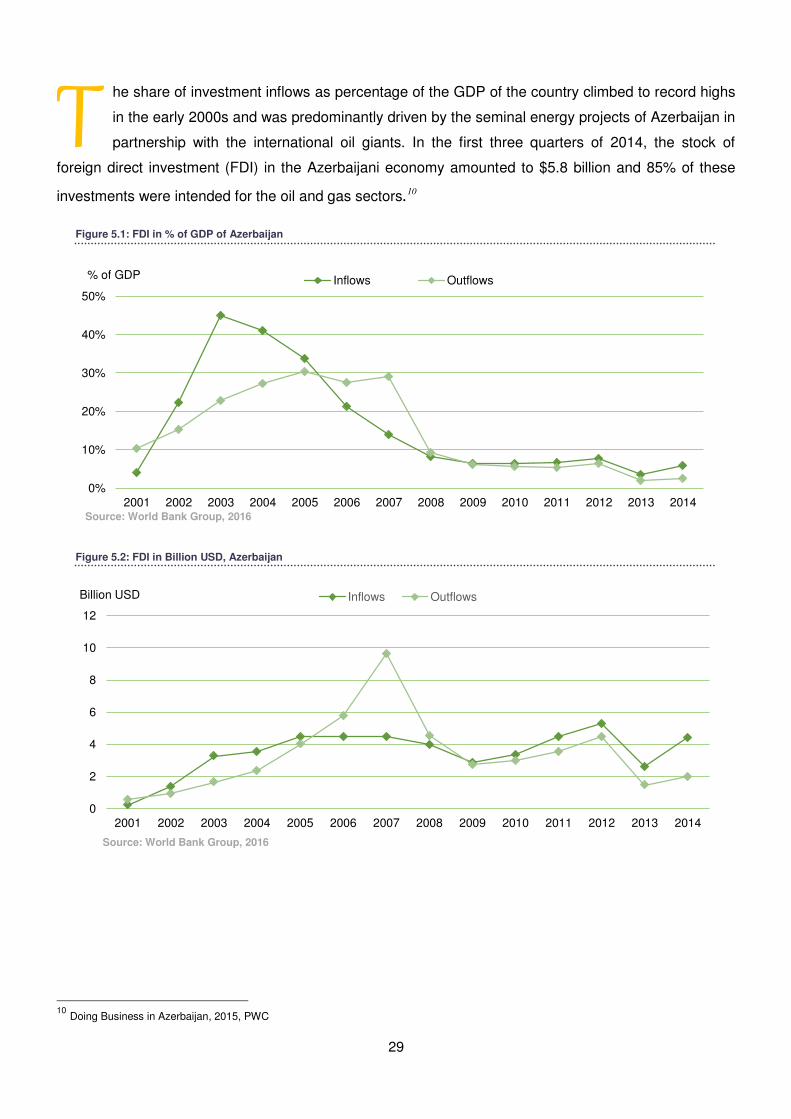
Figure 5.1: FDI in % of GDP of Azerbaijan
Figure 5.2: FDI in Billion USD, Azerbaijan
0%
10%
20%
30%
40%
50%
2001 2002 2003 2004 2005 2006 2007 2008 2009 2010 2011 2012 2013 2014
% of GDP Inflows Outflows
0
2
4
6
8
10
12
2001 2002 2003 2004 2005 2006 2007 2008 2009 2010 2011 2012 2013 2014
Billion USD Inflows Outflows
he share of investment inflows as percentage of the GDP of the country climbed to record highs
in the early 2000s and was predominantly driven by the seminal energy projects of Azerbaijan in
partnership with the international oil giants. In the first three quarters of 2014, the stock of
foreign direct investment (FDI) in the Azerbaijani economy amounted to $5.8 billion and 85% of these
investments were intended for the oil and gas sectors.10
10
Doing Business in Azerbaijan, 2015, PWC
T
Source: World Bank Group, 2016
Source: World Bank Group, 2016

EU Business Climate Survey Azerbaijan 2016
29
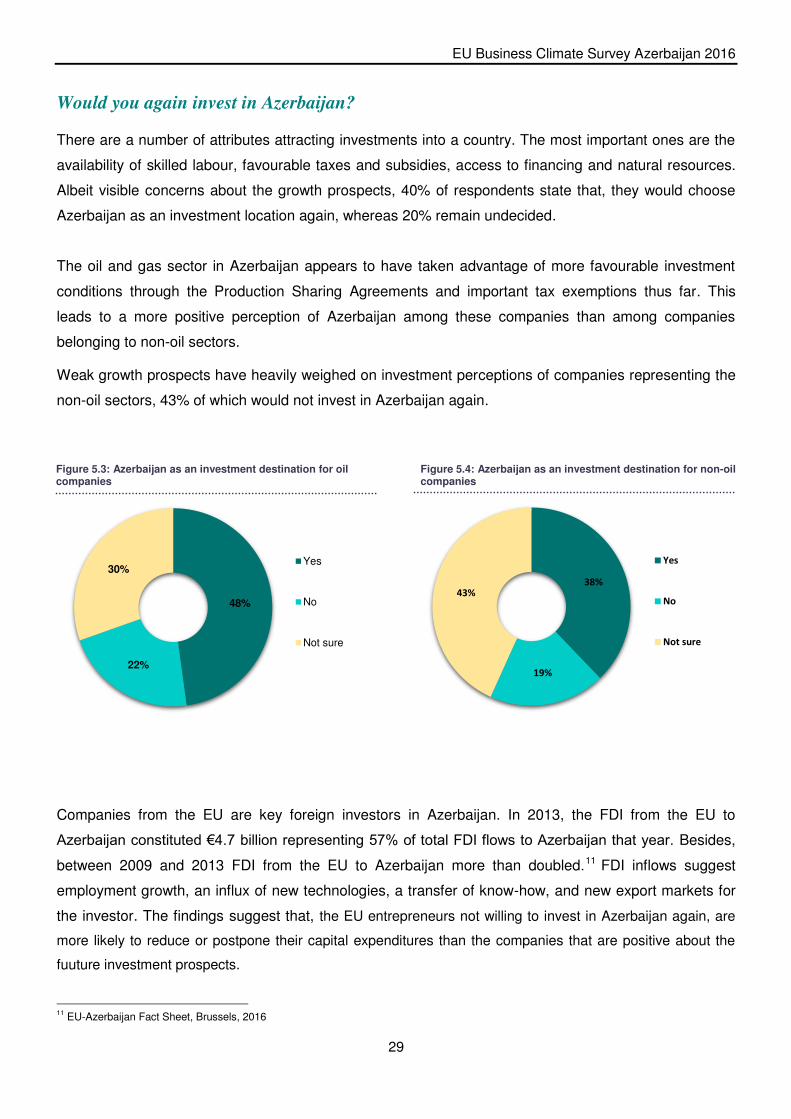
Figure 5.3: Azerbaijan as an investment destination for oil companies
Figure 5.4: Azerbaijan as an investment destination for non-oil companies
48%
22%
30% Yes
No
Not sure
38%
19%
43%
Yes
No
Not sure
Would you again invest in Azerbaijan?
There are a number of attributes attracting investments into a country. The most important ones are the
availability of skilled labour, favourable taxes and subsidies, access to financing and natural resources.
Albeit visible concerns about the growth prospects, 40% of respondents state that, they would choose
Azerbaijan as an investment location again, whereas 20% remain undecided.
The oil and gas sector in Azerbaijan appears to have taken advantage of more favourable investment
conditions through the Production Sharing Agreements and important tax exemptions thus far. This
leads to a more positive perception of Azerbaijan among these companies than among companies
belonging to non-oil sectors.
Weak growth prospects have heavily weighed on investment perceptions of companies representing the
non-oil sectors, 43% of which would not invest in Azerbaijan again.
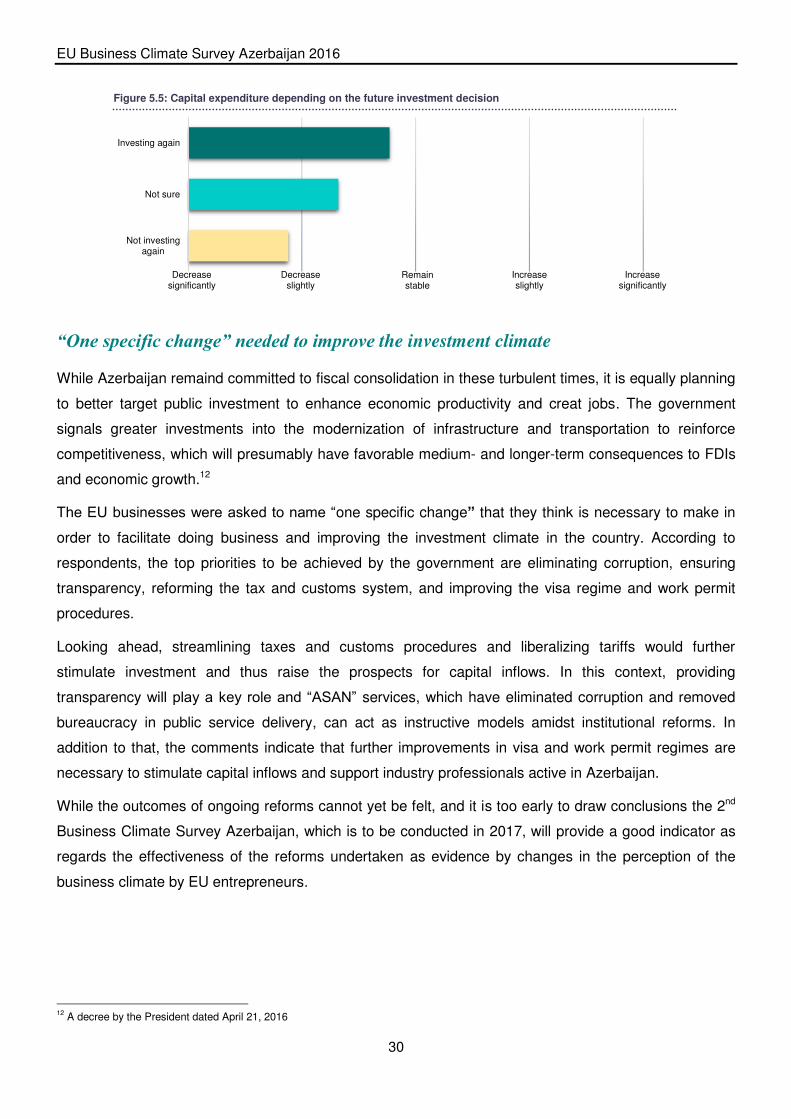
Companies from the EU are key foreign investors in Azerbaijan. In 2013, the FDI from the EU to
Azerbaijan constituted €4.7 billion representing 57% of total FDI flows to Azerbaijan that year. Besides,
between 2009 and 2013 FDI from the EU to Azerbaijan more than doubled.11 FDI inflows suggest
employment growth, an influx of new technologies, a transfer of know-how, and new export markets for
the investor. The findings suggest that, the EU entrepreneurs not willing to invest in Azerbaijan again, are
more likely to reduce or postpone their capital expenditures than the companies that are positive about the
fuuture investment prospects.
11 EU-Azerbaijan Fact Sheet, Brussels, 2016
EU Business Climate Survey Azerbaijan 2016
30
Figure 5.5: Capital expenditure depending on the future investment decision
Investing again
Not sure
Not investingagain
Decrease significantly
Decrease slightly
Remain stable
Increase slightly
Increase significantly
“One specific change” needed to improve the investment climate
While Azerbaijan remaind committed to fiscal consolidation in these turbulent times, it is equally planning
to better target public investment to enhance economic productivity and creat jobs. The government
signals greater investments into the modernization of infrastructure and transportation to reinforce
competitiveness, which will presumably have favorable medium- and longer-term consequences to FDIs
and economic growth.12
The EU businesses were asked to name “one specific change” that they think is necessary to make in
order to facilitate doing business and improving the investment climate in the country. According to
respondents, the top priorities to be achieved by the government are eliminating corruption, ensuring
transparency, reforming the tax and customs system, and improving the visa regime and work permit
procedures.
Looking ahead, streamlining taxes and customs procedures and liberalizing tariffs would further
stimulate investment and thus raise the prospects for capital inflows. In this context, providing
transparency will play a key role and “ASAN” services, which have eliminated corruption and removed
bureaucracy in public service delivery, can act as instructive models amidst institutional reforms. In
addition to that, the comments indicate that further improvements in visa and work permit regimes are
necessary to stimulate capital inflows and support industry professionals active in Azerbaijan.
While the outcomes of ongoing reforms cannot yet be felt, and it is too early to draw conclusions the 2nd
Business Climate Survey Azerbaijan, which is to be conducted in 2017, will provide a good indicator as
regards the effectiveness of the reforms undertaken as evidence by changes in the perception of the
business climate by EU entrepreneurs.
12 A decree by the President dated April 21, 2016
EU Business Climate Survey Azerbaijan 2016
31
Appendix
Methodology and Analysis
1. About the Survey and Report
In early 2016 the German-Azerbaijani Chamber of Commerce (AHK) conducted among EU businesses and
with the support of the Eurochambres and the EU Delegation to Azerbaijan the first-ever Business Climate
Survey Azerbaijan. It is designed to reflect the assessment of EU companies being active in Azerbaijan and is
based not only on historical conditions but also on expectations about conditions prevailing over the next
year. The questionnaire could be filled in from 1 March till 8 April 2016. The survey is based on the written
questionnaire which was distributed online via SurveyMonkey, and which was strictly anonymous. It was
circulated to over 300 companies representing 19 EU countries. With 100 complete responses the AHK
Azerbaijan could reach a response rate of nearly 30%. Added to that, 78 responses were partially filled in,
and unfortunately these results could not be used for the survey report.
To support the survey results, the AHK Azerbaijan organized seven interviews with companies representing
important sectors of the Azerbaijani economy.
The questionnaire consisted of three parts, which were:
- Economic situation in Azerbaijan
- Impact of Azerbaijan’s economic situation and business environment on the company
- Company demographics
This survey particularly follows a similar survey conducted by the AHK Hungary in Central-Eastern European
countries in 2015 and uses similar indicators to examine the macroeconomic environment and investment
climate in Azerbaijan. Where possible the results of both surveys were compared to each other.
A connection between newly started reforms and the survey results was made throughout the report and
underlined with statistics of the World Bank and the State Statistical Committee of the Republic of Azerbaijan.
2. Calculations
The average numbers were calculated using the arithmetical mean.
EU Business Climate Survey Azerbaijan 2016
32
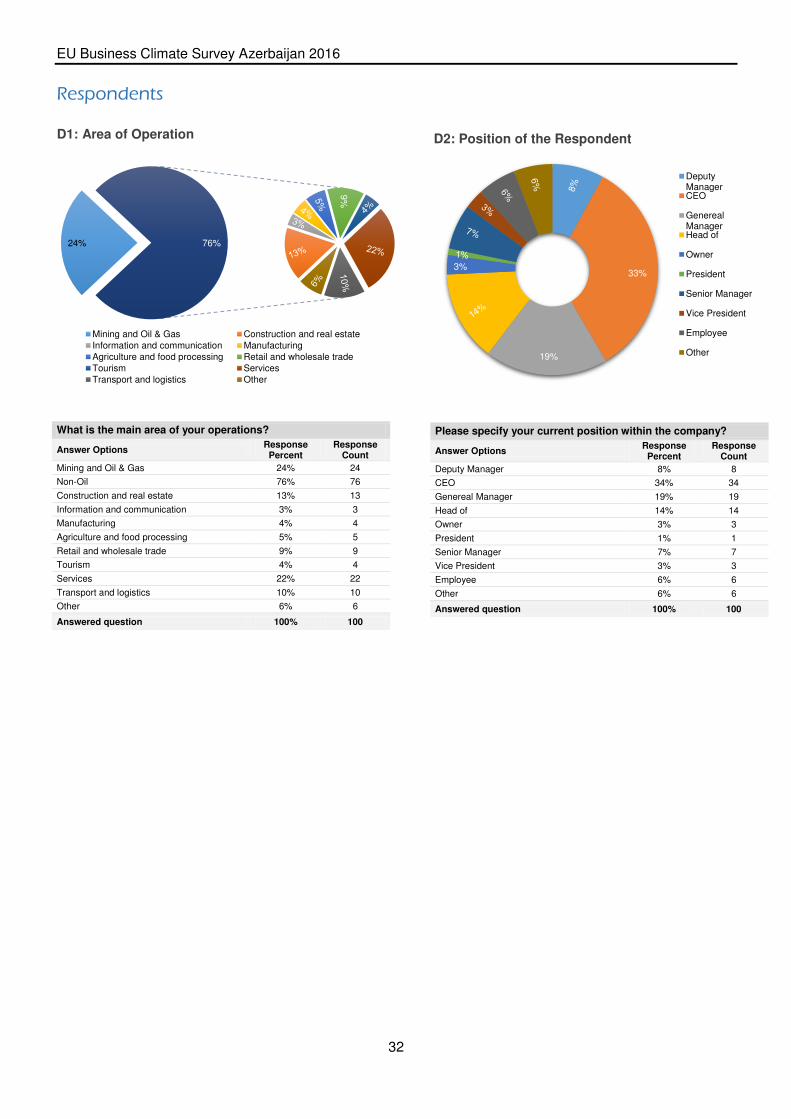
D2: Position of the Respondent
24%
9%
76%
Mining and Oil & Gas Construction and real estateInformation and communication ManufacturingAgriculture and food processing Retail and wholesale tradeTourism ServicesTransport and logistics Other
33%
19%
3%
DeputyManagerCEO
GenerealManagerHead of
Owner
President
Senior Manager
Vice President
Employee
Other
Respondents
What is the main area of your operations?
Answer Options Response Percent
Response Count
Mining and Oil & Gas 24% 24
Non-Oil 76% 76
Construction and real estate 13% 13
Information and communication 3% 3
Manufacturing 4% 4
Agriculture and food processing 5% 5
Retail and wholesale trade 9% 9
Tourism 4% 4
Services 22% 22
Transport and logistics 10% 10
Other 6% 6
Answered question 100% 100
Please specify your current position within the company?
Answer Options Response Percent
Response Count
Deputy Manager 8% 8
CEO 34% 34
Genereal Manager 19% 19
Head of 14% 14
Owner 3% 3
President 1% 1
Senior Manager 7% 7
Vice President 3% 3
Employee 6% 6
Other 6% 6
Answered question 100% 100
D1: Area of Operation

EU Business Climate Survey Azerbaijan 2016
33
D5: Legal Set-Up D6: Year of Establishment
32%
30%
21%
17%
1-9
10-49
50-249
250+
29%
10%
12% 18%
18%
13%
< 5T €
5T € - 1M €
1M € - 2M €
2M € - 10M €
10M € - 50M €
50M+ €
13%
49% 2%
27%
9% Joint stockcompany (JSC)
Limited liabilitycompany (LLC)
Partnership
Representativeoffice
Other
37%
18%
24%
21%
<1990
1990-2000
2001-2010
>2010
Please specify the number of employees in your company?
Answer Options Response Percent
Response Count
1-9 31,3% 31
10-49 30,3% 31
50-249 21,2% 21
250+ 17,2% 17
Answered question 100% 100
What is the total revenue of your company?
Answer Options Response Percent
Response Count
< 5T € 29% 29
5T € - 1M € 10% 10
1M € - 2M € 12% 12
2M € - 10M € 18% 18
10M € - 50M € 18% 18
50M+ € 13% 13
Answered question 100% 100
What is the legal set-up of your company?
Answer Options Response Percent
Response Count
Joint stock company (JSC) 13% 13
Limited liability company (LLC) 49% 49
Partnership 2% 2
Representative office 27% 27
Other 9% 9
Answered question 100% 100
When was your company established?
Answer Options Response Percent
Response Count
<1990 37% 37
1990-2000 18% 18
2001-2010 24% 24
>2010 21% 21
Answered question 100% 100
D3: Number of Employees D4: Revenue
EU Business Climate Survey Azerbaijan 2016
34
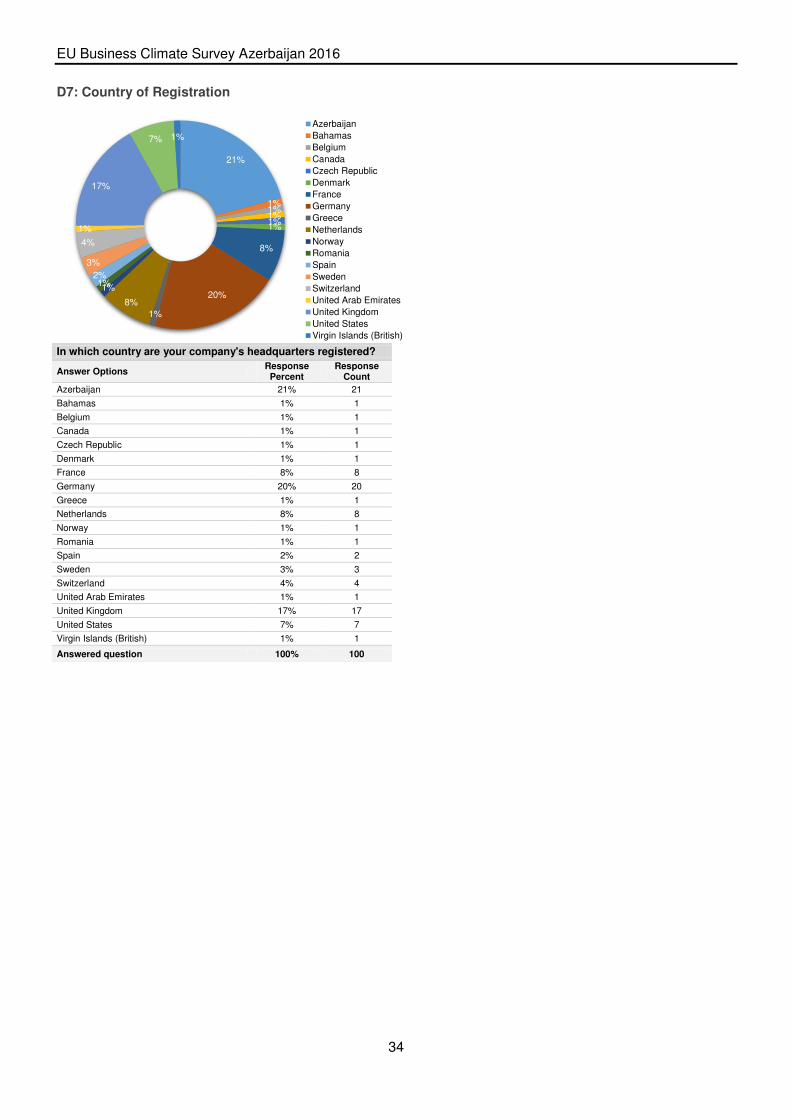
D7: Country of Registration
21%
1% 1% 1% 1% 1%
8%
20%
1%
8%
1% 1% 2%
3%
4%
1%
17%
7% 1%
Azerbaijan
Bahamas
Belgium
Canada
Czech Republic
Denmark
France
Germany
Greece
Netherlands
Norway
Romania
Spain
Sweden
Switzerland
United Arab Emirates
United Kingdom
United States
Virgin Islands (British)
In which country are your company's headquarters registered?
Answer Options Response Percent
Response Count
Azerbaijan 21% 21
Bahamas 1% 1
Belgium 1% 1
Canada 1% 1
Czech Republic 1% 1
Denmark 1% 1
France 8% 8
Germany 20% 20
Greece 1% 1
Netherlands 8% 8
Norway 1% 1
Romania 1% 1
Spain 2% 2
Sweden 3% 3
Switzerland 4% 4
United Arab Emirates 1% 1
United Kingdom 17% 17
United States 7% 7
Virgin Islands (British) 1% 1
Answered question 100% 100
EU Business Climate Survey Azerbaijan 2016
35
National economy Your sector Your company
Very weak Very Strong Strong Satisfactory Weak
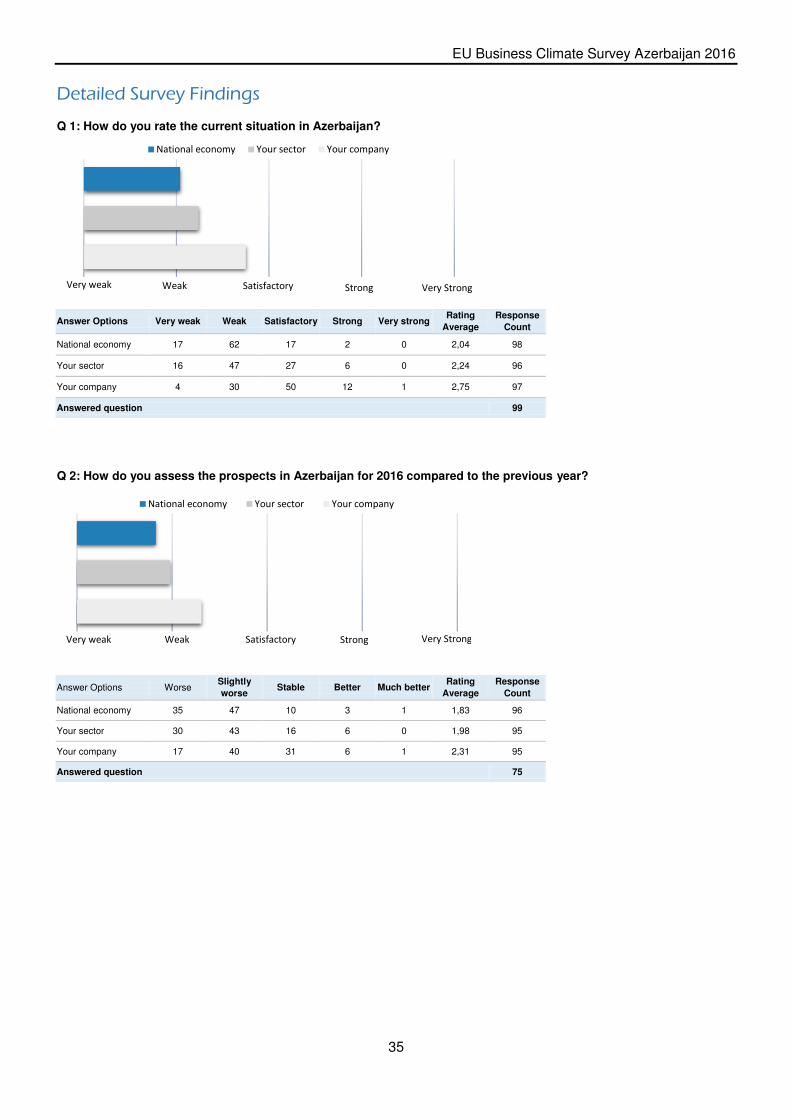
Q 1: How do you rate the current situation in Azerbaijan?
National economy Your sector Your company
Very weak Very Strong Strong Satisfactory Weak
Q 2: How do you assess the prospects in Azerbaijan for 2016 compared to the previous year?
Detailed Survey Findings
Answer Options Very weak Weak Satisfactory Strong Very strong Rating
Average
Response
Count
National economy 17 62 17 2 0 2,04 98
Your sector 16 47 27 6 0 2,24 96
Your company 4 30 50 12 1 2,75 97
Answered question 99
Answer Options Worse Slightly
worse Stable Better Much better
Rating
Average
Response
Count
National economy 35 47 10 3 1 1,83 96
Your sector 30 43 16 6 0 1,98 95
Your company 17 40 31 6 1 2,31 95
Answered question 75
EU Business Climate Survey Azerbaijan 2016
36
Revenues
Expenses
Exports
Imports
Number of employees
Capital expenditure
Decrease significantly
Decrease slightly
Remain stable
Increase slightly
Increase significantly
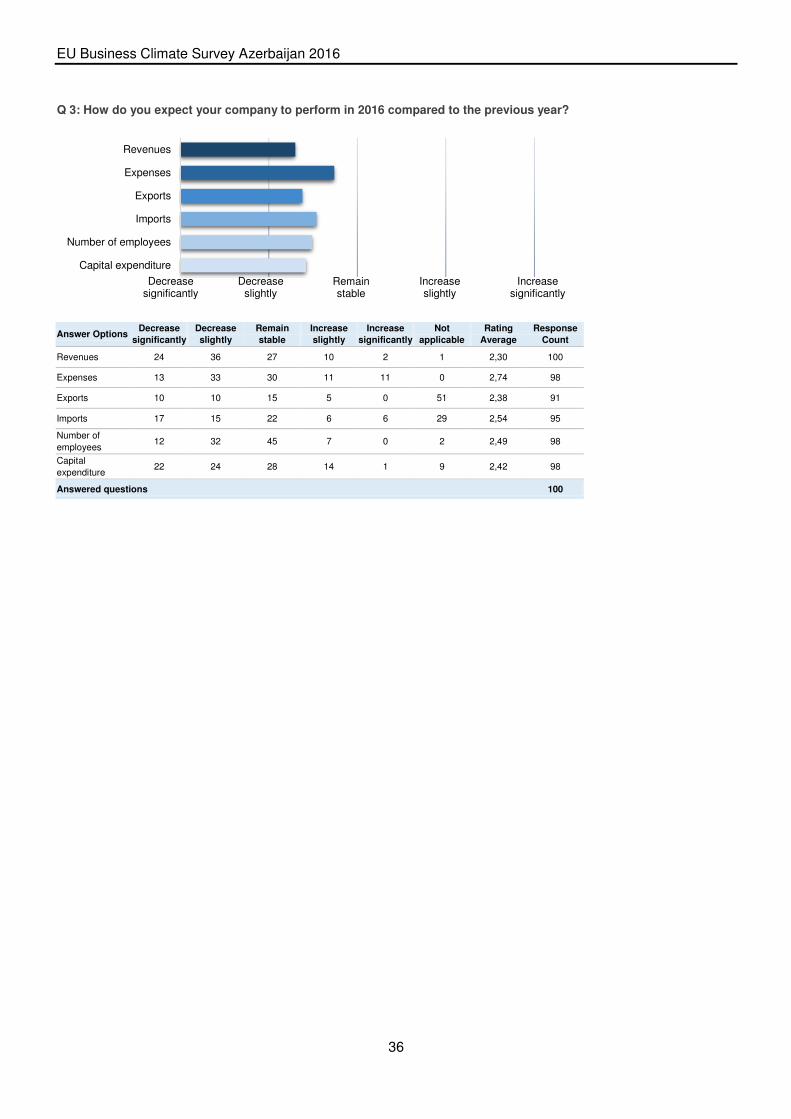
Q 3: How do you expect your company to perform in 2016 compared to the previous year?
Answer Options
Decrease
significantly
Decrease
slightly
Remain
stable
Increase
slightly
Increase
significantly
Not
applicable
Rating
Average
Response
Count
Revenues 24 36 27 10 2 1 2,30 100
Expenses 13 33 30 11 11 0 2,74 98
Exports 10 10 15 5 0 51 2,38 91
Imports 17 15 22 6 6 29 2,54 95
Number of
employees 12 32 45 7 0 2 2,49 98
Capital
expenditure 22 24 28 14 1 9 2,42 98
Answered questions 100
EU Business Climate Survey Azerbaijan 2016
37
Qualification and skills of employees
Commitment and productivity of employees
Labour costs
Political and social stability
Availability of skilled workers
Infrastructure
Flexibility of labour law
Payment discipline
Public administration
Tax burden
Quality and relevance of academic education
Access to capital
Predictability of economic policies
Legal certainty
Quality and availability of local suppliers
Access to public funds
Taxation policy and authorities
Flexibility of immigration policies
Measures to eliminate corruption and crime
Quality and relevance of vocational training
Conditions for Research and Development
Customs procedures and regulations
Transparency of public procurement
Very unsatisfactory
Unsatisfactory Average Satisfactory Very satisfactory
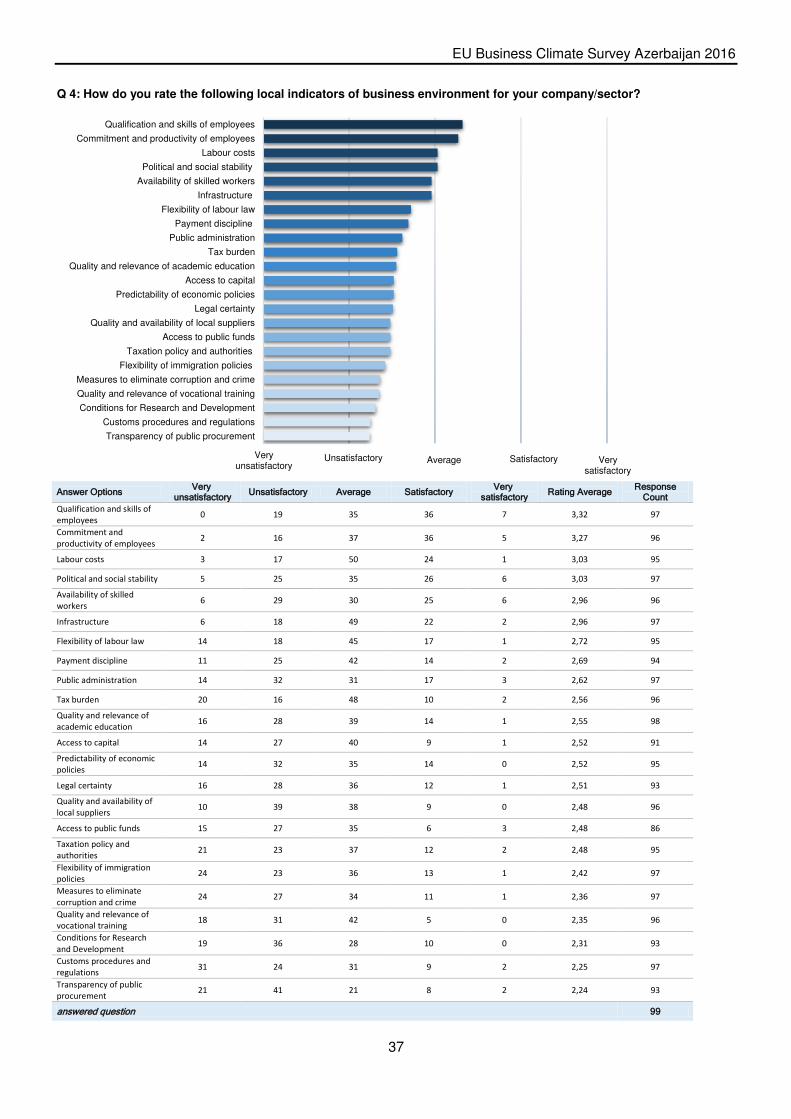
Q 4: How do you rate the following local indicators of business environment for your company/sector?
Answer Options Very
unsatisfactory Unsatisfactory Average Satisfactory
Very satisfactory
Rating Average Response
Count
Qualification and skills of
employees 0 19 35 36 7 3,32 97
Commitment and
productivity of employees 2 16 37 36 5 3,27 96
Labour costs 3 17 50 24 1 3,03 95
Political and social stability 5 25 35 26 6 3,03 97
Availability of skilled
workers 6 29 30 25 6 2,96 96
Infrastructure 6 18 49 22 2 2,96 97
Flexibility of labour law 14 18 45 17 1 2,72 95
Payment discipline 11 25 42 14 2 2,69 94
Public administration 14 32 31 17 3 2,62 97
Tax burden 20 16 48 10 2 2,56 96
Quality and relevance of
academic education 16 28 39 14 1 2,55 98
Access to capital 14 27 40 9 1 2,52 91
Predictability of economic
policies 14 32 35 14 0 2,52 95
Legal certainty 16 28 36 12 1 2,51 93
Quality and availability of
local suppliers 10 39 38 9 0 2,48 96
Access to public funds 15 27 35 6 3 2,48 86
Taxation policy and
authorities 21 23 37 12 2 2,48 95
Flexibility of immigration
policies 24 23 36 13 1 2,42 97
Measures to eliminate
corruption and crime 24 27 34 11 1 2,36 97
Quality and relevance of
vocational training 18 31 42 5 0 2,35 96
Conditions for Research
and Development 19 36 28 10 0 2,31 93
Customs procedures and
regulations 31 24 31 9 2 2,25 97
Transparency of public
procurement 21 41 21 8 2 2,24 93
answered question 99
EU Business Climate Survey Azerbaijan 2016
38
70%
67%
58%
53%
52%
46%
44%
39%
Devaluation
Uncertain marketdevelopment
Bureaucracy
Corruption
Custom controls
Inflation
Tax collection
Access to financing
Affecting the least Affecting the most
30%
61%
56%
54%
48%
47%
42%
33%
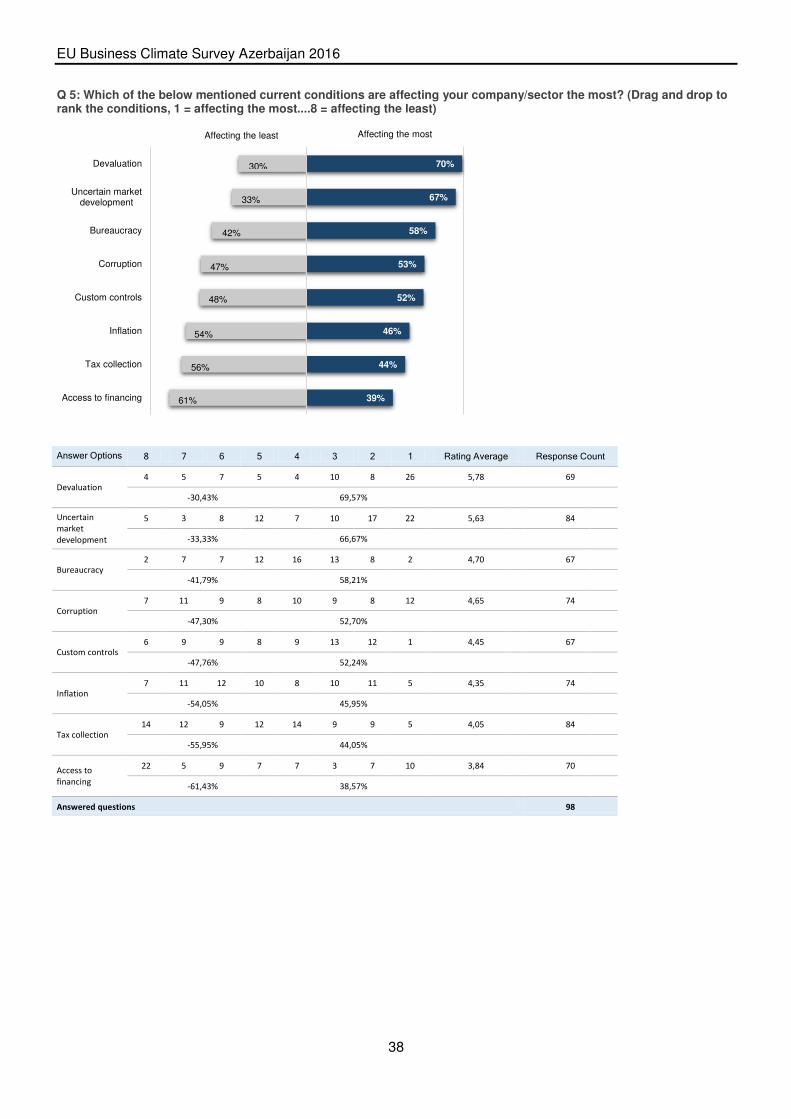
Q 5: Which of the below mentioned current conditions are affecting your company/sector the most? (Drag and drop to rank the conditions, 1 = affecting the most....8 = affecting the least)
Answer Options 8 7 6 5 4 3 2 1 Rating Average Response Count
Devaluation
4 5 7 5 4 10 8 26 5,78 69
-30,43% 69,57%
Uncertain
market
development
5 3 8 12 7 10 17 22 5,63 84
-33,33% 66,67%
Bureaucracy
2 7 7 12 16 13 8 2 4,70 67
-41,79% 58,21%
Corruption
7 11 9 8 10 9 8 12 4,65 74
-47,30% 52,70%
Custom controls 6 9 9 8 9 13 12 1 4,45 67
-47,76% 52,24%
Inflation
7 11 12 10 8 10 11 5 4,35 74
-54,05% 45,95%
Tax collection
14 12 9 12 14 9 9 5 4,05 84
-55,95% 44,05%
Access to
financing
22 5 9 7 7 3 7 10 3,84 70
-61,43% 38,57%
Answered questions 98
EU Business Climate Survey Azerbaijan 2016
39
40%
20%
40%
Yes
No
Not sure
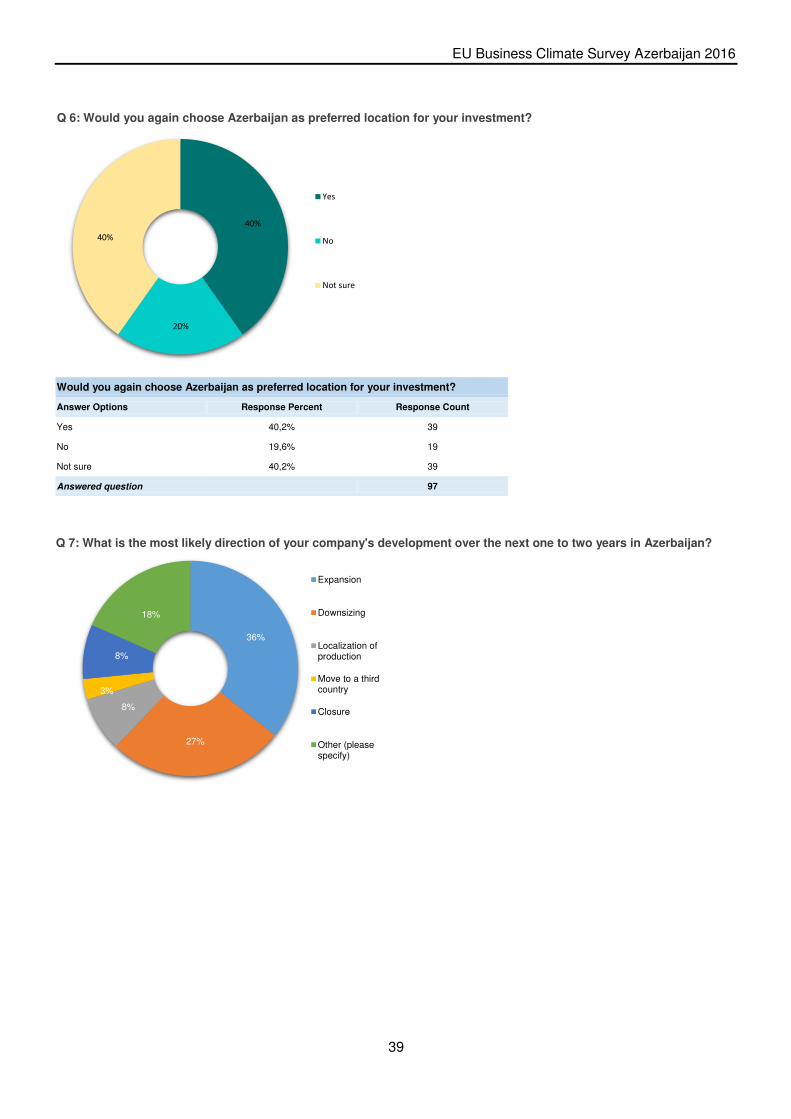
Q 6: Would you again choose Azerbaijan as preferred location for your investment?
36%
27%
8%
3%
8%
18%
Expansion
Downsizing
Localization ofproduction
Move to a thirdcountry
Closure
Other (pleasespecify)
Q 7: What is the most likely direction of your company's development over the next one to two years in Azerbaijan?
Would you again choose Azerbaijan as preferred location for your investment?
Answer Options Response Percent Response Count
Yes 40,2% 39
No 19,6% 19
Not sure 40,2% 39
Answered question 97

EU Business Climate Survey Azerbaijan 2016
40
Working group and contact persons
Nigar Bayramli ([email protected])
Writing and editorial
Research and data analysis Face-to-face interviews
Organisation of the Survey
Ali Ismailov ([email protected])
Graphics and design Research and data analysis
Face-to-face interviews
Organisation of the Survey
German-Azerbaijani Chamber of Commerce (AHK Azerbaijan)
Nigar Rafibeyli Str. 49
AZ 1005 Baku, Azerbaijan
tel: +994 (0) 12-4483995
www.ahk-baku.de
Disclaimer This document has been produced with the financial
assistance of the European Union. The contents of this
document are the sole responsibility of AHK Azerbaijan and can under no circumstances be regarded as
reflecting the position of the European Union.
Disclaimer This document has been produced with the financial
assistance of the European Union. The contents of this
document are the sole responsibility of AHK Azerbaijan and can under no circumstances be regarded as
reflecting the position of the European Union.