Embed Size (px)
Citation preview
TECHNICAL BULLETINCLIMATE RISK
TECHNICAL BULLETIN #: TB001-10182016
Sustainability Accounting Standards Board
ABOUT SASB
The Sustainability Accounting Standards Board (SASB) is an independent 501(c)(3) nonprofit orga-nization. SASB’s mission is to develop and disseminate sustainability accounting standards that help public corporations disclose material, decision-useful information to investors. That mission is accomplished through a rigorous process that includes evidence-based research and broad, balanced stakeholder participation. SASB standards are designed for the disclosure of material sustainability information in mandatory SEC filings, such as Form 10-K and 20-F. SASB develops and maintains sustainability accounting standards for 79 industries, focusing on the subset of industry-specific sustainability factors that are reasonably likely to have material impacts.
ABOUT THIS BULLETIN
This technical bulletin highlights findings related to climate risk arising from research conducted by SASB as part of its standards-setting process. The bulletin provides an overview of where climate-related risk is likely to be present in a typical portfolio, and what types of risk are present, along with the financial implications. It also summarizes the quality of existing disclosure on climate-related risk by SEC registrants. Using this bulletin, investors may better understand the nature of their risk exposures in each industry, as well as in which industries that risk is likely to be uncompensated due to inadequate disclosure in mandatory SEC filings.
Sustainability Accounting Standards Board 1045 Sansome Street, Suite 450 San Francisco CA 94111
(415) 830-9220 [email protected]
October 2016
CLIMATE RISKTECHNICAL BULLETINTB001-10182016
Copyright © 2016 Sustainability Accounting Standards Board. The information, text, and graphics in this publication (the “Content”) are owned by Sustainability Accounting Standards Board. All rights reserved. The Content may be used only for non-commercial or scholarly use, provided that all copyright and other proprietary notices related to the Content are kept intact, and that no modifications are made to the Content. The Content may not be otherwise disseminated, distributed, republished, reproduced, or modified without the prior written permission of Sustainability Accounting Standards Board. To request permission, please contact us at [email protected].
SASB wishes to thank the 2,800 participants in its industry working groups during development of the provisional-phase standards and numerous outside reviewers for their contributions to this document. SASB accepts full responsibility for errors or omissions.
SASB.ORG
CLIMATE RISK TECHNICAL BULLETIN TB001-10182016
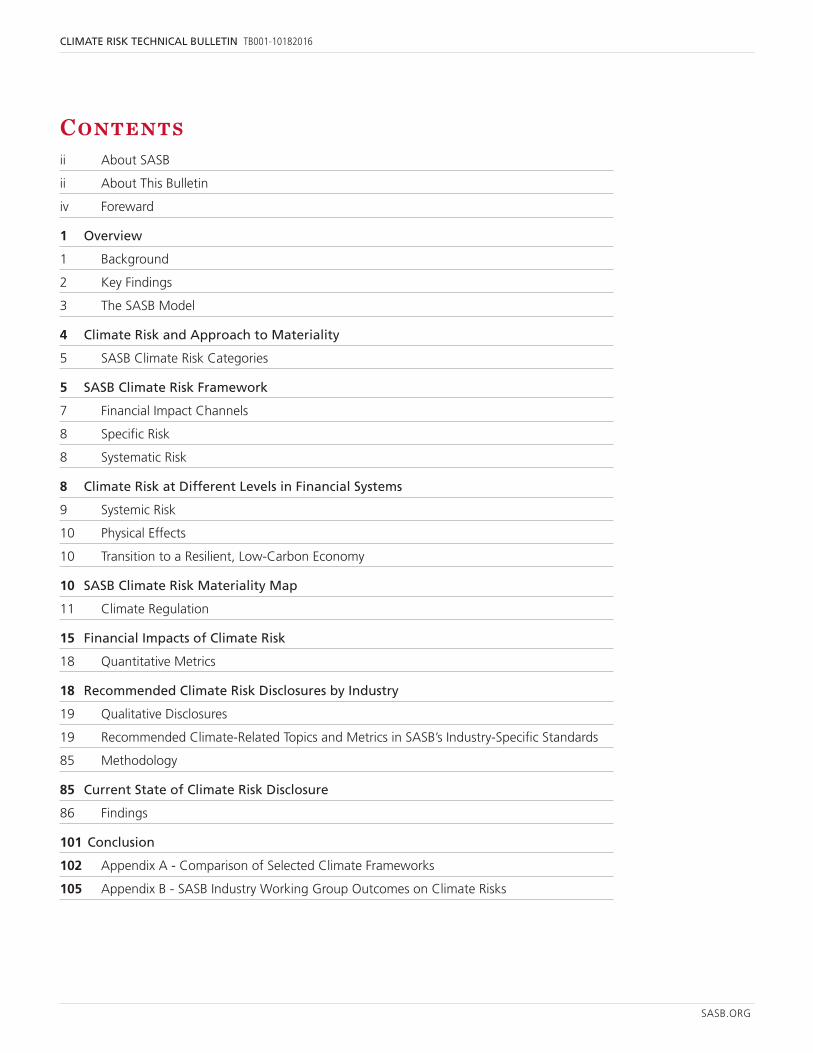
Contentsii About SASB
ii About This Bulletin
iv Foreward
1 Overview
1 Background
2 Key Findings
3 The SASB Model
4 Climate Risk and Approach to Materiality
5 SASB Climate Risk Categories
5 SASB Climate Risk Framework
7 Financial Impact Channels
8 Specific Risk
8 Systematic Risk
8 Climate Risk at Different Levels in Financial Systems
9 Systemic Risk
10 Physical Effects
10 Transition to a Resilient, Low-Carbon Economy
10 SASB Climate Risk Materiality Map
11 Climate Regulation
15 Financial Impacts of Climate Risk
18 Quantitative Metrics
18 Recommended Climate Risk Disclosures by Industry
19 Qualitative Disclosures
19 Recommended Climate-Related Topics and Metrics in SASB’s Industry-Specific Standards
85 Methodology
85 Current State of Climate Risk Disclosure
86 Findings
101 Conclusion
102 Appendix A - Comparison of Selected Climate Frameworks
105 Appendix B - SASB Industry Working Group Outcomes on Climate Risks
SASB.ORG
CLIMATE RISK TECHNICAL BULLETIN TB001-10182016
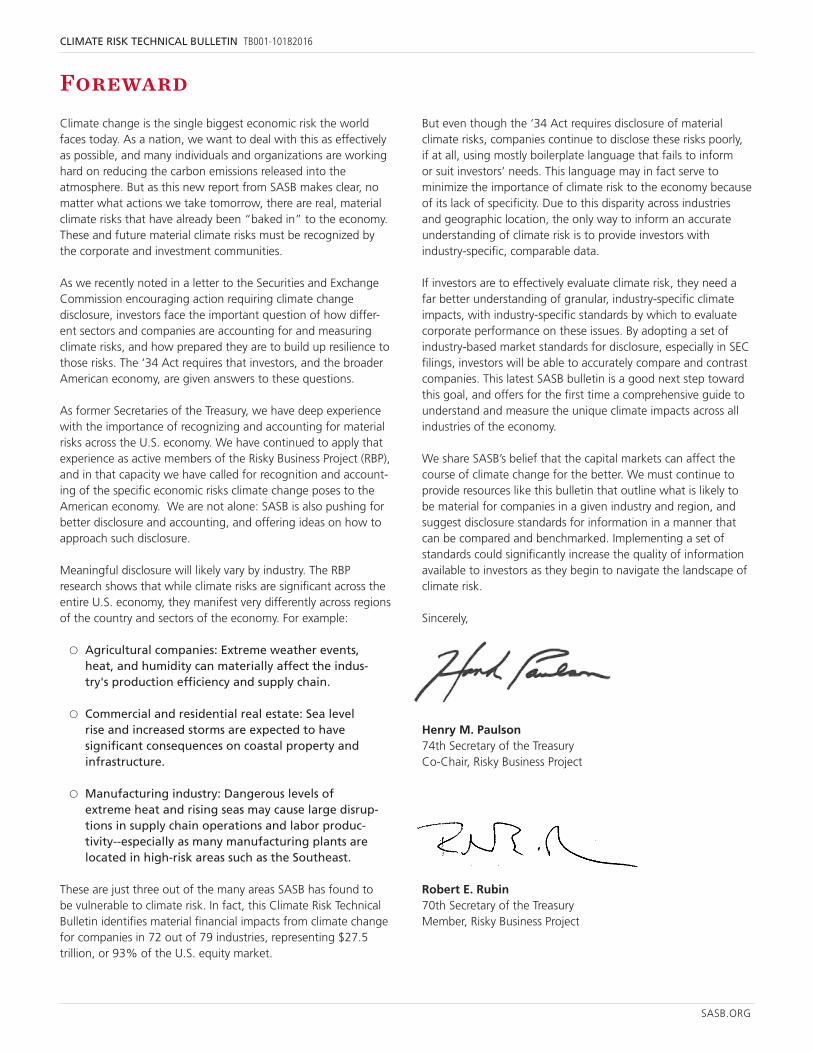
ForewardClimate change is the single biggest economic risk the world faces today. As a nation, we want to deal with this as effectively as possible, and many individuals and organizations are working hard on reducing the carbon emissions released into the atmosphere. But as this new report from SASB makes clear, no matter what actions we take tomorrow, there are real, material climate risks that have already been “baked in” to the economy. These and future material climate risks must be recognized by the corporate and investment communities.
As we recently noted in a letter to the Securities and Exchange Commission encouraging action requiring climate change disclosure, investors face the important question of how differ-ent sectors and companies are accounting for and measuring climate risks, and how prepared they are to build up resilience to those risks. The ‘34 Act requires that investors, and the broader American economy, are given answers to these questions.
As former Secretaries of the Treasury, we have deep experience with the importance of recognizing and accounting for material risks across the U.S. economy. We have continued to apply that experience as active members of the Risky Business Project (RBP), and in that capacity we have called for recognition and account-ing of the specific economic risks climate change poses to the American economy. We are not alone: SASB is also pushing for better disclosure and accounting, and offering ideas on how to approach such disclosure.
Meaningful disclosure will likely vary by industry. The RBP research shows that while climate risks are significant across the entire U.S. economy, they manifest very differently across regions of the country and sectors of the economy. For example:
ț Agricultural companies: Extreme weather events, heat, and humidity can materially affect the indus-try's production efficiency and supply chain.
ț Commercial and residential real estate: Sea level rise and increased storms are expected to have significant consequences on coastal property and infrastructure.
ț Manufacturing industry: Dangerous levels of extreme heat and rising seas may cause large disrup-tions in supply chain operations and labor produc-tivity--especially as many manufacturing plants are located in high-risk areas such as the Southeast.
These are just three out of the many areas SASB has found to be vulnerable to climate risk. In fact, this Climate Risk Technical Bulletin identifies material financial impacts from climate change for companies in 72 out of 79 industries, representing $27.5 trillion, or 93% of the U.S. equity market.
But even though the ‘34 Act requires disclosure of material climate risks, companies continue to disclose these risks poorly, if at all, using mostly boilerplate language that fails to inform or suit investors’ needs. This language may in fact serve to minimize the importance of climate risk to the economy because of its lack of specificity. Due to this disparity across industries and geographic location, the only way to inform an accurate understanding of climate risk is to provide investors with industry-specific, comparable data.
If investors are to effectively evaluate climate risk, they need a far better understanding of granular, industry-specific climate impacts, with industry-specific standards by which to evaluate corporate performance on these issues. By adopting a set of industry-based market standards for disclosure, especially in SEC filings, investors will be able to accurately compare and contrast companies. This latest SASB bulletin is a good next step toward this goal, and offers for the first time a comprehensive guide to understand and measure the unique climate impacts across all industries of the economy.
We share SASB’s belief that the capital markets can affect the course of climate change for the better. We must continue to provide resources like this bulletin that outline what is likely to be material for companies in a given industry and region, and suggest disclosure standards for information in a manner that can be compared and benchmarked. Implementing a set of standards could significantly increase the quality of information available to investors as they begin to navigate the landscape of climate risk.
Sincerely,
Henry M. Paulson 74th Secretary of the Treasury Co-Chair, Risky Business Project
Robert E. Rubin 70th Secretary of the Treasury Member, Risky Business Project
1 SASB.ORG
CLIMATE RISK TECHNICAL BULLETIN TB001-10182016
SASB’s Climate Risk Framework helps investors better understand their exposure to climate risk and how it can be more effectively disclosed for consideration in investment decisions.
From the earliest trade across windswept oceans and arid deserts, our markets and the climate in which they operate have always been interconnected. In today’s world, however, concerns about climate have heightened, creating new and substantial long-term threats to the financial stability of those markets, the security of diversified investment portfolios, and the viability of much business enterprise. Investors, as providers of the financial capital that is the lifeblood of our markets, have increasingly recognized the importance of measuring and managing their exposure to material climate-related risks.
As this report shows, such risks are now present in 72 of the 79 industries that comprise equities as an asset class. Because of this ubiquity, investors cannot diversify away from climate risk; instead they must focus on managing it—and on encouraging portfolio companies to manage it—in all its forms. Twenty-first century businesses and their investors face a variety of significant climate-related risks, which are covered in detail in this report. Each of these risks, depending on how they are managed, can have a positive or negative impact on a company’s financial condition or operating performance—and therefore on an investment portfolio’s risk-return profile. Among these risks are the physical effects of climate change due to the increasing frequency and severity of weather-related events; liabilities related to a shifting regulatory landscape; and the challenge of navigating the transition to a resilient, low-carbon economy. An example of this is seen with the Paris climate accord crossing the threshold required to enter into force, which further drives the need for transitions in carbon-intensive industries and amplifies regulatory pressure.1
This report is intended to assist investors’ efforts to more effectively manage climate risk in several ways. First, it presents for the first time a comprehensive view of where climate risk is present across a diversified portfolio, mapping that risk to corresponding financial impacts, to provide investors with a greater understanding of their exposures and value at risk. Second, it offers an industry-specific analysis of existing climate-risk disclosure, enabling investors to gain insight on where uncompensated risk may be hiding, thereby undermining optimal risk-return targets. Finally, the report shares recom-mendations on how material, industry-specific climate risk can be more effectively managed and disclosed at the issuer level,
1 Ceres website, accessed October 5, 2016, at http://www.ceres.org/press/press-releases/ceres2019-mindy-lubber-statement-on-paris-climate-agreements-entry-into-force
empowering more effective communication between investors and their portfolio companies.
BACKGROUND
As climate-related uncertainty has increased, investors have not been sitting by idly. To lead the charge toward improved climate risk management, they have formed the Investor Network on Cli-mate Risk (INCR), a group of 120 institutional investors with total assets under management of over $14 trillion.2 They have also recognized that achieving climate-related risk-management goals will require greater transparency around corporate performance. To this end, 45 investors representing $1.1 trillion in assets under management—including the nation’s largest public pension fund, CalPERS—submitted a letter to the U.S. Securities and Exchange Commission (SEC) in July, 2016, calling for improved climate risk disclosure.3
The SEC, which is responsible for enforcing federal securities laws in the U.S., has acknowledged that climate-related risk can have significant effects on business. In 2010, responding to calls from more than 100 institutional investors representing $7 tril-lion, the Commission issued interpretive guidance clarifying that, when climate-related impacts are material, corporate issuers are compelled to disclose relevant information in accordance with the existing disclosure requirements contained in Regulation S-K.4 Nevertheless, although climate-related disclosure has increased, it has thus far consisted largely of vague or boilerplate statements, which investors have not found particularly useful.5 6
In the absence of meaningful disclosure, investors have been challenged to adequately understand and manage their exposure to climate-related risks. As a result, the SEC has given thoughtful consideration to sustainability disclosures—such as those related to climate risk—in its ongoing review of disclosure effectiveness under Regulation S-K.7 As part of this project, in April of 2016, the SEC issued a concept release on disclosure reform, which invited feedback on a broad range of issues related to Regulation
2 INCR website, accessed Sept. 29, 2016, at http://www.ceres.org/investor-network/incr/
3 Letter to SEC, Re: File Number S7-06-16: Business and Financial Disclosure Required by Regulation S-K, July 20, 2016; https://www.ceres.org/files/sec-concept-release-letter/at_download/file
4 Securities and Exchange Commission, FR-82, Commission Guidance Regarding Disclosure Related to Climate Change, p. 3 (Feb. 2, 2010), https://www.sec.gov/rules/interp/2010/33-9106.pdf.
5 “Cool Response: The SEC and Corporate Climate Change Reporting,” Ceres, February 2014; https://www.ceres.org/resources/reports/cool-response-the-sec-corporate-climate-change-reporting/
6 Letter to SEC, Re: Investor Concern About Poor Climate Risk Disclosure and Request for SEC Action, June 22, 2016; https://www.ceres.org/files/incr-letter-to-sec/at_download/file
7 Securities and Exchange Commission, Business and Financial Disclosure Required by Regulation S-K, April 15, 2016; http://www.sec.gov/rules/concept/2016/33-10064.pdf
Overview
2 SASB.ORG
CLIMATE RISK TECHNICAL BULLETIN TB001-10182016
S-K. A preliminary analysis of results indicates that 51percent of all sustainability-related (non-form) comment letters from respondents (37 percent of whom were investors) called for improved disclosure related to climate change.8
Meanwhile, the Financial Stability Board (FSB), at the request of G20 leaders, has launched a Task Force on Climate-Related Financial Disclosures (TCFD) aimed at helping companies better understand what financial markets need from disclosure in order to measure and manage climate risk. With this mission, the TCFD seeks to design a set of recommendations for voluntary company financial disclosures that promotes alignment across existing regimes, clarifies what may constitute material and relevant climate-related risks, and is responsive to the needs of lenders, insurers, investors, and other users of disclosures.
These developments represent significant steps in recognizing the risk that climate change may pose to financial markets. However, more work remains to be done.
Since 2012, SASB has conducted extensive analysis of the mate-rial risks associated with climate change and other sustainability factors. SASB’s standardized disclosure framework aligns with the initiatives of both the SEC and the FSB. Its standards are designed to comport with U.S. securities laws and regulations,9 and its process follows the principles of effective disclosure as defined by the TCFD (i.e., “achieving transparent, high quality disclosures that enable users to understand the impact of climate change on a company’s strategy, risk, opportunities, and financial performance, in an integrated manner”).10
Although SASB’s research and standard-setting have addressed a range of sustainability issues—from resource scarcity to product safety to human rights—this report details, for the first time, its findings related to a single issue: climate risk, as it manifests itself in each of 79 industries, along with the recommended disclosures for investors to be able to understand, compare, and price that risk.
8 All Comments to the SEC in Response to Concept Release: Business and Financial Disclosure Required by Regulation S-K: https://www.sec.gov/comments/s7-06-16/s70616.htm
9 Letter to SEC, Re: Concept Release on Business and Financial Disclosure Required by Regulation S-K, July 1, 2016, pp. 39-40; https://www.sec.gov/comments/s7-06-16/s70616-25.pdf
10 Phase I Report of the Task Force on Climate-Related Financial Disclosures, March 31, 2016; accessed September 29, 2016 at https://www.fsb-tcfd.org/wp-content/uploads/2016/03/Phase_I_Report_v15.pdf
KEY FINDINGS
Climate risk is ubiquitous. SASB research demonstrates that 72 out of 79 Sustainable Industry Classification System (SICS™)11 industries are significantly affected in some way by climate risk. This equates to $27.5 trillion, or 93 percent of U.S. equities by market capitalization. This represents a systematic risk that can-not be diversified away. As a result, investors must employ other strategies to manage climate risk, such as balancing exposures through sector allocation, focusing exposures on best-in-class securities, and actively engaging with portfolio companies on key climate-related factors to encourage improved performance.
Climate risk is diverse. Although climate risk is virtually omni-present, cutting across every sector, it manifests itself differently from one industry to the next. For example, agricultural concerns must manage water as an increasingly stressed resource, oil and gas companies need to properly value reserves in a carbon-con-strained world and be prudent about capital expenditures, and commercial banks have to effectively manage the carbon embedded in their loan portfolios. Using SASB’s Climate Risk Framework, introduced in this report, these industry-specific impacts can be grouped into three primary types of risk to a company and its investors: physical risk, transition risk, and/or regulatory risk.
To understand its relevance to investors, these risks must be viewed through the lens of materiality. SASB has conducted a detailed mapping of the types of climate risk likely to be material in each industry (see Table 1) so that investors can understand the nature of the risk they are exposed to depending on the holdings in their portfolio.
Understanding climate risk requires specialized disclosures. Investors need specific information to fully understand their exposure and how well companies are positioned to manage the three types of climate risk. It’s not as simple as all companies disclosing their carbon footprint or data on greenhouse gas (GHG) emissions. In fact, GHG emissions is likely to be a material disclosure in only 23 of 79 industries and, indeed, data from CDP indicates that only seven industries account for 85 percent of reported Scope 1 GHG emissions.12 In health care, investors need to understand extreme weather events that can affect both business continuity and demand for services. In real estate, they need information on the energy efficiency of buildings and the vulnerability of building stock due to geographic location. In
11 SASB groups companies into industries and sectors based on their resource intensity and shared sustainability risks and opportunities. The seven industries for which SASB standards include no climate- related topics are: Consumer Finance, Education, Professional Services, Advertising & Marketing, Media Production & Distribution, Tobacco, and Toys & Sporting Goods. For more information on SICS, see http://www.sasb.org/sics/.
12 Based on SASB analysis using CDP data pulled from the Bloomberg Professional Service in June, 2016, for calendar year 2014 and organized by SICS industry. High-impact industries include Airlines, Chemicals, Construction Materials, Iron & Steel Producers, Metals & Mining, Oil & Gas Exploration & Production, and Electric Utilities. Note that not all companies in every industry report data on GHG emissions to CDP.
3 SASB.ORG
CLIMATE RISK TECHNICAL BULLETIN TB001-10182016
automobiles, they need to be able to track progress on develop-ing alternative-fuel vehicles that curb use-phase emissions and capitalize on changing consumer preferences.
An industry-specific approach is essential, because macroeco-nomic risks can only be understood and managed in terms of their microeconomic implications.13 SASB standards provide industry-by-industry guidance for issuers to measure, manage, and report performance on critical dimensions of climate risk that are material to investors. (See Table 2.)
Climate risk is not adequately disclosed. Despite increasing awareness and investor demand, U.S.-listed companies have not provided the capital markets with adequate disclosure on climate risk. (See Table 3.) Although 75 percent of SASB’s climate-re-lated disclosure topics are already being addressed in SEC filings, they are not being reported in a decision-useful way. Of those disclosures, more than 40 percent use boilerplate language, while only 17 percent use metrics. (Even those disclosures using metrics are not comparable because they lack standardization.) If climate risk is not disclosed in a meaningful way, investors cannot benchmark and compare performance, and the market cannot efficiently price the risk.
Climate risk has financial implications that are tangible and identifiable. SASB’s standards-development process focuses on only those sustainability issues for which it can establish appre-ciable—not anecdotal—evidence of financial impact. In doing so, SASB maps each of its industry-specific topics, including those related to climate risk, to one or more of several types of financial impact commonly evaluated by financial analysts and investors—namely those that would affect a company’s revenues and operating costs, its asset value, and its financing costs. For example, an energy-intensive firm might be overexposed to volatile energy prices, vulnerable to certain risks if overly reliant on the grid, and/or incur indirect costs from internalization of carbon prices, while investments in self-generation, energy efficiency, and renewables may require R&D. For the first time, this report identifies the financial impacts associated with each type of climate risk in each industry (see Table 4), and further detail on each is provided in the SASB Industry Research Briefs.
THE SASB MODEL
Using the information contained in this report, investors are likely to enhance their ability to effectively manage climate-re-lated risk. However, much of this risk can only be managed effectively at the corporate level. In addition to the key findings outlined above, the report also makes recommendations for more effective corporate disclosure on industry-specific climate risks, based on the metrics contained in the SASB standards.
13 Rosenberg, B. and V. Marathe, 1976, “Common Factors in Security Returns: Microeconomic Determinants and Macroeconomic Correlates,” working paper, No. 44 Research Program in Finance, Institute of Business and Economic Research, Berkeley, University of California.
Investors can use the SASB Standards and accompanying Industry Research Briefs, as a playbook for engaging companies on the issues that matter most and to encourage improved sustainability disclosure. With this in mind, investors may want to consider certain features of the standards and how they are developed.
SASB standards are designed by the market, for the market. With participation from more than 2,800 investors and corporate professionals, representing more than $23 trillion in assets under management and more than $11 trillion in market capitalization, SASB’s approach has been developed with the needs of issuers and investors at the forefront. More than 75 percent of partic-ipants in SASB’s rigorous 18-month standards-setting process (for each sector) concluded that the climate-risk issues included in SASB’s standards were likely to be material to a reasonable investor. (See Appendix B.) This consensus was made possible by SASB’s painstaking research, which presented compelling evidence that performance on these issues was reasonably likely to materially affect the financial condition or operating performance of companies in an industry. As SASB transitions to codifying and maintaining the standards in 2016 and beyond, it has entered a period of deep consultation with issuers and investors on the provisional standards.
SASB is designed to provide disclosure that is both decision-use-ful and cost-effective. By continuing to engage the marketplace in its standard-setting process, SASB is able to produce sustain-ability accounting standards that strike a delicate balance: they are decision-useful for investors while still being cost-effective for issuers. SASB achieves cost-effectiveness in part by aligning with other standards, definitions, and concepts already in use by issuers, governments, industry associations, and others. For example, SASB’s climate-risk metrics are closely aligned with those of CDP and many other climate-related organizations. (See Appendix A.) Furthermore, by focusing on only those impacts that are likely to be material to investors, SASB has limited its climate-related disclosures to an average of just two topics and four metrics per industry, easing the reporting burden on issuers.
In summary, SASB standards provide a comprehensive view of climate risk across the entire spectrum of public equities as an asset class. Using the SASB Climate Risk Framework and the information contained in this report, investors can gain a deeper understanding of the types of climate risk to which they are exposed, where those exposures lie, where they are likely to be uncompensated, and what financial impacts they are likely to have. Using the SASB recommended disclosures, companies can describe (in a cost-effective and decision-useful way) how they are managing climate-related risk and how they are positioned to outperform as the competitive landscape evolves. Finally, once the standards are implemented and the capital markets are equipped with the information they yield, both companies and investors will be able to benchmark climate-related performance, creating a race to the top.
4 SASB.ORG
CLIMATE RISK TECHNICAL BULLETIN TB001-10182016
Climate Risk and Approach to Materiality
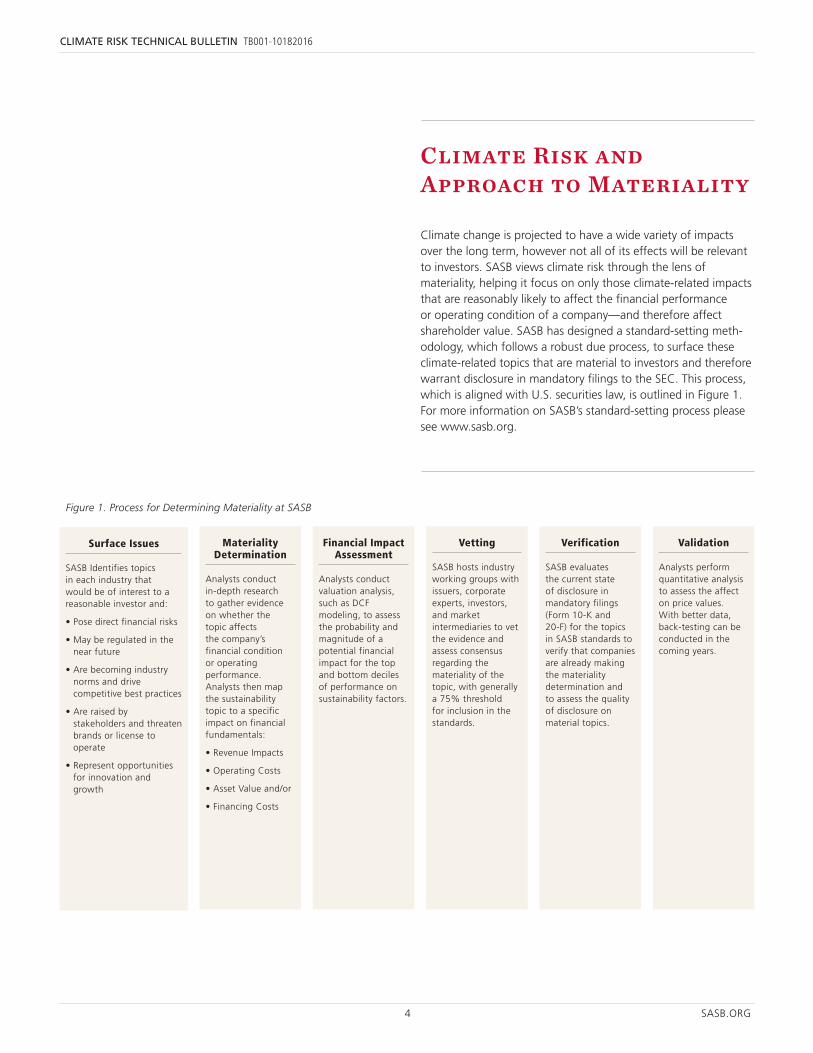
Climate change is projected to have a wide variety of impacts over the long term, however not all of its effects will be relevant to investors. SASB views climate risk through the lens of materiality, helping it focus on only those climate-related impacts that are reasonably likely to affect the financial performance or operating condition of a company—and therefore affect shareholder value. SASB has designed a standard-setting meth-odology, which follows a robust due process, to surface these climate-related topics that are material to investors and therefore warrant disclosure in mandatory filings to the SEC. This process, which is aligned with U.S. securities law, is outlined in Figure 1. For more information on SASB’s standard-setting process please see www.sasb.org.
Surface Issues
SASB Identifies topics in each industry that would be of interest to a reasonable investor and:
• Pose direct financial risks
• May be regulated in the near future
• Are becoming industry norms and drive competitive best practices
• Are raised by stakeholders and threaten brands or license to operate
• Represent opportunities for innovation and growth
Materiality Determination
Analysts conduct in-depth research to gather evidence on whether the topic affects the company’s financial condition or operating performance. Analysts then map the sustainability topic to a specific impact on financial fundamentals:
• Revenue Impacts
• Operating Costs
• Asset Value and/or
• Financing Costs
Vetting
SASB hosts industry working groups with issuers, corporate experts, investors, and market intermediaries to vet the evidence and assess consensus regarding the materiality of the topic, with generally a 75% threshold for inclusion in the standards.
Financial Impact Assessment
Analysts conduct valuation analysis, such as DCF modeling, to assess the probability and magnitude of a potential financial impact for the top and bottom deciles of performance on sustainability factors.
Verification
SASB evaluates the current state of disclosure in mandatory filings (Form 10-K and 20-F) for the topics in SASB standards to verify that companies are already making the materiality determination and to assess the quality of disclosure on material topics.
Validation
Analysts perform quantitative analysis to assess the affect on price values. With better data, back-testing can be conducted in the coming years.
Figure 1. Process for Determining Materiality at SASB
5 SASB.ORG
CLIMATE RISK TECHNICAL BULLETIN TB001-10182016
Climate risk can affect investment returns both in the near and long terms. To date, however, the approach to evaluating the impacts of climate risk on investment portfolios has often just focused on assessing and reducing the “carbon footprint” of portfolios (i.e., the Scope 1 and Scope 2 GHG emissions associated with each investment) or suggested “divestment” from fossil fuel companies or certain high-carbon industries, such as coal and tar sands. However, these approaches are limited when considering how ubiquitous climate risk is, resulting in a wide range of impacts and effects across a myriad of business operations.14
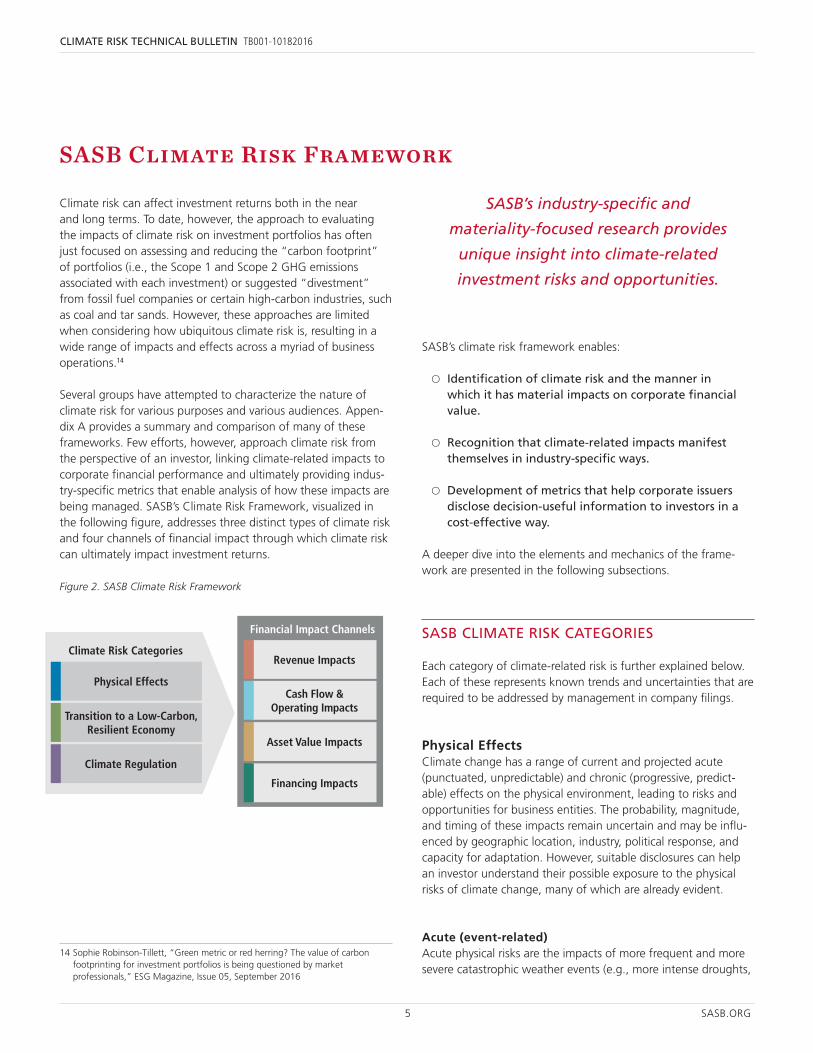
Several groups have attempted to characterize the nature of climate risk for various purposes and various audiences. Appen-dix A provides a summary and comparison of many of these frameworks. Few efforts, however, approach climate risk from the perspective of an investor, linking climate-related impacts to corporate financial performance and ultimately providing indus-try-specific metrics that enable analysis of how these impacts are being managed. SASB’s Climate Risk Framework, visualized in the following figure, addresses three distinct types of climate risk and four channels of financial impact through which climate risk can ultimately impact investment returns.
Figure 2. SASB Climate Risk Framework
14 Sophie Robinson-Tillett, “Green metric or red herring? The value of carbon footprinting for investment portfolios is being questioned by market professionals,” ESG Magazine, Issue 05, September 2016
SASB’s climate risk framework enables:
ț Identification of climate risk and the manner in which it has material impacts on corporate financial value.
ț Recognition that climate-related impacts manifest themselves in industry-specific ways.
ț Development of metrics that help corporate issuers disclose decision-useful information to investors in a cost-effective way.
A deeper dive into the elements and mechanics of the frame-work are presented in the following subsections.
SASB CLIMATE RISK CATEGORIES
Each category of climate-related risk is further explained below. Each of these represents known trends and uncertainties that are required to be addressed by management in company filings.
Physical EffectsClimate change has a range of current and projected acute (punctuated, unpredictable) and chronic (progressive, predict-able) effects on the physical environment, leading to risks and opportunities for business entities. The probability, magnitude, and timing of these impacts remain uncertain and may be influ-enced by geographic location, industry, political response, and capacity for adaptation. However, suitable disclosures can help an investor understand their possible exposure to the physical risks of climate change, many of which are already evident.
Acute (event-related)Acute physical risks are the impacts of more frequent and more severe catastrophic weather events (e.g., more intense droughts,
SASB Climate Risk Framework
SASB’s industry-specific and
materiality-focused research provides
unique insight into climate-related
investment risks and opportunities.
Physical EffectsCash Flow &
Operating ImpactsTransition to a Low-Carbon,
Resilient EconomyAsset Value Impacts
Climate Regulation
Financing Impacts
Revenue ImpactsClimate Risk Categories
Financial Impact Channels
6 SASB.ORG
CLIMATE RISK TECHNICAL BULLETIN TB001-10182016
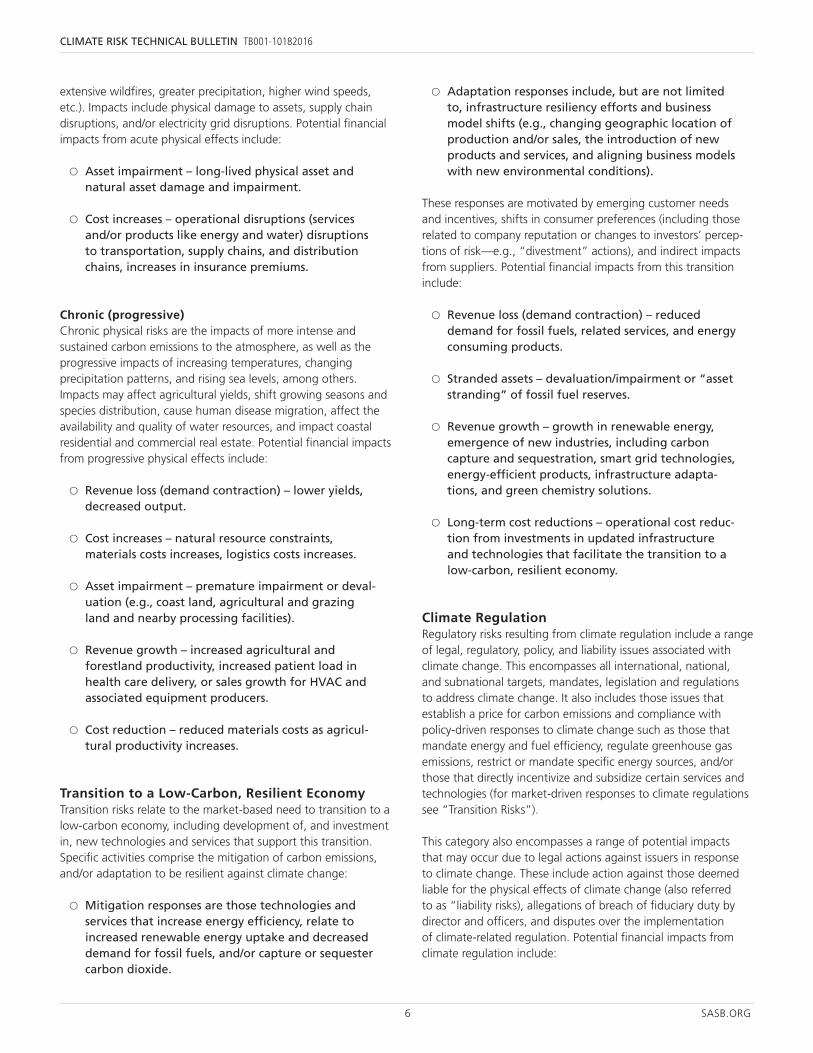
extensive wildfires, greater precipitation, higher wind speeds, etc.). Impacts include physical damage to assets, supply chain disruptions, and/or electricity grid disruptions. Potential financial impacts from acute physical effects include:
ț Asset impairment – long-lived physical asset and natural asset damage and impairment.
ț Cost increases – operational disruptions (services and/or products like energy and water) disruptions to transportation, supply chains, and distribution chains, increases in insurance premiums.
Chronic (progressive) Chronic physical risks are the impacts of more intense and sustained carbon emissions to the atmosphere, as well as the progressive impacts of increasing temperatures, changing precipitation patterns, and rising sea levels, among others. Impacts may affect agricultural yields, shift growing seasons and species distribution, cause human disease migration, affect the availability and quality of water resources, and impact coastal residential and commercial real estate. Potential financial impacts from progressive physical effects include:
ț Revenue loss (demand contraction) – lower yields, decreased output.
ț Cost increases – natural resource constraints, materials costs increases, logistics costs increases.
ț Asset impairment – premature impairment or deval-uation (e.g., coast land, agricultural and grazing land and nearby processing facilities).
ț Revenue growth – increased agricultural and forestland productivity, increased patient load in health care delivery, or sales growth for HVAC and associated equipment producers.
ț Cost reduction – reduced materials costs as agricul-tural productivity increases.
Transition to a Low-Carbon, Resilient EconomyTransition risks relate to the market-based need to transition to a low-carbon economy, including development of, and investment in, new technologies and services that support this transition. Specific activities comprise the mitigation of carbon emissions, and/or adaptation to be resilient against climate change:
ț Mitigation responses are those technologies and services that increase energy efficiency, relate to increased renewable energy uptake and decreased demand for fossil fuels, and/or capture or sequester carbon dioxide.
ț Adaptation responses include, but are not limited to, infrastructure resiliency efforts and business model shifts (e.g., changing geographic location of production and/or sales, the introduction of new products and services, and aligning business models with new environmental conditions).
These responses are motivated by emerging customer needs and incentives, shifts in consumer preferences (including those related to company reputation or changes to investors’ percep-tions of risk—e.g., “divestment” actions), and indirect impacts from suppliers. Potential financial impacts from this transition include:
ț Revenue loss (demand contraction) – reduced demand for fossil fuels, related services, and energy consuming products.
ț Stranded assets – devaluation/impairment or “asset stranding” of fossil fuel reserves.
ț Revenue growth – growth in renewable energy, emergence of new industries, including carbon capture and sequestration, smart grid technologies, energy-efficient products, infrastructure adapta-tions, and green chemistry solutions.
ț Long-term cost reductions – operational cost reduc-tion from investments in updated infrastructure and technologies that facilitate the transition to a low-carbon, resilient economy.
Climate RegulationRegulatory risks resulting from climate regulation include a range of legal, regulatory, policy, and liability issues associated with climate change. This encompasses all international, national, and subnational targets, mandates, legislation and regulations to address climate change. It also includes those issues that establish a price for carbon emissions and compliance with policy-driven responses to climate change such as those that mandate energy and fuel efficiency, regulate greenhouse gas emissions, restrict or mandate specific energy sources, and/or those that directly incentivize and subsidize certain services and technologies (for market-driven responses to climate regulations see “Transition Risks”).
This category also encompasses a range of potential impacts that may occur due to legal actions against issuers in response to climate change. These include action against those deemed liable for the physical effects of climate change (also referred to as “liability risks), allegations of breach of fiduciary duty by director and officers, and disputes over the implementation of climate-related regulation. Potential financial impacts from climate regulation include:
7 SASB.ORG
CLIMATE RISK TECHNICAL BULLETIN TB001-10182016
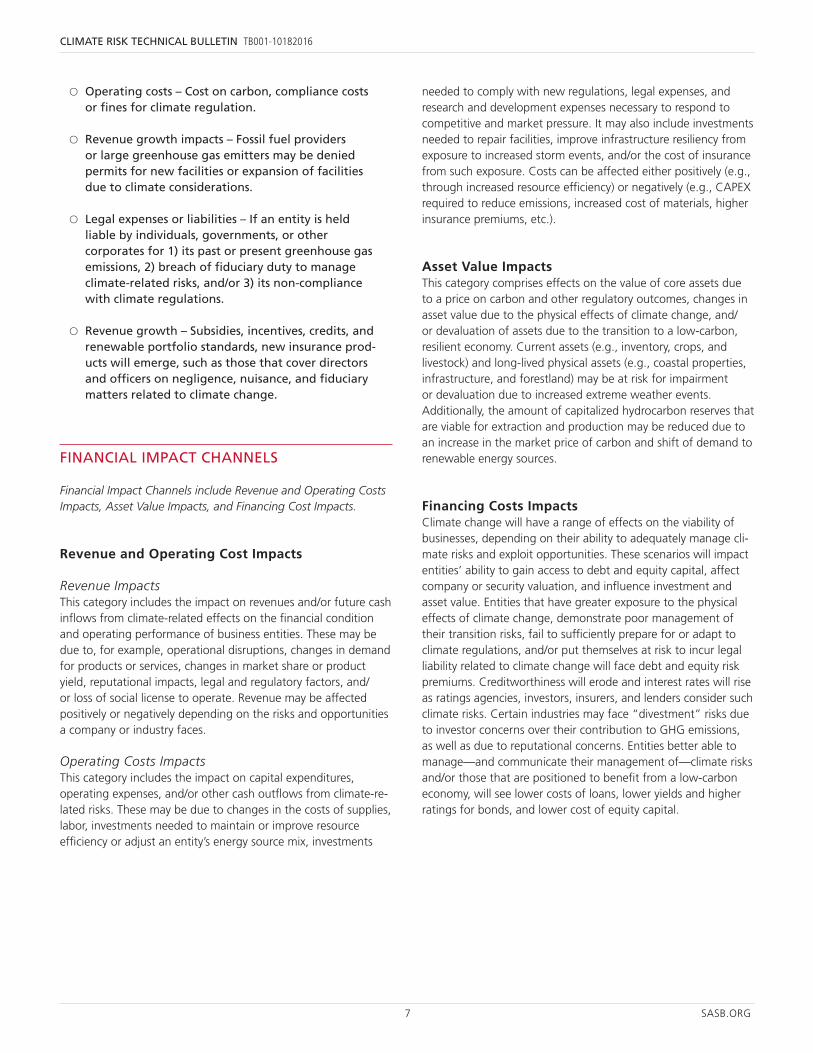
ț Operating costs – Cost on carbon, compliance costs or fines for climate regulation.
ț Revenue growth impacts – Fossil fuel providers or large greenhouse gas emitters may be denied permits for new facilities or expansion of facilities due to climate considerations.
ț Legal expenses or liabilities – If an entity is held liable by individuals, governments, or other corporates for 1) its past or present greenhouse gas emissions, 2) breach of fiduciary duty to manage climate-related risks, and/or 3) its non-compliance with climate regulations.
ț Revenue growth – Subsidies, incentives, credits, and renewable portfolio standards, new insurance prod-ucts will emerge, such as those that cover directors and officers on negligence, nuisance, and fiduciary matters related to climate change.
FINANCIAL IMPACT CHANNELS
Financial Impact Channels include Revenue and Operating Costs Impacts, Asset Value Impacts, and Financing Cost Impacts.
Revenue and Operating Cost Impacts
Revenue ImpactsThis category includes the impact on revenues and/or future cash inflows from climate-related effects on the financial condition and operating performance of business entities. These may be due to, for example, operational disruptions, changes in demand for products or services, changes in market share or product yield, reputational impacts, legal and regulatory factors, and/or loss of social license to operate. Revenue may be affected positively or negatively depending on the risks and opportunities a company or industry faces.
Operating Costs ImpactsThis category includes the impact on capital expenditures, operating expenses, and/or other cash outflows from climate-re-lated risks. These may be due to changes in the costs of supplies, labor, investments needed to maintain or improve resource efficiency or adjust an entity’s energy source mix, investments
needed to comply with new regulations, legal expenses, and research and development expenses necessary to respond to competitive and market pressure. It may also include investments needed to repair facilities, improve infrastructure resiliency from exposure to increased storm events, and/or the cost of insurance from such exposure. Costs can be affected either positively (e.g., through increased resource efficiency) or negatively (e.g., CAPEX required to reduce emissions, increased cost of materials, higher insurance premiums, etc.).
Asset Value ImpactsThis category comprises effects on the value of core assets due to a price on carbon and other regulatory outcomes, changes in asset value due to the physical effects of climate change, and/or devaluation of assets due to the transition to a low-carbon, resilient economy. Current assets (e.g., inventory, crops, and livestock) and long-lived physical assets (e.g., coastal properties, infrastructure, and forestland) may be at risk for impairment or devaluation due to increased extreme weather events. Additionally, the amount of capitalized hydrocarbon reserves that are viable for extraction and production may be reduced due to an increase in the market price of carbon and shift of demand to renewable energy sources.
Financing Costs ImpactsClimate change will have a range of effects on the viability of businesses, depending on their ability to adequately manage cli-mate risks and exploit opportunities. These scenarios will impact entities’ ability to gain access to debt and equity capital, affect company or security valuation, and influence investment and asset value. Entities that have greater exposure to the physical effects of climate change, demonstrate poor management of their transition risks, fail to sufficiently prepare for or adapt to climate regulations, and/or put themselves at risk to incur legal liability related to climate change will face debt and equity risk premiums. Creditworthiness will erode and interest rates will rise as ratings agencies, investors, insurers, and lenders consider such climate risks. Certain industries may face “divestment” risks due to investor concerns over their contribution to GHG emissions, as well as due to reputational concerns. Entities better able to manage—and communicate their management of—climate risks and/or those that are positioned to benefit from a low-carbon economy, will see lower costs of loans, lower yields and higher ratings for bonds, and lower cost of equity capital.
8 SASB.ORG
CLIMATE RISK TECHNICAL BULLETIN TB001-10182016
Climate risk can manifest as a specific risk, systematic risk, or systemic risk. Investors need to understand these different types of risks because these factors influence the ability to diversify risk, how to conduct appropriate financial analysis, and how to manage risk. The data and information recommended by SASB's standards can be a useful first step in managing each category of risk, however SASB's standards were developed primarily to address specific risk—disclosure of those risks unique to a busi-ness entity. To effectively manage other types of risks, investors will require different types of disclosure (beyond the capital markets) not supported under the current securities law regime in the U.S., which focuses on the risks to investors from buying, selling, or holding a security. However, investors still need to be aware of macroeconomic risks, which can affect a broad range of industries and economic sectors. More information on these risk types is provided int he following sections.
SPECIFIC RISK
Specific risk only affects a specific industry or company. Climate change poses a wide range of specific risks to individual issuers and to entire industries. For example, migration of subtropical diseases will affect the health care delivery and managed care industries. Increasing frequency and severity of droughts will affect the agricultural products industry. Carbon pricing regimes will disproportionately affect electric utilities and conventional energy producers.
Because this type of risk is unique to a company or industry, the degree of impact for specific issuers for many (but not all) specific climate risks will likely depend on geographic location, business model, company preparedness, technology availability, and other factors. Therefore, in order to assess specific risks and diversify exposure, investors will need to better understand the probability, magnitude, and timing of climate risks facing each industry across the economy in the near term. Ideally, they would also be able to compare corporate performance among peers to limit exposure to industry leaders while avoiding laggards.
SYSTEMATIC RISK
Systematic risk is the uncertainty inherent to the entire market and is therefore un-diversifiable. Climate change has increasingly
pervasive physical, regulatory, and market transition effects, solidifying it as a systematic risk across the economy. For exam-ple, climate risk will continue to impact global energy prices, agricultural productivity, human health and migration, and GDP.15 Climate change impacts each sector differently, but almost no industry is immune.
All large institutional investors, which are essentially universal owners (in that they have highly diversified portfolios mirroring the global capital markets), should be aware and attuned to the systematic nature of climate risk. A variety of research is emerging that investigates how systematic climate risk manifests under different scenarios and proposes mechanisms for investors to reduce their exposure, including asset-, sector-, and region-fo-cused allocation strategies.16 17
SASB research validates the systematic nature of climate risk, indicating that 72 out of 79 industries are affected in some way. Because this risk cannot be diversified away, investors need to understand and adequately price their exposure to it. An industry approach is essential, as climate risk manifests itself differently from one industry to the next. As early as the 1960s, researchers understood that an industry lens was the most important “common factor” to describe residual returns in securities.18 In the 1970s, additional research furthered the concept of industries as significant microeconomic determinants of risk because companies in industries share fundamental characteristics and hence respond similarly to macroeconomic events, such as climate change.19 Beyond company-specific factors, industry exposure has been the most influential driver of equity market returns, accounting for 22 percent of gains for U.S. stocks over the past 20 years.20 Through SASB’s standardized disclosures, investors are able to better understand not only
15 Wellington, Fred and Sauer, Amanda. “Framing Climate Risk in Portfolio Management,” May 2005, http://pdf.wri.org/framing_climate_risk_uncertainty.pdf
16 Unhedgeable risk: How climate change sentiment impacts investment (CISL, 2015). http://www.cisl.cam.ac.uk/publications/publication-pdfs/unhedgeable-risk.pdf
17 Mercer outlines four scenarios: 1) Transformation, 2) Coordination, 3) Fragmentation (Lower Damages) and 4) Fragmentation (Higher Damages), from: Mercer: Investing in a time of climate change (2015)
18 Cohen, K. and J. Pogue, "An Empirical Evaluation of Alternative Portfolio-Selection Models," J. Business, 40 (1967), 166-193.
19 Rosenberg, B. and V. Marathe, 1976, “Common Factors in Security Returns: Microeconomic Determinants and Macroeconomic Correlates,” working paper, No. 44 Research Program in Finance, Institute of Business and Economic Research, Berkeley, University of California.
20 “Equity Sectors: Essential Building Blocks for Portfolio Construction,” Fidelity, June 2013; https://www.fidelity.com/bin-public/060_www_fidelity_com/documents/EquitySectorsEssentialBuildingBlocks_rev.pdf
Climate Risk at Different Levels in Financial Systems
9 SASB.ORG
CLIMATE RISK TECHNICAL BULLETIN TB001-10182016
specific risk (company performance), but through complete and aggregated industry data, better understand which industries are more exposed and which are better positioned in terms of climate risk and opportunity. Taken together, company-specific and industry-specific factors explain nearly 80 percent of returns for the U.S. equity market.21
To accurately characterize and quantify the systematic implica-tions of climate risk on financial risk and return, factor analysis is needed industry by industry. The data to perform these types of statistical correlations is not yet available. Robust, longitudinal data sets on the material factors in each industry are needed to evaluate climate risk as a truly systematic risk present across a portfolio. Each industry’s common factors relative to climate change need to be evaluated in terms of how well these factors describe industry patterns of volatility. This would yield definitive data with respect to the systematic nature of climate risk present in a typical diversified portfolio. What we know now from SASB research on material factors is that some type of climate risk is present in the majority of industries that represent equities as an asset class, and that 93% of the capital markets are materially affected in some way.
21 Ibid.
SYSTEMIC RISK
Systemic risk is that which could trigger the collapse of an entire market or the financial system at large. A growing body of research suggests that climate change has the potential to be a systemic risk, primarily through two channels:
ț First, the regulatory and transition risks of climate change could lead to a rapid shift in energy usage and a re-pricing of assets (primarily carbon-inten-sive). This shock could impair financial assets and propagate throughout the financial system and wider economy.22 23
ț Second, climate change has the potential to lead to physical impacts that, through real losses and damage, can cause financial losses significant enough to propagate contagion and cripple the global economy. These could be in form of either a catastrophic incident (i.e., “fat tail” risk event) or if over time due to inaction, global average tempera-ture simply rises too high.24
Macroprudential regulators, such as the TCFD, could play a major role in climate-related systemic risk mitigation by recommending appropriate mechanisms to help address this risk. In order for policymakers and investors to understand this type of risk, information beyond securities-level disclosures is needed.
22 “Too late, too sudden: Transition to a low-carbon economy and systemic risk”, Reports of the ESRB Advisory Scientific Committee, No 6, February 2016. https://www.esrb.europa.eu/pub/pdf/asc/Reports_ASC_6_1602.pdf
23 Weyzig, F., B. Kuepper, J. W. van Gelder and R. van Tilburg (2014) ‘The price of doing too little too late; the impact of the carbon bubble on the European financial system’, Green New Deal Series, Volume 1
24 “The cost of inaction: Recognising the value at risk from climate change” The Economist Intelligence Unit, 2015 https://www.eiuperspectives.economist.com/sites/default/files/The%20cost%20of%20inaction_0.pdf
10 SASB.ORG
CLIMATE RISK TECHNICAL BULLETIN TB001-10182016
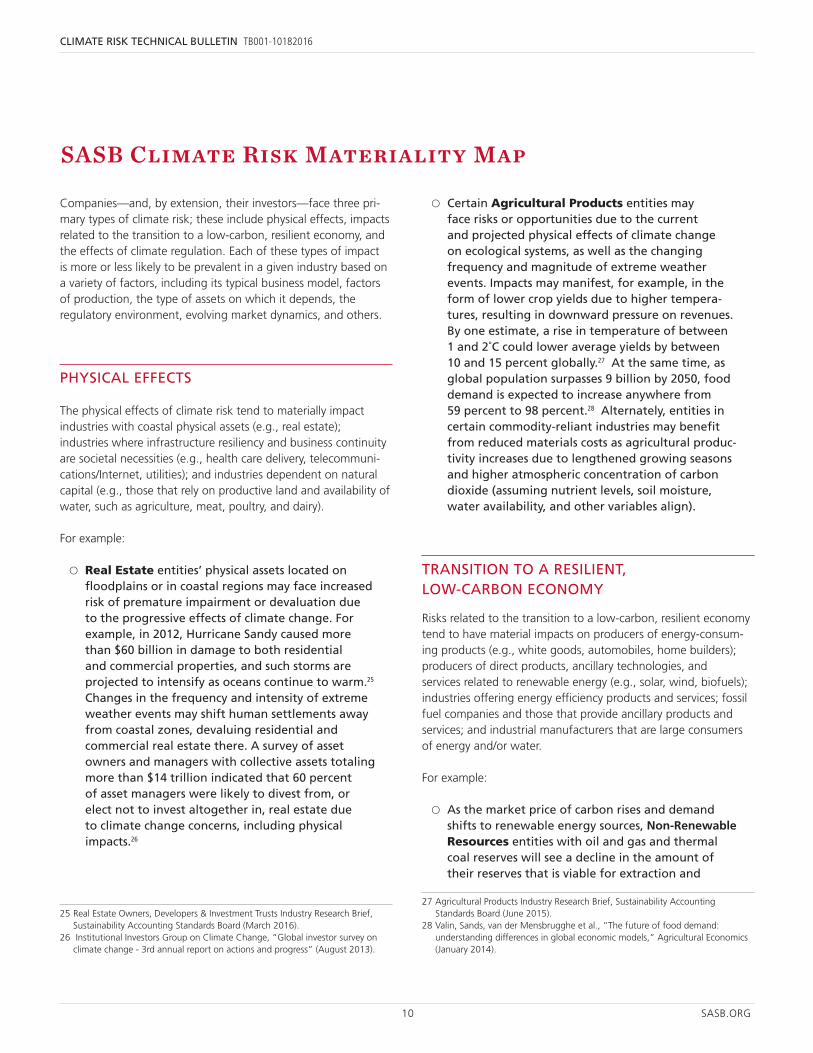
Companies—and, by extension, their investors—face three pri-mary types of climate risk; these include physical effects, impacts related to the transition to a low-carbon, resilient economy, and the effects of climate regulation. Each of these types of impact is more or less likely to be prevalent in a given industry based on a variety of factors, including its typical business model, factors of production, the type of assets on which it depends, the regulatory environment, evolving market dynamics, and others.
PHYSICAL EFFECTS
The physical effects of climate risk tend to materially impact industries with coastal physical assets (e.g., real estate); industries where infrastructure resiliency and business continuity are societal necessities (e.g., health care delivery, telecommuni-cations/Internet, utilities); and industries dependent on natural capital (e.g., those that rely on productive land and availability of water, such as agriculture, meat, poultry, and dairy).
For example:
ț Real Estate entities’ physical assets located on floodplains or in coastal regions may face increased risk of premature impairment or devaluation due to the progressive effects of climate change. For example, in 2012, Hurricane Sandy caused more than $60 billion in damage to both residential and commercial properties, and such storms are projected to intensify as oceans continue to warm.25 Changes in the frequency and intensity of extreme weather events may shift human settlements away from coastal zones, devaluing residential and commercial real estate there. A survey of asset owners and managers with collective assets totaling more than $14 trillion indicated that 60 percent of asset managers were likely to divest from, or elect not to invest altogether in, real estate due to climate change concerns, including physical impacts.26
25 Real Estate Owners, Developers & Investment Trusts Industry Research Brief, Sustainability Accounting Standards Board (March 2016).
26 Institutional Investors Group on Climate Change, “Global investor survey on climate change - 3rd annual report on actions and progress” (August 2013).
ț Certain Agricultural Products entities may face risks or opportunities due to the current and projected physical effects of climate change on ecological systems, as well as the changing frequency and magnitude of extreme weather events. Impacts may manifest, for example, in the form of lower crop yields due to higher tempera-tures, resulting in downward pressure on revenues. By one estimate, a rise in temperature of between 1 and 2˚C could lower average yields by between 10 and 15 percent globally.27 At the same time, as global population surpasses 9 billion by 2050, food demand is expected to increase anywhere from 59 percent to 98 percent.28 Alternately, entities in certain commodity-reliant industries may benefit from reduced materials costs as agricultural produc-tivity increases due to lengthened growing seasons and higher atmospheric concentration of carbon dioxide (assuming nutrient levels, soil moisture, water availability, and other variables align).
TRANSITION TO A RESILIENT, LOW-CARBON ECONOMY
Risks related to the transition to a low-carbon, resilient economy tend to have material impacts on producers of energy-consum-ing products (e.g., white goods, automobiles, home builders); producers of direct products, ancillary technologies, and services related to renewable energy (e.g., solar, wind, biofuels); industries offering energy efficiency products and services; fossil fuel companies and those that provide ancillary products and services; and industrial manufacturers that are large consumers of energy and/or water.
For example:
ț As the market price of carbon rises and demand shifts to renewable energy sources, Non-Renewable Resources entities with oil and gas and thermal coal reserves will see a decline in the amount of their reserves that is viable for extraction and
27 Agricultural Products Industry Research Brief, Sustainability Accounting Standards Board (June 2015).
28 Valin, Sands, van der Mensbrugghe et al., “The future of food demand: understanding differences in global economic models,” Agricultural Economics (January 2014).
SASB Climate Risk Materiality Map
11 SASB.ORG
CLIMATE RISK TECHNICAL BULLETIN TB001-10182016
production—including those proved, undeveloped reserves that are capitalized. In this low-emissions scenario, analysts have estimated that equity valuations of fossil fuel companies could be reduced by 40 to 60 percent.29 This devaluation or "asset stranding" is likely to be driven primarily by economic conditions, although specific regulations may impact carbon prices and/or otherwise restrict the ability to exploit reserves. The SEC has begun to question how at least one oil and gas company values its assets given the world’s mounting response to climate change.30
ț As the economy decarbonizes and the market favors industries that contribute to adaptation and mitiga-tion, companies that offer related technologies and services are likely to see revenue growth opportuni-ties. Automobile companies that invest in research and development to transition to more fuel-efficient technologies such as hybrid and electric vehicles will be better positioned to capture large shares of these rapidly expanding markets. Although electric vehicles represent less than one percent of the market today, they are projected to make up 35 percent of sales by 2040.31 Auto companies that struggle to make this transition will see a decrease in market share (for example, by 2030, sales of diesel-based cars within the European market will plummet to 9 percent from 52 percent).32
CLIMATE REGULATION
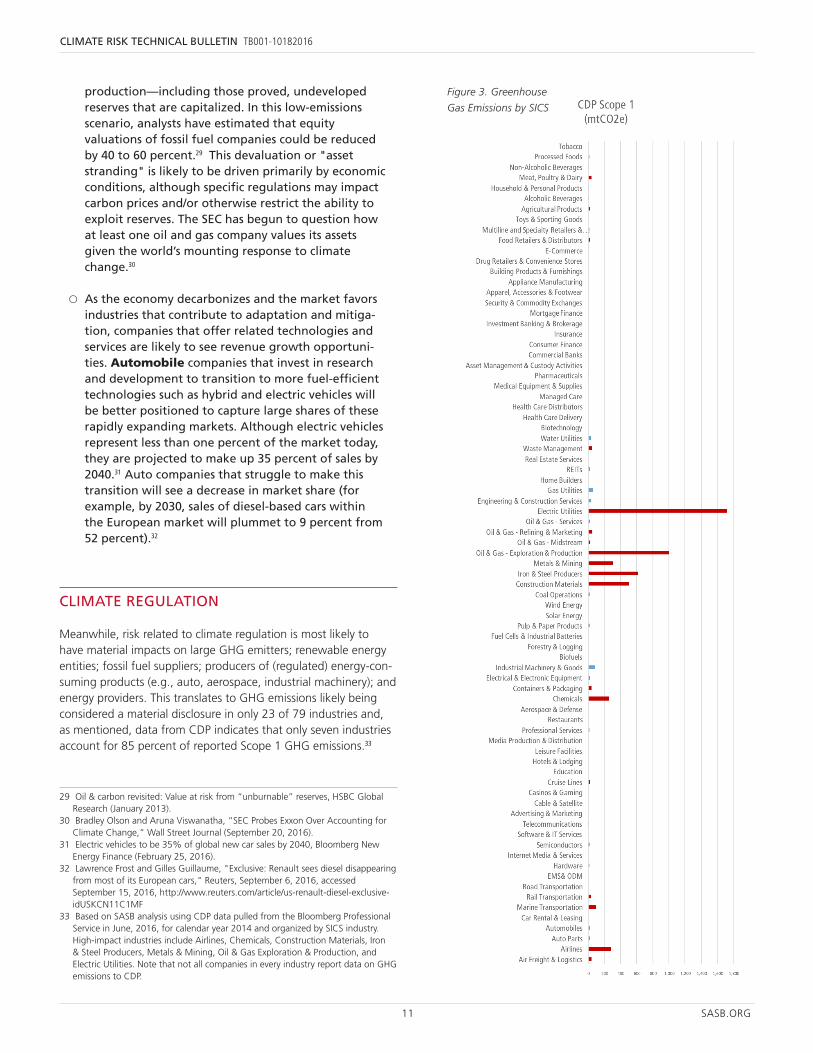
Meanwhile, risk related to climate regulation is most likely to have material impacts on large GHG emitters; renewable energy entities; fossil fuel suppliers; producers of (regulated) energy-con-suming products (e.g., auto, aerospace, industrial machinery); and energy providers. This translates to GHG emissions likely being considered a material disclosure in only 23 of 79 industries and, as mentioned, data from CDP indicates that only seven industries account for 85 percent of reported Scope 1 GHG emissions.33
29 Oil & carbon revisited: Value at risk from “unburnable” reserves, HSBC Global Research (January 2013).
30 Bradley Olson and Aruna Viswanatha, “SEC Probes Exxon Over Accounting for Climate Change,” Wall Street Journal (September 20, 2016).
31 Electric vehicles to be 35% of global new car sales by 2040, Bloomberg New Energy Finance (February 25, 2016).
32 Lawrence Frost and Gilles Guillaume, "Exclusive: Renault sees diesel disappearing from most of its European cars," Reuters, September 6, 2016, accessed September 15, 2016, http://www.reuters.com/article/us-renault-diesel-exclusive-idUSKCN11C1MF
33 Based on SASB analysis using CDP data pulled from the Bloomberg Professional Service in June, 2016, for calendar year 2014 and organized by SICS industry. High-impact industries include Airlines, Chemicals, Construction Materials, Iron & Steel Producers, Metals & Mining, Oil & Gas Exploration & Production, and Electric Utilities. Note that not all companies in every industry report data on GHG emissions to CDP.
Figure 3. Greenhouse
Gas Emissions by SICS
12 SASB.ORG
CLIMATE RISK TECHNICAL BULLETIN TB001-10182016
Climate-related regulation in the U.S. has included the Clean Power Plan, which limits carbon emissions from power generators, Recovery Act funding for wind and solar generation, fuel-efficiency standards for vehicle manufacturers, California’s cap-and-trade program for carbon emissions, and much more. Examples of industries with exposure to climate regulation include:
ț When a cost is associated with carbon emissions through some regulatory mechanism (e.g., tax or cap-and-trade allowance), such as the Clean Power Plan in the U.S., there will be cost implications for Electric Utilities, which represent the largest source of GHG emissions in the U.S. economy. Electric utility companies may face significant oper-ating and capital expenditures for mitigating GHG emissions. The EPA estimates the annual costs of the plan to be between $7.3 billion and $8.8 billion by 2030 (which is offset by an estimated $55 billion to $93 billion worth of health benefits annually).34 While many of these costs can be passed on to a utility customers, power generators in deregulated (competitive) markets may not be able to recoup these costs. In either case, however, companies that have taken a long-term view in proactively managing their facilities and energy mix will be better positioned to absorb these impacts.
ț Climate regulations and policy mechanisms such as subsidies, incentives, credits, and renewable portfolio standards will create revenue growth opportunities for a range of industries, including Solar Energy providers. The industry receives significant governmental assistance, generally with the understanding that solar technologies will lower GHG emissions. For example, Solar Energy providers benefit from federal tax credits, state tax exemptions, and federal purchasing requirements, which by 2020 will direct at least 20 percent of government energy costs—currently $5.8 billion annually—to renewable sources.35 However, the industry also has the potential to create negative social and environmental externalities. For example, if solar energy companies do not adequately manage the waste generated during the manufac-turing or the sourcing of their inputs to minimize negative environmental and social impacts, public sentiment could turn against this industry, threat-ening vital subsidies or creating difficulties when trying to obtain permits and win new customers.
34 U.S. Environmental Protection Agency, Clean Power Plan Fact Sheet (2014)35 Solar Energy Industry Research Brief, Sustainability Accounting Standards Board
(December 2015).
ț Although the competitive landscape in the Commer-cial Banks industry is not directly impacted by environmental concerns in any significant way, there is an indirect connection, and banks must respond to mounting investor and regulatory pressure to monitor and manage their financed emissions. For example, in the six-year period following the Kyoto Protocol, the top 10 banks nearly doubled their financial support of the coal industry, financing more than $150 billion worth of coal operations.36 Since then, regulatory and market forces have hastened the demise of the industry, many coal companies have become insolvent, and countless banks—including JPMorgan Chase, Bank of America, Citigroup, and Morgan Stanley—have announced they will no longer finance new coal-fired power plants in the U.S. or other developed nations. When a bank invests in or provides lending to firms that produce significant greenhouse gas emissions, the bank indirectly exposes itself to climate-related risks that could diminish returns and reduce value for shareholders. For example, in order to avoid a rise in global average temperature of more than 2°C above pre-industrial levels, it is estimated that 60-80 percent of the coal, oil, and gas reserves of listed firms are unburnable.37 This is partly why, in March 2016, the largest U.S. coal miner skipped $71 million in coupon payments due on its outstanding debt obligations before filing for Chapter 11 bankruptcy.38
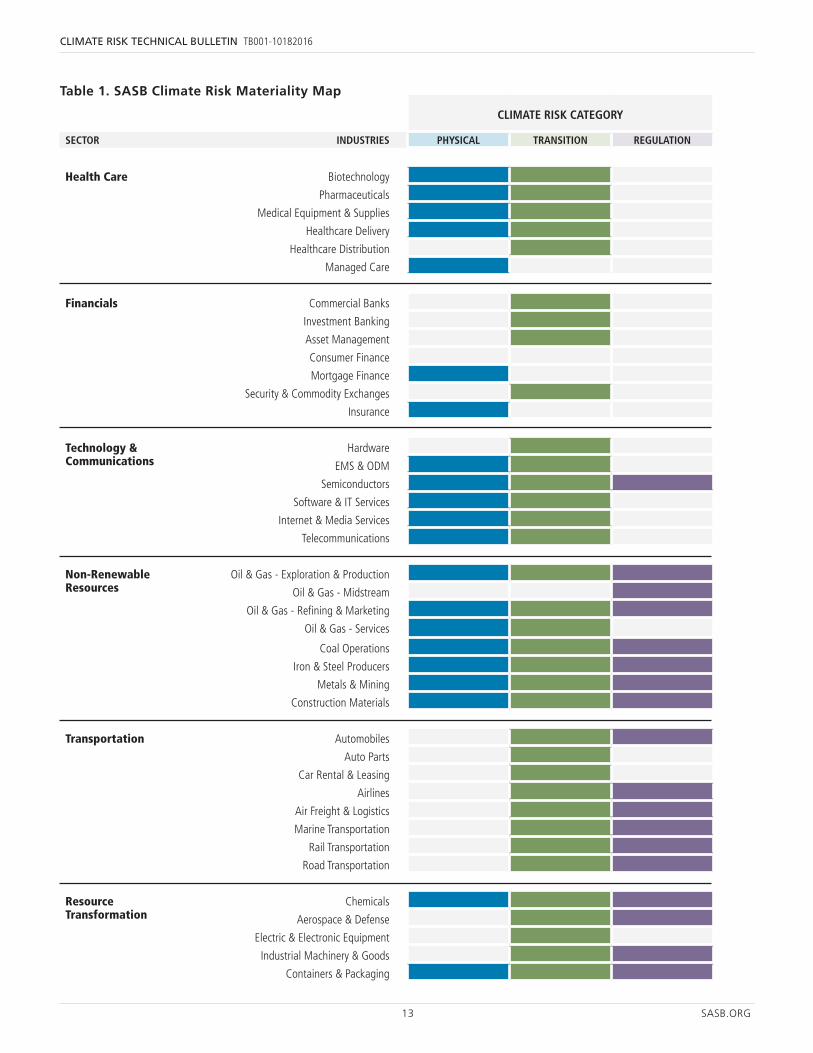
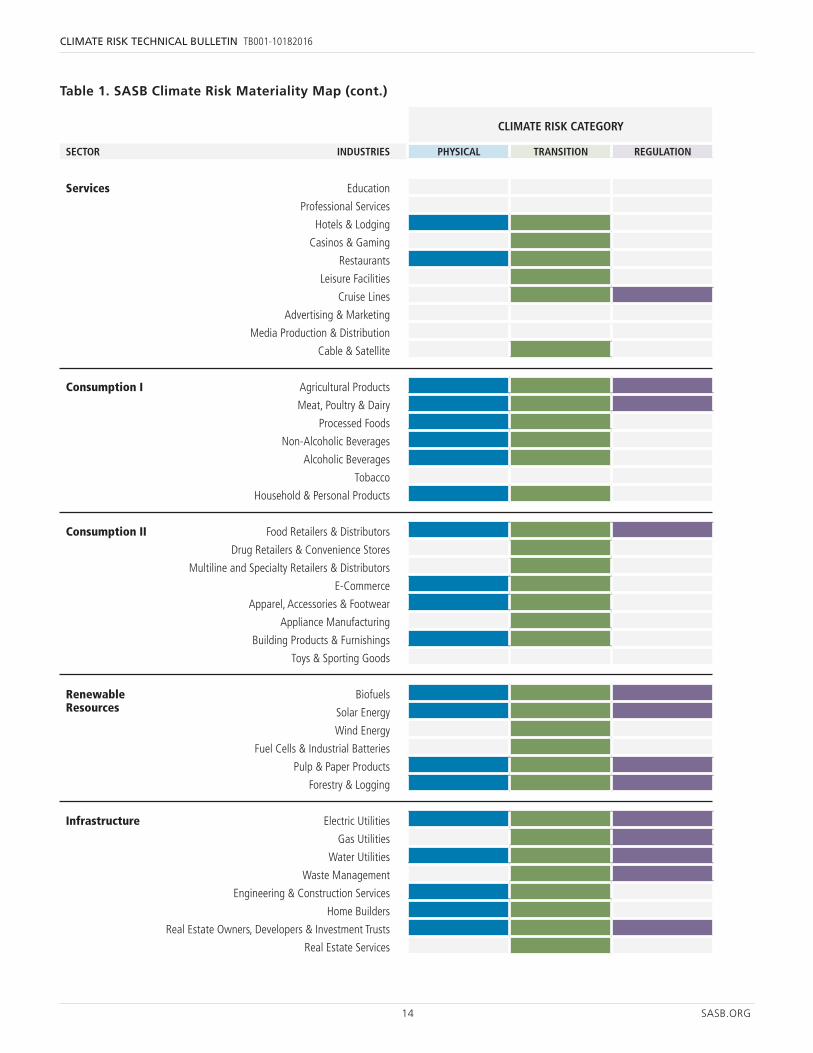
The table that follows indicates the presence of these three primary types of climate impact in each of the 79 SICS industries, as told by the a shaded boxes. It draws on relevant disclosure topics from the SASB standards to present a climate-specific view of the SASB Materiality Map. For more information on how specific climate-related topics are likely to impact companies in an industry, consult the SASB Industry Research Briefs, available at sasb.org/approach/our-process/industry-briefs.
36 Bankrolling Climate Change: A Look into the Portfolios of the World’s Largest Banks, Urgewald, GroundWork, Earthlife Africa Johannesburg, and BankTrack (December 2011).
37 Unburnable Carbon 2013: Wasted capital and stranded assets, Carbon Tracker (April 2013).
38 Nathan Bomey, “Coal giant Peabody Energy files for Chapter 11 bankruptcy,” USA Today (April 13, 2016).
13 SASB.ORG
CLIMATE RISK TECHNICAL BULLETIN TB001-10182016
CLIMATE RISK CATEGORY
SECTOR INDUSTRIES PHYSICAL TRANSITION REGULATION
Health Care Biotechnology
Pharmaceuticals
Medical Equipment & Supplies
Healthcare Delivery
Healthcare Distribution
Managed Care
Financials Commercial Banks
Investment Banking
Asset Management
Consumer Finance
Mortgage Finance
Security & Commodity Exchanges
Insurance
Technology & Communications
Hardware
EMS & ODM
Semiconductors
Software & IT Services
Internet & Media Services
Telecommunications
Non-Renewable Resources
Oil & Gas - Exploration & Production
Oil & Gas - Midstream
Oil & Gas - Refining & Marketing
Oil & Gas - Services
Coal Operations
Iron & Steel Producers
Metals & Mining
Construction Materials
Transportation Automobiles
Auto Parts
Car Rental & Leasing
Airlines
Air Freight & Logistics
Marine Transportation
Rail Transportation
Road Transportation
Resource Transformation
Chemicals
Aerospace & Defense
Electric & Electronic Equipment
Industrial Machinery & Goods
Containers & Packaging
Table 1. SASB Climate Risk Materiality Map
14 SASB.ORG
CLIMATE RISK TECHNICAL BULLETIN TB001-10182016
CLIMATE RISK CATEGORY
SECTOR INDUSTRIES PHYSICAL TRANSITION REGULATION
Services Education
Professional Services
Hotels & Lodging
Casinos & Gaming
Restaurants
Leisure Facilities
Cruise Lines
Advertising & Marketing
Media Production & Distribution
Cable & Satellite
Consumption I Agricultural Products
Meat, Poultry & Dairy
Processed Foods
Non-Alcoholic Beverages
Alcoholic Beverages
Tobacco
Household & Personal Products
Consumption II Food Retailers & Distributors
Drug Retailers & Convenience Stores
Multiline and Specialty Retailers & Distributors
E-Commerce
Apparel, Accessories & Footwear
Appliance Manufacturing
Building Products & Furnishings
Toys & Sporting Goods
Renewable Resources
Biofuels
Solar Energy
Wind Energy
Fuel Cells & Industrial Batteries
Pulp & Paper Products
Forestry & Logging
Infrastructure Electric Utilities
Gas Utilities
Water Utilities
Waste Management
Engineering & Construction Services
Home Builders
Real Estate Owners, Developers & Investment Trusts
Real Estate Services
Table 1. SASB Climate Risk Materiality Map (cont.)
15 SASB.ORG
CLIMATE RISK TECHNICAL BULLETIN TB001-10182016
Financial Impacts of Climate Risk
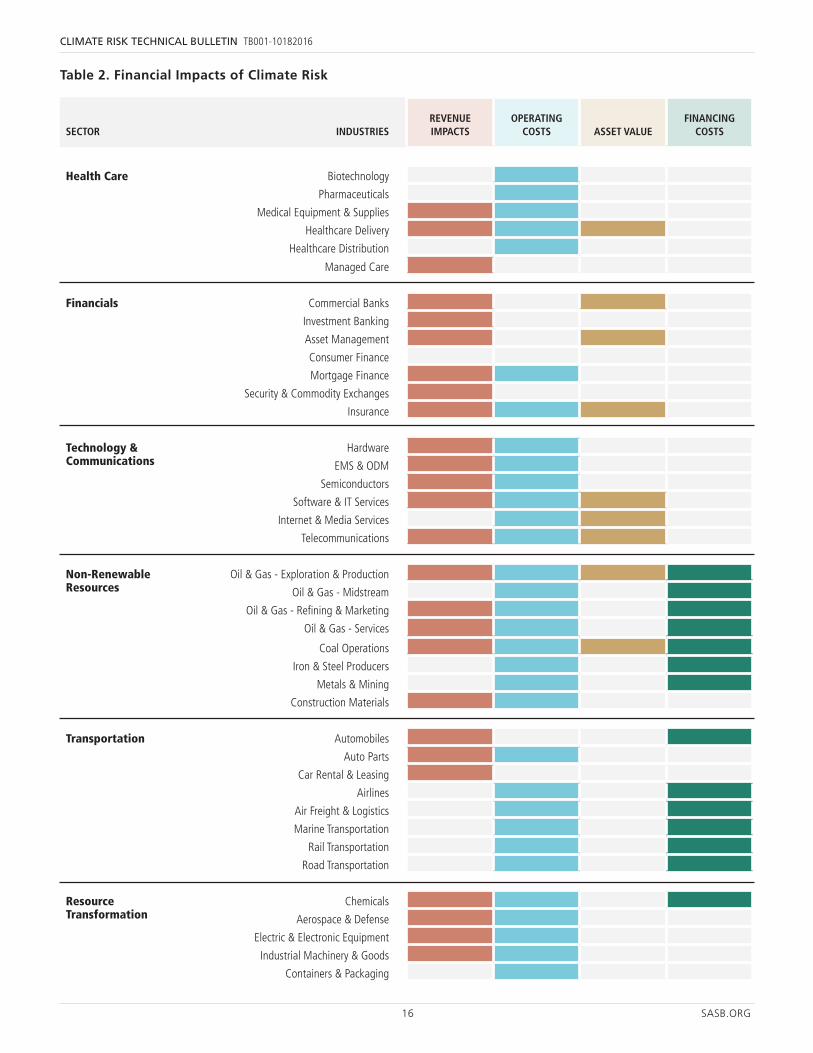
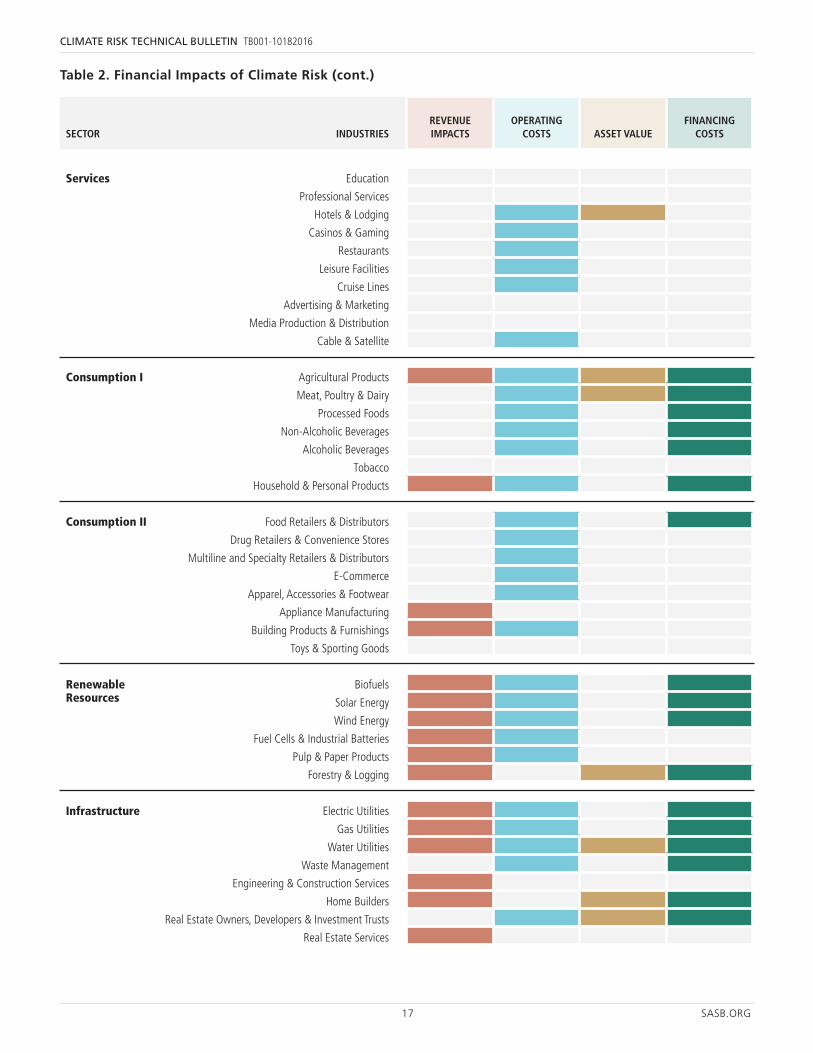
Although the three types of risk identified in Table 1 are helpful in terms of thinking about how climate-related impacts affect different industries, business models, or specific companies, financial analysts require an understanding of how those climate risks impact companies in a financial sense, including effects on a company’s valuation, outlook, or its risk profile. The financial implications of sustainability issues, including climate risk, can be conveniently grouped into the following general categories: Revenue Impacts and Operating Costs, Asset Value, and Financing Costs.
The following tables illustrate the exposure of each of the 79 SICS industries to climate-related impacts through each of these channels of financial impact. The financial impacts of specific climate-related topics are described at a more granular level in the SASB Industry Research Briefs, which can be found at sasb.org/approach/our-process/industry-briefs.
16 SASB.ORG
CLIMATE RISK TECHNICAL BULLETIN TB001-10182016
SECTOR INDUSTRIESREVENUE IMPACTS
OPERATING COSTS ASSET VALUE
FINANCING COSTS
Health Care Biotechnology
Pharmaceuticals
Medical Equipment & Supplies
Healthcare Delivery
Healthcare Distribution
Managed Care
Financials Commercial Banks
Investment Banking
Asset Management
Consumer Finance
Mortgage Finance
Security & Commodity Exchanges
Insurance
Technology & Communications
Hardware
EMS & ODM
Semiconductors
Software & IT Services
Internet & Media Services
Telecommunications
Non-Renewable Resources
Oil & Gas - Exploration & Production
Oil & Gas - Midstream
Oil & Gas - Refining & Marketing
Oil & Gas - Services
Coal Operations
Iron & Steel Producers
Metals & Mining
Construction Materials
Transportation Automobiles
Auto Parts
Car Rental & Leasing
Airlines
Air Freight & Logistics
Marine Transportation
Rail Transportation
Road Transportation
Resource Transformation
Chemicals
Aerospace & Defense
Electric & Electronic Equipment
Industrial Machinery & Goods
Containers & Packaging
Table 2. Financial Impacts of Climate Risk
17 SASB.ORG
CLIMATE RISK TECHNICAL BULLETIN TB001-10182016
SECTOR INDUSTRIESREVENUE IMPACTS
OPERATING COSTS ASSET VALUE
FINANCING COSTS
Services Education
Professional Services
Hotels & Lodging
Casinos & Gaming
Restaurants
Leisure Facilities
Cruise Lines
Advertising & Marketing
Media Production & Distribution
Cable & Satellite
Consumption I Agricultural Products
Meat, Poultry & Dairy
Processed Foods
Non-Alcoholic Beverages
Alcoholic Beverages
Tobacco
Household & Personal Products
Consumption II Food Retailers & Distributors
Drug Retailers & Convenience Stores
Multiline and Specialty Retailers & Distributors
E-Commerce
Apparel, Accessories & Footwear
Appliance Manufacturing
Building Products & Furnishings
Toys & Sporting Goods
Renewable Resources
Biofuels
Solar Energy
Wind Energy
Fuel Cells & Industrial Batteries
Pulp & Paper Products
Forestry & Logging
Infrastructure Electric Utilities
Gas Utilities
Water Utilities
Waste Management
Engineering & Construction Services
Home Builders
Real Estate Owners, Developers & Investment Trusts
Real Estate Services
Table 2. Financial Impacts of Climate Risk (cont.)
18 SASB.ORG
CLIMATE RISK TECHNICAL BULLETIN TB001-10182016
SASB’s climate risk metrics are designed to capture a company’s performance and exposure to risks and opportunities across each of the three types of climate-related impact categories—physical effects, transition to a low-carbon, resilient economy, and climate regulation. In conjunction with the financial impacts likely for each topic (detailed in Table 2), performance data on these climate-related metrics provide a useful way for investors to characterize and benchmark performance.
SASB standards contain both quantitative metrics and qualitative disclosures. In order to support analysts and investors who need comparable data for peer companies to support fundamental analysis, 78 percent of metrics are quantitative.
QUANTITATIVE METRICS
The following points highlight key components to SASB’s approach to identifying metrics that characterize a company’s exposure to climate risk.
ț Criteria for metrics: SASB evaluates potential metrics against key criteria to identify those that present a fair representation and are useful, appli-cable, comparable, complete, verifiable, aligned with current practices, neutral, and distributive.
ț Commonly used metrics: SASB standards include quantitative metrics that have been commonly used by companies to describe performance on greenhouse gas emissions, water resource usage, energy use and “mix,” and more. SASB incorporates the relevant metrics by reference in the technical protocols for its standards, thereby maintaining the cost-effectiveness of the standards for companies. SASB leverages the longstanding technical work of organizations such as the World Resources Institute, the World Business Council on Sustainable Develop-ment, CDP, the Climate Disclosure Standards Board, and many others. Some commonly referenced metrics are on delineated in the metric tables.
ț Industry-specific metrics: Where industries face unique risks and opportunities related to climate risk, SASB’s standards include industry-specific metrics to capture company performance in those areas. SASB’s standards for the Oil & Gas – Explora-tion & Production and Coal Product industries, for
example, include quantitative metrics related to the carbon content of their hydrocarbon reserves and the sensitivity of these reserves to future price projection scenarios that account for a price on carbon emissions. As another example, SASB’s standards for the Investment Banking industry include metrics related to how environmental, social, and governance (ESG) factors are integrated into underwriting activities. And SASB’s Automobiles industry standard includes metrics related to fuel economy of vehicle fleets and sales of low-emission vehicles.
ț Approach to greenhouse gas emissions: Unlike other approaches, SASB does not recommend disclosure of direct (i.e., Scope 1) greenhouse gas emissions for all issuers. As stated in a recent article from ESG Magazine, “there is a long list of things that people use carbon footprinting for, but there is actually a weak relationship between the environ-mental risks and opportunities investors should be interested in and carbon intensity.” This is why SASB typically identifies a greenhouse gas emissions metric only for industries that are significant emit-ters of direct GHG emissions because our conceptual approach has determined these are the industries likely to face material impacts directly related to their emissions. (See Figure 3.) These impacts may manifest as regulatory risks and shifts in consumer demand, which in turn affect costs and revenues. Generally speaking, the less directly carbon-intensive an industry, the less likely these types of impacts are to directly affect those companies’ cash flows.
For industries that indirectly contribute to greenhouse gas emissions through their use of purchased electricity, SASB does not recommend disclosure of Scope 2 emissions. Instead SASB recommends metrics related to understanding the amount, type (i.e., conventional or renewable), and source (i.e., if it is self-generated or purchased) of energy. SASB research and engagement has concluded that these measures provide a better understanding of potential material risks related to indirect emissions than a Scope 2 emissions figure does.
For industries that indirectly contribute to greenhouse gas emission upstream (e.g., from purchased materials processing and transportation), downstream (e.g., from distribution and usage sold products), or in other ways (e.g., from employee commuting and business travel), SASB does not recommend
Recommended Climate Risk Disclosures by Industry
19 SASB.ORG
CLIMATE RISK TECHNICAL BULLETIN TB001-10182016
disclosure of Scope 3 emissions. Instead, where these emissions areas are likely to material, SASB recommends metrics directly related to performance in those areas.
QUALITATIVE DISCLOSURES
In addition to quantitative metrics, SASB standards include qualitative “discussion and analysis” disclosures. These guide issuers on making relevant, industry-specific disclosures of risks to the business from climate-related impacts and of how related factors are integrated into key business activities such as lending, investment analysis, product strategy, or supply chain management. Qualitative disclosures are an essential element of meaningful communication on climate and other sustainability topics. They allow management to communicate to investors factors necessary for the accurate understanding of climate risks and opportunities such as regulatory positioning, regional and local considerations, business structure (e.g., degree of vertical integration), and relevant acquisitions and divestitures.
RECOMMENDED CLIMATE-RELATED TOPICS AND METRICS IN SASB’S INDUSTRY-SPECIFIC STANDARDS
Taken together, the quantitative greenhouse gas emissions metrics, other climate impact metrics, industry-specific metrics, and qualitative disclosures in SASB’s standards provide investors with a comprehensive view of corporate issuers’ climate-related risks and opportunities.
The following metric tables list the climate-related topics and metrics included in SASB’s industry-specific standards. Because of SASB’s materiality focus, the standards provide corporate issuers with guidance on the small handful of climate-related metrics (four per industry, on average) that are likely to be decision-use-ful both internally for management and externally for investors. As is evident from the tables, SASB metrics are closely aligned with major climate-risk disclosure initiatives, including the CDP.
Note: In the following table, Alignment indicates metrics from other organizations or regulations that have a high degree of overlap with the SASB metric, but are not necessarily directly linked or cited in the SASB standard. Issuers will be able to utilize some or most the information they have prepared for these other purposes for disclosure to the SASB standard. Also, in the following table Source Documents include select references that underlie the SASB metric including other frameworks, standards, regulations and other resources. Issuers will find these useful reference points as they compile and prepared disclose to the SASB standard.
20 SASB.ORG
CLIMATE RISK TECHNICAL BULLETIN TB001-10182016
• Physical Effects
• Transition to a Low-Carbon, Resilient Economy
• Climate Regulation
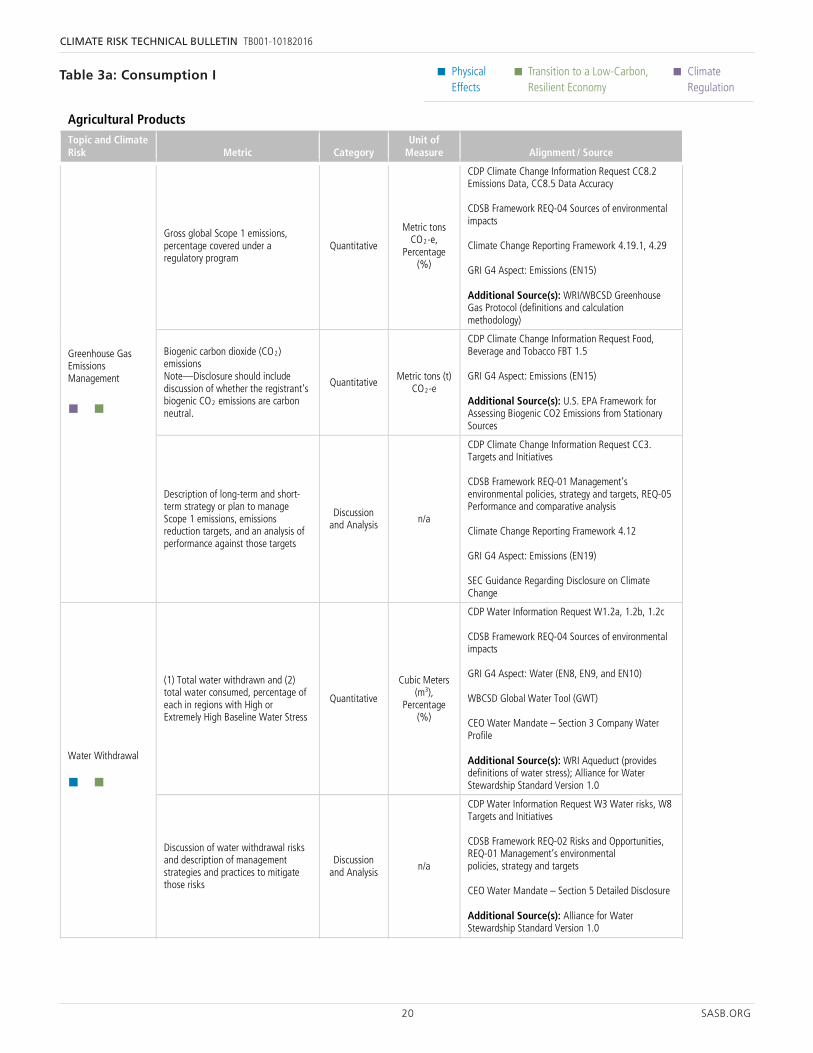
Table 3a: Consumption I
47 SASB.ORG
Physical Effects
Transition to a Low-Carbon, Resilient Economy
Climate Regulation
Agricultural Products Topic and Climate Risk Metric Category
Unit of Measure Alignment / Source
Greenhouse Gas Emissions Management
Gross global Scope 1 emissions, percentage covered under a regulatory program
Quantitative
Metric tons CO2-e,
Percentage (%)
CDP Climate Change Information Request CC8.2 Emissions Data, CC8.5 Data Accuracy CDSB Framework REQ-04 Sources of environmental impacts Climate Change Reporting Framework 4.19.1, 4.29 GRI G4 Aspect: Emissions (EN15) Additional Source(s): WRI/WBCSD Greenhouse Gas Protocol (definitions and calculation methodology)
Biogenic carbon dioxide (CO2) emissions Note—Disclosure should include discussion of whether the registrant‘s biogenic CO2 emissions are carbon neutral.
Quantitative Metric tons (t)
CO2-e
CDP Climate Change Information Request Food, Beverage and Tobacco FBT 1.5 GRI G4 Aspect: Emissions (EN15) Additional Source(s): U.S. EPA Framework for Assessing Biogenic CO2 Emissions from Stationary Sources
Description of long-term and short-term strategy or plan to manage Scope 1 emissions, emissions reduction targets, and an analysis of performance against those targets
Discussion and Analysis n/a
CDP Climate Change Information Request CC3. Targets and Initiatives CDSB Framework REQ-01 Management’s environmental policies, strategy and targets, REQ-05 Performance and comparative analysis Climate Change Reporting Framework 4.12 GRI G4 Aspect: Emissions (EN19) SEC Guidance Regarding Disclosure on Climate Change
Water Withdrawal
(1) Total water withdrawn and (2) total water consumed, percentage of each in regions with High or Extremely High Baseline Water Stress
Quantitative
Cubic Meters (m3),
Percentage (%)
CDP Water Information Request W1.2a, 1.2b, 1.2c CDSB Framework REQ-04 Sources of environmental impacts GRI G4 Aspect: Water (EN8, EN9, and EN10) WBCSD Global Water Tool (GWT) CEO Water Mandate – Section 3 Company Water Profile Additional Source(s): WRI Aqueduct (provides definitions of water stress); Alliance for Water Stewardship Standard Version 1.0
Discussion of water withdrawal risks and description of management strategies and practices to mitigate those risks
Discussion and Analysis
n/a
CDP Water Information Request W3 Water risks, W8 Targets and Initiatives CDSB Framework REQ-02 Risks and Opportunities, REQ-01 Management’s environmental policies, strategy and targets CEO Water Mandate – Section 5 Detailed Disclosure Additional Source(s): Alliance for Water Stewardship Standard Version 1.0
Energy & Fleet Fuel Management
Operational energy consumed, percentage grid electricity, percentage Quantitative Gigajoules,
Percentage CDP Climate Change Information Request CC11.2, CC11.3, CC3.1d
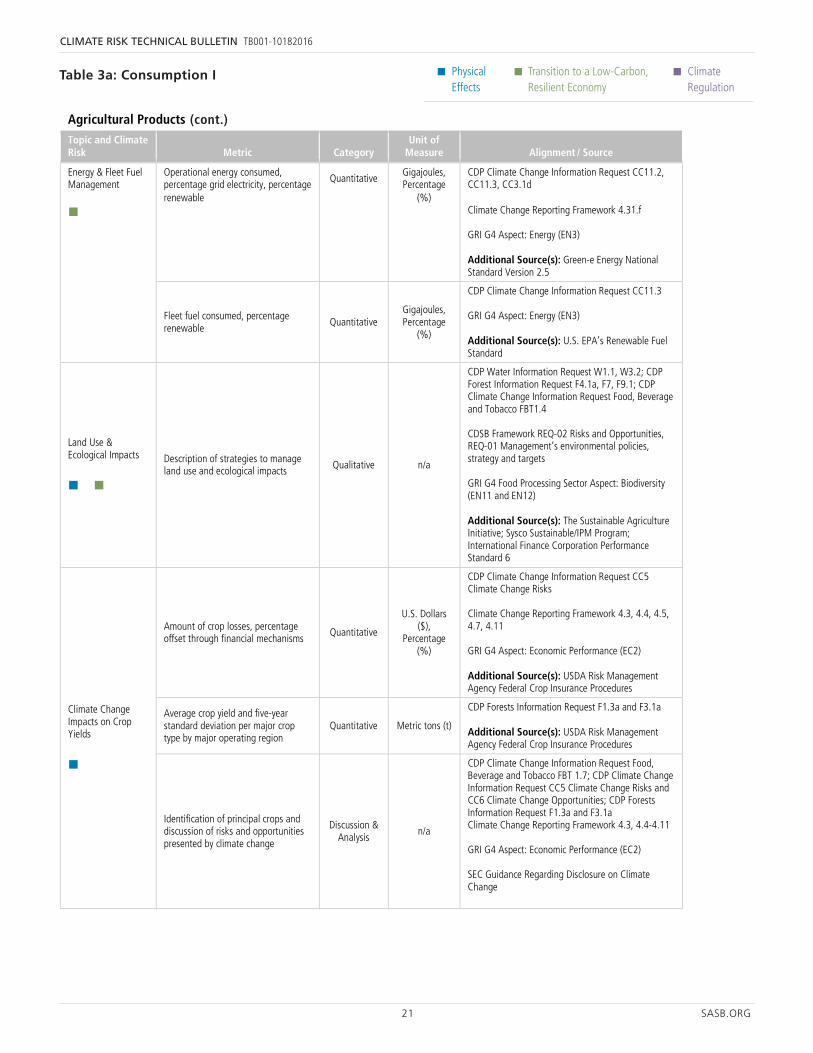
21 SASB.ORG
CLIMATE RISK TECHNICAL BULLETIN TB001-10182016
• Physical Effects
• Transition to a Low-Carbon, Resilient Economy
• Climate Regulation
48 SASB.ORG
Physical Effects
Transition to a Low-Carbon, Resilient Economy
Climate Regulation
Agricultural Products Topic and Climate Risk Metric Category
Unit of Measure Alignment / Source
renewable (%) Climate Change Reporting Framework 4.31.f GRI G4 Aspect: Energy (EN3) Additional Source(s): Green-e Energy National Standard Version 2.5
Fleet fuel consumed, percentage renewable
Quantitative Gigajoules, Percentage
(%)
CDP Climate Change Information Request CC11.3 GRI G4 Aspect: Energy (EN3) Additional Source(s): U.S. EPA’s Renewable Fuel Standard
Land Use & Ecological Impacts
Description of strategies to manage land use and ecological impacts Qualitative n/a
CDP Water Information Request W1.1, W3.2; CDP Forest Information Request F4.1a, F7, F9.1; CDP Climate Change Information Request Food, Beverage and Tobacco FBT1.4 CDSB Framework REQ-02 Risks and Opportunities, REQ-01 Management’s environmental policies, strategy and targets GRI G4 Food Processing Sector Aspect: Biodiversity (EN11 and EN12) Additional Source(s): The Sustainable Agriculture Initiative; Sysco Sustainable/IPM Program; International Finance Corporation Performance Standard 6
Climate Change Impacts on Crop Yields
Amount of crop losses, percentage offset through financial mechanisms Quantitative
U.S. Dollars ($),
Percentage (%)
CDP Climate Change Information Request CC5 Climate Change Risks Climate Change Reporting Framework 4.3, 4.4, 4.5, 4.7, 4.11 GRI G4 Aspect: Economic Performance (EC2) Additional Source(s): USDA Risk Management Agency Federal Crop Insurance Procedures
Average crop yield and five-year standard deviation per major crop type by major operating region
Quantitative Metric tons (t)
CDP Forests Information Request F1.3a and F3.1a Additional Source(s): USDA Risk Management Agency Federal Crop Insurance Procedures
Identification of principal crops and discussion of risks and opportunities presented by climate change
Discussion & Analysis n/a
CDP Climate Change Information Request Food, Beverage and Tobacco FBT 1.7; CDP Climate Change Information Request CC5 Climate Change Risks and CC6 Climate Change Opportunities; CDP Forests Information Request F1.3a and F3.1a Climate Change Reporting Framework 4.3, 4.4-4.11 GRI G4 Aspect: Economic Performance (EC2) SEC Guidance Regarding Disclosure on Climate Change
Environmental & Social Impacts of Ingredient Supply Chains
Percentage of agricultural raw materials sourced from regions with High or Extremely High Baseline Water Stress
Quantitative Percentage (%) by spend
CDP Water Information Request W3.2d CDSB Framework REQ-02 Risks and Opportunities, REQ-01 Management’s environmental policies, strategy and targets n/a
Table 3a: Consumption I
47 SASB.ORG
Physical Effects
Transition to a Low-Carbon, Resilient Economy
Climate Regulation
Agricultural Products Topic and Climate Risk Metric Category
Unit of Measure Alignment / Source
Greenhouse Gas Emissions Management
Gross global Scope 1 emissions, percentage covered under a regulatory program
Quantitative
Metric tons CO2-e,
Percentage (%)
CDP Climate Change Information Request CC8.2 Emissions Data, CC8.5 Data Accuracy CDSB Framework REQ-04 Sources of environmental impacts Climate Change Reporting Framework 4.19.1, 4.29 GRI G4 Aspect: Emissions (EN15) Additional Source(s): WRI/WBCSD Greenhouse Gas Protocol (definitions and calculation methodology)
Biogenic carbon dioxide (CO2) emissions Note—Disclosure should include discussion of whether the registrant‘s biogenic CO2 emissions are carbon neutral.
Quantitative Metric tons (t)
CO2-e
CDP Climate Change Information Request Food, Beverage and Tobacco FBT 1.5 GRI G4 Aspect: Emissions (EN15) Additional Source(s): U.S. EPA Framework for Assessing Biogenic CO2 Emissions from Stationary Sources
Description of long-term and short-term strategy or plan to manage Scope 1 emissions, emissions reduction targets, and an analysis of performance against those targets
Discussion and Analysis n/a
CDP Climate Change Information Request CC3. Targets and Initiatives CDSB Framework REQ-01 Management’s environmental policies, strategy and targets, REQ-05 Performance and comparative analysis Climate Change Reporting Framework 4.12 GRI G4 Aspect: Emissions (EN19) SEC Guidance Regarding Disclosure on Climate Change
Water Withdrawal
(1) Total water withdrawn and (2) total water consumed, percentage of each in regions with High or Extremely High Baseline Water Stress
Quantitative
Cubic Meters (m3),
Percentage (%)
CDP Water Information Request W1.2a, 1.2b, 1.2c CDSB Framework REQ-04 Sources of environmental impacts GRI G4 Aspect: Water (EN8, EN9, and EN10) WBCSD Global Water Tool (GWT) CEO Water Mandate – Section 3 Company Water Profile Additional Source(s): WRI Aqueduct (provides definitions of water stress); Alliance for Water Stewardship Standard Version 1.0
Discussion of water withdrawal risks and description of management strategies and practices to mitigate those risks
Discussion and Analysis
n/a
CDP Water Information Request W3 Water risks, W8 Targets and Initiatives CDSB Framework REQ-02 Risks and Opportunities, REQ-01 Management’s environmental policies, strategy and targets CEO Water Mandate – Section 5 Detailed Disclosure Additional Source(s): Alliance for Water Stewardship Standard Version 1.0
Energy & Fleet Fuel Management
Operational energy consumed, percentage grid electricity, percentage Quantitative Gigajoules,
Percentage CDP Climate Change Information Request CC11.2, CC11.3, CC3.1d
(cont.)
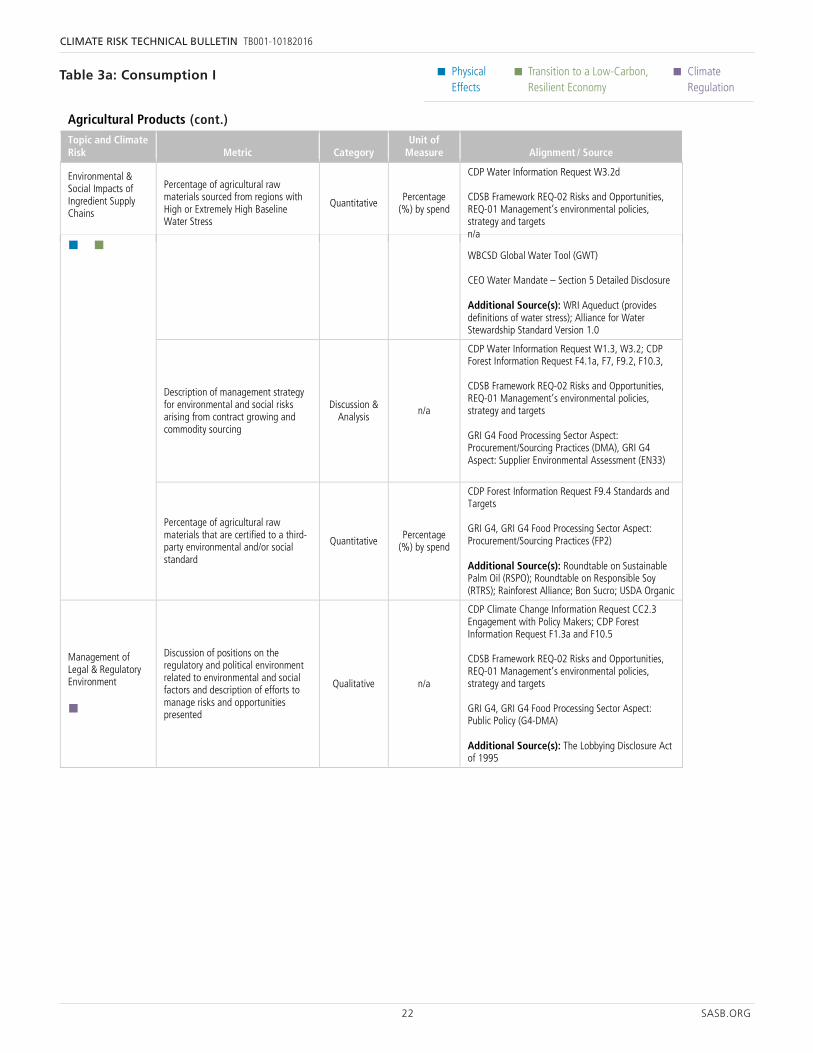
22 SASB.ORG
CLIMATE RISK TECHNICAL BULLETIN TB001-10182016
• Physical Effects
• Transition to a Low-Carbon, Resilient Economy
• Climate Regulation
49 SASB.ORG
Physical Effects
Transition to a Low-Carbon, Resilient Economy
Climate Regulation
Agricultural Products Topic and Climate Risk Metric Category
Unit of Measure Alignment / Source
WBCSD Global Water Tool (GWT) CEO Water Mandate – Section 5 Detailed Disclosure Additional Source(s): WRI Aqueduct (provides definitions of water stress); Alliance for Water Stewardship Standard Version 1.0
Description of management strategy for environmental and social risks arising from contract growing and commodity sourcing
Discussion & Analysis n/a
CDP Water Information Request W1.3, W3.2; CDP Forest Information Request F4.1a, F7, F9.2, F10.3, CDSB Framework REQ-02 Risks and Opportunities, REQ-01 Management’s environmental policies, strategy and targets GRI G4 Food Processing Sector Aspect: Procurement/Sourcing Practices (DMA), GRI G4 Aspect: Supplier Environmental Assessment (EN33)
Percentage of agricultural raw materials that are certified to a third-party environmental and/or social standard
Quantitative Percentage
(%) by spend
CDP Forest Information Request F9.4 Standards and Targets GRI G4, GRI G4 Food Processing Sector Aspect: Procurement/Sourcing Practices (FP2) Additional Source(s): Roundtable on Sustainable Palm Oil (RSPO); Roundtable on Responsible Soy (RTRS); Rainforest Alliance; Bon Sucro; USDA Organic
Management of Legal & Regulatory Environment
Discussion of positions on the regulatory and political environment related to environmental and social factors and description of efforts to manage risks and opportunities presented
Qualitative n/a
CDP Climate Change Information Request CC2.3 Engagement with Policy Makers; CDP Forest Information Request F1.3a and F10.5 CDSB Framework REQ-02 Risks and Opportunities, REQ-01 Management’s environmental policies, strategy and targets GRI G4, GRI G4 Food Processing Sector Aspect: Public Policy (G4-DMA) Additional Source(s): The Lobbying Disclosure Act of 1995
Meat, Poultry & Dairy Topic and Climate Risk Metric Category
Unit of Measure Alignment / Source
Greenhouse Gas Emissions Management
Gross global Scope 1 emissions, percentage covered under a regulatory program
Quantitative
Metric tons CO2-e,
Percentage (%)
CDP Climate Change Information Request CC8.2 Emissions Data, CC8.5 Data Accuracy CDSB Framework REQ-04 Sources of environmental impacts Climate Change Reporting Framework 4.19.1, 4.29 GRI G4 Aspect: Emissions (EN15) Additional Source(s): WRI/WBCSD Greenhouse Gas Protocol (definitions and calculation methodology)
Table 3a: Consumption I
48 SASB.ORG
Physical Effects
Transition to a Low-Carbon, Resilient Economy
Climate Regulation
Agricultural Products Topic and Climate Risk Metric Category
Unit of Measure Alignment / Source
renewable (%) Climate Change Reporting Framework 4.31.f GRI G4 Aspect: Energy (EN3) Additional Source(s): Green-e Energy National Standard Version 2.5
Fleet fuel consumed, percentage renewable
Quantitative Gigajoules, Percentage
(%)
CDP Climate Change Information Request CC11.3 GRI G4 Aspect: Energy (EN3) Additional Source(s): U.S. EPA’s Renewable Fuel Standard
Land Use & Ecological Impacts
Description of strategies to manage land use and ecological impacts Qualitative n/a
CDP Water Information Request W1.1, W3.2; CDP Forest Information Request F4.1a, F7, F9.1; CDP Climate Change Information Request Food, Beverage and Tobacco FBT1.4 CDSB Framework REQ-02 Risks and Opportunities, REQ-01 Management’s environmental policies, strategy and targets GRI G4 Food Processing Sector Aspect: Biodiversity (EN11 and EN12) Additional Source(s): The Sustainable Agriculture Initiative; Sysco Sustainable/IPM Program; International Finance Corporation Performance Standard 6
Climate Change Impacts on Crop Yields
Amount of crop losses, percentage offset through financial mechanisms Quantitative
U.S. Dollars ($),
Percentage (%)
CDP Climate Change Information Request CC5 Climate Change Risks Climate Change Reporting Framework 4.3, 4.4, 4.5, 4.7, 4.11 GRI G4 Aspect: Economic Performance (EC2) Additional Source(s): USDA Risk Management Agency Federal Crop Insurance Procedures
Average crop yield and five-year standard deviation per major crop type by major operating region
Quantitative Metric tons (t)
CDP Forests Information Request F1.3a and F3.1a Additional Source(s): USDA Risk Management Agency Federal Crop Insurance Procedures
Identification of principal crops and discussion of risks and opportunities presented by climate change
Discussion & Analysis n/a
CDP Climate Change Information Request Food, Beverage and Tobacco FBT 1.7; CDP Climate Change Information Request CC5 Climate Change Risks and CC6 Climate Change Opportunities; CDP Forests Information Request F1.3a and F3.1a Climate Change Reporting Framework 4.3, 4.4-4.11 GRI G4 Aspect: Economic Performance (EC2) SEC Guidance Regarding Disclosure on Climate Change
Environmental & Social Impacts of Ingredient Supply Chains
Percentage of agricultural raw materials sourced from regions with High or Extremely High Baseline Water Stress
Quantitative Percentage (%) by spend
CDP Water Information Request W3.2d CDSB Framework REQ-02 Risks and Opportunities, REQ-01 Management’s environmental policies, strategy and targets n/a
(cont.)
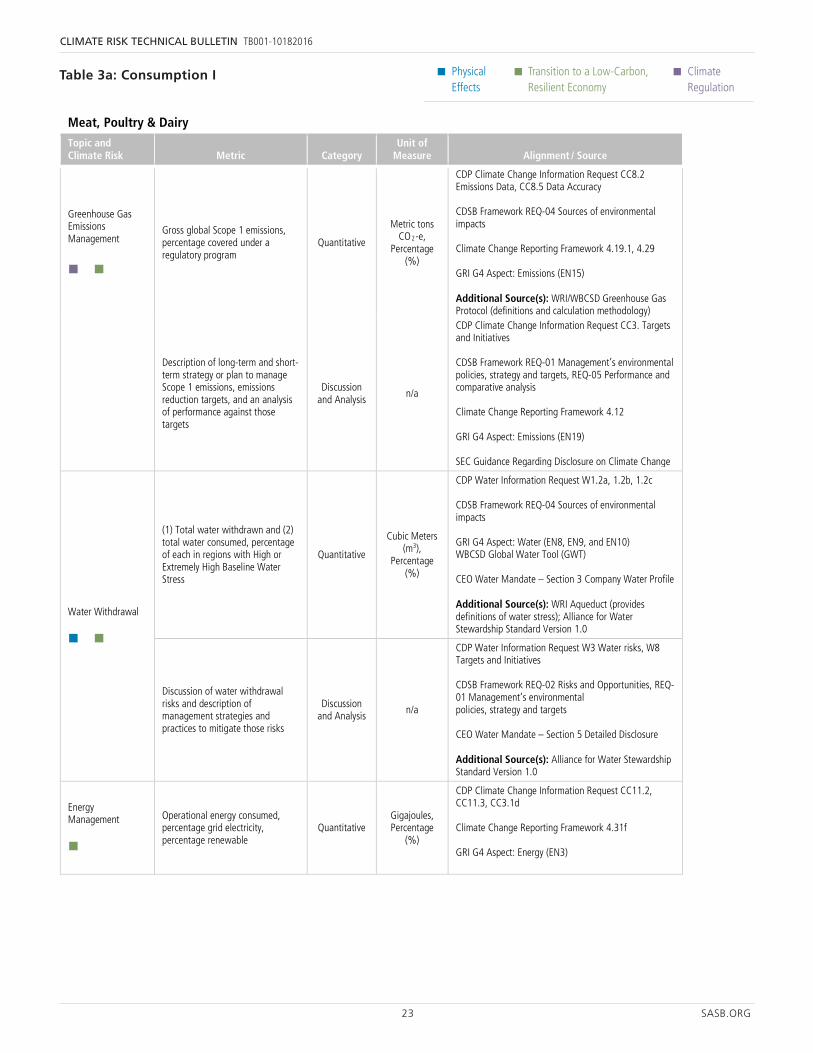
23 SASB.ORG
CLIMATE RISK TECHNICAL BULLETIN TB001-10182016
• Physical Effects
• Transition to a Low-Carbon, Resilient Economy
• Climate Regulation
50 SASB.ORG
Physical Effects
Transition to a Low-Carbon, Resilient Economy
Climate Regulation
Meat, Poultry & Dairy Topic and Climate Risk Metric Category
Unit of Measure Alignment / Source
Description of long-term and short-term strategy or plan to manage Scope 1 emissions, emissions reduction targets, and an analysis of performance against those targets
Discussion and Analysis
n/a
CDP Climate Change Information Request CC3. Targets and Initiatives CDSB Framework REQ-01 Management’s environmental policies, strategy and targets, REQ-05 Performance and comparative analysis Climate Change Reporting Framework 4.12 GRI G4 Aspect: Emissions (EN19) SEC Guidance Regarding Disclosure on Climate Change
Water Withdrawal
(1) Total water withdrawn and (2) total water consumed, percentage of each in regions with High or Extremely High Baseline Water Stress
Quantitative
Cubic Meters (m3),
Percentage (%)
CDP Water Information Request W1.2a, 1.2b, 1.2c CDSB Framework REQ-04 Sources of environmental impacts GRI G4 Aspect: Water (EN8, EN9, and EN10) WBCSD Global Water Tool (GWT) CEO Water Mandate – Section 3 Company Water Profile Additional Source(s): WRI Aqueduct (provides definitions of water stress); Alliance for Water Stewardship Standard Version 1.0
Discussion of water withdrawal risks and description of management strategies and practices to mitigate those risks
Discussion and Analysis
n/a
CDP Water Information Request W3 Water risks, W8 Targets and Initiatives CDSB Framework REQ-02 Risks and Opportunities, REQ-01 Management’s environmental policies, strategy and targets CEO Water Mandate – Section 5 Detailed Disclosure Additional Source(s): Alliance for Water Stewardship Standard Version 1.0
Energy Management
Operational energy consumed, percentage grid electricity, percentage renewable
Quantitative Gigajoules, Percentage
(%)
CDP Climate Change Information Request CC11.2, CC11.3, CC3.1d Climate Change Reporting Framework 4.31f GRI G4 Aspect: Energy (EN3)
Land Use & Ecological Impacts
Amount of animal litter and manure generated, percentage managed according to a nutrient management plan
Quantitative
Metric tons (t),
Percentage (%)
CDP Climate Change Information Request Food, Beverage and Tobacco FBT1.4 Own Farm(s) pathway; CDP Forests Information Request F8.4, F9.1, F9.6 Additional Source(s): Natural Resources Conservation Service (NRCS) Comprehensive Nutrient Management Plan (CNMP)
Percentage of pasture and grazing land managed to NRCS Conservation Plan criteria
Quantitative Percentage by hectares (%)
CDP Climate Change Information Request Food, Beverage and Tobacco FBT1.4 Own farm(s) pathway; CDP Forests Information Request F8.2a, F8.4, F9.1, F9.6 Additional Source(s): Natural Resources Conservation Service (NRCS) Comprehensive Nutrient Management Plan (CNMP)
Environmental & Social Impacts of
Percentage of contract producers in regions with High or Extremely
Quantitative Percentage by contract value
CDP Water Information Request W3.2d
Table 3a: Consumption I
49 SASB.ORG
Physical Effects
Transition to a Low-Carbon, Resilient Economy
Climate Regulation
Agricultural Products Topic and Climate Risk Metric Category
Unit of Measure Alignment / Source
WBCSD Global Water Tool (GWT) CEO Water Mandate – Section 5 Detailed Disclosure Additional Source(s): WRI Aqueduct (provides definitions of water stress); Alliance for Water Stewardship Standard Version 1.0
Description of management strategy for environmental and social risks arising from contract growing and commodity sourcing
Discussion & Analysis n/a
CDP Water Information Request W1.3, W3.2; CDP Forest Information Request F4.1a, F7, F9.2, F10.3, CDSB Framework REQ-02 Risks and Opportunities, REQ-01 Management’s environmental policies, strategy and targets GRI G4 Food Processing Sector Aspect: Procurement/Sourcing Practices (DMA), GRI G4 Aspect: Supplier Environmental Assessment (EN33)
Percentage of agricultural raw materials that are certified to a third-party environmental and/or social standard
Quantitative Percentage
(%) by spend
CDP Forest Information Request F9.4 Standards and Targets GRI G4, GRI G4 Food Processing Sector Aspect: Procurement/Sourcing Practices (FP2) Additional Source(s): Roundtable on Sustainable Palm Oil (RSPO); Roundtable on Responsible Soy (RTRS); Rainforest Alliance; Bon Sucro; USDA Organic
Management of Legal & Regulatory Environment
Discussion of positions on the regulatory and political environment related to environmental and social factors and description of efforts to manage risks and opportunities presented
Qualitative n/a
CDP Climate Change Information Request CC2.3 Engagement with Policy Makers; CDP Forest Information Request F1.3a and F10.5 CDSB Framework REQ-02 Risks and Opportunities, REQ-01 Management’s environmental policies, strategy and targets GRI G4, GRI G4 Food Processing Sector Aspect: Public Policy (G4-DMA) Additional Source(s): The Lobbying Disclosure Act of 1995
Meat, Poultry & Dairy Topic and Climate Risk Metric Category
Unit of Measure Alignment / Source
Greenhouse Gas Emissions Management
Gross global Scope 1 emissions, percentage covered under a regulatory program
Quantitative
Metric tons CO2-e,
Percentage (%)
CDP Climate Change Information Request CC8.2 Emissions Data, CC8.5 Data Accuracy CDSB Framework REQ-04 Sources of environmental impacts Climate Change Reporting Framework 4.19.1, 4.29 GRI G4 Aspect: Emissions (EN15) Additional Source(s): WRI/WBCSD Greenhouse Gas Protocol (definitions and calculation methodology)
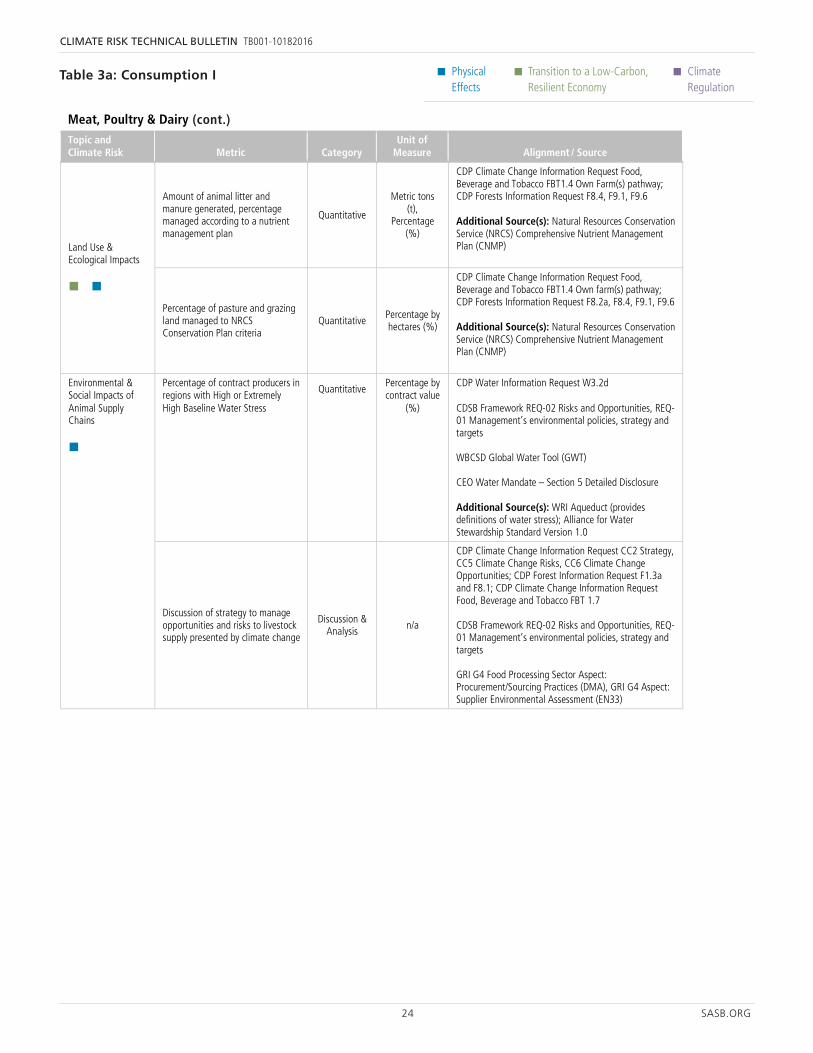
24 SASB.ORG
CLIMATE RISK TECHNICAL BULLETIN TB001-10182016
• Physical Effects
• Transition to a Low-Carbon, Resilient Economy
• Climate Regulation
51 SASB.ORG
Physical Effects
Transition to a Low-Carbon, Resilient Economy
Climate Regulation
Meat, Poultry & Dairy Topic and Climate Risk Metric Category
Unit of Measure Alignment / Source
Animal Supply Chains
High Baseline Water Stress (%) CDSB Framework REQ-02 Risks and Opportunities, REQ-01 Management’s environmental policies, strategy and targets WBCSD Global Water Tool (GWT) CEO Water Mandate – Section 5 Detailed Disclosure Additional Source(s): WRI Aqueduct (provides definitions of water stress); Alliance for Water Stewardship Standard Version 1.0
Discussion of strategy to manage opportunities and risks to livestock supply presented by climate change
Discussion & Analysis n/a
CDP Climate Change Information Request CC2 Strategy, CC5 Climate Change Risks, CC6 Climate Change Opportunities; CDP Forest Information Request F1.3a and F8.1; CDP Climate Change Information Request Food, Beverage and Tobacco FBT 1.7 CDSB Framework REQ-02 Risks and Opportunities, REQ-01 Management’s environmental policies, strategy and targets GRI G4 Food Processing Sector Aspect: Procurement/Sourcing Practices (DMA), GRI G4 Aspect: Supplier Environmental Assessment (EN33)
Environmental Risks in Animal Feed Supply Chains
Percentage of feed sourced from regions with High or Extremely High Baseline Water Stress
Quantitative Percentage (%) by spend
CDP Water Information Request W3.2d CDSB Framework REQ-02 Risks and Opportunities, REQ-01 Management’s environmental policies, strategy and targets WBCSD Global Water Tool (GWT) CEO Water Mandate – Section 5 Detailed Disclosure Additional Source(s): WRI Aqueduct (provides definitions of water stress); Alliance for Water Stewardship Standard Version 1.0
Discussion of strategy to manage opportunities and risks to feed sourcing presented by climate change
Discussion & Analysis n/a
CDP Supply Chain Climate Change Information Request CC2 Strategy, CC5 Climate Change Risks, CC6 Climate Change Opportunities; CDP Forest Information Request F1.3a and F8.1; CDP Climate Change Information Request Food, Beverage and Tobacco FBT 1.7 CDSB Framework REQ-02 Risks and Opportunities, REQ-01 Management’s environmental policies, strategy and targets GRI G4 Food Processing Sector Aspect: Procurement/Sourcing Practices (DMA), GRI G4 Aspect: Supplier Environmental Assessment (EN33)
Table 3a: Consumption I
50 SASB.ORG
Physical Effects
Transition to a Low-Carbon, Resilient Economy
Climate Regulation
Meat, Poultry & Dairy Topic and Climate Risk Metric Category
Unit of Measure Alignment / Source
Description of long-term and short-term strategy or plan to manage Scope 1 emissions, emissions reduction targets, and an analysis of performance against those targets
Discussion and Analysis
n/a
CDP Climate Change Information Request CC3. Targets and Initiatives CDSB Framework REQ-01 Management’s environmental policies, strategy and targets, REQ-05 Performance and comparative analysis Climate Change Reporting Framework 4.12 GRI G4 Aspect: Emissions (EN19) SEC Guidance Regarding Disclosure on Climate Change
Water Withdrawal
(1) Total water withdrawn and (2) total water consumed, percentage of each in regions with High or Extremely High Baseline Water Stress
Quantitative
Cubic Meters (m3),
Percentage (%)
CDP Water Information Request W1.2a, 1.2b, 1.2c CDSB Framework REQ-04 Sources of environmental impacts GRI G4 Aspect: Water (EN8, EN9, and EN10) WBCSD Global Water Tool (GWT) CEO Water Mandate – Section 3 Company Water Profile Additional Source(s): WRI Aqueduct (provides definitions of water stress); Alliance for Water Stewardship Standard Version 1.0
Discussion of water withdrawal risks and description of management strategies and practices to mitigate those risks
Discussion and Analysis
n/a
CDP Water Information Request W3 Water risks, W8 Targets and Initiatives CDSB Framework REQ-02 Risks and Opportunities, REQ-01 Management’s environmental policies, strategy and targets CEO Water Mandate – Section 5 Detailed Disclosure Additional Source(s): Alliance for Water Stewardship Standard Version 1.0
Energy Management
Operational energy consumed, percentage grid electricity, percentage renewable
Quantitative Gigajoules, Percentage
(%)
CDP Climate Change Information Request CC11.2, CC11.3, CC3.1d Climate Change Reporting Framework 4.31f GRI G4 Aspect: Energy (EN3)
Land Use & Ecological Impacts
Amount of animal litter and manure generated, percentage managed according to a nutrient management plan
Quantitative
Metric tons (t),
Percentage (%)
CDP Climate Change Information Request Food, Beverage and Tobacco FBT1.4 Own Farm(s) pathway; CDP Forests Information Request F8.4, F9.1, F9.6 Additional Source(s): Natural Resources Conservation Service (NRCS) Comprehensive Nutrient Management Plan (CNMP)
Percentage of pasture and grazing land managed to NRCS Conservation Plan criteria
Quantitative Percentage by hectares (%)
CDP Climate Change Information Request Food, Beverage and Tobacco FBT1.4 Own farm(s) pathway; CDP Forests Information Request F8.2a, F8.4, F9.1, F9.6 Additional Source(s): Natural Resources Conservation Service (NRCS) Comprehensive Nutrient Management Plan (CNMP)
Environmental & Social Impacts of
Percentage of contract producers in regions with High or Extremely
Quantitative Percentage by contract value
CDP Water Information Request W3.2d
51 SASB.ORG
Physical Effects
Transition to a Low-Carbon, Resilient Economy
Climate Regulation
Meat, Poultry & Dairy Topic and Climate Risk Metric Category
Unit of Measure Alignment / Source
Animal Supply Chains
High Baseline Water Stress (%) CDSB Framework REQ-02 Risks and Opportunities, REQ-01 Management’s environmental policies, strategy and targets WBCSD Global Water Tool (GWT) CEO Water Mandate – Section 5 Detailed Disclosure Additional Source(s): WRI Aqueduct (provides definitions of water stress); Alliance for Water Stewardship Standard Version 1.0
Discussion of strategy to manage opportunities and risks to livestock supply presented by climate change
Discussion & Analysis n/a
CDP Climate Change Information Request CC2 Strategy, CC5 Climate Change Risks, CC6 Climate Change Opportunities; CDP Forest Information Request F1.3a and F8.1; CDP Climate Change Information Request Food, Beverage and Tobacco FBT 1.7 CDSB Framework REQ-02 Risks and Opportunities, REQ-01 Management’s environmental policies, strategy and targets GRI G4 Food Processing Sector Aspect: Procurement/Sourcing Practices (DMA), GRI G4 Aspect: Supplier Environmental Assessment (EN33)
Environmental Risks in Animal Feed Supply Chains
Percentage of feed sourced from regions with High or Extremely High Baseline Water Stress
Quantitative Percentage (%) by spend
CDP Water Information Request W3.2d CDSB Framework REQ-02 Risks and Opportunities, REQ-01 Management’s environmental policies, strategy and targets WBCSD Global Water Tool (GWT) CEO Water Mandate – Section 5 Detailed Disclosure Additional Source(s): WRI Aqueduct (provides definitions of water stress); Alliance for Water Stewardship Standard Version 1.0
Discussion of strategy to manage opportunities and risks to feed sourcing presented by climate change
Discussion & Analysis n/a
CDP Supply Chain Climate Change Information Request CC2 Strategy, CC5 Climate Change Risks, CC6 Climate Change Opportunities; CDP Forest Information Request F1.3a and F8.1; CDP Climate Change Information Request Food, Beverage and Tobacco FBT 1.7 CDSB Framework REQ-02 Risks and Opportunities, REQ-01 Management’s environmental policies, strategy and targets GRI G4 Food Processing Sector Aspect: Procurement/Sourcing Practices (DMA), GRI G4 Aspect: Supplier Environmental Assessment (EN33)
(cont.)
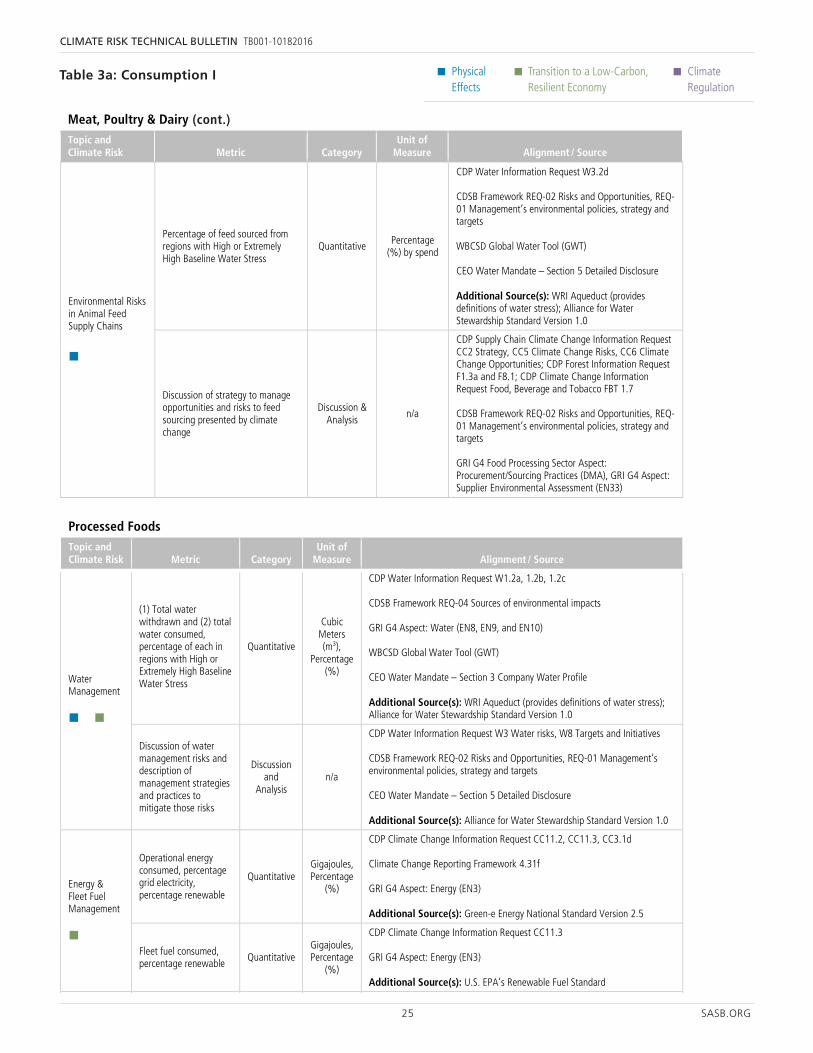
25 SASB.ORG
CLIMATE RISK TECHNICAL BULLETIN TB001-10182016
• Physical Effects
• Transition to a Low-Carbon, Resilient Economy
• Climate Regulation
Table 3a: Consumption I
51 SASB.ORG
Physical Effects
Transition to a Low-Carbon, Resilient Economy
Climate Regulation
Meat, Poultry & Dairy Topic and Climate Risk Metric Category
Unit of Measure Alignment / Source
Animal Supply Chains
High Baseline Water Stress (%) CDSB Framework REQ-02 Risks and Opportunities, REQ-01 Management’s environmental policies, strategy and targets WBCSD Global Water Tool (GWT) CEO Water Mandate – Section 5 Detailed Disclosure Additional Source(s): WRI Aqueduct (provides definitions of water stress); Alliance for Water Stewardship Standard Version 1.0
Discussion of strategy to manage opportunities and risks to livestock supply presented by climate change
Discussion & Analysis n/a
CDP Climate Change Information Request CC2 Strategy, CC5 Climate Change Risks, CC6 Climate Change Opportunities; CDP Forest Information Request F1.3a and F8.1; CDP Climate Change Information Request Food, Beverage and Tobacco FBT 1.7 CDSB Framework REQ-02 Risks and Opportunities, REQ-01 Management’s environmental policies, strategy and targets GRI G4 Food Processing Sector Aspect: Procurement/Sourcing Practices (DMA), GRI G4 Aspect: Supplier Environmental Assessment (EN33)
Environmental Risks in Animal Feed Supply Chains
Percentage of feed sourced from regions with High or Extremely High Baseline Water Stress
Quantitative Percentage (%) by spend
CDP Water Information Request W3.2d CDSB Framework REQ-02 Risks and Opportunities, REQ-01 Management’s environmental policies, strategy and targets WBCSD Global Water Tool (GWT) CEO Water Mandate – Section 5 Detailed Disclosure Additional Source(s): WRI Aqueduct (provides definitions of water stress); Alliance for Water Stewardship Standard Version 1.0
Discussion of strategy to manage opportunities and risks to feed sourcing presented by climate change
Discussion & Analysis n/a
CDP Supply Chain Climate Change Information Request CC2 Strategy, CC5 Climate Change Risks, CC6 Climate Change Opportunities; CDP Forest Information Request F1.3a and F8.1; CDP Climate Change Information Request Food, Beverage and Tobacco FBT 1.7 CDSB Framework REQ-02 Risks and Opportunities, REQ-01 Management’s environmental policies, strategy and targets GRI G4 Food Processing Sector Aspect: Procurement/Sourcing Practices (DMA), GRI G4 Aspect: Supplier Environmental Assessment (EN33)
52 SASB.ORG
Physical Effects
Transition to a Low-Carbon, Resilient Economy
Climate Regulation
Processed Foods Topic and Climate Risk Metric Category
Unit of Measure Alignment / Source
Water Management
(1) Total water withdrawn and (2) total water consumed, percentage of each in regions with High or Extremely High Baseline Water Stress
Quantitative
Cubic Meters (m3),
Percentage (%)
CDP Water Information Request W1.2a, 1.2b, 1.2c CDSB Framework REQ-04 Sources of environmental impacts GRI G4 Aspect: Water (EN8, EN9, and EN10) WBCSD Global Water Tool (GWT) CEO Water Mandate – Section 3 Company Water Profile Additional Source(s): WRI Aqueduct (provides definitions of water stress); Alliance for Water Stewardship Standard Version 1.0
Discussion of water management risks and description of management strategies and practices to mitigate those risks
Discussion and
Analysis n/a
CDP Water Information Request W3 Water risks, W8 Targets and Initiatives CDSB Framework REQ-02 Risks and Opportunities, REQ-01 Management’s environmental policies, strategy and targets CEO Water Mandate – Section 5 Detailed Disclosure Additional Source(s): Alliance for Water Stewardship Standard Version 1.0
Energy & Fleet Fuel Management
Operational energy consumed, percentage grid electricity, percentage renewable
Quantitative Gigajoules, Percentage
(%)
CDP Climate Change Information Request CC11.2, CC11.3, CC3.1d Climate Change Reporting Framework 4.31f GRI G4 Aspect: Energy (EN3) Additional Source(s): Green-e Energy National Standard Version 2.5
Fleet fuel consumed, percentage renewable
Quantitative Gigajoules, Percentage
(%)
CDP Climate Change Information Request CC11.3 GRI G4 Aspect: Energy (EN3) Additional Source(s): U.S. EPA’s Renewable Fuel Standard
Environmental & Social Impacts of Ingredient Supply Chains
Percentage of food ingredients sourced from regions with High or Extremely High Baseline Water Stress
Quantitative Percentage
(%) by spend
CDP Water Information Request W3.2d CDSB Framework REQ-02 Risks and Opportunities, REQ-01 Management’s environmental policies, strategy and targets WBCSD Global Water Tool (GWT) CEO Water Mandate – Section 5 Detailed Disclosure Additional Source(s): WRI Aqueduct (provides definitions of water stress); Alliance for Water Stewardship Standard Version 1.0
Percentage of food ingredients sourced that are certified to third-party environmental and/or social standards, by certification scheme
Quantitative Percentage
(%) by spend
CDP Forest Information Request F9.4 GRI G4 Food Processing Sector Aspect: Procurement/Sourcing Practices (FP2) Additional Source(s): Roundtable on Sustainable Palm Oil (RSPO); Roundtable on Responsible Soy (RTRS); Rainforest Alliance; Bon Sucro; USDA Organic
List of priority food ingredients and discussion of sourcing risks due to environmental and social considerations
Discussion & Analysis n/a
CDP Climate Change Information Request CC2 Strategy and CC5 Climate Change Risks; CDP Forests Information Requests 1.3a, F2. Risk assessment, F3 Risks, F8 Policies, F10 Engagement CDSB Framework REQ-02 Risks and Opportunities, REQ-01 Management’s environmental policies, strategy and targets GRI G4 Food Processing Sector Aspect: Procurement/Sourcing Practices (DMA),
(cont.)
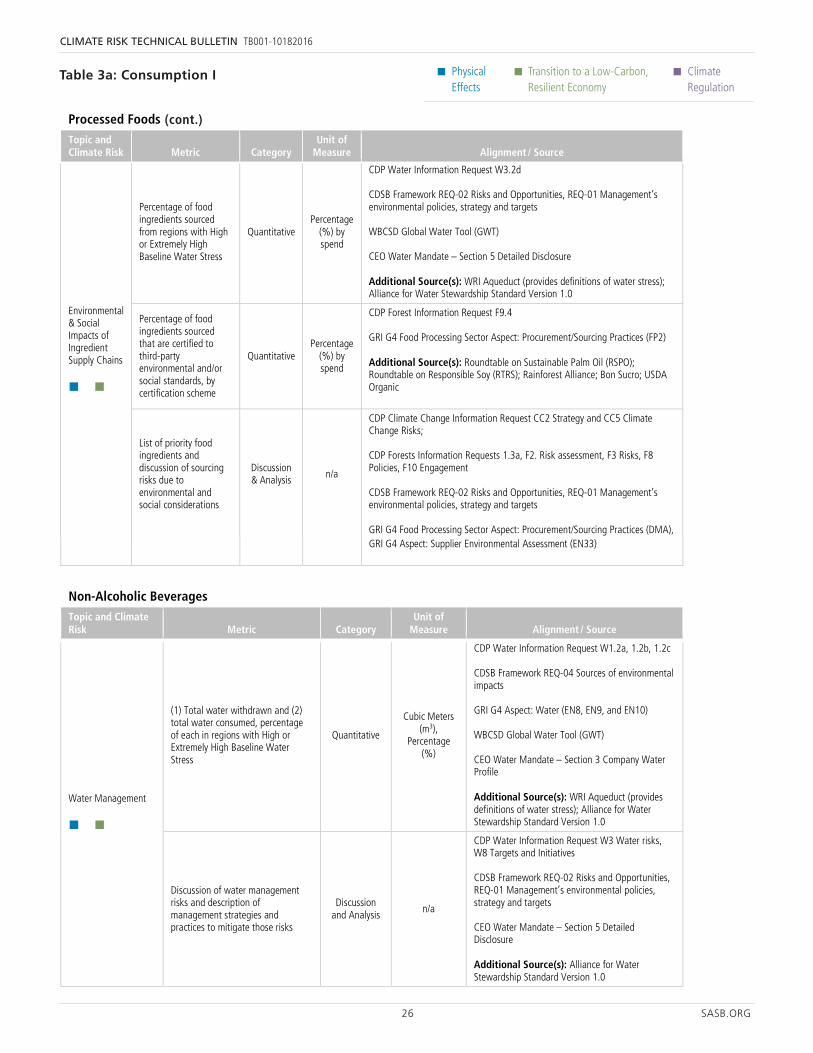
26 SASB.ORG
CLIMATE RISK TECHNICAL BULLETIN TB001-10182016
• Physical Effects
• Transition to a Low-Carbon, Resilient Economy
• Climate Regulation
53 SASB.ORG
Physical Effects
Transition to a Low-Carbon, Resilient Economy
Climate Regulation
Processed Foods Topic and Climate Risk Metric Category
Unit of Measure Alignment / Source
GRI G4 Aspect: Supplier Environmental Assessment (EN33)
Non-Alcoholic Beverages Topic and Climate Risk Metric Category
Unit of Measure Alignment / Source
Water Management
(1) Total water withdrawn and (2) total water consumed, percentage of each in regions with High or Extremely High Baseline Water Stress
Quantitative
Cubic Meters (m3),
Percentage (%)
CDP Water Information Request W1.2a, 1.2b, 1.2c CDSB Framework REQ-04 Sources of environmental impacts GRI G4 Aspect: Water (EN8, EN9, and EN10) WBCSD Global Water Tool (GWT) CEO Water Mandate – Section 3 Company Water Profile Additional Source(s): WRI Aqueduct (provides definitions of water stress); Alliance for Water Stewardship Standard Version 1.0
Discussion of water management risks and description of management strategies and practices to mitigate those risks
Discussion and Analysis
n/a
CDP Water Information Request W3 Water risks, W8 Targets and Initiatives CDSB Framework REQ-02 Risks and Opportunities, REQ-01 Management’s environmental policies, strategy and targets CEO Water Mandate – Section 5 Detailed Disclosure Additional Source(s): Alliance for Water Stewardship Standard Version 1.0
Energy & Fleet Fuel Management
Operational energy consumed, percentage grid electricity, percentage renewable
Quantitative Gigajoules, Percentage
(%)
CDP Climate Change Information Request CC11.2, CC11.3, CC3.1d Climate Change Reporting Framework 4.31.f GRI G4 Aspect: Energy (EN3) Additional Source(s): Green-e Energy National Standard Version 2.5
Fleet fuel consumed, percentage renewable
Quantitative Gigajoules, Percentage
(%)
CDP Climate Change Information Request CC11.3 GRI G4 Aspect: Energy (EN3) Additional Source(s): U.S. EPA’s Renewable Fuel Standard
Environmental & Social Impacts of Ingredient Supply Chains
Percentage of beverage ingredients sourced from regions with High or Extremely High Baseline Water Stress
Quantitative Percentage (%) by spend
CDP Water Information Request W3.2d CDSB Framework REQ-02 Risks and Opportunities, REQ-01 Management’s environmental policies, strategy and targets WBCSD Global Water Tool (GWT) CEO Water Mandate – Section 5 Detailed Disclosure
Table 3a: Consumption I
52 SASB.ORG
Physical Effects
Transition to a Low-Carbon, Resilient Economy
Climate Regulation
Processed Foods Topic and Climate Risk Metric Category
Unit of Measure Alignment / Source
Water Management
(1) Total water withdrawn and (2) total water consumed, percentage of each in regions with High or Extremely High Baseline Water Stress
Quantitative
Cubic Meters (m3),
Percentage (%)
CDP Water Information Request W1.2a, 1.2b, 1.2c CDSB Framework REQ-04 Sources of environmental impacts GRI G4 Aspect: Water (EN8, EN9, and EN10) WBCSD Global Water Tool (GWT) CEO Water Mandate – Section 3 Company Water Profile Additional Source(s): WRI Aqueduct (provides definitions of water stress); Alliance for Water Stewardship Standard Version 1.0
Discussion of water management risks and description of management strategies and practices to mitigate those risks
Discussion and
Analysis n/a
CDP Water Information Request W3 Water risks, W8 Targets and Initiatives CDSB Framework REQ-02 Risks and Opportunities, REQ-01 Management’s environmental policies, strategy and targets CEO Water Mandate – Section 5 Detailed Disclosure Additional Source(s): Alliance for Water Stewardship Standard Version 1.0
Energy & Fleet Fuel Management
Operational energy consumed, percentage grid electricity, percentage renewable
Quantitative Gigajoules, Percentage
(%)
CDP Climate Change Information Request CC11.2, CC11.3, CC3.1d Climate Change Reporting Framework 4.31f GRI G4 Aspect: Energy (EN3) Additional Source(s): Green-e Energy National Standard Version 2.5
Fleet fuel consumed, percentage renewable
Quantitative Gigajoules, Percentage
(%)
CDP Climate Change Information Request CC11.3 GRI G4 Aspect: Energy (EN3) Additional Source(s): U.S. EPA’s Renewable Fuel Standard
Environmental & Social Impacts of Ingredient Supply Chains
Percentage of food ingredients sourced from regions with High or Extremely High Baseline Water Stress
Quantitative Percentage
(%) by spend
CDP Water Information Request W3.2d CDSB Framework REQ-02 Risks and Opportunities, REQ-01 Management’s environmental policies, strategy and targets WBCSD Global Water Tool (GWT) CEO Water Mandate – Section 5 Detailed Disclosure Additional Source(s): WRI Aqueduct (provides definitions of water stress); Alliance for Water Stewardship Standard Version 1.0
Percentage of food ingredients sourced that are certified to third-party environmental and/or social standards, by certification scheme
Quantitative Percentage
(%) by spend
CDP Forest Information Request F9.4 GRI G4 Food Processing Sector Aspect: Procurement/Sourcing Practices (FP2) Additional Source(s): Roundtable on Sustainable Palm Oil (RSPO); Roundtable on Responsible Soy (RTRS); Rainforest Alliance; Bon Sucro; USDA Organic
List of priority food ingredients and discussion of sourcing risks due to environmental and social considerations
Discussion & Analysis n/a
CDP Climate Change Information Request CC2 Strategy and CC5 Climate Change Risks; CDP Forests Information Requests 1.3a, F2. Risk assessment, F3 Risks, F8 Policies, F10 Engagement CDSB Framework REQ-02 Risks and Opportunities, REQ-01 Management’s environmental policies, strategy and targets GRI G4 Food Processing Sector Aspect: Procurement/Sourcing Practices (DMA),
(cont.)
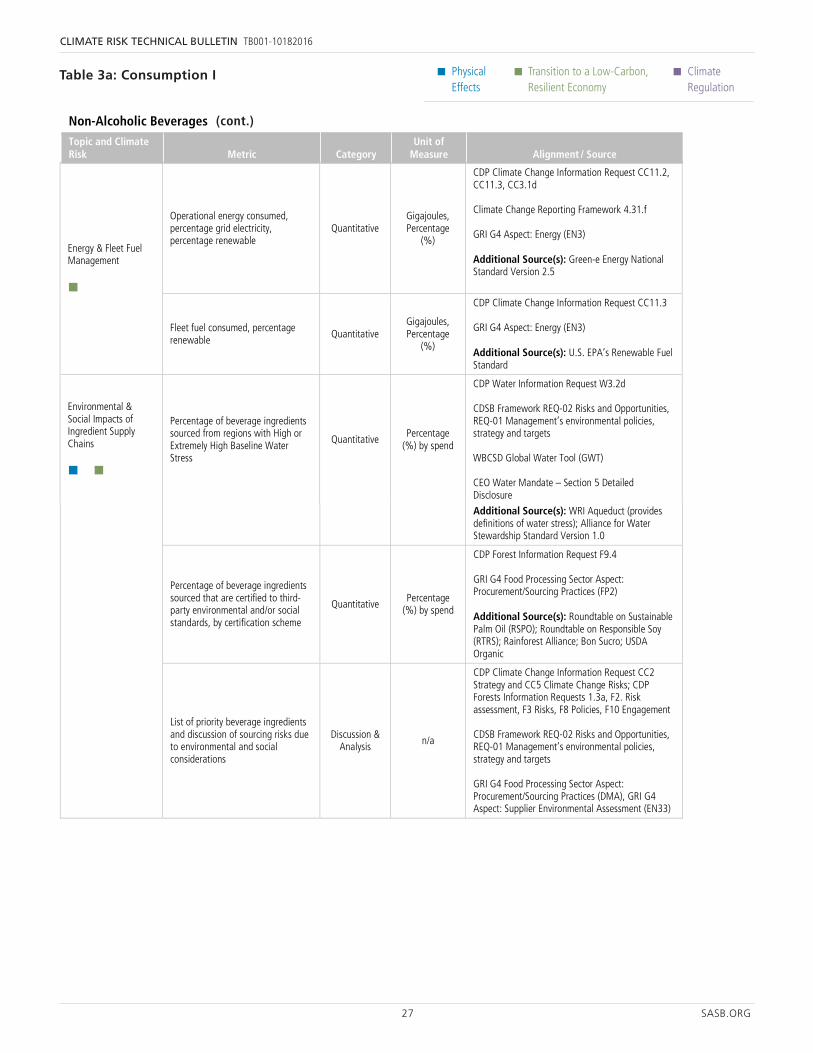
27 SASB.ORG
CLIMATE RISK TECHNICAL BULLETIN TB001-10182016
• Physical Effects
• Transition to a Low-Carbon, Resilient Economy
• Climate Regulation
54 SASB.ORG
Physical Effects
Transition to a Low-Carbon, Resilient Economy
Climate Regulation
Non-Alcoholic Beverages Topic and Climate Risk Metric Category
Unit of Measure Alignment / Source
Additional Source(s): WRI Aqueduct (provides definitions of water stress); Alliance for Water Stewardship Standard Version 1.0
Percentage of beverage ingredients sourced that are certified to third-party environmental and/or social standards, by certification scheme
Quantitative Percentage
(%) by spend
CDP Forest Information Request F9.4 GRI G4 Food Processing Sector Aspect: Procurement/Sourcing Practices (FP2) Additional Source(s): Roundtable on Sustainable Palm Oil (RSPO); Roundtable on Responsible Soy (RTRS); Rainforest Alliance; Bon Sucro; USDA Organic
List of priority beverage ingredients and discussion of sourcing risks due to environmental and social considerations
Discussion & Analysis n/a
CDP Climate Change Information Request CC2 Strategy and CC5 Climate Change Risks; CDP Forests Information Requests 1.3a, F2. Risk assessment, F3 Risks, F8 Policies, F10 Engagement CDSB Framework REQ-02 Risks and Opportunities, REQ-01 Management’s environmental policies, strategy and targets GRI G4 Food Processing Sector Aspect: Procurement/Sourcing Practices (DMA), GRI G4 Aspect: Supplier Environmental Assessment (EN33)
Alcoholic Beverages Topic and Climate Risk Metric Category
Unit of Measure Alignment / Source
Water Management
(1) Total water withdrawn and (2) total water consumed, percentage of each in regions with High or Extremely High Baseline Water Stress
Quantitative
Cubic Meters (m3),
Percentage (%)
CDP Water Information Request W1.2a, 1.2b, 1.2c CDSB Framework REQ-04 Sources of environmental impacts GRI G4 Aspect: Water (EN8, EN9, and EN10) WBCSD Global Water Tool (GWT) CEO Water Mandate – Section 3 Company Water Profile Additional Source(s): WRI Aqueduct (provides definitions of water stress); Alliance for Water Stewardship Standard Version 1.0
Discussion of water management risks and description of management strategies and practices to mitigate those risks
Discussion and Analysis
n/a
CDP Water Information Request W3 Water risks, W8 Targets and Initiatives CDSB Framework REQ-02 Risks and Opportunities, REQ-01 Management’s environmental policies, strategy and targets CEO Water Mandate – Section 5 Detailed Disclosure Additional Source(s): Alliance for Water Stewardship Standard Version 1.0
Energy & Fleet Fuel Management
Operational energy consumed, percentage grid electricity, percentage renewable
Quantitative Gigajoules, Percentage
(%)
CDP Climate Change Information Request CC11.2, CC11.3, CC3.1d
Table 3a: Consumption I
53 SASB.ORG
Physical Effects
Transition to a Low-Carbon, Resilient Economy
Climate Regulation
Processed Foods Topic and Climate Risk Metric Category
Unit of Measure Alignment / Source
GRI G4 Aspect: Supplier Environmental Assessment (EN33)
Non-Alcoholic Beverages Topic and Climate Risk Metric Category
Unit of Measure Alignment / Source
Water Management
(1) Total water withdrawn and (2) total water consumed, percentage of each in regions with High or Extremely High Baseline Water Stress
Quantitative
Cubic Meters (m3),
Percentage (%)
CDP Water Information Request W1.2a, 1.2b, 1.2c CDSB Framework REQ-04 Sources of environmental impacts GRI G4 Aspect: Water (EN8, EN9, and EN10) WBCSD Global Water Tool (GWT) CEO Water Mandate – Section 3 Company Water Profile Additional Source(s): WRI Aqueduct (provides definitions of water stress); Alliance for Water Stewardship Standard Version 1.0
Discussion of water management risks and description of management strategies and practices to mitigate those risks
Discussion and Analysis
n/a
CDP Water Information Request W3 Water risks, W8 Targets and Initiatives CDSB Framework REQ-02 Risks and Opportunities, REQ-01 Management’s environmental policies, strategy and targets CEO Water Mandate – Section 5 Detailed Disclosure Additional Source(s): Alliance for Water Stewardship Standard Version 1.0
Energy & Fleet Fuel Management
Operational energy consumed, percentage grid electricity, percentage renewable
Quantitative Gigajoules, Percentage
(%)
CDP Climate Change Information Request CC11.2, CC11.3, CC3.1d Climate Change Reporting Framework 4.31.f GRI G4 Aspect: Energy (EN3) Additional Source(s): Green-e Energy National Standard Version 2.5
Fleet fuel consumed, percentage renewable
Quantitative Gigajoules, Percentage
(%)
CDP Climate Change Information Request CC11.3 GRI G4 Aspect: Energy (EN3) Additional Source(s): U.S. EPA’s Renewable Fuel Standard
Environmental & Social Impacts of Ingredient Supply Chains
Percentage of beverage ingredients sourced from regions with High or Extremely High Baseline Water Stress
Quantitative Percentage (%) by spend
CDP Water Information Request W3.2d CDSB Framework REQ-02 Risks and Opportunities, REQ-01 Management’s environmental policies, strategy and targets WBCSD Global Water Tool (GWT) CEO Water Mandate – Section 5 Detailed Disclosure
(cont.)
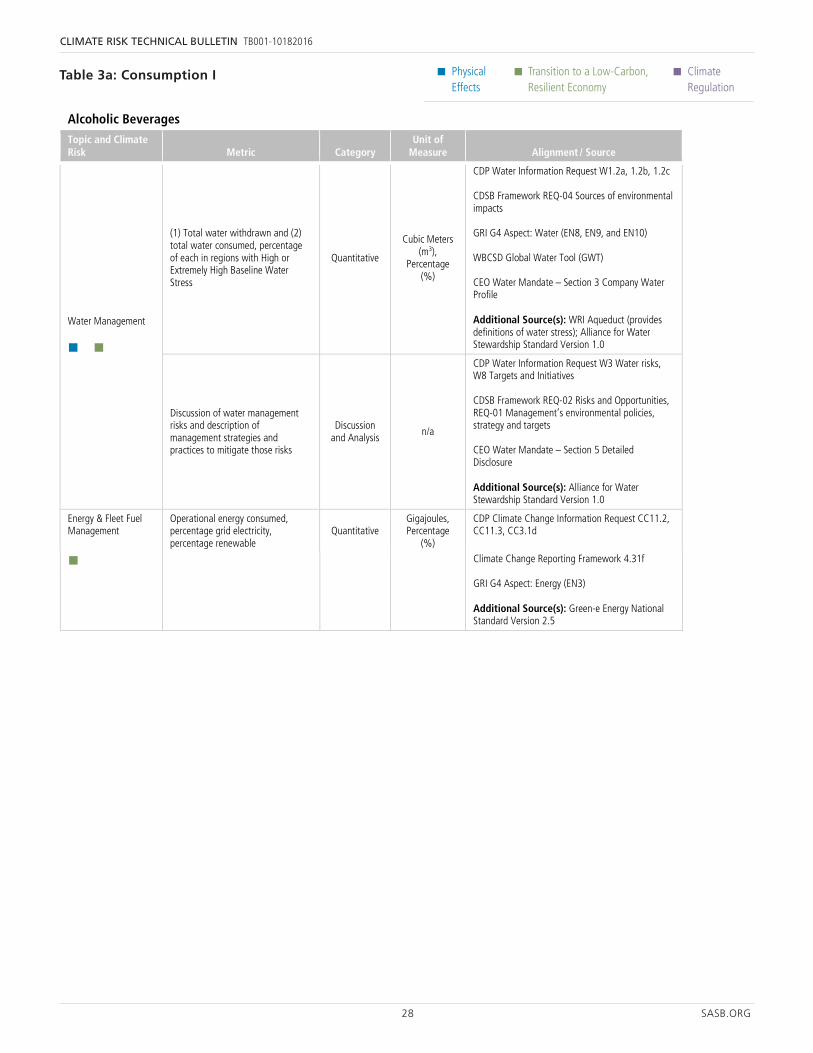
28 SASB.ORG
CLIMATE RISK TECHNICAL BULLETIN TB001-10182016
• Physical Effects
• Transition to a Low-Carbon, Resilient Economy
• Climate Regulation
55 SASB.ORG
Physical Effects
Transition to a Low-Carbon, Resilient Economy
Climate Regulation
Alcoholic Beverages Topic and Climate Risk Metric Category
Unit of Measure Alignment / Source
Climate Change Reporting Framework 4.31f GRI G4 Aspect: Energy (EN3) Additional Source(s): Green-e Energy National Standard Version 2.5
Environmental & Social Impacts of Ingredient Supply Chains
Percentage of beverage ingredients sourced from regions with High or Extremely High Baseline Water Stress
Quantitative Percentage (%) by spend
CDP Water Information Request W3.2d CDSB Framework REQ-02 Risks and Opportunities, REQ-01 Management’s environmental policies, strategy and targets WBCSD Global Water Tool (GWT) CEO Water Mandate – Section 5 Detailed Disclosure Additional Source(s): WRI Aqueduct (provides definitions of water stress); Alliance for Water Stewardship Standard Version 1.0
Percentage of beverage ingredients sourced that are certified to third-party environmental and/or social standards, by certification scheme
Quantitative Percentage
(%) by spend
CDP Forest Information Request F9.4 GRI G4 Food Processing Sector Aspect: Procurement/Sourcing Practices (FP2) Additional Source(s): Roundtable on Sustainable Palm Oil (RSPO); Roundtable on Responsible Soy (RTRS); Rainforest Alliance; Bon Sucro; USDA Organic
List of priority beverage ingredients and discussion of sourcing risks due to environmental and social considerations
Discussion & Analysis n/a
CDP Climate Change Information Request CC2 Strategy and CC5 Climate Change Risks; CDP Forests Information Requests 1.3a, F2. Risk assessment, F3 Risks, F8 Policies, F10 Engagement CDSB Framework REQ-02 Risks and Opportunities, REQ-01 Management’s environmental policies, strategy and targets GRI G4 Food Processing Sector Aspect: Procurement/Sourcing Practices (DMA), GRI G4 Aspect: Supplier Environmental Assessment (EN33)
Household & Personal Products Topic and Climate Risk Metric Category
Unit of Measure Alignment / Source
Water Management
(1) Total water withdrawn and (2) total water consumed, percentage of each in regions with High or Extremely High Baseline Water Stress
Quantitative
Cubic Meters (m3),
Percentage (%)
CDP Water Information Request W1.2a, 1.2b, 1.2c CDSB Framework REQ-04 Sources of environmental impacts GRI G4 Aspect: Water (EN8, EN9, and EN10) WBCSD Global Water Tool (GWT) CEO Water Mandate – Section 3 Company Water Profile
Table 3a: Consumption I
54 SASB.ORG
Physical Effects
Transition to a Low-Carbon, Resilient Economy
Climate Regulation
Non-Alcoholic Beverages Topic and Climate Risk Metric Category
Unit of Measure Alignment / Source
Additional Source(s): WRI Aqueduct (provides definitions of water stress); Alliance for Water Stewardship Standard Version 1.0
Percentage of beverage ingredients sourced that are certified to third-party environmental and/or social standards, by certification scheme
Quantitative Percentage
(%) by spend
CDP Forest Information Request F9.4 GRI G4 Food Processing Sector Aspect: Procurement/Sourcing Practices (FP2) Additional Source(s): Roundtable on Sustainable Palm Oil (RSPO); Roundtable on Responsible Soy (RTRS); Rainforest Alliance; Bon Sucro; USDA Organic
List of priority beverage ingredients and discussion of sourcing risks due to environmental and social considerations
Discussion & Analysis n/a
CDP Climate Change Information Request CC2 Strategy and CC5 Climate Change Risks; CDP Forests Information Requests 1.3a, F2. Risk assessment, F3 Risks, F8 Policies, F10 Engagement CDSB Framework REQ-02 Risks and Opportunities, REQ-01 Management’s environmental policies, strategy and targets GRI G4 Food Processing Sector Aspect: Procurement/Sourcing Practices (DMA), GRI G4 Aspect: Supplier Environmental Assessment (EN33)
Alcoholic Beverages Topic and Climate Risk Metric Category
Unit of Measure Alignment / Source
Water Management
(1) Total water withdrawn and (2) total water consumed, percentage of each in regions with High or Extremely High Baseline Water Stress
Quantitative
Cubic Meters (m3),
Percentage (%)
CDP Water Information Request W1.2a, 1.2b, 1.2c CDSB Framework REQ-04 Sources of environmental impacts GRI G4 Aspect: Water (EN8, EN9, and EN10) WBCSD Global Water Tool (GWT) CEO Water Mandate – Section 3 Company Water Profile Additional Source(s): WRI Aqueduct (provides definitions of water stress); Alliance for Water Stewardship Standard Version 1.0
Discussion of water management risks and description of management strategies and practices to mitigate those risks
Discussion and Analysis
n/a
CDP Water Information Request W3 Water risks, W8 Targets and Initiatives CDSB Framework REQ-02 Risks and Opportunities, REQ-01 Management’s environmental policies, strategy and targets CEO Water Mandate – Section 5 Detailed Disclosure Additional Source(s): Alliance for Water Stewardship Standard Version 1.0
Energy & Fleet Fuel Management
Operational energy consumed, percentage grid electricity, percentage renewable
Quantitative Gigajoules, Percentage
(%)
CDP Climate Change Information Request CC11.2, CC11.3, CC3.1d
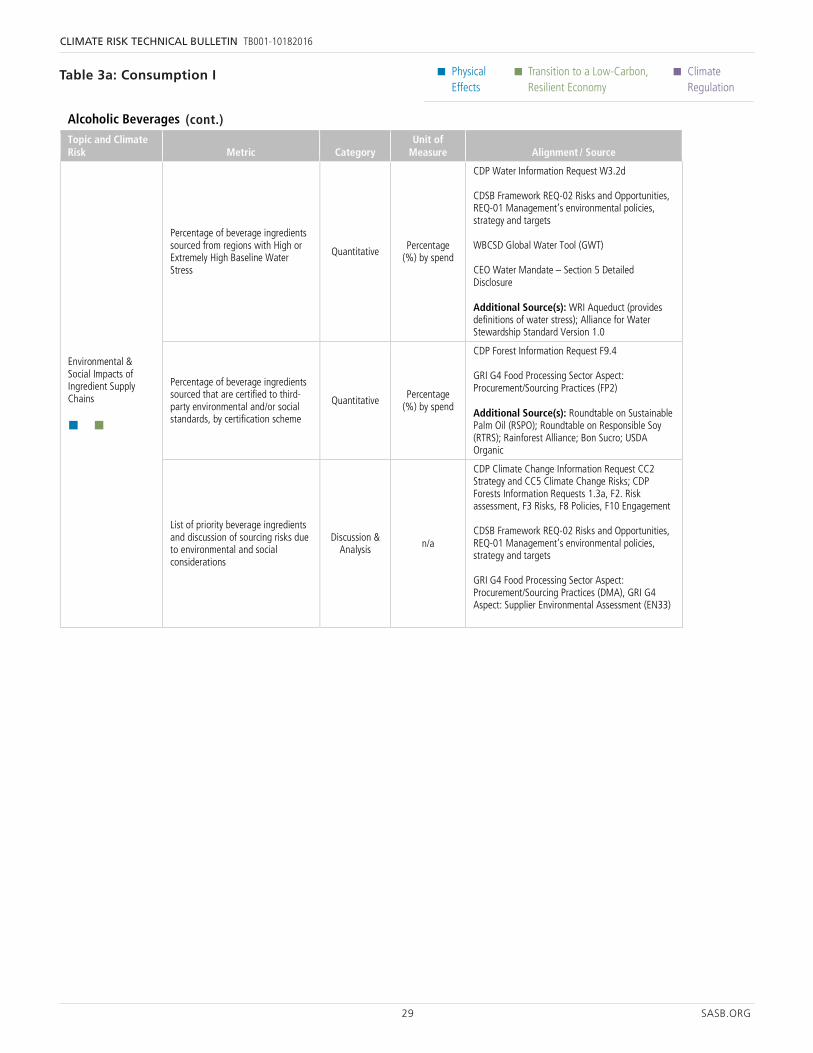
29 SASB.ORG
CLIMATE RISK TECHNICAL BULLETIN TB001-10182016
• Physical Effects
• Transition to a Low-Carbon, Resilient Economy
• Climate Regulation
Table 3a: Consumption I
55 SASB.ORG
Physical Effects
Transition to a Low-Carbon, Resilient Economy
Climate Regulation
Alcoholic Beverages Topic and Climate Risk Metric Category
Unit of Measure Alignment / Source
Climate Change Reporting Framework 4.31f GRI G4 Aspect: Energy (EN3) Additional Source(s): Green-e Energy National Standard Version 2.5
Environmental & Social Impacts of Ingredient Supply Chains
Percentage of beverage ingredients sourced from regions with High or Extremely High Baseline Water Stress
Quantitative Percentage (%) by spend
CDP Water Information Request W3.2d CDSB Framework REQ-02 Risks and Opportunities, REQ-01 Management’s environmental policies, strategy and targets WBCSD Global Water Tool (GWT) CEO Water Mandate – Section 5 Detailed Disclosure Additional Source(s): WRI Aqueduct (provides definitions of water stress); Alliance for Water Stewardship Standard Version 1.0
Percentage of beverage ingredients sourced that are certified to third-party environmental and/or social standards, by certification scheme
Quantitative Percentage
(%) by spend
CDP Forest Information Request F9.4 GRI G4 Food Processing Sector Aspect: Procurement/Sourcing Practices (FP2) Additional Source(s): Roundtable on Sustainable Palm Oil (RSPO); Roundtable on Responsible Soy (RTRS); Rainforest Alliance; Bon Sucro; USDA Organic
List of priority beverage ingredients and discussion of sourcing risks due to environmental and social considerations
Discussion & Analysis n/a
CDP Climate Change Information Request CC2 Strategy and CC5 Climate Change Risks; CDP Forests Information Requests 1.3a, F2. Risk assessment, F3 Risks, F8 Policies, F10 Engagement CDSB Framework REQ-02 Risks and Opportunities, REQ-01 Management’s environmental policies, strategy and targets GRI G4 Food Processing Sector Aspect: Procurement/Sourcing Practices (DMA), GRI G4 Aspect: Supplier Environmental Assessment (EN33)
Household & Personal Products Topic and Climate Risk Metric Category
Unit of Measure Alignment / Source
Water Management
(1) Total water withdrawn and (2) total water consumed, percentage of each in regions with High or Extremely High Baseline Water Stress
Quantitative
Cubic Meters (m3),
Percentage (%)
CDP Water Information Request W1.2a, 1.2b, 1.2c CDSB Framework REQ-04 Sources of environmental impacts GRI G4 Aspect: Water (EN8, EN9, and EN10) WBCSD Global Water Tool (GWT) CEO Water Mandate – Section 3 Company Water Profile
54 SASB.ORG
Physical Effects
Transition to a Low-Carbon, Resilient Economy
Climate Regulation
Non-Alcoholic Beverages Topic and Climate Risk Metric Category
Unit of Measure Alignment / Source
Additional Source(s): WRI Aqueduct (provides definitions of water stress); Alliance for Water Stewardship Standard Version 1.0
Percentage of beverage ingredients sourced that are certified to third-party environmental and/or social standards, by certification scheme
Quantitative Percentage
(%) by spend
CDP Forest Information Request F9.4 GRI G4 Food Processing Sector Aspect: Procurement/Sourcing Practices (FP2) Additional Source(s): Roundtable on Sustainable Palm Oil (RSPO); Roundtable on Responsible Soy (RTRS); Rainforest Alliance; Bon Sucro; USDA Organic
List of priority beverage ingredients and discussion of sourcing risks due to environmental and social considerations
Discussion & Analysis n/a
CDP Climate Change Information Request CC2 Strategy and CC5 Climate Change Risks; CDP Forests Information Requests 1.3a, F2. Risk assessment, F3 Risks, F8 Policies, F10 Engagement CDSB Framework REQ-02 Risks and Opportunities, REQ-01 Management’s environmental policies, strategy and targets GRI G4 Food Processing Sector Aspect: Procurement/Sourcing Practices (DMA), GRI G4 Aspect: Supplier Environmental Assessment (EN33)
Alcoholic Beverages Topic and Climate Risk Metric Category
Unit of Measure Alignment / Source
Water Management
(1) Total water withdrawn and (2) total water consumed, percentage of each in regions with High or Extremely High Baseline Water Stress
Quantitative
Cubic Meters (m3),
Percentage (%)
CDP Water Information Request W1.2a, 1.2b, 1.2c CDSB Framework REQ-04 Sources of environmental impacts GRI G4 Aspect: Water (EN8, EN9, and EN10) WBCSD Global Water Tool (GWT) CEO Water Mandate – Section 3 Company Water Profile Additional Source(s): WRI Aqueduct (provides definitions of water stress); Alliance for Water Stewardship Standard Version 1.0
Discussion of water management risks and description of management strategies and practices to mitigate those risks
Discussion and Analysis
n/a
CDP Water Information Request W3 Water risks, W8 Targets and Initiatives CDSB Framework REQ-02 Risks and Opportunities, REQ-01 Management’s environmental policies, strategy and targets CEO Water Mandate – Section 5 Detailed Disclosure Additional Source(s): Alliance for Water Stewardship Standard Version 1.0
Energy & Fleet Fuel Management
Operational energy consumed, percentage grid electricity, percentage renewable
Quantitative Gigajoules, Percentage
(%)
CDP Climate Change Information Request CC11.2, CC11.3, CC3.1d
(cont.)
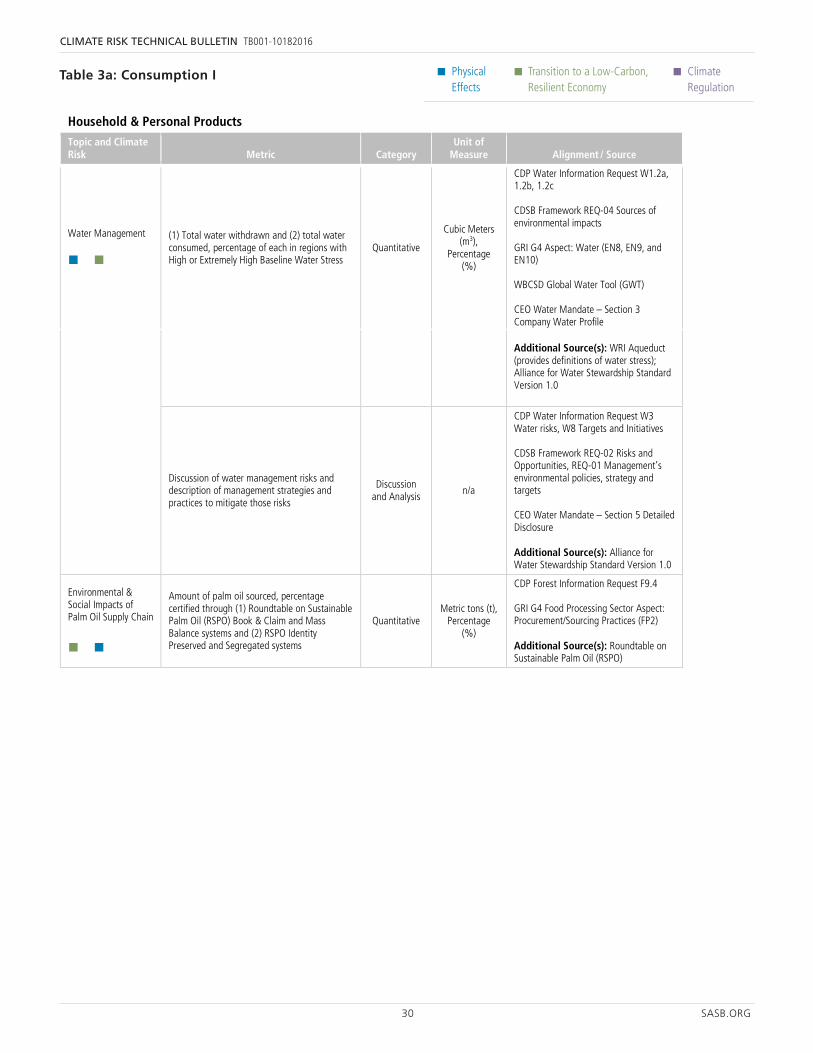
30 SASB.ORG
CLIMATE RISK TECHNICAL BULLETIN TB001-10182016
• Physical Effects
• Transition to a Low-Carbon, Resilient Economy
• Climate Regulation
Table 3a: Consumption I
56 SASB.ORG
Physical Effects
Transition to a Low-Carbon, Resilient Economy
Climate Regulation
Household & Personal Products Topic and Climate Risk Metric Category
Unit of Measure Alignment / Source
Additional Source(s): WRI Aqueduct (provides definitions of water stress); Alliance for Water Stewardship Standard Version 1.0
Discussion of water management risks and description of management strategies and practices to mitigate those risks
Discussion and Analysis
n/a
CDP Water Information Request W3 Water risks, W8 Targets and Initiatives CDSB Framework REQ-02 Risks and Opportunities, REQ-01 Management’s environmental policies, strategy and targets CEO Water Mandate – Section 5 Detailed Disclosure Additional Source(s): Alliance for Water Stewardship Standard Version 1.0
Environmental & Social Impacts of Palm Oil Supply Chain
Amount of palm oil sourced, percentage certified through (1) Roundtable on Sustainable Palm Oil (RSPO) Book & Claim and Mass Balance systems and (2) RSPO Identity Preserved and Segregated systems
Quantitative Metric tons (t),
Percentage (%)
CDP Forest Information Request F9.4 GRI G4 Food Processing Sector Aspect: Procurement/Sourcing Practices (FP2) Additional Source(s): Roundtable on Sustainable Palm Oil (RSPO)
55 SASB.ORG
Physical Effects
Transition to a Low-Carbon, Resilient Economy
Climate Regulation
Alcoholic Beverages Topic and Climate Risk Metric Category
Unit of Measure Alignment / Source
Climate Change Reporting Framework 4.31f GRI G4 Aspect: Energy (EN3) Additional Source(s): Green-e Energy National Standard Version 2.5
Environmental & Social Impacts of Ingredient Supply Chains
Percentage of beverage ingredients sourced from regions with High or Extremely High Baseline Water Stress
Quantitative Percentage (%) by spend
CDP Water Information Request W3.2d CDSB Framework REQ-02 Risks and Opportunities, REQ-01 Management’s environmental policies, strategy and targets WBCSD Global Water Tool (GWT) CEO Water Mandate – Section 5 Detailed Disclosure Additional Source(s): WRI Aqueduct (provides definitions of water stress); Alliance for Water Stewardship Standard Version 1.0
Percentage of beverage ingredients sourced that are certified to third-party environmental and/or social standards, by certification scheme
Quantitative Percentage
(%) by spend
CDP Forest Information Request F9.4 GRI G4 Food Processing Sector Aspect: Procurement/Sourcing Practices (FP2) Additional Source(s): Roundtable on Sustainable Palm Oil (RSPO); Roundtable on Responsible Soy (RTRS); Rainforest Alliance; Bon Sucro; USDA Organic
List of priority beverage ingredients and discussion of sourcing risks due to environmental and social considerations
Discussion & Analysis n/a
CDP Climate Change Information Request CC2 Strategy and CC5 Climate Change Risks; CDP Forests Information Requests 1.3a, F2. Risk assessment, F3 Risks, F8 Policies, F10 Engagement CDSB Framework REQ-02 Risks and Opportunities, REQ-01 Management’s environmental policies, strategy and targets GRI G4 Food Processing Sector Aspect: Procurement/Sourcing Practices (DMA), GRI G4 Aspect: Supplier Environmental Assessment (EN33)
Household & Personal Products Topic and Climate Risk Metric Category
Unit of Measure Alignment / Source
Water Management
(1) Total water withdrawn and (2) total water consumed, percentage of each in regions with High or Extremely High Baseline Water Stress
Quantitative
Cubic Meters (m3),
Percentage (%)
CDP Water Information Request W1.2a, 1.2b, 1.2c CDSB Framework REQ-04 Sources of environmental impacts GRI G4 Aspect: Water (EN8, EN9, and EN10) WBCSD Global Water Tool (GWT) CEO Water Mandate – Section 3 Company Water Profile
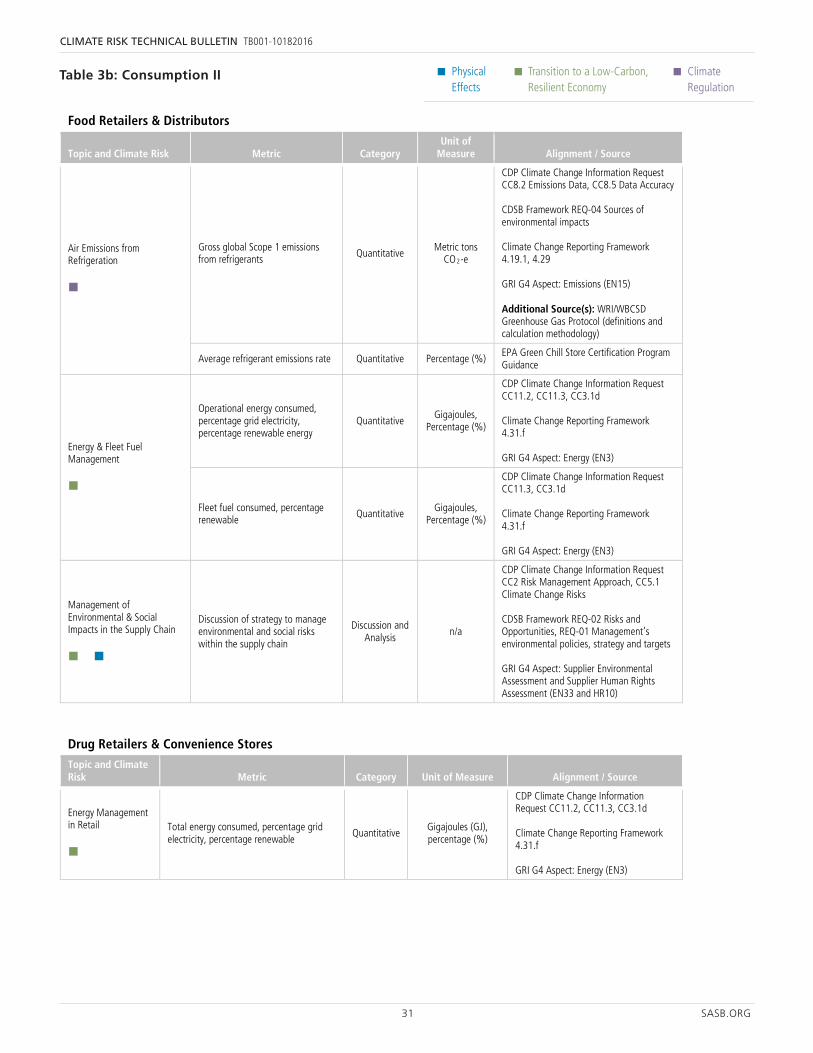
31 SASB.ORG
CLIMATE RISK TECHNICAL BULLETIN TB001-10182016
• Physical Effects
• Transition to a Low-Carbon, Resilient Economy
• Climate Regulation
57 SASB.ORG
Physical Effects
Transition to a Low-Carbon, Resilient Economy
Climate Regulation
Food Retailers & Distributors
Topic and Climate Risk Metric Category Unit of
Measure Alignment / Source
Air Emissions from Refrigeration
Gross global Scope 1 emissions from refrigerants Quantitative
Metric tons CO2-e
CDP Climate Change Information Request CC8.2 Emissions Data, CC8.5 Data Accuracy CDSB Framework REQ-04 Sources of environmental impacts Climate Change Reporting Framework 4.19.1, 4.29 GRI G4 Aspect: Emissions (EN15) Additional Source(s): WRI/WBCSD Greenhouse Gas Protocol (definitions and calculation methodology)
Average refrigerant emissions rate Quantitative Percentage (%) EPA Green Chill Store Certification Program Guidance
Energy & Fleet Fuel Management
Operational energy consumed, percentage grid electricity, percentage renewable energy
Quantitative Gigajoules,
Percentage (%)
CDP Climate Change Information Request CC11.2, CC11.3, CC3.1d Climate Change Reporting Framework 4.31.f GRI G4 Aspect: Energy (EN3)
Fleet fuel consumed, percentage renewable
Quantitative Gigajoules, Percentage (%)
CDP Climate Change Information Request CC11.3, CC3.1d Climate Change Reporting Framework 4.31.f GRI G4 Aspect: Energy (EN3)
Management of Environmental & Social Impacts in the Supply Chain
Discussion of strategy to manage environmental and social risks within the supply chain
Discussion and Analysis
n/a
CDP Climate Change Information Request CC2 Risk Management Approach, CC5.1 Climate Change Risks CDSB Framework REQ-02 Risks and Opportunities, REQ-01 Management’s environmental policies, strategy and targets GRI G4 Aspect: Supplier Environmental Assessment and Supplier Human Rights Assessment (EN33 and HR10)
Drug Retailers & Convenience Stores Topic and Climate Risk Metric Category Unit of Measure Alignment / Source
Energy Management in Retail
Total energy consumed, percentage grid electricity, percentage renewable Quantitative Gigajoules (GJ),
percentage (%)
CDP Climate Change Information Request CC11.2, CC11.3, CC3.1d Climate Change Reporting Framework 4.31.f GRI G4 Aspect: Energy (EN3)
Multiline and Specialty Retailers & Distributors
Table 3b: Consumption II
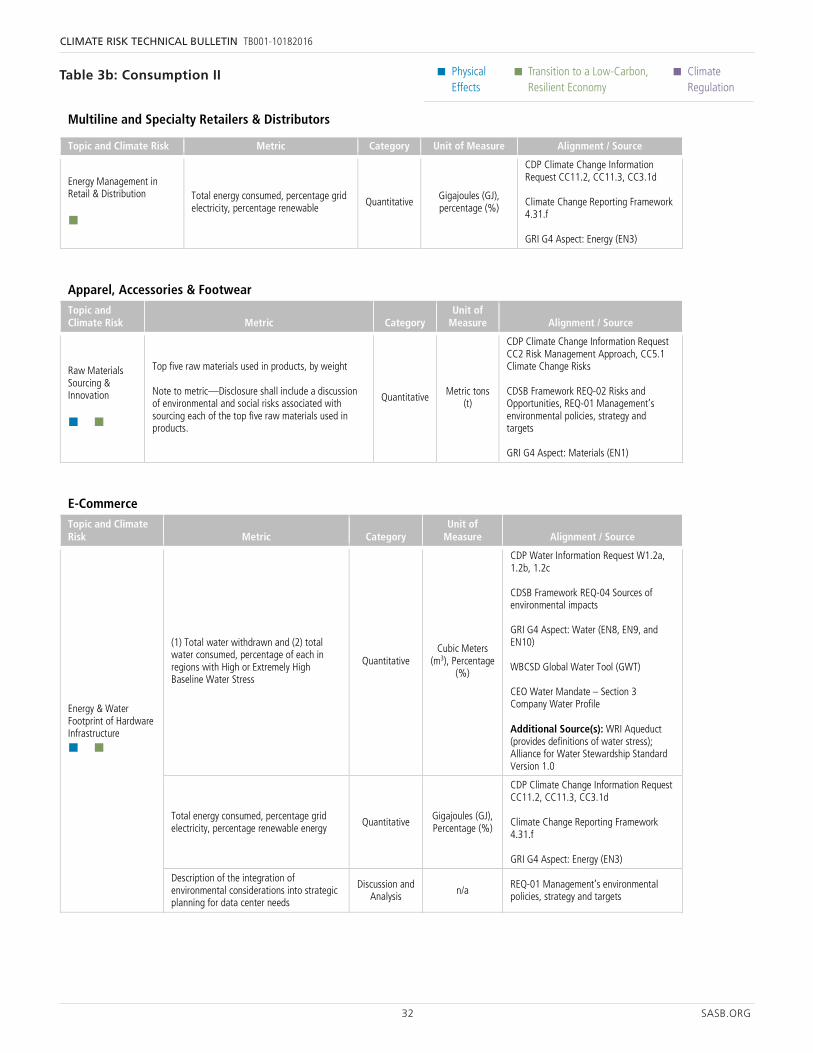
32 SASB.ORG
CLIMATE RISK TECHNICAL BULLETIN TB001-10182016
• Physical Effects
• Transition to a Low-Carbon, Resilient Economy
• Climate Regulation
58 SASB.ORG
Physical Effects
Transition to a Low-Carbon, Resilient Economy
Climate Regulation
Topic and Climate Risk Metric Category Unit of Measure Alignment / Source
Energy Management in Retail & Distribution
Total energy consumed, percentage grid electricity, percentage renewable Quantitative Gigajoules (GJ),
percentage (%)
CDP Climate Change Information Request CC11.2, CC11.3, CC3.1d Climate Change Reporting Framework 4.31.f GRI G4 Aspect: Energy (EN3)
Apparel, Accessories & Footwear Topic and Climate Risk Metric Category
Unit of Measure Alignment / Source
Raw Materials Sourcing & Innovation
Top five raw materials used in products, by weight Note to metric—Disclosure shall include a discussion of environmental and social risks associated with sourcing each of the top five raw materials used in products.
Quantitative Metric tons (t)
CDP Climate Change Information Request CC2 Risk Management Approach, CC5.1 Climate Change Risks CDSB Framework REQ-02 Risks and Opportunities, REQ-01 Management’s environmental policies, strategy and targets GRI G4 Aspect: Materials (EN1)
E-Commerce Topic and Climate Risk Metric Category
Unit of Measure Alignment / Source
Energy & Water Footprint of Hardware Infrastructure
(1) Total water withdrawn and (2) total water consumed, percentage of each in regions with High or Extremely High Baseline Water Stress
Quantitative Cubic Meters
(m3), Percentage (%)
CDP Water Information Request W1.2a, 1.2b, 1.2c CDSB Framework REQ-04 Sources of environmental impacts GRI G4 Aspect: Water (EN8, EN9, and EN10) WBCSD Global Water Tool (GWT) CEO Water Mandate – Section 3 Company Water Profile Additional Source(s): WRI Aqueduct (provides definitions of water stress); Alliance for Water Stewardship Standard Version 1.0
Total energy consumed, percentage grid electricity, percentage renewable energy
Quantitative Gigajoules (GJ), Percentage (%)
CDP Climate Change Information Request CC11.2, CC11.3, CC3.1d Climate Change Reporting Framework 4.31.f GRI G4 Aspect: Energy (EN3)
Description of the integration of environmental considerations into strategic planning for data center needs
Discussion and Analysis n/a
REQ-01 Management’s environmental policies, strategy and targets
Logistics & Packaging Efficiency
Total greenhouse gas (GHG) footprint of product shipments Quantitative
Gigajoules (GJ), percentage (%)
CDP Climate Change Information Request CC14 Scope 3 Emissions CDSB Framework REQ-04 Sources of environmental impacts; Climate Change Reporting Framework 4.27
Table 3b: Consumption II
57 SASB.ORG
Physical Effects
Transition to a Low-Carbon, Resilient Economy
Climate Regulation
Food Retailers & Distributors
Topic and Climate Risk Metric Category Unit of
Measure Alignment / Source
Air Emissions from Refrigeration
Gross global Scope 1 emissions from refrigerants Quantitative
Metric tons CO2-e
CDP Climate Change Information Request CC8.2 Emissions Data, CC8.5 Data Accuracy CDSB Framework REQ-04 Sources of environmental impacts Climate Change Reporting Framework 4.19.1, 4.29 GRI G4 Aspect: Emissions (EN15) Additional Source(s): WRI/WBCSD Greenhouse Gas Protocol (definitions and calculation methodology)
Average refrigerant emissions rate Quantitative Percentage (%) EPA Green Chill Store Certification Program Guidance
Energy & Fleet Fuel Management
Operational energy consumed, percentage grid electricity, percentage renewable energy
Quantitative Gigajoules,
Percentage (%)
CDP Climate Change Information Request CC11.2, CC11.3, CC3.1d Climate Change Reporting Framework 4.31.f GRI G4 Aspect: Energy (EN3)
Fleet fuel consumed, percentage renewable
Quantitative Gigajoules, Percentage (%)
CDP Climate Change Information Request CC11.3, CC3.1d Climate Change Reporting Framework 4.31.f GRI G4 Aspect: Energy (EN3)
Management of Environmental & Social Impacts in the Supply Chain
Discussion of strategy to manage environmental and social risks within the supply chain
Discussion and Analysis
n/a
CDP Climate Change Information Request CC2 Risk Management Approach, CC5.1 Climate Change Risks CDSB Framework REQ-02 Risks and Opportunities, REQ-01 Management’s environmental policies, strategy and targets GRI G4 Aspect: Supplier Environmental Assessment and Supplier Human Rights Assessment (EN33 and HR10)
Drug Retailers & Convenience Stores Topic and Climate Risk Metric Category Unit of Measure Alignment / Source
Energy Management in Retail
Total energy consumed, percentage grid electricity, percentage renewable Quantitative Gigajoules (GJ),
percentage (%)
CDP Climate Change Information Request CC11.2, CC11.3, CC3.1d Climate Change Reporting Framework 4.31.f GRI G4 Aspect: Energy (EN3)
Multiline and Specialty Retailers & Distributors
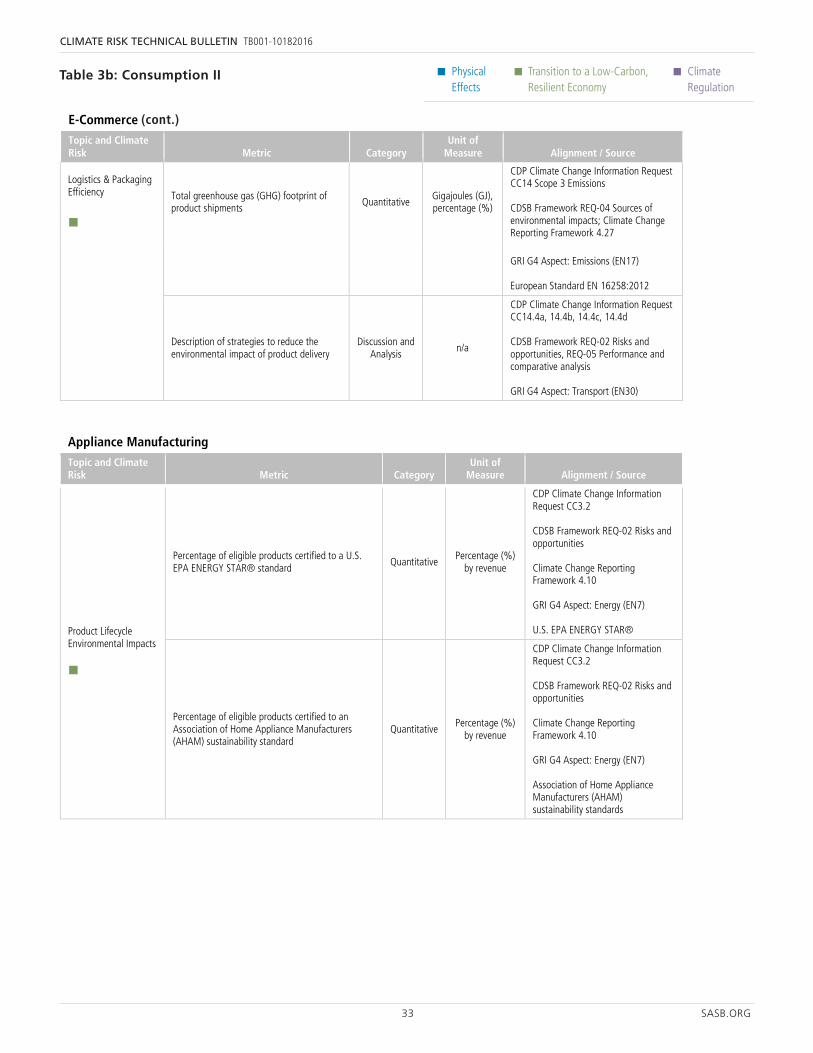
33 SASB.ORG
CLIMATE RISK TECHNICAL BULLETIN TB001-10182016
• Physical Effects
• Transition to a Low-Carbon, Resilient Economy
• Climate Regulation
59 SASB.ORG
Physical Effects
Transition to a Low-Carbon, Resilient Economy
Climate Regulation
E-Commerce Topic and Climate Risk Metric Category
Unit of Measure Alignment / Source
GRI G4 Aspect: Emissions (EN17) European Standard EN 16258:2012
Description of strategies to reduce the environmental impact of product delivery
Discussion and Analysis
n/a
CDP Climate Change Information Request CC14.4a, 14.4b, 14.4c, 14.4d CDSB Framework REQ-02 Risks and opportunities, REQ-05 Performance and comparative analysis GRI G4 Aspect: Transport (EN30)
Appliance Manufacturing Topic and Climate Risk Metric Category
Unit of Measure Alignment / Source
Product Lifecycle Environmental Impacts
Percentage of eligible products certified to a U.S. EPA ENERGY STAR® standard Quantitative Percentage (%)
by revenue
CDP Climate Change Information Request CC3.2 CDSB Framework REQ-02 Risks and opportunities Climate Change Reporting Framework 4.10 GRI G4 Aspect: Energy (EN7) U.S. EPA ENERGY STAR®
Percentage of eligible products certified to an Association of Home Appliance Manufacturers (AHAM) sustainability standard
Quantitative Percentage (%)
by revenue
CDP Climate Change Information Request CC3.2 CDSB Framework REQ-02 Risks and opportunities Climate Change Reporting Framework 4.10 GRI G4 Aspect: Energy (EN7) Association of Home Appliance Manufacturers (AHAM) sustainability standards
Building Products & Furnishings Topic and Climate Risk Metric Category
Unit of Measure Alignment / Source
Energy Management in Manufacturing
Total energy consumed, percentage grid electricity, percentage renewable
Quantitative Gigajoules (GJ), Percentage (%)
CDP Climate Change Information Request CC11.2, CC11.3, CC3.1d Climate Change Reporting Framework 4.31.f GRI G4 Aspect: Energy (EN3)
Product Lifecycle Environmental Impacts
Discussion of efforts to manage product lifecycle impacts and meet demand for sustainable products
Discussion and Analysis
n/a CDP Climate Change Information Request CC3.2 CDSB Framework REQ-02 Risks and opportunities
Table 3b: Consumption II
58 SASB.ORG
Physical Effects
Transition to a Low-Carbon, Resilient Economy
Climate Regulation
Topic and Climate Risk Metric Category Unit of Measure Alignment / Source
Energy Management in Retail & Distribution
Total energy consumed, percentage grid electricity, percentage renewable Quantitative Gigajoules (GJ),
percentage (%)
CDP Climate Change Information Request CC11.2, CC11.3, CC3.1d Climate Change Reporting Framework 4.31.f GRI G4 Aspect: Energy (EN3)
Apparel, Accessories & Footwear Topic and Climate Risk Metric Category
Unit of Measure Alignment / Source
Raw Materials Sourcing & Innovation
Top five raw materials used in products, by weight Note to metric—Disclosure shall include a discussion of environmental and social risks associated with sourcing each of the top five raw materials used in products.
Quantitative Metric tons (t)
CDP Climate Change Information Request CC2 Risk Management Approach, CC5.1 Climate Change Risks CDSB Framework REQ-02 Risks and Opportunities, REQ-01 Management’s environmental policies, strategy and targets GRI G4 Aspect: Materials (EN1)
E-Commerce Topic and Climate Risk Metric Category
Unit of Measure Alignment / Source
Energy & Water Footprint of Hardware Infrastructure
(1) Total water withdrawn and (2) total water consumed, percentage of each in regions with High or Extremely High Baseline Water Stress
Quantitative Cubic Meters
(m3), Percentage (%)
CDP Water Information Request W1.2a, 1.2b, 1.2c CDSB Framework REQ-04 Sources of environmental impacts GRI G4 Aspect: Water (EN8, EN9, and EN10) WBCSD Global Water Tool (GWT) CEO Water Mandate – Section 3 Company Water Profile Additional Source(s): WRI Aqueduct (provides definitions of water stress); Alliance for Water Stewardship Standard Version 1.0
Total energy consumed, percentage grid electricity, percentage renewable energy
Quantitative Gigajoules (GJ), Percentage (%)
CDP Climate Change Information Request CC11.2, CC11.3, CC3.1d Climate Change Reporting Framework 4.31.f GRI G4 Aspect: Energy (EN3)
Description of the integration of environmental considerations into strategic planning for data center needs
Discussion and Analysis n/a
REQ-01 Management’s environmental policies, strategy and targets
Logistics & Packaging Efficiency
Total greenhouse gas (GHG) footprint of product shipments Quantitative
Gigajoules (GJ), percentage (%)
CDP Climate Change Information Request CC14 Scope 3 Emissions CDSB Framework REQ-04 Sources of environmental impacts; Climate Change Reporting Framework 4.27
(cont.)
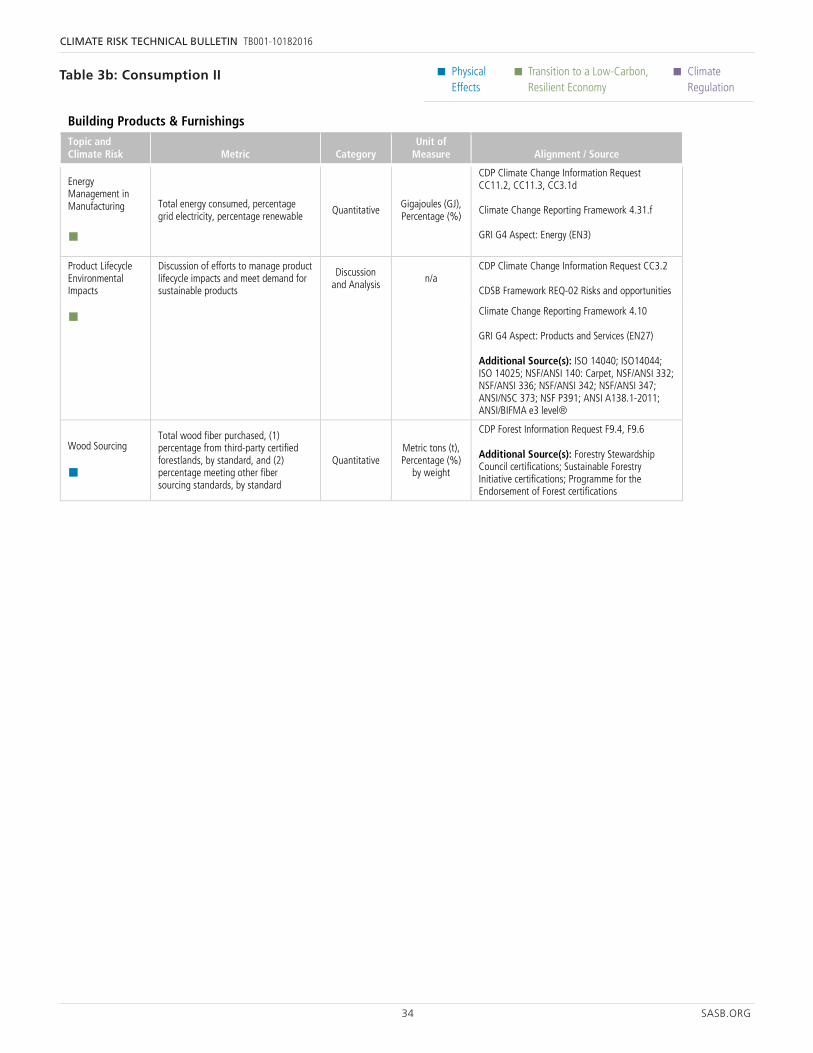
34 SASB.ORG
CLIMATE RISK TECHNICAL BULLETIN TB001-10182016
• Physical Effects
• Transition to a Low-Carbon, Resilient Economy
• Climate Regulation
Table 3b: Consumption II
60 SASB.ORG
Physical Effects
Transition to a Low-Carbon, Resilient Economy
Climate Regulation
Building Products & Furnishings Topic and Climate Risk Metric Category
Unit of Measure Alignment / Source
Climate Change Reporting Framework 4.10 GRI G4 Aspect: Products and Services (EN27) Additional Source(s): ISO 14040; ISO14044; ISO 14025; NSF/ANSI 140: Carpet, NSF/ANSI 332; NSF/ANSI 336; NSF/ANSI 342; NSF/ANSI 347; ANSI/NSC 373; NSF P391; ANSI A138.1-2011; ANSI/BIFMA e3 level®
Wood Sourcing
Total wood fiber purchased, (1) percentage from third-party certified forestlands, by standard, and (2) percentage meeting other fiber sourcing standards, by standard
Quantitative Metric tons (t), Percentage (%)
by weight
CDP Forest Information Request F9.4, F9.6 Additional Source(s): Forestry Stewardship Council certifications; Sustainable Forestry Initiative certifications; Programme for the Endorsement of Forest certifications
59 SASB.ORG
Physical Effects
Transition to a Low-Carbon, Resilient Economy
Climate Regulation
E-Commerce Topic and Climate Risk Metric Category
Unit of Measure Alignment / Source
GRI G4 Aspect: Emissions (EN17) European Standard EN 16258:2012
Description of strategies to reduce the environmental impact of product delivery
Discussion and Analysis
n/a
CDP Climate Change Information Request CC14.4a, 14.4b, 14.4c, 14.4d CDSB Framework REQ-02 Risks and opportunities, REQ-05 Performance and comparative analysis GRI G4 Aspect: Transport (EN30)
Appliance Manufacturing Topic and Climate Risk Metric Category
Unit of Measure Alignment / Source
Product Lifecycle Environmental Impacts
Percentage of eligible products certified to a U.S. EPA ENERGY STAR® standard Quantitative Percentage (%)
by revenue
CDP Climate Change Information Request CC3.2 CDSB Framework REQ-02 Risks and opportunities Climate Change Reporting Framework 4.10 GRI G4 Aspect: Energy (EN7) U.S. EPA ENERGY STAR®
Percentage of eligible products certified to an Association of Home Appliance Manufacturers (AHAM) sustainability standard
Quantitative Percentage (%)
by revenue
CDP Climate Change Information Request CC3.2 CDSB Framework REQ-02 Risks and opportunities Climate Change Reporting Framework 4.10 GRI G4 Aspect: Energy (EN7) Association of Home Appliance Manufacturers (AHAM) sustainability standards
Building Products & Furnishings Topic and Climate Risk Metric Category
Unit of Measure Alignment / Source
Energy Management in Manufacturing
Total energy consumed, percentage grid electricity, percentage renewable
Quantitative Gigajoules (GJ), Percentage (%)
CDP Climate Change Information Request CC11.2, CC11.3, CC3.1d Climate Change Reporting Framework 4.31.f GRI G4 Aspect: Energy (EN3)
Product Lifecycle Environmental Impacts
Discussion of efforts to manage product lifecycle impacts and meet demand for sustainable products
Discussion and Analysis
n/a CDP Climate Change Information Request CC3.2 CDSB Framework REQ-02 Risks and opportunities
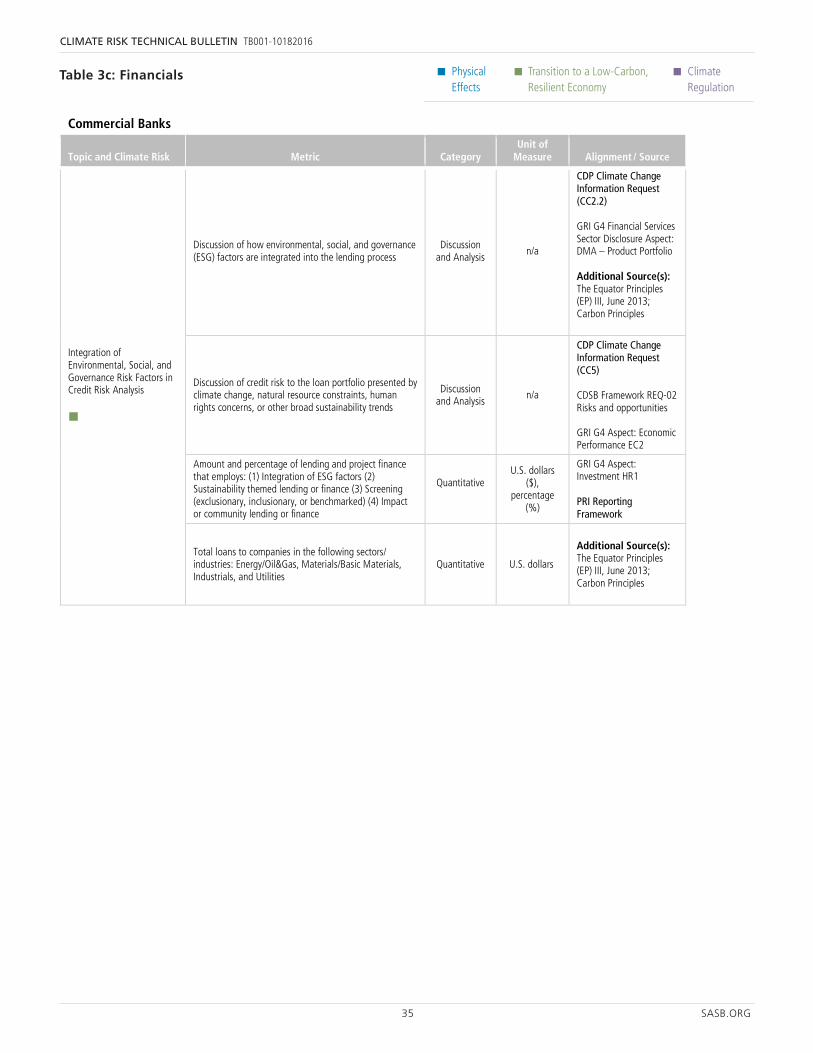
35 SASB.ORG
CLIMATE RISK TECHNICAL BULLETIN TB001-10182016
• Physical Effects
• Transition to a Low-Carbon, Resilient Economy
• Climate Regulation
23 SASB.ORG
Physical Effects
Transition to a Low-Carbon, Resilient Economy
Climate Regulation
Commercial Banks
Topic and Climate Risk Metric Category Unit of
Measure Alignment / Source
Integration of Environmental, Social, and Governance Risk Factors in Credit Risk Analysis
Discussion of how environmental, social, and governance (ESG) factors are integrated into the lending process
Discussion and Analysis n/a
CDP Climate Change Information Request (CC2.2) GRI G4 Financial Services Sector Disclosure Aspect: DMA – Product Portfolio Additional Source(s): The Equator Principles (EP) III, June 2013; Carbon Principles
Discussion of credit risk to the loan portfolio presented by climate change, natural resource constraints, human rights concerns, or other broad sustainability trends
Discussion and Analysis n/a
CDP Climate Change Information Request (CC5) CDSB Framework REQ-02 Risks and opportunities GRI G4 Aspect: Economic Performance EC2
Amount and percentage of lending and project finance that employs: (1) Integration of ESG factors (2) Sustainability themed lending or finance (3) Screening (exclusionary, inclusionary, or benchmarked) (4) Impact or community lending or finance
Quantitative
U.S. dollars ($),
percentage (%)
GRI G4 Aspect: Investment HR1 PRI Reporting Framework
Total loans to companies in the following sectors/ industries: Energy/Oil&Gas, Materials/Basic Materials, Industrials, and Utilities
Quantitative U.S. dollars
Additional Source(s): The Equator Principles (EP) III, June 2013; Carbon Principles
Investment Banking & Brokerage
Topic and Climate Risk Metric Category Unit of
Measure Alignment / Source
Integration of Environmental, Social, and Governance Risk Factors in Advisory, Underwriting, and Brokerage Activities
Discussion of how environmental, social, and governance (ESG) factors are incorporated into core products and services
Discussion and Analysis n/a
CDP Climate Change Information Request (CC2.2) GRI G4 Financial Services Sector Disclosure Aspect: DMA – Product Portfolio Additional Source(s): The Equator Principles (EP) III, June 2013; Carbon Principles
Amount of sustainability-focused services, activities, and products, broken down by: (1) origination, (2) market making, and (3) advisory and underwriting Note—Disclosure shall include a description of sustainability-focused services, activities, and products, broken down by: (1) origination, (2) market making, and (3) advisory and underwriting.
Quantitative U.S.
dollars ($)
G4 Aspect: Sector Specific, FS8
Table 3c: Financials
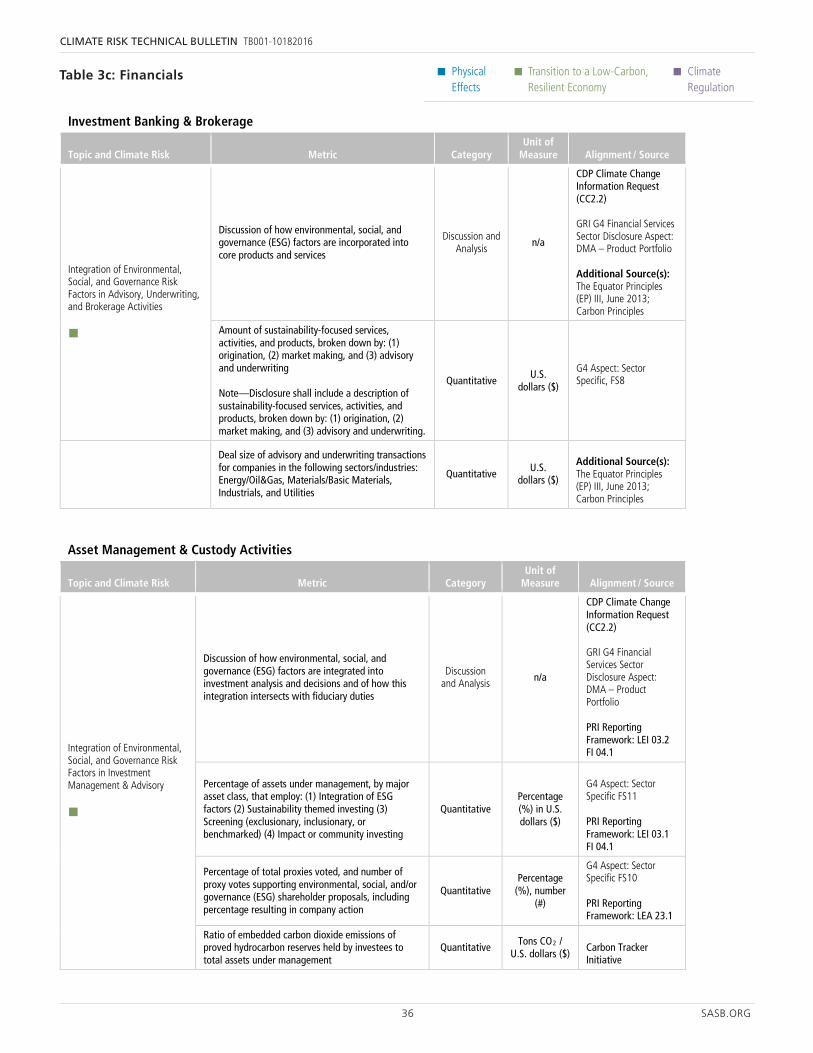
36 SASB.ORG
CLIMATE RISK TECHNICAL BULLETIN TB001-10182016
• Physical Effects
• Transition to a Low-Carbon, Resilient Economy
• Climate Regulation
24 SASB.ORG
Physical Effects
Transition to a Low-Carbon, Resilient Economy
Climate Regulation
Investment Banking & Brokerage
Topic and Climate Risk Metric Category Unit of
Measure Alignment / Source
Deal size of advisory and underwriting transactions for companies in the following sectors/industries: Energy/Oil&Gas, Materials/Basic Materials, Industrials, and Utilities
Quantitative U.S.
dollars ($)
Additional Source(s): The Equator Principles (EP) III, June 2013; Carbon Principles
Asset Management & Custody Activities
Topic and Climate Risk Metric Category Unit of
Measure Alignment / Source
Integration of Environmental, Social, and Governance Risk Factors in Investment Management & Advisory
Discussion of how environmental, social, and governance (ESG) factors are integrated into investment analysis and decisions and of how this integration intersects with fiduciary duties
Discussion and Analysis n/a
CDP Climate Change Information Request (CC2.2) GRI G4 Financial Services Sector Disclosure Aspect: DMA – Product Portfolio PRI Reporting Framework: LEI 03.2 FI 04.1
Percentage of assets under management, by major asset class, that employ: (1) Integration of ESG factors (2) Sustainability themed investing (3) Screening (exclusionary, inclusionary, or benchmarked) (4) Impact or community investing
Quantitative Percentage (%) in U.S. dollars ($)
G4 Aspect: Sector Specific FS11 PRI Reporting Framework: LEI 03.1 FI 04.1
Percentage of total proxies voted, and number of proxy votes supporting environmental, social, and/or governance (ESG) shareholder proposals, including percentage resulting in company action
Quantitative Percentage
(%), number (#)
G4 Aspect: Sector Specific FS10 PRI Reporting Framework: LEA 23.1
Ratio of embedded carbon dioxide emissions of proved hydrocarbon reserves held by investees to total assets under management
Quantitative Tons CO2 /
U.S. dollars ($)
Carbon Tracker Initiative
Mortgage Finance Topic and Climate Risk Metric Category
Unit of Measure Alignment / Source
Environmental Risk to Mortgaged Properties
Number and value of mortgage loans in Federal Emergency Management Agency (FEMA) special flood hazard areas
Quantitative Number (#), U.S. dollars ($)
Additional Source(s): National Flood Insurance Program (NFIP): Flood Hazard Mapping
Description of how climate change and other environmental risks are incorporated into mortgage origination and underwriting
Discussion and Analysis n/a
CDP Climate Change Information Request (CC2.2) CDSB Framework REQ-02 Risks and opportunities GRI G4 Financial Services Sector Disclosure Aspect: DMA –
Table 3c: Financials
23 SASB.ORG
Physical Effects
Transition to a Low-Carbon, Resilient Economy
Climate Regulation
Commercial Banks
Topic and Climate Risk Metric Category Unit of
Measure Alignment / Source
Integration of Environmental, Social, and Governance Risk Factors in Credit Risk Analysis
Discussion of how environmental, social, and governance (ESG) factors are integrated into the lending process
Discussion and Analysis n/a
CDP Climate Change Information Request (CC2.2) GRI G4 Financial Services Sector Disclosure Aspect: DMA – Product Portfolio Additional Source(s): The Equator Principles (EP) III, June 2013; Carbon Principles
Discussion of credit risk to the loan portfolio presented by climate change, natural resource constraints, human rights concerns, or other broad sustainability trends
Discussion and Analysis n/a
CDP Climate Change Information Request (CC5) CDSB Framework REQ-02 Risks and opportunities GRI G4 Aspect: Economic Performance EC2
Amount and percentage of lending and project finance that employs: (1) Integration of ESG factors (2) Sustainability themed lending or finance (3) Screening (exclusionary, inclusionary, or benchmarked) (4) Impact or community lending or finance
Quantitative
U.S. dollars ($),
percentage (%)
GRI G4 Aspect: Investment HR1 PRI Reporting Framework
Total loans to companies in the following sectors/ industries: Energy/Oil&Gas, Materials/Basic Materials, Industrials, and Utilities
Quantitative U.S. dollars
Additional Source(s): The Equator Principles (EP) III, June 2013; Carbon Principles
Investment Banking & Brokerage
Topic and Climate Risk Metric Category Unit of
Measure Alignment / Source
Integration of Environmental, Social, and Governance Risk Factors in Advisory, Underwriting, and Brokerage Activities
Discussion of how environmental, social, and governance (ESG) factors are incorporated into core products and services
Discussion and Analysis n/a
CDP Climate Change Information Request (CC2.2) GRI G4 Financial Services Sector Disclosure Aspect: DMA – Product Portfolio Additional Source(s): The Equator Principles (EP) III, June 2013; Carbon Principles
Amount of sustainability-focused services, activities, and products, broken down by: (1) origination, (2) market making, and (3) advisory and underwriting Note—Disclosure shall include a description of sustainability-focused services, activities, and products, broken down by: (1) origination, (2) market making, and (3) advisory and underwriting.
Quantitative U.S.
dollars ($)
G4 Aspect: Sector Specific, FS8
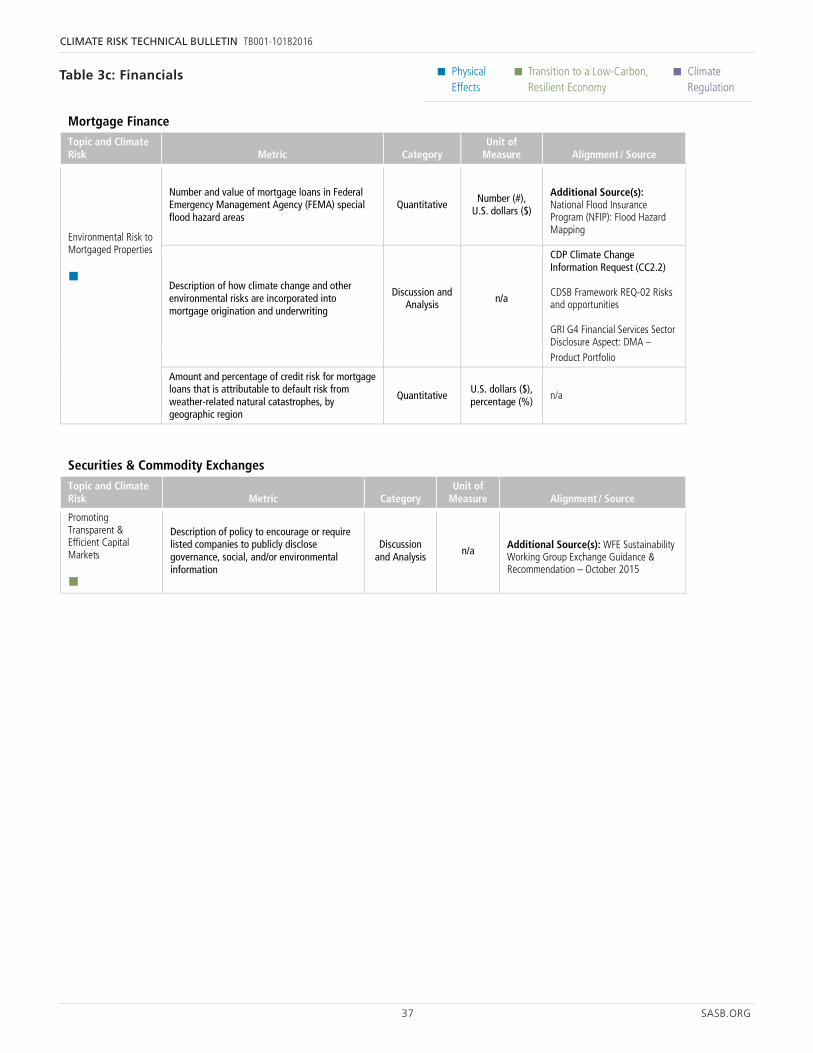
37 SASB.ORG
CLIMATE RISK TECHNICAL BULLETIN TB001-10182016
• Physical Effects
• Transition to a Low-Carbon, Resilient Economy
• Climate Regulation
24 SASB.ORG
Physical Effects
Transition to a Low-Carbon, Resilient Economy
Climate Regulation
Investment Banking & Brokerage
Topic and Climate Risk Metric Category Unit of
Measure Alignment / Source
Deal size of advisory and underwriting transactions for companies in the following sectors/industries: Energy/Oil&Gas, Materials/Basic Materials, Industrials, and Utilities
Quantitative U.S.
dollars ($)
Additional Source(s): The Equator Principles (EP) III, June 2013; Carbon Principles
Asset Management & Custody Activities
Topic and Climate Risk Metric Category Unit of
Measure Alignment / Source
Integration of Environmental, Social, and Governance Risk Factors in Investment Management & Advisory
Discussion of how environmental, social, and governance (ESG) factors are integrated into investment analysis and decisions and of how this integration intersects with fiduciary duties
Discussion and Analysis n/a
CDP Climate Change Information Request (CC2.2) GRI G4 Financial Services Sector Disclosure Aspect: DMA – Product Portfolio PRI Reporting Framework: LEI 03.2 FI 04.1
Percentage of assets under management, by major asset class, that employ: (1) Integration of ESG factors (2) Sustainability themed investing (3) Screening (exclusionary, inclusionary, or benchmarked) (4) Impact or community investing
Quantitative Percentage (%) in U.S. dollars ($)
G4 Aspect: Sector Specific FS11 PRI Reporting Framework: LEI 03.1 FI 04.1
Percentage of total proxies voted, and number of proxy votes supporting environmental, social, and/or governance (ESG) shareholder proposals, including percentage resulting in company action
Quantitative Percentage
(%), number (#)
G4 Aspect: Sector Specific FS10 PRI Reporting Framework: LEA 23.1
Ratio of embedded carbon dioxide emissions of proved hydrocarbon reserves held by investees to total assets under management
Quantitative Tons CO2 /
U.S. dollars ($)
Carbon Tracker Initiative
Mortgage Finance Topic and Climate Risk Metric Category
Unit of Measure Alignment / Source
Environmental Risk to Mortgaged Properties
Number and value of mortgage loans in Federal Emergency Management Agency (FEMA) special flood hazard areas
Quantitative Number (#), U.S. dollars ($)
Additional Source(s): National Flood Insurance Program (NFIP): Flood Hazard Mapping
Description of how climate change and other environmental risks are incorporated into mortgage origination and underwriting
Discussion and Analysis n/a
CDP Climate Change Information Request (CC2.2) CDSB Framework REQ-02 Risks and opportunities GRI G4 Financial Services Sector Disclosure Aspect: DMA –
25 SASB.ORG
Physical Effects
Transition to a Low-Carbon, Resilient Economy
Climate Regulation
Product Portfolio
Amount and percentage of credit risk for mortgage loans that is attributable to default risk from weather-related natural catastrophes, by geographic region
Quantitative U.S. dollars ($), percentage (%)
n/a
Securities & Commodity Exchanges
Topic and Climate Risk Metric Category
Unit of Measure Alignment / Source
Promoting Transparent & Efficient Capital Markets
Description of policy to encourage or require listed companies to publicly disclose governance, social, and/or environmental information
Discussion and Analysis n/a
Additional Source(s): WFE Sustainability Working Group Exchange Guidance & Recommendation – October 2015
Insurance Topic and Climate Risk Metric Category
Unit of Measure Alignment / Source
Environmental Risk Exposure
Probable Maximum Loss (PML) of insured products from weather-related natural catastrophes, by insurance segment, type of event, and type of risk insured
Quantitative U.S. dollars ($)
Additional Source(s): Typical annual filings of P&C insurance companies with the SEC
Total annual losses attributable to insurance payouts from (1) modeled natural catastrophes and (2) non-modeled natural catastrophes
Quantitative U.S. dollars ($)
Additional Source(s): Typical annual filings of P&C insurance companies with the SEC
Description of how environmental risks are integrated into: (1) The underwriting process for individual contracts (2) The management of firm-level risks and capital adequacy
Discussion and Analysis n/a
CDP Climate Change Information Request (CC2.2) GRI G4 Financial Services Sector Disclosure Aspect: DMA – Product Portfolio Additional Source(s): Committee of Sponsoring Organizations of the Treadway Commission COSO Enterprise Risk Management—Integrated Framework
List of markets, regions, and/or events for which the registrant declines to voluntarily write coverage for weather-related natural catastrophe risks
Discussion and Analysis n/a
n/a
Percentage of policies in which weather-related natural catastrophe risks have been mitigated through reinsurance and/or alternative risk transfer
Quantitative Percentage in U.S. dollars ($)
n/a
Integration of Environmental, Social, and Governance Risk Factors in Investment Management
Discussion of how environmental, social, and governance (ESG) factors are integrated into the investment of policy premiums
Discussion and Analysis n/a
CDP Climate Change Information Request (CC2.2) GRI G4 Financial Services Sector Disclosure Aspect: DMA – Product Portfolio
Discussion of the investment portfolio risks presented by climate change, natural resource constraints, human rights concerns, or other broad sustainability trends
Discussion and Analysis n/a
CDP Climate Change Information Request CC5 CDSB Framework REQ-02 Risks and
Table 3c: Financials
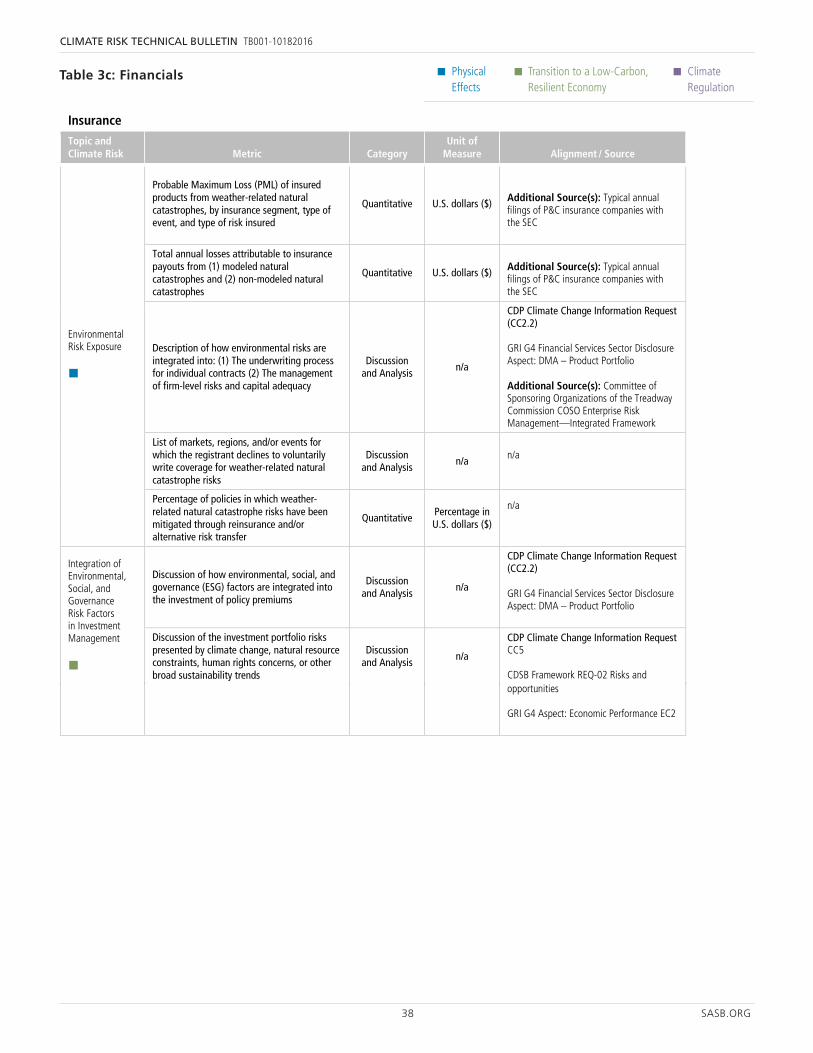
38 SASB.ORG
CLIMATE RISK TECHNICAL BULLETIN TB001-10182016
• Physical Effects
• Transition to a Low-Carbon, Resilient Economy
• Climate Regulation
Table 3c: Financials
25 SASB.ORG
Physical Effects
Transition to a Low-Carbon, Resilient Economy
Climate Regulation
Product Portfolio
Amount and percentage of credit risk for mortgage loans that is attributable to default risk from weather-related natural catastrophes, by geographic region
Quantitative U.S. dollars ($), percentage (%)
n/a
Securities & Commodity Exchanges
Topic and Climate Risk Metric Category
Unit of Measure Alignment / Source
Promoting Transparent & Efficient Capital Markets
Description of policy to encourage or require listed companies to publicly disclose governance, social, and/or environmental information
Discussion and Analysis n/a
Additional Source(s): WFE Sustainability Working Group Exchange Guidance & Recommendation – October 2015
Insurance Topic and Climate Risk Metric Category
Unit of Measure Alignment / Source
Environmental Risk Exposure
Probable Maximum Loss (PML) of insured products from weather-related natural catastrophes, by insurance segment, type of event, and type of risk insured
Quantitative U.S. dollars ($)
Additional Source(s): Typical annual filings of P&C insurance companies with the SEC
Total annual losses attributable to insurance payouts from (1) modeled natural catastrophes and (2) non-modeled natural catastrophes
Quantitative U.S. dollars ($)
Additional Source(s): Typical annual filings of P&C insurance companies with the SEC
Description of how environmental risks are integrated into: (1) The underwriting process for individual contracts (2) The management of firm-level risks and capital adequacy
Discussion and Analysis n/a
CDP Climate Change Information Request (CC2.2) GRI G4 Financial Services Sector Disclosure Aspect: DMA – Product Portfolio Additional Source(s): Committee of Sponsoring Organizations of the Treadway Commission COSO Enterprise Risk Management—Integrated Framework
List of markets, regions, and/or events for which the registrant declines to voluntarily write coverage for weather-related natural catastrophe risks
Discussion and Analysis n/a
n/a
Percentage of policies in which weather-related natural catastrophe risks have been mitigated through reinsurance and/or alternative risk transfer
Quantitative Percentage in U.S. dollars ($)
n/a
Integration of Environmental, Social, and Governance Risk Factors in Investment Management
Discussion of how environmental, social, and governance (ESG) factors are integrated into the investment of policy premiums
Discussion and Analysis n/a
CDP Climate Change Information Request (CC2.2) GRI G4 Financial Services Sector Disclosure Aspect: DMA – Product Portfolio
Discussion of the investment portfolio risks presented by climate change, natural resource constraints, human rights concerns, or other broad sustainability trends
Discussion and Analysis n/a
CDP Climate Change Information Request CC5 CDSB Framework REQ-02 Risks and
26 SASB.ORG
Physical Effects
Transition to a Low-Carbon, Resilient Economy
Climate Regulation
Insurance Topic and Climate Risk Metric Category
Unit of Measure Alignment / Source
opportunities GRI G4 Aspect: Economic Performance EC2
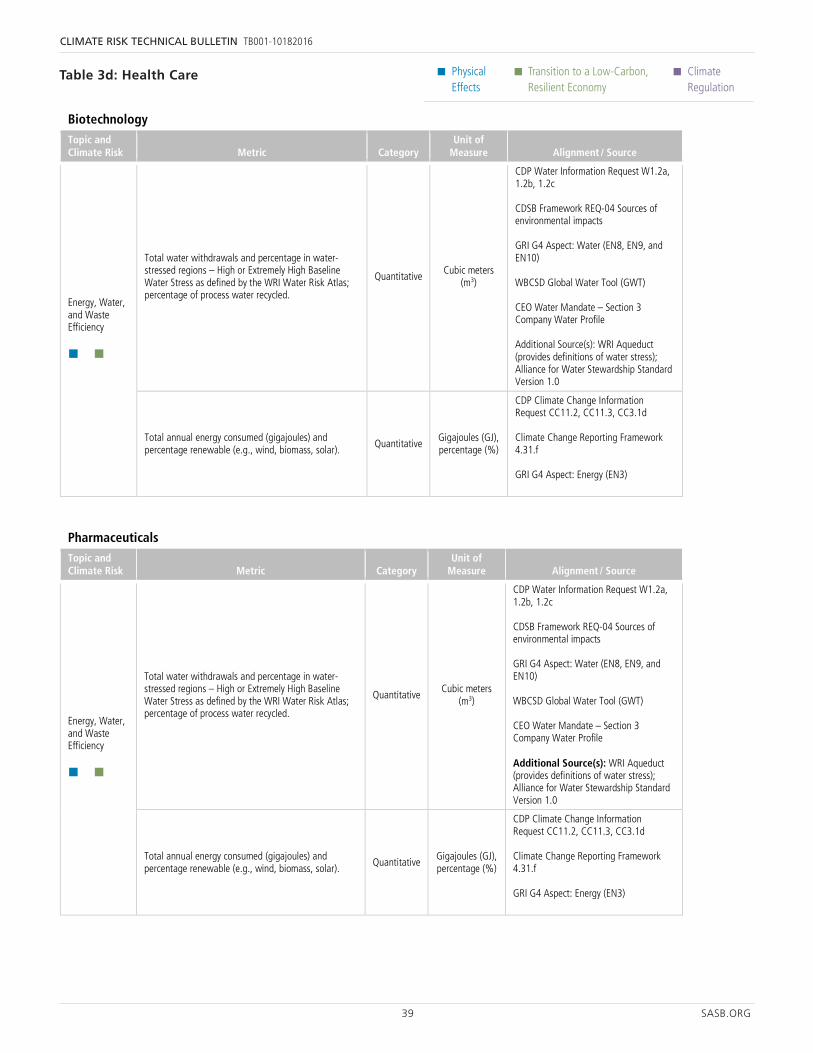
39 SASB.ORG
CLIMATE RISK TECHNICAL BULLETIN TB001-10182016
• Physical Effects
• Transition to a Low-Carbon, Resilient Economy
• Climate Regulation
20 SASB.ORG
Physical Effects
Transition to a Low-Carbon, Resilient Economy
Climate Regulation
Biotechnology Topic and Climate Risk Metric Category
Unit of Measure Alignment / Source
Energy, Water, and Waste Efficiency
Total water withdrawals and percentage in water-stressed regions – High or Extremely High Baseline Water Stress as defined by the WRI Water Risk Atlas; percentage of process water recycled.
Quantitative Cubic meters (m3)
CDP Water Information Request W1.2a, 1.2b, 1.2c CDSB Framework REQ-04 Sources of environmental impacts GRI G4 Aspect: Water (EN8, EN9, and EN10) WBCSD Global Water Tool (GWT) CEO Water Mandate – Section 3 Company Water Profile Additional Source(s): WRI Aqueduct (provides definitions of water stress); Alliance for Water Stewardship Standard Version 1.0
Total annual energy consumed (gigajoules) and percentage renewable (e.g., wind, biomass, solar).
Quantitative Gigajoules (GJ), percentage (%)
CDP Climate Change Information Request CC11.2, CC11.3, CC3.1d Climate Change Reporting Framework 4.31.f GRI G4 Aspect: Energy (EN3)
Pharmaceuticals Topic and Climate Risk Metric Category
Unit of Measure Alignment / Source
Energy, Water, and Waste Efficiency
Total water withdrawals and percentage in water-stressed regions – High or Extremely High Baseline Water Stress as defined by the WRI Water Risk Atlas; percentage of process water recycled.
Quantitative Cubic meters (m3)
CDP Water Information Request W1.2a, 1.2b, 1.2c CDSB Framework REQ-04 Sources of environmental impacts GRI G4 Aspect: Water (EN8, EN9, and EN10) WBCSD Global Water Tool (GWT) CEO Water Mandate – Section 3 Company Water Profile Additional Source(s): WRI Aqueduct (provides definitions of water stress); Alliance for Water Stewardship Standard Version 1.0
Total annual energy consumed (gigajoules) and percentage renewable (e.g., wind, biomass, solar).
Quantitative Gigajoules (GJ), percentage (%)
CDP Climate Change Information Request CC11.2, CC11.3, CC3.1d Climate Change Reporting Framework 4.31.f GRI G4 Aspect: Energy (EN3)
Table 3d: Health Care
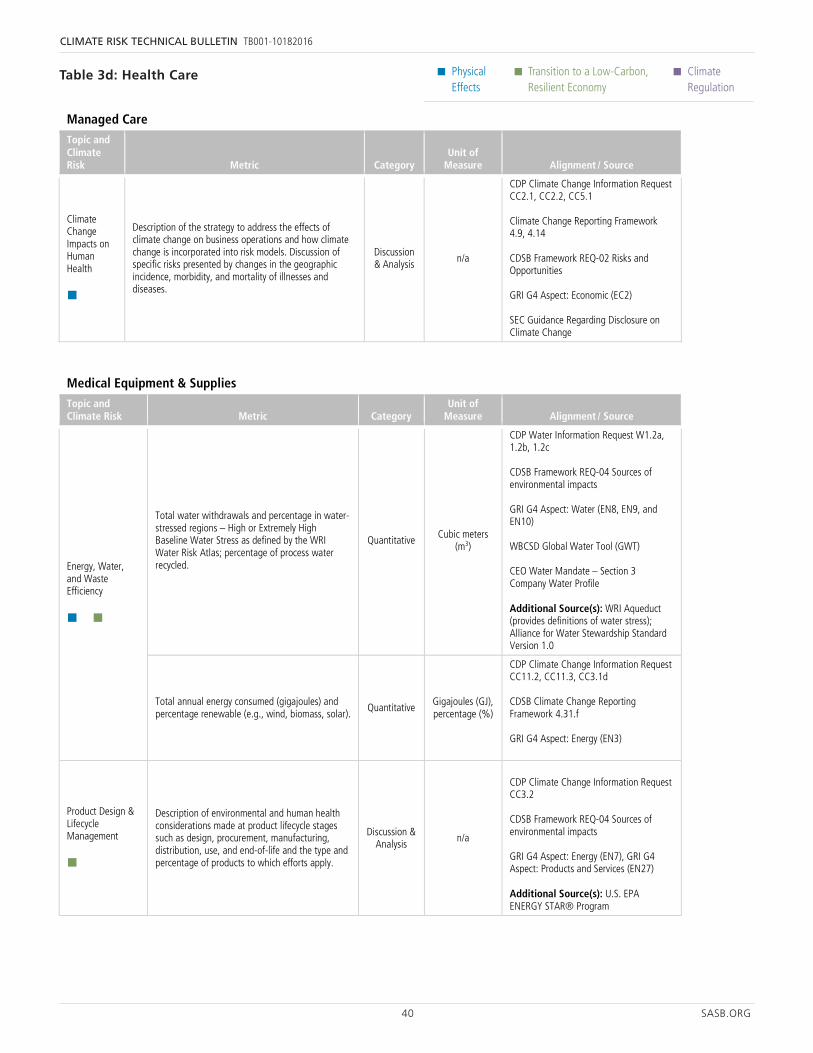
40 SASB.ORG
CLIMATE RISK TECHNICAL BULLETIN TB001-10182016
• Physical Effects
• Transition to a Low-Carbon, Resilient Economy
• Climate Regulation
Table 3d: Health Care
21 SASB.ORG
Physical Effects
Transition to a Low-Carbon, Resilient Economy
Climate Regulation
Managed Care Topic and Climate Risk Metric Category
Unit of Measure Alignment / Source
Climate Change Impacts on Human Health
Description of the strategy to address the effects of climate change on business operations and how climate change is incorporated into risk models. Discussion of specific risks presented by changes in the geographic incidence, morbidity, and mortality of illnesses and diseases.
Discussion & Analysis n/a
CDP Climate Change Information Request CC2.1, CC2.2, CC5.1 Climate Change Reporting Framework 4.9, 4.14 CDSB Framework REQ-02 Risks and Opportunities GRI G4 Aspect: Economic (EC2) SEC Guidance Regarding Disclosure on Climate Change
Medical Equipment & Supplies Topic and Climate Risk Metric Category
Unit of Measure Alignment / Source
Energy, Water, and Waste Efficiency
Total water withdrawals and percentage in water-stressed regions – High or Extremely High Baseline Water Stress as defined by the WRI Water Risk Atlas; percentage of process water recycled.
Quantitative Cubic meters (m3)
CDP Water Information Request W1.2a, 1.2b, 1.2c CDSB Framework REQ-04 Sources of environmental impacts GRI G4 Aspect: Water (EN8, EN9, and EN10) WBCSD Global Water Tool (GWT) CEO Water Mandate – Section 3 Company Water Profile Additional Source(s): WRI Aqueduct (provides definitions of water stress); Alliance for Water Stewardship Standard Version 1.0
Total annual energy consumed (gigajoules) and percentage renewable (e.g., wind, biomass, solar).
Quantitative Gigajoules (GJ), percentage (%)
CDP Climate Change Information Request CC11.2, CC11.3, CC3.1d CDSB Climate Change Reporting Framework 4.31.f GRI G4 Aspect: Energy (EN3)
Product Design & Lifecycle Management
Description of environmental and human health considerations made at product lifecycle stages such as design, procurement, manufacturing, distribution, use, and end-of-life and the type and percentage of products to which efforts apply.
Discussion & Analysis
n/a
CDP Climate Change Information Request CC3.2 CDSB Framework REQ-04 Sources of environmental impacts GRI G4 Aspect: Energy (EN7), GRI G4 Aspect: Products and Services (EN27) Additional Source(s): U.S. EPA ENERGY STAR® Program
Manufacturing and Supply Chain Quality
Discussion of any existing or projected risks or constraints with obtaining raw materials (or components) within the supply chain, including
Discussion & Analysis
n/a CDP Climate Change Information Request CC5.1,
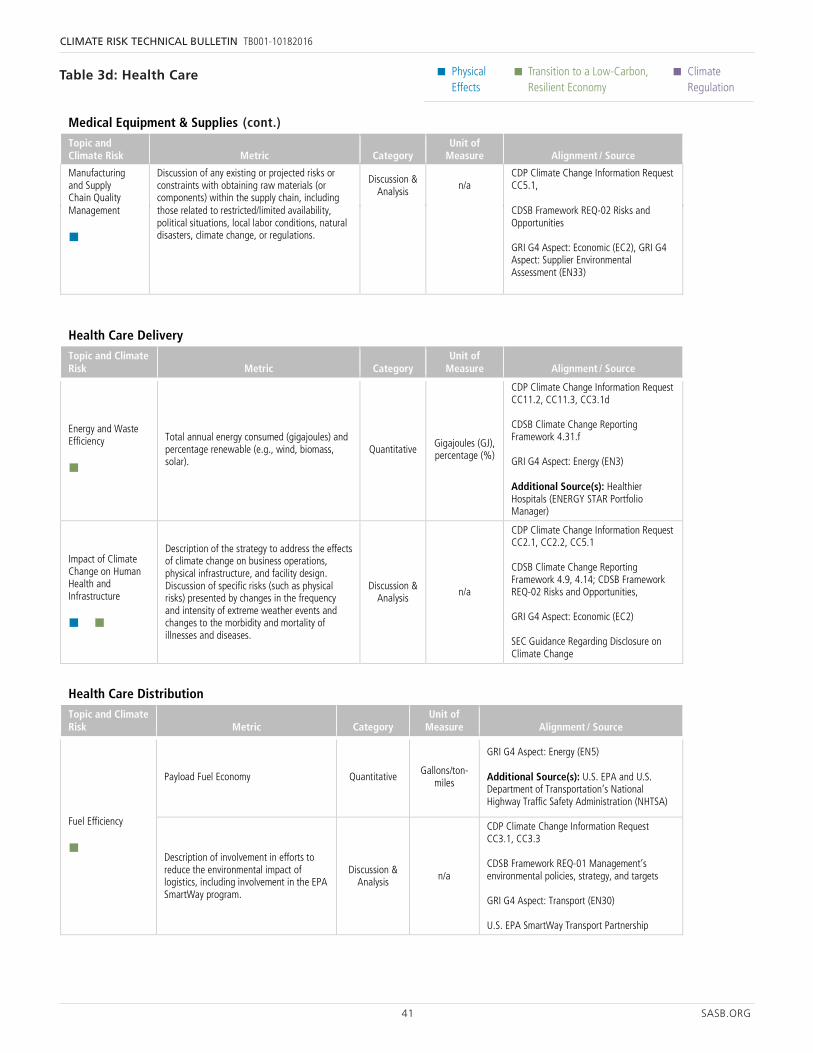
41 SASB.ORG
CLIMATE RISK TECHNICAL BULLETIN TB001-10182016
• Physical Effects
• Transition to a Low-Carbon, Resilient Economy
• Climate Regulation
Table 3d: Health Care
21 SASB.ORG
Physical Effects
Transition to a Low-Carbon, Resilient Economy
Climate Regulation
Managed Care Topic and Climate Risk Metric Category
Unit of Measure Alignment / Source
Climate Change Impacts on Human Health
Description of the strategy to address the effects of climate change on business operations and how climate change is incorporated into risk models. Discussion of specific risks presented by changes in the geographic incidence, morbidity, and mortality of illnesses and diseases.
Discussion & Analysis n/a
CDP Climate Change Information Request CC2.1, CC2.2, CC5.1 Climate Change Reporting Framework 4.9, 4.14 CDSB Framework REQ-02 Risks and Opportunities GRI G4 Aspect: Economic (EC2) SEC Guidance Regarding Disclosure on Climate Change
Medical Equipment & Supplies Topic and Climate Risk Metric Category
Unit of Measure Alignment / Source
Energy, Water, and Waste Efficiency
Total water withdrawals and percentage in water-stressed regions – High or Extremely High Baseline Water Stress as defined by the WRI Water Risk Atlas; percentage of process water recycled.
Quantitative Cubic meters (m3)
CDP Water Information Request W1.2a, 1.2b, 1.2c CDSB Framework REQ-04 Sources of environmental impacts GRI G4 Aspect: Water (EN8, EN9, and EN10) WBCSD Global Water Tool (GWT) CEO Water Mandate – Section 3 Company Water Profile Additional Source(s): WRI Aqueduct (provides definitions of water stress); Alliance for Water Stewardship Standard Version 1.0
Total annual energy consumed (gigajoules) and percentage renewable (e.g., wind, biomass, solar).
Quantitative Gigajoules (GJ), percentage (%)
CDP Climate Change Information Request CC11.2, CC11.3, CC3.1d CDSB Climate Change Reporting Framework 4.31.f GRI G4 Aspect: Energy (EN3)
Product Design & Lifecycle Management
Description of environmental and human health considerations made at product lifecycle stages such as design, procurement, manufacturing, distribution, use, and end-of-life and the type and percentage of products to which efforts apply.
Discussion & Analysis
n/a
CDP Climate Change Information Request CC3.2 CDSB Framework REQ-04 Sources of environmental impacts GRI G4 Aspect: Energy (EN7), GRI G4 Aspect: Products and Services (EN27) Additional Source(s): U.S. EPA ENERGY STAR® Program
Manufacturing and Supply Chain Quality
Discussion of any existing or projected risks or constraints with obtaining raw materials (or components) within the supply chain, including
Discussion & Analysis
n/a CDP Climate Change Information Request CC5.1,
22 SASB.ORG
Physical Effects
Transition to a Low-Carbon, Resilient Economy
Climate Regulation
Medical Equipment & Supplies Topic and Climate Risk Metric Category
Unit of Measure Alignment / Source
Management
those related to restricted/limited availability, political situations, local labor conditions, natural disasters, climate change, or regulations.
CDSB Framework REQ-02 Risks and Opportunities GRI G4 Aspect: Economic (EC2), GRI G4 Aspect: Supplier Environmental Assessment (EN33)
Health Care Delivery Topic and Climate Risk Metric Category
Unit of Measure Alignment / Source
Energy and Waste Efficiency
Total annual energy consumed (gigajoules) and percentage renewable (e.g., wind, biomass, solar).
Quantitative Gigajoules (GJ), percentage (%)
CDP Climate Change Information Request CC11.2, CC11.3, CC3.1d CDSB Climate Change Reporting Framework 4.31.f GRI G4 Aspect: Energy (EN3) Additional Source(s): Healthier Hospitals (ENERGY STAR Portfolio Manager)
Impact of Climate Change on Human Health and Infrastructure
Description of the strategy to address the effects of climate change on business operations, physical infrastructure, and facility design. Discussion of specific risks (such as physical risks) presented by changes in the frequency and intensity of extreme weather events and changes to the morbidity and mortality of illnesses and diseases.
Discussion & Analysis
n/a
CDP Climate Change Information Request CC2.1, CC2.2, CC5.1 CDSB Climate Change Reporting Framework 4.9, 4.14; CDSB Framework REQ-02 Risks and Opportunities, GRI G4 Aspect: Economic (EC2) SEC Guidance Regarding Disclosure on Climate Change
Health Care Distribution Topic and Climate Risk Metric Category
Unit of Measure Alignment / Source
Fuel Efficiency
Payload Fuel Economy Quantitative Gallons/ton-
miles
GRI G4 Aspect: Energy (EN5) Additional Source(s): U.S. EPA and U.S. Department of Transportation’s National Highway Traffic Safety Administration (NHTSA)
Description of involvement in efforts to reduce the environmental impact of logistics, including involvement in the EPA SmartWay program.
Discussion & Analysis n/a
CDP Climate Change Information Request CC3.1, CC3.3 CDSB Framework REQ-01 Management’s environmental policies, strategy, and targets GRI G4 Aspect: Transport (EN30) U.S. EPA SmartWay Transport Partnership
(cont.)
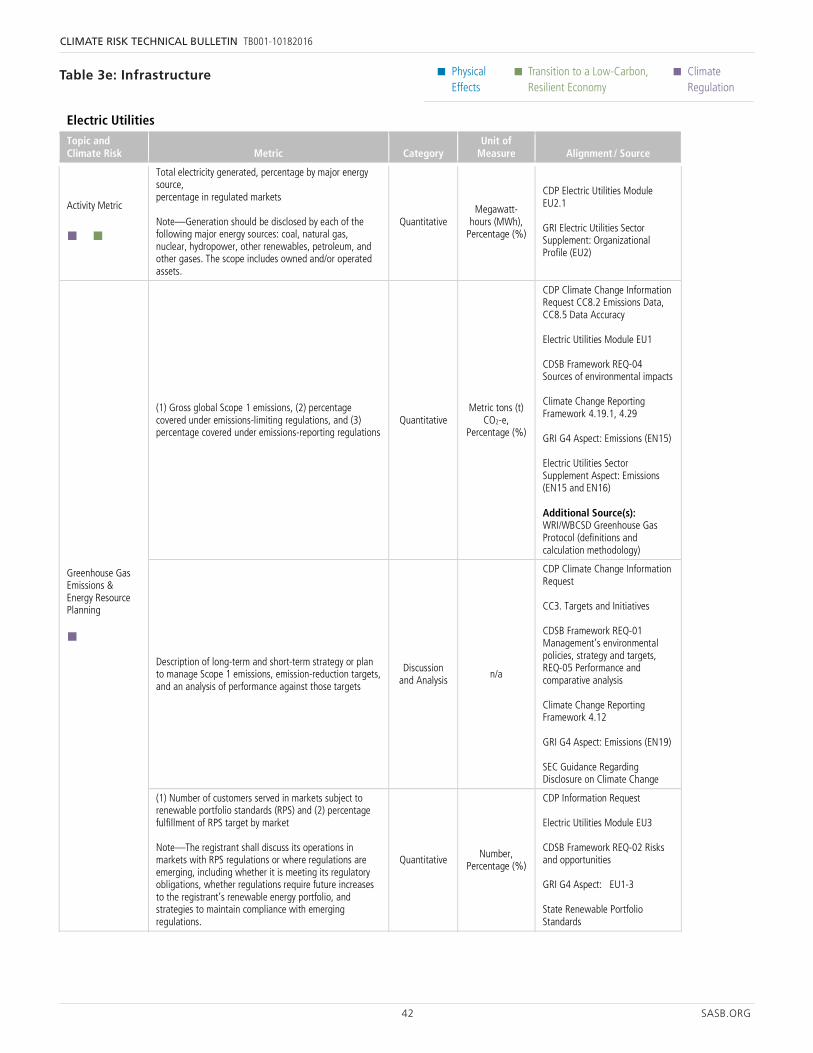
42 SASB.ORG
CLIMATE RISK TECHNICAL BULLETIN TB001-10182016
• Physical Effects
• Transition to a Low-Carbon, Resilient Economy
• Climate Regulation
Table 3e: Infrastructure
68 SASB.ORG
Physical Effects
Transition to a Low-Carbon, Resilient Economy
Climate Regulation
Electric Utilities Topic and Climate Risk Metric Category
Unit of Measure Alignment / Source
Activity Metric
Total electricity generated, percentage by major energy source, percentage in regulated markets Note—Generation should be disclosed by each of the following major energy sources: coal, natural gas, nuclear, hydropower, other renewables, petroleum, and other gases. The scope includes owned and/or operated assets.
Quantitative Megawatt-
hours (MWh), Percentage (%)
CDP Electric Utilities Module EU2.1 GRI Electric Utilities Sector Supplement: Organizational Profile (EU2)
Greenhouse Gas Emissions & Energy Resource Planning
(1) Gross global Scope 1 emissions, (2) percentage covered under emissions-limiting regulations, and (3) percentage covered under emissions-reporting regulations
Quantitative Metric tons (t)
CO2-e, Percentage (%)
CDP Climate Change Information Request CC8.2 Emissions Data, CC8.5 Data Accuracy Electric Utilities Module EU1 CDSB Framework REQ-04 Sources of environmental impacts Climate Change Reporting Framework 4.19.1, 4.29 GRI G4 Aspect: Emissions (EN15) Electric Utilities Sector Supplement Aspect: Emissions (EN15 and EN16) Additional Source(s): WRI/WBCSD Greenhouse Gas Protocol (definitions and calculation methodology)
Description of long-term and short-term strategy or plan to manage Scope 1 emissions, emission-reduction targets, and an analysis of performance against those targets
Discussion and Analysis
n/a
CDP Climate Change Information Request CC3. Targets and Initiatives CDSB Framework REQ-01 Management’s environmental policies, strategy and targets, REQ-05 Performance and comparative analysis Climate Change Reporting Framework 4.12 GRI G4 Aspect: Emissions (EN19) SEC Guidance Regarding Disclosure on Climate Change
(1) Number of customers served in markets subject to renewable portfolio standards (RPS) and (2) percentage fulfillment of RPS target by market Note—The registrant shall discuss its operations in markets with RPS regulations or where regulations are emerging, including whether it is meeting its regulatory obligations, whether regulations require future increases to the registrant’s renewable energy portfolio, and strategies to maintain compliance with emerging regulations.
Quantitative Number, Percentage (%)
CDP Information Request Electric Utilities Module EU3 CDSB Framework REQ-02 Risks and opportunities GRI G4 Aspect: EU1-3 State Renewable Portfolio Standards
Water (1) Total water withdrawn and (2) total water consumed, Quantitative Cubic Meters CDP Water Information Request
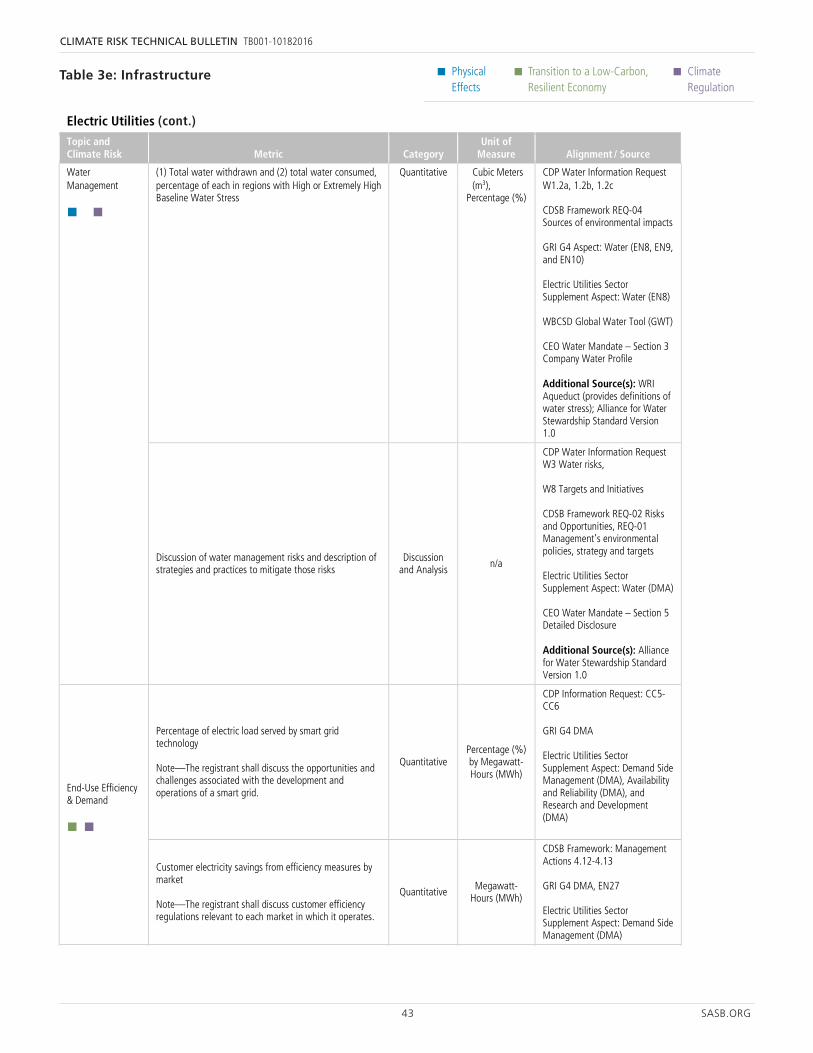
43 SASB.ORG
CLIMATE RISK TECHNICAL BULLETIN TB001-10182016
• Physical Effects
• Transition to a Low-Carbon, Resilient Economy
• Climate Regulation
68 SASB.ORG
Physical Effects
Transition to a Low-Carbon, Resilient Economy
Climate Regulation
Electric Utilities Topic and Climate Risk Metric Category
Unit of Measure Alignment / Source
Activity Metric
Total electricity generated, percentage by major energy source, percentage in regulated markets Note—Generation should be disclosed by each of the following major energy sources: coal, natural gas, nuclear, hydropower, other renewables, petroleum, and other gases. The scope includes owned and/or operated assets.
Quantitative Megawatt-
hours (MWh), Percentage (%)
CDP Electric Utilities Module EU2.1 GRI Electric Utilities Sector Supplement: Organizational Profile (EU2)
Greenhouse Gas Emissions & Energy Resource Planning
(1) Gross global Scope 1 emissions, (2) percentage covered under emissions-limiting regulations, and (3) percentage covered under emissions-reporting regulations
Quantitative Metric tons (t)
CO2-e, Percentage (%)
CDP Climate Change Information Request CC8.2 Emissions Data, CC8.5 Data Accuracy Electric Utilities Module EU1 CDSB Framework REQ-04 Sources of environmental impacts Climate Change Reporting Framework 4.19.1, 4.29 GRI G4 Aspect: Emissions (EN15) Electric Utilities Sector Supplement Aspect: Emissions (EN15 and EN16) Additional Source(s): WRI/WBCSD Greenhouse Gas Protocol (definitions and calculation methodology)
Description of long-term and short-term strategy or plan to manage Scope 1 emissions, emission-reduction targets, and an analysis of performance against those targets
Discussion and Analysis
n/a
CDP Climate Change Information Request CC3. Targets and Initiatives CDSB Framework REQ-01 Management’s environmental policies, strategy and targets, REQ-05 Performance and comparative analysis Climate Change Reporting Framework 4.12 GRI G4 Aspect: Emissions (EN19) SEC Guidance Regarding Disclosure on Climate Change
(1) Number of customers served in markets subject to renewable portfolio standards (RPS) and (2) percentage fulfillment of RPS target by market Note—The registrant shall discuss its operations in markets with RPS regulations or where regulations are emerging, including whether it is meeting its regulatory obligations, whether regulations require future increases to the registrant’s renewable energy portfolio, and strategies to maintain compliance with emerging regulations.
Quantitative Number, Percentage (%)
CDP Information Request Electric Utilities Module EU3 CDSB Framework REQ-02 Risks and opportunities GRI G4 Aspect: EU1-3 State Renewable Portfolio Standards
Water (1) Total water withdrawn and (2) total water consumed, Quantitative Cubic Meters CDP Water Information Request
69 SASB.ORG
Physical Effects
Transition to a Low-Carbon, Resilient Economy
Climate Regulation
Electric Utilities Topic and Climate Risk Metric Category
Unit of Measure Alignment / Source
Management
percentage of each in regions with High or Extremely High Baseline Water Stress
(m3), Percentage (%)
W1.2a, 1.2b, 1.2c CDSB Framework REQ-04 Sources of environmental impacts GRI G4 Aspect: Water (EN8, EN9, and EN10) Electric Utilities Sector Supplement Aspect: Water (EN8) WBCSD Global Water Tool (GWT) CEO Water Mandate – Section 3 Company Water Profile Additional Source(s): WRI Aqueduct (provides definitions of water stress); Alliance for Water Stewardship Standard Version 1.0
Discussion of water management risks and description of strategies and practices to mitigate those risks
Discussion and Analysis
n/a
CDP Water Information Request W3 Water risks, W8 Targets and Initiatives CDSB Framework REQ-02 Risks and Opportunities, REQ-01 Management’s environmental policies, strategy and targets Electric Utilities Sector Supplement Aspect: Water (DMA) CEO Water Mandate – Section 5 Detailed Disclosure Additional Source(s): Alliance for Water Stewardship Standard Version 1.0
End-Use Efficiency & Demand
Percentage of electric load served by smart grid technology Note—The registrant shall discuss the opportunities and challenges associated with the development and operations of a smart grid.
Quantitative Percentage (%) by Megawatt-Hours (MWh)
CDP Information Request: CC5-CC6 GRI G4 DMA Electric Utilities Sector Supplement Aspect: Demand Side Management (DMA), Availability and Reliability (DMA), and Research and Development (DMA)
Customer electricity savings from efficiency measures by market Note—The registrant shall discuss customer efficiency regulations relevant to each market in which it operates.
Quantitative Megawatt-Hours (MWh)
CDSB Framework: Management Actions 4.12-4.13 GRI G4 DMA, EN27 Electric Utilities Sector Supplement Aspect: Demand Side Management (DMA)
Management of Discussion of positions on the regulatory and political Discussion CDP CDC Information Request: CC5.1
Table 3e: Infrastructure
(cont.)
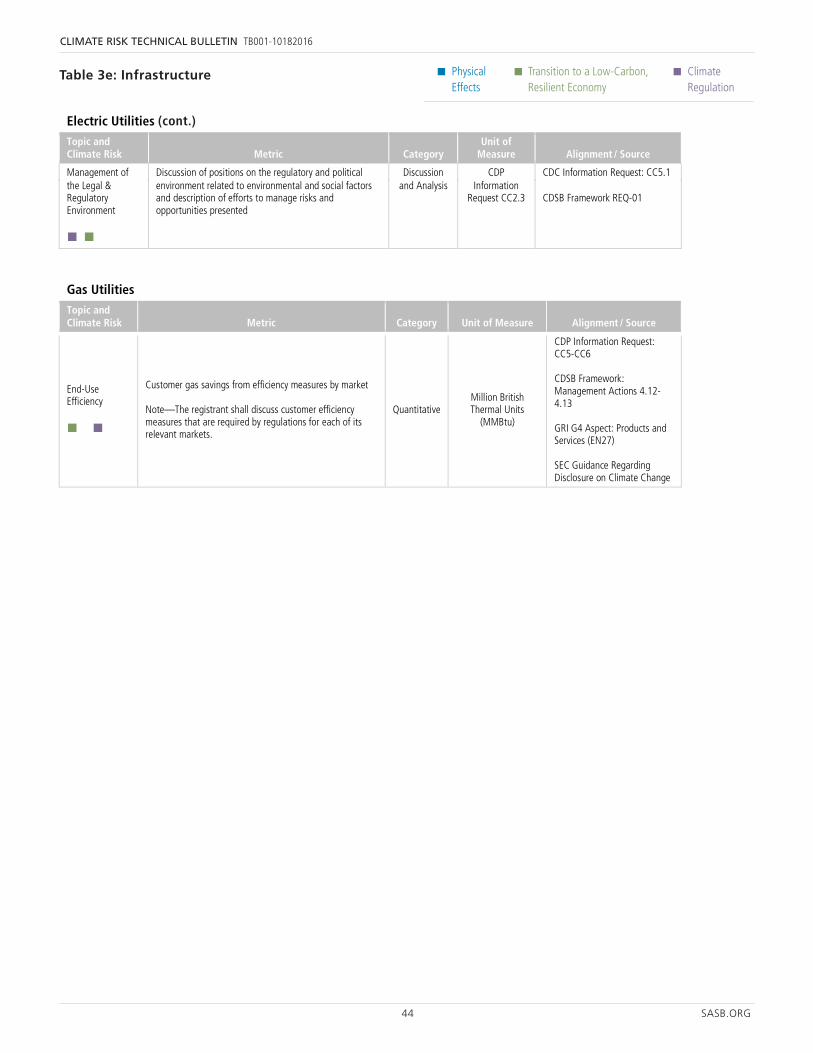
44 SASB.ORG
CLIMATE RISK TECHNICAL BULLETIN TB001-10182016
• Physical Effects
• Transition to a Low-Carbon, Resilient Economy
• Climate Regulation
Table 3e: Infrastructure
68 SASB.ORG
Physical Effects
Transition to a Low-Carbon, Resilient Economy
Climate Regulation
Electric Utilities Topic and Climate Risk Metric Category
Unit of Measure Alignment / Source
Activity Metric
Total electricity generated, percentage by major energy source, percentage in regulated markets Note—Generation should be disclosed by each of the following major energy sources: coal, natural gas, nuclear, hydropower, other renewables, petroleum, and other gases. The scope includes owned and/or operated assets.
Quantitative Megawatt-
hours (MWh), Percentage (%)
CDP Electric Utilities Module EU2.1 GRI Electric Utilities Sector Supplement: Organizational Profile (EU2)
Greenhouse Gas Emissions & Energy Resource Planning
(1) Gross global Scope 1 emissions, (2) percentage covered under emissions-limiting regulations, and (3) percentage covered under emissions-reporting regulations
Quantitative Metric tons (t)
CO2-e, Percentage (%)
CDP Climate Change Information Request CC8.2 Emissions Data, CC8.5 Data Accuracy Electric Utilities Module EU1 CDSB Framework REQ-04 Sources of environmental impacts Climate Change Reporting Framework 4.19.1, 4.29 GRI G4 Aspect: Emissions (EN15) Electric Utilities Sector Supplement Aspect: Emissions (EN15 and EN16) Additional Source(s): WRI/WBCSD Greenhouse Gas Protocol (definitions and calculation methodology)
Description of long-term and short-term strategy or plan to manage Scope 1 emissions, emission-reduction targets, and an analysis of performance against those targets
Discussion and Analysis
n/a
CDP Climate Change Information Request CC3. Targets and Initiatives CDSB Framework REQ-01 Management’s environmental policies, strategy and targets, REQ-05 Performance and comparative analysis Climate Change Reporting Framework 4.12 GRI G4 Aspect: Emissions (EN19) SEC Guidance Regarding Disclosure on Climate Change
(1) Number of customers served in markets subject to renewable portfolio standards (RPS) and (2) percentage fulfillment of RPS target by market Note—The registrant shall discuss its operations in markets with RPS regulations or where regulations are emerging, including whether it is meeting its regulatory obligations, whether regulations require future increases to the registrant’s renewable energy portfolio, and strategies to maintain compliance with emerging regulations.
Quantitative Number, Percentage (%)
CDP Information Request Electric Utilities Module EU3 CDSB Framework REQ-02 Risks and opportunities GRI G4 Aspect: EU1-3 State Renewable Portfolio Standards
Water (1) Total water withdrawn and (2) total water consumed, Quantitative Cubic Meters CDP Water Information Request
69 SASB.ORG
Physical Effects
Transition to a Low-Carbon, Resilient Economy
Climate Regulation
Electric Utilities Topic and Climate Risk Metric Category
Unit of Measure Alignment / Source
Management
percentage of each in regions with High or Extremely High Baseline Water Stress
(m3), Percentage (%)
W1.2a, 1.2b, 1.2c CDSB Framework REQ-04 Sources of environmental impacts GRI G4 Aspect: Water (EN8, EN9, and EN10) Electric Utilities Sector Supplement Aspect: Water (EN8) WBCSD Global Water Tool (GWT) CEO Water Mandate – Section 3 Company Water Profile Additional Source(s): WRI Aqueduct (provides definitions of water stress); Alliance for Water Stewardship Standard Version 1.0
Discussion of water management risks and description of strategies and practices to mitigate those risks
Discussion and Analysis
n/a
CDP Water Information Request W3 Water risks, W8 Targets and Initiatives CDSB Framework REQ-02 Risks and Opportunities, REQ-01 Management’s environmental policies, strategy and targets Electric Utilities Sector Supplement Aspect: Water (DMA) CEO Water Mandate – Section 5 Detailed Disclosure Additional Source(s): Alliance for Water Stewardship Standard Version 1.0
End-Use Efficiency & Demand
Percentage of electric load served by smart grid technology Note—The registrant shall discuss the opportunities and challenges associated with the development and operations of a smart grid.
Quantitative Percentage (%) by Megawatt-Hours (MWh)
CDP Information Request: CC5-CC6 GRI G4 DMA Electric Utilities Sector Supplement Aspect: Demand Side Management (DMA), Availability and Reliability (DMA), and Research and Development (DMA)
Customer electricity savings from efficiency measures by market Note—The registrant shall discuss customer efficiency regulations relevant to each market in which it operates.
Quantitative Megawatt-Hours (MWh)
CDSB Framework: Management Actions 4.12-4.13 GRI G4 DMA, EN27 Electric Utilities Sector Supplement Aspect: Demand Side Management (DMA)
Management of Discussion of positions on the regulatory and political Discussion CDP CDC Information Request: CC5.1
70 SASB.ORG
Physical Effects
Transition to a Low-Carbon, Resilient Economy
Climate Regulation
Electric Utilities Topic and Climate Risk Metric Category
Unit of Measure Alignment / Source
the Legal & Regulatory Environment
environment related to environmental and social factors and description of efforts to manage risks and opportunities presented
and Analysis Information Request CC2.3
CDSB Framework REQ-01
Gas Utilities Topic and Climate Risk Metric Category Unit of Measure Alignment / Source
End-Use Efficiency
Customer gas savings from efficiency measures by market Note—The registrant shall discuss customer efficiency measures that are required by regulations for each of its relevant markets.
Quantitative Million British Thermal Units
(MMBtu)
CDP Information Request: CC5-CC6 CDSB Framework: Management Actions 4.12-4.13 GRI G4 Aspect: Products and Services (EN27) SEC Guidance Regarding Disclosure on Climate Change
Water Utilities Topic and Climate Risk Metric Category
Unit of Measure Alignment / Source
Energy Management
Total energy consumed, percentage grid electricity, percentage renewable
Quantitative
Gigajoules (GJ),
Percentage (%)
CDP Climate Change Information Request CC11.2, CC11.3, CC3.1d Climate Change Reporting Framework 4.31.f GRI G4 Aspect: Energy (EN3)
Water Scarcity
Total fresh water sourced from regions with High or Extremely High Baseline Water Stress and percentage purchased from a third party
Quantitative
Cubic meters (m3),
Percentage (%)
CDP Water Information Request W1.2a, 1.2b, 1.2c CDSB Framework REQ-04 Sources of environmental impacts GRI G4 Aspect: Water (EN8, EN9, and EN10) WBCSD Global Water Tool (GWT) CEO Water Mandate – Section 3 Company Water Profile Additional Source(s): WRI Aqueduct (provides definitions of water stress); Alliance for Water Stewardship Standard Version 1.0
Volume of recycled water delivered Quantitative Cubic meters
(m3)
GRI G4 EN10 CEO Water Mandate Section 5 Detailed Disclosure, Advanced, Water withdrawals by source type
Discussion of strategies to manage risks associated with the quality and availability of water resources
Discussion and Analysis
n/a CDP Water Information Request W3 Water risks, W8 Targets and Initiatives
(cont.)
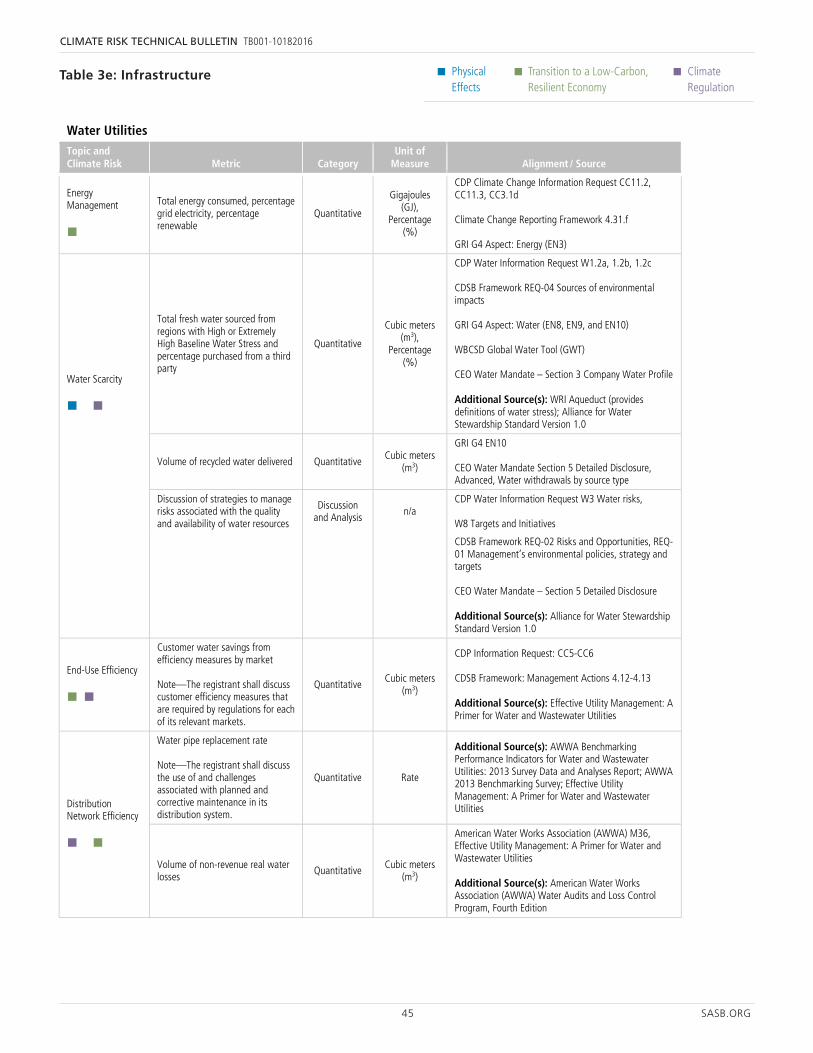
45 SASB.ORG
CLIMATE RISK TECHNICAL BULLETIN TB001-10182016
• Physical Effects
• Transition to a Low-Carbon, Resilient Economy
• Climate Regulation
70 SASB.ORG
Physical Effects
Transition to a Low-Carbon, Resilient Economy
Climate Regulation
Electric Utilities Topic and Climate Risk Metric Category
Unit of Measure Alignment / Source
the Legal & Regulatory Environment
environment related to environmental and social factors and description of efforts to manage risks and opportunities presented
and Analysis Information Request CC2.3
CDSB Framework REQ-01
Gas Utilities Topic and Climate Risk Metric Category Unit of Measure Alignment / Source
End-Use Efficiency
Customer gas savings from efficiency measures by market Note—The registrant shall discuss customer efficiency measures that are required by regulations for each of its relevant markets.
Quantitative Million British Thermal Units
(MMBtu)
CDP Information Request: CC5-CC6 CDSB Framework: Management Actions 4.12-4.13 GRI G4 Aspect: Products and Services (EN27) SEC Guidance Regarding Disclosure on Climate Change
Water Utilities Topic and Climate Risk Metric Category
Unit of Measure Alignment / Source
Energy Management
Total energy consumed, percentage grid electricity, percentage renewable
Quantitative
Gigajoules (GJ),
Percentage (%)
CDP Climate Change Information Request CC11.2, CC11.3, CC3.1d Climate Change Reporting Framework 4.31.f GRI G4 Aspect: Energy (EN3)
Water Scarcity
Total fresh water sourced from regions with High or Extremely High Baseline Water Stress and percentage purchased from a third party
Quantitative
Cubic meters (m3),
Percentage (%)
CDP Water Information Request W1.2a, 1.2b, 1.2c CDSB Framework REQ-04 Sources of environmental impacts GRI G4 Aspect: Water (EN8, EN9, and EN10) WBCSD Global Water Tool (GWT) CEO Water Mandate – Section 3 Company Water Profile Additional Source(s): WRI Aqueduct (provides definitions of water stress); Alliance for Water Stewardship Standard Version 1.0
Volume of recycled water delivered Quantitative Cubic meters
(m3)
GRI G4 EN10 CEO Water Mandate Section 5 Detailed Disclosure, Advanced, Water withdrawals by source type
Discussion of strategies to manage risks associated with the quality and availability of water resources
Discussion and Analysis
n/a CDP Water Information Request W3 Water risks, W8 Targets and Initiatives
71 SASB.ORG
Physical Effects
Transition to a Low-Carbon, Resilient Economy
Climate Regulation
Water Utilities Topic and Climate Risk Metric Category
Unit of Measure Alignment / Source
CDSB Framework REQ-02 Risks and Opportunities, REQ-01 Management’s environmental policies, strategy and targets CEO Water Mandate – Section 5 Detailed Disclosure Additional Source(s): Alliance for Water Stewardship Standard Version 1.0
End-Use Efficiency
Customer water savings from efficiency measures by market Note—The registrant shall discuss customer efficiency measures that are required by regulations for each of its relevant markets.
Quantitative Cubic meters
(m3)
CDP Information Request: CC5-CC6 CDSB Framework: Management Actions 4.12-4.13 Additional Source(s): Effective Utility Management: A Primer for Water and Wastewater Utilities
Distribution Network Efficiency
Water pipe replacement rate Note—The registrant shall discuss the use of and challenges associated with planned and corrective maintenance in its distribution system.
Quantitative Rate
Additional Source(s): AWWA Benchmarking Performance Indicators for Water and Wastewater Utilities: 2013 Survey Data and Analyses Report; AWWA 2013 Benchmarking Survey; Effective Utility Management: A Primer for Water and Wastewater Utilities
Volume of non-revenue real water losses
Quantitative Cubic meters (m3)
American Water Works Association (AWWA) M36, Effective Utility Management: A Primer for Water and Wastewater Utilities Additional Source(s): American Water Works Association (AWWA) Water Audits and Loss Control Program, Fourth Edition
Network Resiliency & Impacts of Climate Change
Water treatment capacity located in FEMA Special Flood Hazard Areas or foreign equivalent
Quantitative Cubic meters (m3) per day
Additional Source(s): FEMA Special Flood Hazard Areas
Volume of sanitary sewer overflows (SSO), percentage recovered
Quantitative
Cubic meters (m3),
Percentage (%)
State specific databases (CA, MD, MI) Additional Source(s): United States Sewage Overflow Community Right-To-Know Act; Effective Utility Management: A Primer for Water and Wastewater Utilities
(1) Number of service disruptions, (2) population affected, and (3) average duration Note—The registrant shall discuss notable service disruptions such as those that affected a significant population or those of extended duration.
Quantitative Number, Minutes
Additional Source(s): American Water Works Association (AWWA) Benchmarking Performance Indicators for Water and Wastewater Utilities: 2013 Survey Data and Analyses Report
Discussion of efforts to identify and manage risks and opportunities related to the impact of climate change on the distribution network
Discussion and Analysis
n/a
CDP Information Request: CC5 GRI G4 Aspect: Economic Performance (EC2) Additional Source(s): Effective Utility Management: A Primer for Water and Wastewater Utilities
Table 3e: Infrastructure
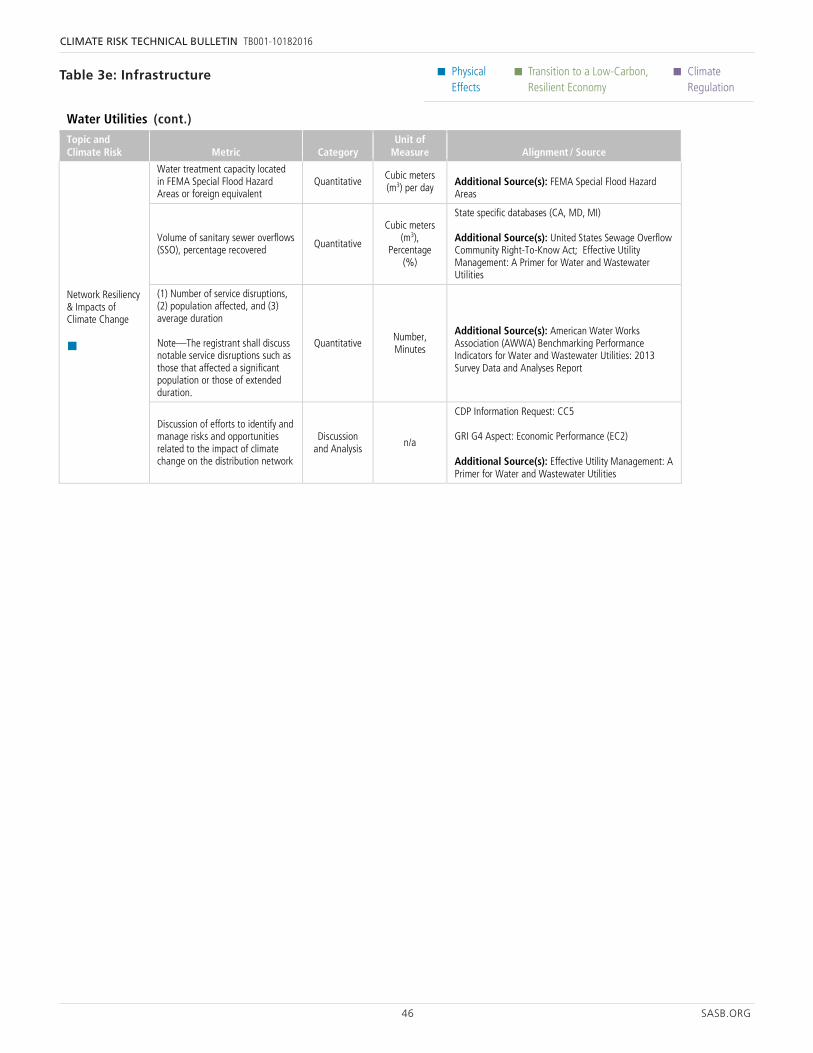
46 SASB.ORG
CLIMATE RISK TECHNICAL BULLETIN TB001-10182016
• Physical Effects
• Transition to a Low-Carbon, Resilient Economy
• Climate Regulation
70 SASB.ORG
Physical Effects
Transition to a Low-Carbon, Resilient Economy
Climate Regulation
Electric Utilities Topic and Climate Risk Metric Category
Unit of Measure Alignment / Source
the Legal & Regulatory Environment
environment related to environmental and social factors and description of efforts to manage risks and opportunities presented
and Analysis Information Request CC2.3
CDSB Framework REQ-01
Gas Utilities Topic and Climate Risk Metric Category Unit of Measure Alignment / Source
End-Use Efficiency
Customer gas savings from efficiency measures by market Note—The registrant shall discuss customer efficiency measures that are required by regulations for each of its relevant markets.
Quantitative Million British Thermal Units
(MMBtu)
CDP Information Request: CC5-CC6 CDSB Framework: Management Actions 4.12-4.13 GRI G4 Aspect: Products and Services (EN27) SEC Guidance Regarding Disclosure on Climate Change
Water Utilities Topic and Climate Risk Metric Category
Unit of Measure Alignment / Source
Energy Management
Total energy consumed, percentage grid electricity, percentage renewable
Quantitative
Gigajoules (GJ),
Percentage (%)
CDP Climate Change Information Request CC11.2, CC11.3, CC3.1d Climate Change Reporting Framework 4.31.f GRI G4 Aspect: Energy (EN3)
Water Scarcity
Total fresh water sourced from regions with High or Extremely High Baseline Water Stress and percentage purchased from a third party
Quantitative
Cubic meters (m3),
Percentage (%)
CDP Water Information Request W1.2a, 1.2b, 1.2c CDSB Framework REQ-04 Sources of environmental impacts GRI G4 Aspect: Water (EN8, EN9, and EN10) WBCSD Global Water Tool (GWT) CEO Water Mandate – Section 3 Company Water Profile Additional Source(s): WRI Aqueduct (provides definitions of water stress); Alliance for Water Stewardship Standard Version 1.0
Volume of recycled water delivered Quantitative Cubic meters
(m3)
GRI G4 EN10 CEO Water Mandate Section 5 Detailed Disclosure, Advanced, Water withdrawals by source type
Discussion of strategies to manage risks associated with the quality and availability of water resources
Discussion and Analysis
n/a CDP Water Information Request W3 Water risks, W8 Targets and Initiatives
71 SASB.ORG
Physical Effects
Transition to a Low-Carbon, Resilient Economy
Climate Regulation
Water Utilities Topic and Climate Risk Metric Category
Unit of Measure Alignment / Source
CDSB Framework REQ-02 Risks and Opportunities, REQ-01 Management’s environmental policies, strategy and targets CEO Water Mandate – Section 5 Detailed Disclosure Additional Source(s): Alliance for Water Stewardship Standard Version 1.0
End-Use Efficiency
Customer water savings from efficiency measures by market Note—The registrant shall discuss customer efficiency measures that are required by regulations for each of its relevant markets.
Quantitative Cubic meters
(m3)
CDP Information Request: CC5-CC6 CDSB Framework: Management Actions 4.12-4.13 Additional Source(s): Effective Utility Management: A Primer for Water and Wastewater Utilities
Distribution Network Efficiency
Water pipe replacement rate Note—The registrant shall discuss the use of and challenges associated with planned and corrective maintenance in its distribution system.
Quantitative Rate
Additional Source(s): AWWA Benchmarking Performance Indicators for Water and Wastewater Utilities: 2013 Survey Data and Analyses Report; AWWA 2013 Benchmarking Survey; Effective Utility Management: A Primer for Water and Wastewater Utilities
Volume of non-revenue real water losses
Quantitative Cubic meters (m3)
American Water Works Association (AWWA) M36, Effective Utility Management: A Primer for Water and Wastewater Utilities Additional Source(s): American Water Works Association (AWWA) Water Audits and Loss Control Program, Fourth Edition
Network Resiliency & Impacts of Climate Change
Water treatment capacity located in FEMA Special Flood Hazard Areas or foreign equivalent
Quantitative Cubic meters (m3) per day
Additional Source(s): FEMA Special Flood Hazard Areas
Volume of sanitary sewer overflows (SSO), percentage recovered
Quantitative
Cubic meters (m3),
Percentage (%)
State specific databases (CA, MD, MI) Additional Source(s): United States Sewage Overflow Community Right-To-Know Act; Effective Utility Management: A Primer for Water and Wastewater Utilities
(1) Number of service disruptions, (2) population affected, and (3) average duration Note—The registrant shall discuss notable service disruptions such as those that affected a significant population or those of extended duration.
Quantitative Number, Minutes
Additional Source(s): American Water Works Association (AWWA) Benchmarking Performance Indicators for Water and Wastewater Utilities: 2013 Survey Data and Analyses Report
Discussion of efforts to identify and manage risks and opportunities related to the impact of climate change on the distribution network
Discussion and Analysis
n/a
CDP Information Request: CC5 GRI G4 Aspect: Economic Performance (EC2) Additional Source(s): Effective Utility Management: A Primer for Water and Wastewater Utilities
Table 3e: Infrastructure
(cont.)
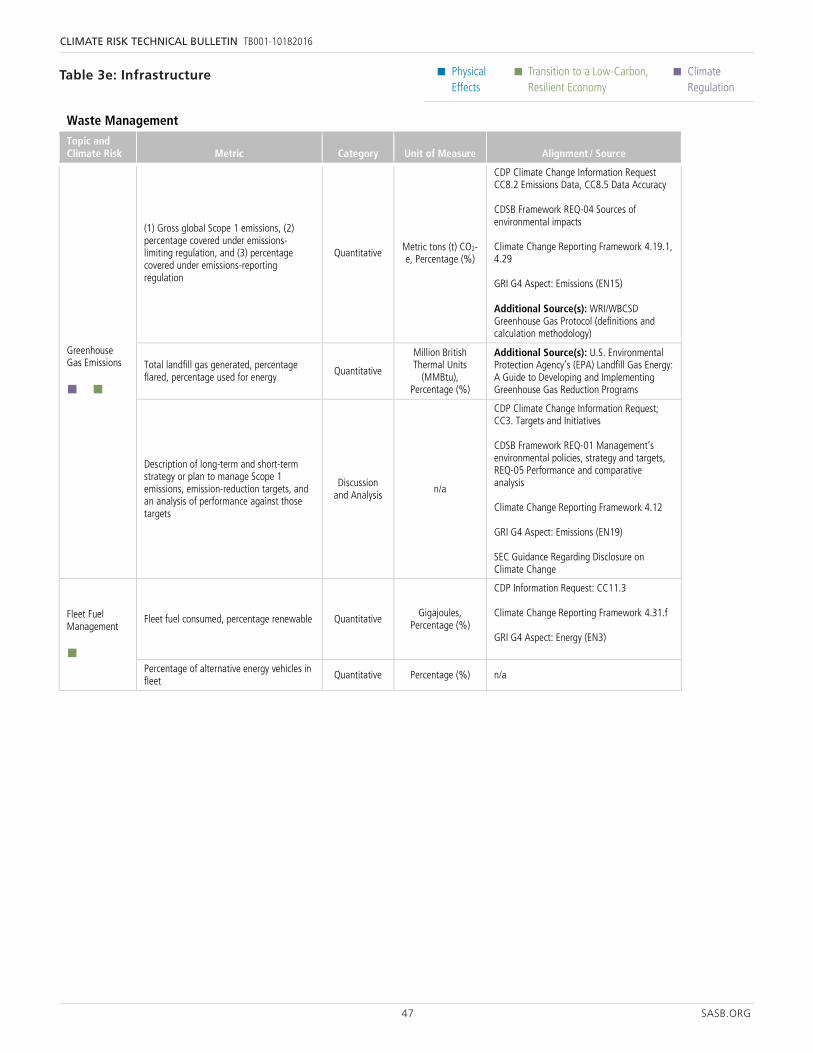
47 SASB.ORG
CLIMATE RISK TECHNICAL BULLETIN TB001-10182016
• Physical Effects
• Transition to a Low-Carbon, Resilient Economy
• Climate Regulation
72 SASB.ORG
Physical Effects
Transition to a Low-Carbon, Resilient Economy
Climate Regulation
Waste Management Topic and Climate Risk Metric Category Unit of Measure Alignment / Source
Greenhouse Gas Emissions
(1) Gross global Scope 1 emissions, (2) percentage covered under emissions-limiting regulation, and (3) percentage covered under emissions-reporting regulation
Quantitative Metric tons (t) CO2-e, Percentage (%)
CDP Climate Change Information Request CC8.2 Emissions Data, CC8.5 Data Accuracy CDSB Framework REQ-04 Sources of environmental impacts Climate Change Reporting Framework 4.19.1, 4.29 GRI G4 Aspect: Emissions (EN15) Additional Source(s): WRI/WBCSD Greenhouse Gas Protocol (definitions and calculation methodology)
Total landfill gas generated, percentage flared, percentage used for energy
Quantitative
Million British Thermal Units
(MMBtu), Percentage (%)
Additional Source(s): U.S. Environmental Protection Agency’s (EPA) Landfill Gas Energy: A Guide to Developing and Implementing Greenhouse Gas Reduction Programs
Description of long-term and short-term strategy or plan to manage Scope 1 emissions, emission-reduction targets, and an analysis of performance against those targets
Discussion and Analysis
n/a
CDP Climate Change Information Request; CC3. Targets and Initiatives CDSB Framework REQ-01 Management’s environmental policies, strategy and targets, REQ-05 Performance and comparative analysis Climate Change Reporting Framework 4.12 GRI G4 Aspect: Emissions (EN19) SEC Guidance Regarding Disclosure on Climate Change
Fleet Fuel Management
Fleet fuel consumed, percentage renewable Quantitative Gigajoules, Percentage (%)
CDP Information Request: CC11.3 Climate Change Reporting Framework 4.31.f GRI G4 Aspect: Energy (EN3)
Percentage of alternative energy vehicles in fleet
Quantitative Percentage (%) n/a
Engineering & Construction Services Topic and Climate Risk Metric Category
Unit of Measure Alignment / Source
Structural Integrity & Safety
Amount of defect- and safety-related rework expenses Quantitative U.S. Dollars
($) n/a
Amount of legal and regulatory fines and settlements associated with defect- and safety-related incidents
Quantitative U.S. Dollars ($)
GRI G4 Aspect: Compliance (PR9)
Climate Impacts of Business Mix
Backlog for (1) hydrocarbon-related projects and (2) renewable energy projects
Quantitative U.S. Dollars
($) Typical annual filings of E&C companies with the SEC
Table 3e: Infrastructure
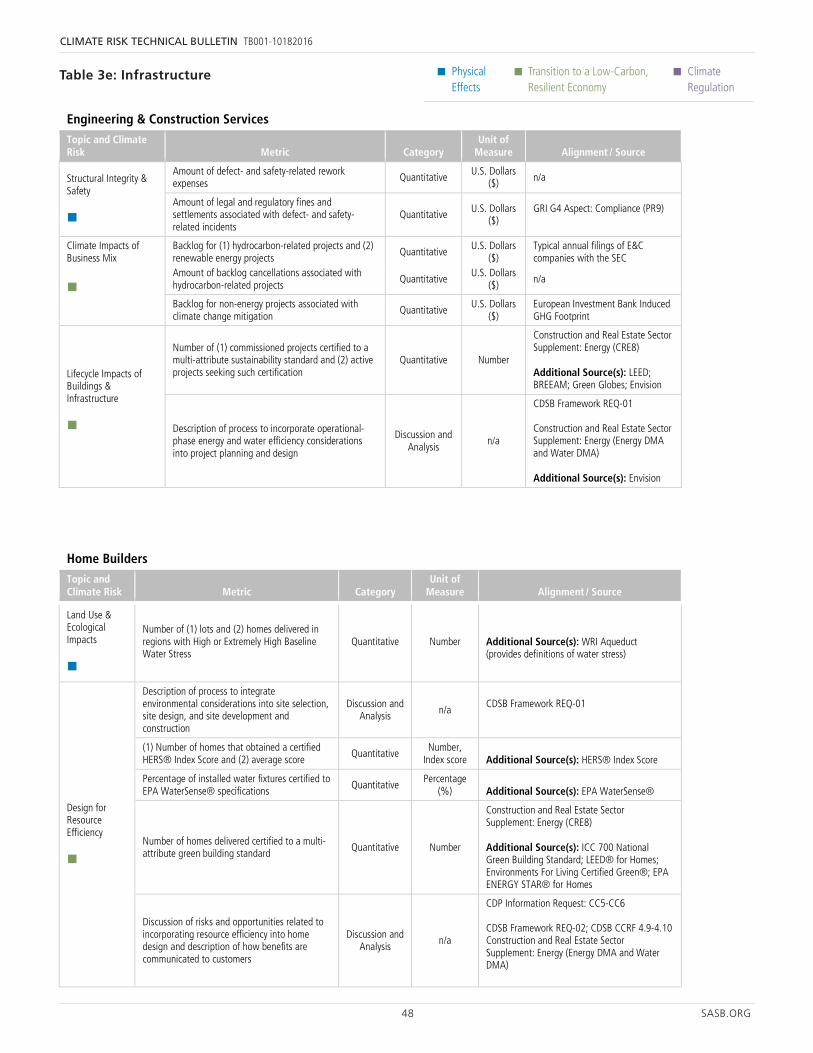
48 SASB.ORG
CLIMATE RISK TECHNICAL BULLETIN TB001-10182016
• Physical Effects
• Transition to a Low-Carbon, Resilient Economy
• Climate Regulation
72 SASB.ORG
Physical Effects
Transition to a Low-Carbon, Resilient Economy
Climate Regulation
Waste Management Topic and Climate Risk Metric Category Unit of Measure Alignment / Source
Greenhouse Gas Emissions
(1) Gross global Scope 1 emissions, (2) percentage covered under emissions-limiting regulation, and (3) percentage covered under emissions-reporting regulation
Quantitative Metric tons (t) CO2-e, Percentage (%)
CDP Climate Change Information Request CC8.2 Emissions Data, CC8.5 Data Accuracy CDSB Framework REQ-04 Sources of environmental impacts Climate Change Reporting Framework 4.19.1, 4.29 GRI G4 Aspect: Emissions (EN15) Additional Source(s): WRI/WBCSD Greenhouse Gas Protocol (definitions and calculation methodology)
Total landfill gas generated, percentage flared, percentage used for energy
Quantitative
Million British Thermal Units
(MMBtu), Percentage (%)
Additional Source(s): U.S. Environmental Protection Agency’s (EPA) Landfill Gas Energy: A Guide to Developing and Implementing Greenhouse Gas Reduction Programs
Description of long-term and short-term strategy or plan to manage Scope 1 emissions, emission-reduction targets, and an analysis of performance against those targets
Discussion and Analysis
n/a
CDP Climate Change Information Request; CC3. Targets and Initiatives CDSB Framework REQ-01 Management’s environmental policies, strategy and targets, REQ-05 Performance and comparative analysis Climate Change Reporting Framework 4.12 GRI G4 Aspect: Emissions (EN19) SEC Guidance Regarding Disclosure on Climate Change
Fleet Fuel Management
Fleet fuel consumed, percentage renewable Quantitative Gigajoules, Percentage (%)
CDP Information Request: CC11.3 Climate Change Reporting Framework 4.31.f GRI G4 Aspect: Energy (EN3)
Percentage of alternative energy vehicles in fleet
Quantitative Percentage (%) n/a
Engineering & Construction Services Topic and Climate Risk Metric Category
Unit of Measure Alignment / Source
Structural Integrity & Safety
Amount of defect- and safety-related rework expenses Quantitative U.S. Dollars
($) n/a
Amount of legal and regulatory fines and settlements associated with defect- and safety-related incidents
Quantitative U.S. Dollars ($)
GRI G4 Aspect: Compliance (PR9)
Climate Impacts of Business Mix
Backlog for (1) hydrocarbon-related projects and (2) renewable energy projects
Quantitative U.S. Dollars
($) Typical annual filings of E&C companies with the SEC
73 SASB.ORG
Physical Effects
Transition to a Low-Carbon, Resilient Economy
Climate Regulation
Amount of backlog cancellations associated with hydrocarbon-related projects
Quantitative U.S. Dollars
($) n/a
Backlog for non-energy projects associated with climate change mitigation
Quantitative U.S. Dollars
($) European Investment Bank Induced GHG Footprint
Lifecycle Impacts of Buildings & Infrastructure
Number of (1) commissioned projects certified to a multi-attribute sustainability standard and (2) active projects seeking such certification
Quantitative Number
Construction and Real Estate Sector Supplement: Energy (CRE8) Additional Source(s): LEED; BREEAM; Green Globes; Envision
Description of process to incorporate operational-phase energy and water efficiency considerations into project planning and design
Discussion and Analysis
n/a
CDSB Framework REQ-01 Construction and Real Estate Sector Supplement: Energy (Energy DMA and Water DMA) Additional Source(s): Envision
Home Builders Topic and Climate Risk Metric Category
Unit of Measure Alignment / Source
Land Use & Ecological Impacts
Number of (1) lots and (2) homes delivered in regions with High or Extremely High Baseline Water Stress
Quantitative Number Additional Source(s): WRI Aqueduct (provides definitions of water stress)
Design for Resource Efficiency
Description of process to integrate environmental considerations into site selection, site design, and site development and construction
Discussion and Analysis n/a
CDSB Framework REQ-01
(1) Number of homes that obtained a certified HERS® Index Score and (2) average score
Quantitative Number,
Index score Additional Source(s): HERS® Index Score
Percentage of installed water fixtures certified to EPA WaterSense® specifications Quantitative Percentage
(%) Additional Source(s): EPA WaterSense®
Number of homes delivered certified to a multi-attribute green building standard Quantitative Number
Construction and Real Estate Sector Supplement: Energy (CRE8) Additional Source(s): ICC 700 National Green Building Standard; LEED® for Homes; Environments For Living Certified Green®; EPA ENERGY STAR® for Homes
Discussion of risks and opportunities related to incorporating resource efficiency into home design and description of how benefits are communicated to customers
Discussion and Analysis
n/a
CDP Information Request: CC5-CC6 CDSB Framework REQ-02; CDSB CCRF 4.9-4.10 Construction and Real Estate Sector Supplement: Energy (Energy DMA and Water DMA)
Climate Change Adaptation
Number of lots located in FEMA Special Flood Hazard Areas or foreign equivalent
Quantitative Number Additional Source(s): FEMA Special Flood Hazard Areas
Description of climate change risk exposure analysis, degree of systematic portfolio exposure, and strategies for mitigating risks
Discussion and Analysis
n/a
CDP Information Request CC2.1-2.2, CC5 CDSB Framework REQ-02; CDSB CCRF 4.3-4.10
Table 3e: Infrastructure
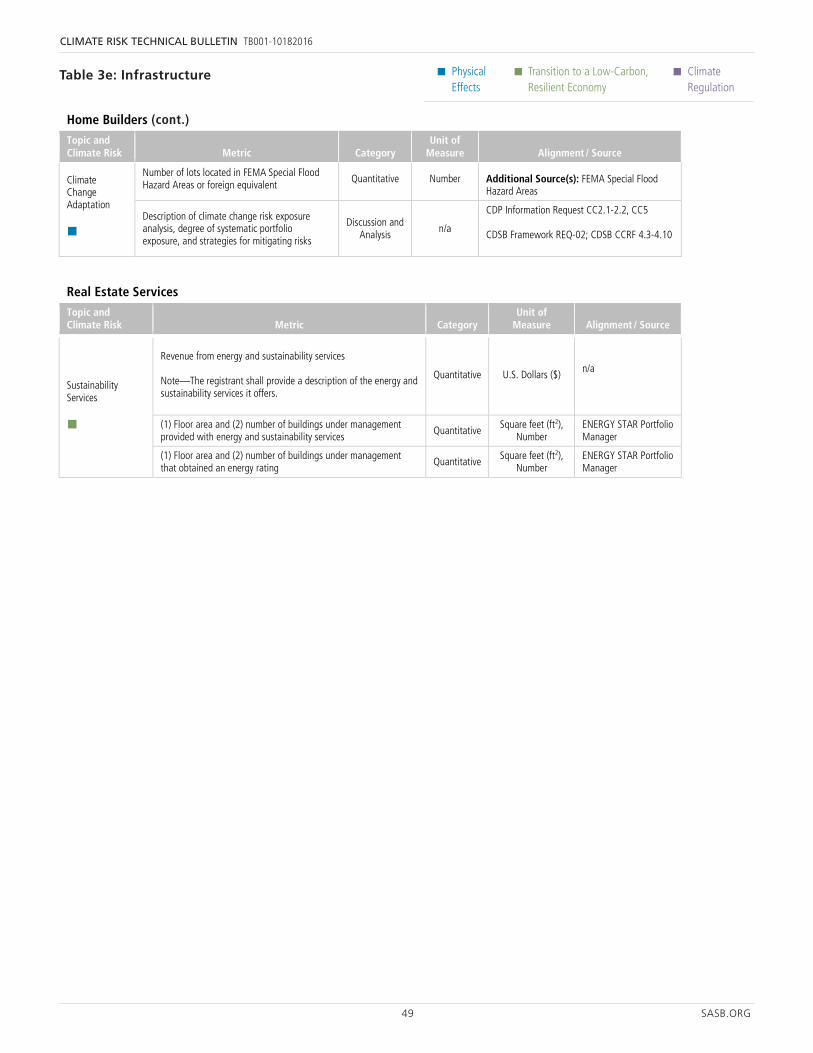
49 SASB.ORG
CLIMATE RISK TECHNICAL BULLETIN TB001-10182016
• Physical Effects
• Transition to a Low-Carbon, Resilient Economy
• Climate Regulation
73 SASB.ORG
Physical Effects
Transition to a Low-Carbon, Resilient Economy
Climate Regulation
Amount of backlog cancellations associated with hydrocarbon-related projects
Quantitative U.S. Dollars
($) n/a
Backlog for non-energy projects associated with climate change mitigation
Quantitative U.S. Dollars
($) European Investment Bank Induced GHG Footprint
Lifecycle Impacts of Buildings & Infrastructure
Number of (1) commissioned projects certified to a multi-attribute sustainability standard and (2) active projects seeking such certification
Quantitative Number
Construction and Real Estate Sector Supplement: Energy (CRE8) Additional Source(s): LEED; BREEAM; Green Globes; Envision
Description of process to incorporate operational-phase energy and water efficiency considerations into project planning and design
Discussion and Analysis
n/a
CDSB Framework REQ-01 Construction and Real Estate Sector Supplement: Energy (Energy DMA and Water DMA) Additional Source(s): Envision
Home Builders Topic and Climate Risk Metric Category
Unit of Measure Alignment / Source
Land Use & Ecological Impacts
Number of (1) lots and (2) homes delivered in regions with High or Extremely High Baseline Water Stress
Quantitative Number Additional Source(s): WRI Aqueduct (provides definitions of water stress)
Design for Resource Efficiency
Description of process to integrate environmental considerations into site selection, site design, and site development and construction
Discussion and Analysis n/a
CDSB Framework REQ-01
(1) Number of homes that obtained a certified HERS® Index Score and (2) average score
Quantitative Number,
Index score Additional Source(s): HERS® Index Score
Percentage of installed water fixtures certified to EPA WaterSense® specifications Quantitative Percentage
(%) Additional Source(s): EPA WaterSense®
Number of homes delivered certified to a multi-attribute green building standard Quantitative Number
Construction and Real Estate Sector Supplement: Energy (CRE8) Additional Source(s): ICC 700 National Green Building Standard; LEED® for Homes; Environments For Living Certified Green®; EPA ENERGY STAR® for Homes
Discussion of risks and opportunities related to incorporating resource efficiency into home design and description of how benefits are communicated to customers
Discussion and Analysis
n/a
CDP Information Request: CC5-CC6 CDSB Framework REQ-02; CDSB CCRF 4.9-4.10 Construction and Real Estate Sector Supplement: Energy (Energy DMA and Water DMA)
Climate Change Adaptation
Number of lots located in FEMA Special Flood Hazard Areas or foreign equivalent
Quantitative Number Additional Source(s): FEMA Special Flood Hazard Areas
Description of climate change risk exposure analysis, degree of systematic portfolio exposure, and strategies for mitigating risks
Discussion and Analysis
n/a
CDP Information Request CC2.1-2.2, CC5 CDSB Framework REQ-02; CDSB CCRF 4.3-4.10
74 SASB.ORG
Physical Effects
Transition to a Low-Carbon, Resilient Economy
Climate Regulation
Real Estate Services Topic and Climate Risk Metric Category
Unit of Measure Alignment / Source
Sustainability Services
Revenue from energy and sustainability services Note—The registrant shall provide a description of the energy and sustainability services it offers.
Quantitative U.S. Dollars ($) n/a
(1) Floor area and (2) number of buildings under management provided with energy and sustainability services
Quantitative Square feet (ft2),
Number ENERGY STAR Portfolio Manager
(1) Floor area and (2) number of buildings under management that obtained an energy rating
Quantitative Square feet (ft2),
Number ENERGY STAR Portfolio Manager
Real Estate Owners, Developers & Investment Trusts Topic and Climate Risk Metric Category
Unit of Measure Alignment / Source
Energy Management
Energy consumption data coverage as a percentage of floor area, by property subsector
Quantitative Percentage (%) by floor area (ft2)
Construction and Real Estate Sector Supplement: Energy (DMA) GRESB Q25.1 ENERGY STAR Portfolio Manager
Total energy consumed by portfolio area with data coverage, percentage grid electricity, and percentage renewable, each by property subsector
Quantitative Gigajoules (GJ), Percentage (%)
CDP Climate Change Information Request CC11.2, CC11.3, CC3.1d Climate Change Reporting Framework 4.31.f GRI G4 Aspect: Energy (EN3 and EN4) Construction and Real Estate Sector Supplement: Energy (EN3, EN4, DMA) GRESB Q25.1, 25.3 ENERGY STAR Portfolio Manager ULI Greenprint
Like-for-like change in energy consumption of portfolio area with data coverage, by property subsector
Quantitative Percentage (%) by gigajoules
(GJ)
CDP Climate Change Information Request CC11.2, CC11.3, CC3.1d Climate Change Reporting Framework 4.31.f GRI G4 Aspect: Energy (EN5 and EN6) Construction and Real Estate Sector Supplement: Energy (EN6) GRESB Q25.1 ENERGY STAR Portfolio Manager ULI Greenprint
Percentage of eligible portfolio that (1) has obtained an energy rating and (2) is certified to ENERGY STAR®, by property subsector
Quantitative Percentage (%) by floor area (ft2)
GRESB Q30.2, Q31; ENERGY STAR Portfolio Manager; ULI Greenprint
Table 3e: Infrastructure
(cont.)
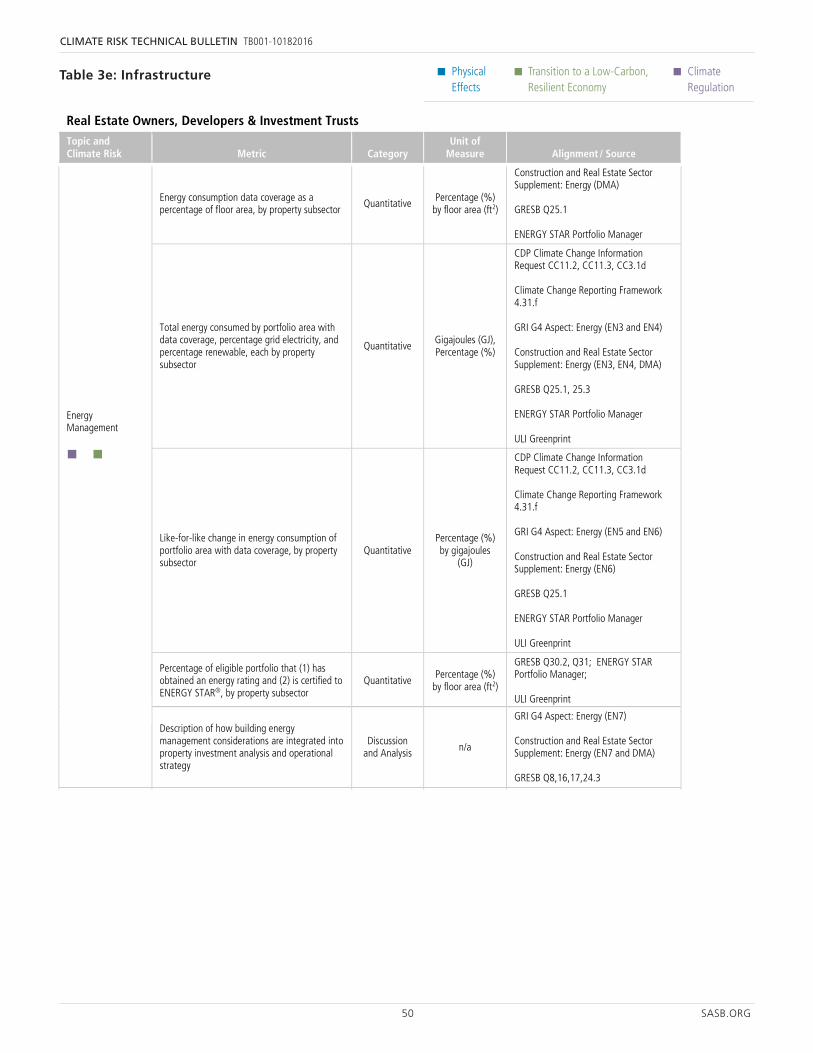
50 SASB.ORG
CLIMATE RISK TECHNICAL BULLETIN TB001-10182016
• Physical Effects
• Transition to a Low-Carbon, Resilient Economy
• Climate Regulation
74 SASB.ORG
Physical Effects
Transition to a Low-Carbon, Resilient Economy
Climate Regulation
Real Estate Services Topic and Climate Risk Metric Category
Unit of Measure Alignment / Source
Sustainability Services
Revenue from energy and sustainability services Note—The registrant shall provide a description of the energy and sustainability services it offers.
Quantitative U.S. Dollars ($) n/a
(1) Floor area and (2) number of buildings under management provided with energy and sustainability services
Quantitative Square feet (ft2),
Number ENERGY STAR Portfolio Manager
(1) Floor area and (2) number of buildings under management that obtained an energy rating
Quantitative Square feet (ft2),
Number ENERGY STAR Portfolio Manager
Real Estate Owners, Developers & Investment Trusts Topic and Climate Risk Metric Category
Unit of Measure Alignment / Source
Energy Management
Energy consumption data coverage as a percentage of floor area, by property subsector
Quantitative Percentage (%) by floor area (ft2)
Construction and Real Estate Sector Supplement: Energy (DMA) GRESB Q25.1 ENERGY STAR Portfolio Manager
Total energy consumed by portfolio area with data coverage, percentage grid electricity, and percentage renewable, each by property subsector
Quantitative Gigajoules (GJ), Percentage (%)
CDP Climate Change Information Request CC11.2, CC11.3, CC3.1d Climate Change Reporting Framework 4.31.f GRI G4 Aspect: Energy (EN3 and EN4) Construction and Real Estate Sector Supplement: Energy (EN3, EN4, DMA) GRESB Q25.1, 25.3 ENERGY STAR Portfolio Manager ULI Greenprint
Like-for-like change in energy consumption of portfolio area with data coverage, by property subsector
Quantitative Percentage (%) by gigajoules
(GJ)
CDP Climate Change Information Request CC11.2, CC11.3, CC3.1d Climate Change Reporting Framework 4.31.f GRI G4 Aspect: Energy (EN5 and EN6) Construction and Real Estate Sector Supplement: Energy (EN6) GRESB Q25.1 ENERGY STAR Portfolio Manager ULI Greenprint
Percentage of eligible portfolio that (1) has obtained an energy rating and (2) is certified to ENERGY STAR®, by property subsector
Quantitative Percentage (%) by floor area (ft2)
GRESB Q30.2, Q31; ENERGY STAR Portfolio Manager; ULI Greenprint
75 SASB.ORG
Physical Effects
Transition to a Low-Carbon, Resilient Economy
Climate Regulation
Real Estate Owners, Developers & Investment Trusts Topic and Climate Risk Metric Category
Unit of Measure Alignment / Source
Description of how building energy management considerations are integrated into property investment analysis and operational strategy
Discussion and Analysis n/a
GRI G4 Aspect: Energy (EN7) Construction and Real Estate Sector Supplement: Energy (EN7 and DMA) GRESB Q8,16,17,24.3
Water Management
Water withdrawal data coverage as a percentage of total floor area and percentage in regions with High or Extremely High Baseline Water Stress, each by property subsector
Quantitative Percentage (%)
by floor area (ft2)
Construction and Real Estate Sector Supplement: Water (DMA) GRESB 27.1; ENERGY STAR Portfolio Manager; ULI Greenprint
Total water withdrawn by portfolio area with data coverage and percentage in regions with High or Extremely High Baseline Water Stress, each by property subsector
Quantitative Cubic meters
(m3), Percentage (%)
CDP Water Information Request W1.2a, 1.2b, 1.2c CDSB Framework REQ-04 Sources of environmental impacts GRI G4 Aspect: Water (EN8, EN9, and EN10) Construction and Real Estate Sector Supplement: Water (DMA) GRESB 27.1; WBCSD Global Water Tool (GWT); CEO Water Mandate – Section 3 Company Water Profile; ENERGY STAR Portfolio Manager; ULI Greenprint Additional Source(s): WRI Aqueduct (provides definitions of water stress); Alliance for Water Stewardship Standard Version 1.0
Like-for-like change in water withdrawn for portfolio area with data coverage, by property subsector
Quantitative Percentage (%) by cubic meters
(m3)
GRESB 27.1; ENERGY STAR Portfolio Manager; ULI Greenprint
Discussion of water management risks and description of strategies and practices to mitigate those risks
Discussion and Analysis
n/a
CDP Water Information Request W3 Water risks, W8 Targets and Initiatives CDSB Framework REQ-02 Risks and Opportunities, REQ-01 Management’s environmental policies, strategy and targets Construction and Real Estate Sector Supplement: Water (DMA) CEO Water Mandate – Section 5 Detailed Disclosure Additional Source(s): Alliance for Water Stewardship Standard Version 1.0
Management of Tenant Sustainability Impacts
Percentage of new leases that contain a cost recovery clause for resource efficiency-related capital improvements and associated leased floor area, by property subsector
Quantitative
Percentage (%) by floor area (ft2), Square
feet (ft2)
Construction and Real Estate Sector Supplement: Energy (DMA) GRESB 39.1
Percentage of tenants that are separately metered or submetered for (1) grid electricity
Quantitative Percentage (%)
by floor area (ft2) Construction and Real Estate Sector Supplement: Energy (DMA)
Table 3e: Infrastructure
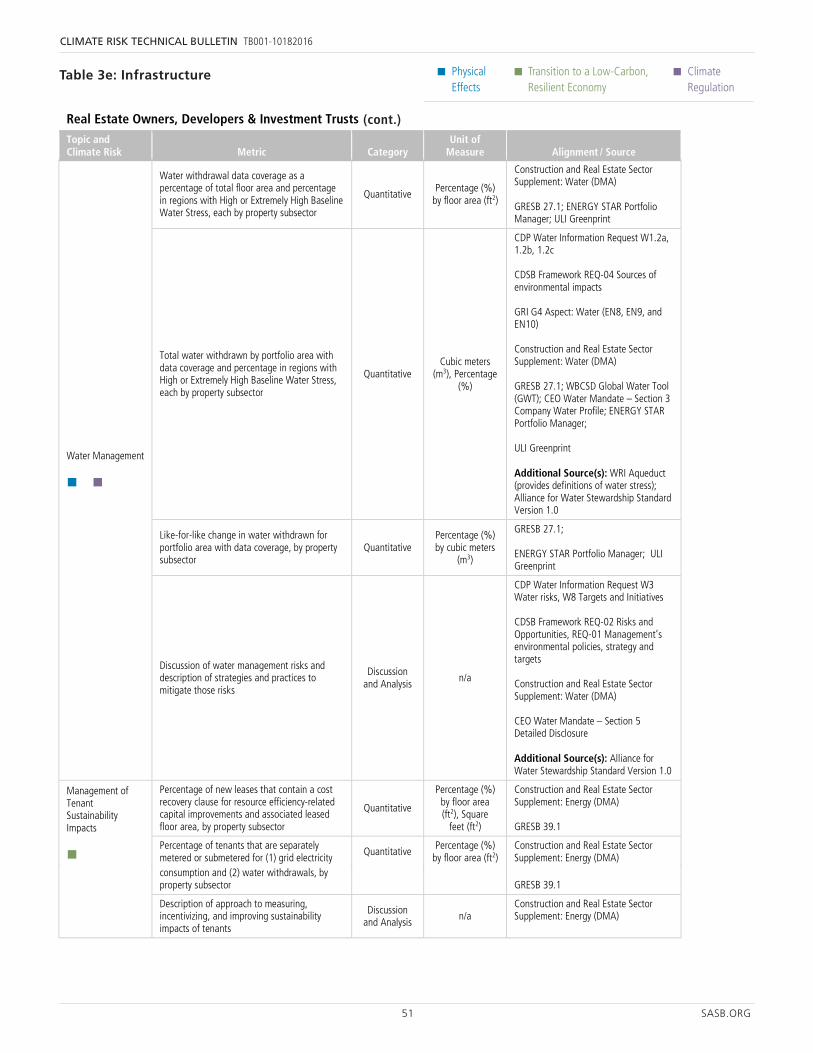
51 SASB.ORG
CLIMATE RISK TECHNICAL BULLETIN TB001-10182016
• Physical Effects
• Transition to a Low-Carbon, Resilient Economy
• Climate Regulation
74 SASB.ORG
Physical Effects
Transition to a Low-Carbon, Resilient Economy
Climate Regulation
Real Estate Services Topic and Climate Risk Metric Category
Unit of Measure Alignment / Source
Sustainability Services
Revenue from energy and sustainability services Note—The registrant shall provide a description of the energy and sustainability services it offers.
Quantitative U.S. Dollars ($) n/a
(1) Floor area and (2) number of buildings under management provided with energy and sustainability services
Quantitative Square feet (ft2),
Number ENERGY STAR Portfolio Manager
(1) Floor area and (2) number of buildings under management that obtained an energy rating
Quantitative Square feet (ft2),
Number ENERGY STAR Portfolio Manager
Real Estate Owners, Developers & Investment Trusts Topic and Climate Risk Metric Category
Unit of Measure Alignment / Source
Energy Management
Energy consumption data coverage as a percentage of floor area, by property subsector
Quantitative Percentage (%) by floor area (ft2)
Construction and Real Estate Sector Supplement: Energy (DMA) GRESB Q25.1 ENERGY STAR Portfolio Manager
Total energy consumed by portfolio area with data coverage, percentage grid electricity, and percentage renewable, each by property subsector
Quantitative Gigajoules (GJ), Percentage (%)
CDP Climate Change Information Request CC11.2, CC11.3, CC3.1d Climate Change Reporting Framework 4.31.f GRI G4 Aspect: Energy (EN3 and EN4) Construction and Real Estate Sector Supplement: Energy (EN3, EN4, DMA) GRESB Q25.1, 25.3 ENERGY STAR Portfolio Manager ULI Greenprint
Like-for-like change in energy consumption of portfolio area with data coverage, by property subsector
Quantitative Percentage (%) by gigajoules
(GJ)
CDP Climate Change Information Request CC11.2, CC11.3, CC3.1d Climate Change Reporting Framework 4.31.f GRI G4 Aspect: Energy (EN5 and EN6) Construction and Real Estate Sector Supplement: Energy (EN6) GRESB Q25.1 ENERGY STAR Portfolio Manager ULI Greenprint
Percentage of eligible portfolio that (1) has obtained an energy rating and (2) is certified to ENERGY STAR®, by property subsector
Quantitative Percentage (%) by floor area (ft2)
GRESB Q30.2, Q31; ENERGY STAR Portfolio Manager; ULI Greenprint
75 SASB.ORG
Physical Effects
Transition to a Low-Carbon, Resilient Economy
Climate Regulation
Real Estate Owners, Developers & Investment Trusts Topic and Climate Risk Metric Category
Unit of Measure Alignment / Source
Description of how building energy management considerations are integrated into property investment analysis and operational strategy
Discussion and Analysis n/a
GRI G4 Aspect: Energy (EN7) Construction and Real Estate Sector Supplement: Energy (EN7 and DMA) GRESB Q8,16,17,24.3
Water Management
Water withdrawal data coverage as a percentage of total floor area and percentage in regions with High or Extremely High Baseline Water Stress, each by property subsector
Quantitative Percentage (%)
by floor area (ft2)
Construction and Real Estate Sector Supplement: Water (DMA) GRESB 27.1; ENERGY STAR Portfolio Manager; ULI Greenprint
Total water withdrawn by portfolio area with data coverage and percentage in regions with High or Extremely High Baseline Water Stress, each by property subsector
Quantitative Cubic meters
(m3), Percentage (%)
CDP Water Information Request W1.2a, 1.2b, 1.2c CDSB Framework REQ-04 Sources of environmental impacts GRI G4 Aspect: Water (EN8, EN9, and EN10) Construction and Real Estate Sector Supplement: Water (DMA) GRESB 27.1; WBCSD Global Water Tool (GWT); CEO Water Mandate – Section 3 Company Water Profile; ENERGY STAR Portfolio Manager; ULI Greenprint Additional Source(s): WRI Aqueduct (provides definitions of water stress); Alliance for Water Stewardship Standard Version 1.0
Like-for-like change in water withdrawn for portfolio area with data coverage, by property subsector
Quantitative Percentage (%) by cubic meters
(m3)
GRESB 27.1; ENERGY STAR Portfolio Manager; ULI Greenprint
Discussion of water management risks and description of strategies and practices to mitigate those risks
Discussion and Analysis
n/a
CDP Water Information Request W3 Water risks, W8 Targets and Initiatives CDSB Framework REQ-02 Risks and Opportunities, REQ-01 Management’s environmental policies, strategy and targets Construction and Real Estate Sector Supplement: Water (DMA) CEO Water Mandate – Section 5 Detailed Disclosure Additional Source(s): Alliance for Water Stewardship Standard Version 1.0
Management of Tenant Sustainability Impacts
Percentage of new leases that contain a cost recovery clause for resource efficiency-related capital improvements and associated leased floor area, by property subsector
Quantitative
Percentage (%) by floor area (ft2), Square
feet (ft2)
Construction and Real Estate Sector Supplement: Energy (DMA) GRESB 39.1
Percentage of tenants that are separately metered or submetered for (1) grid electricity
Quantitative Percentage (%)
by floor area (ft2) Construction and Real Estate Sector Supplement: Energy (DMA)
76 SASB.ORG
Physical Effects
Transition to a Low-Carbon, Resilient Economy
Climate Regulation
Real Estate Owners, Developers & Investment Trusts Topic and Climate Risk Metric Category
Unit of Measure Alignment / Source
consumption and (2) water withdrawals, by property subsector
GRESB 39.1
Description of approach to measuring, incentivizing, and improving sustainability impacts of tenants
Discussion and Analysis
n/a Construction and Real Estate Sector Supplement: Energy (DMA)
Climate Change Adaptation
Area of properties located in FEMA Special Flood Hazard Areas or foreign equivalent, by property subsector
Quantitative Square feet
(ft2) FEMA National Flood Insurance Program
Description of climate change risk exposure analysis, degree of systematic portfolio exposure, and strategies for mitigating risks
Discussion and Analysis
n/a
CDSB Framework REQ-02 CDSB CCRF 4.3-4.10 Construction and Real Estate Sector Supplement: Economic Performance (DMA) GRESB Q8. Q15.1, Q15.2, NC1
Table 3e: Infrastructure
(cont.)
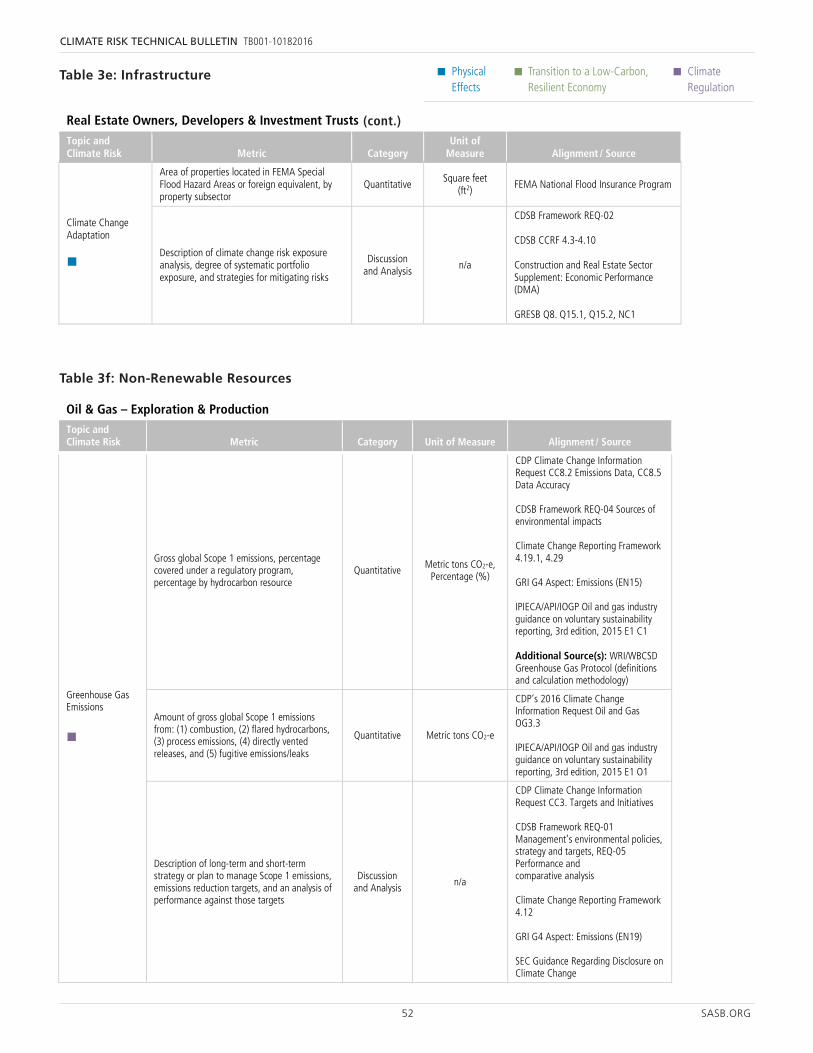
52 SASB.ORG
CLIMATE RISK TECHNICAL BULLETIN TB001-10182016
• Physical Effects
• Transition to a Low-Carbon, Resilient Economy
• Climate Regulation
76 SASB.ORG
Physical Effects
Transition to a Low-Carbon, Resilient Economy
Climate Regulation
Real Estate Owners, Developers & Investment Trusts Topic and Climate Risk Metric Category
Unit of Measure Alignment / Source
consumption and (2) water withdrawals, by property subsector
GRESB 39.1
Description of approach to measuring, incentivizing, and improving sustainability impacts of tenants
Discussion and Analysis
n/a Construction and Real Estate Sector Supplement: Energy (DMA)
Climate Change Adaptation
Area of properties located in FEMA Special Flood Hazard Areas or foreign equivalent, by property subsector
Quantitative Square feet
(ft2) FEMA National Flood Insurance Program
Description of climate change risk exposure analysis, degree of systematic portfolio exposure, and strategies for mitigating risks
Discussion and Analysis
n/a
CDSB Framework REQ-02 CDSB CCRF 4.3-4.10 Construction and Real Estate Sector Supplement: Economic Performance (DMA) GRESB Q8. Q15.1, Q15.2, NC1
29 SASB.ORG
Physical Effects
Transition to a Low-Carbon, Resilient Economy
Climate Regulation
Oil & Gas – Exploration & Production Topic and Climate Risk Metric Category Unit of Measure Alignment / Source
Greenhouse Gas Emissions
Gross global Scope 1 emissions, percentage covered under a regulatory program, percentage by hydrocarbon resource
Quantitative Metric tons CO2-e, Percentage (%)
CDP Climate Change Information Request CC8.2 Emissions Data, CC8.5 Data Accuracy CDSB Framework REQ-04 Sources of environmental impacts Climate Change Reporting Framework 4.19.1, 4.29 GRI G4 Aspect: Emissions (EN15) IPIECA/API/IOGP Oil and gas industry guidance on voluntary sustainability reporting, 3rd edition, 2015 E1 C1 Additional Source(s): WRI/WBCSD Greenhouse Gas Protocol (definitions and calculation methodology)
Amount of gross global Scope 1 emissions from: (1) combustion, (2) flared hydrocarbons, (3) process emissions, (4) directly vented releases, and (5) fugitive emissions/leaks
Quantitative Metric tons CO2-e
CDP’s 2016 Climate Change Information Request Oil and Gas OG3.3 IPIECA/API/IOGP Oil and gas industry guidance on voluntary sustainability reporting, 3rd edition, 2015 E1 O1
Description of long-term and short-term strategy or plan to manage Scope 1 emissions, emissions reduction targets, and an analysis of performance against those targets
Discussion and Analysis
n/a
CDP Climate Change Information Request CC3. Targets and Initiatives CDSB Framework REQ-01 Management’s environmental policies, strategy and targets, REQ-05 Performance and comparative analysis Climate Change Reporting Framework 4.12 GRI G4 Aspect: Emissions (EN19) SEC Guidance Regarding Disclosure on Climate Change
Water Management
Total fresh water withdrawn, percentage recycled, percentage in regions with High or Extremely High Baseline Water Stress
Quantitative Cubic meters (m3),
Percentage (%)
CDP Water Information Request W1.2a, 1.2b, 1.2c CDSB Framework REQ-04 Sources of environmental impacts GRI G4 Aspect: Water (EN8, EN9, and EN10) WBCSD Global Water Tool (GWT) CEO Water Mandate – Section 3 Company Water Profile Additional Source(s): WRI Aqueduct (provides definitions of water stress); Alliance for Water Stewardship Standard Version 1.0
Reserves Valuation & Capital
Sensitivity of hydrocarbon reserve levels to future price projection scenarios that account
Quantitative Million barrels
(MMbbls), Million CDP Climate Change Information Request Oil and Gas OG1.6
76 SASB.ORG
Physical Effects
Transition to a Low-Carbon, Resilient Economy
Climate Regulation
Real Estate Owners, Developers & Investment Trusts Topic and Climate Risk Metric Category
Unit of Measure Alignment / Source
consumption and (2) water withdrawals, by property subsector
GRESB 39.1
Description of approach to measuring, incentivizing, and improving sustainability impacts of tenants
Discussion and Analysis
n/a Construction and Real Estate Sector Supplement: Energy (DMA)
Climate Change Adaptation
Area of properties located in FEMA Special Flood Hazard Areas or foreign equivalent, by property subsector
Quantitative Square feet
(ft2) FEMA National Flood Insurance Program
Description of climate change risk exposure analysis, degree of systematic portfolio exposure, and strategies for mitigating risks
Discussion and Analysis
n/a
CDSB Framework REQ-02 CDSB CCRF 4.3-4.10 Construction and Real Estate Sector Supplement: Economic Performance (DMA) GRESB Q8. Q15.1, Q15.2, NC1
Table 3e: Infrastructure
Table 3f: Non-Renewable Resources
(cont.)
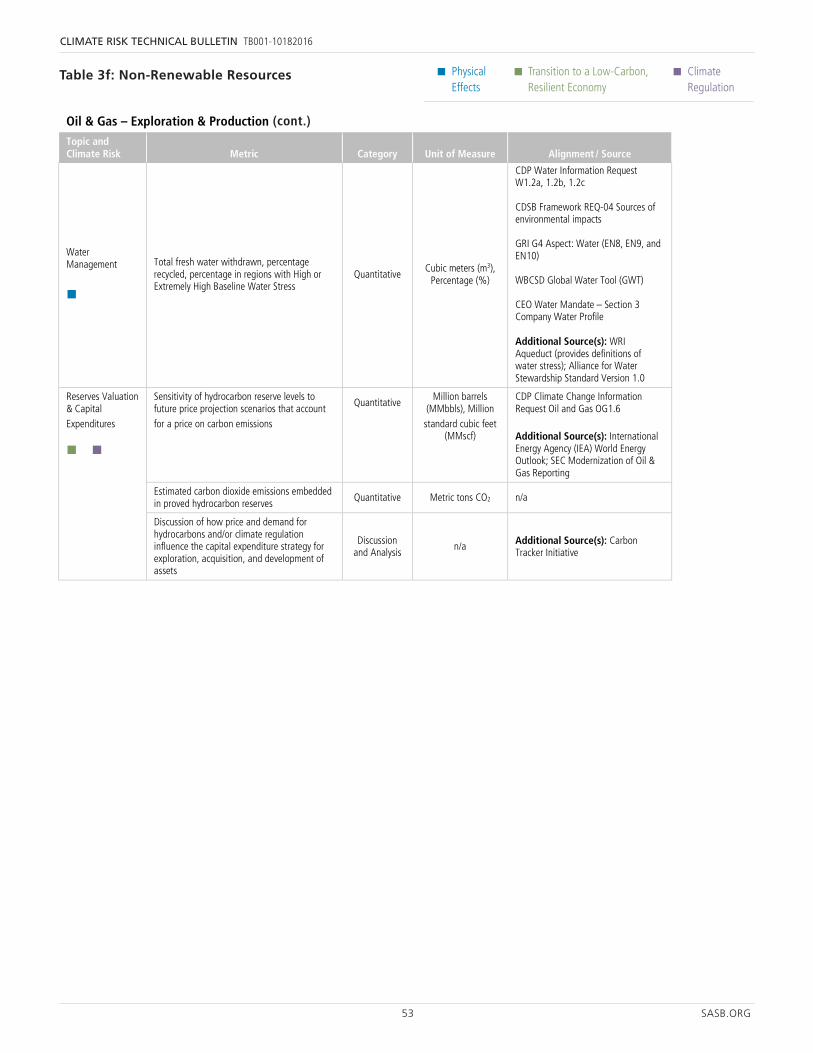
53 SASB.ORG
CLIMATE RISK TECHNICAL BULLETIN TB001-10182016
• Physical Effects
• Transition to a Low-Carbon, Resilient Economy
• Climate Regulation
Table 3f: Non-Renewable Resources
29 SASB.ORG
Physical Effects
Transition to a Low-Carbon, Resilient Economy
Climate Regulation
Oil & Gas – Exploration & Production Topic and Climate Risk Metric Category Unit of Measure Alignment / Source
Greenhouse Gas Emissions
Gross global Scope 1 emissions, percentage covered under a regulatory program, percentage by hydrocarbon resource
Quantitative Metric tons CO2-e, Percentage (%)
CDP Climate Change Information Request CC8.2 Emissions Data, CC8.5 Data Accuracy CDSB Framework REQ-04 Sources of environmental impacts Climate Change Reporting Framework 4.19.1, 4.29 GRI G4 Aspect: Emissions (EN15) IPIECA/API/IOGP Oil and gas industry guidance on voluntary sustainability reporting, 3rd edition, 2015 E1 C1 Additional Source(s): WRI/WBCSD Greenhouse Gas Protocol (definitions and calculation methodology)
Amount of gross global Scope 1 emissions from: (1) combustion, (2) flared hydrocarbons, (3) process emissions, (4) directly vented releases, and (5) fugitive emissions/leaks
Quantitative Metric tons CO2-e
CDP’s 2016 Climate Change Information Request Oil and Gas OG3.3 IPIECA/API/IOGP Oil and gas industry guidance on voluntary sustainability reporting, 3rd edition, 2015 E1 O1
Description of long-term and short-term strategy or plan to manage Scope 1 emissions, emissions reduction targets, and an analysis of performance against those targets
Discussion and Analysis
n/a
CDP Climate Change Information Request CC3. Targets and Initiatives CDSB Framework REQ-01 Management’s environmental policies, strategy and targets, REQ-05 Performance and comparative analysis Climate Change Reporting Framework 4.12 GRI G4 Aspect: Emissions (EN19) SEC Guidance Regarding Disclosure on Climate Change
Water Management
Total fresh water withdrawn, percentage recycled, percentage in regions with High or Extremely High Baseline Water Stress
Quantitative Cubic meters (m3),
Percentage (%)
CDP Water Information Request W1.2a, 1.2b, 1.2c CDSB Framework REQ-04 Sources of environmental impacts GRI G4 Aspect: Water (EN8, EN9, and EN10) WBCSD Global Water Tool (GWT) CEO Water Mandate – Section 3 Company Water Profile Additional Source(s): WRI Aqueduct (provides definitions of water stress); Alliance for Water Stewardship Standard Version 1.0
Reserves Valuation & Capital
Sensitivity of hydrocarbon reserve levels to future price projection scenarios that account
Quantitative Million barrels
(MMbbls), Million CDP Climate Change Information Request Oil and Gas OG1.6
30 SASB.ORG
Physical Effects
Transition to a Low-Carbon, Resilient Economy
Climate Regulation
Oil & Gas – Exploration & Production Topic and Climate Risk Metric Category Unit of Measure Alignment / Source
Expenditures
for a price on carbon emissions standard cubic feet (MMscf)
Additional Source(s): International Energy Agency (IEA) World Energy Outlook; SEC Modernization of Oil & Gas Reporting
Estimated carbon dioxide emissions embedded in proved hydrocarbon reserves
Quantitative Metric tons CO2 n/a
Discussion of how price and demand for hydrocarbons and/or climate regulation influence the capital expenditure strategy for exploration, acquisition, and development of assets
Discussion and Analysis
n/a Additional Source(s): Carbon Tracker Initiative
Oil & Gas – Midstream
Topic and Climate Risk Metric Category
Unit of Measure Alignment / Source
Greenhouse Gas Emissions
Gross global Scope 1 emissions, percentage covered under a regulatory program
Quantitative Metric tons
CO2-e, Percentage (%)
CDP Climate Change Information Request CC8.2 Emissions Data, CC8.5 Data Accuracy CDSB Framework REQ-04 Sources of environmental impacts Climate Change Reporting Framework 4.19.1, 4.29 GRI G4 Aspect: Emissions (EN15) IPIECA/API/IOGP Oil and gas industry guidance on voluntary sustainability reporting, 3rd edition, 2015 E1 C1 Additional Source(s): WRI/WBCSD Greenhouse Gas Protocol (definitions and calculation methodology)
Description of long-term and short-term strategy or plan to manage Scope 1 emissions, emissions reduction targets, and an analysis of performance against those targets
Discussion and Analysis
n/a
CDP Climate Change Information Request CC3. Targets and Initiatives CDSB Framework REQ-01 Management’s environmental policies, strategy and targets, REQ-05 Performance and comparative analysis Climate Change Reporting Framework 4.12 GRI G4 Aspect: Emissions (EN19) SEC Guidance Regarding Disclosure on Climate Change
(cont.)
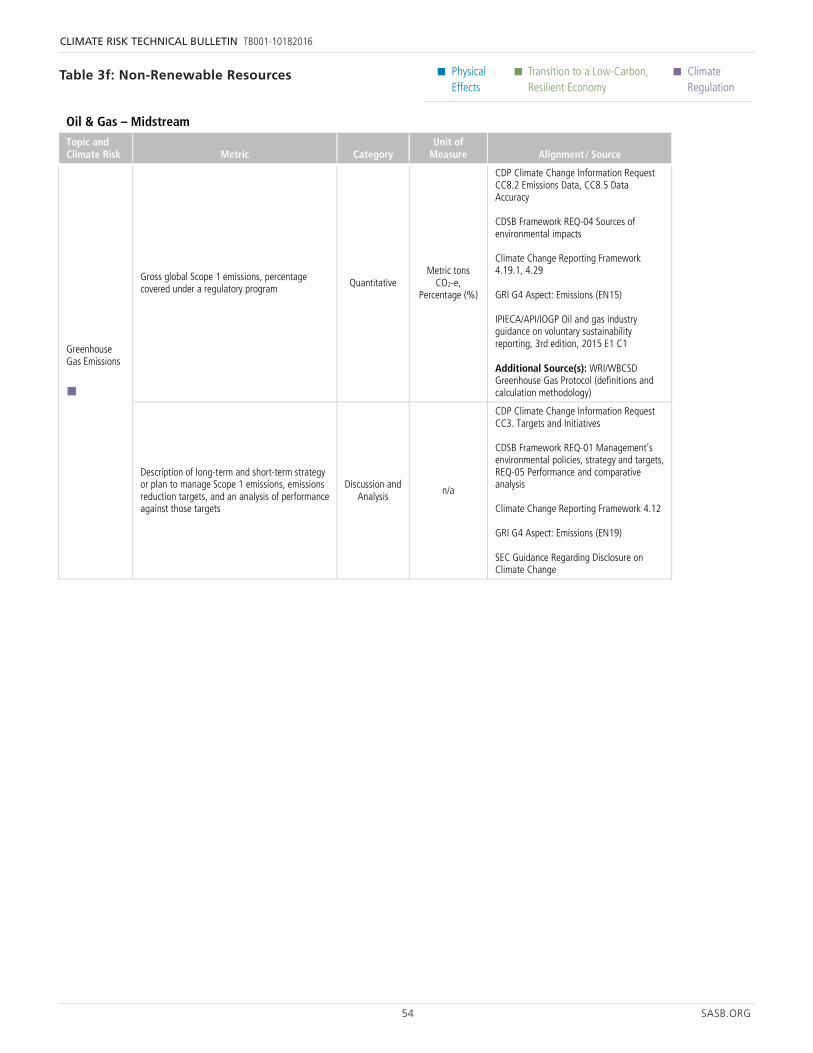
54 SASB.ORG
CLIMATE RISK TECHNICAL BULLETIN TB001-10182016
• Physical Effects
• Transition to a Low-Carbon, Resilient Economy
• Climate Regulation
30 SASB.ORG
Physical Effects
Transition to a Low-Carbon, Resilient Economy
Climate Regulation
Oil & Gas – Exploration & Production Topic and Climate Risk Metric Category Unit of Measure Alignment / Source
Expenditures
for a price on carbon emissions standard cubic feet (MMscf)
Additional Source(s): International Energy Agency (IEA) World Energy Outlook; SEC Modernization of Oil & Gas Reporting
Estimated carbon dioxide emissions embedded in proved hydrocarbon reserves
Quantitative Metric tons CO2 n/a
Discussion of how price and demand for hydrocarbons and/or climate regulation influence the capital expenditure strategy for exploration, acquisition, and development of assets
Discussion and Analysis
n/a Additional Source(s): Carbon Tracker Initiative
Oil & Gas – Midstream
Topic and Climate Risk Metric Category
Unit of Measure Alignment / Source
Greenhouse Gas Emissions
Gross global Scope 1 emissions, percentage covered under a regulatory program
Quantitative Metric tons
CO2-e, Percentage (%)
CDP Climate Change Information Request CC8.2 Emissions Data, CC8.5 Data Accuracy CDSB Framework REQ-04 Sources of environmental impacts Climate Change Reporting Framework 4.19.1, 4.29 GRI G4 Aspect: Emissions (EN15) IPIECA/API/IOGP Oil and gas industry guidance on voluntary sustainability reporting, 3rd edition, 2015 E1 C1 Additional Source(s): WRI/WBCSD Greenhouse Gas Protocol (definitions and calculation methodology)
Description of long-term and short-term strategy or plan to manage Scope 1 emissions, emissions reduction targets, and an analysis of performance against those targets
Discussion and Analysis
n/a
CDP Climate Change Information Request CC3. Targets and Initiatives CDSB Framework REQ-01 Management’s environmental policies, strategy and targets, REQ-05 Performance and comparative analysis Climate Change Reporting Framework 4.12 GRI G4 Aspect: Emissions (EN19) SEC Guidance Regarding Disclosure on Climate Change
Table 3f: Non-Renewable Resources
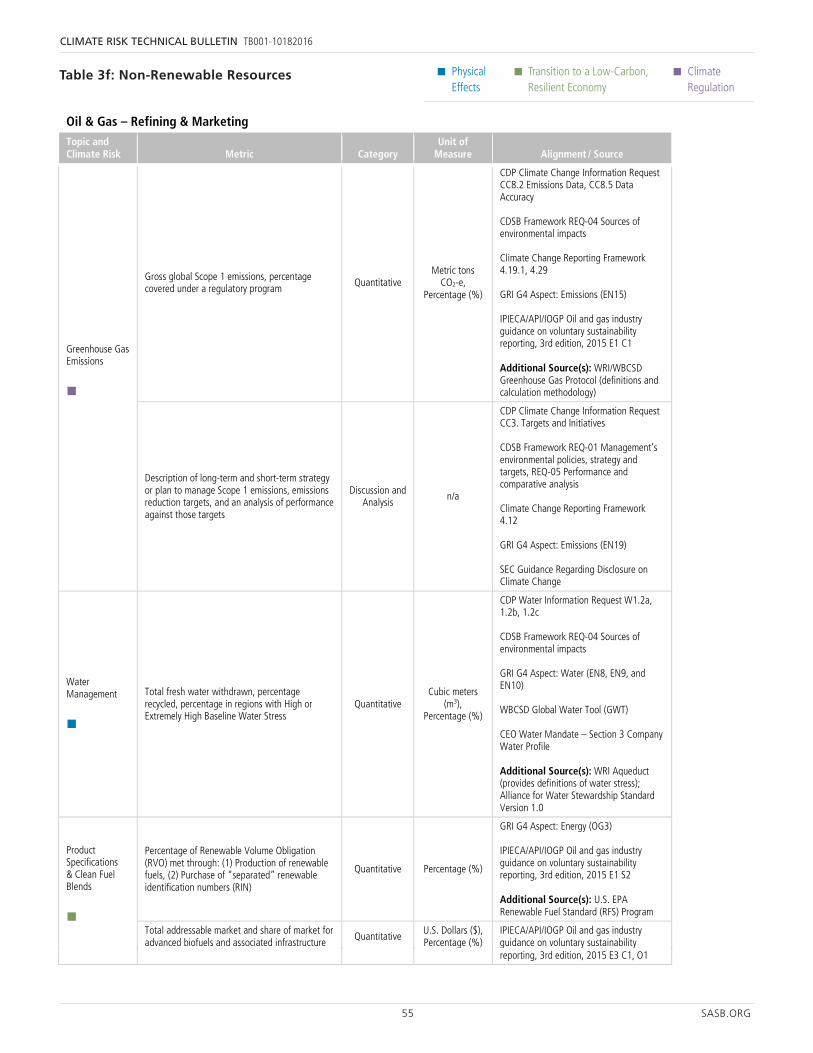
55 SASB.ORG
CLIMATE RISK TECHNICAL BULLETIN TB001-10182016
• Physical Effects
• Transition to a Low-Carbon, Resilient Economy
• Climate Regulation
31 SASB.ORG
Physical Effects
Transition to a Low-Carbon, Resilient Economy
Climate Regulation
Oil & Gas – Refining & Marketing Topic and Climate Risk Metric Category
Unit of Measure Alignment / Source
Greenhouse Gas Emissions
Gross global Scope 1 emissions, percentage covered under a regulatory program
Quantitative Metric tons
CO2-e, Percentage (%)
CDP Climate Change Information Request CC8.2 Emissions Data, CC8.5 Data Accuracy CDSB Framework REQ-04 Sources of environmental impacts Climate Change Reporting Framework 4.19.1, 4.29 GRI G4 Aspect: Emissions (EN15) IPIECA/API/IOGP Oil and gas industry guidance on voluntary sustainability reporting, 3rd edition, 2015 E1 C1 Additional Source(s): WRI/WBCSD Greenhouse Gas Protocol (definitions and calculation methodology)
Description of long-term and short-term strategy or plan to manage Scope 1 emissions, emissions reduction targets, and an analysis of performance against those targets
Discussion and Analysis
n/a
CDP Climate Change Information Request CC3. Targets and Initiatives CDSB Framework REQ-01 Management’s environmental policies, strategy and targets, REQ-05 Performance and comparative analysis Climate Change Reporting Framework 4.12 GRI G4 Aspect: Emissions (EN19) SEC Guidance Regarding Disclosure on Climate Change
Water Management
Total fresh water withdrawn, percentage recycled, percentage in regions with High or Extremely High Baseline Water Stress
Quantitative Cubic meters
(m3), Percentage (%)
CDP Water Information Request W1.2a, 1.2b, 1.2c CDSB Framework REQ-04 Sources of environmental impacts GRI G4 Aspect: Water (EN8, EN9, and EN10) WBCSD Global Water Tool (GWT) CEO Water Mandate – Section 3 Company Water Profile Additional Source(s): WRI Aqueduct (provides definitions of water stress); Alliance for Water Stewardship Standard Version 1.0
Product Specifications & Clean Fuel Blends
Percentage of Renewable Volume Obligation (RVO) met through: (1) Production of renewable fuels, (2) Purchase of “separated” renewable identification numbers (RIN)
Quantitative Percentage (%)
GRI G4 Aspect: Energy (OG3) IPIECA/API/IOGP Oil and gas industry guidance on voluntary sustainability reporting, 3rd edition, 2015 E1 S2 Additional Source(s): U.S. EPA Renewable Fuel Standard (RFS) Program
Total addressable market and share of market for advanced biofuels and associated infrastructure
Quantitative U.S. Dollars ($), Percentage (%)
IPIECA/API/IOGP Oil and gas industry guidance on voluntary sustainability
32 SASB.ORG
Physical Effects
Transition to a Low-Carbon, Resilient Economy
Climate Regulation
Oil & Gas – Refining & Marketing Topic and Climate Risk Metric Category
Unit of Measure Alignment / Source
reporting, 3rd edition, 2015 E3 C1, O1
Coal Operations Topic and Climate Risk Metric Category
Unit of Measure Alignment / Source
Greenhouse Gas Emissions
Gross global Scope 1 emissions, percentage covered under a regulatory program
Quantitative Metric tons
CO2-e, Percentage (%)
CDP Climate Change Information Request CC8.2 Emissions Data, CC8.5 Data Accuracy CDSB Framework REQ-04 Sources of environmental impacts Climate Change Reporting Framework 4.19.1, 4.29 GRI G4 Aspect: Emissions (EN15) Additional Source(s): WRI/WBCSD Greenhouse Gas Protocol (definitions and calculation methodology)
Description of long-term and short-term strategy or plan to manage Scope 1 emissions, emissions reduction targets, and an analysis of performance against those targets
Discussion and Analysis
n/a
CDP Climate Change Information Request CC3. Targets and Initiatives CDSB Framework REQ-01 Management’s environmental policies, strategy and targets, REQ-05 Performance and comparative analysis Climate Change Reporting Framework 4.12 GRI G4 Aspect: Emissions (EN19) SEC Guidance Regarding Disclosure on Climate Change
Water Management
Total fresh water withdrawn, percentage recycled, percentage in regions with High or Extremely High Baseline Water Stress
Quantitative Cubic meters
(m3), Percentage (%)
CDP Water Information Request W1.2a, 1.2b, 1.2c CDSB Framework REQ-04 Sources of environmental impacts GRI G4 Aspect: Water (EN8, EN9, and EN10) WBCSD Global Water Tool (GWT) CEO Water Mandate – Section 3 Company Water Profile Additional Source(s): WRI Aqueduct (provides definitions of water stress); Alliance for Water Stewardship Standard Version 1.0
Reserves Valuation & Capital Expenditures
Sensitivity of coal reserve levels to future price projection scenarios that account for a price on carbon emissions
Quantitative Million metric
tons (t)
Additional Source(s): International Energy Agency (IEA) World Energy Outlook; SEC Modernization of Oil &
Table 3f: Non-Renewable Resources
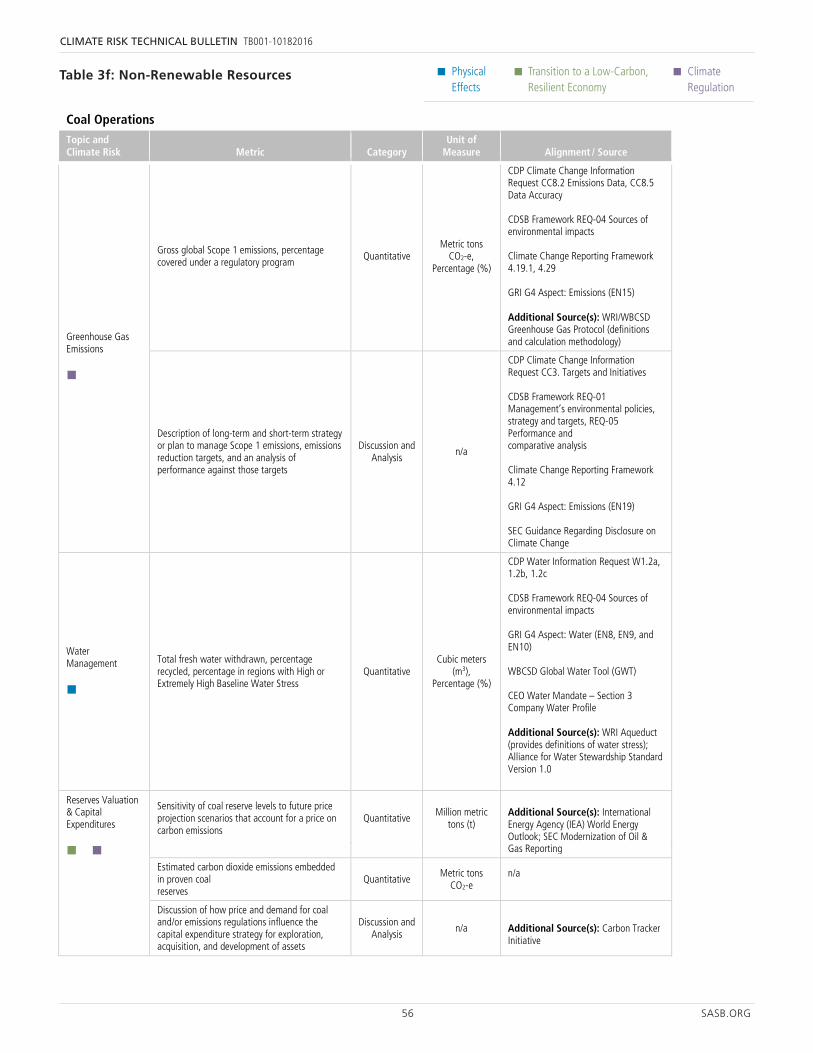
56 SASB.ORG
CLIMATE RISK TECHNICAL BULLETIN TB001-10182016
• Physical Effects
• Transition to a Low-Carbon, Resilient Economy
• Climate Regulation
32 SASB.ORG
Physical Effects
Transition to a Low-Carbon, Resilient Economy
Climate Regulation
Oil & Gas – Refining & Marketing Topic and Climate Risk Metric Category
Unit of Measure Alignment / Source
reporting, 3rd edition, 2015 E3 C1, O1
Coal Operations Topic and Climate Risk Metric Category
Unit of Measure Alignment / Source
Greenhouse Gas Emissions
Gross global Scope 1 emissions, percentage covered under a regulatory program
Quantitative Metric tons
CO2-e, Percentage (%)
CDP Climate Change Information Request CC8.2 Emissions Data, CC8.5 Data Accuracy CDSB Framework REQ-04 Sources of environmental impacts Climate Change Reporting Framework 4.19.1, 4.29 GRI G4 Aspect: Emissions (EN15) Additional Source(s): WRI/WBCSD Greenhouse Gas Protocol (definitions and calculation methodology)
Description of long-term and short-term strategy or plan to manage Scope 1 emissions, emissions reduction targets, and an analysis of performance against those targets
Discussion and Analysis
n/a
CDP Climate Change Information Request CC3. Targets and Initiatives CDSB Framework REQ-01 Management’s environmental policies, strategy and targets, REQ-05 Performance and comparative analysis Climate Change Reporting Framework 4.12 GRI G4 Aspect: Emissions (EN19) SEC Guidance Regarding Disclosure on Climate Change
Water Management
Total fresh water withdrawn, percentage recycled, percentage in regions with High or Extremely High Baseline Water Stress
Quantitative Cubic meters
(m3), Percentage (%)
CDP Water Information Request W1.2a, 1.2b, 1.2c CDSB Framework REQ-04 Sources of environmental impacts GRI G4 Aspect: Water (EN8, EN9, and EN10) WBCSD Global Water Tool (GWT) CEO Water Mandate – Section 3 Company Water Profile Additional Source(s): WRI Aqueduct (provides definitions of water stress); Alliance for Water Stewardship Standard Version 1.0
Reserves Valuation & Capital Expenditures
Sensitivity of coal reserve levels to future price projection scenarios that account for a price on carbon emissions
Quantitative Million metric
tons (t)
Additional Source(s): International Energy Agency (IEA) World Energy Outlook; SEC Modernization of Oil &
33 SASB.ORG
Physical Effects
Transition to a Low-Carbon, Resilient Economy
Climate Regulation
Coal Operations Topic and Climate Risk Metric Category
Unit of Measure Alignment / Source
Gas Reporting
Estimated carbon dioxide emissions embedded in proven coal reserves
Quantitative Metric tons
CO2-e n/a
Discussion of how price and demand for coal and/or emissions regulations influence the capital expenditure strategy for exploration, acquisition, and development of assets
Discussion and Analysis
n/a Additional Source(s): Carbon Tracker Initiative
Oil & Gas – Services
Topic and Climate Risk Metric Category Unit of Measure Alignment / Source
Emissions Reduction Services & Fuels Management
Total fuel consumed, percentage renewable, percentage used in: (1) on-road equipment and vehicles and (2) off-road equipment
Quantitative Gigajoules (GJ), Percentage (%)
CDP Climate Change Information Request CC11.3 GRI G4 Aspect: Energy (EN3)
Description of strategy or plans to address air emissions-related risks, opportunities, and impacts
Discussion and Analysis
n/a
CDP Climate Change Information RequestCC2. Strategy. CC5. Risks and Opportunities CDSB Framework REQ-01 Management’s environmental policies, strategy and targets, REQ-02 Risks and opportunities Climate Change Reporting Framework 4.9, 4.10, 4.12 GRI G4 Aspect: Products and Services (EN27)
Water Management Services
Average volume of water used per volume of gas or oil extracted by (1) fresh water and (2) recycled water
Quantitative
Cubic meters (m3) per million cubic feet (MMscf) or million barrels
(MMbbl)
IPIECA/API/IOGP Oil and gas industry guidance on voluntary sustainability reporting, 3rd edition, 2015 E6 C1, S2
Description of strategy or plans to address water consumption and disposal-related risks, opportunities, and impacts
Discussion and Analysis
n/a
CDP Water Information Request W3 Water risks, W4 Opportunities W8 Targets and Initiatives CDSB Framework REQ-01 Management’s environmental policies, strategy and targets, REQ-02 Risks and opportunities Climate Change Reporting Framework 4.9, 4.10, 4.12 GRI G4 Aspect: Products and Services (EN27) IPIECA/API/IOGP Oil and gas industry guidance on voluntary sustainability reporting, 3rd edition, 2015 E6 O6, O7
Table 3f: Non-Renewable Resources
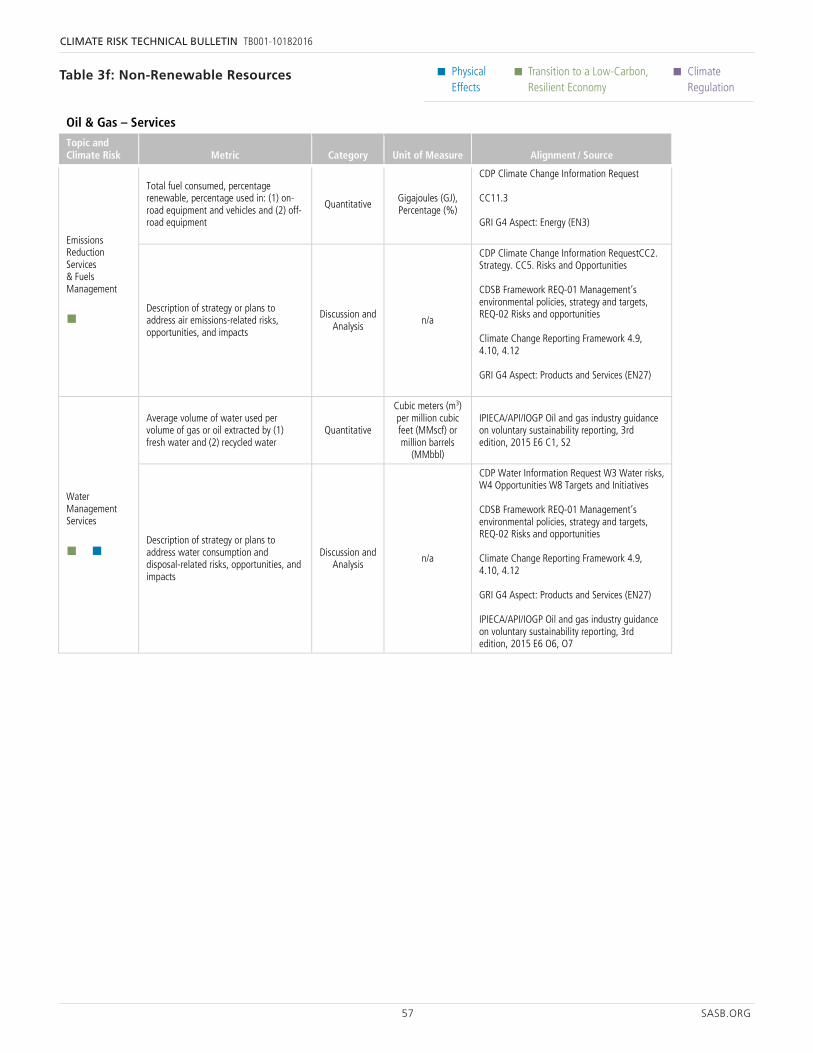
57 SASB.ORG
CLIMATE RISK TECHNICAL BULLETIN TB001-10182016
• Physical Effects
• Transition to a Low-Carbon, Resilient Economy
• Climate Regulation
Table 3f: Non-Renewable Resources
33 SASB.ORG
Physical Effects
Transition to a Low-Carbon, Resilient Economy
Climate Regulation
Coal Operations Topic and Climate Risk Metric Category
Unit of Measure Alignment / Source
Gas Reporting
Estimated carbon dioxide emissions embedded in proven coal reserves
Quantitative Metric tons
CO2-e n/a
Discussion of how price and demand for coal and/or emissions regulations influence the capital expenditure strategy for exploration, acquisition, and development of assets
Discussion and Analysis
n/a Additional Source(s): Carbon Tracker Initiative
Oil & Gas – Services
Topic and Climate Risk Metric Category Unit of Measure Alignment / Source
Emissions Reduction Services & Fuels Management
Total fuel consumed, percentage renewable, percentage used in: (1) on-road equipment and vehicles and (2) off-road equipment
Quantitative Gigajoules (GJ), Percentage (%)
CDP Climate Change Information Request CC11.3 GRI G4 Aspect: Energy (EN3)
Description of strategy or plans to address air emissions-related risks, opportunities, and impacts
Discussion and Analysis
n/a
CDP Climate Change Information RequestCC2. Strategy. CC5. Risks and Opportunities CDSB Framework REQ-01 Management’s environmental policies, strategy and targets, REQ-02 Risks and opportunities Climate Change Reporting Framework 4.9, 4.10, 4.12 GRI G4 Aspect: Products and Services (EN27)
Water Management Services
Average volume of water used per volume of gas or oil extracted by (1) fresh water and (2) recycled water
Quantitative
Cubic meters (m3) per million cubic feet (MMscf) or million barrels
(MMbbl)
IPIECA/API/IOGP Oil and gas industry guidance on voluntary sustainability reporting, 3rd edition, 2015 E6 C1, S2
Description of strategy or plans to address water consumption and disposal-related risks, opportunities, and impacts
Discussion and Analysis
n/a
CDP Water Information Request W3 Water risks, W4 Opportunities W8 Targets and Initiatives CDSB Framework REQ-01 Management’s environmental policies, strategy and targets, REQ-02 Risks and opportunities Climate Change Reporting Framework 4.9, 4.10, 4.12 GRI G4 Aspect: Products and Services (EN27) IPIECA/API/IOGP Oil and gas industry guidance on voluntary sustainability reporting, 3rd edition, 2015 E6 O6, O7
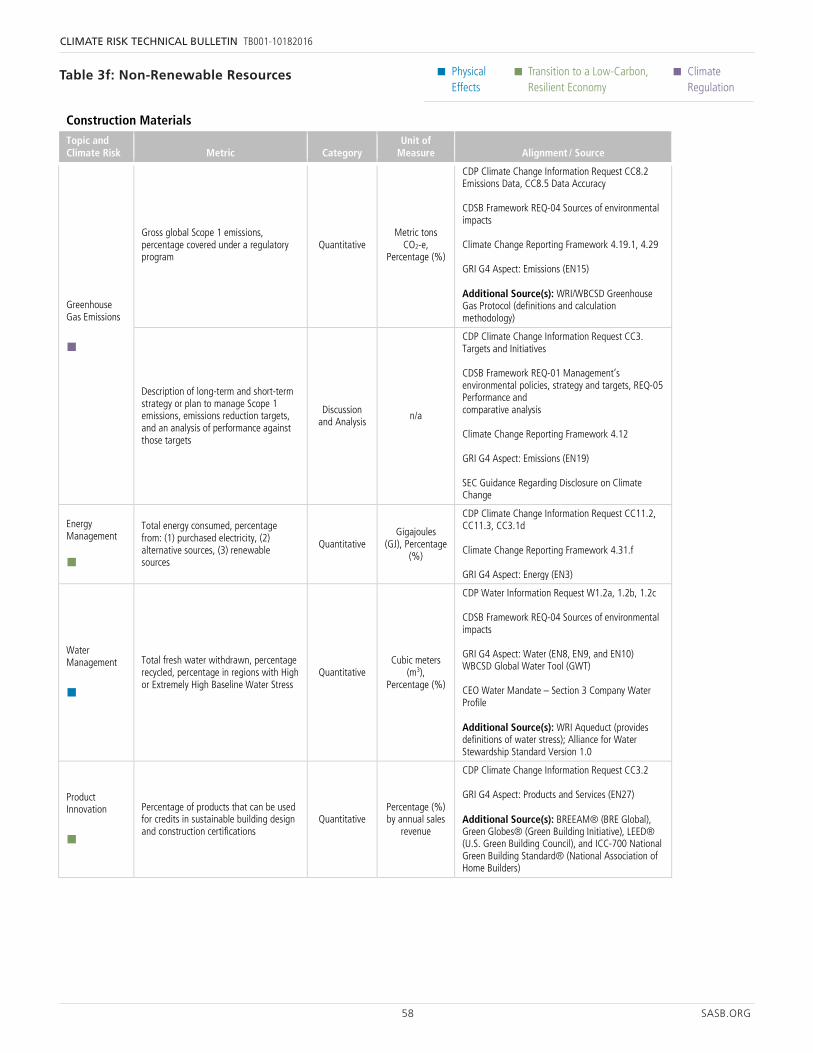
58 SASB.ORG
CLIMATE RISK TECHNICAL BULLETIN TB001-10182016
• Physical Effects
• Transition to a Low-Carbon, Resilient Economy
• Climate Regulation
Table 3f: Non-Renewable Resources
34 SASB.ORG
Physical Effects
Transition to a Low-Carbon, Resilient Economy
Climate Regulation
Construction Materials Topic and Climate Risk Metric Category
Unit of Measure Alignment / Source
Greenhouse Gas Emissions
Gross global Scope 1 emissions, percentage covered under a regulatory program
Quantitative Metric tons
CO2-e, Percentage (%)
CDP Climate Change Information Request CC8.2 Emissions Data, CC8.5 Data Accuracy CDSB Framework REQ-04 Sources of environmental impacts Climate Change Reporting Framework 4.19.1, 4.29 GRI G4 Aspect: Emissions (EN15) Additional Source(s): WRI/WBCSD Greenhouse Gas Protocol (definitions and calculation methodology)
Description of long-term and short-term strategy or plan to manage Scope 1 emissions, emissions reduction targets, and an analysis of performance against those targets
Discussion and Analysis
n/a
CDP Climate Change Information Request CC3. Targets and Initiatives CDSB Framework REQ-01 Management’s environmental policies, strategy and targets, REQ-05 Performance and comparative analysis Climate Change Reporting Framework 4.12 GRI G4 Aspect: Emissions (EN19) SEC Guidance Regarding Disclosure on Climate Change
Energy Management
Total energy consumed, percentage from: (1) purchased electricity, (2) alternative sources, (3) renewable sources
Quantitative Gigajoules
(GJ), Percentage (%)
CDP Climate Change Information Request CC11.2, CC11.3, CC3.1d Climate Change Reporting Framework 4.31.f GRI G4 Aspect: Energy (EN3)
Water Management
Total fresh water withdrawn, percentage recycled, percentage in regions with High or Extremely High Baseline Water Stress
Quantitative Cubic meters
(m3), Percentage (%)
CDP Water Information Request W1.2a, 1.2b, 1.2c CDSB Framework REQ-04 Sources of environmental impacts GRI G4 Aspect: Water (EN8, EN9, and EN10) WBCSD Global Water Tool (GWT) CEO Water Mandate – Section 3 Company Water Profile Additional Source(s): WRI Aqueduct (provides definitions of water stress); Alliance for Water Stewardship Standard Version 1.0
Product Innovation
Percentage of products that can be used for credits in sustainable building design and construction certifications
Quantitative Percentage (%) by annual sales
revenue
CDP Climate Change Information Request CC3.2 GRI G4 Aspect: Products and Services (EN27) Additional Source(s): BREEAM® (BRE Global), Green Globes® (Green Building Initiative), LEED® (U.S. Green Building Council), and ICC-700 National Green Building Standard® (National Association of Home Builders)
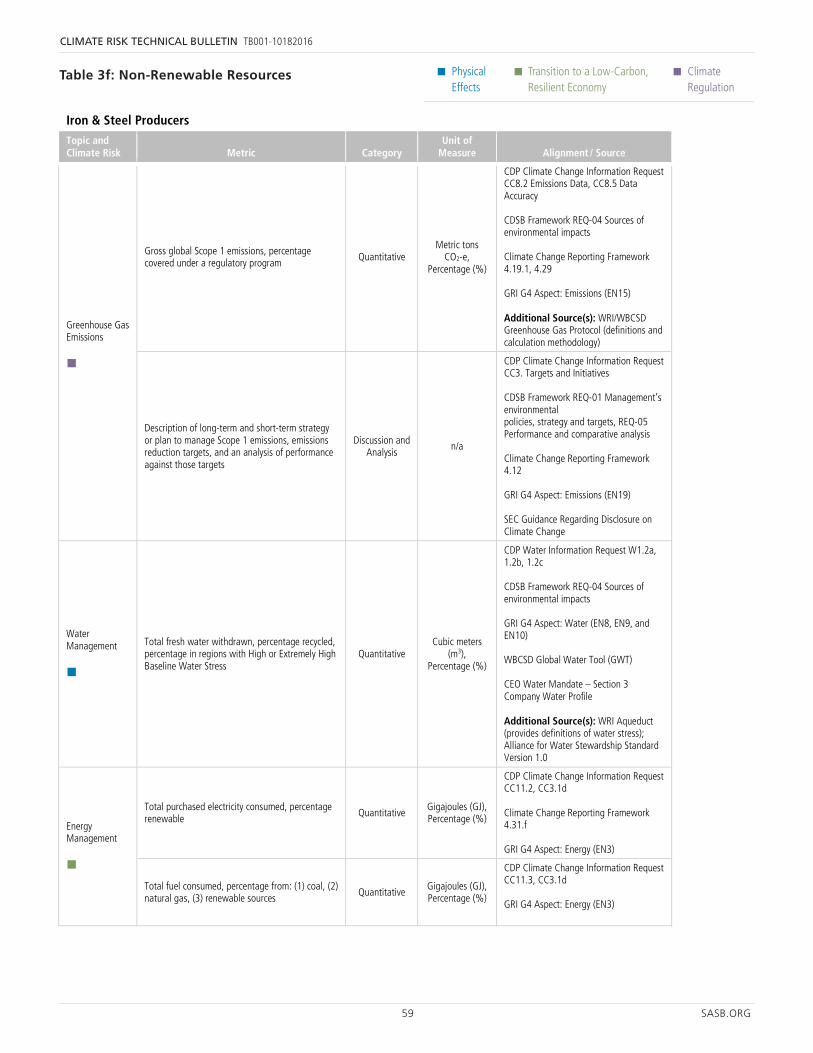
59 SASB.ORG
CLIMATE RISK TECHNICAL BULLETIN TB001-10182016
• Physical Effects
• Transition to a Low-Carbon, Resilient Economy
• Climate Regulation
Table 3f: Non-Renewable Resources
35 SASB.ORG
Physical Effects
Transition to a Low-Carbon, Resilient Economy
Climate Regulation
Iron & Steel Producers Topic and Climate Risk Metric Category
Unit of Measure Alignment / Source
Greenhouse Gas Emissions
Gross global Scope 1 emissions, percentage covered under a regulatory program
Quantitative Metric tons
CO2-e, Percentage (%)
CDP Climate Change Information Request CC8.2 Emissions Data, CC8.5 Data Accuracy CDSB Framework REQ-04 Sources of environmental impacts Climate Change Reporting Framework 4.19.1, 4.29 GRI G4 Aspect: Emissions (EN15) Additional Source(s): WRI/WBCSD Greenhouse Gas Protocol (definitions and calculation methodology)
Description of long-term and short-term strategy or plan to manage Scope 1 emissions, emissions reduction targets, and an analysis of performance against those targets
Discussion and Analysis
n/a
CDP Climate Change Information Request CC3. Targets and Initiatives CDSB Framework REQ-01 Management’s environmental policies, strategy and targets, REQ-05 Performance and comparative analysis Climate Change Reporting Framework 4.12 GRI G4 Aspect: Emissions (EN19) SEC Guidance Regarding Disclosure on Climate Change
Water Management
Total fresh water withdrawn, percentage recycled, percentage in regions with High or Extremely High Baseline Water Stress
Quantitative Cubic meters
(m3), Percentage (%)
CDP Water Information Request W1.2a, 1.2b, 1.2c CDSB Framework REQ-04 Sources of environmental impacts GRI G4 Aspect: Water (EN8, EN9, and EN10) WBCSD Global Water Tool (GWT) CEO Water Mandate – Section 3 Company Water Profile Additional Source(s): WRI Aqueduct (provides definitions of water stress); Alliance for Water Stewardship Standard Version 1.0
Energy Management
Total purchased electricity consumed, percentage renewable Quantitative
Gigajoules (GJ), Percentage (%)
CDP Climate Change Information Request CC11.2, CC3.1d Climate Change Reporting Framework 4.31.f GRI G4 Aspect: Energy (EN3)
Total fuel consumed, percentage from: (1) coal, (2) natural gas, (3) renewable sources Quantitative
Gigajoules (GJ), Percentage (%)
CDP Climate Change Information Request CC11.3, CC3.1d GRI G4 Aspect: Energy (EN3)
Supply Chain Discussion of the process for managing iron ore Discussion and n/a CDP Climate Change Information Request
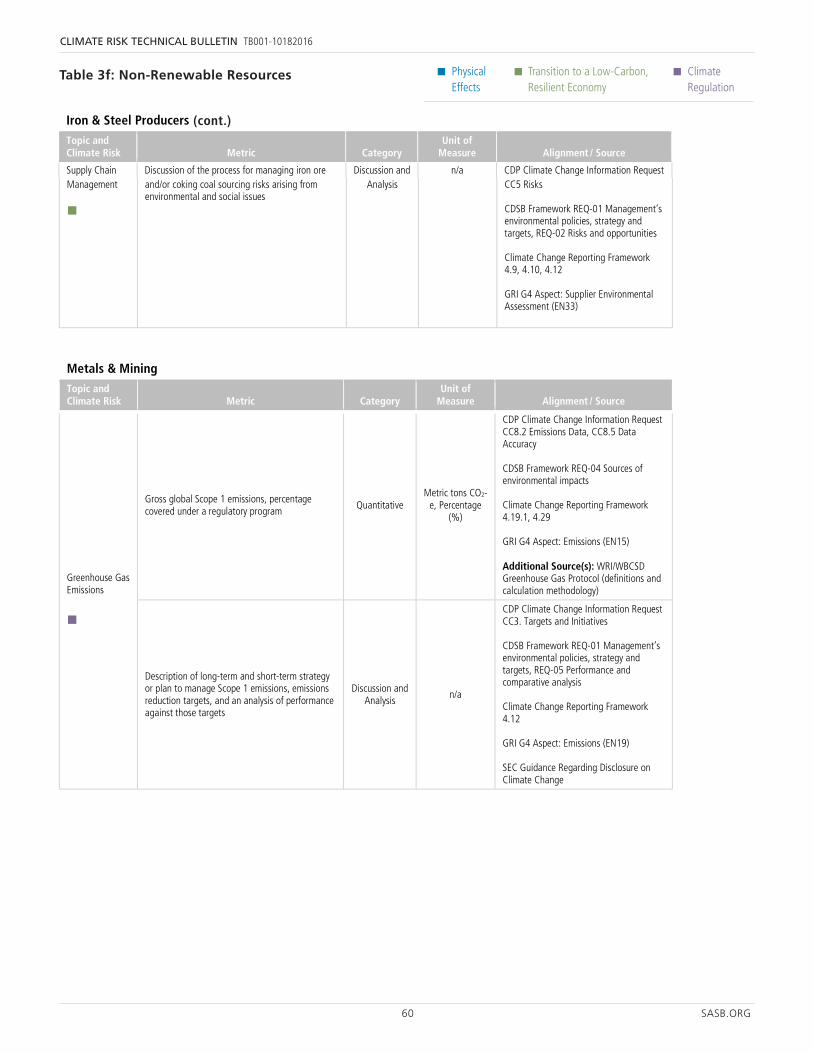
60 SASB.ORG
CLIMATE RISK TECHNICAL BULLETIN TB001-10182016
• Physical Effects
• Transition to a Low-Carbon, Resilient Economy
• Climate Regulation
Table 3f: Non-Renewable Resources
35 SASB.ORG
Physical Effects
Transition to a Low-Carbon, Resilient Economy
Climate Regulation
Iron & Steel Producers Topic and Climate Risk Metric Category
Unit of Measure Alignment / Source
Greenhouse Gas Emissions
Gross global Scope 1 emissions, percentage covered under a regulatory program
Quantitative Metric tons
CO2-e, Percentage (%)
CDP Climate Change Information Request CC8.2 Emissions Data, CC8.5 Data Accuracy CDSB Framework REQ-04 Sources of environmental impacts Climate Change Reporting Framework 4.19.1, 4.29 GRI G4 Aspect: Emissions (EN15) Additional Source(s): WRI/WBCSD Greenhouse Gas Protocol (definitions and calculation methodology)
Description of long-term and short-term strategy or plan to manage Scope 1 emissions, emissions reduction targets, and an analysis of performance against those targets
Discussion and Analysis
n/a
CDP Climate Change Information Request CC3. Targets and Initiatives CDSB Framework REQ-01 Management’s environmental policies, strategy and targets, REQ-05 Performance and comparative analysis Climate Change Reporting Framework 4.12 GRI G4 Aspect: Emissions (EN19) SEC Guidance Regarding Disclosure on Climate Change
Water Management
Total fresh water withdrawn, percentage recycled, percentage in regions with High or Extremely High Baseline Water Stress
Quantitative Cubic meters
(m3), Percentage (%)
CDP Water Information Request W1.2a, 1.2b, 1.2c CDSB Framework REQ-04 Sources of environmental impacts GRI G4 Aspect: Water (EN8, EN9, and EN10) WBCSD Global Water Tool (GWT) CEO Water Mandate – Section 3 Company Water Profile Additional Source(s): WRI Aqueduct (provides definitions of water stress); Alliance for Water Stewardship Standard Version 1.0
Energy Management
Total purchased electricity consumed, percentage renewable Quantitative
Gigajoules (GJ), Percentage (%)
CDP Climate Change Information Request CC11.2, CC3.1d Climate Change Reporting Framework 4.31.f GRI G4 Aspect: Energy (EN3)
Total fuel consumed, percentage from: (1) coal, (2) natural gas, (3) renewable sources Quantitative
Gigajoules (GJ), Percentage (%)
CDP Climate Change Information Request CC11.3, CC3.1d GRI G4 Aspect: Energy (EN3)
Supply Chain Discussion of the process for managing iron ore Discussion and n/a CDP Climate Change Information Request
36 SASB.ORG
Physical Effects
Transition to a Low-Carbon, Resilient Economy
Climate Regulation
Iron & Steel Producers Topic and Climate Risk Metric Category
Unit of Measure Alignment / Source
Management
and/or coking coal sourcing risks arising from environmental and social issues
Analysis CC5 Risks CDSB Framework REQ-01 Management’s environmental policies, strategy and targets, REQ-02 Risks and opportunities Climate Change Reporting Framework 4.9, 4.10, 4.12 GRI G4 Aspect: Supplier Environmental Assessment (EN33)
Metals & Mining Topic and Climate Risk Metric Category
Unit of Measure Alignment / Source
Greenhouse Gas Emissions
Gross global Scope 1 emissions, percentage covered under a regulatory program
Quantitative Metric tons CO2-
e, Percentage (%)
CDP Climate Change Information Request CC8.2 Emissions Data, CC8.5 Data Accuracy CDSB Framework REQ-04 Sources of environmental impacts Climate Change Reporting Framework 4.19.1, 4.29 GRI G4 Aspect: Emissions (EN15) Additional Source(s): WRI/WBCSD Greenhouse Gas Protocol (definitions and calculation methodology)
Description of long-term and short-term strategy or plan to manage Scope 1 emissions, emissions reduction targets, and an analysis of performance against those targets
Discussion and Analysis
n/a
CDP Climate Change Information Request CC3. Targets and Initiatives CDSB Framework REQ-01 Management’s environmental policies, strategy and targets, REQ-05 Performance and comparative analysis Climate Change Reporting Framework 4.12 GRI G4 Aspect: Emissions (EN19) SEC Guidance Regarding Disclosure on Climate Change
Water Management
Total fresh water withdrawn, percentage recycled, percentage in regions with High or Extremely High Baseline Water Stress
Quantitative Cubic meters
(m3), Percentage (%)
CDP Water Information Request W1.2a, 1.2b, 1.2c CDSB Framework REQ-04 Sources of environmental impacts GRI G4 Aspect: Water (EN8, EN9, and EN10) WBCSD Global Water Tool (GWT) CEO Water Mandate – Section 3 Company Water Profile
(cont.)
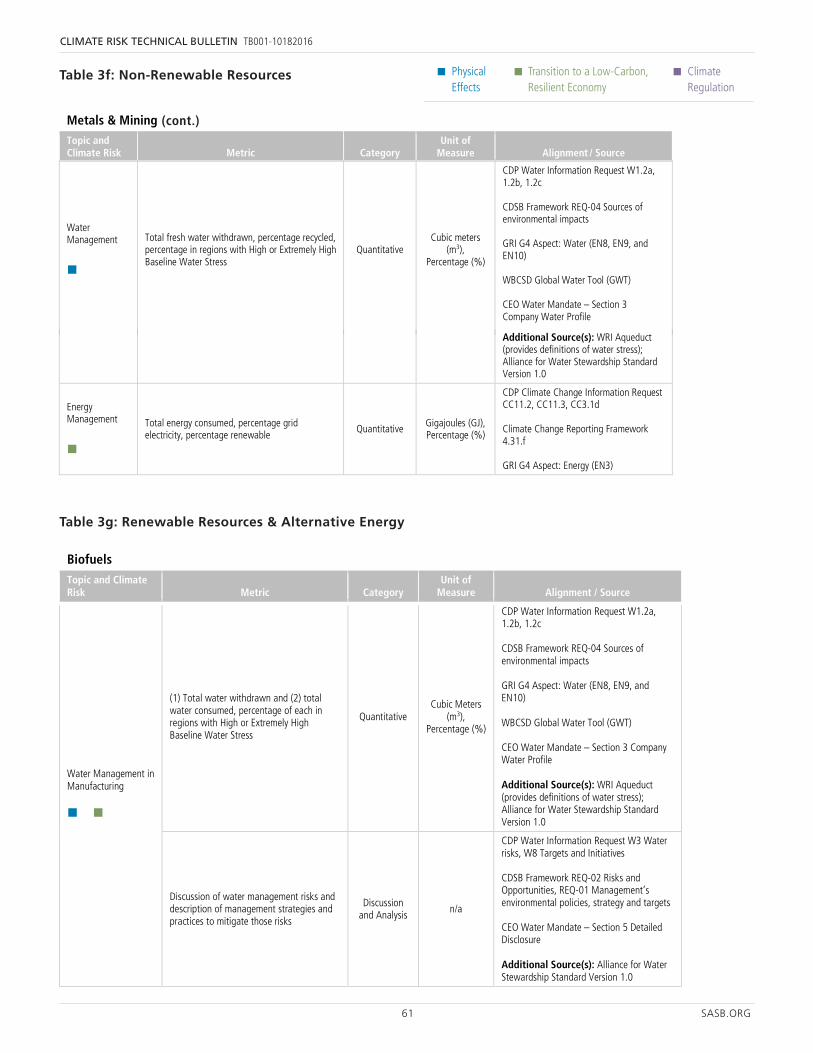
61 SASB.ORG
CLIMATE RISK TECHNICAL BULLETIN TB001-10182016
• Physical Effects
• Transition to a Low-Carbon, Resilient Economy
• Climate Regulation
36 SASB.ORG
Physical Effects
Transition to a Low-Carbon, Resilient Economy
Climate Regulation
Iron & Steel Producers Topic and Climate Risk Metric Category
Unit of Measure Alignment / Source
Management
and/or coking coal sourcing risks arising from environmental and social issues
Analysis CC5 Risks CDSB Framework REQ-01 Management’s environmental policies, strategy and targets, REQ-02 Risks and opportunities Climate Change Reporting Framework 4.9, 4.10, 4.12 GRI G4 Aspect: Supplier Environmental Assessment (EN33)
Metals & Mining Topic and Climate Risk Metric Category
Unit of Measure Alignment / Source
Greenhouse Gas Emissions
Gross global Scope 1 emissions, percentage covered under a regulatory program
Quantitative Metric tons CO2-
e, Percentage (%)
CDP Climate Change Information Request CC8.2 Emissions Data, CC8.5 Data Accuracy CDSB Framework REQ-04 Sources of environmental impacts Climate Change Reporting Framework 4.19.1, 4.29 GRI G4 Aspect: Emissions (EN15) Additional Source(s): WRI/WBCSD Greenhouse Gas Protocol (definitions and calculation methodology)
Description of long-term and short-term strategy or plan to manage Scope 1 emissions, emissions reduction targets, and an analysis of performance against those targets
Discussion and Analysis
n/a
CDP Climate Change Information Request CC3. Targets and Initiatives CDSB Framework REQ-01 Management’s environmental policies, strategy and targets, REQ-05 Performance and comparative analysis Climate Change Reporting Framework 4.12 GRI G4 Aspect: Emissions (EN19) SEC Guidance Regarding Disclosure on Climate Change
Water Management
Total fresh water withdrawn, percentage recycled, percentage in regions with High or Extremely High Baseline Water Stress
Quantitative Cubic meters
(m3), Percentage (%)
CDP Water Information Request W1.2a, 1.2b, 1.2c CDSB Framework REQ-04 Sources of environmental impacts GRI G4 Aspect: Water (EN8, EN9, and EN10) WBCSD Global Water Tool (GWT) CEO Water Mandate – Section 3 Company Water Profile
61 SASB.ORG
Physical Effects
Transition to a Low-Carbon, Resilient Economy
Climate Regulation
Biofuels Topic and Climate Risk Metric Category
Unit of Measure Alignment / Source
Water Management in Manufacturing
(1) Total water withdrawn and (2) total water consumed, percentage of each in regions with High or Extremely High Baseline Water Stress
Quantitative Cubic Meters
(m3), Percentage (%)
CDP Water Information Request W1.2a, 1.2b, 1.2c CDSB Framework REQ-04 Sources of environmental impacts GRI G4 Aspect: Water (EN8, EN9, and EN10) WBCSD Global Water Tool (GWT) CEO Water Mandate – Section 3 Company Water Profile Additional Source(s): WRI Aqueduct (provides definitions of water stress); Alliance for Water Stewardship Standard Version 1.0
Discussion of water management risks and description of management strategies and practices to mitigate those risks
Discussion and Analysis
n/a
CDP Water Information Request W3 Water risks, W8 Targets and Initiatives CDSB Framework REQ-02 Risks and Opportunities, REQ-01 Management’s environmental policies, strategy and targets CEO Water Mandate – Section 5 Detailed Disclosure Additional Source(s): Alliance for Water Stewardship Standard Version 1.0
Lifecycle Emissions Balance
Lifecycle greenhouse gas (GHG) emissions, by biofuel type Quantitative
Grams of CO2-e per
megajoule (MJ)
CDP Climate Change Information Request CC3.2 Emissions Reductions Initiatives GRI G4 Aspect: Emissions (EN15 – EN17) EPA Renewable Fuel Standard (RFS) Additional Source(s): California Air Resources Board Low Carbon Fuel Standard Program, EU Renewable Energy Directive, and Roundtable on Sustainable Biomaterials (RSB)
Management of the Legal & Regulatory Environment
Amount of subsidies received through government programs
Quantitative U.S. Dollars ($) GRI G4 Aspect: Economic Performance (EC4)
Discussion of positions on the regulatory and political environment related to environmental and social factors and description of efforts to manage risks and opportunities presented
Discussion and Analysis
n/a
CDP Climate Change Information Request CC5 Climate Change Risks and CC6 Climate Change Opportunities; CDP Forest Information Request F10.5 CDSB Framework REQ-02 GRI G4 Economic Performance (EC2)
Sourcing & Environmental Impacts of Feedstock Production
Description of strategy to manage risks associated with environmental impacts of feedstock production
Discussion and Analysis
n/a
CDP Climate Change Information Request CC2 Strategy and CC5 Climate Change Risks; CDP Forest Information Request F1.3, F7. Governance and Strategy, F9.2, F10. Engagement CDSB Framework REQ-02 Risks and Opportunities, REQ-01 Management’s
36 SASB.ORG
Physical Effects
Transition to a Low-Carbon, Resilient Economy
Climate Regulation
Iron & Steel Producers Topic and Climate Risk Metric Category
Unit of Measure Alignment / Source
Management
and/or coking coal sourcing risks arising from environmental and social issues
Analysis CC5 Risks CDSB Framework REQ-01 Management’s environmental policies, strategy and targets, REQ-02 Risks and opportunities Climate Change Reporting Framework 4.9, 4.10, 4.12 GRI G4 Aspect: Supplier Environmental Assessment (EN33)
Metals & Mining Topic and Climate Risk Metric Category
Unit of Measure Alignment / Source
Greenhouse Gas Emissions
Gross global Scope 1 emissions, percentage covered under a regulatory program
Quantitative Metric tons CO2-
e, Percentage (%)
CDP Climate Change Information Request CC8.2 Emissions Data, CC8.5 Data Accuracy CDSB Framework REQ-04 Sources of environmental impacts Climate Change Reporting Framework 4.19.1, 4.29 GRI G4 Aspect: Emissions (EN15) Additional Source(s): WRI/WBCSD Greenhouse Gas Protocol (definitions and calculation methodology)
Description of long-term and short-term strategy or plan to manage Scope 1 emissions, emissions reduction targets, and an analysis of performance against those targets
Discussion and Analysis
n/a
CDP Climate Change Information Request CC3. Targets and Initiatives CDSB Framework REQ-01 Management’s environmental policies, strategy and targets, REQ-05 Performance and comparative analysis Climate Change Reporting Framework 4.12 GRI G4 Aspect: Emissions (EN19) SEC Guidance Regarding Disclosure on Climate Change
Water Management
Total fresh water withdrawn, percentage recycled, percentage in regions with High or Extremely High Baseline Water Stress
Quantitative Cubic meters
(m3), Percentage (%)
CDP Water Information Request W1.2a, 1.2b, 1.2c CDSB Framework REQ-04 Sources of environmental impacts GRI G4 Aspect: Water (EN8, EN9, and EN10) WBCSD Global Water Tool (GWT) CEO Water Mandate – Section 3 Company Water Profile
37 SASB.ORG
Physical Effects
Transition to a Low-Carbon, Resilient Economy
Climate Regulation
Metals & Mining Topic and Climate Risk Metric Category
Unit of Measure Alignment / Source
Additional Source(s): WRI Aqueduct (provides definitions of water stress); Alliance for Water Stewardship Standard Version 1.0
Energy Management
Total energy consumed, percentage grid electricity, percentage renewable
Quantitative Gigajoules (GJ), Percentage (%)
CDP Climate Change Information Request CC11.2, CC11.3, CC3.1d Climate Change Reporting Framework 4.31.f GRI G4 Aspect: Energy (EN3)
Table 3f: Non-Renewable Resources
Table 3g: Renewable Resources & Alternative Energy
(cont.)
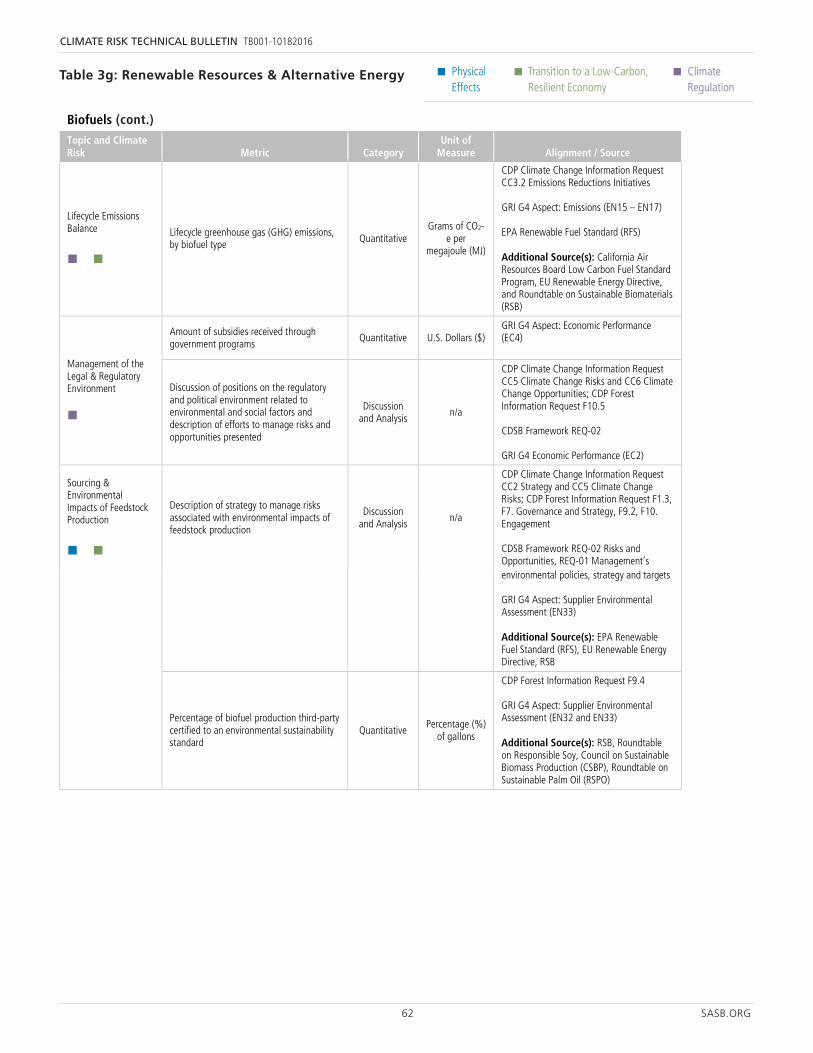
62 SASB.ORG
CLIMATE RISK TECHNICAL BULLETIN TB001-10182016
• Physical Effects
• Transition to a Low-Carbon, Resilient Economy
• Climate Regulation
61 SASB.ORG
Physical Effects
Transition to a Low-Carbon, Resilient Economy
Climate Regulation
Biofuels Topic and Climate Risk Metric Category
Unit of Measure Alignment / Source
Water Management in Manufacturing
(1) Total water withdrawn and (2) total water consumed, percentage of each in regions with High or Extremely High Baseline Water Stress
Quantitative Cubic Meters
(m3), Percentage (%)
CDP Water Information Request W1.2a, 1.2b, 1.2c CDSB Framework REQ-04 Sources of environmental impacts GRI G4 Aspect: Water (EN8, EN9, and EN10) WBCSD Global Water Tool (GWT) CEO Water Mandate – Section 3 Company Water Profile Additional Source(s): WRI Aqueduct (provides definitions of water stress); Alliance for Water Stewardship Standard Version 1.0
Discussion of water management risks and description of management strategies and practices to mitigate those risks
Discussion and Analysis
n/a
CDP Water Information Request W3 Water risks, W8 Targets and Initiatives CDSB Framework REQ-02 Risks and Opportunities, REQ-01 Management’s environmental policies, strategy and targets CEO Water Mandate – Section 5 Detailed Disclosure Additional Source(s): Alliance for Water Stewardship Standard Version 1.0
Lifecycle Emissions Balance
Lifecycle greenhouse gas (GHG) emissions, by biofuel type Quantitative
Grams of CO2-e per
megajoule (MJ)
CDP Climate Change Information Request CC3.2 Emissions Reductions Initiatives GRI G4 Aspect: Emissions (EN15 – EN17) EPA Renewable Fuel Standard (RFS) Additional Source(s): California Air Resources Board Low Carbon Fuel Standard Program, EU Renewable Energy Directive, and Roundtable on Sustainable Biomaterials (RSB)
Management of the Legal & Regulatory Environment
Amount of subsidies received through government programs
Quantitative U.S. Dollars ($) GRI G4 Aspect: Economic Performance (EC4)
Discussion of positions on the regulatory and political environment related to environmental and social factors and description of efforts to manage risks and opportunities presented
Discussion and Analysis
n/a
CDP Climate Change Information Request CC5 Climate Change Risks and CC6 Climate Change Opportunities; CDP Forest Information Request F10.5 CDSB Framework REQ-02 GRI G4 Economic Performance (EC2)
Sourcing & Environmental Impacts of Feedstock Production
Description of strategy to manage risks associated with environmental impacts of feedstock production
Discussion and Analysis
n/a
CDP Climate Change Information Request CC2 Strategy and CC5 Climate Change Risks; CDP Forest Information Request F1.3, F7. Governance and Strategy, F9.2, F10. Engagement CDSB Framework REQ-02 Risks and Opportunities, REQ-01 Management’s
62 SASB.ORG
Physical Effects
Transition to a Low-Carbon, Resilient Economy
Climate Regulation
Biofuels Topic and Climate Risk Metric Category
Unit of Measure Alignment / Source
environmental policies, strategy and targets GRI G4 Aspect: Supplier Environmental Assessment (EN33) Additional Source(s): EPA Renewable Fuel Standard (RFS), EU Renewable Energy Directive, RSB
Percentage of biofuel production third-party certified to an environmental sustainability standard
Quantitative Percentage (%)
of gallons
CDP Forest Information Request F9.4 GRI G4 Aspect: Supplier Environmental Assessment (EN32 and EN33) Additional Source(s): RSB, Roundtable on Responsible Soy, Council on Sustainable Biomass Production (CSBP), Roundtable on Sustainable Palm Oil (RSPO)
Solar Energy Topic and Climate Risk Metric Category
Unit of Measure Alignment / Source
Energy Management in Manufacturing
Total energy consumed, percentage grid electricity, percentage renewable Quantitative
Gigajoules (GJ),
Percentage (%)
CDP Climate Change Information Request CC11.2, CC11.3, CC3.1d CDSB Climate Change Reporting Framework 4.31.f GRI G4 Aspect: Energy (EN3)
Water Management in Manufacturing
(1) Total water withdrawn and (2) total water consumed, percentage of each in regions with High or Extremely High Baseline Water Stress
Quantitative
Cubic meters (m3),
Percentage (%)
CDP Water Information Request W1.2a, 1.2b, 1.2c CDSB Framework REQ-04 Sources of environmental impacts GRI G4 Aspect: Water (EN8, EN9, and EN10) WBCSD Global Water Tool (GWT) CEO Water Mandate – Section 3 Company Water Profile Additional Source(s): WRI Aqueduct (provides definitions of water stress); Alliance for Water Stewardship Standard Version 1.0
Discussion of water management risks and description of strategies and practices to mitigate those risks
Discussion and Analysis n/a
CDP Water Information Request W3 Water risks, W8 Targets and Initiatives CDSB Framework REQ-02 Risks and Opportunities, REQ-01 Management’s environmental policies, strategy and targets CEO Water Mandate – Section 5 Detailed Disclosure Additional Source(s): Alliance for Water Stewardship Standard Version 1.0
Management of Energy Average price of solar energy (1) Quantitative U.S. Dollars
Table 3g: Renewable Resources & Alternative Energy
61 SASB.ORG
Physical Effects
Transition to a Low-Carbon, Resilient Economy
Climate Regulation
Biofuels Topic and Climate Risk Metric Category
Unit of Measure Alignment / Source
Water Management in Manufacturing
(1) Total water withdrawn and (2) total water consumed, percentage of each in regions with High or Extremely High Baseline Water Stress
Quantitative Cubic Meters
(m3), Percentage (%)
CDP Water Information Request W1.2a, 1.2b, 1.2c CDSB Framework REQ-04 Sources of environmental impacts GRI G4 Aspect: Water (EN8, EN9, and EN10) WBCSD Global Water Tool (GWT) CEO Water Mandate – Section 3 Company Water Profile Additional Source(s): WRI Aqueduct (provides definitions of water stress); Alliance for Water Stewardship Standard Version 1.0
Discussion of water management risks and description of management strategies and practices to mitigate those risks
Discussion and Analysis
n/a
CDP Water Information Request W3 Water risks, W8 Targets and Initiatives CDSB Framework REQ-02 Risks and Opportunities, REQ-01 Management’s environmental policies, strategy and targets CEO Water Mandate – Section 5 Detailed Disclosure Additional Source(s): Alliance for Water Stewardship Standard Version 1.0
Lifecycle Emissions Balance
Lifecycle greenhouse gas (GHG) emissions, by biofuel type Quantitative
Grams of CO2-e per
megajoule (MJ)
CDP Climate Change Information Request CC3.2 Emissions Reductions Initiatives GRI G4 Aspect: Emissions (EN15 – EN17) EPA Renewable Fuel Standard (RFS) Additional Source(s): California Air Resources Board Low Carbon Fuel Standard Program, EU Renewable Energy Directive, and Roundtable on Sustainable Biomaterials (RSB)
Management of the Legal & Regulatory Environment
Amount of subsidies received through government programs
Quantitative U.S. Dollars ($) GRI G4 Aspect: Economic Performance (EC4)
Discussion of positions on the regulatory and political environment related to environmental and social factors and description of efforts to manage risks and opportunities presented
Discussion and Analysis
n/a
CDP Climate Change Information Request CC5 Climate Change Risks and CC6 Climate Change Opportunities; CDP Forest Information Request F10.5 CDSB Framework REQ-02 GRI G4 Economic Performance (EC2)
Sourcing & Environmental Impacts of Feedstock Production
Description of strategy to manage risks associated with environmental impacts of feedstock production
Discussion and Analysis
n/a
CDP Climate Change Information Request CC2 Strategy and CC5 Climate Change Risks; CDP Forest Information Request F1.3, F7. Governance and Strategy, F9.2, F10. Engagement CDSB Framework REQ-02 Risks and Opportunities, REQ-01 Management’s
(cont.)
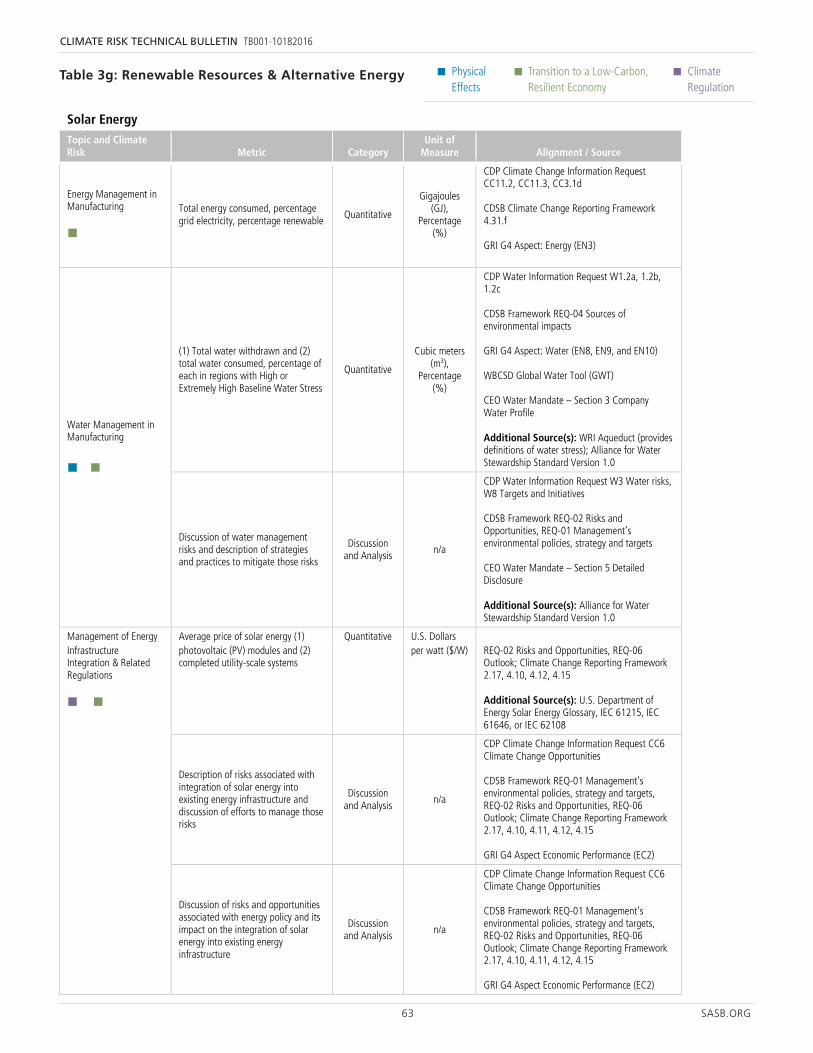
63 SASB.ORG
CLIMATE RISK TECHNICAL BULLETIN TB001-10182016
• Physical Effects
• Transition to a Low-Carbon, Resilient Economy
• Climate Regulation
Table 3g: Renewable Resources & Alternative Energy
62 SASB.ORG
Physical Effects
Transition to a Low-Carbon, Resilient Economy
Climate Regulation
Biofuels Topic and Climate Risk Metric Category
Unit of Measure Alignment / Source
environmental policies, strategy and targets GRI G4 Aspect: Supplier Environmental Assessment (EN33) Additional Source(s): EPA Renewable Fuel Standard (RFS), EU Renewable Energy Directive, RSB
Percentage of biofuel production third-party certified to an environmental sustainability standard
Quantitative Percentage (%)
of gallons
CDP Forest Information Request F9.4 GRI G4 Aspect: Supplier Environmental Assessment (EN32 and EN33) Additional Source(s): RSB, Roundtable on Responsible Soy, Council on Sustainable Biomass Production (CSBP), Roundtable on Sustainable Palm Oil (RSPO)
Solar Energy Topic and Climate Risk Metric Category
Unit of Measure Alignment / Source
Energy Management in Manufacturing
Total energy consumed, percentage grid electricity, percentage renewable Quantitative
Gigajoules (GJ),
Percentage (%)
CDP Climate Change Information Request CC11.2, CC11.3, CC3.1d CDSB Climate Change Reporting Framework 4.31.f GRI G4 Aspect: Energy (EN3)
Water Management in Manufacturing
(1) Total water withdrawn and (2) total water consumed, percentage of each in regions with High or Extremely High Baseline Water Stress
Quantitative
Cubic meters (m3),
Percentage (%)
CDP Water Information Request W1.2a, 1.2b, 1.2c CDSB Framework REQ-04 Sources of environmental impacts GRI G4 Aspect: Water (EN8, EN9, and EN10) WBCSD Global Water Tool (GWT) CEO Water Mandate – Section 3 Company Water Profile Additional Source(s): WRI Aqueduct (provides definitions of water stress); Alliance for Water Stewardship Standard Version 1.0
Discussion of water management risks and description of strategies and practices to mitigate those risks
Discussion and Analysis n/a
CDP Water Information Request W3 Water risks, W8 Targets and Initiatives CDSB Framework REQ-02 Risks and Opportunities, REQ-01 Management’s environmental policies, strategy and targets CEO Water Mandate – Section 5 Detailed Disclosure Additional Source(s): Alliance for Water Stewardship Standard Version 1.0
Management of Energy Average price of solar energy (1) Quantitative U.S. Dollars
63 SASB.ORG
Physical Effects
Transition to a Low-Carbon, Resilient Economy
Climate Regulation
Solar Energy Topic and Climate Risk Metric Category
Unit of Measure Alignment / Source
Infrastructure Integration & Related Regulations
photovoltaic (PV) modules and (2) completed utility-scale systems
per watt ($/W) REQ-02 Risks and Opportunities, REQ-06 Outlook; Climate Change Reporting Framework 2.17, 4.10, 4.12, 4.15 Additional Source(s): U.S. Department of Energy Solar Energy Glossary, IEC 61215, IEC 61646, or IEC 62108
Description of risks associated with integration of solar energy into existing energy infrastructure and discussion of efforts to manage those risks
Discussion and Analysis
n/a
CDP Climate Change Information Request CC6 Climate Change Opportunities CDSB Framework REQ-01 Management’s environmental policies, strategy and targets, REQ-02 Risks and Opportunities, REQ-06 Outlook; Climate Change Reporting Framework 2.17, 4.10, 4.11, 4.12, 4.15 GRI G4 Aspect Economic Performance (EC2)
Discussion of risks and opportunities associated with energy policy and its impact on the integration of solar energy into existing energy infrastructure
Discussion and Analysis n/a
CDP Climate Change Information Request CC6 Climate Change Opportunities CDSB Framework REQ-01 Management’s environmental policies, strategy and targets, REQ-02 Risks and Opportunities, REQ-06 Outlook; Climate Change Reporting Framework 2.17, 4.10, 4.11, 4.12, 4.15 GRI G4 Aspect Economic Performance (EC2)
Forestry & Logging
Topic and Climate Risk Metric Category
Unit of Measure Alignment / Source
Ecosystem Services & Impacts
Area of forestland certified to a third-party forest management standard, percentage certified to each standard Note—For any forest management certifications that were suspended or terminated, the registrant shall disclose the number, associated acreage, and stated reason for suspension or termination. Note—The registrant shall describe forestry management practices for non-certified forestlands.
Quantitative Acres,
Percentage (%)
CDP Forest Information Request F9 Standards and Targets CDSB Framework REQ-04 Sources of environmental impacts GRI G4 Aspect: Biodiversity (EN13) Additional Source(s): American Tree Farm System (ATFS), Forest Stewardship Council (FSC), Programme for the Endorsement of Forest Certification (PEFC), Forest certification systems endorsed by the PEFC, Sustainable Forest Initiative (SFI)
Area of forestland with protected conservation status Quantitative Acres
CDP Forest Information Request F9 Standards and Targets CDSB Framework REQ-02 Risk and Opportunities; REQ-04 Sources of environmental impacts GRI G4 Aspect: Biodiversity (EN11) Additional Source(s): Ramsar Wetlands of International Importance, IUCN Protected Areas (categories I-VI), UNESCO World Heritage sites, Biosphere Reserves recognized within the framework of UNESCO’s Man and the Biosphere Programme, and UNEP World Conservation Monitoring Centre
Discussion of approach to optimizing Discussion n/a CDP Climate Change Information Request CC3.2
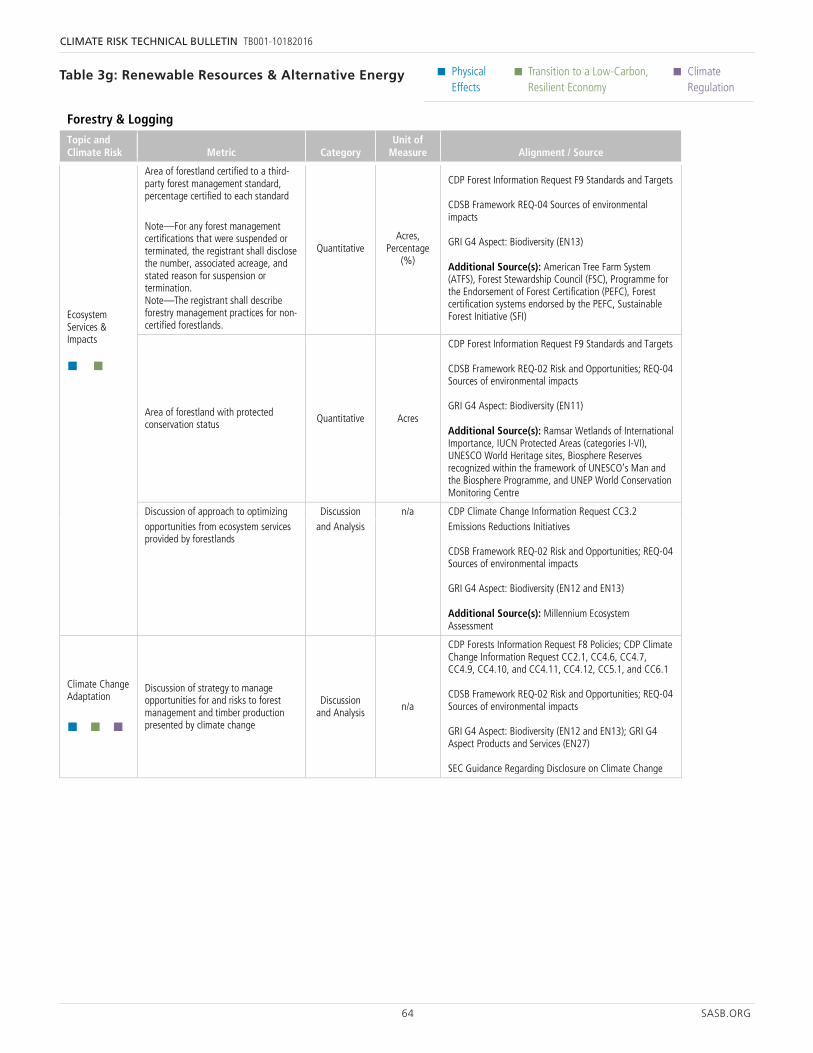
64 SASB.ORG
CLIMATE RISK TECHNICAL BULLETIN TB001-10182016
• Physical Effects
• Transition to a Low-Carbon, Resilient Economy
• Climate Regulation
Table 3g: Renewable Resources & Alternative Energy
63 SASB.ORG
Physical Effects
Transition to a Low-Carbon, Resilient Economy
Climate Regulation
Solar Energy Topic and Climate Risk Metric Category
Unit of Measure Alignment / Source
Infrastructure Integration & Related Regulations
photovoltaic (PV) modules and (2) completed utility-scale systems
per watt ($/W) REQ-02 Risks and Opportunities, REQ-06 Outlook; Climate Change Reporting Framework 2.17, 4.10, 4.12, 4.15 Additional Source(s): U.S. Department of Energy Solar Energy Glossary, IEC 61215, IEC 61646, or IEC 62108
Description of risks associated with integration of solar energy into existing energy infrastructure and discussion of efforts to manage those risks
Discussion and Analysis
n/a
CDP Climate Change Information Request CC6 Climate Change Opportunities CDSB Framework REQ-01 Management’s environmental policies, strategy and targets, REQ-02 Risks and Opportunities, REQ-06 Outlook; Climate Change Reporting Framework 2.17, 4.10, 4.11, 4.12, 4.15 GRI G4 Aspect Economic Performance (EC2)
Discussion of risks and opportunities associated with energy policy and its impact on the integration of solar energy into existing energy infrastructure
Discussion and Analysis n/a
CDP Climate Change Information Request CC6 Climate Change Opportunities CDSB Framework REQ-01 Management’s environmental policies, strategy and targets, REQ-02 Risks and Opportunities, REQ-06 Outlook; Climate Change Reporting Framework 2.17, 4.10, 4.11, 4.12, 4.15 GRI G4 Aspect Economic Performance (EC2)
Forestry & Logging
Topic and Climate Risk Metric Category
Unit of Measure Alignment / Source
Ecosystem Services & Impacts
Area of forestland certified to a third-party forest management standard, percentage certified to each standard Note—For any forest management certifications that were suspended or terminated, the registrant shall disclose the number, associated acreage, and stated reason for suspension or termination. Note—The registrant shall describe forestry management practices for non-certified forestlands.
Quantitative Acres,
Percentage (%)
CDP Forest Information Request F9 Standards and Targets CDSB Framework REQ-04 Sources of environmental impacts GRI G4 Aspect: Biodiversity (EN13) Additional Source(s): American Tree Farm System (ATFS), Forest Stewardship Council (FSC), Programme for the Endorsement of Forest Certification (PEFC), Forest certification systems endorsed by the PEFC, Sustainable Forest Initiative (SFI)
Area of forestland with protected conservation status Quantitative Acres
CDP Forest Information Request F9 Standards and Targets CDSB Framework REQ-02 Risk and Opportunities; REQ-04 Sources of environmental impacts GRI G4 Aspect: Biodiversity (EN11) Additional Source(s): Ramsar Wetlands of International Importance, IUCN Protected Areas (categories I-VI), UNESCO World Heritage sites, Biosphere Reserves recognized within the framework of UNESCO’s Man and the Biosphere Programme, and UNEP World Conservation Monitoring Centre
Discussion of approach to optimizing Discussion n/a CDP Climate Change Information Request CC3.2
64 SASB.ORG
Physical Effects
Transition to a Low-Carbon, Resilient Economy
Climate Regulation
Forestry & Logging Topic and Climate Risk Metric Category
Unit of Measure Alignment / Source
opportunities from ecosystem services provided by forestlands
and Analysis Emissions Reductions Initiatives CDSB Framework REQ-02 Risk and Opportunities; REQ-04 Sources of environmental impacts GRI G4 Aspect: Biodiversity (EN12 and EN13) Additional Source(s): Millennium Ecosystem Assessment
Climate Change Adaptation
Discussion of strategy to manage opportunities for and risks to forest management and timber production presented by climate change
Discussion and Analysis
n/a
CDP Forests Information Request F8 Policies; CDP Climate Change Information Request CC2.1, CC4.6, CC4.7, CC4.9, CC4.10, and CC4.11, CC4.12, CC5.1, and CC6.1 CDSB Framework REQ-02 Risk and Opportunities; REQ-04 Sources of environmental impacts GRI G4 Aspect: Biodiversity (EN12 and EN13); GRI G4 Aspect Products and Services (EN27) SEC Guidance Regarding Disclosure on Climate Change
Fuel Cells & Industrial Batteries Topic and Climate Risk Metric Category
Unit of Measure Alignment / Source
Energy Management
Total energy consumed, percentage grid electricity, percentage renewable Quantitative Gigajoules (GJ),
Percentage (%)
CDP Climate Change Information Request CC11.2, CC11.3, CC3.1d Climate Change Reporting Framework 4.31.f GRI G4 Aspect: Energy (EN3)
Product Efficiency
Average storage capacity of batteries, by product application and technology type
Quantitative Specific energy
(Wh/kg)
CDP Climate Change Information Request CC6 Climate Change Opportunities CDSB Framework REQ-01 Management’s environmental policies, strategy and targets, REQ-02 Risks and Opportunities, REQ-06 Outlook; Climate Change Reporting Framework 2.17, 4.10, 4.12, 4.15 GRI G4 Aspect: Energy EN7, GRI G4 Aspect: Emissions (EN19) SAE J240—Automotive storage batteries and SAE J2185—Heavy-duty storage batteries
Average energy efficiency of fuel cells as (1) electrical efficiency and (2) thermal efficiency, by product application and technology type
Quantitative Percentage (%)
CDP Climate Change Information Request CC6 Climate Change Opportunities CDSB Framework REQ-01 Management’s environmental policies, strategy and targets, REQ-02 Risks and Opportunities, REQ-06 Outlook; Climate Change Reporting Framework 2.17, 4.10, 4.12, 4.15 GRI G4 Aspect: Energy (EN7) IEC 62282-3-200—Stationary fuel cell power systems and SAE J2615—Testing Performance of Fuel Cell Systems for Automotive Applications
Average battery efficiency as coulombic efficiency, by product
Quantitative Percentage (%) CDP Climate Change Information Request CC6 Climate Change Opportunities
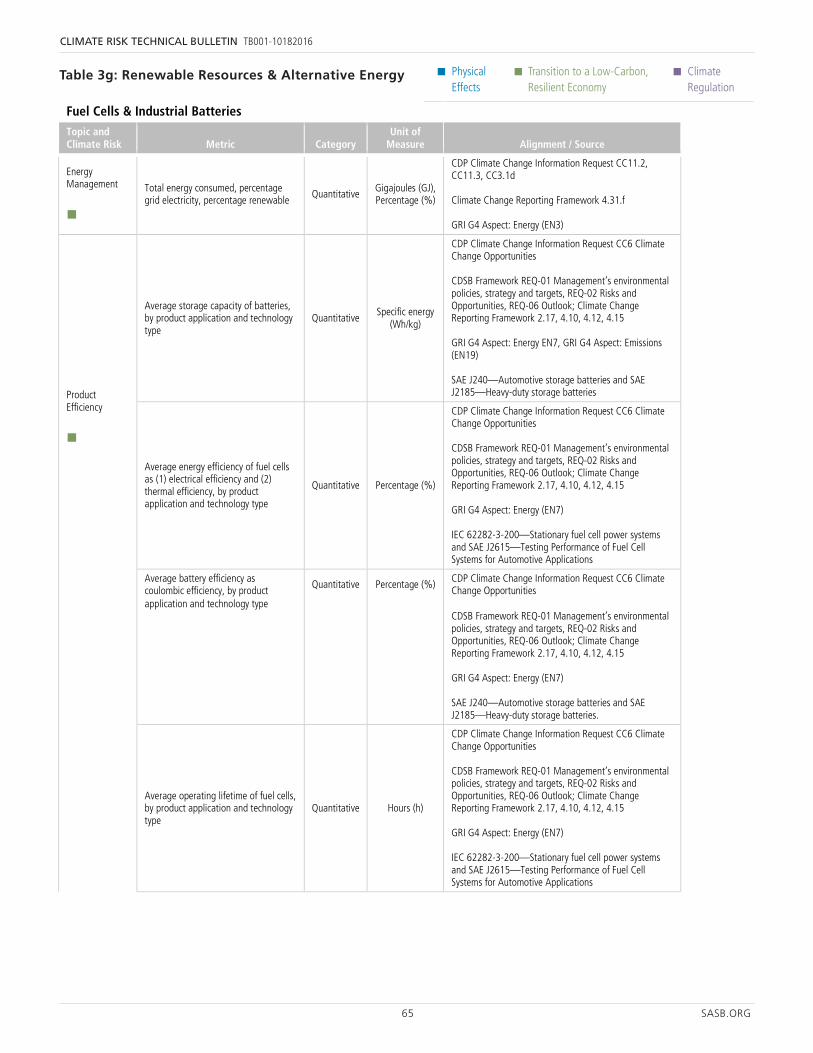
65 SASB.ORG
CLIMATE RISK TECHNICAL BULLETIN TB001-10182016
• Physical Effects
• Transition to a Low-Carbon, Resilient Economy
• Climate Regulation
Table 3g: Renewable Resources & Alternative Energy
64 SASB.ORG
Physical Effects
Transition to a Low-Carbon, Resilient Economy
Climate Regulation
Forestry & Logging Topic and Climate Risk Metric Category
Unit of Measure Alignment / Source
opportunities from ecosystem services provided by forestlands
and Analysis Emissions Reductions Initiatives CDSB Framework REQ-02 Risk and Opportunities; REQ-04 Sources of environmental impacts GRI G4 Aspect: Biodiversity (EN12 and EN13) Additional Source(s): Millennium Ecosystem Assessment
Climate Change Adaptation
Discussion of strategy to manage opportunities for and risks to forest management and timber production presented by climate change
Discussion and Analysis
n/a
CDP Forests Information Request F8 Policies; CDP Climate Change Information Request CC2.1, CC4.6, CC4.7, CC4.9, CC4.10, and CC4.11, CC4.12, CC5.1, and CC6.1 CDSB Framework REQ-02 Risk and Opportunities; REQ-04 Sources of environmental impacts GRI G4 Aspect: Biodiversity (EN12 and EN13); GRI G4 Aspect Products and Services (EN27) SEC Guidance Regarding Disclosure on Climate Change
Fuel Cells & Industrial Batteries Topic and Climate Risk Metric Category
Unit of Measure Alignment / Source
Energy Management
Total energy consumed, percentage grid electricity, percentage renewable Quantitative Gigajoules (GJ),
Percentage (%)
CDP Climate Change Information Request CC11.2, CC11.3, CC3.1d Climate Change Reporting Framework 4.31.f GRI G4 Aspect: Energy (EN3)
Product Efficiency
Average storage capacity of batteries, by product application and technology type
Quantitative Specific energy
(Wh/kg)
CDP Climate Change Information Request CC6 Climate Change Opportunities CDSB Framework REQ-01 Management’s environmental policies, strategy and targets, REQ-02 Risks and Opportunities, REQ-06 Outlook; Climate Change Reporting Framework 2.17, 4.10, 4.12, 4.15 GRI G4 Aspect: Energy EN7, GRI G4 Aspect: Emissions (EN19) SAE J240—Automotive storage batteries and SAE J2185—Heavy-duty storage batteries
Average energy efficiency of fuel cells as (1) electrical efficiency and (2) thermal efficiency, by product application and technology type
Quantitative Percentage (%)
CDP Climate Change Information Request CC6 Climate Change Opportunities CDSB Framework REQ-01 Management’s environmental policies, strategy and targets, REQ-02 Risks and Opportunities, REQ-06 Outlook; Climate Change Reporting Framework 2.17, 4.10, 4.12, 4.15 GRI G4 Aspect: Energy (EN7) IEC 62282-3-200—Stationary fuel cell power systems and SAE J2615—Testing Performance of Fuel Cell Systems for Automotive Applications
Average battery efficiency as coulombic efficiency, by product
Quantitative Percentage (%) CDP Climate Change Information Request CC6 Climate Change Opportunities
65 SASB.ORG
Physical Effects
Transition to a Low-Carbon, Resilient Economy
Climate Regulation
Fuel Cells & Industrial Batteries Topic and Climate Risk Metric Category
Unit of Measure Alignment / Source
application and technology type CDSB Framework REQ-01 Management’s environmental policies, strategy and targets, REQ-02 Risks and Opportunities, REQ-06 Outlook; Climate Change Reporting Framework 2.17, 4.10, 4.12, 4.15 GRI G4 Aspect: Energy (EN7) SAE J240—Automotive storage batteries and SAE J2185—Heavy-duty storage batteries.
Average operating lifetime of fuel cells, by product application and technology type
Quantitative Hours (h)
CDP Climate Change Information Request CC6 Climate Change Opportunities CDSB Framework REQ-01 Management’s environmental policies, strategy and targets, REQ-02 Risks and Opportunities, REQ-06 Outlook; Climate Change Reporting Framework 2.17, 4.10, 4.12, 4.15 GRI G4 Aspect: Energy (EN7) IEC 62282-3-200—Stationary fuel cell power systems and SAE J2615—Testing Performance of Fuel Cell Systems for Automotive Applications
Average operating lifetime of batteries, by product application and technology type
Quantitative Number of cycles
CDP Climate Change Information Request CC6 Climate Change Opportunities CDSB Framework REQ-01 Management’s environmental policies, strategy and targets, REQ-02 Risks and Opportunities, REQ-06 Outlook; Climate Change Reporting Framework 2.17, 4.10, 4.12, 4.15 GRI G4 Aspect: Energy (EN7) SAE J240—Automotive storage batteries and SAE J2185—Heavy-duty storage batteries.
Wind Energy Topic and Climate Risk Metric Category
Unit of Measure Alignment / Source
Materials Efficiency
Average top head mass per turbine capacity, by wind turbine class Quantitative
Metric tons per megawatt
(t/MW)
CDP Climate Change Information Request CC6 Climate Change Opportunities CDSB Framework REQ-01 Management’s environmental policies, strategy and targets, REQ-02 Risks and Opportunities, REQ-06 Outlook; Climate Change Reporting Framework 2.17, 4.10, 4.12, 4.15 GRI G4 Aspect: Materials (EN1)
Discussion of approach to optimize materials efficiency of wind turbine design
Discussion and Analysis
n/a
CDP Climate Change Information Request CC6 Climate Change Opportunities CDSB Framework REQ-01 Management’s environmental policies, strategy and targets, REQ-02 Risks and Opportunities, REQ-06 Outlook; Climate Change Reporting Framework 2.17, 4.10, 4.12, 4.15
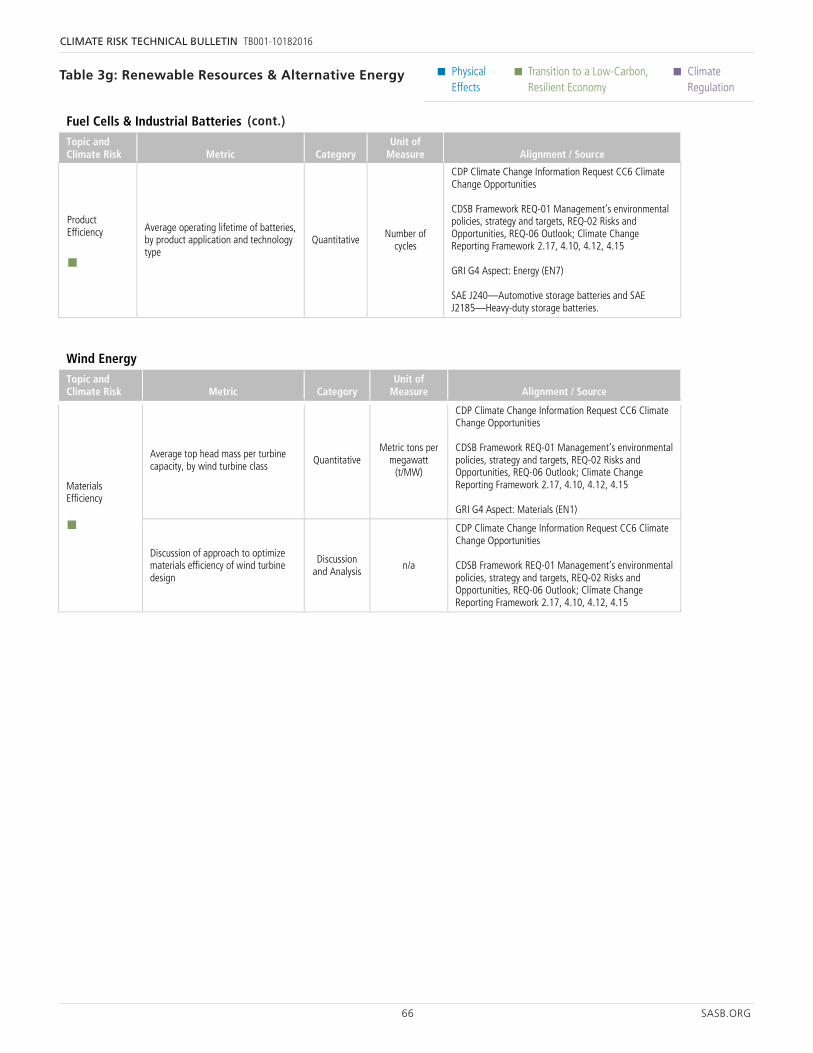
66 SASB.ORG
CLIMATE RISK TECHNICAL BULLETIN TB001-10182016
• Physical Effects
• Transition to a Low-Carbon, Resilient Economy
• Climate Regulation
64 SASB.ORG
Physical Effects
Transition to a Low-Carbon, Resilient Economy
Climate Regulation
Forestry & Logging Topic and Climate Risk Metric Category
Unit of Measure Alignment / Source
opportunities from ecosystem services provided by forestlands
and Analysis Emissions Reductions Initiatives CDSB Framework REQ-02 Risk and Opportunities; REQ-04 Sources of environmental impacts GRI G4 Aspect: Biodiversity (EN12 and EN13) Additional Source(s): Millennium Ecosystem Assessment
Climate Change Adaptation
Discussion of strategy to manage opportunities for and risks to forest management and timber production presented by climate change
Discussion and Analysis
n/a
CDP Forests Information Request F8 Policies; CDP Climate Change Information Request CC2.1, CC4.6, CC4.7, CC4.9, CC4.10, and CC4.11, CC4.12, CC5.1, and CC6.1 CDSB Framework REQ-02 Risk and Opportunities; REQ-04 Sources of environmental impacts GRI G4 Aspect: Biodiversity (EN12 and EN13); GRI G4 Aspect Products and Services (EN27) SEC Guidance Regarding Disclosure on Climate Change
Fuel Cells & Industrial Batteries Topic and Climate Risk Metric Category
Unit of Measure Alignment / Source
Energy Management
Total energy consumed, percentage grid electricity, percentage renewable Quantitative Gigajoules (GJ),
Percentage (%)
CDP Climate Change Information Request CC11.2, CC11.3, CC3.1d Climate Change Reporting Framework 4.31.f GRI G4 Aspect: Energy (EN3)
Product Efficiency
Average storage capacity of batteries, by product application and technology type
Quantitative Specific energy
(Wh/kg)
CDP Climate Change Information Request CC6 Climate Change Opportunities CDSB Framework REQ-01 Management’s environmental policies, strategy and targets, REQ-02 Risks and Opportunities, REQ-06 Outlook; Climate Change Reporting Framework 2.17, 4.10, 4.12, 4.15 GRI G4 Aspect: Energy EN7, GRI G4 Aspect: Emissions (EN19) SAE J240—Automotive storage batteries and SAE J2185—Heavy-duty storage batteries
Average energy efficiency of fuel cells as (1) electrical efficiency and (2) thermal efficiency, by product application and technology type
Quantitative Percentage (%)
CDP Climate Change Information Request CC6 Climate Change Opportunities CDSB Framework REQ-01 Management’s environmental policies, strategy and targets, REQ-02 Risks and Opportunities, REQ-06 Outlook; Climate Change Reporting Framework 2.17, 4.10, 4.12, 4.15 GRI G4 Aspect: Energy (EN7) IEC 62282-3-200—Stationary fuel cell power systems and SAE J2615—Testing Performance of Fuel Cell Systems for Automotive Applications
Average battery efficiency as coulombic efficiency, by product
Quantitative Percentage (%) CDP Climate Change Information Request CC6 Climate Change Opportunities
65 SASB.ORG
Physical Effects
Transition to a Low-Carbon, Resilient Economy
Climate Regulation
Fuel Cells & Industrial Batteries Topic and Climate Risk Metric Category
Unit of Measure Alignment / Source
application and technology type CDSB Framework REQ-01 Management’s environmental policies, strategy and targets, REQ-02 Risks and Opportunities, REQ-06 Outlook; Climate Change Reporting Framework 2.17, 4.10, 4.12, 4.15 GRI G4 Aspect: Energy (EN7) SAE J240—Automotive storage batteries and SAE J2185—Heavy-duty storage batteries.
Average operating lifetime of fuel cells, by product application and technology type
Quantitative Hours (h)
CDP Climate Change Information Request CC6 Climate Change Opportunities CDSB Framework REQ-01 Management’s environmental policies, strategy and targets, REQ-02 Risks and Opportunities, REQ-06 Outlook; Climate Change Reporting Framework 2.17, 4.10, 4.12, 4.15 GRI G4 Aspect: Energy (EN7) IEC 62282-3-200—Stationary fuel cell power systems and SAE J2615—Testing Performance of Fuel Cell Systems for Automotive Applications
Average operating lifetime of batteries, by product application and technology type
Quantitative Number of cycles
CDP Climate Change Information Request CC6 Climate Change Opportunities CDSB Framework REQ-01 Management’s environmental policies, strategy and targets, REQ-02 Risks and Opportunities, REQ-06 Outlook; Climate Change Reporting Framework 2.17, 4.10, 4.12, 4.15 GRI G4 Aspect: Energy (EN7) SAE J240—Automotive storage batteries and SAE J2185—Heavy-duty storage batteries.
Wind Energy Topic and Climate Risk Metric Category
Unit of Measure Alignment / Source
Materials Efficiency
Average top head mass per turbine capacity, by wind turbine class Quantitative
Metric tons per megawatt
(t/MW)
CDP Climate Change Information Request CC6 Climate Change Opportunities CDSB Framework REQ-01 Management’s environmental policies, strategy and targets, REQ-02 Risks and Opportunities, REQ-06 Outlook; Climate Change Reporting Framework 2.17, 4.10, 4.12, 4.15 GRI G4 Aspect: Materials (EN1)
Discussion of approach to optimize materials efficiency of wind turbine design
Discussion and Analysis
n/a
CDP Climate Change Information Request CC6 Climate Change Opportunities CDSB Framework REQ-01 Management’s environmental policies, strategy and targets, REQ-02 Risks and Opportunities, REQ-06 Outlook; Climate Change Reporting Framework 2.17, 4.10, 4.12, 4.15
64 SASB.ORG
Physical Effects
Transition to a Low-Carbon, Resilient Economy
Climate Regulation
Forestry & Logging Topic and Climate Risk Metric Category
Unit of Measure Alignment / Source
opportunities from ecosystem services provided by forestlands
and Analysis Emissions Reductions Initiatives CDSB Framework REQ-02 Risk and Opportunities; REQ-04 Sources of environmental impacts GRI G4 Aspect: Biodiversity (EN12 and EN13) Additional Source(s): Millennium Ecosystem Assessment
Climate Change Adaptation
Discussion of strategy to manage opportunities for and risks to forest management and timber production presented by climate change
Discussion and Analysis
n/a
CDP Forests Information Request F8 Policies; CDP Climate Change Information Request CC2.1, CC4.6, CC4.7, CC4.9, CC4.10, and CC4.11, CC4.12, CC5.1, and CC6.1 CDSB Framework REQ-02 Risk and Opportunities; REQ-04 Sources of environmental impacts GRI G4 Aspect: Biodiversity (EN12 and EN13); GRI G4 Aspect Products and Services (EN27) SEC Guidance Regarding Disclosure on Climate Change
Fuel Cells & Industrial Batteries Topic and Climate Risk Metric Category
Unit of Measure Alignment / Source
Energy Management
Total energy consumed, percentage grid electricity, percentage renewable Quantitative Gigajoules (GJ),
Percentage (%)
CDP Climate Change Information Request CC11.2, CC11.3, CC3.1d Climate Change Reporting Framework 4.31.f GRI G4 Aspect: Energy (EN3)
Product Efficiency
Average storage capacity of batteries, by product application and technology type
Quantitative Specific energy
(Wh/kg)
CDP Climate Change Information Request CC6 Climate Change Opportunities CDSB Framework REQ-01 Management’s environmental policies, strategy and targets, REQ-02 Risks and Opportunities, REQ-06 Outlook; Climate Change Reporting Framework 2.17, 4.10, 4.12, 4.15 GRI G4 Aspect: Energy EN7, GRI G4 Aspect: Emissions (EN19) SAE J240—Automotive storage batteries and SAE J2185—Heavy-duty storage batteries
Average energy efficiency of fuel cells as (1) electrical efficiency and (2) thermal efficiency, by product application and technology type
Quantitative Percentage (%)
CDP Climate Change Information Request CC6 Climate Change Opportunities CDSB Framework REQ-01 Management’s environmental policies, strategy and targets, REQ-02 Risks and Opportunities, REQ-06 Outlook; Climate Change Reporting Framework 2.17, 4.10, 4.12, 4.15 GRI G4 Aspect: Energy (EN7) IEC 62282-3-200—Stationary fuel cell power systems and SAE J2615—Testing Performance of Fuel Cell Systems for Automotive Applications
Average battery efficiency as coulombic efficiency, by product
Quantitative Percentage (%) CDP Climate Change Information Request CC6 Climate Change Opportunities
Table 3g: Renewable Resources & Alternative Energy
(cont.)
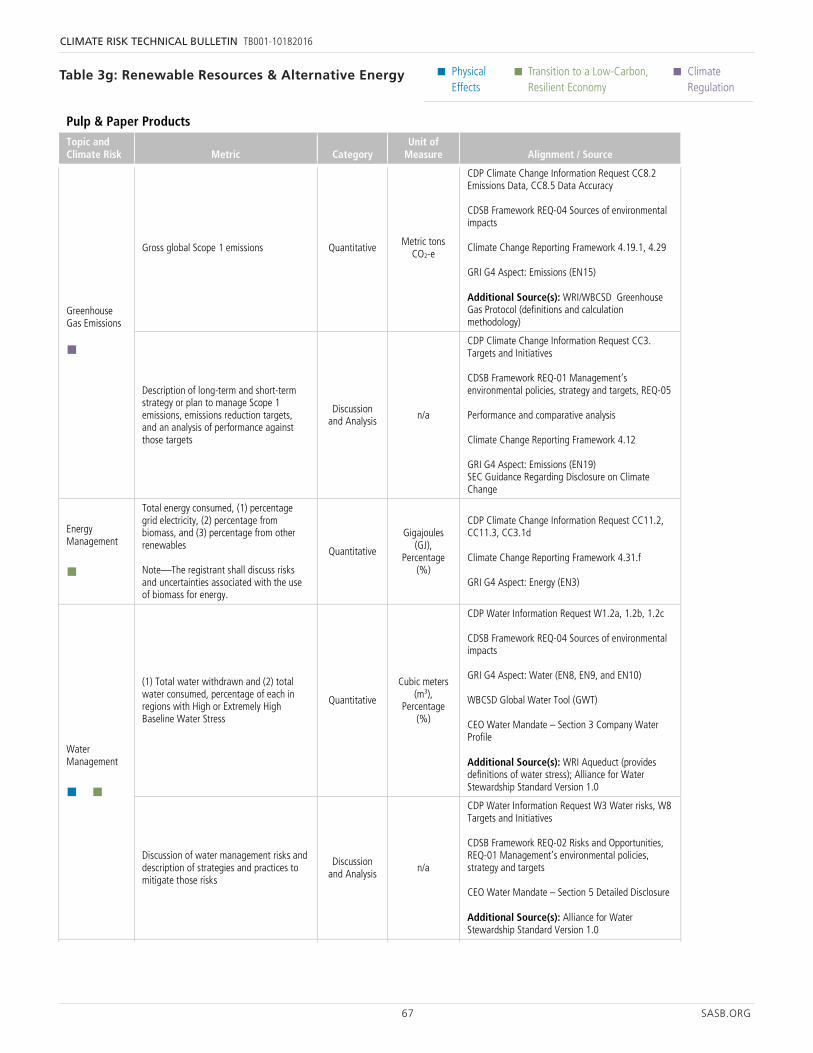
67 SASB.ORG
CLIMATE RISK TECHNICAL BULLETIN TB001-10182016
• Physical Effects
• Transition to a Low-Carbon, Resilient Economy
• Climate Regulation
66 SASB.ORG
Physical Effects
Transition to a Low-Carbon, Resilient Economy
Climate Regulation
Pulp & Paper Products Topic and Climate Risk Metric Category
Unit of Measure Alignment / Source
Greenhouse Gas Emissions
Gross global Scope 1 emissions Quantitative Metric tons CO2-e
CDP Climate Change Information Request CC8.2 Emissions Data, CC8.5 Data Accuracy CDSB Framework REQ-04 Sources of environmental impacts Climate Change Reporting Framework 4.19.1, 4.29 GRI G4 Aspect: Emissions (EN15) Additional Source(s): WRI/WBCSD Greenhouse Gas Protocol (definitions and calculation methodology)
Description of long-term and short-term strategy or plan to manage Scope 1 emissions, emissions reduction targets, and an analysis of performance against those targets
Discussion and Analysis n/a
CDP Climate Change Information Request CC3. Targets and Initiatives CDSB Framework REQ-01 Management’s environmental policies, strategy and targets, REQ-05 Performance and comparative analysis Climate Change Reporting Framework 4.12 GRI G4 Aspect: Emissions (EN19) SEC Guidance Regarding Disclosure on Climate Change
Energy Management
Total energy consumed, (1) percentage grid electricity, (2) percentage from biomass, and (3) percentage from other renewables Note—The registrant shall discuss risks and uncertainties associated with the use of biomass for energy.
Quantitative
Gigajoules (GJ),
Percentage (%)
CDP Climate Change Information Request CC11.2, CC11.3, CC3.1d Climate Change Reporting Framework 4.31.f GRI G4 Aspect: Energy (EN3)
Water Management
(1) Total water withdrawn and (2) total water consumed, percentage of each in regions with High or Extremely High Baseline Water Stress
Quantitative
Cubic meters (m3),
Percentage (%)
CDP Water Information Request W1.2a, 1.2b, 1.2c CDSB Framework REQ-04 Sources of environmental impacts GRI G4 Aspect: Water (EN8, EN9, and EN10) WBCSD Global Water Tool (GWT) CEO Water Mandate – Section 3 Company Water Profile Additional Source(s): WRI Aqueduct (provides definitions of water stress); Alliance for Water Stewardship Standard Version 1.0
Discussion of water management risks and description of strategies and practices to mitigate those risks
Discussion and Analysis
n/a
CDP Water Information Request W3 Water risks, W8 Targets and Initiatives CDSB Framework REQ-02 Risks and Opportunities, REQ-01 Management’s environmental policies, strategy and targets CEO Water Mandate – Section 5 Detailed Disclosure Additional Source(s): Alliance for Water Stewardship Standard Version 1.0
Fiber Sourcing Percentage of wood fiber sourced (1) from Quantitative Percentage CDP Forests Information Request F9 Standards and
Table 3g: Renewable Resources & Alternative Energy
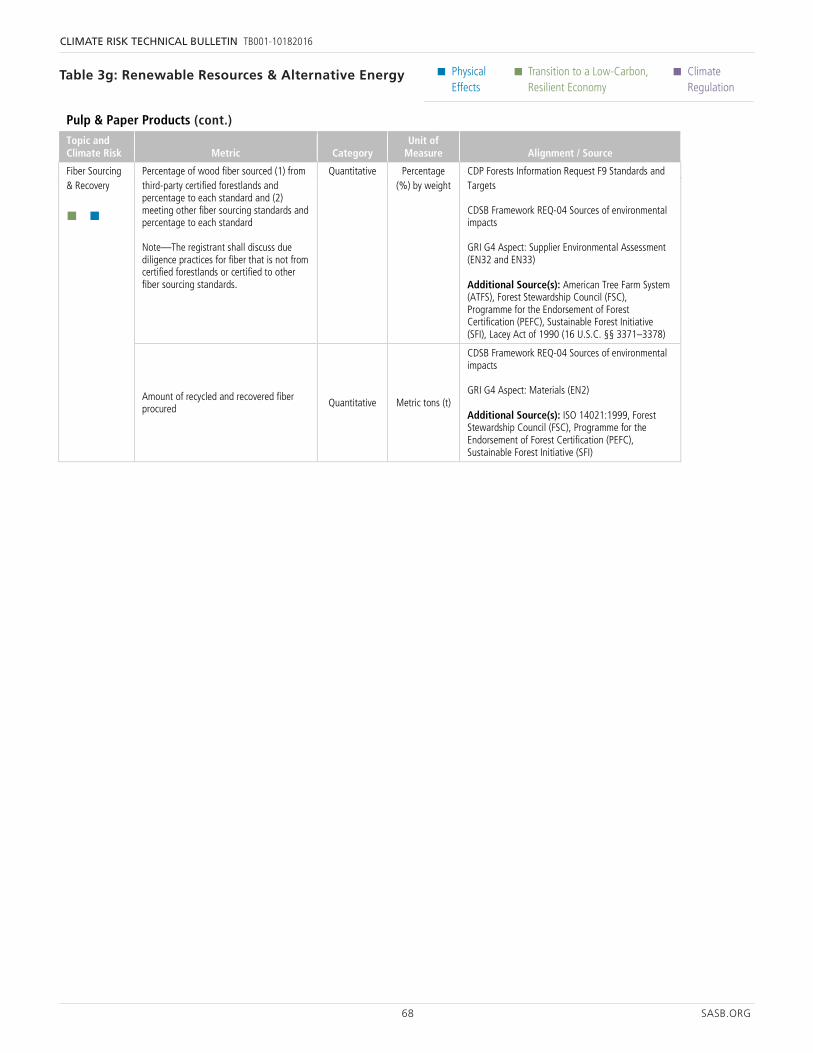
68 SASB.ORG
CLIMATE RISK TECHNICAL BULLETIN TB001-10182016
• Physical Effects
• Transition to a Low-Carbon, Resilient Economy
• Climate Regulation
66 SASB.ORG
Physical Effects
Transition to a Low-Carbon, Resilient Economy
Climate Regulation
Pulp & Paper Products Topic and Climate Risk Metric Category
Unit of Measure Alignment / Source
Greenhouse Gas Emissions
Gross global Scope 1 emissions Quantitative Metric tons CO2-e
CDP Climate Change Information Request CC8.2 Emissions Data, CC8.5 Data Accuracy CDSB Framework REQ-04 Sources of environmental impacts Climate Change Reporting Framework 4.19.1, 4.29 GRI G4 Aspect: Emissions (EN15) Additional Source(s): WRI/WBCSD Greenhouse Gas Protocol (definitions and calculation methodology)
Description of long-term and short-term strategy or plan to manage Scope 1 emissions, emissions reduction targets, and an analysis of performance against those targets
Discussion and Analysis n/a
CDP Climate Change Information Request CC3. Targets and Initiatives CDSB Framework REQ-01 Management’s environmental policies, strategy and targets, REQ-05 Performance and comparative analysis Climate Change Reporting Framework 4.12 GRI G4 Aspect: Emissions (EN19) SEC Guidance Regarding Disclosure on Climate Change
Energy Management
Total energy consumed, (1) percentage grid electricity, (2) percentage from biomass, and (3) percentage from other renewables Note—The registrant shall discuss risks and uncertainties associated with the use of biomass for energy.
Quantitative
Gigajoules (GJ),
Percentage (%)
CDP Climate Change Information Request CC11.2, CC11.3, CC3.1d Climate Change Reporting Framework 4.31.f GRI G4 Aspect: Energy (EN3)
Water Management
(1) Total water withdrawn and (2) total water consumed, percentage of each in regions with High or Extremely High Baseline Water Stress
Quantitative
Cubic meters (m3),
Percentage (%)
CDP Water Information Request W1.2a, 1.2b, 1.2c CDSB Framework REQ-04 Sources of environmental impacts GRI G4 Aspect: Water (EN8, EN9, and EN10) WBCSD Global Water Tool (GWT) CEO Water Mandate – Section 3 Company Water Profile Additional Source(s): WRI Aqueduct (provides definitions of water stress); Alliance for Water Stewardship Standard Version 1.0
Discussion of water management risks and description of strategies and practices to mitigate those risks
Discussion and Analysis
n/a
CDP Water Information Request W3 Water risks, W8 Targets and Initiatives CDSB Framework REQ-02 Risks and Opportunities, REQ-01 Management’s environmental policies, strategy and targets CEO Water Mandate – Section 5 Detailed Disclosure Additional Source(s): Alliance for Water Stewardship Standard Version 1.0
Fiber Sourcing Percentage of wood fiber sourced (1) from Quantitative Percentage CDP Forests Information Request F9 Standards and
67 SASB.ORG
Physical Effects
Transition to a Low-Carbon, Resilient Economy
Climate Regulation
Pulp & Paper Products Topic and Climate Risk Metric Category
Unit of Measure Alignment / Source
& Recovery
third-party certified forestlands and percentage to each standard and (2) meeting other fiber sourcing standards and percentage to each standard Note—The registrant shall discuss due diligence practices for fiber that is not from certified forestlands or certified to other fiber sourcing standards.
(%) by weight Targets CDSB Framework REQ-04 Sources of environmental impacts GRI G4 Aspect: Supplier Environmental Assessment (EN32 and EN33) Additional Source(s): American Tree Farm System (ATFS), Forest Stewardship Council (FSC), Programme for the Endorsement of Forest Certification (PEFC), Sustainable Forest Initiative (SFI), Lacey Act of 1990 (16 U.S.C. §§ 3371–3378)
Amount of recycled and recovered fiber procured Quantitative Metric tons (t)
CDSB Framework REQ-04 Sources of environmental impacts GRI G4 Aspect: Materials (EN2) Additional Source(s): ISO 14021:1999, Forest Stewardship Council (FSC), Programme for the Endorsement of Forest Certification (PEFC), Sustainable Forest Initiative (SFI)
Table 3g: Renewable Resources & Alternative Energy
(cont.)
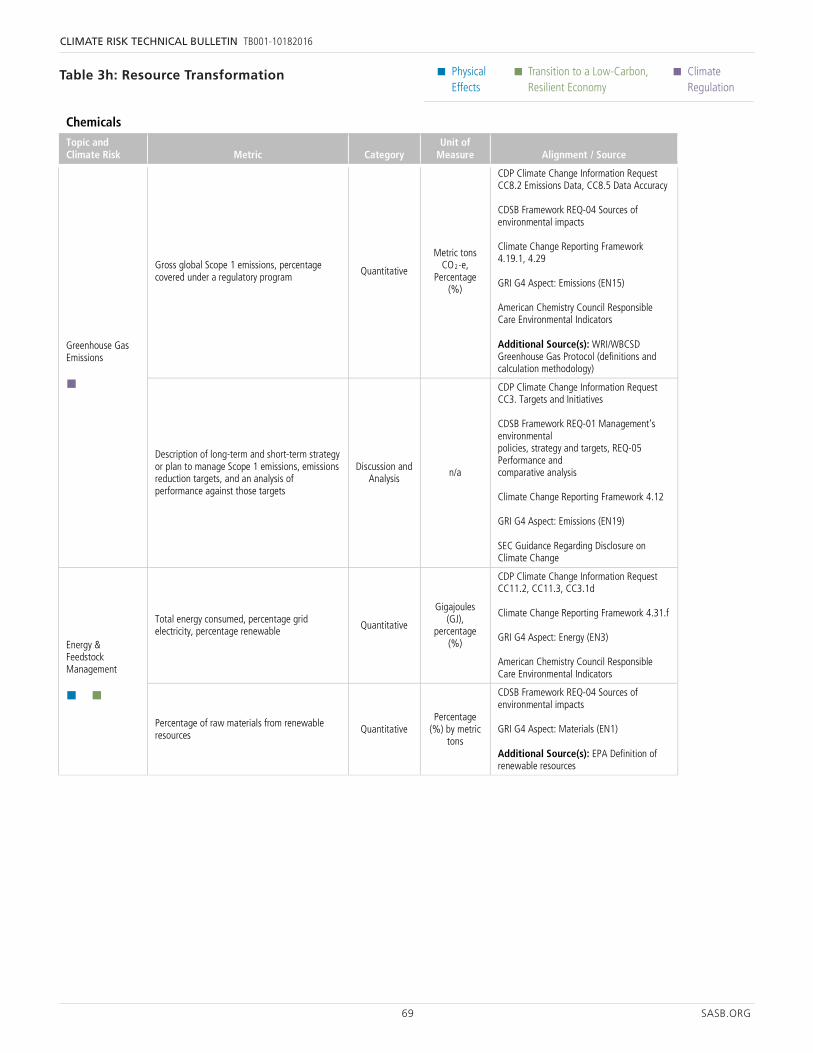
69 SASB.ORG
CLIMATE RISK TECHNICAL BULLETIN TB001-10182016
• Physical Effects
• Transition to a Low-Carbon, Resilient Economy
• Climate Regulation
Table 3h: Resource Transformation
43 SASB.ORG
Physical Effects
Transition to a Low-Carbon, Resilient Economy
Climate Regulation
Chemicals Topic and Climate Risk Metric Category
Unit of Measure Alignment / Source
Greenhouse Gas Emissions
Gross global Scope 1 emissions, percentage covered under a regulatory program Quantitative
Metric tons CO2-e,
Percentage (%)
CDP Climate Change Information Request CC8.2 Emissions Data, CC8.5 Data Accuracy CDSB Framework REQ-04 Sources of environmental impacts Climate Change Reporting Framework 4.19.1, 4.29 GRI G4 Aspect: Emissions (EN15) American Chemistry Council Responsible Care Environmental Indicators Additional Source(s): WRI/WBCSD Greenhouse Gas Protocol (definitions and calculation methodology)
Description of long-term and short-term strategy or plan to manage Scope 1 emissions, emissions reduction targets, and an analysis of performance against those targets
Discussion and Analysis
n/a
CDP Climate Change Information Request CC3. Targets and Initiatives CDSB Framework REQ-01 Management’s environmental policies, strategy and targets, REQ-05 Performance and comparative analysis Climate Change Reporting Framework 4.12 GRI G4 Aspect: Emissions (EN19) SEC Guidance Regarding Disclosure on Climate Change
Energy & Feedstock Management
Total energy consumed, percentage grid electricity, percentage renewable Quantitative
Gigajoules (GJ),
percentage (%)
CDP Climate Change Information Request CC11.2, CC11.3, CC3.1d Climate Change Reporting Framework 4.31.f GRI G4 Aspect: Energy (EN3) American Chemistry Council Responsible Care Environmental Indicators
Percentage of raw materials from renewable resources Quantitative
Percentage (%) by metric
tons
CDSB Framework REQ-04 Sources of environmental impacts GRI G4 Aspect: Materials (EN1) Additional Source(s): EPA Definition of renewable resources
Water Management
(1) Total water withdrawn and (2) total water consumed, percentage of each in regions with High or Extremely High Baseline Water Stress
Quantitative
Cubic Meters (m3),
Percentage (%)
CDP Water Information Request W1.2a, 1.2b, 1.2c CDSB Framework REQ-04 Sources of environmental impacts GRI G4 Aspect: Water (EN8, EN9, and EN10) American Chemistry Council Responsible Care Environmental Indicators WBCSD Global Water Tool (GWT) CEO Water Mandate – Section 3 Company
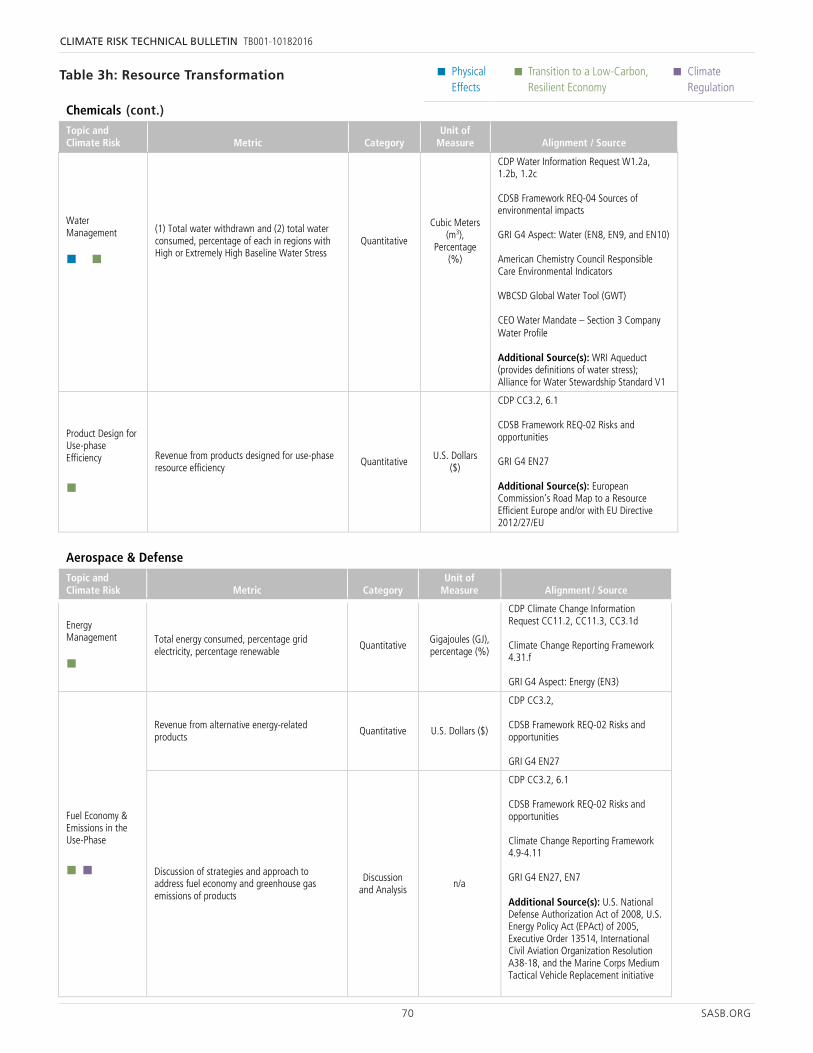
70 SASB.ORG
CLIMATE RISK TECHNICAL BULLETIN TB001-10182016
• Physical Effects
• Transition to a Low-Carbon, Resilient Economy
• Climate Regulation
Table 3h: Resource Transformation
44 SASB.ORG
Physical Effects
Transition to a Low-Carbon, Resilient Economy
Climate Regulation
Chemicals Topic and Climate Risk Metric Category
Unit of Measure Alignment / Source
Water Profile Additional Source(s): WRI Aqueduct (provides definitions of water stress); Alliance for Water Stewardship Standard V1
Product Design for Use-phase Efficiency
Revenue from products designed for use-phase resource efficiency
Quantitative U.S. Dollars
($)
CDP CC3.2, 6.1 CDSB Framework REQ-02 Risks and opportunities GRI G4 EN27 Additional Source(s): European Commission’s Road Map to a Resource Efficient Europe and/or with EU Directive 2012/27/EU
Aerospace & Defense
Topic and Climate Risk Metric Category
Unit of Measure Alignment / Source
Energy Management
Total energy consumed, percentage grid electricity, percentage renewable Quantitative Gigajoules (GJ),
percentage (%)
CDP Climate Change Information Request CC11.2, CC11.3, CC3.1d Climate Change Reporting Framework 4.31.f GRI G4 Aspect: Energy (EN3)
Fuel Economy & Emissions in the Use-Phase
Revenue from alternative energy-related products Quantitative U.S. Dollars ($)
CDP CC3.2, CDSB Framework REQ-02 Risks and opportunities GRI G4 EN27
Discussion of strategies and approach to address fuel economy and greenhouse gas emissions of products
Discussion and Analysis n/a
CDP CC3.2, 6.1 CDSB Framework REQ-02 Risks and opportunities Climate Change Reporting Framework 4.9-4.11 GRI G4 EN27, EN7 Additional Source(s): U.S. National Defense Authorization Act of 2008, U.S. Energy Policy Act (EPAct) of 2005, Executive Order 13514, International Civil Aviation Organization Resolution A38-18, and the Marine Corps Medium Tactical Vehicle Replacement initiative
43 SASB.ORG
Physical Effects
Transition to a Low-Carbon, Resilient Economy
Climate Regulation
Chemicals Topic and Climate Risk Metric Category
Unit of Measure Alignment / Source
Greenhouse Gas Emissions
Gross global Scope 1 emissions, percentage covered under a regulatory program Quantitative
Metric tons CO2-e,
Percentage (%)
CDP Climate Change Information Request CC8.2 Emissions Data, CC8.5 Data Accuracy CDSB Framework REQ-04 Sources of environmental impacts Climate Change Reporting Framework 4.19.1, 4.29 GRI G4 Aspect: Emissions (EN15) American Chemistry Council Responsible Care Environmental Indicators Additional Source(s): WRI/WBCSD Greenhouse Gas Protocol (definitions and calculation methodology)
Description of long-term and short-term strategy or plan to manage Scope 1 emissions, emissions reduction targets, and an analysis of performance against those targets
Discussion and Analysis
n/a
CDP Climate Change Information Request CC3. Targets and Initiatives CDSB Framework REQ-01 Management’s environmental policies, strategy and targets, REQ-05 Performance and comparative analysis Climate Change Reporting Framework 4.12 GRI G4 Aspect: Emissions (EN19) SEC Guidance Regarding Disclosure on Climate Change
Energy & Feedstock Management
Total energy consumed, percentage grid electricity, percentage renewable Quantitative
Gigajoules (GJ),
percentage (%)
CDP Climate Change Information Request CC11.2, CC11.3, CC3.1d Climate Change Reporting Framework 4.31.f GRI G4 Aspect: Energy (EN3) American Chemistry Council Responsible Care Environmental Indicators
Percentage of raw materials from renewable resources Quantitative
Percentage (%) by metric
tons
CDSB Framework REQ-04 Sources of environmental impacts GRI G4 Aspect: Materials (EN1) Additional Source(s): EPA Definition of renewable resources
Water Management
(1) Total water withdrawn and (2) total water consumed, percentage of each in regions with High or Extremely High Baseline Water Stress
Quantitative
Cubic Meters (m3),
Percentage (%)
CDP Water Information Request W1.2a, 1.2b, 1.2c CDSB Framework REQ-04 Sources of environmental impacts GRI G4 Aspect: Water (EN8, EN9, and EN10) American Chemistry Council Responsible Care Environmental Indicators WBCSD Global Water Tool (GWT) CEO Water Mandate – Section 3 Company
(cont.)
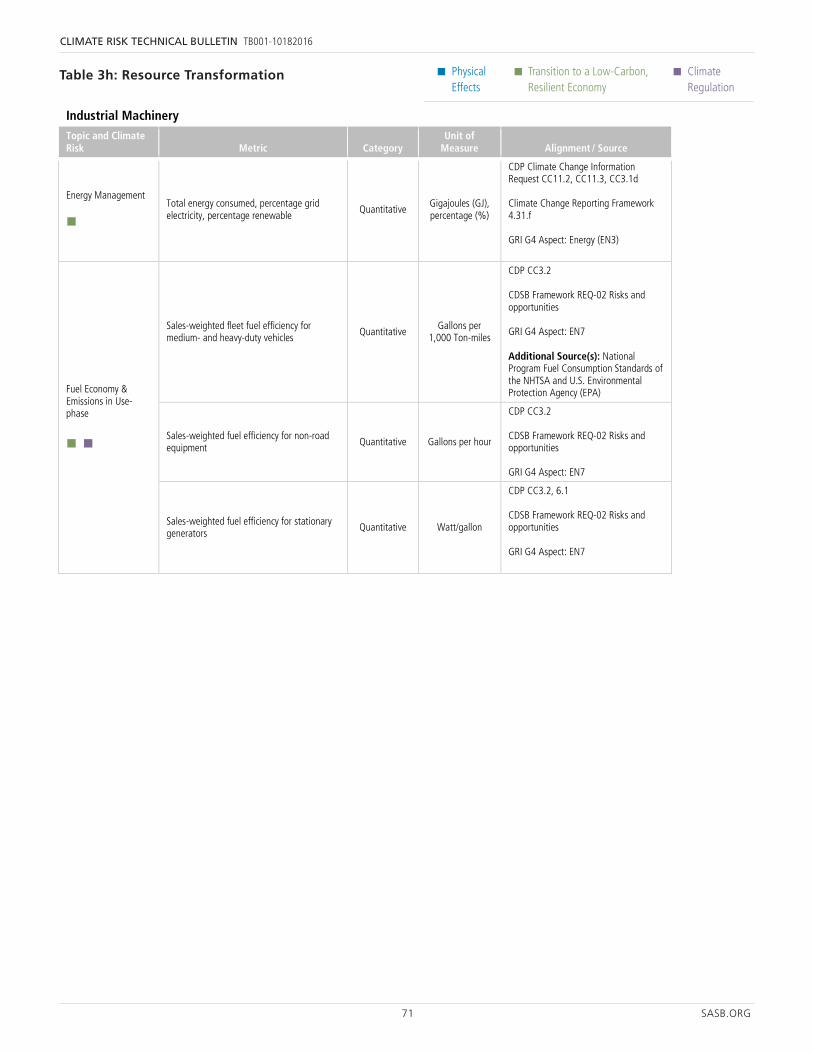
71 SASB.ORG
CLIMATE RISK TECHNICAL BULLETIN TB001-10182016
• Physical Effects
• Transition to a Low-Carbon, Resilient Economy
• Climate Regulation
Table 3h: Resource Transformation
45 SASB.ORG
Physical Effects
Transition to a Low-Carbon, Resilient Economy
Climate Regulation
Industrial Machinery Topic and Climate Risk Metric Category
Unit of Measure Alignment / Source
Energy Management
Total energy consumed, percentage grid electricity, percentage renewable Quantitative Gigajoules (GJ),
percentage (%)
CDP Climate Change Information Request CC11.2, CC11.3, CC3.1d Climate Change Reporting Framework 4.31.f GRI G4 Aspect: Energy (EN3)
Fuel Economy & Emissions in Use-phase
Sales-weighted fleet fuel efficiency for medium- and heavy-duty vehicles Quantitative Gallons per
1,000 Ton-miles
CDP CC3.2 CDSB Framework REQ-02 Risks and opportunities GRI G4 Aspect: EN7 Additional Source(s): National Program Fuel Consumption Standards of the NHTSA and U.S. Environmental Protection Agency (EPA)
Sales-weighted fuel efficiency for non-road equipment Quantitative Gallons per hour
CDP CC3.2 CDSB Framework REQ-02 Risks and opportunities GRI G4 Aspect: EN7
Sales-weighted fuel efficiency for stationary generators Quantitative Watt/gallon
CDP CC3.2, 6.1 CDSB Framework REQ-02 Risks and opportunities GRI G4 Aspect: EN7
Electrical & Electronic Equipment Topic and Climate Risk Metric Category
Unit of Measure Alignment / Source
Energy Management
Total energy consumed, percentage grid electricity, percentage renewable
Quantitative
Gigajoules (GJ),
percentage (%)
CDP Climate Change Information Request CC11.2, CC11.3, CC3.1d Climate Change Reporting Framework 4.31.f GRI G4 Aspect: Energy (EN3)
Product Lifecycle Management & Innovation for Environmental Efficiency
Percentage of eligible products by revenue that meet ENERGY STAR® criteria
Quantitative Percentage
(%) by revenue
CDP CC3.2 CDSB Framework REQ-02 Risks and opportunities GRI G4 EN7 Additional Source(s): U.S. Department of Energy ENERGY STAR®
Revenue from renewable energy-related and energy efficiency-related products
Quantitative U.S. Dollars ($)
CDP CC3.2 CDSB Framework REQ-02 Risks and opportunities GRI G4 EN7 Additional Source(s): NIST Smart Grid Interoperability Standards, EC’s Road Map to a Resource Efficient Europe and/or
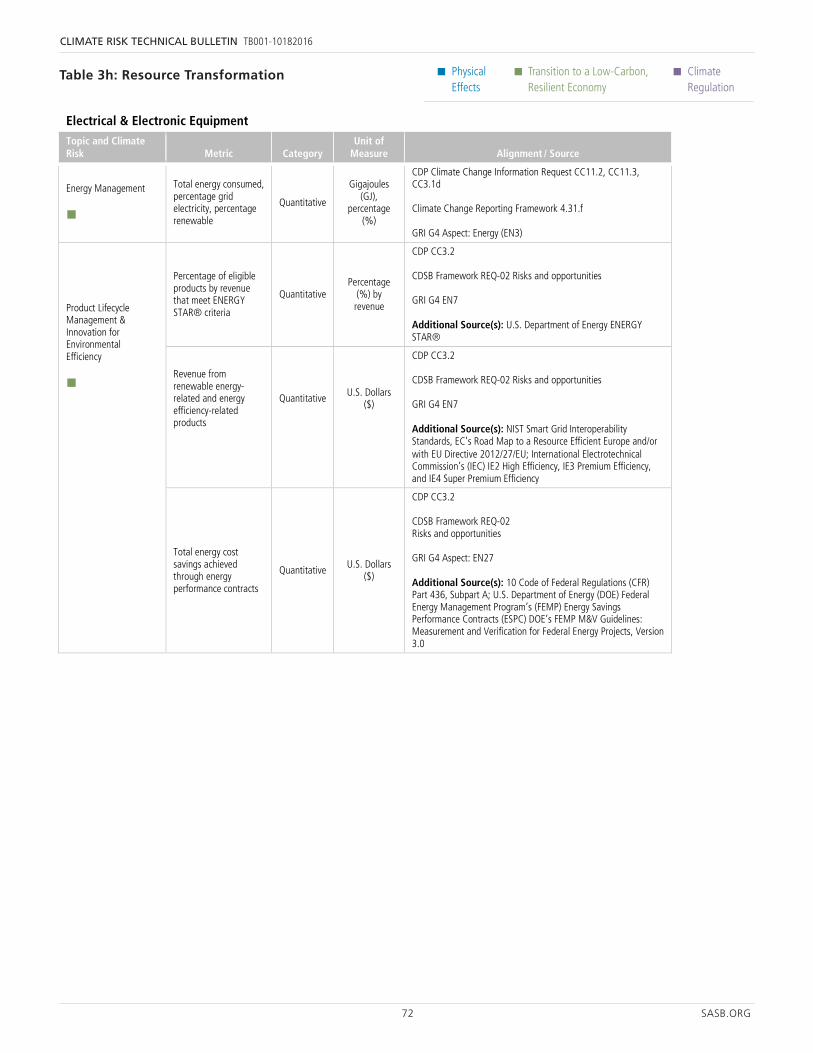
72 SASB.ORG
CLIMATE RISK TECHNICAL BULLETIN TB001-10182016
• Physical Effects
• Transition to a Low-Carbon, Resilient Economy
• Climate Regulation
45 SASB.ORG
Physical Effects
Transition to a Low-Carbon, Resilient Economy
Climate Regulation
Industrial Machinery Topic and Climate Risk Metric Category
Unit of Measure Alignment / Source
Energy Management
Total energy consumed, percentage grid electricity, percentage renewable Quantitative Gigajoules (GJ),
percentage (%)
CDP Climate Change Information Request CC11.2, CC11.3, CC3.1d Climate Change Reporting Framework 4.31.f GRI G4 Aspect: Energy (EN3)
Fuel Economy & Emissions in Use-phase
Sales-weighted fleet fuel efficiency for medium- and heavy-duty vehicles Quantitative Gallons per
1,000 Ton-miles
CDP CC3.2 CDSB Framework REQ-02 Risks and opportunities GRI G4 Aspect: EN7 Additional Source(s): National Program Fuel Consumption Standards of the NHTSA and U.S. Environmental Protection Agency (EPA)
Sales-weighted fuel efficiency for non-road equipment Quantitative Gallons per hour
CDP CC3.2 CDSB Framework REQ-02 Risks and opportunities GRI G4 Aspect: EN7
Sales-weighted fuel efficiency for stationary generators Quantitative Watt/gallon
CDP CC3.2, 6.1 CDSB Framework REQ-02 Risks and opportunities GRI G4 Aspect: EN7
Electrical & Electronic Equipment Topic and Climate Risk Metric Category
Unit of Measure Alignment / Source
Energy Management
Total energy consumed, percentage grid electricity, percentage renewable
Quantitative
Gigajoules (GJ),
percentage (%)
CDP Climate Change Information Request CC11.2, CC11.3, CC3.1d Climate Change Reporting Framework 4.31.f GRI G4 Aspect: Energy (EN3)
Product Lifecycle Management & Innovation for Environmental Efficiency
Percentage of eligible products by revenue that meet ENERGY STAR® criteria
Quantitative Percentage
(%) by revenue
CDP CC3.2 CDSB Framework REQ-02 Risks and opportunities GRI G4 EN7 Additional Source(s): U.S. Department of Energy ENERGY STAR®
Revenue from renewable energy-related and energy efficiency-related products
Quantitative U.S. Dollars ($)
CDP CC3.2 CDSB Framework REQ-02 Risks and opportunities GRI G4 EN7 Additional Source(s): NIST Smart Grid Interoperability Standards, EC’s Road Map to a Resource Efficient Europe and/or
46 SASB.ORG
Physical Effects
Transition to a Low-Carbon, Resilient Economy
Climate Regulation
Electrical & Electronic Equipment Topic and Climate Risk Metric Category
Unit of Measure Alignment / Source
with EU Directive 2012/27/EU; International Electrotechnical Commission’s (IEC) IE2 High Efficiency, IE3 Premium Efficiency, and IE4 Super Premium Efficiency
Total energy cost savings achieved through energy performance contracts
Quantitative U.S. Dollars ($)
CDP CC3.2 CDSB Framework REQ-02 Risks and opportunities GRI G4 Aspect: EN27 Additional Source(s): 10 Code of Federal Regulations (CFR) Part 436, Subpart A; U.S. Department of Energy (DOE) Federal Energy Management Program’s (FEMP) Energy Savings Performance Contracts (ESPC) DOE’s FEMP M&V Guidelines: Measurement and Verification for Federal Energy Projects, Version 3.0
Containers & Packaging
Topic and Climate Risk Metric Category
Unit of Measure Alignment / Source
Greenhouse Gas Emissions
Gross global Scope 1 emissions, percentage covered under a regulatory program
Quantitative
Metric tons CO2-e,
Percentage (%)
CDP Climate Change Information Request CC8.2 Emissions Data, CC8.5 Data Accuracy CDSB Framework REQ-04 Sources of environmental impacts Climate Change Reporting Framework 4.19.1, 4.29 GRI G4 Aspect: Emissions (EN15) Additional Source(s): WRI/WBCSD Greenhouse Gas Protocol (definitions and calculation methodology)
Description of long-term and short-term strategy or plan to manage Scope 1 emissions, emissions reduction targets, and an analysis of performance against those targets
Discussion and
Analysis n/a
CDP Climate Change Information Request CC3. Targets and Initiatives CDSB Framework REQ-01 Management’s environmental policies, strategy and targets, REQ-05 Performance and comparative analysis Climate Change Reporting Framework 4.12 GRI G4 Aspect: Emissions (EN19) SEC Guidance Regarding Disclosure on Climate Change
Energy Management
Total energy consumed, percentage grid electricity, percentage renewable
Quantitative
Gigajoules (GJ),
percentage (%)
CDP Climate Change Information Request CC11.2, CC11.3, CC3.1d Climate Change Reporting Framework 4.31.f GRI G4 Aspect: Energy (EN3)
Water Management
(1) Total water withdrawn and (2) total water consumed, percentage of each in regions with High or Extremely High Baseline Water Stress
Quantitative
Cubic Meters (m3),
Percentage (%)
CDP Water Information Request W1.2a, 1.2b, 1.2c CDSB Framework REQ-04 Sources of environmental impacts GRI G4 Aspect: Water (EN8, EN9, and EN10) WBCSD Global Water Tool (GWT) CEO Water Mandate – Section 3 Company Water Profile
Table 3h: Resource Transformation
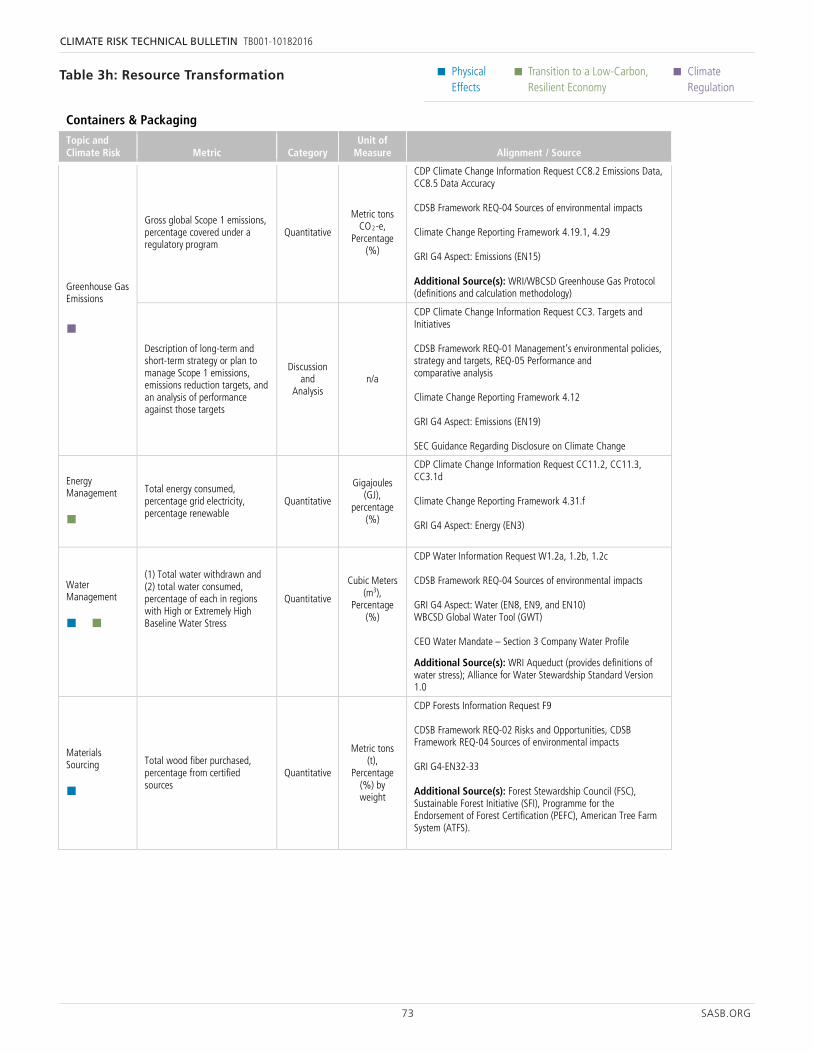
73 SASB.ORG
CLIMATE RISK TECHNICAL BULLETIN TB001-10182016
• Physical Effects
• Transition to a Low-Carbon, Resilient Economy
• Climate Regulation
46 SASB.ORG
Physical Effects
Transition to a Low-Carbon, Resilient Economy
Climate Regulation
Electrical & Electronic Equipment Topic and Climate Risk Metric Category
Unit of Measure Alignment / Source
with EU Directive 2012/27/EU; International Electrotechnical Commission’s (IEC) IE2 High Efficiency, IE3 Premium Efficiency, and IE4 Super Premium Efficiency
Total energy cost savings achieved through energy performance contracts
Quantitative U.S. Dollars ($)
CDP CC3.2 CDSB Framework REQ-02 Risks and opportunities GRI G4 Aspect: EN27 Additional Source(s): 10 Code of Federal Regulations (CFR) Part 436, Subpart A; U.S. Department of Energy (DOE) Federal Energy Management Program’s (FEMP) Energy Savings Performance Contracts (ESPC) DOE’s FEMP M&V Guidelines: Measurement and Verification for Federal Energy Projects, Version 3.0
Containers & Packaging
Topic and Climate Risk Metric Category
Unit of Measure Alignment / Source
Greenhouse Gas Emissions
Gross global Scope 1 emissions, percentage covered under a regulatory program
Quantitative
Metric tons CO2-e,
Percentage (%)
CDP Climate Change Information Request CC8.2 Emissions Data, CC8.5 Data Accuracy CDSB Framework REQ-04 Sources of environmental impacts Climate Change Reporting Framework 4.19.1, 4.29 GRI G4 Aspect: Emissions (EN15) Additional Source(s): WRI/WBCSD Greenhouse Gas Protocol (definitions and calculation methodology)
Description of long-term and short-term strategy or plan to manage Scope 1 emissions, emissions reduction targets, and an analysis of performance against those targets
Discussion and
Analysis n/a
CDP Climate Change Information Request CC3. Targets and Initiatives CDSB Framework REQ-01 Management’s environmental policies, strategy and targets, REQ-05 Performance and comparative analysis Climate Change Reporting Framework 4.12 GRI G4 Aspect: Emissions (EN19) SEC Guidance Regarding Disclosure on Climate Change
Energy Management
Total energy consumed, percentage grid electricity, percentage renewable
Quantitative
Gigajoules (GJ),
percentage (%)
CDP Climate Change Information Request CC11.2, CC11.3, CC3.1d Climate Change Reporting Framework 4.31.f GRI G4 Aspect: Energy (EN3)
Water Management
(1) Total water withdrawn and (2) total water consumed, percentage of each in regions with High or Extremely High Baseline Water Stress
Quantitative
Cubic Meters (m3),
Percentage (%)
CDP Water Information Request W1.2a, 1.2b, 1.2c CDSB Framework REQ-04 Sources of environmental impacts GRI G4 Aspect: Water (EN8, EN9, and EN10) WBCSD Global Water Tool (GWT) CEO Water Mandate – Section 3 Company Water Profile
47 SASB.ORG
Physical Effects
Transition to a Low-Carbon, Resilient Economy
Climate Regulation
Containers & Packaging Topic and Climate Risk Metric Category
Unit of Measure Alignment / Source
Additional Source(s): WRI Aqueduct (provides definitions of water stress); Alliance for Water Stewardship Standard Version 1.0
Materials Sourcing
Total wood fiber purchased, percentage from certified sources
Quantitative
Metric tons (t),
Percentage (%) by weight
CDP Forests Information Request F9 CDSB Framework REQ-02 Risks and Opportunities, CDSB Framework REQ-04 Sources of environmental impacts GRI G4-EN32-33 Additional Source(s): Forest Stewardship Council (FSC), Sustainable Forest Initiative (SFI), Programme for the Endorsement of Forest Certification (PEFC), American Tree Farm System (ATFS).
Table 3h: Resource Transformation
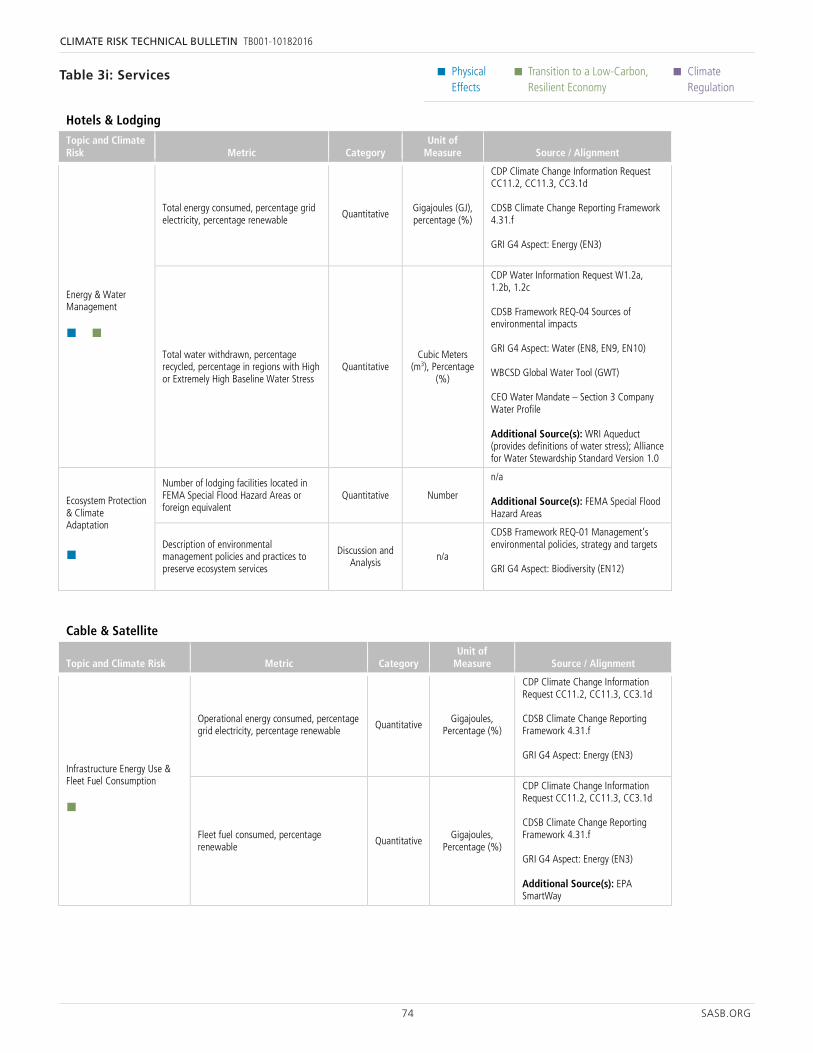
74 SASB.ORG
CLIMATE RISK TECHNICAL BULLETIN TB001-10182016
• Physical Effects
• Transition to a Low-Carbon, Resilient Economy
• Climate Regulation
40 SASB.ORG
Physical Effects
Transition to a Low-Carbon, Resilient Economy
Climate Regulation
Hotels & Lodging Topic and Climate Risk Metric Category
Unit of Measure Source / Alignment
Energy & Water Management
Total energy consumed, percentage grid electricity, percentage renewable
Quantitative Gigajoules (GJ), percentage (%)
CDP Climate Change Information Request CC11.2, CC11.3, CC3.1d CDSB Climate Change Reporting Framework 4.31.f GRI G4 Aspect: Energy (EN3)
Total water withdrawn, percentage recycled, percentage in regions with High or Extremely High Baseline Water Stress
Quantitative Cubic Meters
(m3), Percentage (%)
CDP Water Information Request W1.2a, 1.2b, 1.2c CDSB Framework REQ-04 Sources of environmental impacts GRI G4 Aspect: Water (EN8, EN9, EN10) WBCSD Global Water Tool (GWT) CEO Water Mandate – Section 3 Company Water Profile Additional Source(s): WRI Aqueduct (provides definitions of water stress); Alliance for Water Stewardship Standard Version 1.0
Ecosystem Protection & Climate Adaptation
Number of lodging facilities located in FEMA Special Flood Hazard Areas or foreign equivalent
Quantitative Number
n/a Additional Source(s): FEMA Special Flood Hazard Areas
Description of environmental management policies and practices to preserve ecosystem services
Discussion and Analysis
n/a
CDSB Framework REQ-01 Management’s environmental policies, strategy and targets GRI G4 Aspect: Biodiversity (EN12)
Cable & Satellite
Topic and Climate Risk Metric Category Unit of
Measure Source / Alignment
Infrastructure Energy Use & Fleet Fuel Consumption
Operational energy consumed, percentage grid electricity, percentage renewable Quantitative Gigajoules,
Percentage (%)
CDP Climate Change Information Request CC11.2, CC11.3, CC3.1d CDSB Climate Change Reporting Framework 4.31.f GRI G4 Aspect: Energy (EN3)
Fleet fuel consumed, percentage renewable
Quantitative Gigajoules,
Percentage (%)
CDP Climate Change Information Request CC11.2, CC11.3, CC3.1d CDSB Climate Change Reporting Framework 4.31.f GRI G4 Aspect: Energy (EN3) Additional Source(s): EPA SmartWay
Table 3i: Services
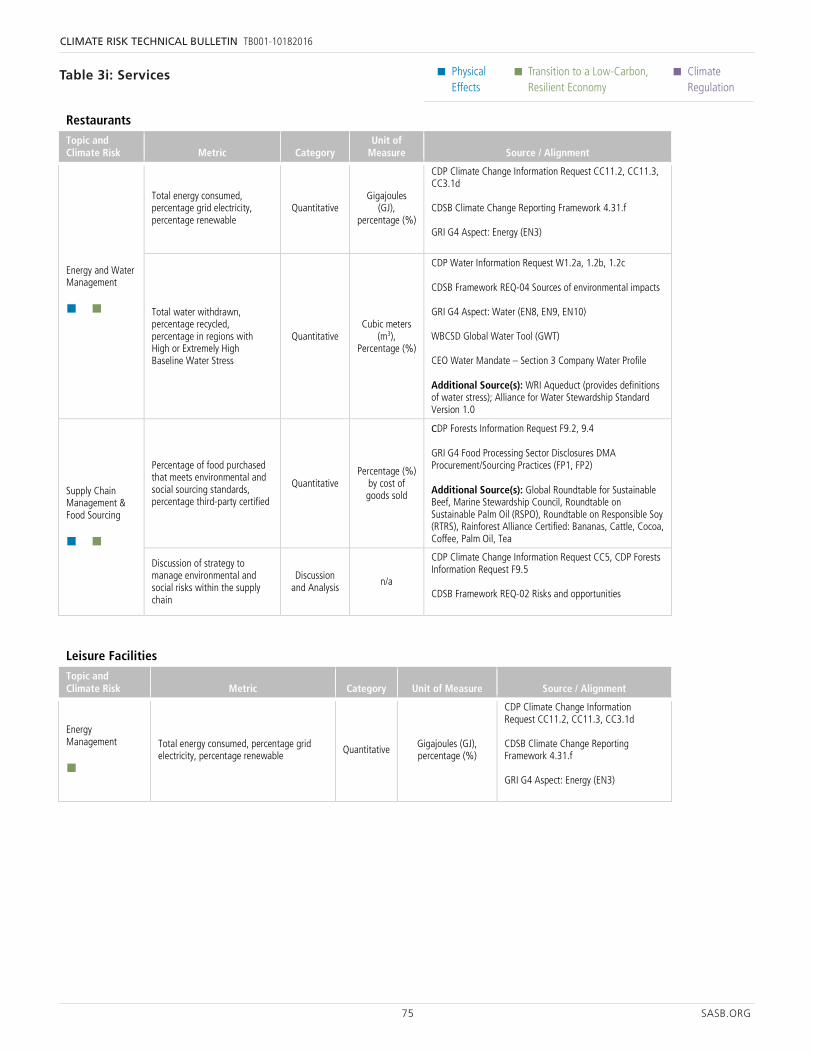
75 SASB.ORG
CLIMATE RISK TECHNICAL BULLETIN TB001-10182016
• Physical Effects
• Transition to a Low-Carbon, Resilient Economy
• Climate Regulation
41 SASB.ORG
Physical Effects
Transition to a Low-Carbon, Resilient Economy
Climate Regulation
Restaurants Topic and Climate Risk Metric Category
Unit of Measure Source / Alignment
Energy and Water Management
Total energy consumed, percentage grid electricity, percentage renewable
Quantitative Gigajoules
(GJ), percentage (%)
CDP Climate Change Information Request CC11.2, CC11.3, CC3.1d CDSB Climate Change Reporting Framework 4.31.f GRI G4 Aspect: Energy (EN3)
Total water withdrawn, percentage recycled, percentage in regions with High or Extremely High Baseline Water Stress
Quantitative Cubic meters
(m3), Percentage (%)
CDP Water Information Request W1.2a, 1.2b, 1.2c CDSB Framework REQ-04 Sources of environmental impacts GRI G4 Aspect: Water (EN8, EN9, EN10) WBCSD Global Water Tool (GWT) CEO Water Mandate – Section 3 Company Water Profile Additional Source(s): WRI Aqueduct (provides definitions of water stress); Alliance for Water Stewardship Standard Version 1.0
Supply Chain Management & Food Sourcing
Percentage of food purchased that meets environmental and social sourcing standards, percentage third-party certified
Quantitative Percentage (%)
by cost of goods sold
CDP Forests Information Request F9.2, 9.4 GRI G4 Food Processing Sector Disclosures DMA Procurement/Sourcing Practices (FP1, FP2) Additional Source(s): Global Roundtable for Sustainable Beef, Marine Stewardship Council, Roundtable on Sustainable Palm Oil (RSPO), Roundtable on Responsible Soy (RTRS), Rainforest Alliance Certified: Bananas, Cattle, Cocoa, Coffee, Palm Oil, Tea
Discussion of strategy to manage environmental and social risks within the supply chain
Discussion and Analysis n/a
CDP Climate Change Information Request CC5, CDP Forests Information Request F9.5 CDSB Framework REQ-02 Risks and opportunities
Leisure Facilities Topic and Climate Risk Metric Category Unit of Measure Source / Alignment
Energy Management
Total energy consumed, percentage grid electricity, percentage renewable Quantitative Gigajoules (GJ),
percentage (%)
CDP Climate Change Information Request CC11.2, CC11.3, CC3.1d CDSB Climate Change Reporting Framework 4.31.f GRI G4 Aspect: Energy (EN3)
Cruise Lines Topic and Climate Risk Metric Category
Unit of Measure Source / Alignment
Fuel Use & Air Emissions
Gross global Scope 1 emissions Quantitative Metric tons CO2-e
CDP Climate Change Information Request CC8.2 Emissions Data, CC8.5 Data Accuracy CDSB Framework REQ-04 Sources of
Table 3i: Services
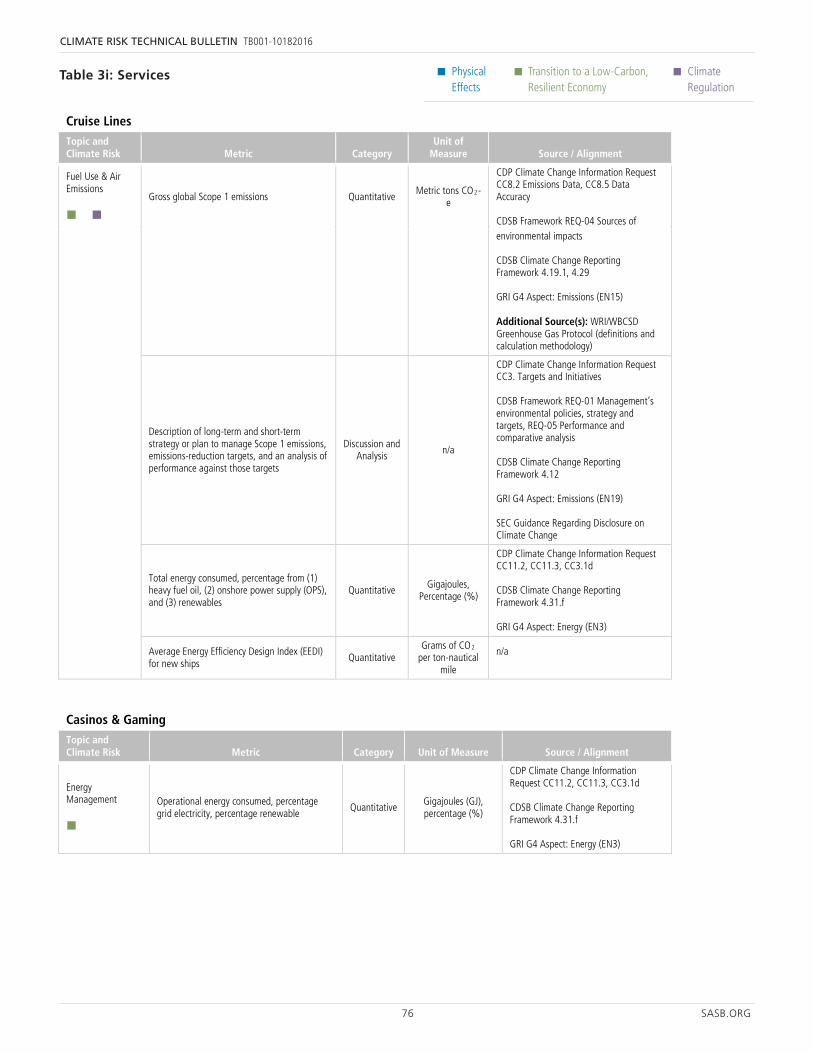
76 SASB.ORG
CLIMATE RISK TECHNICAL BULLETIN TB001-10182016
• Physical Effects
• Transition to a Low-Carbon, Resilient Economy
• Climate Regulation
41 SASB.ORG
Physical Effects
Transition to a Low-Carbon, Resilient Economy
Climate Regulation
Restaurants Topic and Climate Risk Metric Category
Unit of Measure Source / Alignment
Energy and Water Management
Total energy consumed, percentage grid electricity, percentage renewable
Quantitative Gigajoules
(GJ), percentage (%)
CDP Climate Change Information Request CC11.2, CC11.3, CC3.1d CDSB Climate Change Reporting Framework 4.31.f GRI G4 Aspect: Energy (EN3)
Total water withdrawn, percentage recycled, percentage in regions with High or Extremely High Baseline Water Stress
Quantitative Cubic meters
(m3), Percentage (%)
CDP Water Information Request W1.2a, 1.2b, 1.2c CDSB Framework REQ-04 Sources of environmental impacts GRI G4 Aspect: Water (EN8, EN9, EN10) WBCSD Global Water Tool (GWT) CEO Water Mandate – Section 3 Company Water Profile Additional Source(s): WRI Aqueduct (provides definitions of water stress); Alliance for Water Stewardship Standard Version 1.0
Supply Chain Management & Food Sourcing
Percentage of food purchased that meets environmental and social sourcing standards, percentage third-party certified
Quantitative Percentage (%)
by cost of goods sold
CDP Forests Information Request F9.2, 9.4 GRI G4 Food Processing Sector Disclosures DMA Procurement/Sourcing Practices (FP1, FP2) Additional Source(s): Global Roundtable for Sustainable Beef, Marine Stewardship Council, Roundtable on Sustainable Palm Oil (RSPO), Roundtable on Responsible Soy (RTRS), Rainforest Alliance Certified: Bananas, Cattle, Cocoa, Coffee, Palm Oil, Tea
Discussion of strategy to manage environmental and social risks within the supply chain
Discussion and Analysis n/a
CDP Climate Change Information Request CC5, CDP Forests Information Request F9.5 CDSB Framework REQ-02 Risks and opportunities
Leisure Facilities Topic and Climate Risk Metric Category Unit of Measure Source / Alignment
Energy Management
Total energy consumed, percentage grid electricity, percentage renewable Quantitative Gigajoules (GJ),
percentage (%)
CDP Climate Change Information Request CC11.2, CC11.3, CC3.1d CDSB Climate Change Reporting Framework 4.31.f GRI G4 Aspect: Energy (EN3)
Cruise Lines Topic and Climate Risk Metric Category
Unit of Measure Source / Alignment
Fuel Use & Air Emissions
Gross global Scope 1 emissions Quantitative Metric tons CO2-e
CDP Climate Change Information Request CC8.2 Emissions Data, CC8.5 Data Accuracy CDSB Framework REQ-04 Sources of
42 SASB.ORG
Physical Effects
Transition to a Low-Carbon, Resilient Economy
Climate Regulation
Cruise Lines Topic and Climate Risk Metric Category
Unit of Measure Source / Alignment
environmental impacts CDSB Climate Change Reporting Framework 4.19.1, 4.29 GRI G4 Aspect: Emissions (EN15) Additional Source(s): WRI/WBCSD Greenhouse Gas Protocol (definitions and calculation methodology)
Description of long-term and short-term strategy or plan to manage Scope 1 emissions, emissions-reduction targets, and an analysis of performance against those targets
Discussion and Analysis n/a
CDP Climate Change Information Request CC3. Targets and Initiatives CDSB Framework REQ-01 Management’s environmental policies, strategy and targets, REQ-05 Performance and comparative analysis CDSB Climate Change Reporting Framework 4.12 GRI G4 Aspect: Emissions (EN19) SEC Guidance Regarding Disclosure on Climate Change
Total energy consumed, percentage from (1) heavy fuel oil, (2) onshore power supply (OPS), and (3) renewables
Quantitative Gigajoules, Percentage (%)
CDP Climate Change Information Request CC11.2, CC11.3, CC3.1d CDSB Climate Change Reporting Framework 4.31.f GRI G4 Aspect: Energy (EN3)
Average Energy Efficiency Design Index (EEDI) for new ships
Quantitative Grams of CO2
per ton-nautical mile
n/a
Casinos & Gaming Topic and Climate Risk Metric Category Unit of Measure Source / Alignment
Energy Management
Operational energy consumed, percentage grid electricity, percentage renewable Quantitative Gigajoules (GJ),
percentage (%)
CDP Climate Change Information Request CC11.2, CC11.3, CC3.1d CDSB Climate Change Reporting Framework 4.31.f GRI G4 Aspect: Energy (EN3)
Table 3i: Services
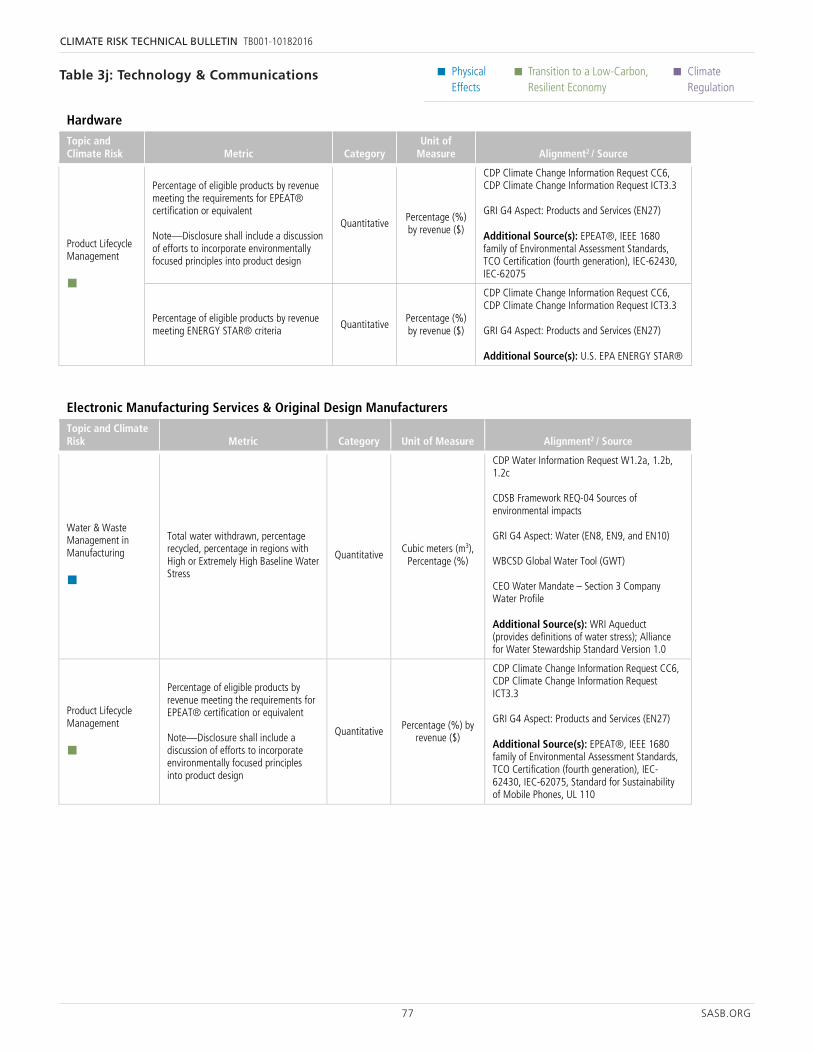
77 SASB.ORG
CLIMATE RISK TECHNICAL BULLETIN TB001-10182016
• Physical Effects
• Transition to a Low-Carbon, Resilient Economy
• Climate Regulation
26 SASB.ORG
Physical Effects
Transition to a Low-Carbon, Resilient Economy
Climate Regulation
Hardware Topic and Climate Risk Metric Category
Unit of Measure Alignment2 / Source
Product Lifecycle Management
Percentage of eligible products by revenue meeting the requirements for EPEAT® certification or equivalent Note—Disclosure shall include a discussion of efforts to incorporate environmentally focused principles into product design
Quantitative Percentage (%) by revenue ($)
CDP Climate Change Information Request CC6, CDP Climate Change Information Request ICT3.3 GRI G4 Aspect: Products and Services (EN27) Additional Source(s): EPEAT®, IEEE 1680 family of Environmental Assessment Standards, TCO Certification (fourth generation), IEC-62430, IEC-62075
Percentage of eligible products by revenue meeting ENERGY STAR® criteria
Quantitative Percentage (%) by revenue ($)
CDP Climate Change Information Request CC6, CDP Climate Change Information Request ICT3.3 GRI G4 Aspect: Products and Services (EN27) Additional Source(s): U.S. EPA ENERGY STAR®
Electronic Manufacturing Services & Original Design Manufacturers Topic and Climate Risk Metric Category Unit of Measure Alignment2 / Source
Water & Waste Management in Manufacturing
Total water withdrawn, percentage recycled, percentage in regions with High or Extremely High Baseline Water Stress
Quantitative Cubic meters (m3),
Percentage (%)
CDP Water Information Request W1.2a, 1.2b, 1.2c CDSB Framework REQ-04 Sources of environmental impacts GRI G4 Aspect: Water (EN8, EN9, and EN10) WBCSD Global Water Tool (GWT) CEO Water Mandate – Section 3 Company Water Profile Additional Source(s): WRI Aqueduct (provides definitions of water stress); Alliance for Water Stewardship Standard Version 1.0
Product Lifecycle Management
Percentage of eligible products by revenue meeting the requirements for EPEAT® certification or equivalent Note—Disclosure shall include a discussion of efforts to incorporate environmentally focused principles into product design
Quantitative Percentage (%) by revenue ($)
CDP Climate Change Information Request CC6, CDP Climate Change Information Request ICT3.3 GRI G4 Aspect: Products and Services (EN27) Additional Source(s): EPEAT®, IEEE 1680 family of Environmental Assessment Standards, TCO Certification (fourth generation), IEC-62430, IEC-62075, Standard for Sustainability of Mobile Phones, UL 110
Internet Media & Services Topic and Climate Risk Metric Category
Unit of Measure Alignment2 / Source
Environmental Footprint of Hardware Infrastructure
Total energy consumed, percentage grid electricity, percentage renewable energy
Quantitative Gigajoules, Percentage
(%)
CDP Climate Change Information Request CC11.2, CC11.3, CC3.1d Climate Change Reporting Framework 4.31.f GRI G4 Aspect: Energy (EN3)
Table 3j: Technology & Communications
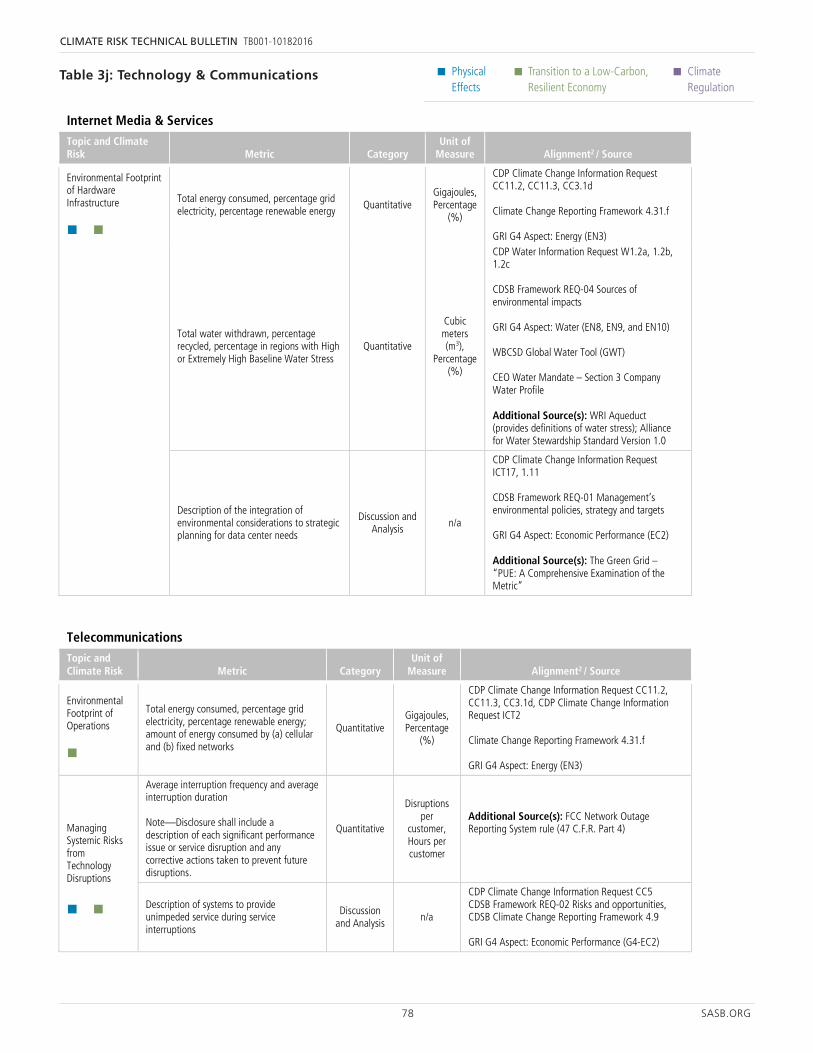
78 SASB.ORG
CLIMATE RISK TECHNICAL BULLETIN TB001-10182016
• Physical Effects
• Transition to a Low-Carbon, Resilient Economy
• Climate Regulation
26 SASB.ORG
Physical Effects
Transition to a Low-Carbon, Resilient Economy
Climate Regulation
Hardware Topic and Climate Risk Metric Category
Unit of Measure Alignment2 / Source
Product Lifecycle Management
Percentage of eligible products by revenue meeting the requirements for EPEAT® certification or equivalent Note—Disclosure shall include a discussion of efforts to incorporate environmentally focused principles into product design
Quantitative Percentage (%) by revenue ($)
CDP Climate Change Information Request CC6, CDP Climate Change Information Request ICT3.3 GRI G4 Aspect: Products and Services (EN27) Additional Source(s): EPEAT®, IEEE 1680 family of Environmental Assessment Standards, TCO Certification (fourth generation), IEC-62430, IEC-62075
Percentage of eligible products by revenue meeting ENERGY STAR® criteria
Quantitative Percentage (%) by revenue ($)
CDP Climate Change Information Request CC6, CDP Climate Change Information Request ICT3.3 GRI G4 Aspect: Products and Services (EN27) Additional Source(s): U.S. EPA ENERGY STAR®
Electronic Manufacturing Services & Original Design Manufacturers Topic and Climate Risk Metric Category Unit of Measure Alignment2 / Source
Water & Waste Management in Manufacturing
Total water withdrawn, percentage recycled, percentage in regions with High or Extremely High Baseline Water Stress
Quantitative Cubic meters (m3),
Percentage (%)
CDP Water Information Request W1.2a, 1.2b, 1.2c CDSB Framework REQ-04 Sources of environmental impacts GRI G4 Aspect: Water (EN8, EN9, and EN10) WBCSD Global Water Tool (GWT) CEO Water Mandate – Section 3 Company Water Profile Additional Source(s): WRI Aqueduct (provides definitions of water stress); Alliance for Water Stewardship Standard Version 1.0
Product Lifecycle Management
Percentage of eligible products by revenue meeting the requirements for EPEAT® certification or equivalent Note—Disclosure shall include a discussion of efforts to incorporate environmentally focused principles into product design
Quantitative Percentage (%) by revenue ($)
CDP Climate Change Information Request CC6, CDP Climate Change Information Request ICT3.3 GRI G4 Aspect: Products and Services (EN27) Additional Source(s): EPEAT®, IEEE 1680 family of Environmental Assessment Standards, TCO Certification (fourth generation), IEC-62430, IEC-62075, Standard for Sustainability of Mobile Phones, UL 110
Internet Media & Services Topic and Climate Risk Metric Category
Unit of Measure Alignment2 / Source
Environmental Footprint of Hardware Infrastructure
Total energy consumed, percentage grid electricity, percentage renewable energy
Quantitative Gigajoules, Percentage
(%)
CDP Climate Change Information Request CC11.2, CC11.3, CC3.1d Climate Change Reporting Framework 4.31.f GRI G4 Aspect: Energy (EN3)
27 SASB.ORG
Physical Effects
Transition to a Low-Carbon, Resilient Economy
Climate Regulation
Internet Media & Services Topic and Climate Risk Metric Category
Unit of Measure Alignment2 / Source
Total water withdrawn, percentage recycled, percentage in regions with High or Extremely High Baseline Water Stress
Quantitative
Cubic meters (m3),
Percentage (%)
CDP Water Information Request W1.2a, 1.2b, 1.2c CDSB Framework REQ-04 Sources of environmental impacts GRI G4 Aspect: Water (EN8, EN9, and EN10) WBCSD Global Water Tool (GWT) CEO Water Mandate – Section 3 Company Water Profile Additional Source(s): WRI Aqueduct (provides definitions of water stress); Alliance for Water Stewardship Standard Version 1.0
Description of the integration of environmental considerations to strategic planning for data center needs
Discussion and Analysis n/a
CDP Climate Change Information Request ICT17, 1.11 CDSB Framework REQ-01 Management’s environmental policies, strategy and targets GRI G4 Aspect: Economic Performance (EC2) Additional Source(s): The Green Grid – “PUE: A Comprehensive Examination of the Metric”
Telecommunications Topic and Climate Risk Metric Category
Unit of Measure Alignment2 / Source
Environmental Footprint of Operations
Total energy consumed, percentage grid electricity, percentage renewable energy; amount of energy consumed by (a) cellular and (b) fixed networks
Quantitative Gigajoules, Percentage
(%)
CDP Climate Change Information Request CC11.2, CC11.3, CC3.1d, CDP Climate Change Information Request ICT2 Climate Change Reporting Framework 4.31.f GRI G4 Aspect: Energy (EN3)
Managing Systemic Risks from Technology Disruptions
Average interruption frequency and average interruption duration Note—Disclosure shall include a description of each significant performance issue or service disruption and any corrective actions taken to prevent future disruptions.
Quantitative
Disruptions per
customer, Hours per customer
Additional Source(s): FCC Network Outage Reporting System rule (47 C.F.R. Part 4)
Description of systems to provide unimpeded service during service interruptions
Discussion and Analysis
n/a
CDP Climate Change Information Request CC5 CDSB Framework REQ-02 Risks and opportunities, CDSB Climate Change Reporting Framework 4.9 GRI G4 Aspect: Economic Performance (G4-EC2)
Table 3j: Technology & Communications
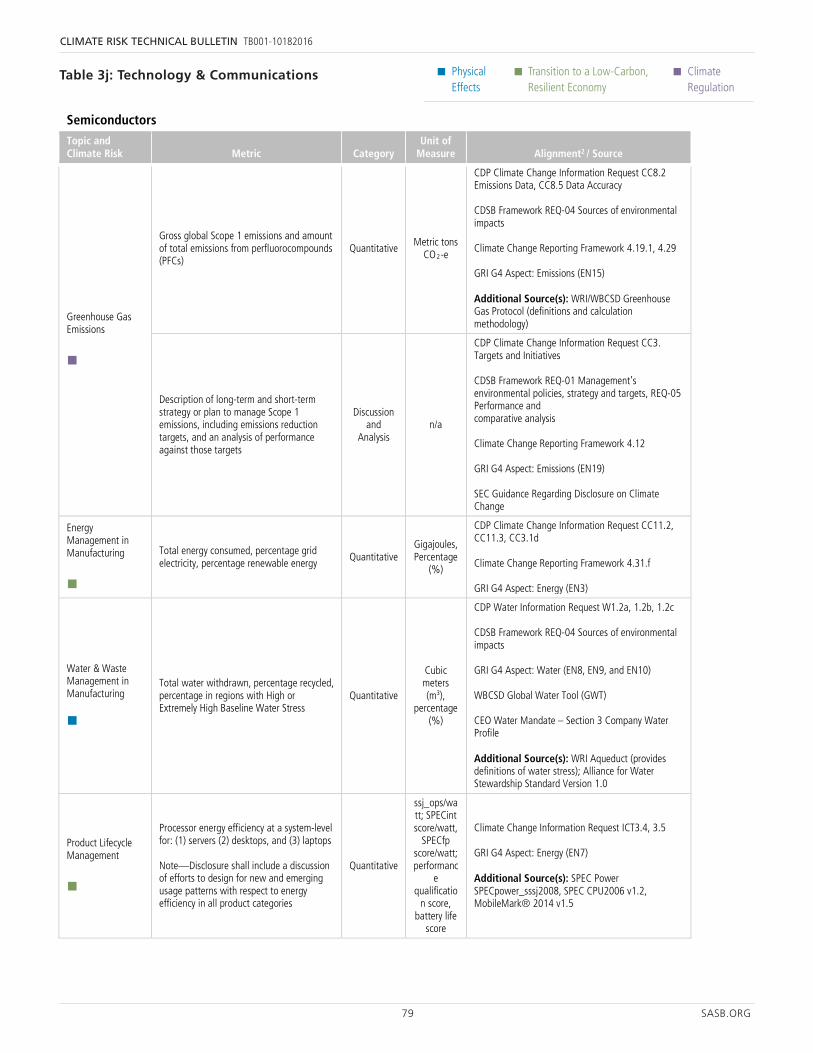
79 SASB.ORG
CLIMATE RISK TECHNICAL BULLETIN TB001-10182016
• Physical Effects
• Transition to a Low-Carbon, Resilient Economy
• Climate Regulation
28 SASB.ORG
Physical Effects
Transition to a Low-Carbon, Resilient Economy
Climate Regulation
Semiconductors Topic and Climate Risk Metric Category
Unit of Measure Alignment2 / Source
Greenhouse Gas Emissions
Gross global Scope 1 emissions and amount of total emissions from perfluorocompounds (PFCs)
Quantitative Metric tons
CO2-e
CDP Climate Change Information Request CC8.2 Emissions Data, CC8.5 Data Accuracy CDSB Framework REQ-04 Sources of environmental impacts Climate Change Reporting Framework 4.19.1, 4.29 GRI G4 Aspect: Emissions (EN15) Additional Source(s): WRI/WBCSD Greenhouse Gas Protocol (definitions and calculation methodology)
Description of long-term and short-term strategy or plan to manage Scope 1 emissions, including emissions reduction targets, and an analysis of performance against those targets
Discussion and
Analysis n/a
CDP Climate Change Information Request CC3. Targets and Initiatives CDSB Framework REQ-01 Management’s environmental policies, strategy and targets, REQ-05 Performance and comparative analysis Climate Change Reporting Framework 4.12 GRI G4 Aspect: Emissions (EN19) SEC Guidance Regarding Disclosure on Climate Change
Energy Management in Manufacturing
Total energy consumed, percentage grid electricity, percentage renewable energy
Quantitative Gigajoules, Percentage
(%)
CDP Climate Change Information Request CC11.2, CC11.3, CC3.1d Climate Change Reporting Framework 4.31.f GRI G4 Aspect: Energy (EN3)
Water & Waste Management in Manufacturing
Total water withdrawn, percentage recycled, percentage in regions with High or Extremely High Baseline Water Stress
Quantitative
Cubic meters (m3),
percentage (%)
CDP Water Information Request W1.2a, 1.2b, 1.2c CDSB Framework REQ-04 Sources of environmental impacts GRI G4 Aspect: Water (EN8, EN9, and EN10) WBCSD Global Water Tool (GWT) CEO Water Mandate – Section 3 Company Water Profile Additional Source(s): WRI Aqueduct (provides definitions of water stress); Alliance for Water Stewardship Standard Version 1.0
Product Lifecycle Management
Processor energy efficiency at a system-level for: (1) servers (2) desktops, and (3) laptops Note—Disclosure shall include a discussion of efforts to design for new and emerging usage patterns with respect to energy efficiency in all product categories
Quantitative
ssj_ops/watt; SPECint score/watt,
SPECfp score/watt; performanc
e qualificatio
n score, battery life
score
Climate Change Information Request ICT3.4, 3.5 GRI G4 Aspect: Energy (EN7) Additional Source(s): SPEC Power SPECpower_sssj2008, SPEC CPU2006 v1.2, MobileMark® 2014 v1.5
Table 3j: Technology & Communications
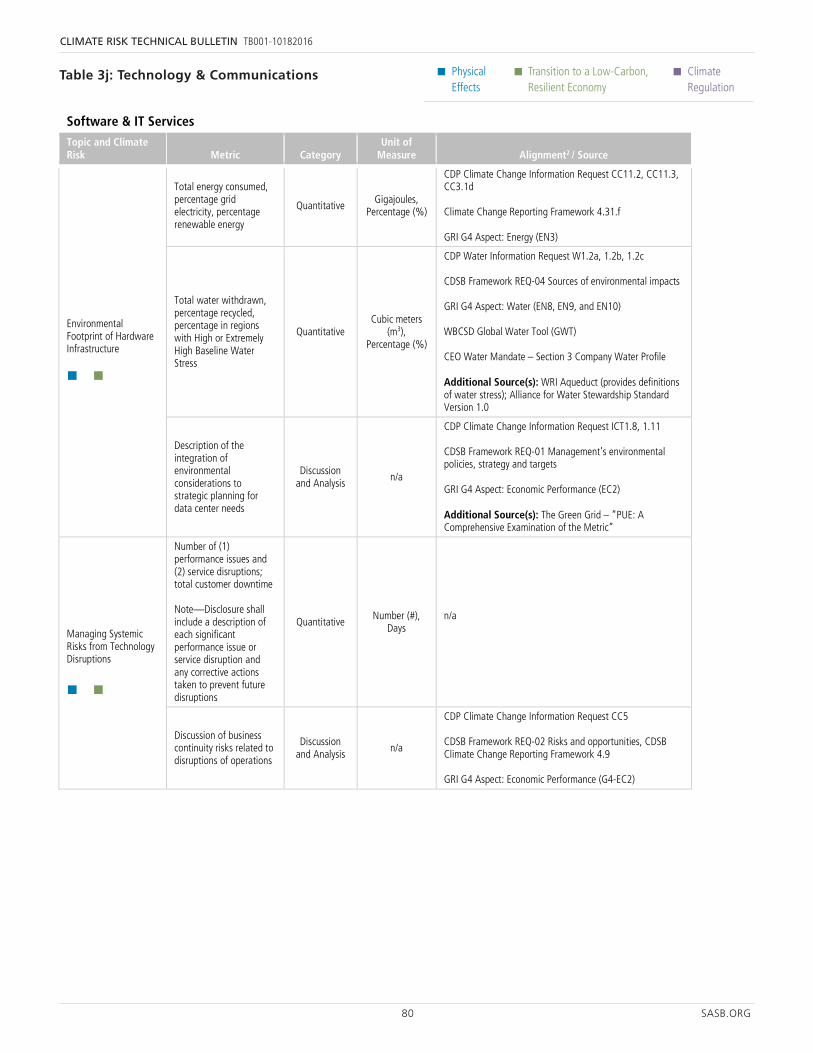
80 SASB.ORG
CLIMATE RISK TECHNICAL BULLETIN TB001-10182016
• Physical Effects
• Transition to a Low-Carbon, Resilient Economy
• Climate Regulation
29 SASB.ORG
Physical Effects
Transition to a Low-Carbon, Resilient Economy
Climate Regulation
Software & IT Services Topic and Climate Risk Metric Category
Unit of Measure Alignment2 / Source
Environmental Footprint of Hardware Infrastructure
Total energy consumed, percentage grid electricity, percentage renewable energy
Quantitative Gigajoules,
Percentage (%)
CDP Climate Change Information Request CC11.2, CC11.3, CC3.1d Climate Change Reporting Framework 4.31.f GRI G4 Aspect: Energy (EN3)
Total water withdrawn, percentage recycled, percentage in regions with High or Extremely High Baseline Water Stress
Quantitative Cubic meters
(m3), Percentage (%)
CDP Water Information Request W1.2a, 1.2b, 1.2c CDSB Framework REQ-04 Sources of environmental impacts GRI G4 Aspect: Water (EN8, EN9, and EN10) WBCSD Global Water Tool (GWT) CEO Water Mandate – Section 3 Company Water Profile Additional Source(s): WRI Aqueduct (provides definitions of water stress); Alliance for Water Stewardship Standard Version 1.0
Description of the integration of environmental considerations to strategic planning for data center needs
Discussion and Analysis
n/a
CDP Climate Change Information Request ICT1.8, 1.11 CDSB Framework REQ-01 Management’s environmental policies, strategy and targets GRI G4 Aspect: Economic Performance (EC2) Additional Source(s): The Green Grid – “PUE: A Comprehensive Examination of the Metric”
Managing Systemic Risks from Technology Disruptions
Number of (1) performance issues and (2) service disruptions; total customer downtime Note—Disclosure shall include a description of each significant performance issue or service disruption and any corrective actions taken to prevent future disruptions
Quantitative Number (#),
Days n/a
Discussion of business continuity risks related to disruptions of operations
Discussion and Analysis
n/a
CDP Climate Change Information Request CC5 CDSB Framework REQ-02 Risks and opportunities, CDSB Climate Change Reporting Framework 4.9 GRI G4 Aspect: Economic Performance (G4-EC2)
Table 3j: Technology & Communications
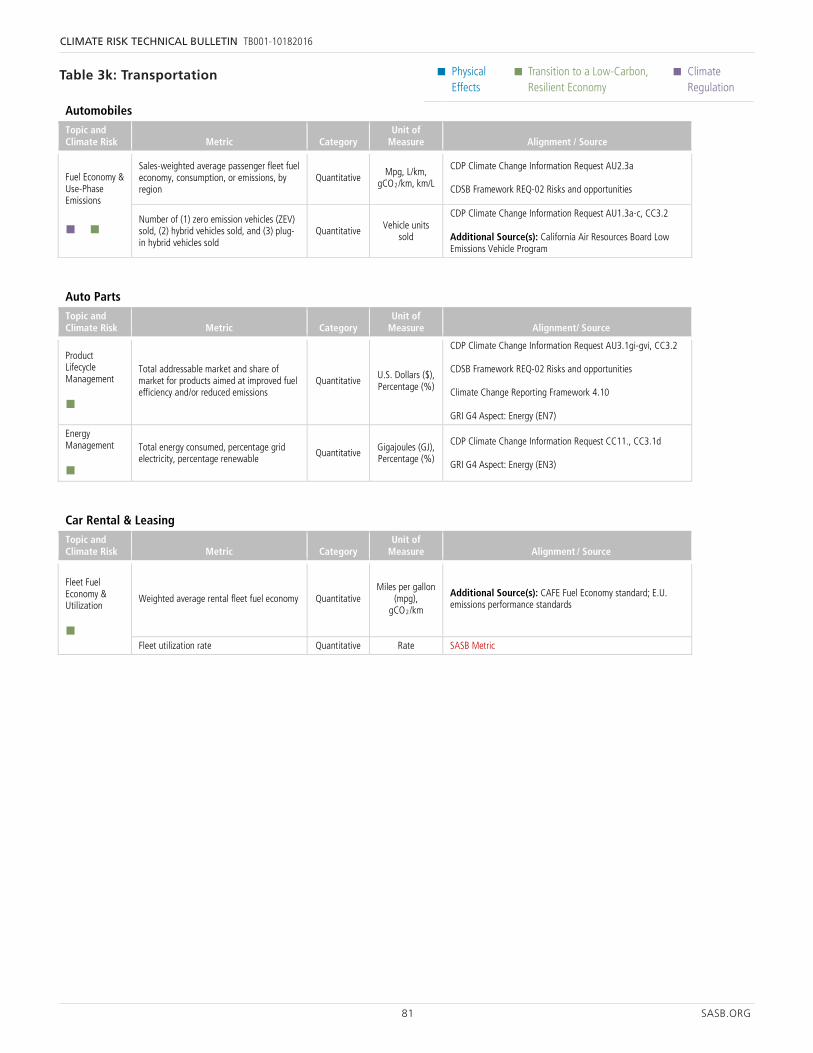
81 SASB.ORG
CLIMATE RISK TECHNICAL BULLETIN TB001-10182016
• Physical Effects
• Transition to a Low-Carbon, Resilient Economy
• Climate Regulation
36 SASB.ORG
Physical Effects
Transition to a Low-Carbon, Resilient Economy
Climate Regulation
Automobiles Topic and Climate Risk Metric Category
Unit of Measure Alignment / Source
Fuel Economy & Use-Phase Emissions
Sales-weighted average passenger fleet fuel economy, consumption, or emissions, by region
Quantitative Mpg, L/km,
gCO2/km, km/L
CDP Climate Change Information Request AU2.3a CDSB Framework REQ-02 Risks and opportunities
Number of (1) zero emission vehicles (ZEV) sold, (2) hybrid vehicles sold, and (3) plug-in hybrid vehicles sold
Quantitative Vehicle units sold
CDP Climate Change Information Request AU1.3a-c, CC3.2 Additional Source(s): California Air Resources Board Low Emissions Vehicle Program
Auto Parts Topic and Climate Risk Metric Category
Unit of Measure Alignment/ Source
Product Lifecycle Management
Total addressable market and share of market for products aimed at improved fuel efficiency and/or reduced emissions
Quantitative U.S. Dollars ($), Percentage (%)
CDP Climate Change Information Request AU3.1gi-gvi, CC3.2 CDSB Framework REQ-02 Risks and opportunities Climate Change Reporting Framework 4.10 GRI G4 Aspect: Energy (EN7)
Energy Management
Total energy consumed, percentage grid electricity, percentage renewable
Quantitative Gigajoules (GJ), Percentage (%)
CDP Climate Change Information Request CC11., CC3.1d GRI G4 Aspect: Energy (EN3)
Car Rental & Leasing Topic and Climate Risk Metric Category
Unit of Measure Alignment / Source
Fleet Fuel Economy & Utilization
Weighted average rental fleet fuel economy Quantitative Miles per gallon
(mpg), gCO2/km
Additional Source(s): CAFE Fuel Economy standard; E.U. emissions performance standards
Fleet utilization rate Quantitative Rate SASB Metric
Airlines Topic and Climate Risk Metric Category
Unit of Measure Alignment / Source
Environmental Footprint of Fuel Use
Gross global Scope 1 emissions Quantitative Metric tons CO2-e
CDP Climate Change Information Request CC8.2 Emissions Data, CC8.5 Data Accuracy CDSB Framework REQ-04 Sources of environmental impacts Climate Change Reporting Framework 4.19.1, 4.29 GRI G4 Aspect: Emissions (EN15) Additional Source(s): WRI/WBCSD Greenhouse Gas Protocol (definitions and calculation methodology)
Description of long-term and short-term strategy or plan to manage Scope 1 emissions, emissions reduction targets, and
Discussion and Analysis
n/a CDP Climate Change Information Request CC3. Targets and Initiatives
Table 3k: Transportation
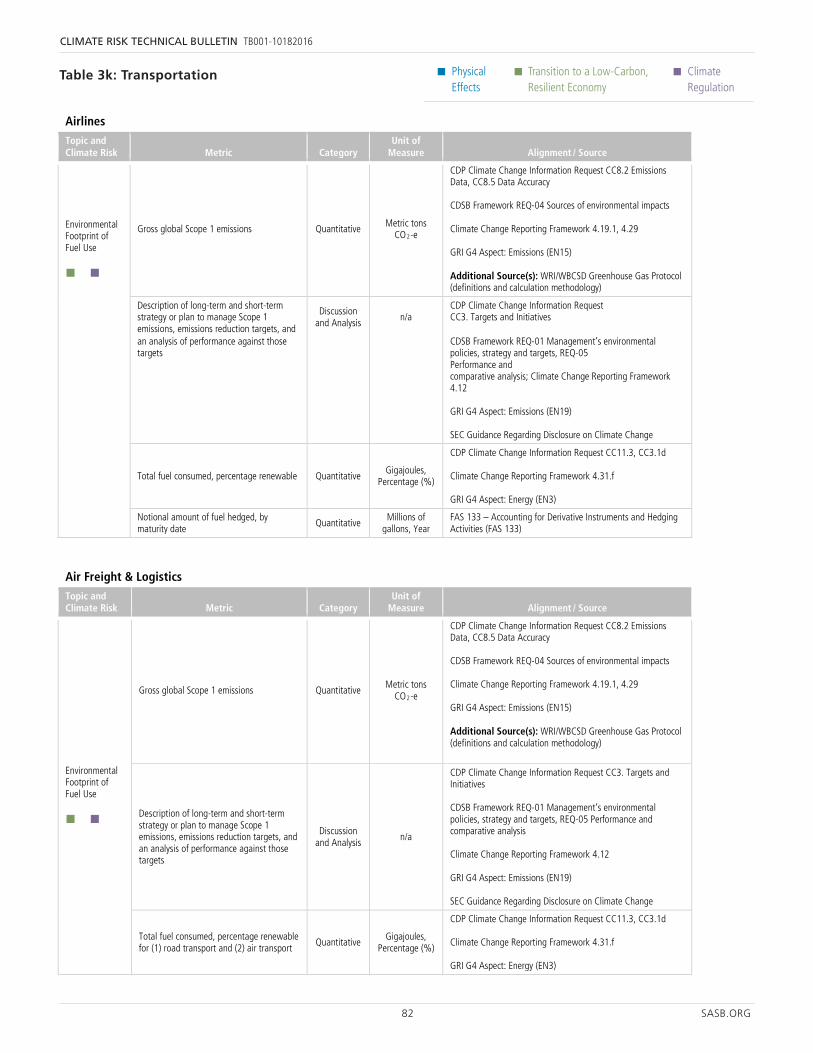
82 SASB.ORG
CLIMATE RISK TECHNICAL BULLETIN TB001-10182016
• Physical Effects
• Transition to a Low-Carbon, Resilient Economy
• Climate Regulation
37 SASB.ORG
Physical Effects
Transition to a Low-Carbon, Resilient Economy
Climate Regulation
Airlines Topic and Climate Risk Metric Category
Unit of Measure Alignment / Source
an analysis of performance against those targets
CDSB Framework REQ-01 Management’s environmental policies, strategy and targets, REQ-05 Performance and comparative analysis; Climate Change Reporting Framework 4.12 GRI G4 Aspect: Emissions (EN19) SEC Guidance Regarding Disclosure on Climate Change
Total fuel consumed, percentage renewable Quantitative Gigajoules,
Percentage (%)
CDP Climate Change Information Request CC11.3, CC3.1d Climate Change Reporting Framework 4.31.f GRI G4 Aspect: Energy (EN3)
Notional amount of fuel hedged, by maturity date
Quantitative Millions of
gallons, Year FAS 133 – Accounting for Derivative Instruments and Hedging Activities (FAS 133)
Air Freight & Logistics Topic and Climate Risk Metric Category
Unit of Measure Alignment / Source
Environmental Footprint of Fuel Use
Gross global Scope 1 emissions Quantitative Metric tons
CO2-e
CDP Climate Change Information Request CC8.2 Emissions Data, CC8.5 Data Accuracy CDSB Framework REQ-04 Sources of environmental impacts Climate Change Reporting Framework 4.19.1, 4.29 GRI G4 Aspect: Emissions (EN15) Additional Source(s): WRI/WBCSD Greenhouse Gas Protocol (definitions and calculation methodology)
Description of long-term and short-term strategy or plan to manage Scope 1 emissions, emissions reduction targets, and an analysis of performance against those targets
Discussion and Analysis
n/a
CDP Climate Change Information Request CC3. Targets and Initiatives CDSB Framework REQ-01 Management’s environmental policies, strategy and targets, REQ-05 Performance and comparative analysis Climate Change Reporting Framework 4.12 GRI G4 Aspect: Emissions (EN19) SEC Guidance Regarding Disclosure on Climate Change
Total fuel consumed, percentage renewable for (1) road transport and (2) air transport
Quantitative Gigajoules,
Percentage (%)
CDP Climate Change Information Request CC11.3, CC3.1d Climate Change Reporting Framework 4.31.f GRI G4 Aspect: Energy (EN3)
Supply Chain Management
Complete greenhouse gas footprint across transport modes
Quantitative Metric tons
CO2-e per ton-kilometer
CDP Climate Change Information Request CC8.2 Emissions Data, CC8.5 Data Accuracy CDSB Framework REQ-04 Sources of environmental impacts Climate Change Reporting Framework 4.19.1, 4.29 GRI G4 Aspect: Emissions (EN15, EN17)
36 SASB.ORG
Physical Effects
Transition to a Low-Carbon, Resilient Economy
Climate Regulation
Automobiles Topic and Climate Risk Metric Category
Unit of Measure Alignment / Source
Fuel Economy & Use-Phase Emissions
Sales-weighted average passenger fleet fuel economy, consumption, or emissions, by region
Quantitative Mpg, L/km,
gCO2/km, km/L
CDP Climate Change Information Request AU2.3a CDSB Framework REQ-02 Risks and opportunities
Number of (1) zero emission vehicles (ZEV) sold, (2) hybrid vehicles sold, and (3) plug-in hybrid vehicles sold
Quantitative Vehicle units sold
CDP Climate Change Information Request AU1.3a-c, CC3.2 Additional Source(s): California Air Resources Board Low Emissions Vehicle Program
Auto Parts Topic and Climate Risk Metric Category
Unit of Measure Alignment/ Source
Product Lifecycle Management
Total addressable market and share of market for products aimed at improved fuel efficiency and/or reduced emissions
Quantitative U.S. Dollars ($), Percentage (%)
CDP Climate Change Information Request AU3.1gi-gvi, CC3.2 CDSB Framework REQ-02 Risks and opportunities Climate Change Reporting Framework 4.10 GRI G4 Aspect: Energy (EN7)
Energy Management
Total energy consumed, percentage grid electricity, percentage renewable
Quantitative Gigajoules (GJ), Percentage (%)
CDP Climate Change Information Request CC11., CC3.1d GRI G4 Aspect: Energy (EN3)
Car Rental & Leasing Topic and Climate Risk Metric Category
Unit of Measure Alignment / Source
Fleet Fuel Economy & Utilization
Weighted average rental fleet fuel economy Quantitative Miles per gallon
(mpg), gCO2/km
Additional Source(s): CAFE Fuel Economy standard; E.U. emissions performance standards
Fleet utilization rate Quantitative Rate SASB Metric
Airlines Topic and Climate Risk Metric Category
Unit of Measure Alignment / Source
Environmental Footprint of Fuel Use
Gross global Scope 1 emissions Quantitative Metric tons CO2-e
CDP Climate Change Information Request CC8.2 Emissions Data, CC8.5 Data Accuracy CDSB Framework REQ-04 Sources of environmental impacts Climate Change Reporting Framework 4.19.1, 4.29 GRI G4 Aspect: Emissions (EN15) Additional Source(s): WRI/WBCSD Greenhouse Gas Protocol (definitions and calculation methodology)
Description of long-term and short-term strategy or plan to manage Scope 1 emissions, emissions reduction targets, and
Discussion and Analysis
n/a CDP Climate Change Information Request CC3. Targets and Initiatives
Table 3k: Transportation
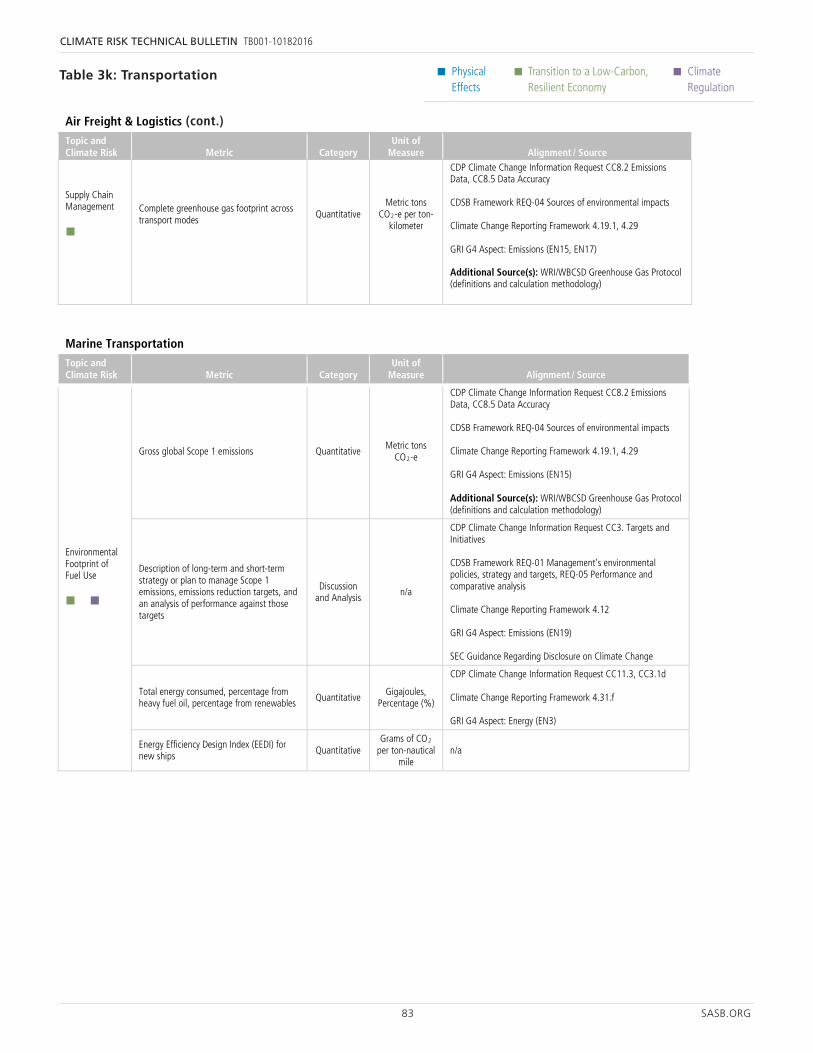
83 SASB.ORG
CLIMATE RISK TECHNICAL BULLETIN TB001-10182016
• Physical Effects
• Transition to a Low-Carbon, Resilient Economy
• Climate Regulation
37 SASB.ORG
Physical Effects
Transition to a Low-Carbon, Resilient Economy
Climate Regulation
Airlines Topic and Climate Risk Metric Category
Unit of Measure Alignment / Source
an analysis of performance against those targets
CDSB Framework REQ-01 Management’s environmental policies, strategy and targets, REQ-05 Performance and comparative analysis; Climate Change Reporting Framework 4.12 GRI G4 Aspect: Emissions (EN19) SEC Guidance Regarding Disclosure on Climate Change
Total fuel consumed, percentage renewable Quantitative Gigajoules,
Percentage (%)
CDP Climate Change Information Request CC11.3, CC3.1d Climate Change Reporting Framework 4.31.f GRI G4 Aspect: Energy (EN3)
Notional amount of fuel hedged, by maturity date
Quantitative Millions of
gallons, Year FAS 133 – Accounting for Derivative Instruments and Hedging Activities (FAS 133)
Air Freight & Logistics Topic and Climate Risk Metric Category
Unit of Measure Alignment / Source
Environmental Footprint of Fuel Use
Gross global Scope 1 emissions Quantitative Metric tons
CO2-e
CDP Climate Change Information Request CC8.2 Emissions Data, CC8.5 Data Accuracy CDSB Framework REQ-04 Sources of environmental impacts Climate Change Reporting Framework 4.19.1, 4.29 GRI G4 Aspect: Emissions (EN15) Additional Source(s): WRI/WBCSD Greenhouse Gas Protocol (definitions and calculation methodology)
Description of long-term and short-term strategy or plan to manage Scope 1 emissions, emissions reduction targets, and an analysis of performance against those targets
Discussion and Analysis
n/a
CDP Climate Change Information Request CC3. Targets and Initiatives CDSB Framework REQ-01 Management’s environmental policies, strategy and targets, REQ-05 Performance and comparative analysis Climate Change Reporting Framework 4.12 GRI G4 Aspect: Emissions (EN19) SEC Guidance Regarding Disclosure on Climate Change
Total fuel consumed, percentage renewable for (1) road transport and (2) air transport
Quantitative Gigajoules,
Percentage (%)
CDP Climate Change Information Request CC11.3, CC3.1d Climate Change Reporting Framework 4.31.f GRI G4 Aspect: Energy (EN3)
Supply Chain Management
Complete greenhouse gas footprint across transport modes
Quantitative Metric tons
CO2-e per ton-kilometer
CDP Climate Change Information Request CC8.2 Emissions Data, CC8.5 Data Accuracy CDSB Framework REQ-04 Sources of environmental impacts Climate Change Reporting Framework 4.19.1, 4.29 GRI G4 Aspect: Emissions (EN15, EN17)
38 SASB.ORG
Physical Effects
Transition to a Low-Carbon, Resilient Economy
Climate Regulation
Air Freight & Logistics Topic and Climate Risk Metric Category
Unit of Measure Alignment / Source
Additional Source(s): WRI/WBCSD Greenhouse Gas Protocol (definitions and calculation methodology)
Marine Transportation Topic and Climate Risk Metric Category
Unit of Measure Alignment / Source
Environmental Footprint of Fuel Use
Gross global Scope 1 emissions Quantitative Metric tons
CO2-e
CDP Climate Change Information Request CC8.2 Emissions Data, CC8.5 Data Accuracy CDSB Framework REQ-04 Sources of environmental impacts Climate Change Reporting Framework 4.19.1, 4.29 GRI G4 Aspect: Emissions (EN15) Additional Source(s): WRI/WBCSD Greenhouse Gas Protocol (definitions and calculation methodology)
Description of long-term and short-term strategy or plan to manage Scope 1 emissions, emissions reduction targets, and an analysis of performance against those targets
Discussion and Analysis
n/a
CDP Climate Change Information Request CC3. Targets and Initiatives CDSB Framework REQ-01 Management’s environmental policies, strategy and targets, REQ-05 Performance and comparative analysis Climate Change Reporting Framework 4.12 GRI G4 Aspect: Emissions (EN19) SEC Guidance Regarding Disclosure on Climate Change
Total energy consumed, percentage from heavy fuel oil, percentage from renewables Quantitative
Gigajoules, Percentage (%)
CDP Climate Change Information Request CC11.3, CC3.1d Climate Change Reporting Framework 4.31.f GRI G4 Aspect: Energy (EN3)
Energy Efficiency Design Index (EEDI) for new ships Quantitative
Grams of CO2 per ton-nautical
mile n/a
Road Transportation Topic and Climate Risk Metric Category
Unit of Measure Alignment / Source
Environmental Footprint of Fuel Use
Gross global Scope 1 emissions Quantitative Metric tons
CO2-e
CDP Climate Change Information Request CC8.2 Emissions Data, CC8.5 Data Accuracy CDSB Framework REQ-04 Sources of environmental impacts Climate Change Reporting Framework 4.19.1, 4.29 GRI G4 Aspect: Emissions (EN15) Additional Source(s): WRI/WBCSD Greenhouse Gas Protocol (definitions and calculation methodology)
Description of long-term and short-term strategy or plan to manage Scope 1 emissions, emissions reduction targets, and
Discussion and Analysis
n/a CDP Climate Change Information Request CC3. Targets and Initiatives
37 SASB.ORG
Physical Effects
Transition to a Low-Carbon, Resilient Economy
Climate Regulation
Airlines Topic and Climate Risk Metric Category
Unit of Measure Alignment / Source
an analysis of performance against those targets
CDSB Framework REQ-01 Management’s environmental policies, strategy and targets, REQ-05 Performance and comparative analysis; Climate Change Reporting Framework 4.12 GRI G4 Aspect: Emissions (EN19) SEC Guidance Regarding Disclosure on Climate Change
Total fuel consumed, percentage renewable Quantitative Gigajoules,
Percentage (%)
CDP Climate Change Information Request CC11.3, CC3.1d Climate Change Reporting Framework 4.31.f GRI G4 Aspect: Energy (EN3)
Notional amount of fuel hedged, by maturity date
Quantitative Millions of
gallons, Year FAS 133 – Accounting for Derivative Instruments and Hedging Activities (FAS 133)
Air Freight & Logistics Topic and Climate Risk Metric Category
Unit of Measure Alignment / Source
Environmental Footprint of Fuel Use
Gross global Scope 1 emissions Quantitative Metric tons
CO2-e
CDP Climate Change Information Request CC8.2 Emissions Data, CC8.5 Data Accuracy CDSB Framework REQ-04 Sources of environmental impacts Climate Change Reporting Framework 4.19.1, 4.29 GRI G4 Aspect: Emissions (EN15) Additional Source(s): WRI/WBCSD Greenhouse Gas Protocol (definitions and calculation methodology)
Description of long-term and short-term strategy or plan to manage Scope 1 emissions, emissions reduction targets, and an analysis of performance against those targets
Discussion and Analysis
n/a
CDP Climate Change Information Request CC3. Targets and Initiatives CDSB Framework REQ-01 Management’s environmental policies, strategy and targets, REQ-05 Performance and comparative analysis Climate Change Reporting Framework 4.12 GRI G4 Aspect: Emissions (EN19) SEC Guidance Regarding Disclosure on Climate Change
Total fuel consumed, percentage renewable for (1) road transport and (2) air transport
Quantitative Gigajoules,
Percentage (%)
CDP Climate Change Information Request CC11.3, CC3.1d Climate Change Reporting Framework 4.31.f GRI G4 Aspect: Energy (EN3)
Supply Chain Management
Complete greenhouse gas footprint across transport modes
Quantitative Metric tons
CO2-e per ton-kilometer
CDP Climate Change Information Request CC8.2 Emissions Data, CC8.5 Data Accuracy CDSB Framework REQ-04 Sources of environmental impacts Climate Change Reporting Framework 4.19.1, 4.29 GRI G4 Aspect: Emissions (EN15, EN17)
Table 3k: Transportation
(cont.)
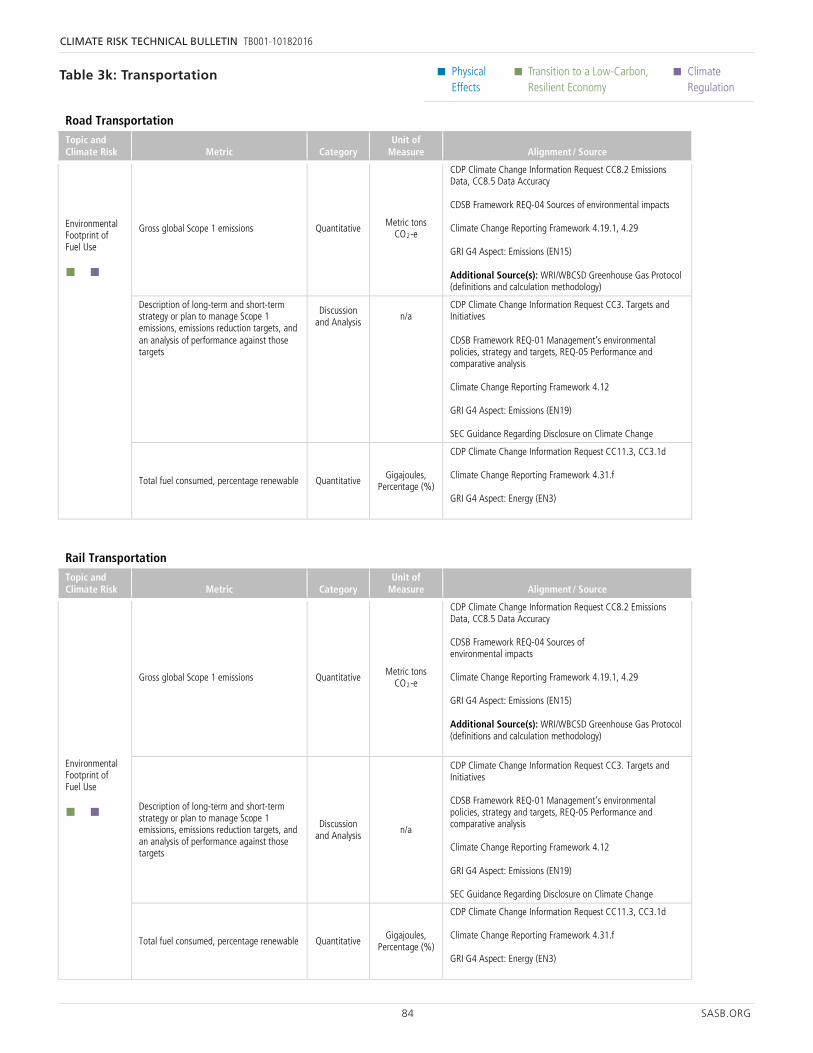
84 SASB.ORG
CLIMATE RISK TECHNICAL BULLETIN TB001-10182016
• Physical Effects
• Transition to a Low-Carbon, Resilient Economy
• Climate Regulation
39 SASB.ORG
Physical Effects
Transition to a Low-Carbon, Resilient Economy
Climate Regulation
Road Transportation Topic and Climate Risk Metric Category
Unit of Measure Alignment / Source
an analysis of performance against those targets
CDSB Framework REQ-01 Management’s environmental policies, strategy and targets, REQ-05 Performance and comparative analysis Climate Change Reporting Framework 4.12 GRI G4 Aspect: Emissions (EN19) SEC Guidance Regarding Disclosure on Climate Change
Total fuel consumed, percentage renewable Quantitative Gigajoules, Percentage (%)
CDP Climate Change Information Request CC11.3, CC3.1d Climate Change Reporting Framework 4.31.f GRI G4 Aspect: Energy (EN3)
Rail Transportation Topic and Climate Risk Metric Category
Unit of Measure Alignment / Source
Environmental Footprint of Fuel Use
Gross global Scope 1 emissions Quantitative Metric tons
CO2-e
CDP Climate Change Information Request CC8.2 Emissions Data, CC8.5 Data Accuracy CDSB Framework REQ-04 Sources of environmental impacts Climate Change Reporting Framework 4.19.1, 4.29 GRI G4 Aspect: Emissions (EN15) Additional Source(s): WRI/WBCSD Greenhouse Gas Protocol (definitions and calculation methodology)
Description of long-term and short-term strategy or plan to manage Scope 1 emissions, emissions reduction targets, and an analysis of performance against those targets
Discussion and Analysis
n/a
CDP Climate Change Information Request CC3. Targets and Initiatives CDSB Framework REQ-01 Management’s environmental policies, strategy and targets, REQ-05 Performance and comparative analysis Climate Change Reporting Framework 4.12 GRI G4 Aspect: Emissions (EN19) SEC Guidance Regarding Disclosure on Climate Change
Total fuel consumed, percentage renewable Quantitative Gigajoules,
Percentage (%)
CDP Climate Change Information Request CC11.3, CC3.1d Climate Change Reporting Framework 4.31.f GRI G4 Aspect: Energy (EN3)
38 SASB.ORG
Physical Effects
Transition to a Low-Carbon, Resilient Economy
Climate Regulation
Air Freight & Logistics Topic and Climate Risk Metric Category
Unit of Measure Alignment / Source
Additional Source(s): WRI/WBCSD Greenhouse Gas Protocol (definitions and calculation methodology)
Marine Transportation Topic and Climate Risk Metric Category
Unit of Measure Alignment / Source
Environmental Footprint of Fuel Use
Gross global Scope 1 emissions Quantitative Metric tons
CO2-e
CDP Climate Change Information Request CC8.2 Emissions Data, CC8.5 Data Accuracy CDSB Framework REQ-04 Sources of environmental impacts Climate Change Reporting Framework 4.19.1, 4.29 GRI G4 Aspect: Emissions (EN15) Additional Source(s): WRI/WBCSD Greenhouse Gas Protocol (definitions and calculation methodology)
Description of long-term and short-term strategy or plan to manage Scope 1 emissions, emissions reduction targets, and an analysis of performance against those targets
Discussion and Analysis
n/a
CDP Climate Change Information Request CC3. Targets and Initiatives CDSB Framework REQ-01 Management’s environmental policies, strategy and targets, REQ-05 Performance and comparative analysis Climate Change Reporting Framework 4.12 GRI G4 Aspect: Emissions (EN19) SEC Guidance Regarding Disclosure on Climate Change
Total energy consumed, percentage from heavy fuel oil, percentage from renewables Quantitative
Gigajoules, Percentage (%)
CDP Climate Change Information Request CC11.3, CC3.1d Climate Change Reporting Framework 4.31.f GRI G4 Aspect: Energy (EN3)
Energy Efficiency Design Index (EEDI) for new ships Quantitative
Grams of CO2 per ton-nautical
mile n/a
Road Transportation Topic and Climate Risk Metric Category
Unit of Measure Alignment / Source
Environmental Footprint of Fuel Use
Gross global Scope 1 emissions Quantitative Metric tons
CO2-e
CDP Climate Change Information Request CC8.2 Emissions Data, CC8.5 Data Accuracy CDSB Framework REQ-04 Sources of environmental impacts Climate Change Reporting Framework 4.19.1, 4.29 GRI G4 Aspect: Emissions (EN15) Additional Source(s): WRI/WBCSD Greenhouse Gas Protocol (definitions and calculation methodology)
Description of long-term and short-term strategy or plan to manage Scope 1 emissions, emissions reduction targets, and
Discussion and Analysis
n/a CDP Climate Change Information Request CC3. Targets and Initiatives
Table 3k: Transportation
85 SASB.ORG
CLIMATE RISK TECHNICAL BULLETIN TB001-10182016
Despite the SEC’s 2010 publication of guidance for doing so, companies have found it challenging to effectively disclose information on climate risk.39 During the four fiscal years after the guidance was issued, an analysis found that “the state of corporate climate reporting … has improved—at best—mar-ginally. Still, the vast majority of financial reporting on climate change does not meet SEC requirements.” It continued:
Most companies are not discussing company specific material information and are not quantifying risks or past impacts. Most are briefly discussing climate change using boilerplate language of minimal utility to investors, providing few materials details about climate risks and opportunities facing them.40
Indeed, more recent analysis by SASB shows that not much has changed.41 The results of this analysis, presented here, show that 40 percent of disclosure on climate risk is boilerplate and that in 27 percent of cases there is no climate risk disclosure at all. Without meaningful disclosure on climate risk, investors are unable to understand the trajectory of a company’s performance or how that performance compares to that of peer companies, and, thus, the market is unable to efficiently price the impacts of climate risk.
It’s important to note that even in industries with generally higher-quality disclosure (e.g., metrics), significant variability still exists, creating challenges for investors. For example, even when two industry peers disclose quantitative information regarding a material climate-related topic, they may use different metrics and/or calculation methods, hindering comparability. Consider the varied usefulness of the following instances of water management disclosure made by two companies in the Alcoholic Beverages industry, one using boilerplate and the later using metrics:
“Climate change and water availability may negatively affect our business and financial results. … Clean water is a limited resource in many parts of the world and climate change may increase water scarcity and cause a deterioration of water quality in areas where we maintain brewing operations. The competition for water
39 SEC, Commission Guidance Regarding Disclosure Related to Climate Change (February 2010).
40 “Cool Response: The SEC and Corporate Climate Change Reporting,” Ceres, February 2014; https://www.ceres.org/resources/reports/cool-response-the-sec-corporate-climate-change-reporting/
41 SASB analysis performed between May and August 2015 using the latest annual SEC Filings (i.e. Form 10-Ks and 20-Fs) for the top companies, by revenue, per SICS industry (maximum of 10 companies per industry).
among domestic, agricultural and manufacturing users is increasing in some of our brewing communities. … The above risk, if realized, could result in a material adverse effect on our business and financial results.” Molson Coors, Form 10-K filed 12-Feb-15
“Overall this year, Diageo has delivered improved perfor-mance across all water and other environmental target areas versus the prior year, and progressed towards meeting 2015 goals. We reduced absolute water use by 9% or 2,268,000 cubic metres while water efficiency improved by 2.4% compared to the prior year. In water-stressed locations, we have reduced water wasted by 12%, an important contribution towards our target of a 50% reduction versus the company’s 2007 baseline.” Diageo, Form 20-F filed 12-Aug-14
The sample disclosures included with the following charts (Table 4) are intended to illustrate the range of this variability within each industry and across a variety of topics.
METHODOLOGY
As part of its standards development process, SASB analyzed the state of disclosure in annual SEC filings of the likely material sustainability topics that are part of each provisional SASB standard, including the climate-related topics presented in Table 3 above. The analysis focused on identifying disclosure practices by the top 10 companies (by revenue) in each industry on their most recent Form 10-K or 20-F, and classifying such disclosures based on the categories presented below:
ț No Disclosure: The company does not provide disclosure that is relevant to the topic under analysis.
ț Boilerplate: The company provides disclosure using generic language which can be applicable to most, if not all, issuers in the industry. Such disclosure has not been sufficiently tailored to reflect the compa-ny’s specific and unique circumstances, including, but not limited to, its past performance, future targets and individual risk/opportunity management strategies. The disclosure, thus, does not provide the reader with sufficient and significant information
Current State of Climate Risk Disclosure
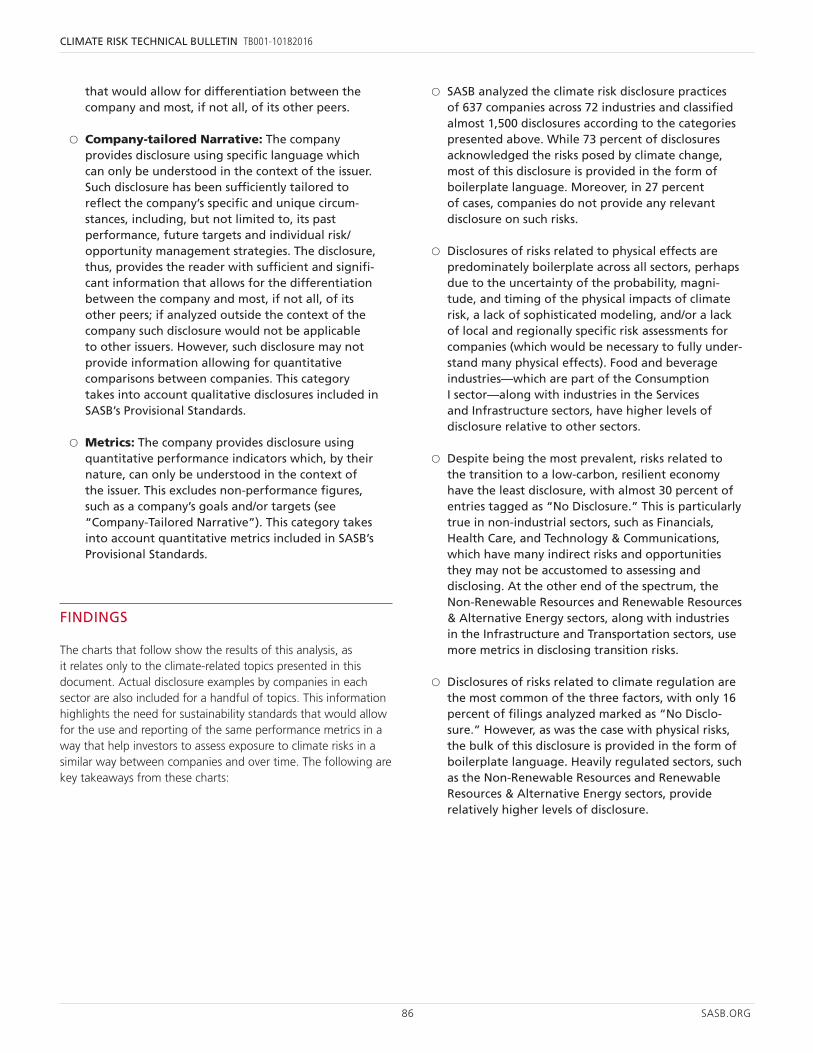
86 SASB.ORG
CLIMATE RISK TECHNICAL BULLETIN TB001-10182016
that would allow for differentiation between the company and most, if not all, of its other peers.
ț Company-tailored Narrative: The company provides disclosure using specific language which can only be understood in the context of the issuer. Such disclosure has been sufficiently tailored to reflect the company’s specific and unique circum-stances, including, but not limited to, its past performance, future targets and individual risk/opportunity management strategies. The disclosure, thus, provides the reader with sufficient and signifi-cant information that allows for the differentiation between the company and most, if not all, of its other peers; if analyzed outside the context of the company such disclosure would not be applicable to other issuers. However, such disclosure may not provide information allowing for quantitative comparisons between companies. This category takes into account qualitative disclosures included in SASB’s Provisional Standards.
ț Metrics: The company provides disclosure using quantitative performance indicators which, by their nature, can only be understood in the context of the issuer. This excludes non-performance figures, such as a company’s goals and/or targets (see “Company-Tailored Narrative”). This category takes into account quantitative metrics included in SASB’s Provisional Standards.
FINDINGS
The charts that follow show the results of this analysis, as it relates only to the climate-related topics presented in this document. Actual disclosure examples by companies in each sector are also included for a handful of topics. This information highlights the need for sustainability standards that would allow for the use and reporting of the same performance metrics in a way that help investors to assess exposure to climate risks in a similar way between companies and over time. The following are key takeaways from these charts:
ț SASB analyzed the climate risk disclosure practices of 637 companies across 72 industries and classified almost 1,500 disclosures according to the categories presented above. While 73 percent of disclosures acknowledged the risks posed by climate change, most of this disclosure is provided in the form of boilerplate language. Moreover, in 27 percent of cases, companies do not provide any relevant disclosure on such risks.
ț Disclosures of risks related to physical effects are predominately boilerplate across all sectors, perhaps due to the uncertainty of the probability, magni-tude, and timing of the physical impacts of climate risk, a lack of sophisticated modeling, and/or a lack of local and regionally specific risk assessments for companies (which would be necessary to fully under-stand many physical effects). Food and beverage industries—which are part of the Consumption I sector—along with industries in the Services and Infrastructure sectors, have higher levels of disclosure relative to other sectors.
ț Despite being the most prevalent, risks related to the transition to a low-carbon, resilient economy have the least disclosure, with almost 30 percent of entries tagged as “No Disclosure.” This is particularly true in non-industrial sectors, such as Financials, Health Care, and Technology & Communications, which have many indirect risks and opportunities they may not be accustomed to assessing and disclosing. At the other end of the spectrum, the Non-Renewable Resources and Renewable Resources & Alternative Energy sectors, along with industries in the Infrastructure and Transportation sectors, use more metrics in disclosing transition risks.
ț Disclosures of risks related to climate regulation are the most common of the three factors, with only 16 percent of filings analyzed marked as “No Disclo-sure.” However, as was the case with physical risks, the bulk of this disclosure is provided in the form of boilerplate language. Heavily regulated sectors, such as the Non-Renewable Resources and Renewable Resources & Alternative Energy sectors, provide relatively higher levels of disclosure.
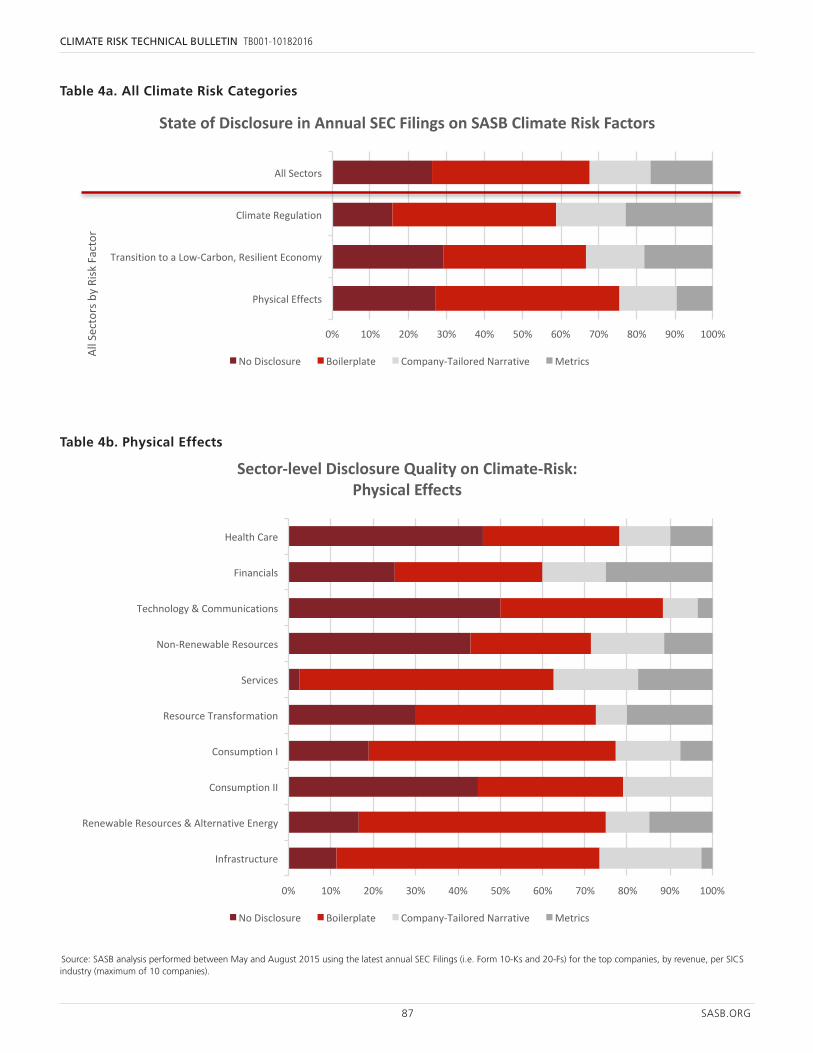
87 SASB.ORG
CLIMATE RISK TECHNICAL BULLETIN TB001-10182016All Climate Risk Categories
10/5/163
Source: SASB analysis performed between May and August 2015 using the latest annual SEC Filings (i.e. Form 10-Ks and 20-Fs) for the top companies, by revenue, per SICS industry (maximum of 10 companies).
0% 10% 20% 30% 40% 50% 60% 70% 80% 90% 100%
PhysicalEffects
TransitiontoaLow-Carbon,ResilientEconomy
ClimateRegulation
AllSectors
AllSectorsbyRiskFactor
StateofDisclosureinAnnualSECFilingsonSASBClimateRiskFactors
NoDisclosure Boilerplate Company-TailoredNarrative Metrics
Source: SASB analysis performed between May and August 2015 using the latest annual SEC Filings (i.e. Form 10-Ks and 20-Fs) for the top companies, by revenue, per SICS industry (maximum of 10 companies).
Table 4a. All Climate Risk Categories
Physical Effects
10/5/164
0% 10% 20% 30% 40% 50% 60% 70% 80% 90% 100%
Infrastructure
RenewableResources&AlternativeEnergy
ConsumptionII
ConsumptionI
ResourceTransformation
Services
Non-RenewableResources
Technology&Communications
Financials
HealthCare
Sector-levelDisclosureQualityonClimate-Risk:PhysicalEffects
NoDisclosure Boilerplate Company-TailoredNarrative Metrics
Source: SASB analysis performed between May and August 2015 using the latest annual SEC Filings (i.e. Form 10-Ks and 20-Fs) for the top companies, by revenue, per SICS industry (maximum of 10 companies).
Table 4b. Physical Effects
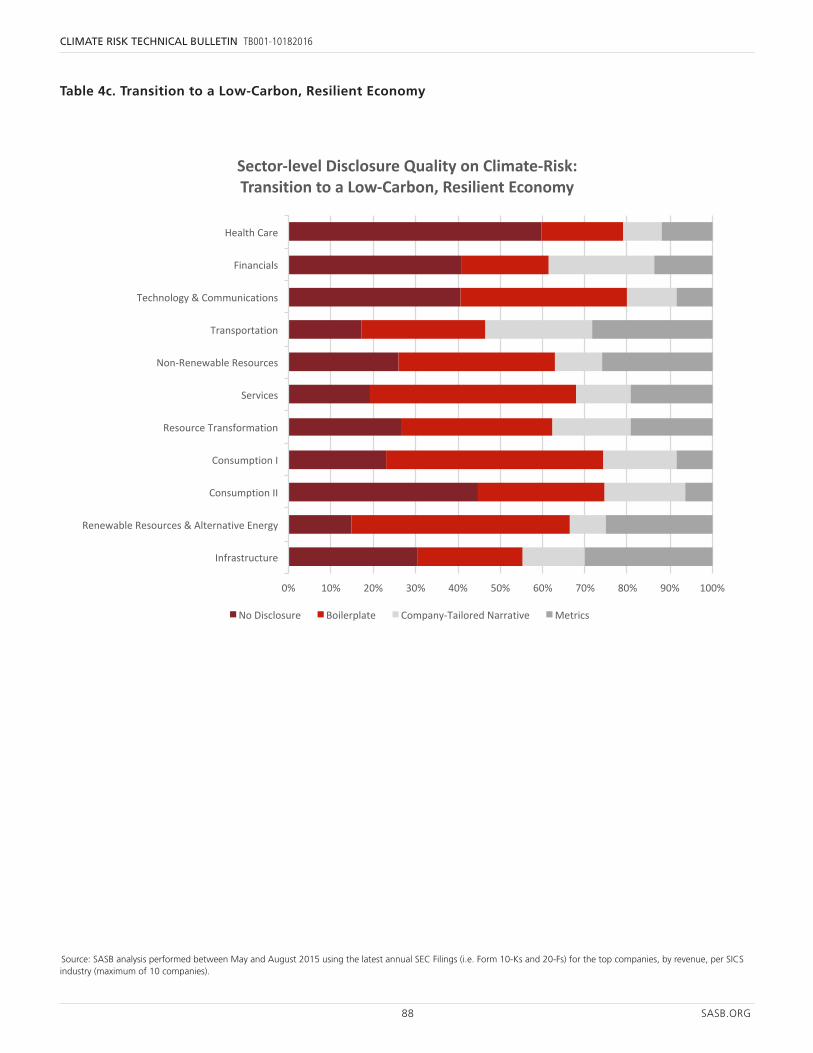
88 SASB.ORG
CLIMATE RISK TECHNICAL BULLETIN TB001-10182016
Transition to a Low-Carbon, Resilient Economy
10/5/165
0% 10% 20% 30% 40% 50% 60% 70% 80% 90% 100%
Infrastructure
RenewableResources&AlternativeEnergy
ConsumptionII
ConsumptionI
ResourceTransformation
Services
Non-RenewableResources
Transportation
Technology&Communications
Financials
HealthCare
Sector-levelDisclosureQualityonClimate-Risk:TransitiontoaLow-Carbon,ResilientEconomy
NoDisclosure Boilerplate Company-TailoredNarrative Metrics
Source: SASB analysis performed between May and August 2015 using the latest annual SEC Filings (i.e. Form 10-Ks and 20-Fs) for the top companies, by revenue, per SICS industry (maximum of 10 companies).
Table 4c. Transition to a Low-Carbon, Resilient Economy
Source: SASB analysis performed between May and August 2015 using the latest annual SEC Filings (i.e. Form 10-Ks and 20-Fs) for the top companies, by revenue, per SICS industry (maximum of 10 companies).
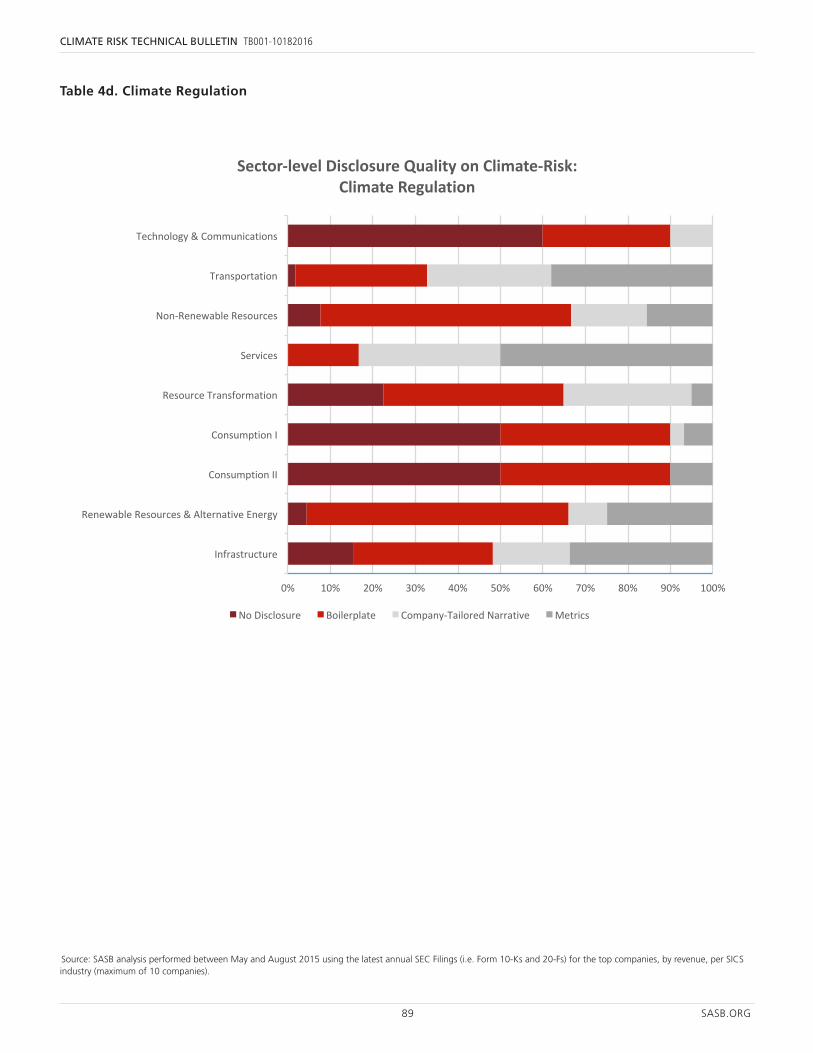
89 SASB.ORG
CLIMATE RISK TECHNICAL BULLETIN TB001-10182016
Climate Regulation
10/5/166
0% 10% 20% 30% 40% 50% 60% 70% 80% 90% 100%
Infrastructure
RenewableResources&AlternativeEnergy
ConsumptionII
ConsumptionI
ResourceTransformation
Services
Non-RenewableResources
Transportation
Technology&Communications
Sector-levelDisclosureQualityonClimate-Risk:ClimateRegulation
NoDisclosure Boilerplate Company-TailoredNarrative Metrics
Source: SASB analysis performed between May and August 2015 using the latest annual SEC Filings (i.e. Form 10-Ks and 20-Fs) for the top companies, by revenue, per SICS industry (maximum of 10 companies).
Table 4d. Climate Regulation
Source: SASB analysis performed between May and August 2015 using the latest annual SEC Filings (i.e. Form 10-Ks and 20-Fs) for the top companies, by revenue, per SICS industry (maximum of 10 companies).
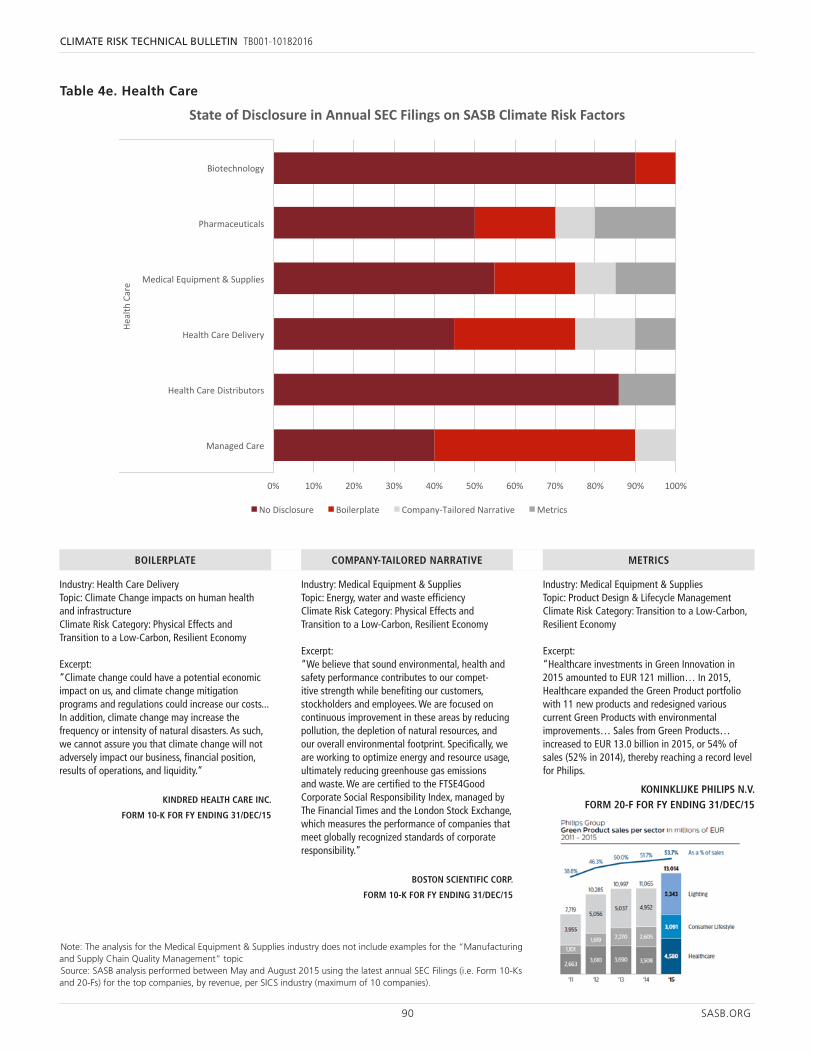
90 SASB.ORG
CLIMATE RISK TECHNICAL BULLETIN TB001-10182016
Note: The analysis for the Medical Equipment & Supplies industry does not include examples for the “Manufacturing and Supply Chain Quality Management” topicSource: SASB analysis performed between May and August 2015 using the latest annual SEC Filings (i.e. Form 10-Ks and 20-Fs) for the top companies, by revenue, per SICS industry (maximum of 10 companies).
Health Care
10/5/168
Note: The analysis for the Medical Equipment & Supplies industry does not include examples for the “Manufacturing and Supply Chain Quality Management” topic
0% 10% 20% 30% 40% 50% 60% 70% 80% 90% 100%
ManagedCare
HealthCareDistributors
HealthCareDelivery
MedicalEquipment&Supplies
Pharmaceuticals
Biotechnology
HealthCare
StateofDisclosureinAnnualSECFilingsonSASBClimateRiskFactors
NoDisclosure Boilerplate Company-TailoredNarrative Metrics
Source: SASB analysis performed between May and August 2015 using the latest annual SEC Filings (i.e. Form 10-Ks and 20-Fs) for the top companies, by revenue, per SICS industry (maximum of 10 companies).
Table 4e. Health Care
Industry: Health Care DeliveryTopic: Climate Change impacts on human health and infrastructureClimate Risk Category: Physical Effects and Transition to a Low-Carbon, Resilient Economy
Excerpt: “Climate change could have a potential economic impact on us, and climate change mitigation programs and regulations could increase our costs... In addition, climate change may increase the frequency or intensity of natural disasters. As such, we cannot assure you that climate change will not adversely impact our business, financial position, results of operations, and liquidity.”
KINDRED HEALTH CARE INC.
FORM 10-K FOR FY ENDING 31/DEC/15
Industry: Medical Equipment & Supplies Topic: Energy, water and waste efficiencyClimate Risk Category: Physical Effects and Transition to a Low-Carbon, Resilient Economy
Excerpt: “We believe that sound environmental, health and safety performance contributes to our compet-itive strength while benefiting our customers, stockholders and employees. We are focused on continuous improvement in these areas by reducing pollution, the depletion of natural resources, and our overall environmental footprint. Specifically, we are working to optimize energy and resource usage, ultimately reducing greenhouse gas emissions and waste. We are certified to the FTSE4Good Corporate Social Responsibility Index, managed by The Financial Times and the London Stock Exchange, which measures the performance of companies that meet globally recognized standards of corporate responsibility.”
BOSTON SCIENTIFIC CORP.
FORM 10-K FOR FY ENDING 31/DEC/15
Industry: Medical Equipment & Supplies Topic: Product Design & Lifecycle ManagementClimate Risk Category: Transition to a Low-Carbon, Resilient Economy
Excerpt: “Healthcare investments in Green Innovation in 2015 amounted to EUR 121 million… In 2015, Healthcare expanded the Green Product portfolio with 11 new products and redesigned various current Green Products with environmental improvements… Sales from Green Products… increased to EUR 13.0 billion in 2015, or 54% of sales (52% in 2014), thereby reaching a record level for Philips.
KONINKLIJKE PHILIPS N.V.FORM 20-F FOR FY ENDING 31/DEC/15
BOILERPLATE COMPANY-TAILORED NARRATIVE METRICS
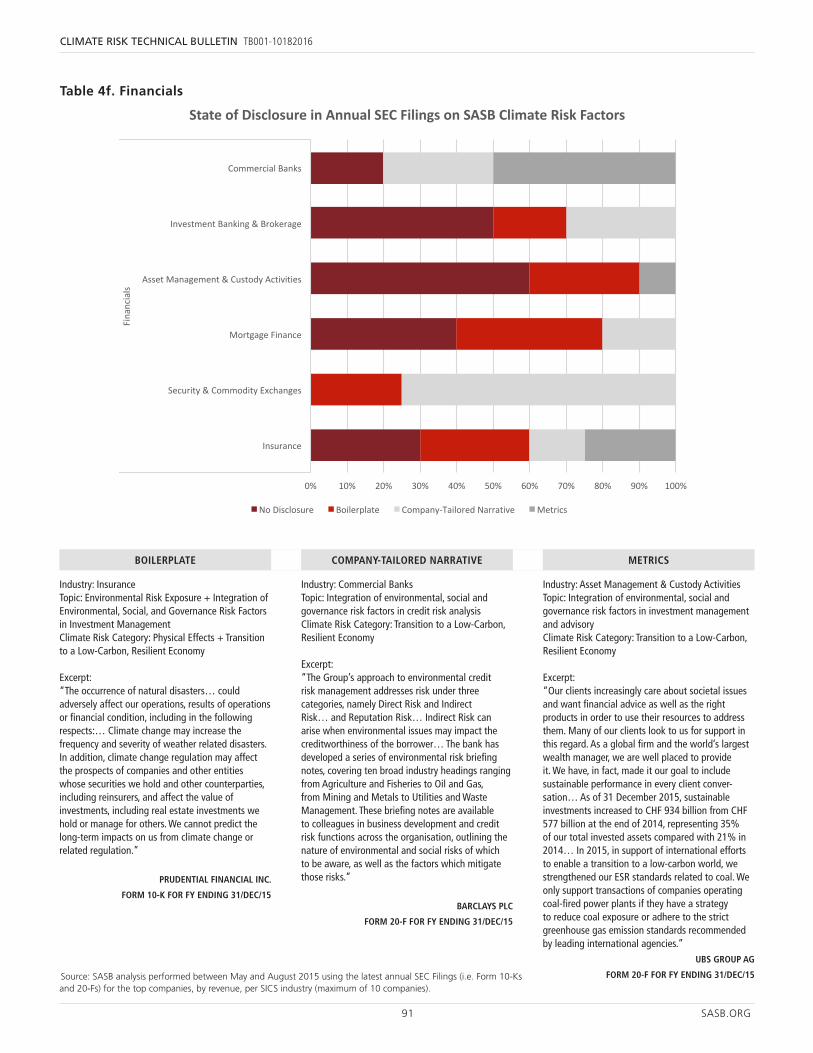
91 SASB.ORG
CLIMATE RISK TECHNICAL BULLETIN TB001-10182016
Source: SASB analysis performed between May and August 2015 using the latest annual SEC Filings (i.e. Form 10-Ks and 20-Fs) for the top companies, by revenue, per SICS industry (maximum of 10 companies).
Financials
10/5/1610
0% 10% 20% 30% 40% 50% 60% 70% 80% 90% 100%
Insurance
Security&CommodityExchanges
MortgageFinance
AssetManagement&CustodyActivities
InvestmentBanking&Brokerage
CommercialBanks
Financials
StateofDisclosureinAnnualSECFilingsonSASBClimateRiskFactors
NoDisclosure Boilerplate Company-TailoredNarrative Metrics
Source: SASB analysis performed between May and August 2015 using the latest annual SEC Filings (i.e. Form 10-Ks and 20-Fs) for the top companies, by revenue, per SICS industry (maximum of 10 companies).
Table 4f. Financials
Industry: InsuranceTopic: Environmental Risk Exposure + Integration of Environmental, Social, and Governance Risk Factors in Investment Management Climate Risk Category: Physical Effects + Transition to a Low-Carbon, Resilient Economy
Excerpt: “The occurrence of natural disasters… could adversely affect our operations, results of operations or financial condition, including in the following respects:… Climate change may increase the frequency and severity of weather related disasters. In addition, climate change regulation may affect the prospects of companies and other entities whose securities we hold and other counterparties, including reinsurers, and affect the value of investments, including real estate investments we hold or manage for others. We cannot predict the long-term impacts on us from climate change or related regulation.”
PRUDENTIAL FINANCIAL INC.
FORM 10-K FOR FY ENDING 31/DEC/15
Industry: Commercial BanksTopic: Integration of environmental, social and governance risk factors in credit risk analysisClimate Risk Category: Transition to a Low-Carbon, Resilient Economy
Excerpt: “The Group’s approach to environmental credit risk management addresses risk under three categories, namely Direct Risk and Indirect Risk… and Reputation Risk… Indirect Risk can arise when environmental issues may impact the creditworthiness of the borrower… The bank has developed a series of environmental risk briefing notes, covering ten broad industry headings ranging from Agriculture and Fisheries to Oil and Gas, from Mining and Metals to Utilities and Waste Management. These briefing notes are available to colleagues in business development and credit risk functions across the organisation, outlining the nature of environmental and social risks of which to be aware, as well as the factors which mitigate those risks.”
BARCLAYS PLC
FORM 20-F FOR FY ENDING 31/DEC/15
Industry: Asset Management & Custody ActivitiesTopic: Integration of environmental, social and governance risk factors in investment management and advisoryClimate Risk Category: Transition to a Low-Carbon, Resilient Economy
Excerpt: “Our clients increasingly care about societal issues and want financial advice as well as the right products in order to use their resources to address them. Many of our clients look to us for support in this regard. As a global firm and the world’s largest wealth manager, we are well placed to provide it. We have, in fact, made it our goal to include sustainable performance in every client conver-sation… As of 31 December 2015, sustainable investments increased to CHF 934 billion from CHF 577 billion at the end of 2014, representing 35% of our total invested assets compared with 21% in 2014… In 2015, in support of international efforts to enable a transition to a low-carbon world, we strengthened our ESR standards related to coal. We only support transactions of companies operating coal-fired power plants if they have a strategy to reduce coal exposure or adhere to the strict greenhouse gas emission standards recommended by leading international agencies.”
UBS GROUP AG
FORM 20-F FOR FY ENDING 31/DEC/15
BOILERPLATE COMPANY-TAILORED NARRATIVE METRICS
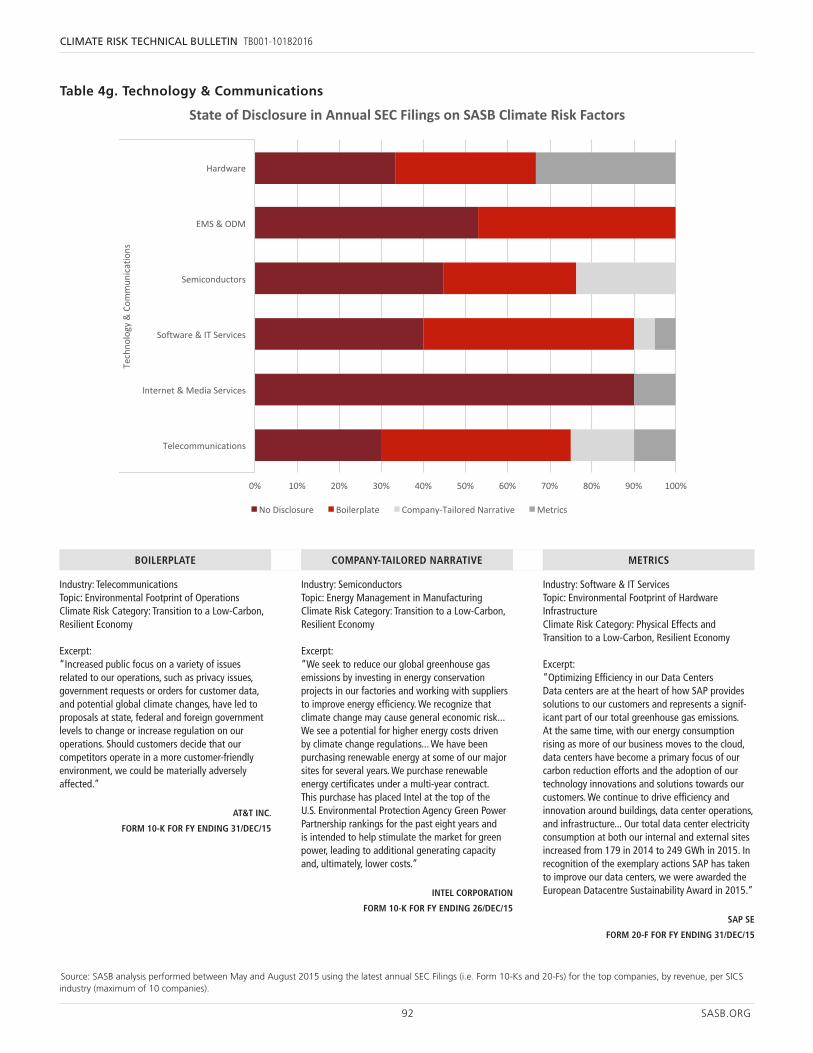
92 SASB.ORG
CLIMATE RISK TECHNICAL BULLETIN TB001-10182016
Source: SASB analysis performed between May and August 2015 using the latest annual SEC Filings (i.e. Form 10-Ks and 20-Fs) for the top companies, by revenue, per SICS industry (maximum of 10 companies).
Technology & Communications
10/5/1612
0% 10% 20% 30% 40% 50% 60% 70% 80% 90% 100%
Telecommunications
Internet&MediaServices
Software&ITServices
Semiconductors
EMS&ODM
Hardware
Technology&Communications
StateofDisclosureinAnnualSECFilingsonSASBClimateRiskFactors
NoDisclosure Boilerplate Company-TailoredNarrative Metrics
Source: SASB analysis performed between May and August 2015 using the latest annual SEC Filings (i.e. Form 10-Ks and 20-Fs) for the top companies, by revenue, per SICS industry (maximum of 10 companies).
Table 4g. Technology & Communications
Industry: TelecommunicationsTopic: Environmental Footprint of OperationsClimate Risk Category: Transition to a Low-Carbon, Resilient Economy
Excerpt: “Increased public focus on a variety of issues related to our operations, such as privacy issues, government requests or orders for customer data, and potential global climate changes, have led to proposals at state, federal and foreign government levels to change or increase regulation on our operations. Should customers decide that our competitors operate in a more customer-friendly environment, we could be materially adversely affected.”
AT&T INC.
FORM 10-K FOR FY ENDING 31/DEC/15
Industry: SemiconductorsTopic: Energy Management in ManufacturingClimate Risk Category: Transition to a Low-Carbon, Resilient Economy
Excerpt: “We seek to reduce our global greenhouse gas emissions by investing in energy conservation projects in our factories and working with suppliers to improve energy efficiency. We recognize that climate change may cause general economic risk... We see a potential for higher energy costs driven by climate change regulations... We have been purchasing renewable energy at some of our major sites for several years. We purchase renewable energy certificates under a multi-year contract. This purchase has placed Intel at the top of the U.S. Environmental Protection Agency Green Power Partnership rankings for the past eight years and is intended to help stimulate the market for green power, leading to additional generating capacity and, ultimately, lower costs.”
INTEL CORPORATION
FORM 10-K FOR FY ENDING 26/DEC/15
Industry: Software & IT ServicesTopic: Environmental Footprint of Hardware InfrastructureClimate Risk Category: Physical Effects and Transition to a Low-Carbon, Resilient Economy
Excerpt: “Optimizing Efficiency in our Data CentersData centers are at the heart of how SAP provides solutions to our customers and represents a signif-icant part of our total greenhouse gas emissions. At the same time, with our energy consumption rising as more of our business moves to the cloud, data centers have become a primary focus of our carbon reduction efforts and the adoption of our technology innovations and solutions towards our customers. We continue to drive efficiency and innovation around buildings, data center operations, and infrastructure... Our total data center electricity consumption at both our internal and external sites increased from 179 in 2014 to 249 GWh in 2015. In recognition of the exemplary actions SAP has taken to improve our data centers, we were awarded the European Datacentre Sustainability Award in 2015.”
SAP SE
FORM 20-F FOR FY ENDING 31/DEC/15
BOILERPLATE COMPANY-TAILORED NARRATIVE METRICS
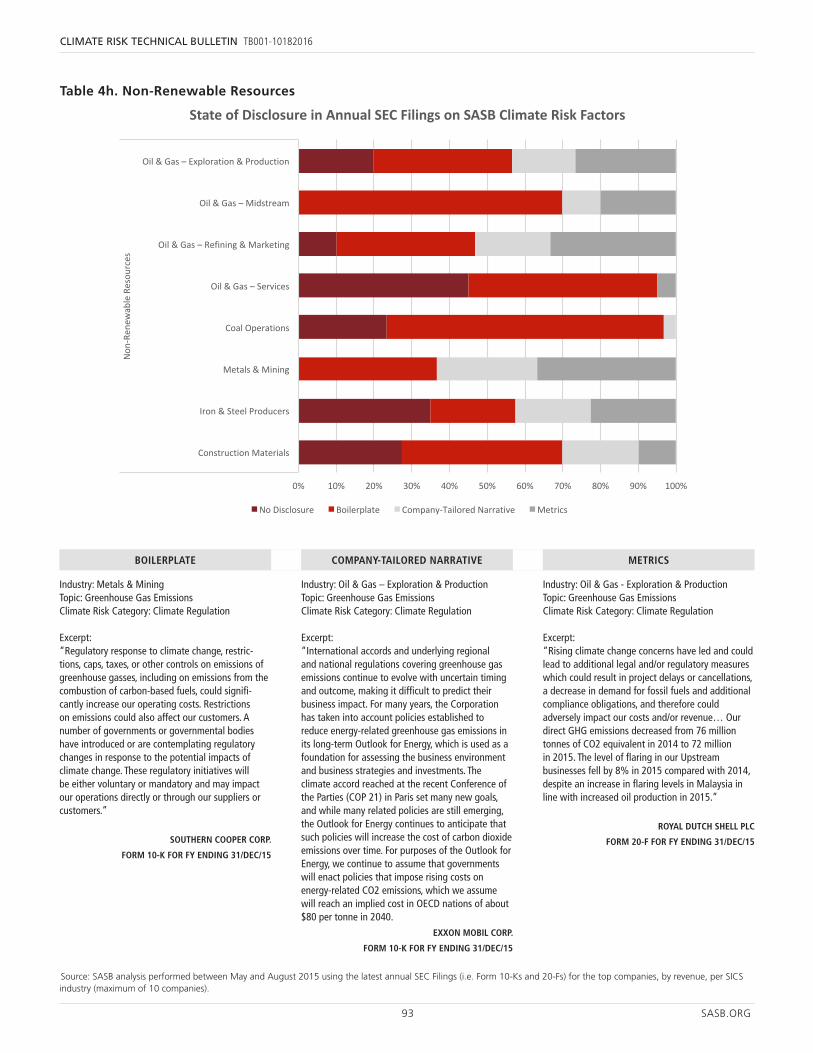
93 SASB.ORG
CLIMATE RISK TECHNICAL BULLETIN TB001-10182016
Source: SASB analysis performed between May and August 2015 using the latest annual SEC Filings (i.e. Form 10-Ks and 20-Fs) for the top companies, by revenue, per SICS industry (maximum of 10 companies).
Non-Renewable Resources
10/5/1614
0% 10% 20% 30% 40% 50% 60% 70% 80% 90% 100%
ConstructionMaterials
Iron&SteelProducers
Metals&Mining
CoalOperations
Oil&Gas– Services
Oil&Gas– Refining&Marketing
Oil&Gas– Midstream
Oil&Gas– Exploration&Production
Non-RenewableResources
StateofDisclosureinAnnualSECFilingsonSASBClimateRiskFactors
NoDisclosure Boilerplate Company-TailoredNarrative Metrics
Source: SASB analysis performed between May and August 2015 using the latest annual SEC Filings (i.e. Form 10-Ks and 20-Fs) for the top companies, by revenue, per SICS industry (maximum of 10 companies).
Table 4h. Non-Renewable Resources
Industry: Metals & MiningTopic: Greenhouse Gas EmissionsClimate Risk Category: Climate Regulation
Excerpt: “Regulatory response to climate change, restric-tions, caps, taxes, or other controls on emissions of greenhouse gasses, including on emissions from the combustion of carbon-based fuels, could signifi-cantly increase our operating costs. Restrictions on emissions could also affect our customers. A number of governments or governmental bodies have introduced or are contemplating regulatory changes in response to the potential impacts of climate change. These regulatory initiatives will be either voluntary or mandatory and may impact our operations directly or through our suppliers or customers.”
SOUTHERN COOPER CORP.
FORM 10-K FOR FY ENDING 31/DEC/15
Industry: Oil & Gas – Exploration & ProductionTopic: Greenhouse Gas EmissionsClimate Risk Category: Climate Regulation
Excerpt: “International accords and underlying regional and national regulations covering greenhouse gas emissions continue to evolve with uncertain timing and outcome, making it difficult to predict their business impact. For many years, the Corporation has taken into account policies established to reduce energy-related greenhouse gas emissions in its long-term Outlook for Energy, which is used as a foundation for assessing the business environment and business strategies and investments. The climate accord reached at the recent Conference of the Parties (COP 21) in Paris set many new goals, and while many related policies are still emerging, the Outlook for Energy continues to anticipate that such policies will increase the cost of carbon dioxide emissions over time. For purposes of the Outlook for Energy, we continue to assume that governments will enact policies that impose rising costs on energy-related CO2 emissions, which we assume will reach an implied cost in OECD nations of about $80 per tonne in 2040.
EXXON MOBIL CORP.
FORM 10-K FOR FY ENDING 31/DEC/15
Industry: Oil & Gas - Exploration & ProductionTopic: Greenhouse Gas EmissionsClimate Risk Category: Climate Regulation
Excerpt: “Rising climate change concerns have led and could lead to additional legal and/or regulatory measures which could result in project delays or cancellations, a decrease in demand for fossil fuels and additional compliance obligations, and therefore could adversely impact our costs and/or revenue… Our direct GHG emissions decreased from 76 million tonnes of CO2 equivalent in 2014 to 72 million in 2015. The level of flaring in our Upstream businesses fell by 8% in 2015 compared with 2014, despite an increase in flaring levels in Malaysia in line with increased oil production in 2015.”
ROYAL DUTCH SHELL PLC
FORM 20-F FOR FY ENDING 31/DEC/15
BOILERPLATE COMPANY-TAILORED NARRATIVE METRICS
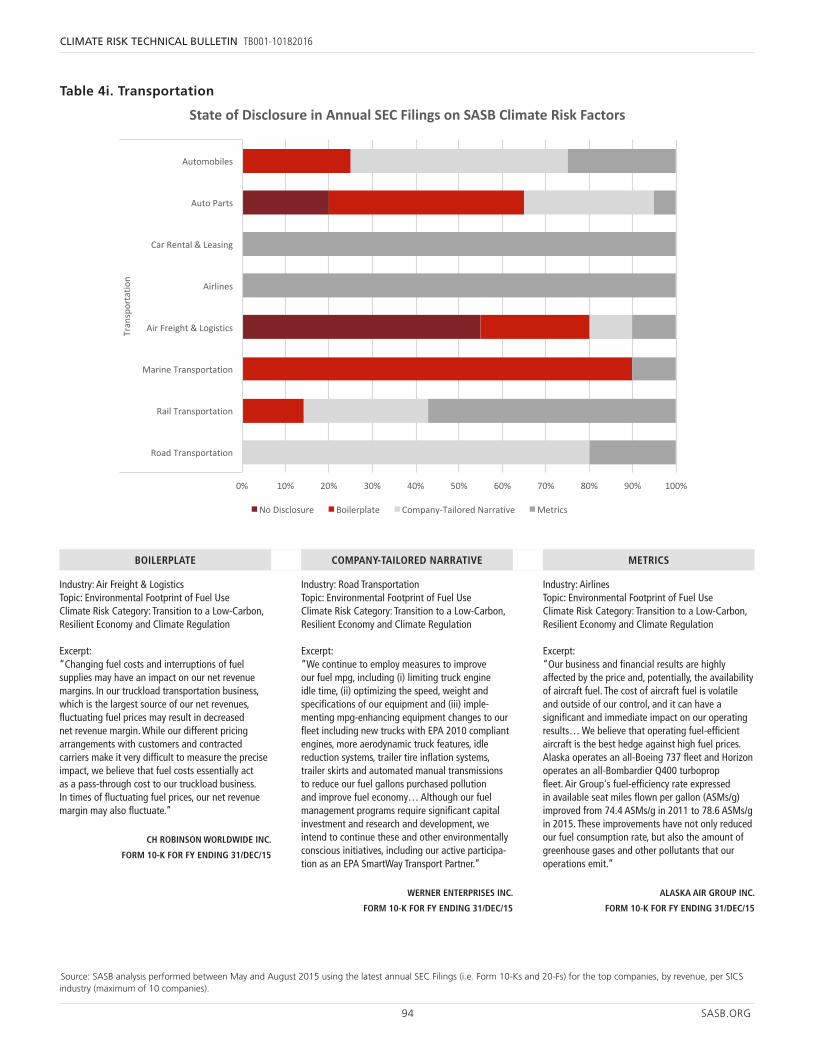
94 SASB.ORG
CLIMATE RISK TECHNICAL BULLETIN TB001-10182016
Source: SASB analysis performed between May and August 2015 using the latest annual SEC Filings (i.e. Form 10-Ks and 20-Fs) for the top companies, by revenue, per SICS industry (maximum of 10 companies).
Transportation
10/5/1616
0% 10% 20% 30% 40% 50% 60% 70% 80% 90% 100%
RoadTransportation
RailTransportation
MarineTransportation
AirFreight&Logistics
Airlines
CarRental&Leasing
AutoParts
Automobiles
Transportation
StateofDisclosureinAnnualSECFilingsonSASBClimateRiskFactors
NoDisclosure Boilerplate Company-TailoredNarrative Metrics
Source: SASB analysis performed between May and August 2015 using the latest annual SEC Filings (i.e. Form 10-Ks and 20-Fs) for the top companies, by revenue, per SICS industry (maximum of 10 companies).
Table 4i. Transportation
Industry: Air Freight & LogisticsTopic: Environmental Footprint of Fuel UseClimate Risk Category: Transition to a Low-Carbon, Resilient Economy and Climate Regulation
Excerpt: “Changing fuel costs and interruptions of fuel supplies may have an impact on our net revenue margins. In our truckload transportation business, which is the largest source of our net revenues, fluctuating fuel prices may result in decreased net revenue margin. While our different pricing arrangements with customers and contracted carriers make it very difficult to measure the precise impact, we believe that fuel costs essentially act as a pass-through cost to our truckload business. In times of fluctuating fuel prices, our net revenue margin may also fluctuate.”
CH ROBINSON WORLDWIDE INC.
FORM 10-K FOR FY ENDING 31/DEC/15
Industry: Road TransportationTopic: Environmental Footprint of Fuel UseClimate Risk Category: Transition to a Low-Carbon, Resilient Economy and Climate Regulation
Excerpt: “We continue to employ measures to improve our fuel mpg, including (i) limiting truck engine idle time, (ii) optimizing the speed, weight and specifications of our equipment and (iii) imple-menting mpg-enhancing equipment changes to our fleet including new trucks with EPA 2010 compliant engines, more aerodynamic truck features, idle reduction systems, trailer tire inflation systems, trailer skirts and automated manual transmissions to reduce our fuel gallons purchased pollution and improve fuel economy… Although our fuel management programs require significant capital investment and research and development, we intend to continue these and other environmentally conscious initiatives, including our active participa-tion as an EPA SmartWay Transport Partner.”
WERNER ENTERPRISES INC.
FORM 10-K FOR FY ENDING 31/DEC/15
Industry: AirlinesTopic: Environmental Footprint of Fuel UseClimate Risk Category: Transition to a Low-Carbon, Resilient Economy and Climate Regulation
Excerpt: “Our business and financial results are highly affected by the price and, potentially, the availability of aircraft fuel. The cost of aircraft fuel is volatile and outside of our control, and it can have a significant and immediate impact on our operating results… We believe that operating fuel-efficient aircraft is the best hedge against high fuel prices. Alaska operates an all-Boeing 737 fleet and Horizon operates an all-Bombardier Q400 turboprop fleet. Air Group's fuel-efficiency rate expressed in available seat miles flown per gallon (ASMs/g) improved from 74.4 ASMs/g in 2011 to 78.6 ASMs/g in 2015. These improvements have not only reduced our fuel consumption rate, but also the amount of greenhouse gases and other pollutants that our operations emit.”
ALASKA AIR GROUP INC.
FORM 10-K FOR FY ENDING 31/DEC/15
BOILERPLATE COMPANY-TAILORED NARRATIVE METRICS
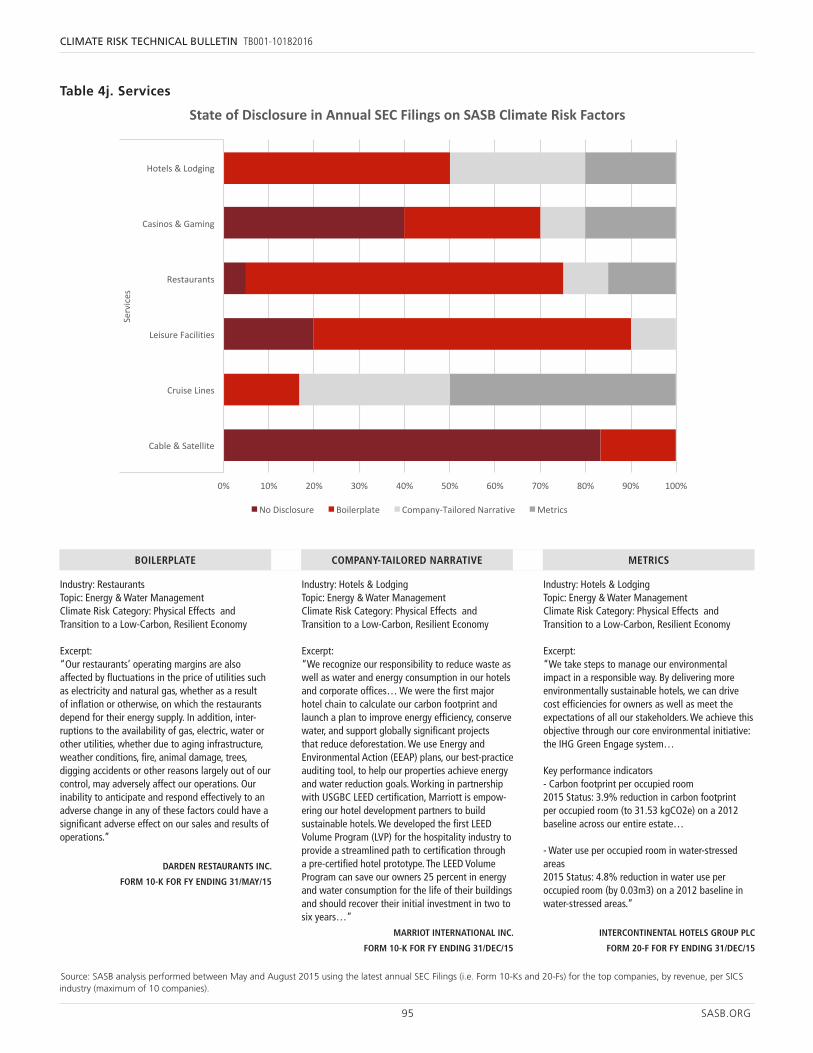
95 SASB.ORG
CLIMATE RISK TECHNICAL BULLETIN TB001-10182016
Source: SASB analysis performed between May and August 2015 using the latest annual SEC Filings (i.e. Form 10-Ks and 20-Fs) for the top companies, by revenue, per SICS industry (maximum of 10 companies).
Services
10/5/1618
0% 10% 20% 30% 40% 50% 60% 70% 80% 90% 100%
Cable&Satellite
CruiseLines
LeisureFacilities
Restaurants
Casinos&Gaming
Hotels&Lodging
Services
StateofDisclosureinAnnualSECFilingsonSASBClimateRiskFactors
NoDisclosure Boilerplate Company-TailoredNarrative Metrics
Source: SASB analysis performed between May and August 2015 using the latest annual SEC Filings (i.e. Form 10-Ks and 20-Fs) for the top companies, by revenue, per SICS industry (maximum of 10 companies).
Table 4j. Services
Industry: RestaurantsTopic: Energy & Water ManagementClimate Risk Category: Physical Effects and Transition to a Low-Carbon, Resilient Economy
Excerpt: “Our restaurants’ operating margins are also affected by fluctuations in the price of utilities such as electricity and natural gas, whether as a result of inflation or otherwise, on which the restaurants depend for their energy supply. In addition, inter-ruptions to the availability of gas, electric, water or other utilities, whether due to aging infrastructure, weather conditions, fire, animal damage, trees, digging accidents or other reasons largely out of our control, may adversely affect our operations. Our inability to anticipate and respond effectively to an adverse change in any of these factors could have a significant adverse effect on our sales and results of operations.”
DARDEN RESTAURANTS INC.
FORM 10-K FOR FY ENDING 31/MAY/15
Industry: Hotels & LodgingTopic: Energy & Water ManagementClimate Risk Category: Physical Effects and Transition to a Low-Carbon, Resilient Economy
Excerpt: “We recognize our responsibility to reduce waste as well as water and energy consumption in our hotels and corporate offices… We were the first major hotel chain to calculate our carbon footprint and launch a plan to improve energy efficiency, conserve water, and support globally significant projects that reduce deforestation. We use Energy and Environmental Action (EEAP) plans, our best-practice auditing tool, to help our properties achieve energy and water reduction goals. Working in partnership with USGBC LEED certification, Marriott is empow-ering our hotel development partners to build sustainable hotels. We developed the first LEED Volume Program (LVP) for the hospitality industry to provide a streamlined path to certification through a pre-certified hotel prototype. The LEED Volume Program can save our owners 25 percent in energy and water consumption for the life of their buildings and should recover their initial investment in two to six years…”
MARRIOT INTERNATIONAL INC.
FORM 10-K FOR FY ENDING 31/DEC/15
Industry: Hotels & LodgingTopic: Energy & Water ManagementClimate Risk Category: Physical Effects and Transition to a Low-Carbon, Resilient Economy
Excerpt: “We take steps to manage our environmental impact in a responsible way. By delivering more environmentally sustainable hotels, we can drive cost efficiencies for owners as well as meet the expectations of all our stakeholders. We achieve this objective through our core environmental initiative: the IHG Green Engage system…
Key performance indicators- Carbon footprint per occupied room2015 Status: 3.9% reduction in carbon footprint per occupied room (to 31.53 kgCO2e) on a 2012 baseline across our entire estate…
- Water use per occupied room in water-stressed areas2015 Status: 4.8% reduction in water use per occupied room (by 0.03m3) on a 2012 baseline in water-stressed areas.”
INTERCONTINENTAL HOTELS GROUP PLC
FORM 20-F FOR FY ENDING 31/DEC/15
BOILERPLATE COMPANY-TAILORED NARRATIVE METRICS
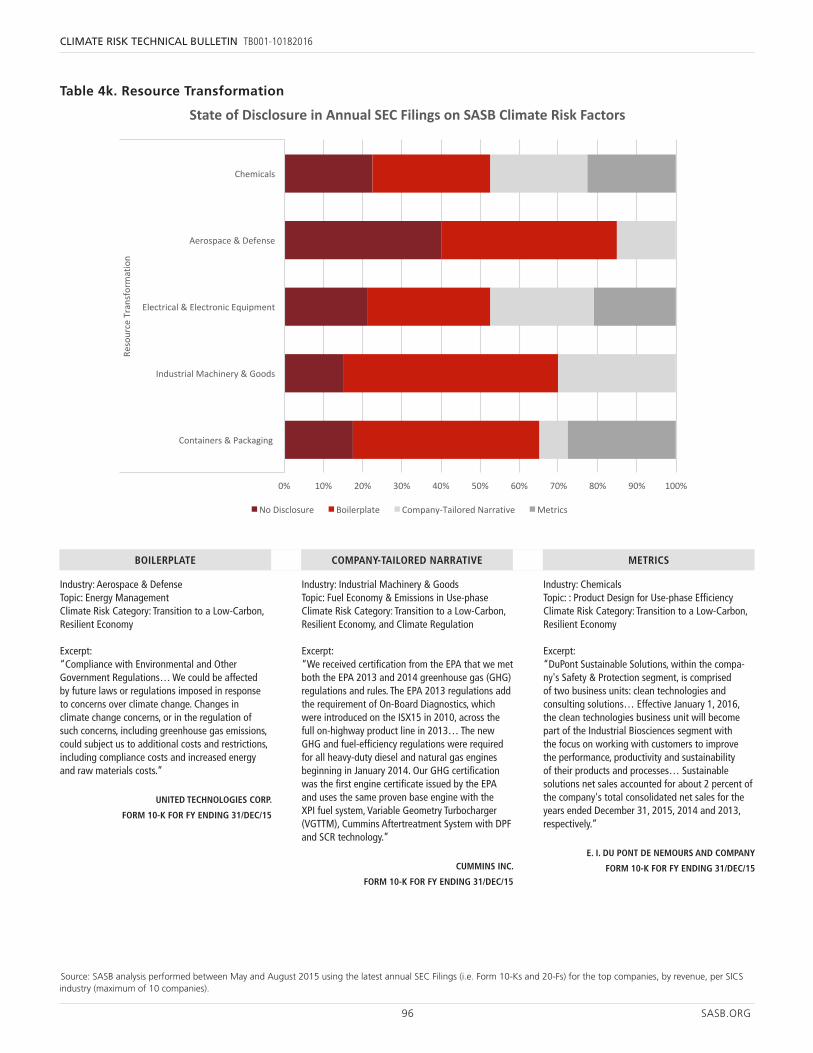
96 SASB.ORG
CLIMATE RISK TECHNICAL BULLETIN TB001-10182016
Source: SASB analysis performed between May and August 2015 using the latest annual SEC Filings (i.e. Form 10-Ks and 20-Fs) for the top companies, by revenue, per SICS industry (maximum of 10 companies).
Resource Transformation
10/5/1620
0% 10% 20% 30% 40% 50% 60% 70% 80% 90% 100%
Containers&Packaging
IndustrialMachinery&Goods
Electrical&ElectronicEquipment
Aerospace&Defense
Chemicals
ResourceTransformation
StateofDisclosureinAnnualSECFilingsonSASBClimateRiskFactors
NoDisclosure Boilerplate Company-TailoredNarrative Metrics
Source: SASB analysis performed between May and August 2015 using the latest annual SEC Filings (i.e. Form 10-Ks and 20-Fs) for the top companies, by revenue, per SICS industry (maximum of 10 companies).
Table 4k. Resource Transformation
Industry: Aerospace & DefenseTopic: Energy ManagementClimate Risk Category: Transition to a Low-Carbon, Resilient Economy
Excerpt: “Compliance with Environmental and Other Government Regulations… We could be affected by future laws or regulations imposed in response to concerns over climate change. Changes in climate change concerns, or in the regulation of such concerns, including greenhouse gas emissions, could subject us to additional costs and restrictions, including compliance costs and increased energy and raw materials costs.”
UNITED TECHNOLOGIES CORP.
FORM 10-K FOR FY ENDING 31/DEC/15
Industry: Industrial Machinery & GoodsTopic: Fuel Economy & Emissions in Use-phaseClimate Risk Category: Transition to a Low-Carbon, Resilient Economy, and Climate Regulation
Excerpt: “We received certification from the EPA that we met both the EPA 2013 and 2014 greenhouse gas (GHG) regulations and rules. The EPA 2013 regulations add the requirement of On-Board Diagnostics, which were introduced on the ISX15 in 2010, across the full on-highway product line in 2013… The new GHG and fuel-efficiency regulations were required for all heavy-duty diesel and natural gas engines beginning in January 2014. Our GHG certification was the first engine certificate issued by the EPA and uses the same proven base engine with the XPI fuel system, Variable Geometry Turbocharger (VGTTM), Cummins Aftertreatment System with DPF and SCR technology.”
CUMMINS INC.
FORM 10-K FOR FY ENDING 31/DEC/15
Industry: ChemicalsTopic: : Product Design for Use-phase EfficiencyClimate Risk Category: Transition to a Low-Carbon, Resilient Economy
Excerpt: “DuPont Sustainable Solutions, within the compa-ny's Safety & Protection segment, is comprised of two business units: clean technologies and consulting solutions… Effective January 1, 2016, the clean technologies business unit will become part of the Industrial Biosciences segment with the focus on working with customers to improve the performance, productivity and sustainability of their products and processes… Sustainable solutions net sales accounted for about 2 percent of the company's total consolidated net sales for the years ended December 31, 2015, 2014 and 2013, respectively.”
E. I. DU PONT DE NEMOURS AND COMPANY
FORM 10-K FOR FY ENDING 31/DEC/15
BOILERPLATE COMPANY-TAILORED NARRATIVE METRICS
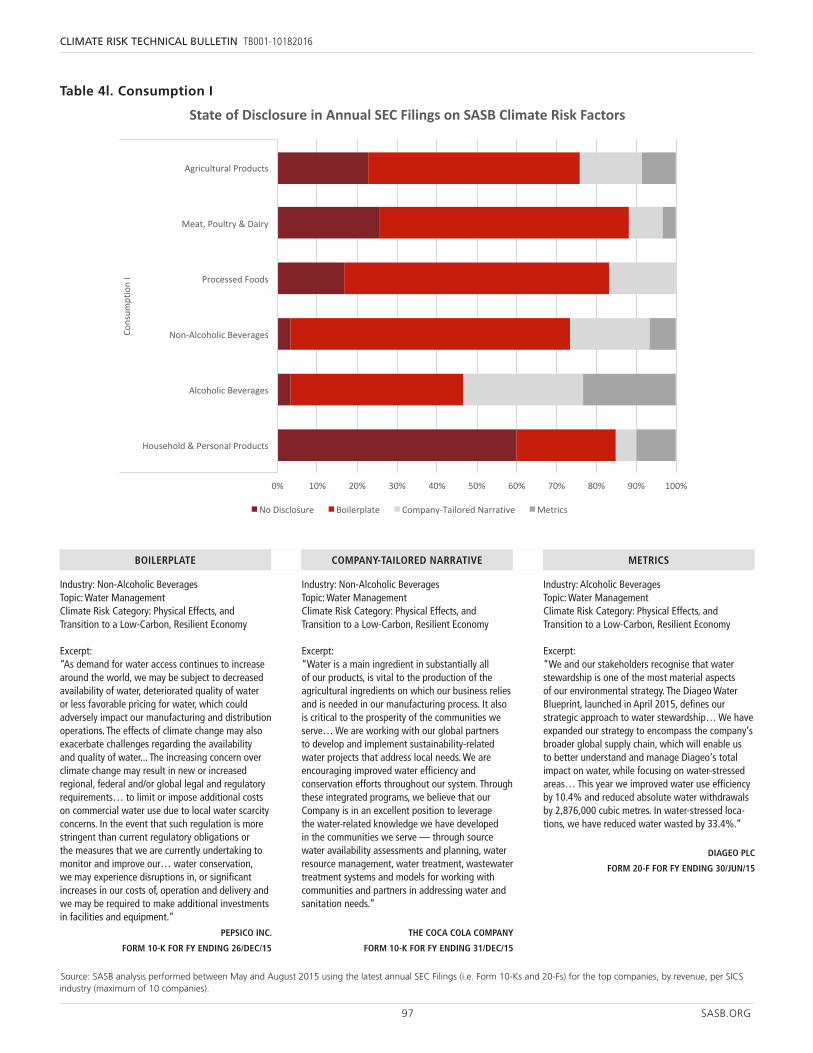
97 SASB.ORG
CLIMATE RISK TECHNICAL BULLETIN TB001-10182016
Source: SASB analysis performed between May and August 2015 using the latest annual SEC Filings (i.e. Form 10-Ks and 20-Fs) for the top companies, by revenue, per SICS industry (maximum of 10 companies).
Consumption I
10/5/1622
0% 10% 20% 30% 40% 50% 60% 70% 80% 90% 100%
Household&PersonalProducts
AlcoholicBeverages
Non-AlcoholicBeverages
ProcessedFoods
Meat,Poultry&Dairy
AgriculturalProducts
ConsumptionI
StateofDisclosureinAnnualSECFilingsonSASBClimateRiskFactors
NoDisclosure Boilerplate Company-TailoredNarrative Metrics
Source: SASB analysis performed between May and August 2015 using the latest annual SEC Filings (i.e. Form 10-Ks and 20-Fs) for the top companies, by revenue, per SICS industry (maximum of 10 companies).
Table 4l. Consumption I
Industry: Non-Alcoholic BeveragesTopic: Water ManagementClimate Risk Category: Physical Effects, and Transition to a Low-Carbon, Resilient Economy
Excerpt: “As demand for water access continues to increase around the world, we may be subject to decreased availability of water, deteriorated quality of water or less favorable pricing for water, which could adversely impact our manufacturing and distribution operations. The effects of climate change may also exacerbate challenges regarding the availability and quality of water... The increasing concern over climate change may result in new or increased regional, federal and/or global legal and regulatory requirements… to limit or impose additional costs on commercial water use due to local water scarcity concerns. In the event that such regulation is more stringent than current regulatory obligations or the measures that we are currently undertaking to monitor and improve our… water conservation, we may experience disruptions in, or significant increases in our costs of, operation and delivery and we may be required to make additional investments in facilities and equipment.”
PEPSICO INC.
FORM 10-K FOR FY ENDING 26/DEC/15
Industry: Non-Alcoholic BeveragesTopic: Water ManagementClimate Risk Category: Physical Effects, and Transition to a Low-Carbon, Resilient Economy
Excerpt: “Water is a main ingredient in substantially all of our products, is vital to the production of the agricultural ingredients on which our business relies and is needed in our manufacturing process. It also is critical to the prosperity of the communities we serve… We are working with our global partners to develop and implement sustainability-related water projects that address local needs. We are encouraging improved water efficiency and conservation efforts throughout our system. Through these integrated programs, we believe that our Company is in an excellent position to leverage the water-related knowledge we have developed in the communities we serve — through source water availability assessments and planning, water resource management, water treatment, wastewater treatment systems and models for working with communities and partners in addressing water and sanitation needs.”
THE COCA COLA COMPANY
FORM 10-K FOR FY ENDING 31/DEC/15
Industry: Alcoholic BeveragesTopic: Water ManagementClimate Risk Category: Physical Effects, and Transition to a Low-Carbon, Resilient Economy
Excerpt: “We and our stakeholders recognise that water stewardship is one of the most material aspects of our environmental strategy. The Diageo Water Blueprint, launched in April 2015, defines our strategic approach to water stewardship… We have expanded our strategy to encompass the company‘s broader global supply chain, which will enable us to better understand and manage Diageo‘s total impact on water, while focusing on water-stressed areas… This year we improved water use efficiency by 10.4% and reduced absolute water withdrawals by 2,876,000 cubic metres. In water-stressed loca-tions, we have reduced water wasted by 33.4%.”
DIAGEO PLC
FORM 20-F FOR FY ENDING 30/JUN/15
BOILERPLATE COMPANY-TAILORED NARRATIVE METRICS
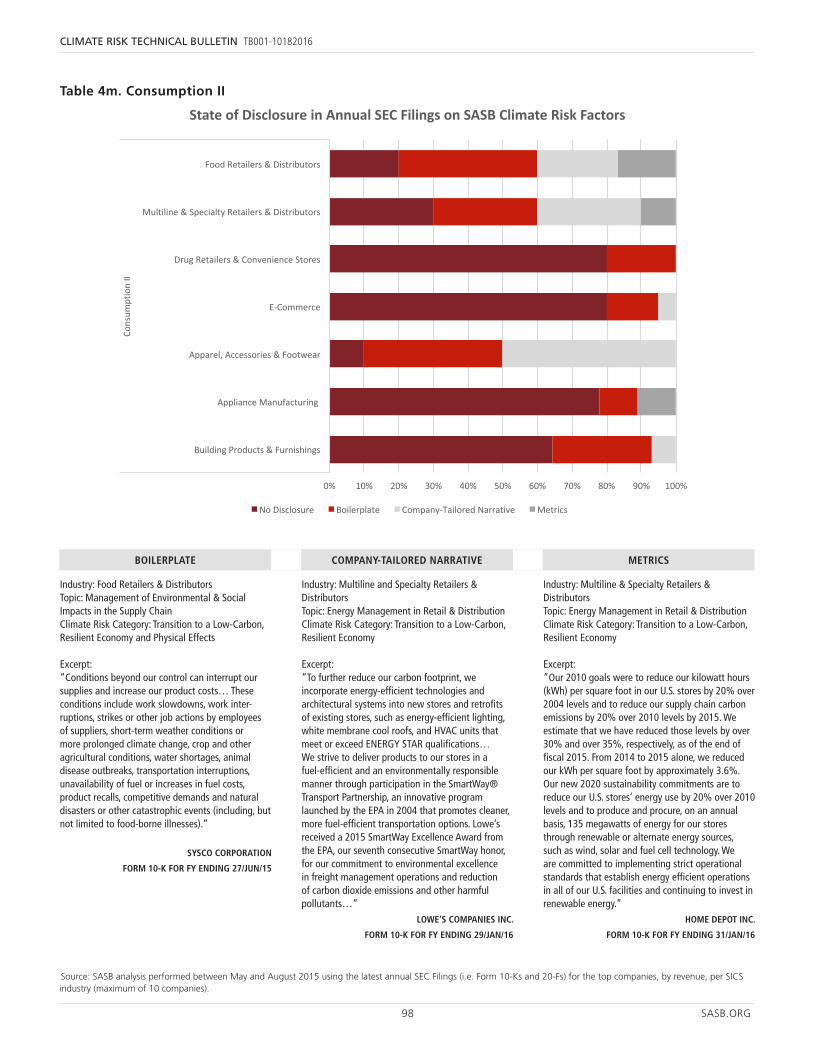
98 SASB.ORG
CLIMATE RISK TECHNICAL BULLETIN TB001-10182016
Source: SASB analysis performed between May and August 2015 using the latest annual SEC Filings (i.e. Form 10-Ks and 20-Fs) for the top companies, by revenue, per SICS industry (maximum of 10 companies).
Consumption II
10/5/1624
0% 10% 20% 30% 40% 50% 60% 70% 80% 90% 100%
BuildingProducts&Furnishings
ApplianceManufacturing
Apparel,Accessories&Footwear
E-Commerce
DrugRetailers&ConvenienceStores
Multiline&SpecialtyRetailers&Distributors
FoodRetailers&Distributors
ConsumptionII
StateofDisclosureinAnnualSECFilingsonSASBClimateRiskFactors
NoDisclosure Boilerplate Company-TailoredNarrative Metrics
Source: SASB analysis performed between May and August 2015 using the latest annual SEC Filings (i.e. Form 10-Ks and 20-Fs) for the top companies, by revenue, per SICS industry (maximum of 10 companies).
Table 4m. Consumption II
Industry: Food Retailers & DistributorsTopic: Management of Environmental & Social Impacts in the Supply ChainClimate Risk Category: Transition to a Low-Carbon, Resilient Economy and Physical Effects
Excerpt: “Conditions beyond our control can interrupt our supplies and increase our product costs… These conditions include work slowdowns, work inter-ruptions, strikes or other job actions by employees of suppliers, short-term weather conditions or more prolonged climate change, crop and other agricultural conditions, water shortages, animal disease outbreaks, transportation interruptions, unavailability of fuel or increases in fuel costs, product recalls, competitive demands and natural disasters or other catastrophic events (including, but not limited to food-borne illnesses).”
SYSCO CORPORATION
FORM 10-K FOR FY ENDING 27/JUN/15
Industry: Multiline and Specialty Retailers & DistributorsTopic: Energy Management in Retail & DistributionClimate Risk Category: Transition to a Low-Carbon, Resilient Economy
Excerpt: “To further reduce our carbon footprint, we incorporate energy-efficient technologies and architectural systems into new stores and retrofits of existing stores, such as energy-efficient lighting, white membrane cool roofs, and HVAC units that meet or exceed ENERGY STAR qualifications… We strive to deliver products to our stores in a fuel-efficient and an environmentally responsible manner through participation in the SmartWay® Transport Partnership, an innovative program launched by the EPA in 2004 that promotes cleaner, more fuel-efficient transportation options. Lowe’s received a 2015 SmartWay Excellence Award from the EPA, our seventh consecutive SmartWay honor, for our commitment to environmental excellence in freight management operations and reduction of carbon dioxide emissions and other harmful pollutants…”
LOWE’S COMPANIES INC.
FORM 10-K FOR FY ENDING 29/JAN/16
Industry: Multiline & Specialty Retailers & DistributorsTopic: Energy Management in Retail & DistributionClimate Risk Category: Transition to a Low-Carbon, Resilient Economy
Excerpt: “Our 2010 goals were to reduce our kilowatt hours (kWh) per square foot in our U.S. stores by 20% over 2004 levels and to reduce our supply chain carbon emissions by 20% over 2010 levels by 2015. We estimate that we have reduced those levels by over 30% and over 35%, respectively, as of the end of fiscal 2015. From 2014 to 2015 alone, we reduced our kWh per square foot by approximately 3.6%. Our new 2020 sustainability commitments are to reduce our U.S. stores’ energy use by 20% over 2010 levels and to produce and procure, on an annual basis, 135 megawatts of energy for our stores through renewable or alternate energy sources, such as wind, solar and fuel cell technology. We are committed to implementing strict operational standards that establish energy efficient operations in all of our U.S. facilities and continuing to invest in renewable energy.”
HOME DEPOT INC.
FORM 10-K FOR FY ENDING 31/JAN/16
BOILERPLATE COMPANY-TAILORED NARRATIVE METRICS
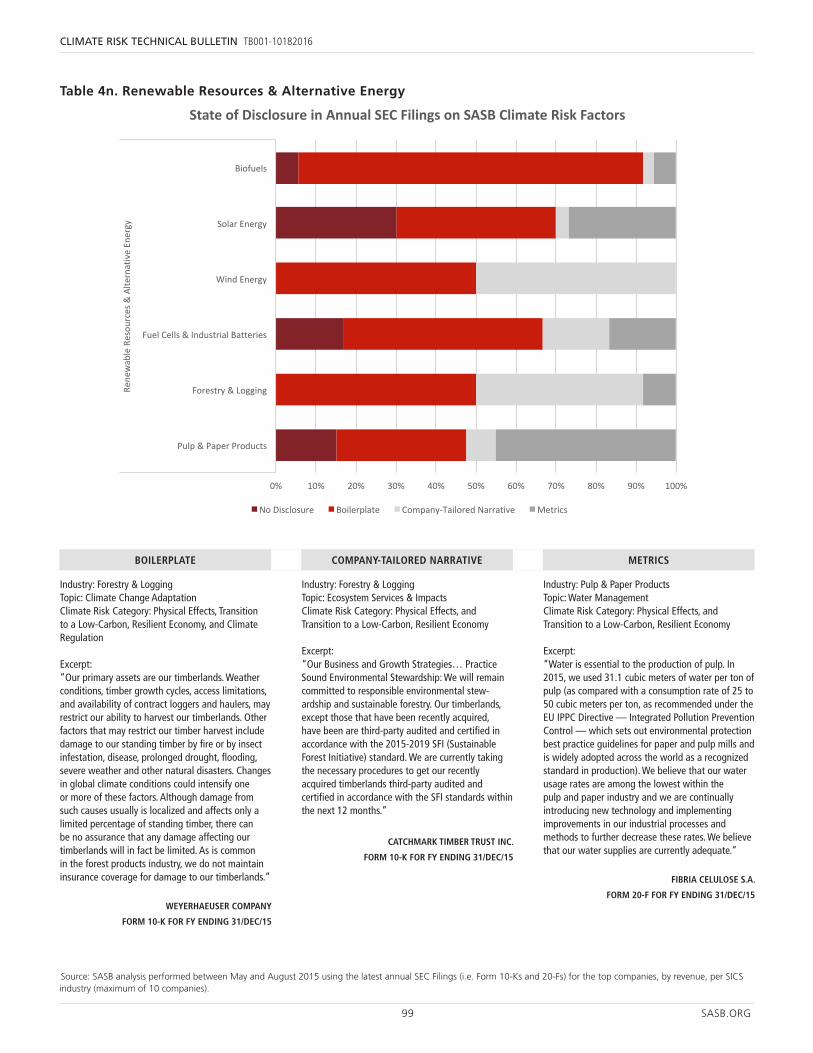
99 SASB.ORG
CLIMATE RISK TECHNICAL BULLETIN TB001-10182016
Source: SASB analysis performed between May and August 2015 using the latest annual SEC Filings (i.e. Form 10-Ks and 20-Fs) for the top companies, by revenue, per SICS industry (maximum of 10 companies).
Renewable Resources & Alternative Energy
10/5/1626
0% 10% 20% 30% 40% 50% 60% 70% 80% 90% 100%
Pulp&PaperProducts
Forestry&Logging
FuelCells&IndustrialBatteries
WindEnergy
SolarEnergy
Biofuels
RenewableResources&AlternativeEnergy
StateofDisclosureinAnnualSECFilingsonSASBClimateRiskFactors
NoDisclosure Boilerplate Company-TailoredNarrative Metrics
Source: SASB analysis performed between May and August 2015 using the latest annual SEC Filings (i.e. Form 10-Ks and 20-Fs) for the top companies, by revenue, per SICS industry (maximum of 10 companies).
Table 4n. Renewable Resources & Alternative Energy
Industry: Forestry & LoggingTopic: Climate Change AdaptationClimate Risk Category: Physical Effects, Transition to a Low-Carbon, Resilient Economy, and Climate Regulation
Excerpt: “Our primary assets are our timberlands. Weather conditions, timber growth cycles, access limitations, and availability of contract loggers and haulers, may restrict our ability to harvest our timberlands. Other factors that may restrict our timber harvest include damage to our standing timber by fire or by insect infestation, disease, prolonged drought, flooding, severe weather and other natural disasters. Changes in global climate conditions could intensify one or more of these factors. Although damage from such causes usually is localized and affects only a limited percentage of standing timber, there can be no assurance that any damage affecting our timberlands will in fact be limited. As is common in the forest products industry, we do not maintain insurance coverage for damage to our timberlands.”
WEYERHAEUSER COMPANY
FORM 10-K FOR FY ENDING 31/DEC/15
Industry: Forestry & LoggingTopic: Ecosystem Services & ImpactsClimate Risk Category: Physical Effects, and Transition to a Low-Carbon, Resilient Economy
Excerpt: “Our Business and Growth Strategies… Practice Sound Environmental Stewardship: We will remain committed to responsible environmental stew-ardship and sustainable forestry. Our timberlands, except those that have been recently acquired, have been are third-party audited and certified in accordance with the 2015-2019 SFI (Sustainable Forest Initiative) standard. We are currently taking the necessary procedures to get our recently acquired timberlands third-party audited and certified in accordance with the SFI standards within the next 12 months.”
CATCHMARK TIMBER TRUST INC.
FORM 10-K FOR FY ENDING 31/DEC/15
Industry: Pulp & Paper ProductsTopic: Water ManagementClimate Risk Category: Physical Effects, and Transition to a Low-Carbon, Resilient Economy
Excerpt: “Water is essential to the production of pulp. In 2015, we used 31.1 cubic meters of water per ton of pulp (as compared with a consumption rate of 25 to 50 cubic meters per ton, as recommended under the EU IPPC Directive — Integrated Pollution Prevention Control — which sets out environmental protection best practice guidelines for paper and pulp mills and is widely adopted across the world as a recognized standard in production). We believe that our water usage rates are among the lowest within the pulp and paper industry and we are continually introducing new technology and implementing improvements in our industrial processes and methods to further decrease these rates. We believe that our water supplies are currently adequate.”
FIBRIA CELULOSE S.A.
FORM 20-F FOR FY ENDING 31/DEC/15
BOILERPLATE COMPANY-TAILORED NARRATIVE METRICS
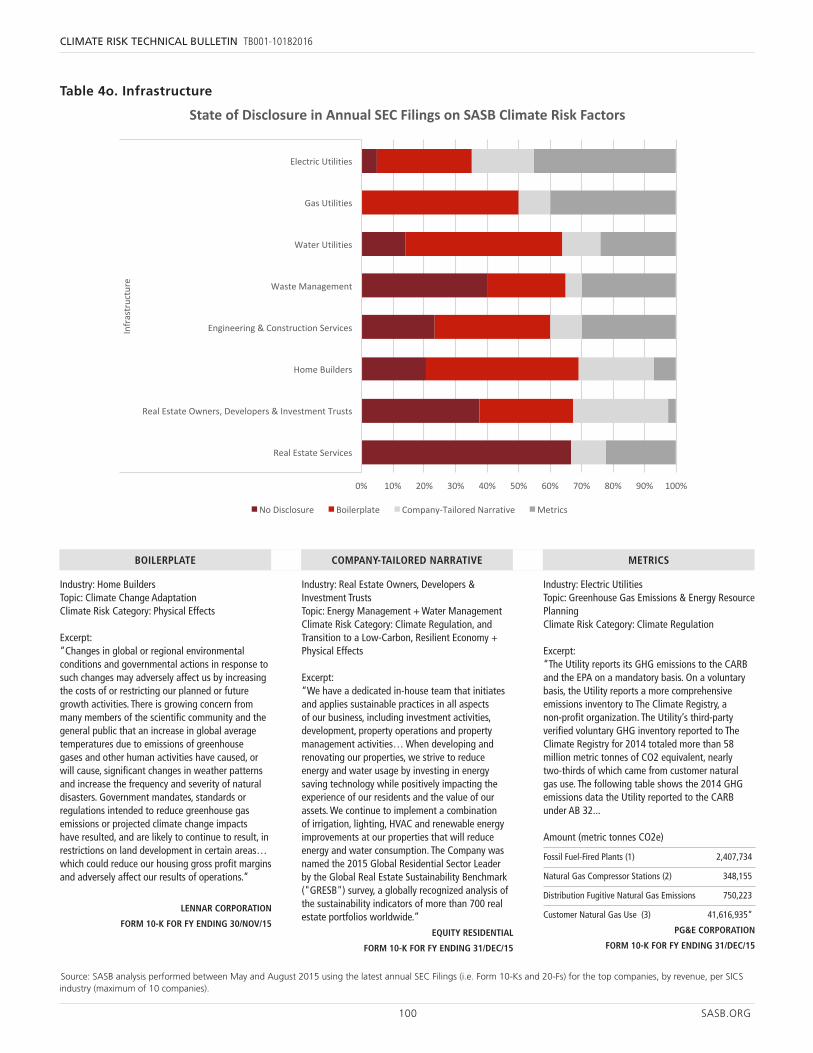
100 SASB.ORG
CLIMATE RISK TECHNICAL BULLETIN TB001-10182016
Source: SASB analysis performed between May and August 2015 using the latest annual SEC Filings (i.e. Form 10-Ks and 20-Fs) for the top companies, by revenue, per SICS industry (maximum of 10 companies).
Infrastructure
10/5/1628
0% 10% 20% 30% 40% 50% 60% 70% 80% 90% 100%
RealEstateServices
RealEstateOwners,Developers&InvestmentTrusts
HomeBuilders
Engineering&ConstructionServices
WasteManagement
WaterUtilities
GasUtilities
ElectricUtilities
Infrastructure
StateofDisclosureinAnnualSECFilingsonSASBClimateRiskFactors
NoDisclosure Boilerplate Company-TailoredNarrative Metrics
Source: SASB analysis performed between May and August 2015 using the latest annual SEC Filings (i.e. Form 10-Ks and 20-Fs) for the top companies, by revenue, per SICS industry (maximum of 10 companies).
Table 4o. Infrastructure
Industry: Home BuildersTopic: Climate Change AdaptationClimate Risk Category: Physical Effects
Excerpt: “Changes in global or regional environmental conditions and governmental actions in response to such changes may adversely affect us by increasing the costs of or restricting our planned or future growth activities. There is growing concern from many members of the scientific community and the general public that an increase in global average temperatures due to emissions of greenhouse gases and other human activities have caused, or will cause, significant changes in weather patterns and increase the frequency and severity of natural disasters. Government mandates, standards or regulations intended to reduce greenhouse gas emissions or projected climate change impacts have resulted, and are likely to continue to result, in restrictions on land development in certain areas… which could reduce our housing gross profit margins and adversely affect our results of operations.”
LENNAR CORPORATION
FORM 10-K FOR FY ENDING 30/NOV/15
Industry: Real Estate Owners, Developers & Investment TrustsTopic: Energy Management + Water ManagementClimate Risk Category: Climate Regulation, and Transition to a Low-Carbon, Resilient Economy + Physical Effects
Excerpt: “We have a dedicated in-house team that initiates and applies sustainable practices in all aspects of our business, including investment activities, development, property operations and property management activities… When developing and renovating our properties, we strive to reduce energy and water usage by investing in energy saving technology while positively impacting the experience of our residents and the value of our assets. We continue to implement a combination of irrigation, lighting, HVAC and renewable energy improvements at our properties that will reduce energy and water consumption. The Company was named the 2015 Global Residential Sector Leader by the Global Real Estate Sustainability Benchmark ("GRESB") survey, a globally recognized analysis of the sustainability indicators of more than 700 real estate portfolios worldwide.”
EQUITY RESIDENTIAL
FORM 10-K FOR FY ENDING 31/DEC/15
Industry: Electric UtilitiesTopic: Greenhouse Gas Emissions & Energy Resource PlanningClimate Risk Category: Climate Regulation
Excerpt: “The Utility reports its GHG emissions to the CARB and the EPA on a mandatory basis. On a voluntary basis, the Utility reports a more comprehensive emissions inventory to The Climate Registry, a non-profit organization. The Utility’s third-party verified voluntary GHG inventory reported to The Climate Registry for 2014 totaled more than 58 million metric tonnes of CO 2 equivalent, nearly two-thirds of which came from customer natural gas use. The following table shows the 2014 GHG emissions data the Utility reported to the CARB under AB 32...
Amount (metric tonnes CO2e)
Fossil Fuel-Fired Plants (1) 2,407,734
Natural Gas Compressor Stations (2) 348,155
Distribution Fugitive Natural Gas Emissions 750,223
Customer Natural Gas Use (3) 41,616,935”
PG&E CORPORATION
FORM 10-K FOR FY ENDING 31/DEC/15
BOILERPLATE COMPANY-TAILORED NARRATIVE METRICS
101 SASB.ORG
CLIMATE RISK TECHNICAL BULLETIN TB001-10182016
Conclusion
The movement to understand and manage climate risk in investment portfolios continues to gain momentum among mainstream investors, who have called it “one of the defining issues of our time,”42 and said that “investors can no longer ignore climate change.”43 Adding to this urgency, G20 leaders have reiterated calls for “timely implementation” of the global climate agreement reached in November 2015 at the United Nations Climate Change Conference (COP21) in Paris.44
Although climate risk is not new, the market is only just beginning to develop a practical understanding of it. Many organizations have made important contributions to this effort, but important work remains to be done. SASB hopes this report will inspire progress on that front. Corporate disclosure, in particular, remains inadequate and improvements in this area would profoundly enhance investors’ ability to better understand and manage their climate-related risk exposures. SASB standards are designed to improve the effectiveness of sustainability-re-lated disclosures by corporations, including those on material climate risks and opportunities, in a way that is decision-useful to investors and cost-effective for companies. This effort aligns with the goals of the TCFD as well. As FSB Chair Mark Carney has said, “one of the potential benefits of improved disclosures [is] helping to make a market. This requires that investors have the information they need to seek out prospective risks and rewards across all sectors, from agriculture to car manufacturing
42 Merrill Lynch, “A Call to Action – Climate Change Solutions Primer,” November 27, 201
43 BlackRock, “Adapting Portfolios to Climate Change,” September 2016; https://www.blackrock.com/investing/literature/whitepaper/bii-climate-change-2016-us.pdf
44 G20, “Hangzhou Action Plan,” September 8, 2016; http://g20.org/English/Documents/Current/201609/t20160908_3410.html
to consumer goods.”45 The Task Force is an important comple-ment to SASB’s work, because in order to understand potential systematic risks to an investment portfolio and systemic risks to the economy, different types of disclosure may be needed beyond those that are reasonable and appropriate for companies to make under existing securities law. SASB standards enable an understanding of the residual risk related to climate change that may be present in an investment portfolio: i.e., entity-specific risk and shared industry factors.
As the market’s understanding of climate risk continues to evolve, companies, investors, regulators, and policymakers will adapt, taking new approaches to understand and mitigate risks and capitalize on opportunities. While these developments unfold, the SASB standards will evolve alongside them. SASB engages in ongoing consultation with both issuers and investors to ensure the maintenance of decision-useful, cost-effective standards. As changes occur in an industry’s competitive context, in the climate itself, or in the interests of the reasonable investor, this bottom-up, market-based approach is key to ensuring that the SASB standards continue to support market needs.
With the tools and information that are beginning to emerge, addressing climate risk can no longer be viewed as a zero-sum game. By pushing for more effective and efficient pricing of climate risks across the financial system, investors have the opportunity to alter investing patterns to manage risk and to create sustainable, long-term value for themselves, their portfolio companies, and the economy at large.
45 Mark Carney, Chair of the Financial Stability Board and Governor of the Bank of England, “Resolving the Climate Paradox” (speech), Sept. 22, 2016; http://www.bankofengland.co.uk/publications/Documents/speeches/2016/speech923.pdf
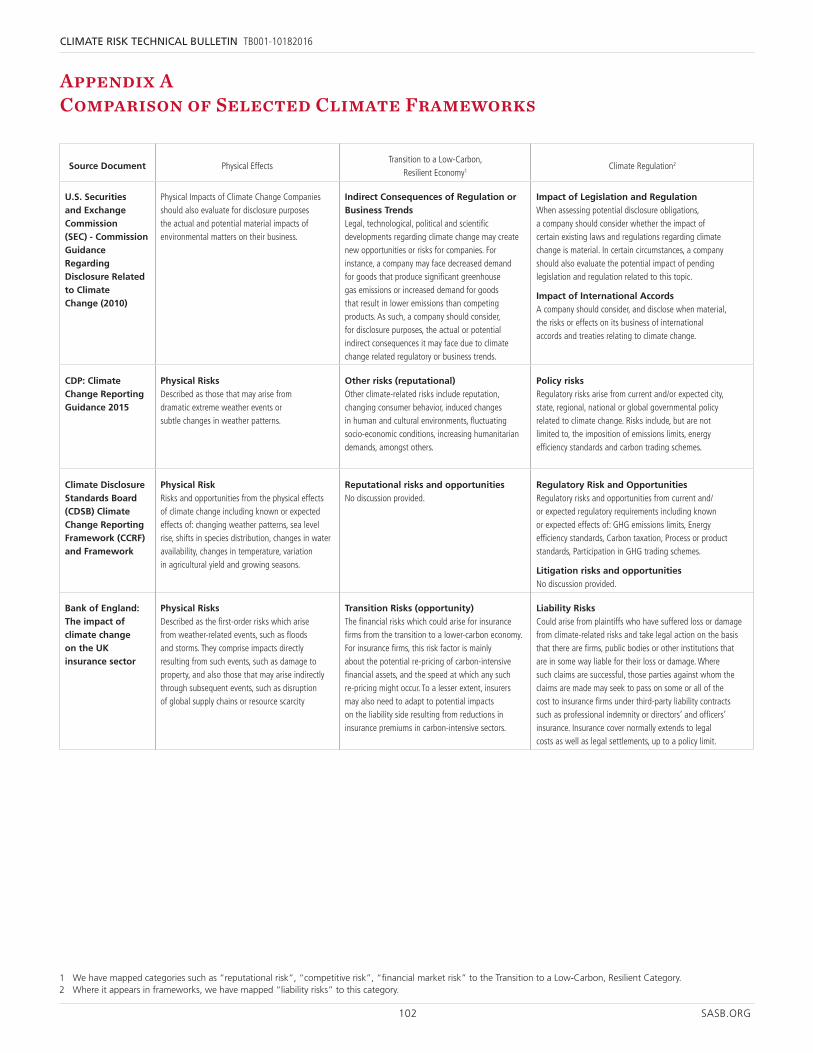
102 SASB.ORG
CLIMATE RISK TECHNICAL BULLETIN TB001-10182016
Source Document Physical EffectsTransition to a Low-Carbon,
Resilient Economy1 Climate Regulation2
U.S. Securities and Exchange Commission (SEC) - Commission Guidance Regarding Disclosure Related to Climate Change (2010)
Physical Impacts of Climate Change Companies should also evaluate for disclosure purposes the actual and potential material impacts of environmental matters on their business.
Indirect Consequences of Regulation or Business Trends Legal, technological, political and scientific developments regarding climate change may create new opportunities or risks for companies. For instance, a company may face decreased demand for goods that produce significant greenhouse gas emissions or increased demand for goods that result in lower emissions than competing products. As such, a company should consider, for disclosure purposes, the actual or potential indirect consequences it may face due to climate change related regulatory or business trends.
Impact of Legislation and Regulation When assessing potential disclosure obligations, a company should consider whether the impact of certain existing laws and regulations regarding climate change is material. In certain circumstances, a company should also evaluate the potential impact of pending legislation and regulation related to this topic.
Impact of International Accords A company should consider, and disclose when material, the risks or effects on its business of international accords and treaties relating to climate change.
CDP: Climate Change Reporting Guidance 2015
Physical Risks Described as those that may arise from dramatic extreme weather events or subtle changes in weather patterns.
Other risks (reputational) Other climate-related risks include reputation, changing consumer behavior, induced changes in human and cultural environments, fluctuating socio-economic conditions, increasing humanitarian demands, amongst others.
Policy risks Regulatory risks arise from current and/or expected city, state, regional, national or global governmental policy related to climate change. Risks include, but are not limited to, the imposition of emissions limits, energy efficiency standards and carbon trading schemes.
Climate Disclosure Standards Board (CDSB) Climate Change Reporting Framework (CCRF) and Framework
Physical Risk Risks and opportunities from the physical effects of climate change including known or expected effects of: changing weather patterns, sea level rise, shifts in species distribution, changes in water availability, changes in temperature, variation in agricultural yield and growing seasons.
Reputational risks and opportunities No discussion provided.
Regulatory Risk and Opportunities Regulatory risks and opportunities from current and/or expected regulatory requirements including known or expected effects of: GHG emissions limits, Energy efficiency standards, Carbon taxation, Process or product standards, Participation in GHG trading schemes.
Litigation risks and opportunities No discussion provided.
Bank of England: The impact of climate change on the UK insurance sector
Physical Risks Described as the first-order risks which arise from weather-related events, such as floods and storms. They comprise impacts directly resulting from such events, such as damage to property, and also those that may arise indirectly through subsequent events, such as disruption of global supply chains or resource scarcity
Transition Risks (opportunity) The financial risks which could arise for insurance firms from the transition to a lower-carbon economy. For insurance firms, this risk factor is mainly about the potential re-pricing of carbon-intensive financial assets, and the speed at which any such re-pricing might occur. To a lesser extent, insurers may also need to adapt to potential impacts on the liability side resulting from reductions in insurance premiums in carbon-intensive sectors.
Liability Risks Could arise from plaintiffs who have suffered loss or damage from climate-related risks and take legal action on the basis that there are firms, public bodies or other institutions that are in some way liable for their loss or damage. Where such claims are successful, those parties against whom the claims are made may seek to pass on some or all of the cost to insurance firms under third-party liability contracts such as professional indemnity or directors’ and officers’ insurance. Insurance cover normally extends to legal costs as well as legal settlements, up to a policy limit.
Appendix A Comparison of Selected Climate Frameworks
1 We have mapped categories such as “reputational risk”, “competitive risk”, “financial market risk” to the Transition to a Low-Carbon, Resilient Category. 2 Where it appears in frameworks, we have mapped “liability risks” to this category.
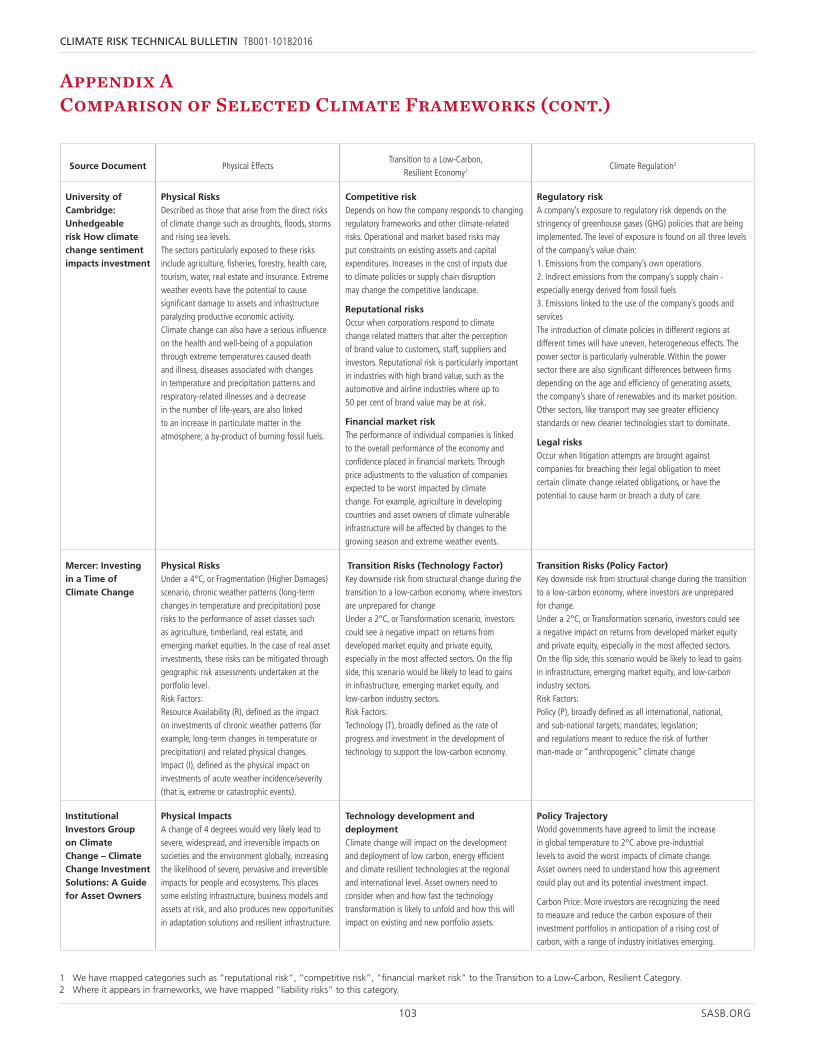
103 SASB.ORG
CLIMATE RISK TECHNICAL BULLETIN TB001-10182016
Source Document Physical EffectsTransition to a Low-Carbon,
Resilient Economy1 Climate Regulation2
University of Cambridge: Unhedgeable risk How climate change sentiment impacts investment
Physical Risks Described as those that arise from the direct risks of climate change such as droughts, floods, storms and rising sea levels. The sectors particularly exposed to these risks include agriculture, fisheries, forestry, health care, tourism, water, real estate and insurance. Extreme weather events have the potential to cause significant damage to assets and infrastructure paralyzing productive economic activity. Climate change can also have a serious influence on the health and well-being of a population through extreme temperatures caused death and illness, diseases associated with changes in temperature and precipitation patterns and respiratory-related illnesses and a decrease in the number of life-years, are also linked to an increase in particulate matter in the atmosphere; a by-product of burning fossil fuels.
Competitive risk Depends on how the company responds to changing regulatory frameworks and other climate-related risks. Operational and market based risks may put constraints on existing assets and capital expenditures. Increases in the cost of inputs due to climate policies or supply chain disruption may change the competitive landscape.
Reputational risks Occur when corporations respond to climate change related matters that alter the perception of brand value to customers, staff, suppliers and investors. Reputational risk is particularly important in industries with high brand value, such as the automotive and airline industries where up to 50 per cent of brand value may be at risk.
Financial market risk The performance of individual companies is linked to the overall performance of the economy and confidence placed in financial markets. Through price adjustments to the valuation of companies expected to be worst impacted by climate change. For example, agriculture in developing countries and asset owners of climate vulnerable infrastructure will be affected by changes to the growing season and extreme weather events.
Regulatory risk A company’s exposure to regulatory risk depends on the stringency of greenhouse gases (GHG) policies that are being implemented. The level of exposure is found on all three levels of the company’s value chain: 1. Emissions from the company’s own operations 2. Indirect emissions from the company’s supply chain - especially energy derived from fossil fuels 3. Emissions linked to the use of the company’s goods and services The introduction of climate policies in different regions at different times will have uneven, heterogeneous effects. The power sector is particularly vulnerable. Within the power sector there are also significant differences between firms depending on the age and efficiency of generating assets, the company’s share of renewables and its market position. Other sectors, like transport may see greater efficiency standards or new cleaner technologies start to dominate.
Legal risks Occur when litigation attempts are brought against companies for breaching their legal obligation to meet certain climate change related obligations, or have the potential to cause harm or breach a duty of care.
Mercer: Investing in a Time of Climate Change
Physical Risks Under a 4°C, or Fragmentation (Higher Damages) scenario, chronic weather patterns (long-term changes in temperature and precipitation) pose risks to the performance of asset classes such as agriculture, timberland, real estate, and emerging market equities. In the case of real asset investments, these risks can be mitigated through geographic risk assessments undertaken at the portfolio level. Risk Factors: Resource Availability (R), defined as the impact on investments of chronic weather patterns (for example, long-term changes in temperature or precipitation) and related physical changes. Impact (I), defined as the physical impact on investments of acute weather incidence/severity (that is, extreme or catastrophic events).
Transition Risks (Technology Factor) Key downside risk from structural change during the transition to a low-carbon economy, where investors are unprepared for change Under a 2°C, or Transformation scenario, investors could see a negative impact on returns from developed market equity and private equity, especially in the most affected sectors. On the flip side, this scenario would be likely to lead to gains in infrastructure, emerging market equity, and low-carbon industry sectors. Risk Factors: Technology (T), broadly defined as the rate of progress and investment in the development of technology to support the low-carbon economy.
Transition Risks (Policy Factor) Key downside risk from structural change during the transition to a low-carbon economy, where investors are unprepared for change. Under a 2°C, or Transformation scenario, investors could see a negative impact on returns from developed market equity and private equity, especially in the most affected sectors. On the flip side, this scenario would be likely to lead to gains in infrastructure, emerging market equity, and low-carbon industry sectors. Risk Factors: Policy (P), broadly defined as all international, national, and sub-national targets; mandates; legislation; and regulations meant to reduce the risk of further man-made or “anthropogenic” climate change
Institutional Investors Group on Climate Change – Climate Change Investment Solutions: A Guide for Asset Owners
Physical Impacts A change of 4 degrees would very likely lead to severe, widespread, and irreversible impacts on societies and the environment globally, increasing the likelihood of severe, pervasive and irreversible impacts for people and ecosystems. This places some existing infrastructure, business models and assets at risk, and also produces new opportunities in adaptation solutions and resilient infrastructure.
Technology development and deployment Climate change will impact on the development and deployment of low carbon, energy efficient and climate resilient technologies at the regional and international level. Asset owners need to consider when and how fast the technology transformation is likely to unfold and how this will impact on existing and new portfolio assets.
Policy Trajectory World governments have agreed to limit the increase in global temperature to 2°C above pre-industrial levels to avoid the worst impacts of climate change. Asset owners need to understand how this agreement could play out and its potential investment impact.
Carbon Price: More investors are recognizing the need to measure and reduce the carbon exposure of their investment portfolios in anticipation of a rising cost of carbon, with a range of industry initiatives emerging.
Appendix A Comparison of Selected Climate Frameworks (cont.)
1 We have mapped categories such as “reputational risk”, “competitive risk”, “financial market risk” to the Transition to a Low-Carbon, Resilient Category. 2 Where it appears in frameworks, we have mapped “liability risks” to this category.
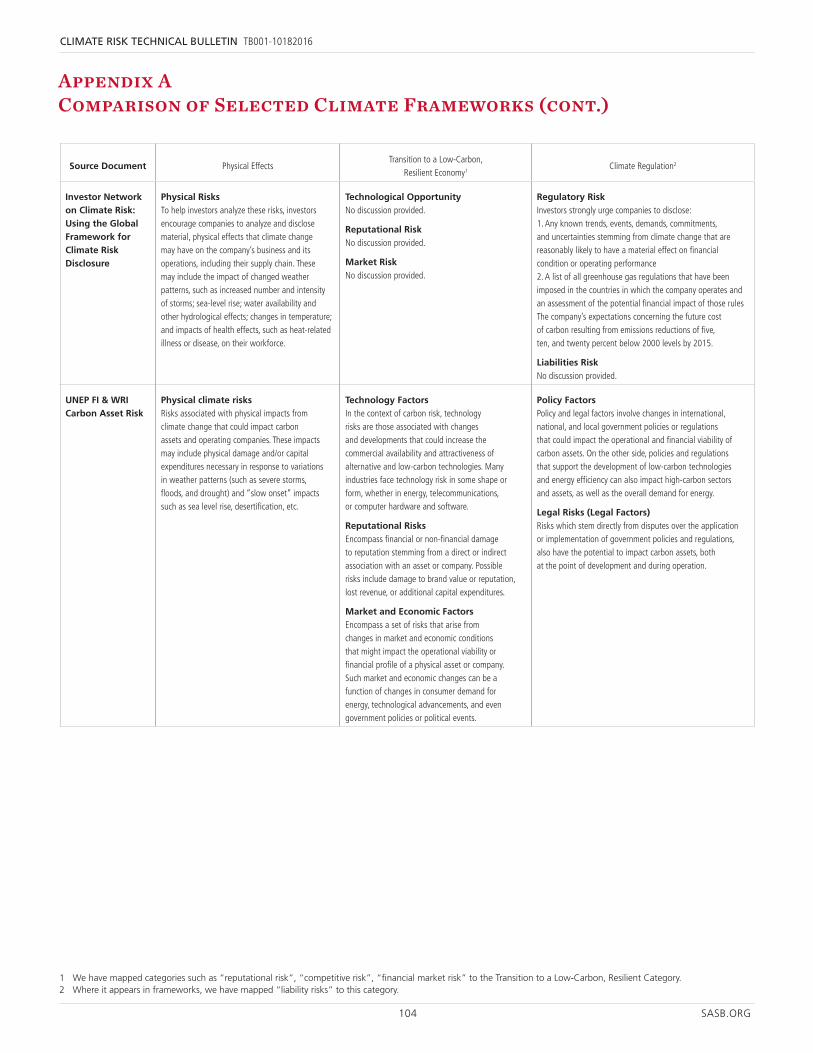
104 SASB.ORG
CLIMATE RISK TECHNICAL BULLETIN TB001-10182016
Source Document Physical EffectsTransition to a Low-Carbon,
Resilient Economy1 Climate Regulation2
Investor Network on Climate Risk: Using the Global Framework for Climate Risk Disclosure
Physical Risks To help investors analyze these risks, investors encourage companies to analyze and disclose material, physical effects that climate change may have on the company’s business and its operations, including their supply chain. These may include the impact of changed weather patterns, such as increased number and intensity of storms; sea-level rise; water availability and other hydrological effects; changes in temperature; and impacts of health effects, such as heat-related illness or disease, on their workforce.
Technological Opportunity No discussion provided.
Reputational Risk No discussion provided.
Market Risk No discussion provided.
Regulatory Risk Investors strongly urge companies to disclose: 1. Any known trends, events, demands, commitments, and uncertainties stemming from climate change that are reasonably likely to have a material effect on financial condition or operating performance 2. A list of all greenhouse gas regulations that have been imposed in the countries in which the company operates and an assessment of the potential financial impact of those rules The company’s expectations concerning the future cost of carbon resulting from emissions reductions of five, ten, and twenty percent below 2000 levels by 2015.
Liabilities Risk No discussion provided.
UNEP FI & WRI Carbon Asset Risk
Physical climate risks Risks associated with physical impacts from climate change that could impact carbon assets and operating companies. These impacts may include physical damage and/or capital expenditures necessary in response to variations in weather patterns (such as severe storms, floods, and drought) and “slow onset” impacts such as sea level rise, desertification, etc.
Technology Factors In the context of carbon risk, technology risks are those associated with changes and developments that could increase the commercial availability and attractiveness of alternative and low-carbon technologies. Many industries face technology risk in some shape or form, whether in energy, telecommunications, or computer hardware and software.
Reputational Risks Encompass financial or non-financial damage to reputation stemming from a direct or indirect association with an asset or company. Possible risks include damage to brand value or reputation, lost revenue, or additional capital expenditures.
Market and Economic Factors Encompass a set of risks that arise from changes in market and economic conditions that might impact the operational viability or financial profile of a physical asset or company. Such market and economic changes can be a function of changes in consumer demand for energy, technological advancements, and even government policies or political events.
Policy Factors Policy and legal factors involve changes in international, national, and local government policies or regulations that could impact the operational and financial viability of carbon assets. On the other side, policies and regulations that support the development of low-carbon technologies and energy efficiency can also impact high-carbon sectors and assets, as well as the overall demand for energy.
Legal Risks (Legal Factors) Risks which stem directly from disputes over the application or implementation of government policies and regulations, also have the potential to impact carbon assets, both at the point of development and during operation.
Appendix A Comparison of Selected Climate Frameworks (cont.)
1 We have mapped categories such as “reputational risk”, “competitive risk”, “financial market risk” to the Transition to a Low-Carbon, Resilient Category. 2 Where it appears in frameworks, we have mapped “liability risks” to this category.
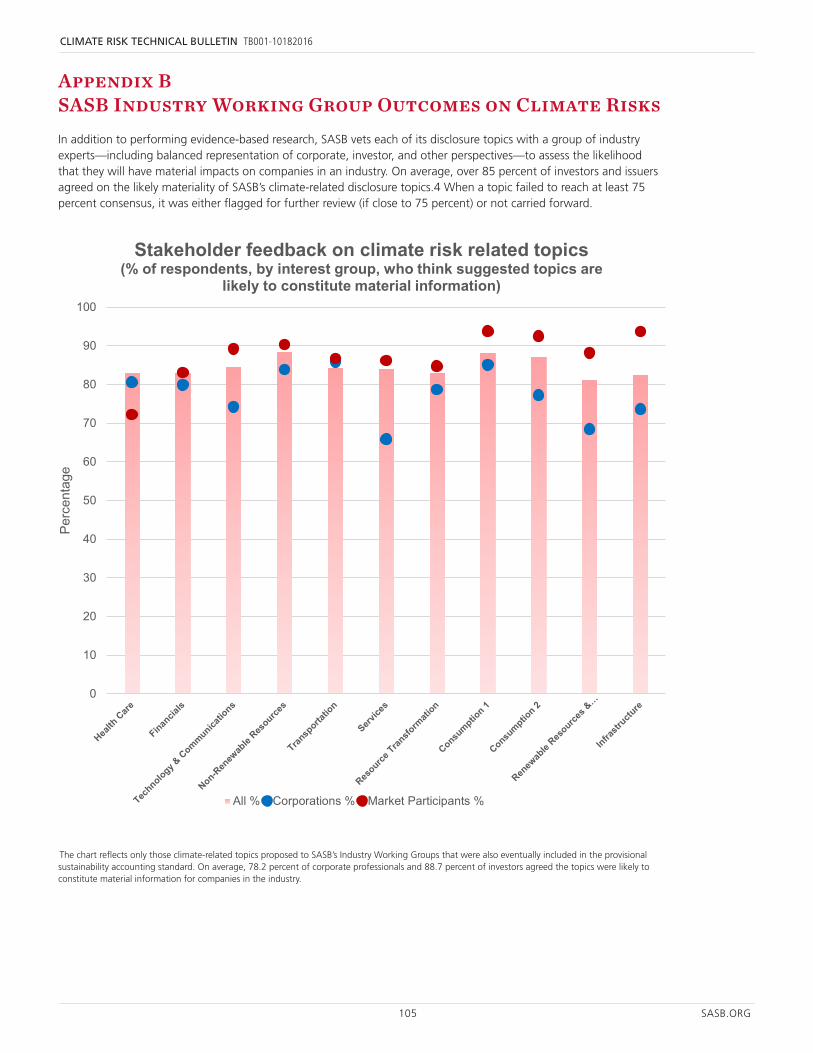
105 SASB.ORG
CLIMATE RISK TECHNICAL BULLETIN TB001-10182016
Appendix B SASB Industry Working Group Outcomes on Climate Risks
Appendix B: SASB Industry Working Group Outcomes on Climate Risks
In addition to performing evidence-based research, SASB vets each of its disclosure topics with a group of industry experts—including balanced representation of corporate, investor, and other perspectives—to assess the likelihood that they will have material impacts on companies in an industry. On average, over 85 percent of investors and issuers agreed on the likely materiality of SASB’s climate-related disclosure topics.4 When a topic failed to reach at least 75 percent consensus, it was either flagged for further review (if close to 75 percent) or not carried forward.
4 The chart reflects only those climate-related topics proposed to SASB’s Industry Working Groups that were also eventually included in the provisional sustainability accounting standard. On average, 78.2 percent of corporate professionals and 88.7 percent of investors agreed the topics were likely to constitute material information for companies in the industry.
0
10
20
30
40
50
60
70
80
90
100
Perc
enta
ge
Stakeholder feedback on climate risk related topics(% of respondents, by interest group, who think suggested topics are
likely to constitute material information)
All % Corporations % Market Participants %
WORKING DRAFT: FOR COMMENT SASB TECHNICAL BULLETIN 2016-01—CLIMATE RISK
© 2016 SUSTAINABILITY ACCOUNTING STANDARDS BOARD 69
In addition to performing evidence-based research, SASB vets each of its disclosure topics with a group of industry experts—including balanced representation of corporate, investor, and other perspectives—to assess the likelihood that they will have material impacts on companies in an industry. On average, over 85 percent of investors and issuers agreed on the likely materiality of SASB’s climate-related disclosure topics.4 When a topic failed to reach at least 75 percent consensus, it was either flagged for further review (if close to 75 percent) or not carried forward.
The chart reflects only those climate-related topics proposed to SASB’s Industry Working Groups that were also eventually included in the provisional sustainability accounting standard. On average, 78.2 percent of corporate professionals and 88.7 percent of investors agreed the topics were likely to constitute material information for companies in the industry.
SUSTAINABILITY ACCOUNTING STANDARDS BOARD1045 Sansome Street, Suite 450San Francisco, CA [email protected](415) 830-9220sasb.org