Embed Size (px)
Citation preview
1
THIS REPORT CONTAINS ASSESSMENTS OF COMMODITY AND TRADE ISSUES MADE BY
USDA STAFF AND NOT NECESSARILY STATEMENTS OF OFFICIAL U.S. GOVERNMENT
POLICY
Date:
GAIN Report Number:
Approved By:
Prepared By:
Report Highlights:
EU-28 production of peaches and nectarines in MY 2017/18 is estimated at 4 million MT, 6 percent
higher compared to the previous harvest due to favorable weather conditions. Total cherry production
in MY 2017/18 is projected at 576,346 MT, a 21 percent decrease compared with last season, following
the downward trend of the last two years, where the growth in Italy and Spain could not compensate the
strong decline in Poland and Germany. Due to the Russian ban, the value of EU-28 stone fruit exports
experienced important declines. During MY 2016/17 volumes of cherries imported from the United
States decreased by 47 percent. In MY 2017/18 U.S. cherries exports may also be hurt by the French
pesticide ban.
Carmen Valverde, Agricultural Specialist
Rachel Bickford, Agricultural Attaché
2017
Stone Fruit Annual
EU-28
SP1727
8/22/2017
Required Report - public distribution
2
Disclaimer: This report presents the situation and outlook for stone fruit including peaches, nectarines
and cherries in the EU-28. The report presents the views of the authors and does not reflect the official
view of the U.S. Department of Agriculture (USDA). The data are not official USDA data.
This report was written with the contributions of the following Foreign Agricultural Service analysts:
Ornella Bettini FAS/Rome covering Italy
Dimosthenis Faniadis FAS/Rome covering Greece
Xavier Audran FAS/Paris covering France
Mila Boshnakova FAS/Sofia covering Bulgaria
Mira Kobuszynska FAS/Warsaw covering Poland
Sabine Lieberz FAS/ Berlin covering Germany
Gellert Golya FAS/Budapest covering Hungary
Carmen Valverde FAS/Madrid covering Spain and Portugal
Tania de Belder FAS/USEU Brussels covering the EU policy section
Abbreviations and definitions used in this report
GTA Global Trade Atlas
Ha hectare; 1 ha = 2.471 acres
HS Codes Harmonized System codes for commodity classification used to calculate trade data.
Peaches and nectarines HS Code 080930
Cherries HS Code 080921, 080929
MT Metric ton = 1,000 kg
MMT Million metric tons
MS EU member state(s)
MY Marketing year: January/December
Note: The European Union Member States (MS) are mandated to annually provide the EU Commission
with data concerning the “production area” of permanent crops. This means “the area that can
potentially be harvested in the reference harvest year. It excludes all non-producing areas, such as new
plantations that have not yet started to produce” (Regulation (EC) No 543/2009 of the European
Parliament and of the Council of 18 June 2009, Article 2 (f)). In this report this corresponds to the line
“Planted Area”. Some MS also publish harvested data, but not all of them, and as such in this report the
line “Area Harvested” is an FAS Post estimate.
3
Executive Summary
The main EU-28 producers of peaches and nectarines are Spain, Italy, Greece and France, in this order.
The area planted to peaches and nectarines in the EU decreased in MY 2016/17 to 229,000 ha and
according to FAS post projections the harvested area is projected to remain stable in MY 2017/18 at
210,000 ha. Productivity gains were achieved with the introduction of new, higher yielding varieties
that bring more diversity in the types of fruit and increased spread in harvest dates where Spain is
gaining ground.
Production of peaches and nectarines in MY 2017/18 for the EU-28 is estimated at 4 million MT, six
percent higher compared to the MY 2016/17 harvest, due to an expected increase in the most of the
major producers due to favorable weather conditions.
In MY 2017/18 fresh consumption of peaches and nectarines is projected to slightly increase reaching
almost 3 MMT. Peaches and nectarines for processing may also increase by 13 percent due to a higher
supply compared to previous year and low prices of peach and nectarine in the fresh market.
The EU is a net exporter of peaches and nectarines with exports largely exceeding imports. The main
suppliers of peaches and nectarines to the EU-28 in MY 2016/17 were South Africa and Chile. The
EU’s imports of peaches and nectarines were valued at 82 million USD in MY 2016/17 with 31,172
MT, 10 percent higher than previous year due to the decrease in production.
In the first half of 2017 EU-28 imports of peaches and nectarines declined 14 percent with decreased
imports from Chile and Turkey. Given the higher production forecasts in MY 2017/18 imports will
continue to decrease.
The EU’s exports of peaches and nectarines were valued at 164 million USD in MY 2016/17, a 17
percent decrease in value and 24 percent lower volume from the previous year reaching 225,822 MT.
Due to the Russian ban, in MY 2016/17 EU’s exports of peaches and nectarines valued around 171
million USD less compared to MY 2014/15. The main destination for EU-28 peaches and nectarines in
MY 2016/17 was Belarus followed by Switzerland and Ukraine. EU’s exports of peaches and nectarines
from Greece and Spain to Serbia experienced an important growth in MY 2016/17.
In the first half of 2017 EU-28 exports of peaches and nectarines rose 22 percent due to the increased
demand in export markets. Due to higher production forecasts in MY 2017/18 exports may increase to
historical, pre-Russian ban levels.
The main EU-28 producers of fresh cherries are Poland, Italy, and Spain. Traditionally Germany was in
forth position but in the last few years, Greece and Hungary have surpassed German cherry production.
Poland is the EU’s largest cherry processor transforming 75 percent of its cherry crop. Spain is the
4
biggest exporter due to its early season harvest. Italy is the number one consumer of fresh cherries.
According to FAS projections, the updated data of total EU planted area of cherries estimates an area of
around 155,000 ha in MY 2017/18.
Total cherry production in MY 2017/18 is projected at 576,346 MT, or 21 percent decrease compared
with last season, following the downward trend of the last two years, where the expected growth in Italy
and Spain could not compensate the strong decline in Poland and Germany due to unfavorable weather
conditions.
Consumption of fresh cherries in the EU may decline with an estimated volume of around 391,000 MT
in MY 2017/18. Also cherries for processing may also decrease 61 percent in MY 2017/18, due to the
lack in Polish production.
The EU imports of fresh cherries were valued at 203 million USD in MY 2016/17, a 51 percent increase
from the previous year with a total volume of 57,697 MT or 57 percent higher than previous year. The
EU-28 imported only 423MT of cherries from the United States in MY 2016/17, a decline of 47 percent
compared to previous year and valued at 3 million US Dollars, 10 million U.S. Dollars less compared to
MY 2014/15, continuing with this downward trend in the first half of 2017. While the U.S. was the
fourth largest non-EU supplier of cherries to EU-28, France decision to renew its ban imports of cherries
(at least until 12/31/2017) from countries where Dimethoate can be legally used on cherry trees
effectively cut access to the French market to U.S., Canada and Turkish cherries.
In the first half of 2017 EU-28 imports of cherries declined 35 percent and forecasts in MY 2017/2018
predicts imports may slightly decrease again.
The main destinations for the major EU producers are other Member States; the most important external
destinations are Belarus and Serbia experiencing an important growth mainly from Greece and Hungary.
The EU exports of fresh cherries in MY 2016/17 were valued at 35 million USD, 32 percent decrease
from the previous year with 47 percent lower volume, reaching 25,076 MT. Since the Russian embargo
in MY 2014/15, EU’s exports of cherries valued 41 million US Dollars less.
During the first half of 2017, EU-28 exports of cherries increased 14 percent in volume, valued 24
percent more, due to the growth in the main countries of destinations.
5
Commodities
Fresh Peaches & Nectarines
The main EU-28 producers of peaches and nectarines are Spain, Italy, Greece and France, in this order.
There is also limited production in other EU MS, including Hungary, Portugal, Bulgaria and Poland.
Italy used to be the EU’s largest producer but in the last years Spain is the biggest producer and exporter
due to its early season harvest and yielding varieties. Greece is the leading EU peach processor.
Crop Area
The area planted of peaches and nectarines in the EU decreased in MY 2016/17 at around 229,000 ha
and according to FAS post projections the harvested area is projected to remain stable in MY 2017/18 at
around 210,000 ha. This is the result of productivity gains achieved with the introduction of new and
higher yielding varieties that bring more diversity in the types of fruit and spread in harvest dates.
On the other hand, due to its competitiveness, Spain is gaining market share at the expense of other main
producers as shown by Spain’s increase in planted area in the last years. In Spain, the production area is
moving southwards to take advantage of an extra-early harvest which is possible with a number of low-
chilling varieties. The growing of peach and nectarine trees is concentrated in the regions of Cataluña,
Aragón and Murcia, along the Mediterranean arch. Andalusia and Extremadura are also important
growing regions. Spanish crop area is around 86,000 ha.
Italian crop area is around 69,000 ha experiencing a downward trend in the last 2 years. . Planted areas
continue to reduce in Emilia-Romagna and Piedmont due to the Sharka disease, while stabilizing in
Veneto after years of strong reductions, and increasing in Puglia. Stone fruit production plays a key role
in the agricultural sector of several Italian regions, both in the North (especially in Emilia-Romagna and
Piedmont) and in the South (Campania). The bulk of the Italian harvest occurs in June and July.
Greek farms are typically up to five hectares, much smaller than the average size in either the rest of the
EU or the United States. According to industry estimates, there are approximately 48,000 hectares
currently cultivated for peaches and nectarines. The main producing areas include four areas (Imathia,
Pella, Pieria, and Kozani) of Central Macedonia located in northern Greece, and the area of Larissa, in
Thessaly, Central Greece. Most of the crop is harvested in June and July.
In France, peaches and nectarines orchards continued to shrink due to poor economic conditions
combined with losses of trees due to the Sharka disease, reaching almost 9,000 ha.
In Hungary, the total crop area of peaches is about 6,600 ha. Most of the orchards are in the southern
part of the Hungarian Great Plain. The relative number of trees is low (350-500/hectare) and the
average age of orchards is 15-24 years on more than 40 percent of the growing areas. About 100-150 ha
are replanted annually. “Redhaven” variety is cultivated in the largest area. It accounts for 16 percent of
peach orchards, while “Suncrest” peach accounts for 10 percent and “Champion” for 7 percent.
“Dixired” and “Early Redhaven” are also popular.
6
In Poland during 2015 and 2016 peach orchards decreased to 2,500 hectares, meaning a decline of 7.4
percent due to economic reasons.
Production
Production of peaches and nectarines in MY 2017/18 for the EU-28 is estimated at 4 million MT, 6
percent higher compared to the previous campaign MY 2016/17 due to an expected increase in the most
of the major producers. Production in the main producing countries is shown in Table 1 below.
Table 1. Major EU Fresh Peach & Nectarine Producers by Volume in MT
Country MY 2015/16 MY 2016/17 MY 2017/18
Spain 1,581,510 1,475,849 1,487,444
Italy 1,408,504 1,262,127 1,362,749
Greece 777,160 788,120 910,000
France 217,146 207,004 214,800
Source: FAS EU-28 offices
Spain
Spain has become in the last 4 seasons the largest peach and nectarine producer in EU-28. Growth for
both peaches and nectarines production in the country’s most important regions, Aragón, Cataluña and
Murcia, together with the important increases in Extremadura, Andalusia and Region of Valencia, are
the main factor for the higher overall Spanish production of peaches and nectarines. There has been an
increase of early and mid-season peaches, mainly due to good flowering and fruit set, as well as the
entry into production of new varieties. Spanish stone fruit has an important advantage in terms of
quality due to the vast varietal renewal that has taken place in recent years. Newer varieties with more
intense flavors and color have been planted.
According to the latest official estimations of the Spanish Ministry of Agriculture, Fisheries, Food and
Environment (MAPAMA), peach and nectarine production in Spain for MY 2017/18 is projected to
reach almost 1.487 MMT accounting for almost 40 percent share of the total EU-28 peach and nectarine
production. This is 0.7 percent higher compared to the previous season due to favorable weather
conditions that resulted in a production with very good quality and calibers. Peach production is forecast
at 916,850 MT, while nectarine production is forecast at 570,594 MT or 2.5 percent lower than previous
year and 6.4 percent higher than previous year respectively.
Italy
Italy’s marketing year (MY) 2017/18 peach and nectarine production is forecast to increase by 8 percent
compared to the previous campaign due to increased volumes in the South (+15 percent for peaches and
+19 percent for nectarines), despite volume reductions registered in the North (-3 percent for peaches
and -8 percent for nectarines). Peach production is forecast at 589,342 metric tons (+10 percent
7
compared to MY 2016/17), while nectarine production is forecast at 688,621 MT (+5 percent compared
to MY 2016/17). The cling peach harvest is likely to reach 84,786 MT (+24 percent compared to MY
2016/17). Fruit quality is expected to be excellent, with smaller calibers and higher sugar content.
Greece
Greece’s MY 2017/18 peach and nectarine production is preliminary forecasted to increase by
15.5 percent due to favorable weather conditions during fruit set; the April occurred frost did
not affect peach and nectarine production but significantly reduced the yields of other crops.
Fresh peaches production is forecast to increase by approximately 17 percent, while nectarines
production is forecast to increase by 7 percent (at approximately 150,000 MT). Greece’s
MY2017/18 cling peach crop is forecast to increase by 25 percent (400,000 MT), due to new
plantations entering production.
France
France’s peaches and nectarines crop is expected to be up 4 percent compared to previous season due to
favorable weather condition in the spring, and 5 percent compared to the 5 year average due to lower
production area.
Hungary
In MY 2017/18 spring frost did not significantly damage the orchards but the record breaking heat and
draught occurred in July may limit fruit size and production. It is estimated a production in MY
2017/2018 of 40,000MT.
Portugal
In Portugal, the peach and nectarine orchards are mostly located in the inland center region. According
to Portuguese official data, peach production in MY 2016/17 reached 35,180 MT and may remain flat in
MY 2017/8. Nectarine production in Portugal is negligible.
Bulgaria
In MY 2017/18 peach and nectarine production may reach 34,000 MT.

8
Poland
In MY 2017/18 production of peaches is forecast at 2,000 MT, 81 percent lower than last year. Strong
spring frost damaged flowers and buds of peach trees which severely affected the overall peach crop
output. There were no losses in the number of peach trees after winter this year. Peach cultivation
profitability has been very low for the last years in Poland. The biggest peach orchard in the region of
Lower Silesia in Poland was cut off in 2015. The main problem for Polish peach growers is constant
lack of soil moisture and lack of capital for investments in irrigation. Low prices for peaches made some
growers to switch for other varieties fruit production. It is expected that the low harvest in MY 2017/18
will cause further decrease in peach orchards area.
Consumption
In MY 2017/18 fresh consumption of peaches and nectarines is projected to slightly increase reaching
almost 3 MMT. Peaches and nectarines for processing may also increase 13 percent due to a higher
supply compared to previous year and low prices of peach and nectarine in the fresh market.
Most Italian and Spanish peaches and nectarines are consumed fresh. Consumers in southern countries
generally prefer large, sweet, and pulpy fruits, while the North European markets prefer smaller, slightly
sour, and crunchy fruits. Apart from the economic situation and the industry’s concern for the
increasing complexity of the destination markets, the overall goal is to encourage consumption for a
product that is the primary summer fruit. Greek nectarine production is destined mainly for the fresh
market; freestone peaches are used for fresh consumption, and clingstone peaches are predominantly
used in processing. In France, consumption is expected to slightly increase due to good weather
conditions throughout the late spring and summer. In the last 10 years, annual fruit consumption
fluctuated between 37.5 and 48.5 kg/capita in Hungary. Stone fruits (including peaches and nectarines)
had a significant share of the domestic consumption.
Trade
The EU is a net exporter of peaches and nectarines with exports largely exceeding imports.
Imports
As seen in Table 2 below, the main suppliers of peaches and nectarines to the EU-28 in MY 2016/17
were South Africa and Chile. More than half of total imports are sourced in the southern hemisphere
and are imported during the European off-season. The EU’s imports of peaches and nectarines were
valued at 82 million USD in MY 2016/17 with 31,172 MT, 10 percent higher than previous year due to
the decrease in production.
In the first half of 2017 EU-28 imports of peaches and nectarines declined 14 percent with decreased
imports from Chile and Turkey. Due to higher production forecasts in MY 2017/18 imports may
decrease.
9
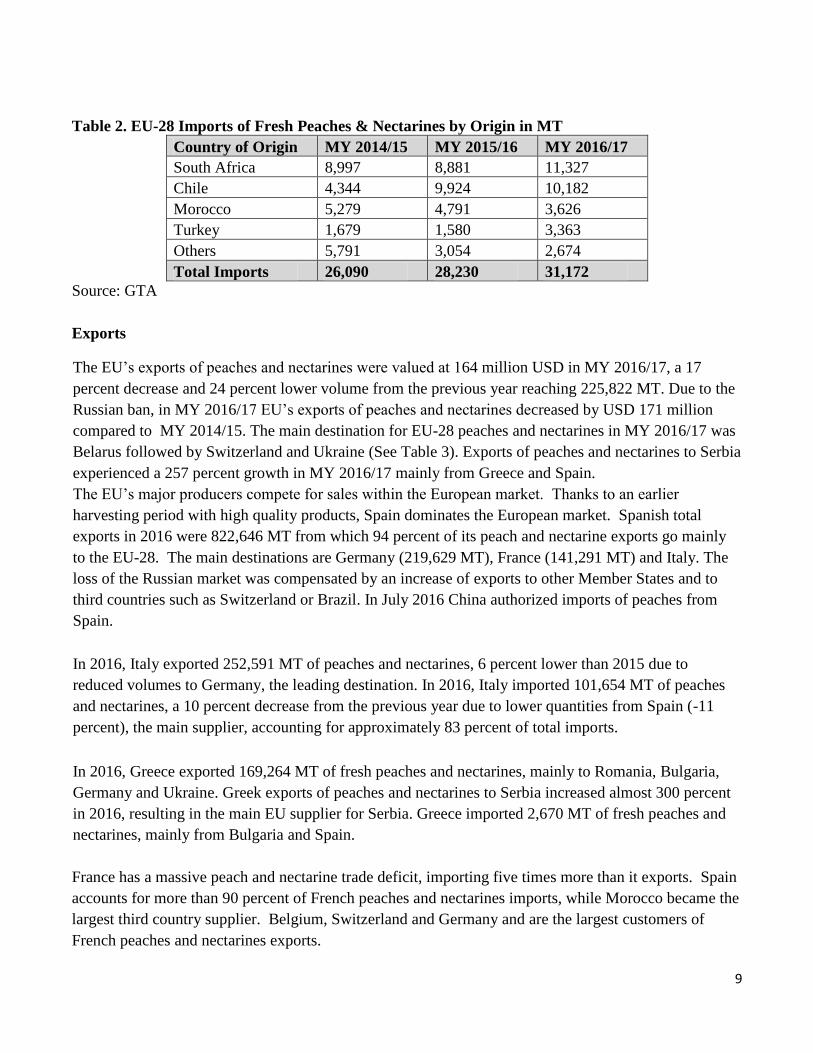
Table 2. EU-28 Imports of Fresh Peaches & Nectarines by Origin in MT
Country of Origin MY 2014/15 MY 2015/16 MY 2016/17
South Africa 8,997 8,881 11,327
Chile 4,344 9,924 10,182
Morocco 5,279 4,791 3,626
Turkey 1,679 1,580 3,363
Others 5,791 3,054 2,674
Total Imports 26,090 28,230 31,172
Source: GTA
Exports
The EU’s exports of peaches and nectarines were valued at 164 million USD in MY 2016/17, a 17
percent decrease and 24 percent lower volume from the previous year reaching 225,822 MT. Due to the
Russian ban, in MY 2016/17 EU’s exports of peaches and nectarines decreased by USD 171 million
compared to MY 2014/15. The main destination for EU-28 peaches and nectarines in MY 2016/17 was
Belarus followed by Switzerland and Ukraine (See Table 3). Exports of peaches and nectarines to Serbia
experienced a 257 percent growth in MY 2016/17 mainly from Greece and Spain.
The EU’s major producers compete for sales within the European market. Thanks to an earlier
harvesting period with high quality products, Spain dominates the European market. Spanish total
exports in 2016 were 822,646 MT from which 94 percent of its peach and nectarine exports go mainly
to the EU-28. The main destinations are Germany (219,629 MT), France (141,291 MT) and Italy. The
loss of the Russian market was compensated by an increase of exports to other Member States and to
third countries such as Switzerland or Brazil. In July 2016 China authorized imports of peaches from
Spain.
In 2016, Italy exported 252,591 MT of peaches and nectarines, 6 percent lower than 2015 due to
reduced volumes to Germany, the leading destination. In 2016, Italy imported 101,654 MT of peaches
and nectarines, a 10 percent decrease from the previous year due to lower quantities from Spain (-11
percent), the main supplier, accounting for approximately 83 percent of total imports.
In 2016, Greece exported 169,264 MT of fresh peaches and nectarines, mainly to Romania, Bulgaria,
Germany and Ukraine. Greek exports of peaches and nectarines to Serbia increased almost 300 percent
in 2016, resulting in the main EU supplier for Serbia. Greece imported 2,670 MT of fresh peaches and
nectarines, mainly from Bulgaria and Spain.
France has a massive peach and nectarine trade deficit, importing five times more than it exports. Spain
accounts for more than 90 percent of French peaches and nectarines imports, while Morocco became the
largest third country supplier. Belgium, Switzerland and Germany and are the largest customers of
French peaches and nectarines exports.
10
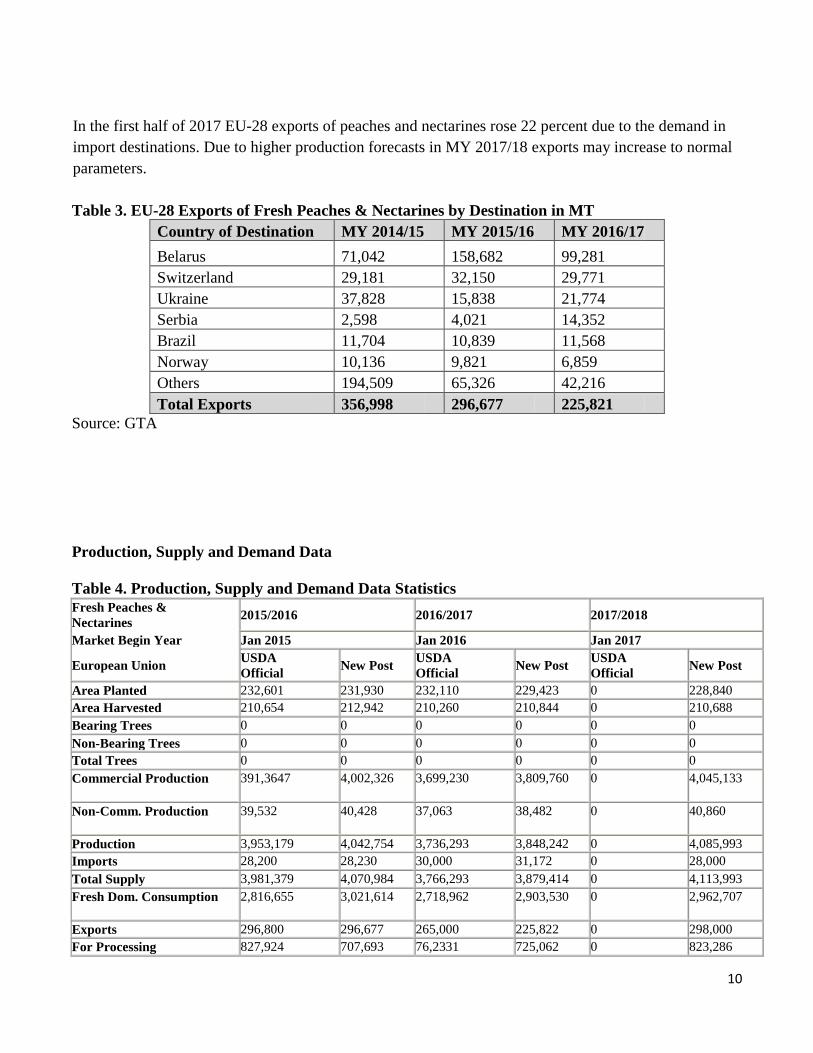
In the first half of 2017 EU-28 exports of peaches and nectarines rose 22 percent due to the demand in
import destinations. Due to higher production forecasts in MY 2017/18 exports may increase to normal
parameters.
Table 3. EU-28 Exports of Fresh Peaches & Nectarines by Destination in MT
Country of Destination MY 2014/15 MY 2015/16 MY 2016/17
Belarus 71,042 158,682 99,281
Switzerland 29,181 32,150 29,771
Ukraine 37,828 15,838 21,774
Serbia 2,598 4,021 14,352
Brazil 11,704 10,839 11,568
Norway 10,136 9,821 6,859
Others 194,509 65,326 42,216
Total Exports 356,998 296,677 225,821
Source: GTA
Production, Supply and Demand Data
Table 4. Production, Supply and Demand Data Statistics
Fresh Peaches &
Nectarines 2015/2016 2016/2017 2017/2018
Market Begin Year Jan 2015 Jan 2016 Jan 2017
European Union USDA
Official New Post
USDA
Official New Post
USDA
Official New Post
Area Planted 232,601 231,930 232,110 229,423 0 228,840
Area Harvested 210,654 212,942 210,260 210,844 0 210,688
Bearing Trees 0 0 0 0 0 0
Non-Bearing Trees 0 0 0 0 0 0
Total Trees 0 0 0 0 0 0
Commercial Production 391,3647 4,002,326 3,699,230 3,809,760 0 4,045,133
Non-Comm. Production 39,532 40,428 37,063 38,482 0 40,860
Production 3,953,179 4,042,754 3,736,293 3,848,242 0 4,085,993
Imports 28,200 28,230 30,000 31,172 0 28,000
Total Supply 3,981,379 4,070,984 3,766,293 3,879,414 0 4,113,993
Fresh Dom. Consumption 2,816,655 3,021,614 2,718,962 2,903,530 0 2,962,707
Exports 296,800 296,677 265,000 225,822 0 298,000
For Processing 827,924 707,693 76,2331 725,062 0 823,286
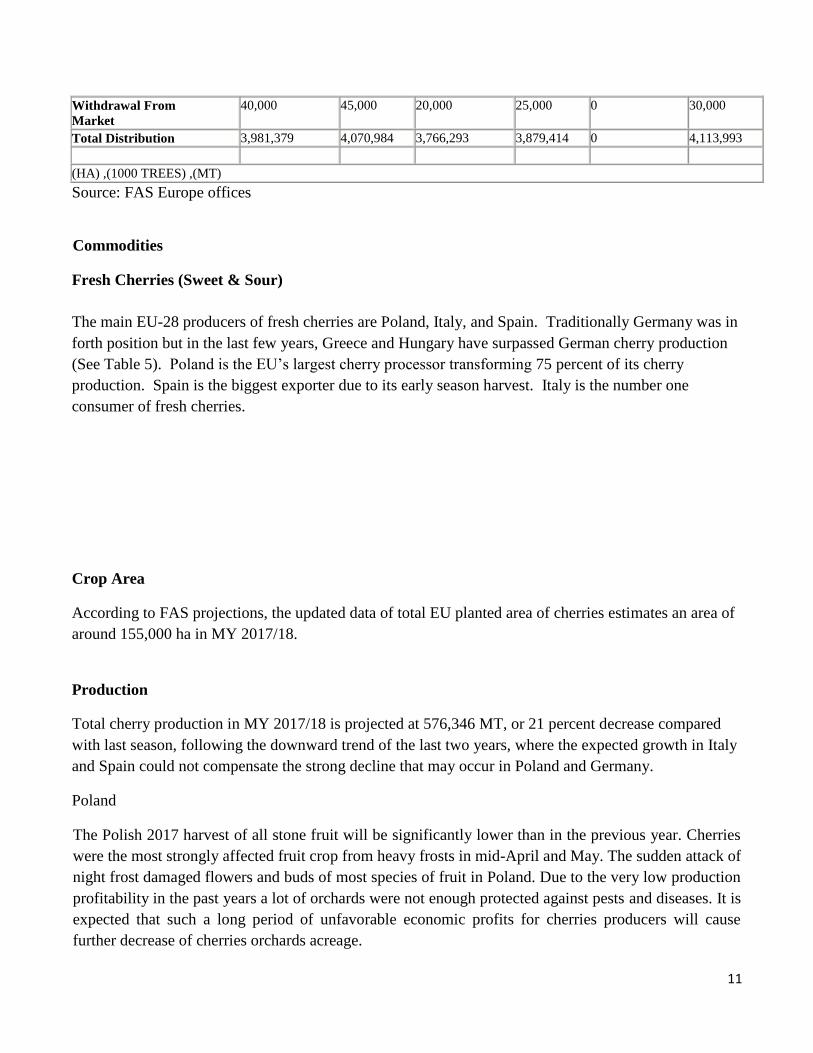
11
Withdrawal From
Market
40,000 45,000 20,000 25,000 0 30,000
Total Distribution 3,981,379 4,070,984 3,766,293 3,879,414 0 4,113,993
(HA) ,(1000 TREES) ,(MT)
Source: FAS Europe offices
Commodities
Fresh Cherries (Sweet & Sour)
The main EU-28 producers of fresh cherries are Poland, Italy, and Spain. Traditionally Germany was in
forth position but in the last few years, Greece and Hungary have surpassed German cherry production
(See Table 5). Poland is the EU’s largest cherry processor transforming 75 percent of its cherry
production. Spain is the biggest exporter due to its early season harvest. Italy is the number one
consumer of fresh cherries.
Crop Area
According to FAS projections, the updated data of total EU planted area of cherries estimates an area of
around 155,000 ha in MY 2017/18.
Production
Total cherry production in MY 2017/18 is projected at 576,346 MT, or 21 percent decrease compared
with last season, following the downward trend of the last two years, where the expected growth in Italy
and Spain could not compensate the strong decline that may occur in Poland and Germany.
Poland
The Polish 2017 harvest of all stone fruit will be significantly lower than in the previous year. Cherries
were the most strongly affected fruit crop from heavy frosts in mid-April and May. The sudden attack of
night frost damaged flowers and buds of most species of fruit in Poland. Due to the very low production
profitability in the past years a lot of orchards were not enough protected against pests and diseases. It is
expected that such a long period of unfavorable economic profits for cherries producers will cause
further decrease of cherries orchards acreage.
12
It is forecasted that due to smaller crop and very high production costs Polish fruit processors will
source 64 percent less sour cherries than in the last year. For more information, see GAIN Report
Poland- 2017 Stone Fruit Annual.
Italy
Italy’s MY 2017/18 cherry production is preliminarily forecast at 105,000 MT, an increase of 10.6
percent compared to the previous marketing year, thanks to favorable weather conditions during
flowering and fruit set, especially in Puglia that accounts for approximately 30 percent of national
production. Fruit quality is expected to be excellent. Bigarreau, Giorgia, and Ferrovia are the main
cherry varieties grown in Italy. Puglia, Campania, Emilia-Romagna, and Veneto are the leading
producing areas. Furthermore, new orchards are entering in regime in Trentino.
Spain
According to the Ministry of Agriculture, Fisheries, Food and Environment (MAPAMA) Spanish cherry
production for MY 2017/18 is projected at 100,946 MT, 16.5 percent rise from the previous year’s level.
The main cherry producing areas are Extremadura, accounting for over 35 percent of Spain’s total, and
Aragon, responsible for over 20 percent of Spain’s production.
In Spain, cherry harvesting takes place from the end of April through mid-August. The dominant
varieties are: Napoleon, which is sold fresh and used for jams; Ambrunesa, which is a late variety with a
crispy consistency and sweet taste; and, Burlat, an early harvested variety bearing a thick fruit with red,
strong, juicy and sweet pulp. Some new varieties include Starking, Lapins, Summit, Vittoria, Van
(California), Picota and Sandy. The sour varieties include Richmond, Montmorency, and Morello.
Greece
Greece’s MY 2017/18 cherry season is forecast to decrease 13.8 percent after a record production in
2016, because of unfavorable weather conditions during blossom, which minimized fruit set, and rainfall
that occurred on the harvest period. Pella and Imathia in Northern Greece are the main producing areas.
Hungary
13
Cherry crops accounts for about 10 percent of the total fruit production of the country. Although tart
cherry area has increased since 2014, yield varied significantly.
In MY 2017/18 frosts damages in late spring may result in lower production estimated at about
70,000MT due to the limited production last year and the favorable weather, flowering was very strong
and promising in early April. Then, night frosts and cold occurring several times in April as well as the
windy and wet weather during flowering caused losses. Bloom stage was abnormally long and
pollinators activity was low. Therefore, heterogeneous fruit sizes were formed, which resulted in more
intense fruit drop than it is usual. Annual sweet cherry production is around 11,000MT in Hungary and
is expected to remain flat in 2017 because of spring frosts and notable fruit drop after flowering. New
Hungarian hybrids, such as “Carmen”, “Rita” and “Vera” are getting more popular among farmers. The
main production areas are Bács-Kiskun and Szabolcs-Szatmár-Bereg Counties.
Germany
Total German cherry production for MY 2017/18 is estimated at 26,000 MT or 43 percent below
previous year. This is the third year in a row with below average production; this year’s low production
was a result of a devastating frost in mid-April, 2017. In addition, the decline of tart cherry area is the
continuation of a long-term pattern. In the last ten years, tart cherry area has declined by more than 50
percent from 4,200 ha in 2006 to 2,010 ha in 2016 due to a strong competition from other EU member
states. Germany is more competitive for sweet cherries since most of the production is for fresh
consumption and consumers are willing to pay a premium for locally produced cherries.
France
After an already lower crop in MY 2016/17, France’s cherries crop in MY 2017/18 may increase due to
improved weather conditions during the growing season. Area planted to cherry trees continued to
decline as old orchards are not systematically renewed. Producers blame the lack of new disease
resistant varieties as well as the high production cost.
In France in the main producing regions (southern half of France), there were reports of significant pest
and fungal infestation, especially Drosophila Suzukii and Moniliosis in several production areas. The
French decision to ban a pesticide (Dimethoate) efficient against Drosophila Suzukii may have enhanced
the losses (See Policy Section).
Bulgaria
14
The general prospects for the MY2017/18 season show cherry production to be almost 3 percent higher
than in the previous year reaching 43,200 MT due to unfavorable weather conditions. The forecast is for
a restoration of production from the low levels seen in 2016 but still below the very good crop harvested
in 2014.
Portugal
In Portugal in MY 2017/18, projections point to rebound production after the low harvest of 2016.
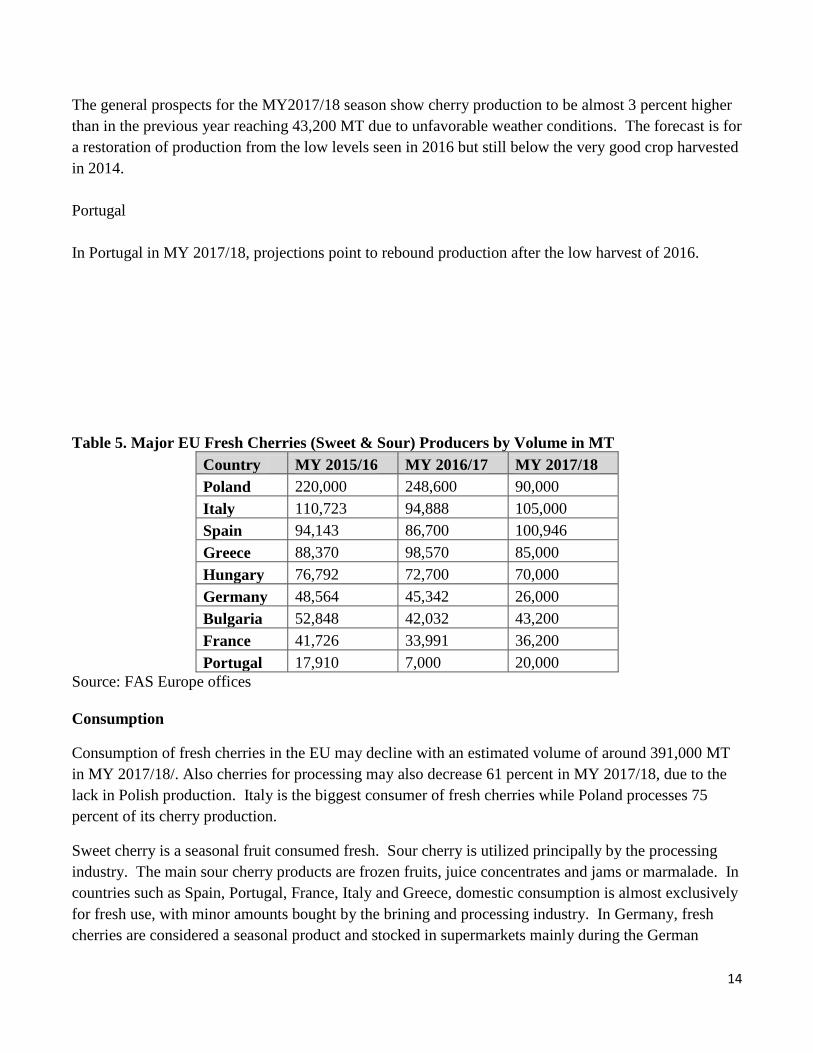
Table 5. Major EU Fresh Cherries (Sweet & Sour) Producers by Volume in MT
Country MY 2015/16 MY 2016/17 MY 2017/18
Poland 220,000 248,600 90,000
Italy 110,723 94,888 105,000
Spain 94,143 86,700 100,946
Greece 88,370 98,570 85,000
Hungary 76,792 72,700 70,000
Germany 48,564 45,342 26,000
Bulgaria 52,848 42,032 43,200
France 41,726 33,991 36,200
Portugal 17,910 7,000 20,000
Source: FAS Europe offices
Consumption
Consumption of fresh cherries in the EU may decline with an estimated volume of around 391,000 MT
in MY 2017/18/. Also cherries for processing may also decrease 61 percent in MY 2017/18, due to the
lack in Polish production. Italy is the biggest consumer of fresh cherries while Poland processes 75
percent of its cherry production.
Sweet cherry is a seasonal fruit consumed fresh. Sour cherry is utilized principally by the processing
industry. The main sour cherry products are frozen fruits, juice concentrates and jams or marmalade. In
countries such as Spain, Portugal, France, Italy and Greece, domestic consumption is almost exclusively
for fresh use, with minor amounts bought by the brining and processing industry. In Germany, fresh
cherries are considered a seasonal product and stocked in supermarkets mainly during the German

15
marketing season (July/August). In contrast, peaches are stocked year round but are hardly grown in
Germany. This explains the lower per capita consumption of cherries (2.2 kg) compared to peaches (3.7
kg). Consumer preferences clearly trend towards larger sizes (>28 mm). Smaller cherries can only be
marketed at a large discount. In Hungary, average per capita fruit consumption is under the EU-28
average. The majority of cherries harvested are destined for fresh exports and the processing industry.
Trade
During MY 2017/18 EU-28 imports of cherries may be higher than EU-28 cherry exports due to the
expected decline in supply, as already occurred in MY 2016/17. These are sourced mostly from
Turkey, the world’s leading cherry producer (See Table 6). While the US was the fourth largest non-EU
supplier of cherries to EU-28, France decision to renew its ban imports of cherries (at least until
12/31/2017) from countries where Dimethoate can be legally used on cherry trees effectively cut access
to the French market to U.S., Canada and Turkish cherries. The main destinations for the major EU
producers are other Member States; the most important external destinations are Belarus and Serbia
experiencing important growth.
Imports
The EU imports of fresh cherries were valued at 203 million USD in MY 2016/17, a 51 percent increase
from the previous year with a total volume of 57,697 MT or 57 percent higher than previous year.
According to GTA, the EU-28 imported only 423MT of cherries from the United States in MY 2016/17,
a decline of 47 percent compared to previous year and valued at 3 million US Dollars, 10 million US
Dollars less compared to MY 2014/15. In the first half of 2017 the EU-28 imported 74 percent less
cherries from the United States compared to the same period of previous year.
Imports of cherries are expected to increase significantly in Poland in 2017 due to shortages in local
supply and very high prices sweet cherry exports volume will be fulfilled mostly by shipments from
other EU and non-EU countries. The main countries of origin to Poland are traditionally Hungary,
Croatia, Serbia and Turkey. In 2017 average cherry import and export prices are much higher than in the
previous year what strongly lifted retail prices, and limited demand for sour cherries from processing
industry.
France has a large trade deficit in cherries, the bulk of imports coming from EU-28 (mainly Spain
followed by Germany). While the U.S. was the third largest non-EU supplier of cherries to France, after
Turkey and Chile, France’s decision to renew its ban imports of cherries (at least until 12/31/2017) from
countries where Dimethoate can be legally used on cherry trees effectively cut access to the French
market to U.S., Canada and Turkish cherries. France imported U.S. Cherries in July, August and
September when the domestic/EU supply weakened. Those cherries were imported fresh by air cargo
and are often purchased by restaurants.
Germany is the third largest importer of cherries in the world after China and Russia. According to the
German market from 2014 to 2016, between 54 and 68 percent of the cherries consumed in Germany

16
were imported. German imports vary between 45,000 and 70,000 MT of cherries annually; the majority
originates from other EU member states, mainly Austria, Italy and Spain for sweet cherries and
Hungary, Poland and the Czech Republic for tart cherries. The largest non-EU suppliers are Turkey for
sweet cherries and Serbia for tart cherries. For 2017, imports are forecasted to increase as Turkey, the
Czech Republic, and Slovakia take advantage of the void left by the poor German domestic production.
In MY 2015/16, Italy imported 12,895 MT of cherries, 46 percent more than the previous year mainly
from Spain, Turkey and Greece (+66 percent), while Spain imported only 949 MT or 40 percent less
than previous year, mainly from Chile and Argentina.
In the first half of 2017 EU-28 imports of cherries declined 35 percent and forecasts in MY 2017/2018
imports may decrease.
Table 6. EU-28 Imports of Fresh Cherries (Sweet & Sour) by Origin in MT
Country of Origin MY 2014/15 MY 2015/16 MY 2016/17
Turkey 25,294 28,284 43,168
Serbia 6,834 2,106 8,733
Chile 4,940 2,991 2,655
Argentina 687 928 1,088
Macedonia 635 589 1,078
United States 2,155 795 423
Canada 1,064 662 278
Others 728 370 274
Total Imports 42,337 36,725 57,697
Source: GTA
Exports
The EU exports of fresh cherries in MY 2016/17 were valued at 35 million USD, 32 percent decrease
from the previous year with 47 percent lower volume, reaching 25,076 MT. The main destinations for
EU-28 cherries in MY 2016/17 were Belarus, Serbia and Switzerland as in MY 2016/17 EU-28 cherry
exports to Russia were negligible due to the Russian embargo after two consecutive years, losing 41
million US Dollars. EU’s cherry exports to Serbia experienced important growth, mainly from Greece
and Hungary, resulting that new markets are showing growth for the second year in a row.
Poland’s MY 2016/17 total exports volume of fresh cherries was 11 percent lower than in 2015. In 2016
fresh sweet and sour cherries fruit exports (including EU-28 trade) amounted to 16,388 MT, valued at
U.S. $15.1 million or 3 percent higher than previous year. The decrease of exports volume was offset by
higher incomes. Export destinations changed for Polish cherry exporters in the last three years. Polish
producers and exporters have been strongly hit by Russian ban on food imports imposed on the EU in
August 2014. Until 2014 Russia was the main cherry export market for both tart and sweet cherries
capturing 60 percent of Poland’s total cherry exports. In 2016 the main sales destinations were the EU

17
member states, with leading position of Germany. Now Germany is the main export market for sour
cherries for processing, capturing 40 percent of Poland’s sour cherries exports. Belarus partly replaced
Russia in demand for Polish sweet fresh dessert cherries.
For 2017 it is forecasted that Poland’s sour and sweet cherry export will decrease by even 80 percent in
comparison with 2016. Due to shortages in local supply, and very high prices sweet cherry exports
volume will be fulfilled mostly by shipments from other EU and non-EU countries.
Italy and Spain are mainly focused in the intra-EU market. In MY 2016/17, Italy exported 5,111 MT of
cherries, a decline of 53 percent compared to the previous year, mainly due to reduced volumes to
Germany (-58 percent), the Italian leading destination, accounting for 45 percent of total exports. Spain,
the major EU’s cherry exporter, exported 23,827 MT or 11 percent below last year, mainly to United
Kingdom, Italy and France.
In MY 2016/17, Greece exported 16,776 MT of cherries, mainly to the Netherlands (3,226 MT), Serbia
and Bulgaria.
In Hungary, tart cherries are sold to canneries and in smaller amounts to freezing plants and for fresh
fruit exports. Hungary is one of the biggest canned cherry exporters in the EU. In MY 2016/17, import
volume was negligible while the exports decreased by 13 percent reaching 19,950 MT. Exports to the
main trade partner, Germany decreased further by 8 percent. Until 2014, Russia was the second largest
foreign market of the country to where 3,300-5,800MT of tart cherries were exported. Since the Russian
embargo was put into force, this opportunity has ended. At the same time, exports to Serbia have
experienced important growth.
During the first half of 2017, EU-28 exports of cherries increased 14 percent in volume, valued 24
percent more, due to the growth in the main countries of destinations.
Table 7. EU-28 Exports of Fresh Cherries (Sweet & Sour) by Destination in MT
Country of Destination MY 2014/15 MY 2015/16 MY 2016/17
Belarus 6,681 27,560 13,235
Serbia 414 1,881 5,150
Switzerland 3,579 2,889 3,071
Others 28,076 15,260 3,620
Total Exports 38,750 47,590 25,076
Source: GTA

18
Production, Supply and Demand Data
Table 8. Production, Supply and Demand Data Statistics:
Fresh
Cherries,(Sweet&Sour) 2015/2016 2016/2017 2017/2018
Market Begin Year Jan 2015 Jan 2016 Jan 2017
European Union USDA
Official
New
Post
USDA
Official
New
Post
USDA
Official
New
Post
Area Planted 154,523 155,466 152,680 156,130 0 155,455
Area Harvested 149,260 148,953 146,830 149,353 0 147,278
Bearing Trees 0 0 0 0 0 0
Non-Bearing Trees 0 0 0 0 0 0
Total Trees 0 0 0 0 0 0
Commercial Production 699,253 713,522 622,176 693,332 0 547,529
Non-Comm. Production 36,803 37,554 32,824 36,491 0 28,817
Production 736,056 751,076 655,000 729,823 0 576,346
Imports 36,700 36,725 60,000 57,673 0 50,000
Total Supply 772,756 787,801 715,000 787,496 0 626,346
Fresh Dom. Consumption 415,013 424,516 377,250 423,816 0 391,116
Exports 47,600 47,590 30,000 25,076 0 28,000
For Processing 309,843 315,195 307,450 338,104 0 206,730
Withdrawal From Market 300 500 300 500 0 500
Total Distribution 772,756 787,801 715,000 787,496 0 626,346
(HA) ,(1000 TREES) ,(MT)
Source: FAS Europe offices

19
Policy
Stone fruit falls under the EU fruit and vegetables regime and is part of the Common Agriculture Policy
(CAP). The following section explains the main elements of the EU fruit and vegetables policy that
refer to the stone fruit sector. The second part explains the EU measures that were taken in response to
the Russian embargo.
I. EU Policy Related to Stone Fruit
1. The New Common Agriculture Policy (CAP) Reform
The single Common Market Organization (CMO) provides a framework for market measures under the
CAP, which is outlined in Regulation (EU) No 1308/2013 and entered into force on January 1, 2014.
The CAP 2020 reform consists of four basic regulations, supplemented by delegated acts, and amends
the implementing rules for the fresh and processed fruit and vegetables sectors (Commission
implementing Regulation (EU) No 543/2011).
On June 1, 2017, Commission Delegated Regulation 2017/891 entered into force to increase the support
for withdrawals for fruit and vegetable Producer Organizations (POs). The new framework also seeks to
make POs more attractive to non-members, provide greater clarity about what actions are eligible for EU
funding, and set a maximum percentage of produce that can be marketed outside the organization at 25
percent to create short supply chains whereby producers sell directly to consumers. It will also simplify
and clarify legislation with regard to payments to transnational POs and their associations. POs can
make use of the new provisions for the next programming period (2018).
These market measures under the CAP aim to:
a) Create a more competitive and market-oriented sector

20
Producer Organizations (POs) are still the key elements in the EU's CMO for fruit and vegetables. POs
are legal entities established by producers to market commodities, including stone fruit. EU subsidies
are not paid to individual producers but are channeled through POs. In order to qualify for EU
subsidies, a PO must submit an operational program financed through an operational fund. The EU's
financial contribution is paid directly into each PO’s operational fund. The calculation of the estimated
amount of the operational fund is based on the operational program and the value of the marketed
production. As of January 20, 2014, operational programs are approved under the Regulation (EU) No
1308/2013.
Fresh fruit and vegetable imports into the EU are checked for compliance with EU-harmonized
marketing standards. These standards apply at all marketing stages and include criteria such as quality,
size, labeling, packaging, and presentation. Commission implementing Regulation (EU) No 543/2011
provides for a general marketing standard for all fresh fruits and vegetables. Specific marketing
standards are still in place for ten products, including peaches and nectarines, and are set out in Part B of
Annex I on page 86 (section 5).
b) Diminish crisis-related fluctuations in producers’ income
To achieve this objective, EU funding is offered under the operational programs for:
- Product withdrawal
- Green harvesting/non-harvesting;
- Promotion/communication tools;
- Training measures;
- Harvest insurance;
- Assistance to secure bank loans, and support for administrative costs associated with setting up
mutual funds.
National authorities must determine, in their national strategies, which of these instruments can be
funded in their countries. POs may take out loans on commercial terms to finance crisis prevention and
management measures. The repayment of the capital and the interest on those loans may be eligible for
financial assistance under the operational programs of POs.
c) Encourage increased consumption of fruit and vegetables in the EU
The European “School Fruit Scheme” (SFS) originated in 2009 as a measure to combat child obesity and
includes three elements: free distribution of fruit and vegetables in schools, information campaigns on
healthy eating habits, and monitoring and evaluation. As in previous years, the EU funds of $164
million (€150 million) was allocated in the school year 2016/2017 to 25 Member States that decided to
participate in the program - with Sweden, Finland and United Kingdom opting out.

21
Regulation EU No 2016/791 on the new School Scheme for Milk, Fruit and Vegetables applies as of
August 1, 2017.
The sector may also benefit from the European promotion budget for agricultural products and quality
schemes. The Commission reformed its promotion policy with an extension of the product scope and a
greater focus on export markets. The current promotion budget of $76 million (€60 million) will
increase annually until it reaches $255 million (€200 million) in 2020. National co-funding will no
longer be needed and EU associations will be able to apply directly for a program.
d) Increase the use of environmentally friendly cultivation and production techniques
At least 10 percent of operational program funding must be spent on environmental actions that go
beyond mandatory environmental standards. MS with recognized POs must draw up a National
Framework for Environmental Action (NEF) as part of their “national strategy for sustainable
operational program.” The NEF must contain a non-exhaustive list of environmental actions and the
conditions applicable to them in the MS concerned.
For information on the CAP after 2014, please see: http://ec.europa.eu/agriculture/cap-post-
2013/index_en.htm
2. Certification of Fruit Shipments
Plant products need a phytosanitary certificate to be exported to the EU. Phytosanitary certificates
issued by a USDA/Animal Plant Health Inspection Service (APHIS) inspector are required to
accompany fruit, vegetable, and nut shipments. APHIS issues phytosanitary certificates in accordance
with international regulations established by the International Plant Protection Convention of the Food
and Agriculture Organization of the United Nations. This standard-setting body coordinates cooperation
between nations to control plant and plant product pests and to prevent their spread.
Council Directive 2000/29/EC contains provisions concerning compulsory plant health checks. This
includes documentary, identity, and physical plant health checks to verify compliance with EU import
requirements.
More information can be accessed on DG Health and Consumer Protection's website
http://ec.europa.eu/food/plant/plant_health_biosecurity/non_eu_trade/index_en.htm
Commission Regulation 1756/2004 provides for plant health checks to be carried out at reduced
frequency when justified. The list of products recommended for plant health checks at reduced levels
was issued on October 22, 2015 . On an annual basis, the Commission monitors imports of fruit and
vegetables to determine how to adjust the frequency of testing consignments.

22
3. Maximum Residue Levels for Fruit
Maximum Residue Levels (MRLs) for pesticides, including import tolerances, have been harmonized
throughout the EU since September 2008. As a marketing tool, some retail chains in the EU adopt
private standards that exceed EU regulations by requiring their suppliers to adhere to stricter company
policies that limit the maximum residues to 30, 50, or 70 percent of the respective EU MRL. Please find
the link to the EU MRL database , as well as to the International USDA MRL database developed by
USDA for MRLs worldwide.
4. Tariffs
EU imports of fresh fruit and vegetables are subject to the Entry Price System (EPS) which has been in
place in its current form since the Uruguay Round. It is a complex tariff system that provides a high
level of protection to EU producers. In this system fruits and vegetables imported at or above an
established entry price are charged an ad valorem duty only. Produce valued below the entry price are
charged a tariff equivalent in addition to the ad valorem duty. The tariff equivalent is graduated for
products valued between 92 and 100 percent of the entry price. The ad valorem duty and the full tariff
equivalent are levied on imports valued at less than 92 percent of the entry price.
Tariff levels for 2017 are published in Commission Implementing Regulation 2016/1821.
The tariffs for stone fruit remain unchanged compared to the levels of 2016 and can be found on page 97
for cherries, peaches and nectarines. The United States tends to sell high quality products at higher
prices which typically do not face additional duties.
II. Russian ban on agricultural products
On August 7, 2014, the Russian government implemented a ban for one year on a range of agricultural
and food products, including stone fruit, from the United States, the European Union (EU), Canada,
Australia, and Norway, in response to U.S. and EU sanctions over Russian actions in Ukraine. The
CMO rules (see Regulation 1308/2013 in part I) provide various market management tools to stabilize
markets and the Commission is also empowered under the reformed CAP to take "exceptional
measures" in case of market disruption. As such, the Commission introduced specific market support
measures for the European fruit and vegetables sector since the start of the ban in 2014.

23
Commission Delegated Regulation (EU) 2017/1165 introduced the new aid scheme for fruit and
vegetable producers as the ban continues through 2017. It extends the previous scheme but with a lower
budget and ceilings for volumes to be withdrawn. As before, the Commission proposes an additional
quantity of up to 2000 tons for all Member States to further stabilize the market. The aid for market
withdrawals and free distribution entered into force on July 1, 2017, and producers of fruit and
vegetables have until July 31, 2018, to apply for their allocation.
More information on the Commission’s response to the Russian ban can be found here:
http://ec.europa.eu/agriculture/russian-import-ban/index_en.htm
III. French ban of Dimethoate on cherries
On April 27, 2017, the French Ministry of Agriculture published a decree that reinstates the 2016
dimethoate ban prohibiting imports of fresh cherries (with the exception of organic cherries) from EU
Member States or countries where dimethoate can be legally used on cherry trees. The decree is valid
until December 31, 2017. Dimethoate was used to fight Drosphila suzukii, an Asian fruit fly which
causes considerable damages in cherry orchards but is suspected by France of being dangerous to human
health. France imports roughly one fifth of its consumption, the bulk coming from EU countries
including some (such as Spain, Italy) that have already banned dimethoate. The French prohibition will
de facto suspend imports of cherries from the United States, valued at around $1 million annually. For
more information, see GAIN FR1710 France re-instates ban on U.S. cherry imports.
Trade Shows
Trade fairs play a key role in presenting new products to the trade or in finding additional buyers and
importers. The most important trade shows related to the fruit and vegetable sectors are:
Fruit Logistica
Fruit Logistica
Berlin, Germany (Interval: yearly)
Target Market: Germany/EU/Central & Eastern Europe
The leading European trade show for fresh and dried fruit, nuts, and related products
http://www.fruitlogistica.de
Next Fair:
February
7-9, 2018
Fruit Logistica is the major trade show for fresh and dried fruits in Europe. The next show will take
place on February 7-9, 2018. More than 2,400 companies from across the entire fresh produce value
chain will participate, including major global players as well as small and medium-sized suppliers from
around the world.
24
Bio Fach
Bio Fach
Nuremberg, Germany (Interval: yearly)
Target Market: Germany/Europe
The leading European trade show for organic food and non-food products
http://www.biofach.de
Next Fair:
February
14-17, 2018
Bio Fach is one of the most important trade shows for organic products in Europe. The next show will
take place on February 14-17, 2018.