Embed Size (px)
Citation preview

ETP 2012 – Choice of 3 Futures
© OECD/IEA 2012
6DSwhere the world is now heading with potentially devastating results
The 6°C Scenario
4DSreflecting pledges by countries to cut emissions and boost energy efficiency
The 4°C Scenario
2DSa vision of a sustainable energy system of reduced Greenhouse Gas (GHG) and CO2 emissions
The 2°C Scenario

Clean energy: slow lane to fast track
© OECD/IEA 2012
Progress is too slow in almost all technology areas
Significant action is required to get back on track

Renewable power generation
42%Average annual
growth in Solar PV
27%Average annual growth in wind
75%Cost reductions in
Solar PV in just three years in
some countries
Renewables provide good news

Energy RD&D has slipped in priority
© OECD/IEA 2012
0%
2%
4%
6%
8%
10%
12%
0
5
10
15
20
25
1974 1978 1982 1986 1990 1994 1998 2002 2006 2010
Shar
e of
ene
rgy
RD&
D in
tota
l R&
D
USD
bill
ion
Energy RD&D Share of energy RD&D in total R&D
0
1
2
3
4
Braz
il
Chin
a
Indi
a
Mex
ico
Russ
ia
Sout
h A
fric
a
USD
bill
ion
2008 non-IEA country spending

A smart, sustainable energy system
© OECD/IEA 2012
A sustainable energy system is a smarter, more unified and integrated energy system

Recommendations to Governments
© OECD/IEA 2012
1. Create an investment climate of confidencein clean energy
2. Unlock the incredible potential of energy efficiency – “the hidden” fuel of the future
3. Accelerate innovation and public research, development and demonstration (RD&D)

2009 2015 2020 2025 2030 2035 2040 2045 2050 0
5 000
10 000
15 000
20 000
25 000
30 000
35 000
40 000
45 000 OtherWindSolarHydroNuclearBiomass and wasteOilGas with CCSGasCoal with CCSCoal
Low-carbon electricity: a clean core
© OECD/IEA 2012
Renewables will generate more than half the world’s electricity in 2050 in the 2DS
TW
h
Global electricity generation in the 2DS

© OECD/IEA 2012
Renewables need to dominate EU electricity
Renewables cover two-thirds of the electricity mix in 2050 in the 2DS, with wind power alone reaching a share of 30% in the mix.
0
500
1 000
1 500
2 000
2 500
3 000
3 500
4 000
4 500
5 000
4DS 2DS
2009 2050
TWh
Other renewables
Wind
Solar
Hydro
Nuclear
Fossil w CCS
Fossil w/o CCS
53%
27%
2%
1%
7%
28%
22%
23%
10%
9%
13%
7%
10%
4%
21%
28%
4%13% 17%
0%
10%
20%
30%
40%
50%
60%
70%
80%
90%
100%
4DS 2DS
2009 2050
Gen
erati
on s
hare
Other renewables
Wind
Solar
Hydro
Nuclear
Fossil w CCS
Fossil w/o CCS
Other renewables
Wind
Solar
Nuclear
Solar
Hydro
Fossil w/o CCS
Fossil w CCS
2009 2050

© OECD/IEA 2012
Renewables growth in Europe continues but slows
0
200
400
600
800
1 000
1 200
1 400
2011 2012 2013 2014 2015 2016 2017
OECD Europe forecast renewable generation
Hydropower Wind onshore Bioenergy Solar PV
Geothermal Wind offshore CSP Ocean
TWh
Despite policy adjustments and macroeconomic situation, growth continues

All technologies have roles to play
© OECD/IEA 2012
Nuclear is one piece of the puzzle
2009 2015 2020 2025 2030 2035 2040 2045 2050 0
10 000
20 000
30 000
40 000
50 000
60 000
Nuclear 8% (8%)
End-use fuel switching 12% (12%)
End-use fuel and electricity ef-ficiency 42% (39%)
Renewables 21% (23%)
CCS 14% (17%)
2DS
Gt C
O2
Technology contributions to reaching the 2DS
© OECD/IEA 2012
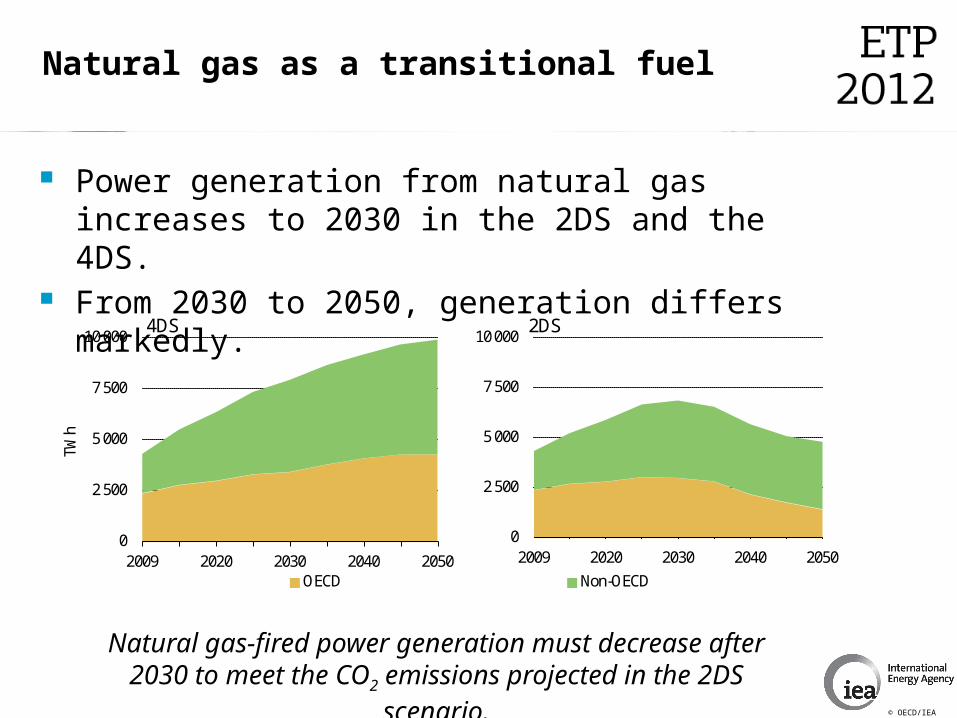
Power generation from natural gas increases to 2030 in the 2DS and the 4DS.
From 2030 to 2050, generation differs markedly.
Natural gas-fired power generation must decrease after 2030 to meet the CO2 emissions projected in the 2DS scenario.
0
2 500
5 000
7 500
10 000
2009 2020 2030 2040 2050
TWh
4DS
OECD Non-OECD
0
2 500
5 000
7 500
10 000
2009 2020 2030 2040 2050
2DS
Natural gas as a transitional fuel

© OECD/IEA 2012
The CCS infant must grow quickly
© OECD/IEA 2012
Note: Capture rates in MtCO2 /year
Mt CO2
Mt CO2
Mt CO2
Mt CO2
Mt CO2
Mt C
O2

Heating & Cooling: the forgotten giant
© OECD/IEA 2012
Heating and cooling account for 46% of global energy use.Their huge potential for cutting CO2 emissions is often neglected.

Electric vehicles need to come of age
© OECD/IEA 2012
2000 2005 2010 2015 2020 2025 2030 2035 2040 2045 2050 0
50
100
150
200FCEV
Electricity
Plug-in hybrid diesel
Plug-in hybrid gasoline
Diesel hybrid
Gasoline hybrid
CNG/LPG
Diesel
Gasoline
Fuel Cell Electric Vehicles
More than 90% of new light duty vehicles need to be propelled by an electric motor in 2050
Glo
bal P
asse
nger
LD
V s
ales
(m
illio
n)

2010 2011 2012 2013 2014 2015 2016 2017 2018 2019 20200
1
2
3
4
5
6
7
8
Manufacturers production/sales
Projection (Es-timated from each country's target)
mill
ion
sa
les/
yea
r
0
1
2
3
4
5
6
7
8
Projection (Es-timated from each country's target)
mill
ion
sa
les/
yea
rTranslating targets into action
© OECD/IEA 2012
Government targets need to be backed by policy action
2010 2012 2014 2016 2018 2020

Fuel economy makes a difference
© OECD/IEA 2012
Fuel economy improvements in conventional and hybrid vehicles alone can save 11 mbbl/day.
2010 2020 2030 2040 20502
4
6
8
10
PLDV tested fuel economy - WORLD
(new car average)
[Lg
e/1
00
km
] 6DS
Better FE
2DS
2010 2020 2030 2040 20500
500
1000
1500
2000
2500
PLDV fuel consumption - WORLD
[bill
ion
Lge/
year
]
equivalent to 11mbbl/day reduction
6DS
Better FE
2DS(I/A/S)

© OECD/IEA 2012
Clean energy investment pays off
© OECD/IEA 2012
Every additional dollar invested in clean energy can generate 3 dollars in return.
- 120 - 80 - 40 0 40
10%
Undiscounted
Fuel savings
Additionalinvestment
Tota
l sav
ings
USD trillion
Power
Industry
Transport
Residential
Commercial
Biomass
Coal
Oil
Gas
Fuel savings
Additional investment

© OECD/IEA 2012
Sustainable future still in reach
© OECD/IEA 2012
Are we on track to reach a clean
energy future?
NO ✗
Can we get on track?
YES ✓
Is a clean energy transition urgent?
YES ✓

© OECD/IEA 2012
www.iea.org/etp
For much more, please visit