Embed Size (px)
Citation preview
1
Supporting Information for
Etched titania nanoplates by both HF and HAc and the
photocatalytic activities for degradation of pollutants
Mengjiao Xu, Fei Teng,* Juan Xu, Tianyun Lu and Mindong Chen
Jiangsu Key Laboratory of Atmospheric Environment Monitoring and Pollution Control,
Innovative Research Laboratory of Environment and Energy, School of Environmental
Sciences and Engineering, Nanjing University of Information Sciences and Engineering,
Nanjing 210044, P. R. China
Corresponding author. Email: [email protected] (F. Teng); Phone/Fax: +86-25-58736689
Experimental Section
Chemicals: Titanium butoxide (TB, 98%), 40% hydrofluoric acid (40% HF), glacial
acetic acid (HAc, 99.5%) and Commercial TiO2 (Degussa P25) were purchased from
Shanghai Reagents Company (Shanghai, China). All chemicals were used as received
without further purification.
Synthesis of TiO2 nanoplates: In a typical procedure, 1.2 g of water, 5.35 g of 4% HF
and 30.03 g of HAc were mixed to form a clear solution, and then mixed with 5 mmol
of TB in a Teflon-lined stainless steel autoclave with a capacity of 50 mL, and finally
kept at 180 oC for 24 h. After being cooled to room temperature naturally, the resultant
white powder was separated by centrifugation, washed with ethanol and distilled water
for several times, and dried at 60 oC overnight. In the study, a series of TiO2 nanoplates
with different shapes and sizes were synthesized by varying the precursors ratios or
reaction temperature.
Characterizations: The phase compositions of the samples were determined by X-ray
diffractometer (Rigaku D/max-2550VB): using graphite monochromatized Cu Kα
Electronic Supplementary Material (ESI) for RSC AdvancesThis journal is © The Royal Society of Chemistry 2014
2
radiation (λ=0.154 nm), operating at 40 kV and 50mA. The XRD patterns were scanned
in the range of 20-80◦ at a scanning rate of 5◦min-1. The images of the samples were
obtained by scanning electron microscope (SEM, Hitachi SU-1510) operated at 120 kV.
The samples were coated with 5-nm-thick gold layer before observation. The structure
of the samples was observed by high-resolution transmission electron microscopy
(HRTEM, JEM-2100) with an acceleration voltage of 200 kV. Nitrogen
adsorption-desorption isotherms were performed at 77 K on the NOVOE 4000
physicoadsorption apparatus.
Photocatalytic reactions: Photocatalytic activities of the samples were tested by the
photocatalytic decomposition of rhodamine B (RhB). Typically, 0.1 g of powders were
put into a solution of RhB (200 ml, 8 mg/L), which was irradiated with a 300W Xe arc
lamp equipped with an visible light cutoff filter to provide ultraviolet with λ<420 nm.
Before the light was turned on, the solution was continuously stirred for 30 min in the
dark to ensure the establishment of an adsorption-desorption equilibrium. The
concentration of RhB during the degradation was monitored by colorimetry using a
UV-vis spectrometer (Shimadzu UV-2500 PC) at the wavelength 550 nm.
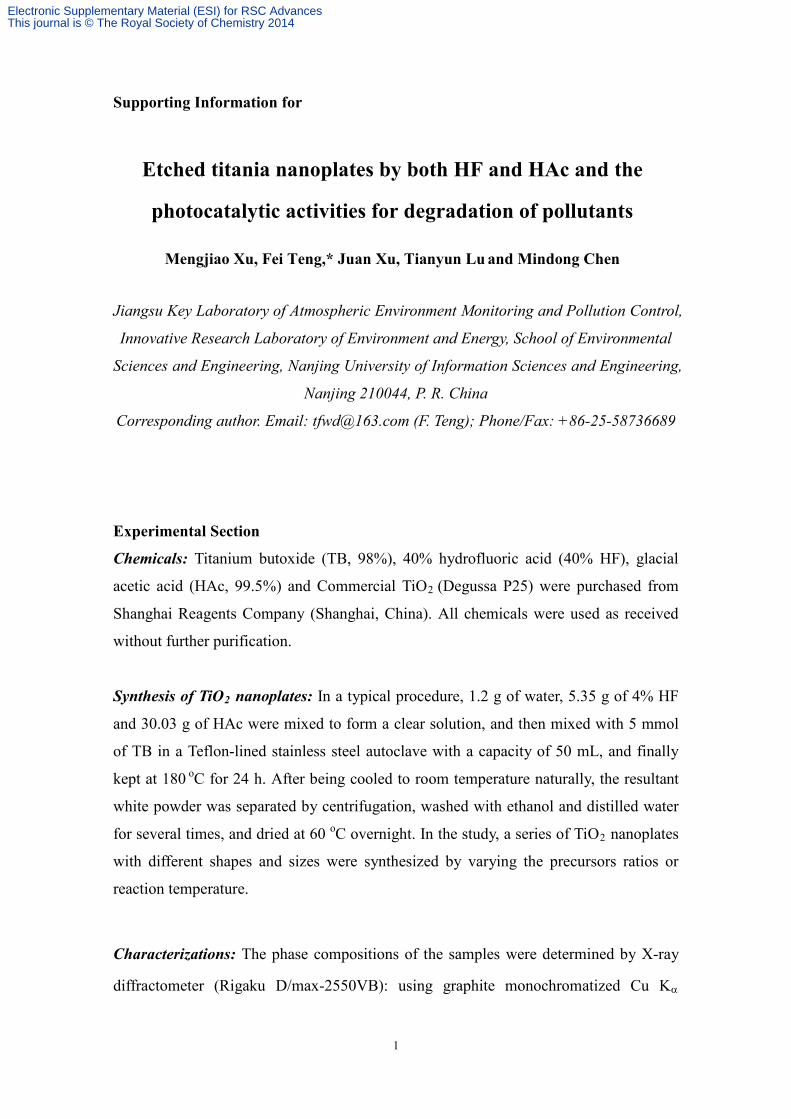
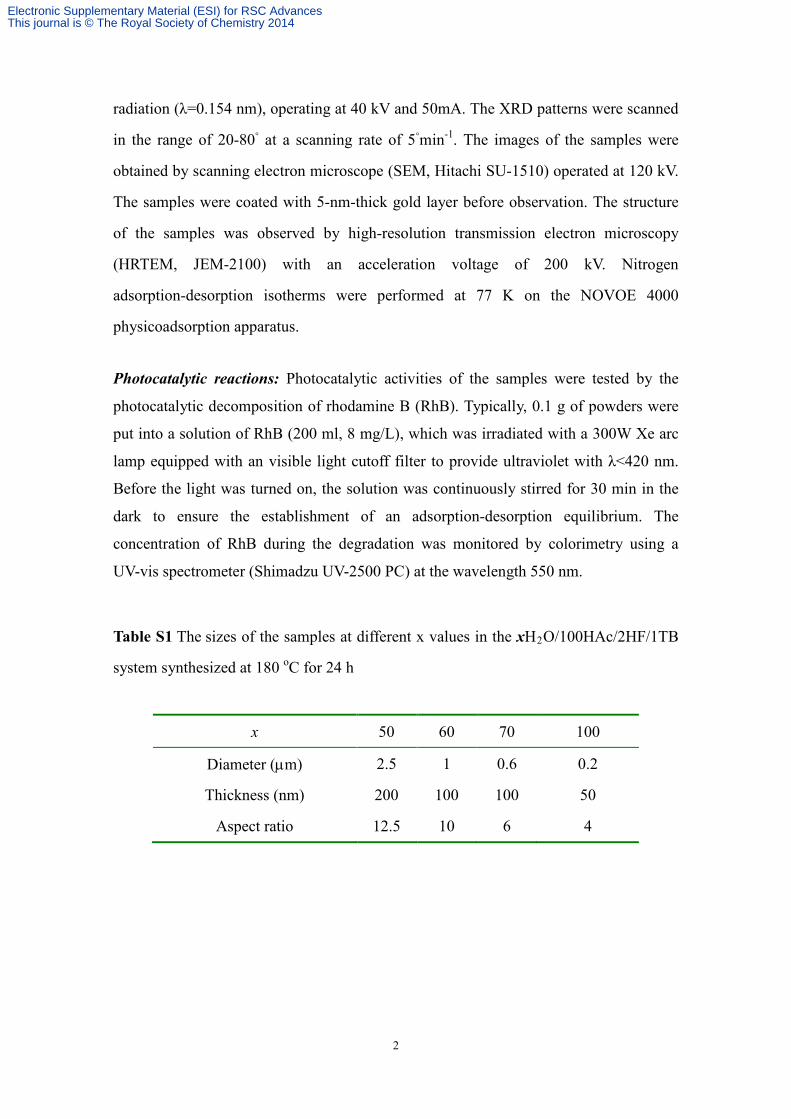
Table S1 The sizes of the samples at different x values in the xH2O/100HAc/2HF/1TB
system synthesized at 180 oC for 24 h
x 50 60 70 100
Diameter (µm) 2.5 1 0.6 0.2
Thickness (nm) 200 100 100 50
Aspect ratio 12.5 10 6 4
Electronic Supplementary Material (ESI) for RSC AdvancesThis journal is © The Royal Society of Chemistry 2014
3
10 20 30 40 50 60 70 80
inte
nsity
(a.u
.)
2 Theta(degree)
0 2 4 6 8 10
0
2
4
6
8
10
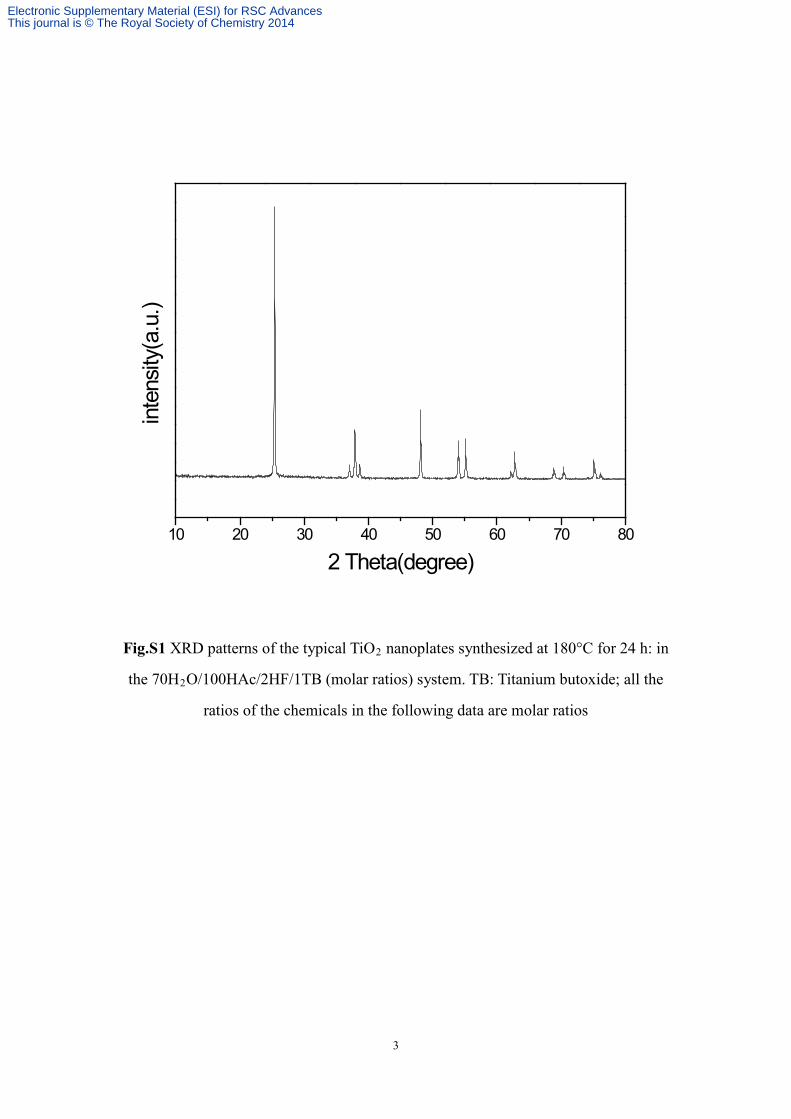
Fig.S1 XRD patterns of the typical TiO2 nanoplates synthesized at 180°C for 24 h: in
the 70H2O/100HAc/2HF/1TB (molar ratios) system. TB: Titanium butoxide; all the
ratios of the chemicals in the following data are molar ratios
Electronic Supplementary Material (ESI) for RSC AdvancesThis journal is © The Royal Society of Chemistry 2014
4
A
B
Electronic Supplementary Material (ESI) for RSC AdvancesThis journal is © The Royal Society of Chemistry 2014
5
0 10 20 30 40 50 60 70 80 90
inten
sity
2 Theta(degree)
A B C D
0 2 4 6 8 10
0
2
4
6
8
10
C
D
E
Electronic Supplementary Material (ESI) for RSC AdvancesThis journal is © The Royal Society of Chemistry 2014
6
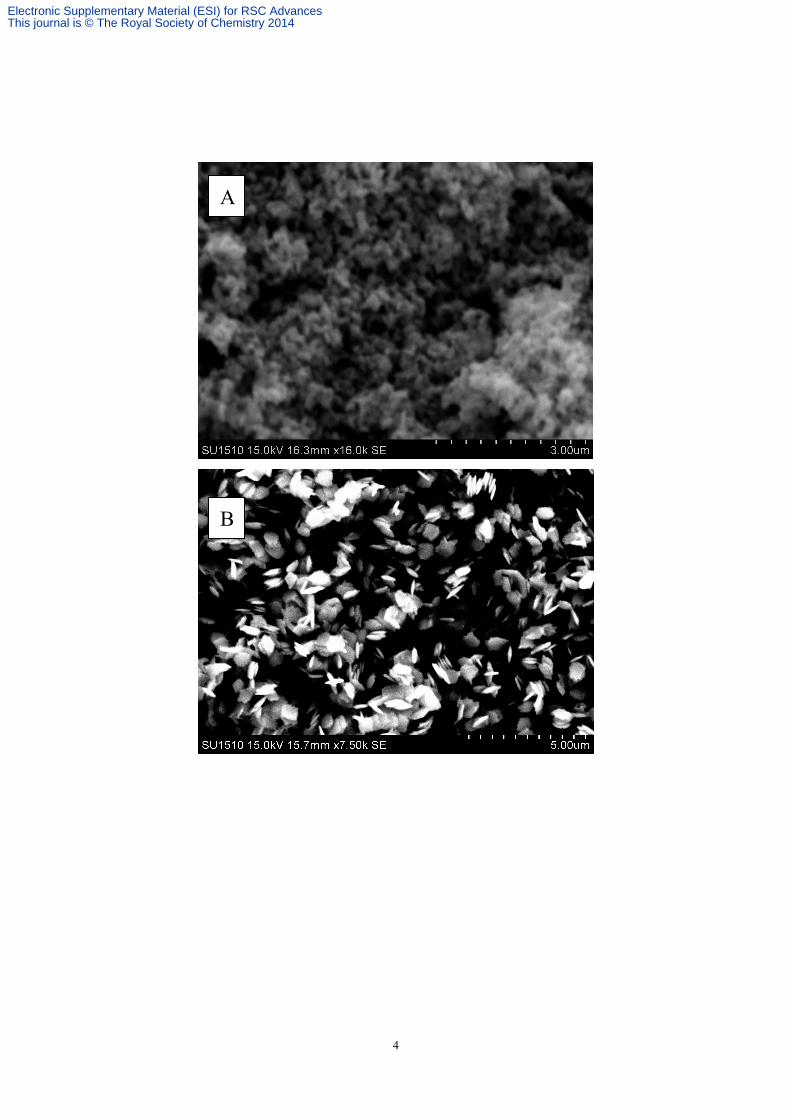
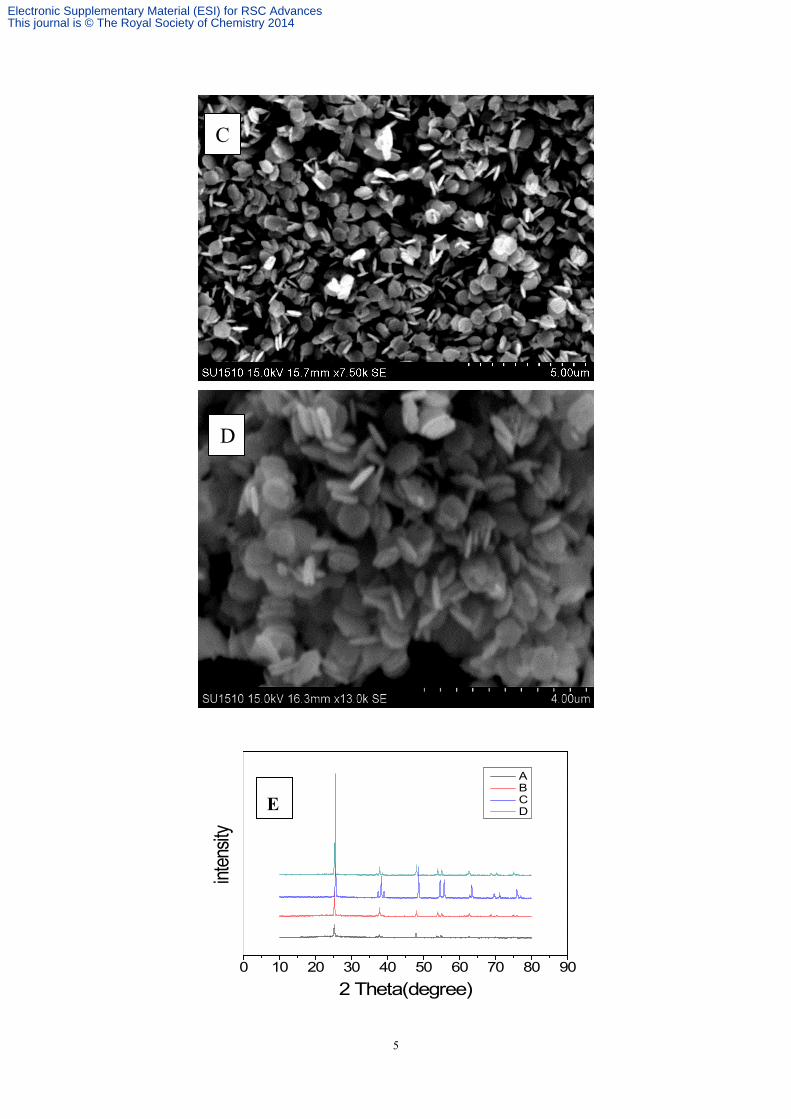
Fig.S2 SEM images and XRD patterns of TiO2 nanoplates synthesized at different
reaction temperatures for 24 h in the 70H2O/100HAc/2HF/1TB system: (A)140 oC, (B)
160 oC, (C) 180 oC, (D) 200 oC, (E) XRD
A
B
Electronic Supplementary Material (ESI) for RSC AdvancesThis journal is © The Royal Society of Chemistry 2014
7
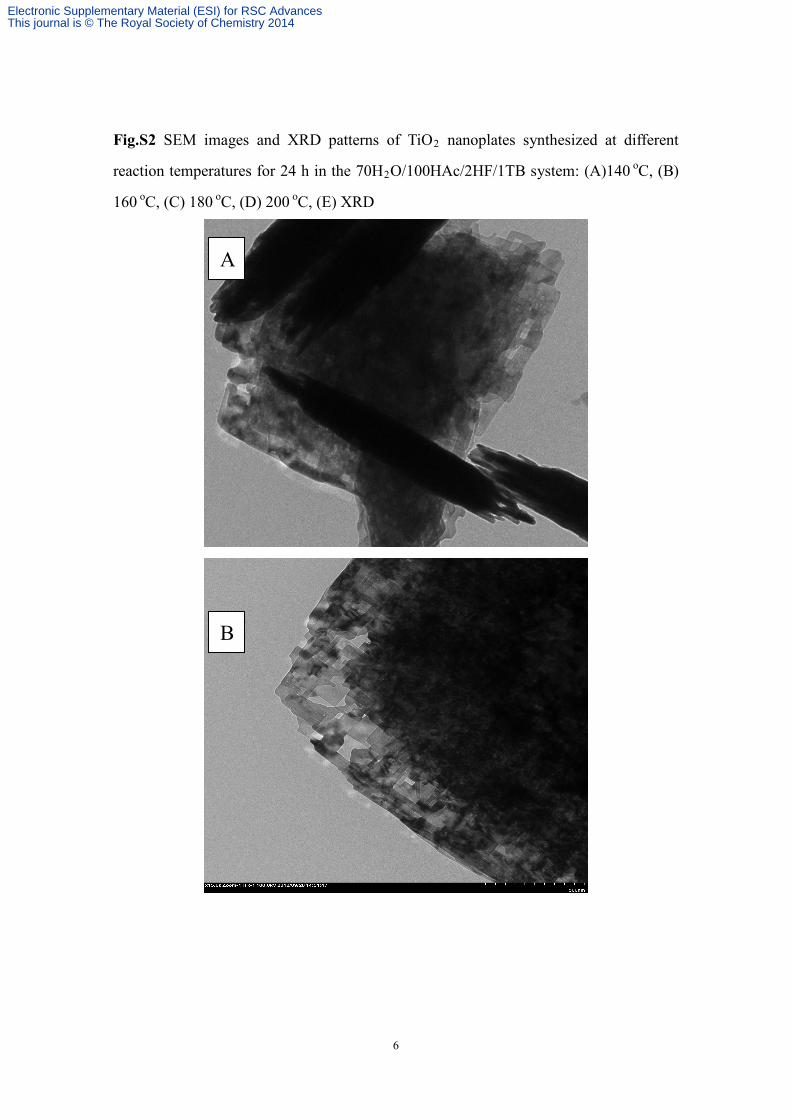
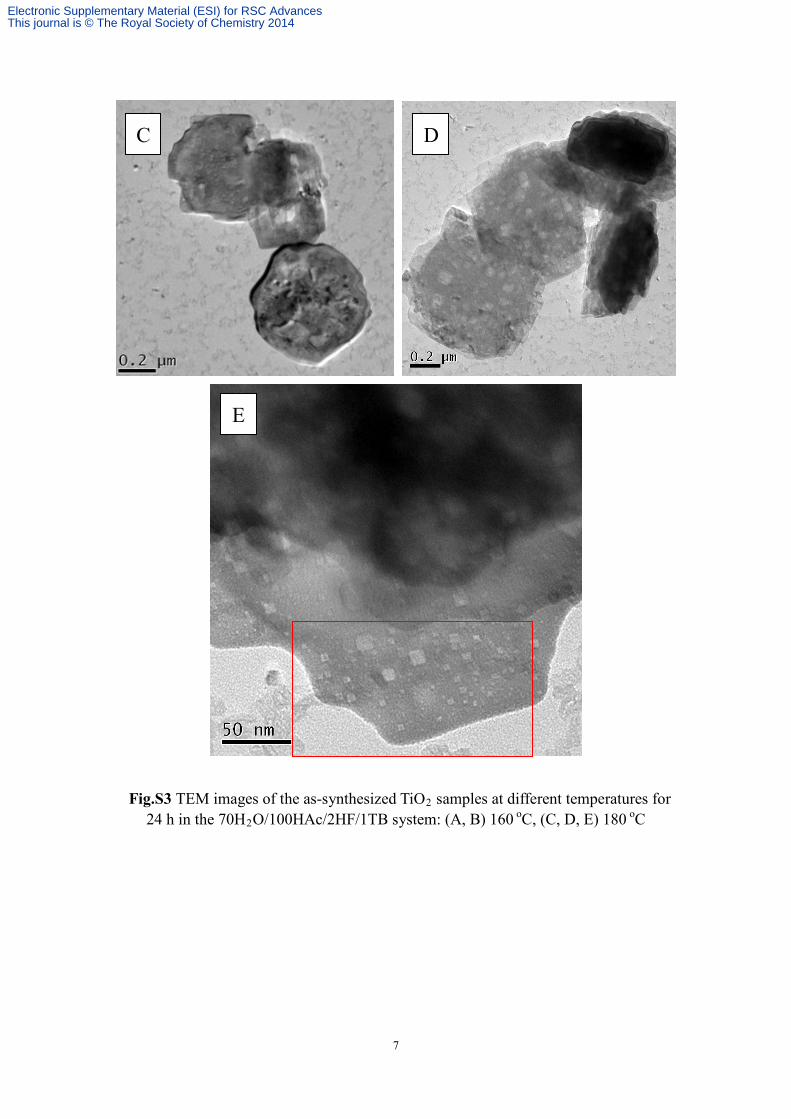
Fig.S3 TEM images of the as-synthesized TiO2 samples at different temperatures for 24 h in the 70H2O/100HAc/2HF/1TB system: (A, B) 160 oC, (C, D, E) 180 oC
C D
E
Electronic Supplementary Material (ESI) for RSC AdvancesThis journal is © The Royal Society of Chemistry 2014
8
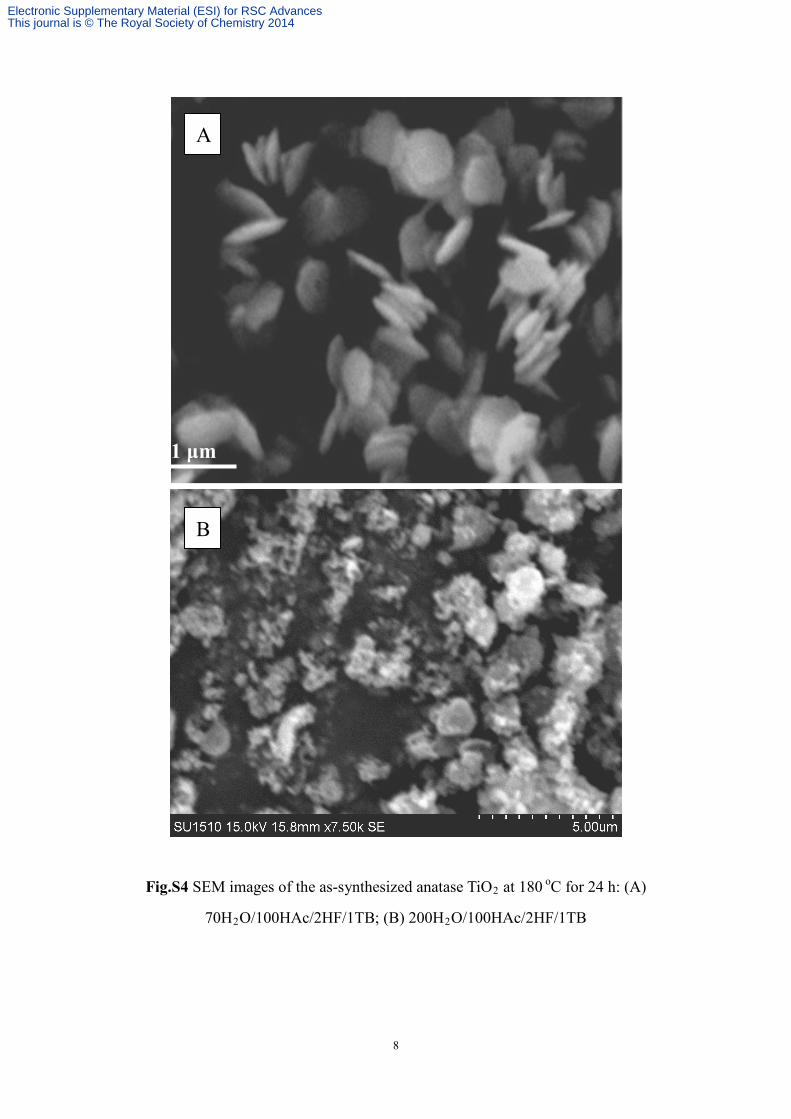
Fig.S4 SEM images of the as-synthesized anatase TiO2 at 180 oC for 24 h: (A)
70H2O/100HAc/2HF/1TB; (B) 200H2O/100HAc/2HF/1TB
A
1 μm
B
Electronic Supplementary Material (ESI) for RSC AdvancesThis journal is © The Royal Society of Chemistry 2014
9
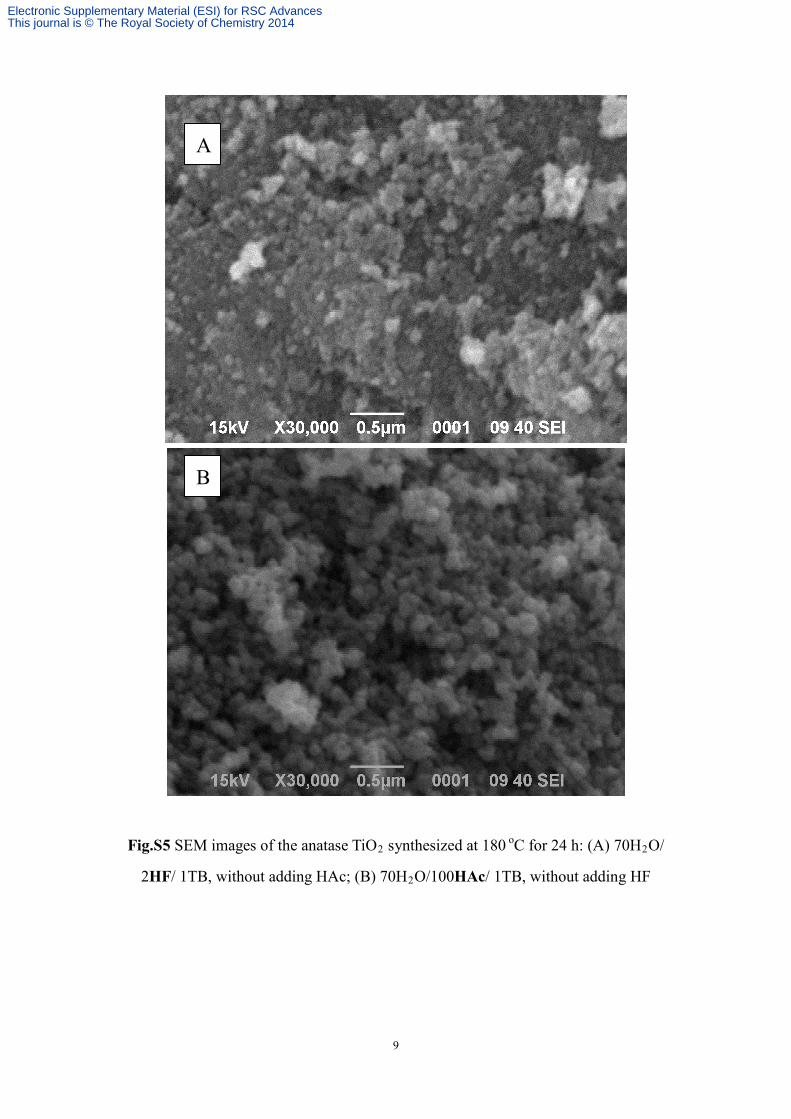
Fig.S5 SEM images of the anatase TiO2 synthesized at 180 oC for 24 h: (A) 70H2O/
2HF/ 1TB, without adding HAc; (B) 70H2O/100HAc/ 1TB, without adding HF
A
B
Electronic Supplementary Material (ESI) for RSC AdvancesThis journal is © The Royal Society of Chemistry 2014
10
0 10 20 30 40 50 60 70 80 90
inten
sity
2 Theta
0 2 4 6 8 10
0
2
4
6
8
10
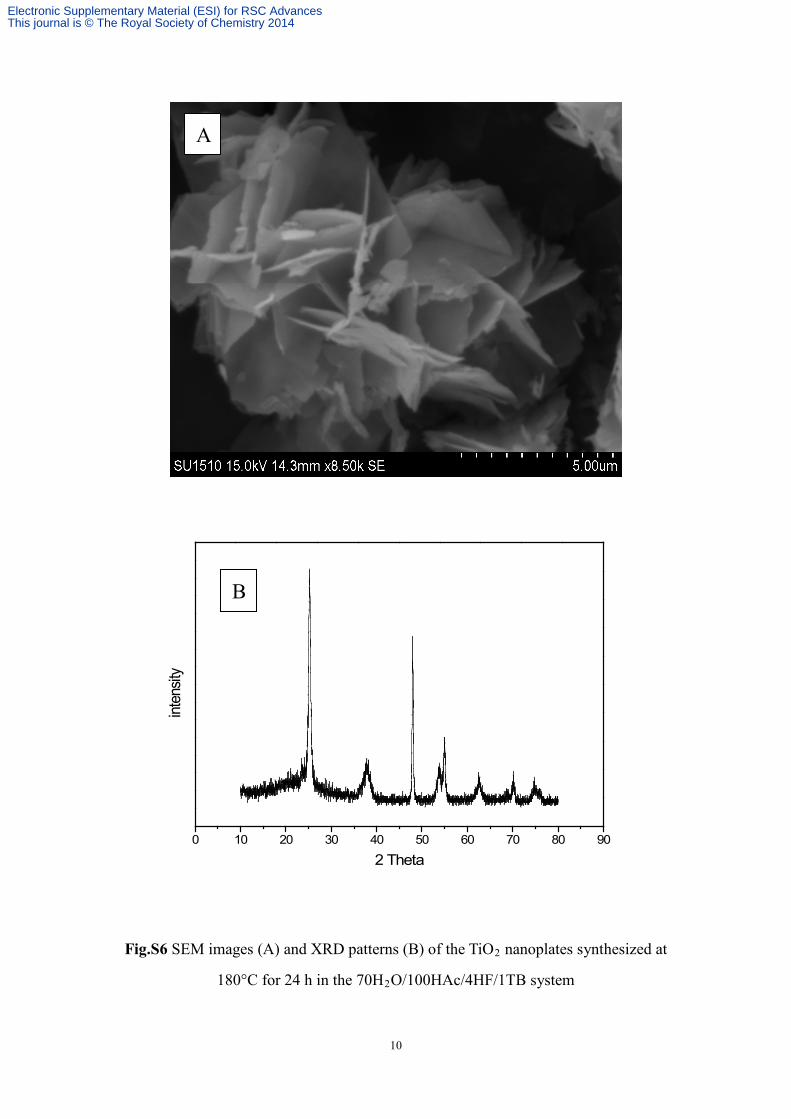
Fig.S6 SEM images (A) and XRD patterns (B) of the TiO2 nanoplates synthesized at
180°C for 24 h in the 70H2O/100HAc/4HF/1TB system
A
B
Electronic Supplementary Material (ESI) for RSC AdvancesThis journal is © The Royal Society of Chemistry 2014
11
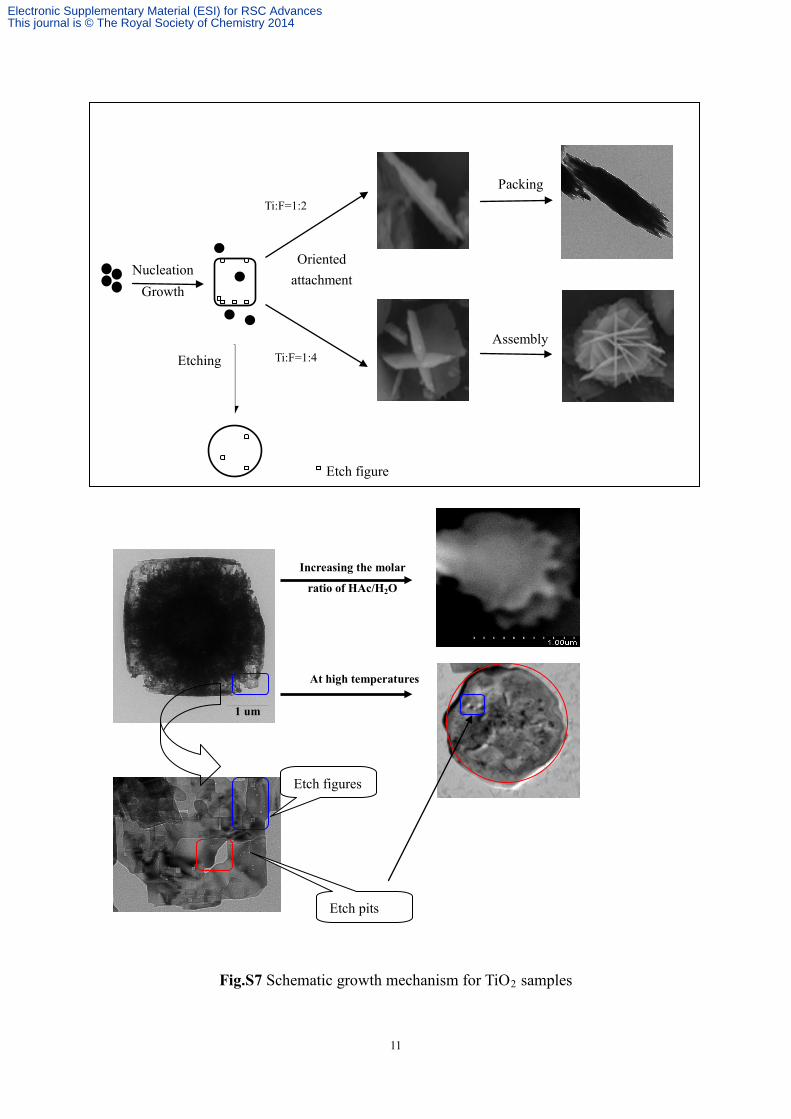
Fig.S7 Schematic growth mechanism for TiO2 samples
Etch figure
Assembly
Packing
Etching
Ti:F=1:2
Oriented attachment
Nucleation Growth
Ti:F=1:4
Increasing the molar
ratio of HAc/H2O
1 um
At high temperatures
Etch figures
Etch pits
Electronic Supplementary Material (ESI) for RSC AdvancesThis journal is © The Royal Society of Chemistry 2014
12
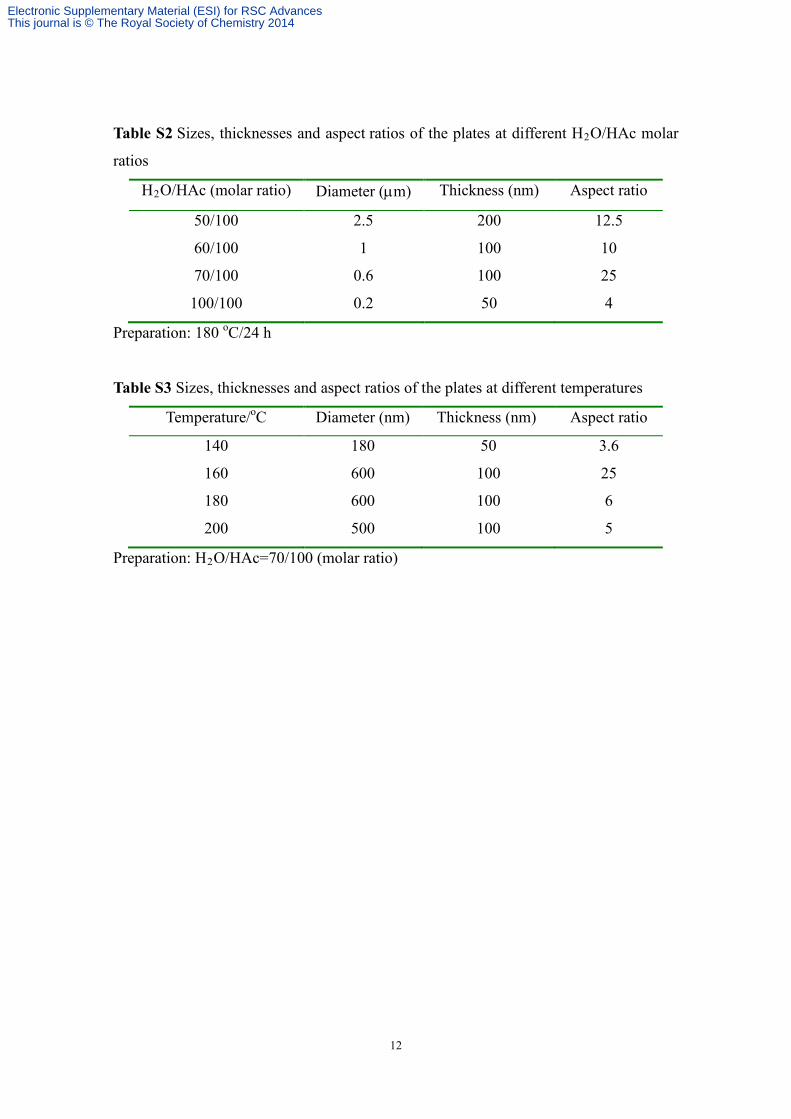
Table S2 Sizes, thicknesses and aspect ratios of the plates at different H2O/HAc molar
ratios
H2O/HAc (molar ratio) Diameter (µm) Thickness (nm) Aspect ratio
50/100 2.5 200 12.5
60/100 1 100 10
70/100 0.6 100 25
100/100 0.2 50 4
Preparation: 180 oC/24 h
Table S3 Sizes, thicknesses and aspect ratios of the plates at different temperatures
Temperature/oC Diameter (nm) Thickness (nm) Aspect ratio
140 180 50 3.6
160 600 100 25
180 600 100 6
200 500 100 5
Preparation: H2O/HAc=70/100 (molar ratio)
Electronic Supplementary Material (ESI) for RSC AdvancesThis journal is © The Royal Society of Chemistry 2014