Embed Size (px)
Citation preview

Estonian ICT Cluster and Development TrendsEstonian ICT Cluster and Development TrendsTarmo Kalvet,PRAXIS Center for Policy Studies

Structure of the PresentationStructure of the Presentation• I: Definitions and Methodological Approach
– About the Project– Methodology (1): Stages of Economic Development– Methodology (2): Porter’s Diamond
• II: Estonian ICT Sector: Current Standing– General facts– Porter’s Diamond (1): Factor conditions– Porter’s Diamond (2): Demand conditions– Porter’s Diamond (3): Related and supporting industries– Porter’s Diamond (4): Firm strategy, structure and rivalry– IST R&D in Estonian ICT Cluster
• Conclusions, Q&A
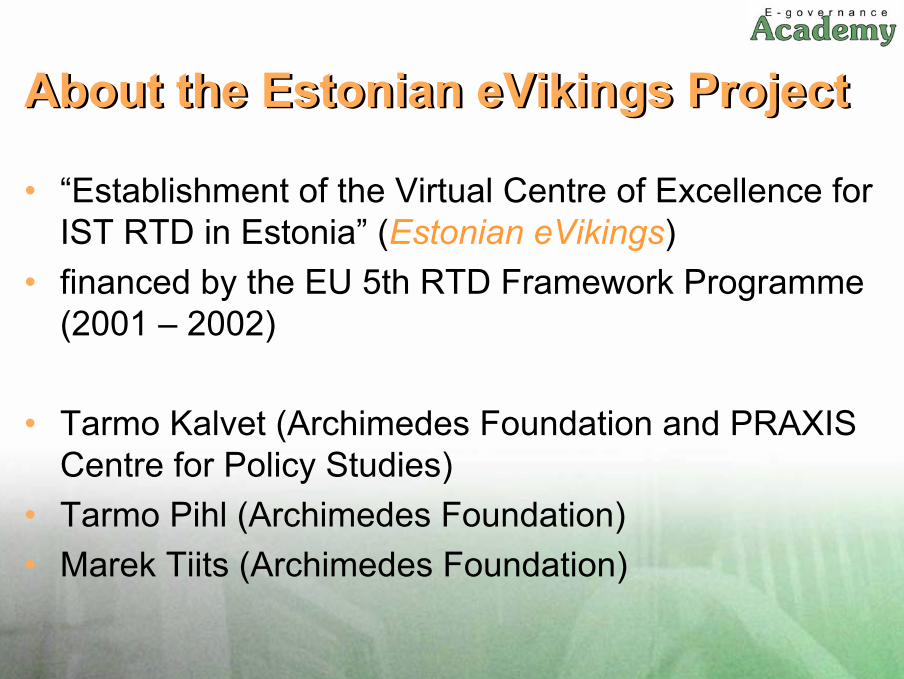
About the Estonian eVikings ProjectAbout the Estonian eVikings Project
• “Establishment of the Virtual Centre of Excellence for IST RTD in Estonia” (Estonian eVikings)
• financed by the EU 5th RTD Framework Programme(2001 – 2002)
• Tarmo Kalvet (Archimedes Foundation and PRAXIS Centre for Policy Studies)
• Tarmo Pihl (Archimedes Foundation)• Marek Tiits (Archimedes Foundation)

Project objectivesProject objectives• The Estonian eVikings project aims to integrate Estonian
leading IST research and development labs and companies through the everyday collaborative RTD projects better with the European academia and industry, innovation networks.
• Currently feasibility study phase of the project starts building up the Virtual Centre of Excellence for IST RTD by strengthening the existing IT innovation infrastructure in Estonia, strengthening the links between Estonian and European IST communities, introduction of new co-operative research and development projects.
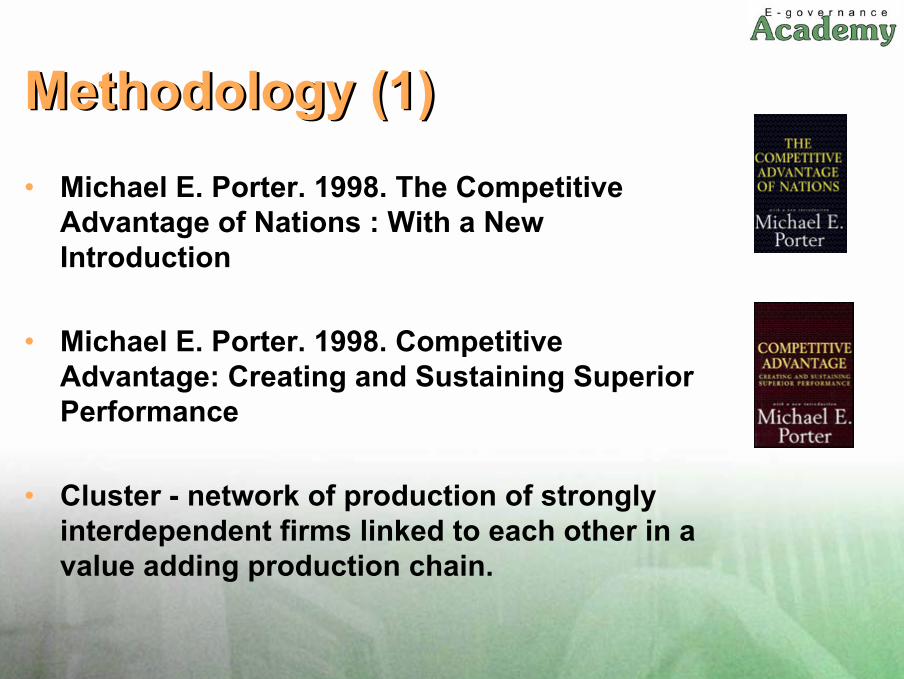
Methodology (1)Methodology (1)• Michael E. Porter. 1998. The Competitive
Advantage of Nations : With a New Introduction
• Michael E. Porter. 1998. Competitive Advantage: Creating and Sustaining Superior Performance
• Cluster - network of production of strongly interdependent firms linked to each other in a value adding production chain.
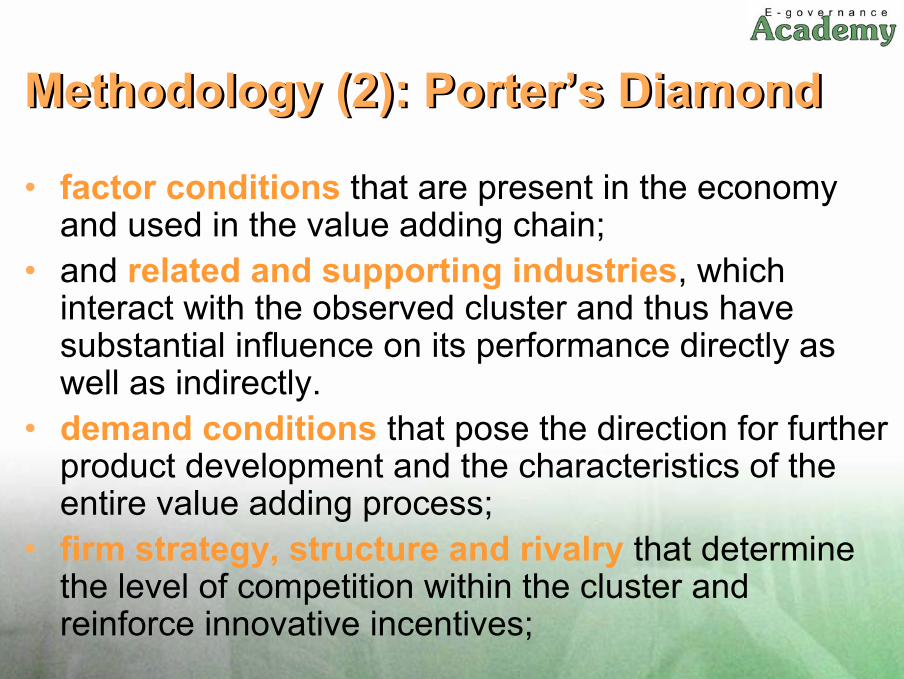
Methodology (2): Porter’s DiamondMethodology (2): Porter’s Diamond
• factor conditions that are present in the economy and used in the value adding chain;
• and related and supporting industries, which interact with the observed cluster and thus have substantial influence on its performance directly as well as indirectly.
• demand conditions that pose the direction for further product development and the characteristics of the entire value adding process;
• firm strategy, structure and rivalry that determine the level of competition within the cluster and reinforce innovative incentives;

Porter’s DiamondPorter’s Diamond
Firm strategy, structure, and
rivalry
Firm strategy, structure, and
rivalry
Demand conditions
Demand conditions
Related and supporting industries
Related and supporting industries
Factor conditionsFactor conditions

Methodology (3)Methodology (3)• factor-driven stage - an economic system whose
performance is dependent on the availability of primary factors, such as land, labour and capital
• investment-driven economy - financial capital is invested into modern facilities and into complex foreign products as well as process technology
• innovation-driven status - efficient and sophisticated technological solutions, extensive research and development that generates innovative products, continual training of the workforce
• => Porter’s Diamond
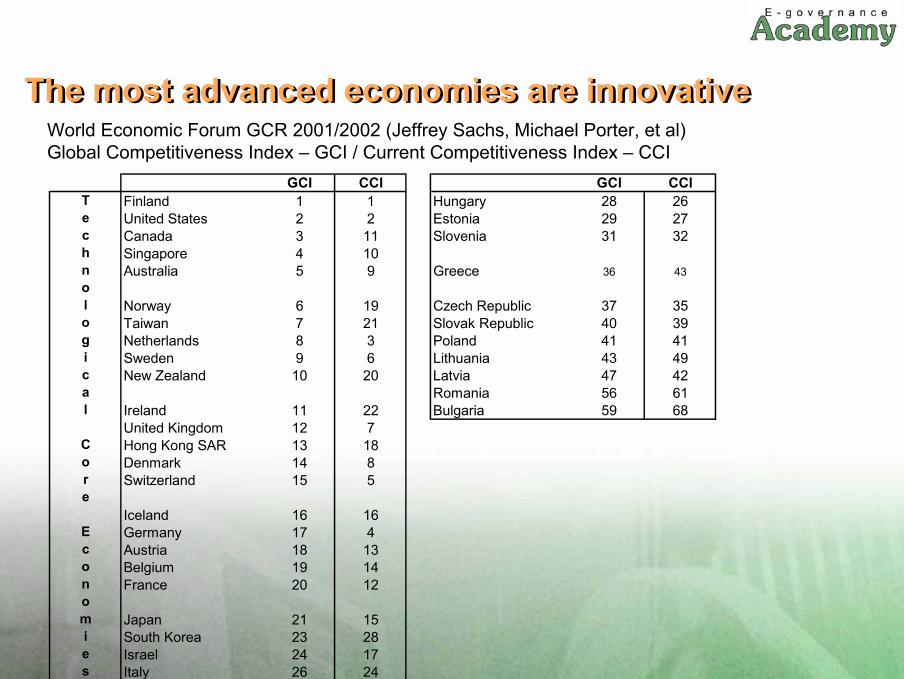
The most advanced economies are innovativeThe most advanced economies are innovativeWorld Economic Forum GCR 2001/2002 (Jeffrey Sachs, Michael Porter, et al)Global Competitiveness Index – GCI / Current Competitiveness Index – CCI
GCI CCI GCI CCIFinland 1 1 Hungary 28 26United States 2 2 Estonia 29 27Canada 3 11 Slovenia 31 32Singapore 4 10Australia 5 9 Greece 36 43
Norway 6 19 Czech Republic 37 35Taiwan 7 21 Slovak Republic 40 39Netherlands 8 3 Poland 41 41Sweden 9 6 Lithuania 43 49New Zealand 10 20 Latvia 47 42
Romania 56 61Ireland 11 22 Bulgaria 59 68United Kingdom 12 7Hong Kong SAR 13 18Denmark 14 8Switzerland 15 5
Iceland 16 16Germany 17 4Austria 18 13Belgium 19 14France 20 12
Japan 21 15South Korea 23 28Israel 24 17Italy 26 24
Technological Core Economies

II: Estonian ICT Sector: Current Standing
II: Estonian ICT Sector: Current Standing

1. Factor Conditions (1)1. Factor Conditions (1)• Fast take-up of the Information and communications
technologies– Telecommunications infrastructure well in place and the Internet
penetration close to European average (and close to the saturation)
– eBanking, eGovernment (and eEducation) are the main driving forces of the content and services development
• Estonian ICT sector is consolidated – 8 largest companies account for 80% of turnover
• Sweden and Finland are the main target countries with about95% of the total ICT exports
• Subcontracting very important in all ICT domains. In telecom equipment and electronics subcontracting has 60-100% share in turnover.

Factor Conditions (2)Factor Conditions (2)
• Elcoteq Tallinn AS - 83% of total Estonian ICT exports and 96% of telecom equipment export
• Estonian Telephone Company• Estonian Mobile Telephone• Radiolinja Estonia • TELE2• JOT Estonia • Tarkon• MicroLink
• Hansabank – IT systems development leader in financial sector

Source: McConnell International

Source: McConnell International

2. Related and supporting industries2. Related and supporting industries
• Manufacturing– 14.8% share of GDP– food, wood, furniture, textile industries– supplier-dominated activities– most innovations come from suppliers of equipment
and materials; firms undertake generally little R&D and request few patents (Pavitt 1984)
• Banking• Governmental structures

Figure 3. Proportion of industrial production by economic activity (percentages)years 1992, 1994, 1996, 1998, 1999
31,6 32,827,2 24,5
20,2
11,014,7
13,311,0
12,2
3,7
4,6
6,59,1
11,2
4,9
5,05,4 6,5 6,8
11,84,6
6,9 6,3 6,0
1,6 2,5 3,7 4,5 5,0
7,6 7,6 7,2 5,2 4,2
27,8 28,2 29,8 32,9 34,4
0%
20%
40%
60%
80%
100%
1992 1994 1996 1998 1999
year
%
Other
Manufacturing of chemicals and chemical products
Publishing, printing and reproduction of recorded media
Manufacturing of textiles
Manufacturing of furniture
Manufacturing of wood
Energy supply
Manufacturing of food products, beverages andtobacco products
Source: Statistical Office of Estonia (2001)

Source: Estonian eVikings

3. Demand conditions3. Demand conditions• Sub-contracting
– 73% originates from abroad– Export of services is marginal– The effect of Scandinavia can be summed up in a dual manner:
• on the one hand, it has facilitated the uptake of novel technology and provided Estonian companies with sustainable income through subcontracting;
• on the other, it reinforces the lock-in effect as the Estonian ICT industry is captured in low value added activities with little promotion of incentives for innovation.
• Estonian information society developments– Internet Banking– Governmental structures– B2B, B2C


Digital Divide existingDigital Divide existing
Source: Digital Divide in Estonia

3. Firm strategy, structure and rivalry3. Firm strategy, structure and rivalry
• Consolidation– telecommunications– banking
• Estonian companies try to be fast imitators and utilise novel products developed elsewhere
• Only 9% actually cooperate with the domestic universities
• Lack of foresight and strategic planning
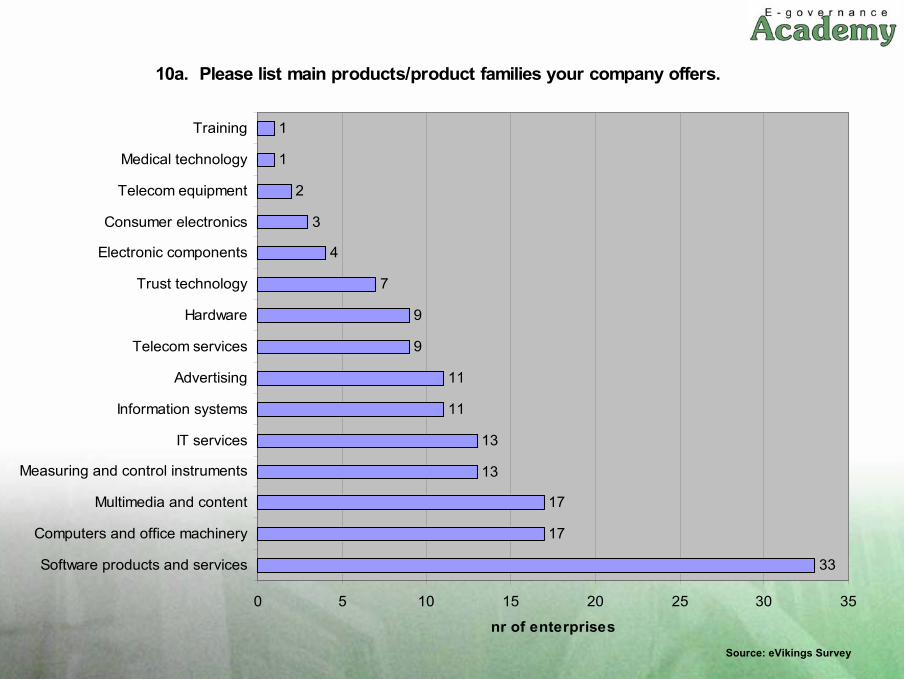
10a. Please list main products/product families your company offers.
33
17
17
13
13
11
11
9
9
7
4
3
2
1
1
0 5 10 15 20 25 30 35
Software products and services
Computers and office machinery
Multimedia and content
Measuring and control instruments
IT services
Information systems
Advertising
Telecom services
Hardware
Trust technology
Electronic components
Consumer electronics
Telecom equipment
Medical technology
Training
nr of enterprisesSource: eVikings Survey
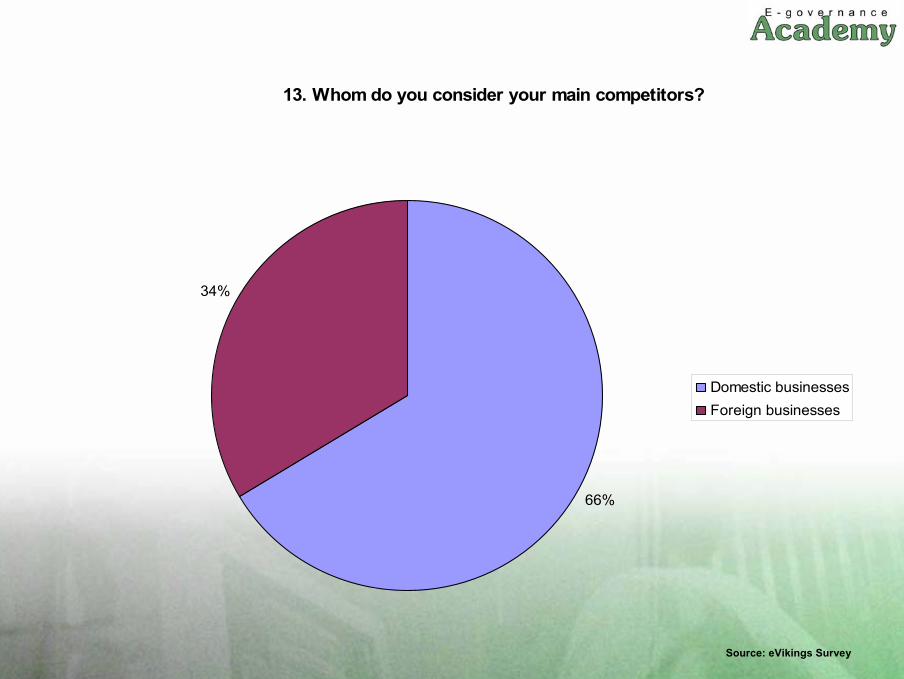
13. Whom do you consider your main competitors?
66%
34%
Domestic businessesForeign businesses
Source: eVikings Survey
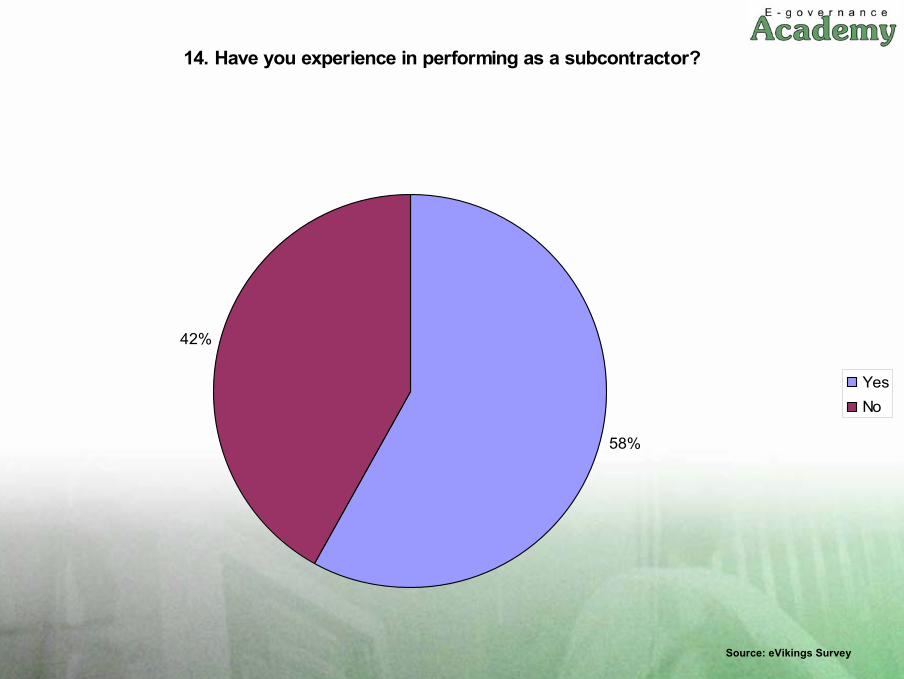
14. Have you experience in performing as a subcontractor? �
58%
42%
YesNo
Source: eVikings Survey

21. How long in advance do you try to foresee market developments?
48%
23%
21%
8%
Up to 2 yearsUp to 1 yearUp to 5 yearsUp to 6 months
Source: eVikings Survey

19. How long is your strategic planning horizon?
51%
42%
7%
Our company has long term strategymore than 1 yearOur company has short term strategy upto 1 yearOur company does not have strategicplans
Source: eVikings Survey

39c. What kind of specialists would you need in the future the most? (MORE THAN ONE CHOISE ALLOWED)
4240
30
20
1310
8
0
5
10
15
20
25
30
35
40
45
techn
ology
/prod
uct s
pecia
lists
projec
t man
agers
sales
perso
nnel
R&D perso
nnel
market-
resea
rchers
quali
ty co
ntroll
ers else
nr o
f ent
erpr
ises
Source: eVikings Survey

42. What factors seem to be the most constraining on your company’s development?
63
3128
2622
20
6
0
10
20
30
40
50
60
70
lack of qualifiedpersonnel
small customerbase
lack of R&Dinvestments
lack ofoperational
capital
lack of know-how and
experience
changinglegislative
environment
else
nr o
f ent
erpr
ises
Source: eVikings Survey

IST R&D in Estonian ICT ClusterIST R&D in Estonian ICT Cluster• R&D expenditure: 0.8% of GDP• R&D intensity relatively low
– Public expenditure is very fragmentised and limited in absolute terms
– Rare contact between the public R&D themes and the (foreseeable future) market needs
– Enterprises are not actively involved into formal R&D activities yet
• Serious need for the capacity-building measures– Weak strategic planning and technology management
practice– Networking within the national innovation system
should be strengthened

Key Emerging TechnologiesKey Emerging Technologies
0%
5%
10%
15%
20%
25%
30%
35%Embedded intelligence
Middle-ware and distributed systems
IP mobile and wireless
Multi-domain network management
Converging core and access networks
Micro- and opto-electonics
Trust and confidence
Cross media content
Multi-modal and adaptive interfaces
Multilingual dialogue mode
Estonia EC IST 1999-2000
Only 1/3 of the Estonian IT R&D projects target one of the KET
Source: eVikings

IT R&D market orientationIT R&D market orientation
0
1
2
3
4
5
6
7
8
9
10
Softwaretechnologies
Microelectronics Networkinfrastructure
Languagetechnologies
eLearning andknowledge
management
Content services New workmethods
eCommerce eGovernment
Targeted funding Estonnian Science Foundation Estonian Technology Agency
Very few projects target emerging needs of the information society
Number of projects
Source: eVikings

Source: eVikings

Additional readingsAdditional readings• Kalvet, T., Pihl, T, Tiits, M. 2002. The Estonian ICT Cluster: The
Current Status and Future Challenges. Baltic IT Review, No. 2 (25), pp. 56-59.
• http://www.ebaltics.com
• Kalvet, T., Pihl, T., Tiits, M. 2002. Analysis of the Estonian ICT Sector Innovation System. Executive Summary. Tartu: Archimedes.
• http://www.esis.ee/eVikings/evaluation/eVikings_executive_summary.pdf
• Secretariat of the Research and Development Council (Tiits, M. and R. Kaarli). 2002. Research and Development in Estonia 2000-2001.
• http://www.tan.ee/tan/en/doc/Documents/1019471063.13/RTD in Estonia 2000-2001 print.pdf

Thank you for your attention!Thank you for your attention!
Tarmo KalvetPRAXIS Center for Policy Studies