Embed Size (px)
Citation preview
ESTIMATION OF THE STOCK OF CAPITAL IN SPAIN
Matilde Mas, Francisco Pérez y Ezequiel Uriel
Universitat de València and Instituto Valenciano de Investigaciones Económicas
A B S T R A C T
The paper presents the methodology and results of the estimation of the endowments of
capital in the Spanish economy. It distinguishes between endowments of public capital and
private capital. The series corresponding to the public sector cover the period 1955-1997 and
consider seven categories (or functions). The estimates are disaggregated by 17 regions and 50
provinces. The level of disaggregation is regional and provincial (NUTS2 and NUTS3 in
European terminology). The private capital series cover the period 1964-1997 and consider 17
sectors of production, with disaggregation at regional level. The information refers to two
variables: gross formation of fixed capital (in current and constant pesetas) and net capital stock
in constant pesetas (base year 1990).
Keywords: Data Estimation Methodology; Capital Stock
JEL: C82, E22
2
The stocks of fixed capital of countries and regions have in recent years occupied a
prominent place in debates on economic policy and also in the new approaches to the analysis of
growth. The discussions arising in different countries have been possible thanks to the
availability of previous estimates of capital stock. The OECD's publication Flows and Stocks of
Fixed Capital reproduces the estimates made in those member countries that have them, and
makes evident the absence of capital stock estimates in many of them. The countries referred to
by the last document published (OECD, 1998) are Canada, U.S.A., Japan, Australia, Belgium,
Denmark, Finland, France, Germany, Greece, Italy, Norway, Sweden and the U.K.. The
information is available, though not for all countries and with some breaks in methodology, for
the period 1964-1996. Although the information is not always homogeneous, the variables
considered are as follows: gross and net capital stock, gross fixed capital formation, and gross
fixed capital consumption, all of them valued at current and constant prices. In turn, each of the
variables presents the following sector disaggregation: 1.- Agriculture; 2.- Industry, 2.1.-
Manufacturing; 3.-Services, excluding dwellings; 4.-Dwellings, and 5.-Producers of Government
Services. The first four constitute the private sector of the economy, while the last refers to the
public sector.
The first studies of the estimation of capital stock in Spain were centered on the
measurement of national wealth1 and, from this perspective, considered not only physical capital
but also natural resources. In most of the countries of the OECD referred to above, the definition
of capital stock is restricted to durable, tangible and reproducible assets2.
This is also the approach adopted in the estimations presented in section III. The
endowments analysed are thus circumscribed to non-financial material reproducible assets.
The debate on the role of public capital in the United States also threw light on the
importance of the level of geographical disaggregation in the estimation of stocks. There are at

3
least two reasons for analysing its effect from a territorial viewpoint. On the one hand, the
inequalities in the regional endowments of public capital may condition access to its services and
with it, the present welfare and the future growth opportunities of different economic areas. This
aspect is especially important from the point of view of regional policy. Secondly, spillover
effects, associated with a large number of public infrastructures due to the network characteristic
associated with many of them, make recommendable the disaggregated analysis of the impact on
growth of public investment3. The debate in other countries also showed the different impact on
growth of the different types of public capital. In the discussion a distinction is usually made
between infrastructures directly linked to the process of production (roads, railways, water cycle,
urban structures, etc) and those of a social character (education and health, fundamentally).
In Spain no suitable statistical information on the stock of capital was available until
recently, so some of the debates which have taken place - e.g. on the role of infrastructures -have
for a time lacked the essential objective references and the analysis of the strong economic
growth of the last few decades has been incomplete. The Valencian Institute for Economic
Research (IVIE) has in recent years undertaken the task of covering this statistical vacuum. The
initiative initially had the support of the European Commission, and has now become a joint
project between the IVIE and the Banco Bilbao-Vizcaya Foundation, which currently supports
its continuity. So far three editions have been made4. The last one covers the period 1964-1997 in
the series corresponding to the private sector, and 1955-1997 in the public sector series. The
regionalised series end in 1995. The diffusion of these have been received with great interest by
Spanish researchers and by those researchers of other countries who, on specific occasions, have
come to know of its existence. The complete series and their subsequent updatings are available
on Internet5. The aim of this article is to make known the methodology and results of an
ambitious project, potentially interesting not only for the academic community but also for other
4
analysts and managers.
The research undertaken had to fulfil the following requirements:
a) Be consistent, in methodology and demarcation of the agents, with the estimations
made in the other countries of the OECD.
b) Take the regions as the geographical unit of reference. In the case of public capital
stock the information also enables further disaggregation, to province level6.
c) Distinguish, as far as the statistical information allowed, between different types of
public infrastructures and particularly between productive and social infrastructures.
d) Disaggregate by sectors, as far as possible, the stock of private capital.
The paper is structured as follows. Section I describes the basic lines of the methodology
followed in the estimation of the public capital series, and section II those corresponding to the
private sector. Section III presents some results giving information in the Spanish regions with
regard to capital endowments, section IV illustrates some applications already made and section
V concludes.
I. ESTIMATION OF PUBLIC CAPITAL7
I.1. Demarcation of the Government Sector
The demarcation adopted is that applied by the Spanish National Accounts (CNE) and by
the government accounts of Spain (CAP). In CNE-85 the sector is disaggregated into the
following sub-sectors (two digits) and agents (three digits):

5
S.61. General Government
S.611. Central government
S.612. Autonomous Government Bodies
S.62. Territorial Administrations
S.621. Regional government
S.622. Local government
S.63. Social Security Funds Administration
S.631. Social Security System
S.632. Other Social Security Administrations
The above classification is currently valid, but has undergone substantial modifications
with the passage of time. For this reason it has been necessary, in the analysis of the time series,
to make adjustments to allow comparability of the magnitudes across time.
I.2. Classifications of public capital stock: functional and territorial
The criterion of classification of the public capital stock followed in the study is two-fold:
a) the evaluation on a territorial basis of the government capital stock, and b) the composition of
the public capital stock in terms of its purpose or function. With regard to the territorial criterion
it has already been indicated that the information has been classified at the level of regions and
provinces.
In the selection of the functions considered two criteria have been followed. On the one
hand, the statistics available restrict the feasible level of disaggregation that fulfils the necessary
6
requirement of homogeneity. On the other, we have concentrated on those functions which the
specialist literature recognises as having greatest influence on growth.
The two considerations have led us to distinguish the following functions: 1.- Road
infrastructures; 2.- Urban infrastructures; 3.- Water infrastructures; 4.- Ports, Coasts and
Maritime Signaling; 5.- Health; and 6.- Education.
This classification applies exclusively to the capital stock belonging to Government.
Because of their interest, the series corresponding to other investment agents offering public
services have also been drawn up: 7.- Toll motorways; 8.- Ports not belonging to the
Government; 9.- Airports; and 10.- Railways.
I.3. The Permanent Inventory Method (PIM)
For the calculation of the capital stock, several estimation procedures8 can be considered,
but the most used is the Permanent Inventory Method (PIM). This procedure derives capital
series from the accumulation of investment series. It is the method adopted by all the countries of
the OECD that make estimations of capital stock. The difficulty and the cost of estimating
capital series from census information, and the rigidity of the procedure, which makes frequent
updating complicated, have led to this method being the one generally adopted by countries. The
accumulation of investment series is the basic point of reference for the method, but does not
prevent its results being enriched with additional information taken from the Census or referring
to the physical characteristics of the assets. In the estimations made, we have included all the
additional information available relating to the inventory of physical assets, to complement the
investment series in some cases and also as a criterion of territorialisation.

7
The estimations based on the PIM distinguish between two measurements of capital
stock: gross and net. The gross capital stock represents the total volume of the physical
productive assets available in a country, and is considered to be the volume of capital available
for the productive process at a moment in time when it may be used in an economic system9. The
gross capital stock in a given year is obtained by accumulating the past flows of investment and
deducting from them the accumulated value of the investment that has been withdrawn, using for
this a given withdrawal pattern and estimates of average life.
Net capital stock represents the accumulated value, minus depreciation, of the existing
gross capital stock. This magnitude reflects the effect of the composition by years or by
generations of the productive equipment on its productive capacity. Thus, the net stock correct
gross stock for the reduction in its value originated by use, obsolescence and aging10. The
Spanish capital series are provided only, following SNA-93 suggestion, in net terms.
I.4. Valuation Method
The valuation of the investment series, and therefore of the stock itself, is usually done at
current prices and at constant prices11. To deflate the investment of the Government a specific
deflator should be available, for each type of asset, at the maximum level of disaggregation.
Reasons of statistical availability limit the disaggregation to four items from 1954, and to a
single item in the previous period (which goes back to 1857). The four deflators drawn up for the
period beginning in 1954 are: 1. Residential properties; 2. Other construction; 3. Transport
material; and 4. Machinery, equipment and other products. These deflators have been applied to
the investment series - which are provided at current prices and at constant prices (base year
1990). The net stock series are expressed only in constant prices of 1990.

8
I.5. Average Lives
Average Life is understood to be the period of time during which the capital asset is
expected to remain in the stock (and not the period of time that it is considered in the accounts
for financial or tax reasons). The period during which the asset remains in the stock will depend
on its technical characteristics and also on the conditions in which it is used (maintenance,
working conditions, etc).
This study takes into account the average lives used in the following estimations: 1.-
Bureau of Economic Analysis (BEA) of the USA; 2.- INSEE of France, in the report by
J.Mairesse (1972); 3.- A.Munell (1990), in his estimation of public capital by regions in the
USA; 4.- The maximum lives permitted for taxation purposes in Spanish company tax, as many
countries, e.g. the USA and Germany, derive from this source their estimations of average lives;
5.- A summary of the average lives used in different countries reproduced in the studies by Ward
(1976) and Keese et al. (1991); and 6.- The opinion of Spanish experts, fundamentally architects
and engineers, who work for the Government. Of all the above, only the BEA and A.Munell refer
explicitly to public capital. The remainder are applied basically to estimations of private capital.
There are notable differences in average lives among the above-mentioned sources,
which may have at least two different origins. First, they may be due to differences in the
productive structure and/or in the technology used, and second, to differences in the period of
time considered. There seems to be agreement on the reduction of life expectancy of capital in
recent decades, due to the faster obsolescence or the technology used in production. This process
must have been especially intense in the case of machinery and equipment, but was by no means
negligible even in "buildings and other constructions".

9
In table 1 there is a summary of the average years of life used in the estimations of capital
stock for the Spanish economy.
Table 1. Average lives used in the estimation of Public Capital
Average years of life
Roads
until 1965: 60 from 1966: 40
Water Works Basic infrastructures: 60
Supply and irrigation infrastructures: 30 Unclassified: 40
Urban Structures 30
Ports 50
Railways 40
Education Buildings: 50 Equipment: 15
Health Buildings: 50 Equipment: 15
Transport material: 10
Airports 20
The assumptions as to average lives have a significant influence on the results obtained
by the permanent inventory method. In a simulation exercise carried out in the European
Community12 with five survival functions (quasi-logistic, gamma, sudden death, delayed linear
and lognormal) and different assumptions as to the average life and growth rate of investment, it
was found that if the duration of the average life were to be extended from 10 to 20 years, and
the rate of investment to remain constant, the gross capital stock estimated would be doubled; it

10
would increase by 50% if investment increased at a rate of 5% per year, and finally, it would
increase by 30% or 40% if investment grew at 10% per year. These results clearly illustrate the
importance of assumptions of average lives for the results.
I.6. Depreciation and Survival Functions
In international estimations, the use of the Winfrey S-1313 survival function has become
general, and for this reason it has been selected for application in this study. Winfrey (1935), on
the basis of a statistical analysis of withdrawal of capital goods in the USA, established general
equations of eighteen frequency curves14 to determine withdrawals. These eighteen curves are
grouped into three types: with the mode at the right (five curves), with the mode at the left (six
curves) and symmetrical (seven curves). In his study, Winfrey was inspired by a family of twelve
type-curves, developed by Karl Pearson, reflected in the study by Elderton (1927). The Pearson
family of curves was designed to determine the theoretical curve most suitable for a given
distribution of frequencies15.
A further question to be kept in mind is the time reference for the capital stock and for the
investment flows. Investments have been considered to be made at the mid-point of each year.
The capital stock refers to 31 December of each year.

11
I.7. Statistical Sources
A large number of sources have been used. We consider that a detailed description of
them is of little interest to a non-Spanish reader. It is enough to say that for public capital the
basic source of information was the budget settlements available, though not homogeneously for
the whole period, since 1857. The functional classification was made according to the COFOG,
the functional classification of public expenditure proposed by the United Nations in 1980. For
the consideration or otherwise of the different budget items, the criteria of ESA16 have been
taken into account for defining the gross fixed capital formation.
12
II. ESTIMATION OF PRIVATE CAPITAL
II.1. Demarcation of the Private Sector
Consistency requires Spanish total investment to correspond with that given by the
National Statistical Institute in Spain's National Accounts and Regional Accounts. Therefore, the
aggregate investment series for the private sector has been obtained as the difference between
total investment and that made by the Government and other quasi-public infrastructures.
Observe that the investment made by Public Enterprises thus appears included in the private
sector of the economy. On the other hand, the private capital of the transport services sector does
not include the part corresponding to ports, airports, railway infrastructures and motorways,
since this capital is reflected in the public capital series. In the same way, the capital of the
agricultural sector does not include the result of the public investments in the sector, not even
when these public investments revert to the private sector (as is the case with irrigation
infrastructures), as they have been considered in the public capital stock.
II.2. Disaggregation by sector and territory
Two kinds of consideration have influenced the decision on the level of disaggregation by
sectors: that is should be the maximum possible allowed by the information available, and that it
should correspond to the disaggregation by branches of production used in standard
classifications of economic activities in the European Union. The sectors for which information
is provided on investment and capital stock at regional level for the period 1964-1994 are those

13
appearing in table 2.
Table 2. Private Sector Disaggregation
1. Agriculture
2. Fishing
3. Energy products
4. Industrial products
4.1. Metallic minerals and metal production
4.2. Non-metallic minerals and products
4.3. Chemical products
4.4. Other metallic products
4.5. Industrial and agricultural machinery
4.6. Office machinery and computers
4.7. Electric material and accessories
4.8. Transport material
4.9. Food products, drinks and tobacco
4.10. Textiles, leather and footwear, clothing
4.11. Paper, paper articles, printing
4.12. Rubber products and plastics
4.13. Wood, cork and other manufactures
5. Construction
6. Dwelling
7. Services
7.1. Hotel and restaurant services
7.2. Transport services
7.3. Communication services
7.4. Credit institutions and insurance
7.5. Other services

14
Also in this case the series are those corresponding to gross fixed capital formation, at
current and constant prices, and to the net capital stock at constant prices (base 1990). The level
of territorial disaggregation is regional, as the statistical information makes the extension to the
fifty provinces of Spain a difficult task.
II.3. Method of Estimation
As has been indicated, the application of the PIM requires the availability of long time
series of investment. For investments made by the private sector the information is more limited
and this situation makes it difficult to start the series in the year 1955. Furthermore, if it is
intended to estimate the capital of the different private sectors since 1964, the PIM cannot be
applied in the same way as has been done in the estimation of public capital, except in those
sectors in which a sufficiently long investment series was available, as in the communications
sector.
Due to the difficulty mentioned, in this case the permanent inventory method has been
applied on the basis of an initial capital stock. For this calculation, the research has rested on the
study of the National Wealth of Spain available for 196417. According to this procedure, to an
initial capital stock are accumulated the investment flows corresponding to the subsequent years.
In order to apply the PIM to these sectors, it is necessary to have available annual fixed capital
consumption rates for each one of them. The OECD compiles and offers, for those countries that
make this type of estimations, investment and capital series (in both gross and net terms) with the

15
sector disaggregation mentioned in the text. Behind these series lie assumptions regarding the
average life of the capital goods and structures in which each of these sectors invests, as well as
the composition of the investment in each of them. In general, the average lives used by the
different countries do not coincide18. On the basis of the information provided by the OECD we
have estimated the implicit series of proportional rates of fixed capital consumption of the
manufacturing sector as a whole. Observe that these rates include both depreciation and the
withdrawal of capital goods. Next we have obtained the average rates for all countries, rates
which have been considered to be a good approximation of those which may have held in the
Spanish manufacturing sector in the course of time. The average rates corresponding to the 14
sectors that make it up have been derived by maintaining the ratio between the rate estimated for
the Spanish case by Martín and Moreno (1991) for each branch and its estimation for the sector
as a whole. In the "Other services" sector we have used the implicit average rates observed by
the OECD, excluding dwellings. The rate of fixed capital consumption used can be seen in table
3.
Table 3. Fixed capital consumption rates
SECTORS Average rate used
Energy products 6.4 Metallic minerals and metal production 6.4 Non-metallic minerals and products 8.5 Chemical products 8.8 Metal products 9.0 Industrial and agricultural machinery 10.3 Office machinery and computers 9.0 Electric material and accessories 9.4 Transport material 10.6 Food products, drinks and tobacco 9.3 Textiles, leather and footwear, clothing 9.7 Paper, paper articles, printing 7.8 Rubber products and plastics 6.7 Wood, cork and other manufactures 8.8 Leasing 8.5

16
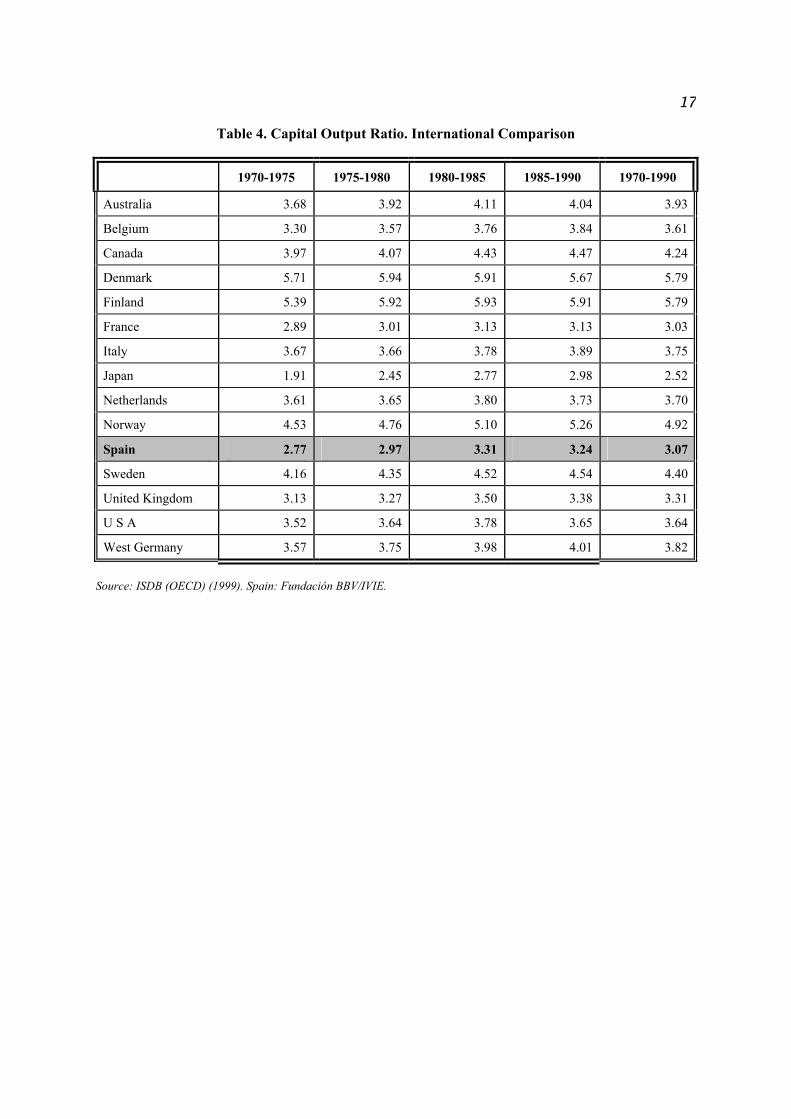
III. RESULTS
From the estimates described in the previous sections, it has been possible to advance
substantially in the knowledge of the process of capitalisation and growth of the Spanish
economy. But first, it is of interest to illustrate the situation of the Spanish endowments of
capital in the international context. In table 4 appears the capital/output ratio in all the countries
considered by the OECD International Sectoral Data Base (ISDB) together with the Spanish
data. This information allows to conclude that the Spanish ratio is similar to most of the
European countries, though in the inferior range, and that it has increased in the course of time.
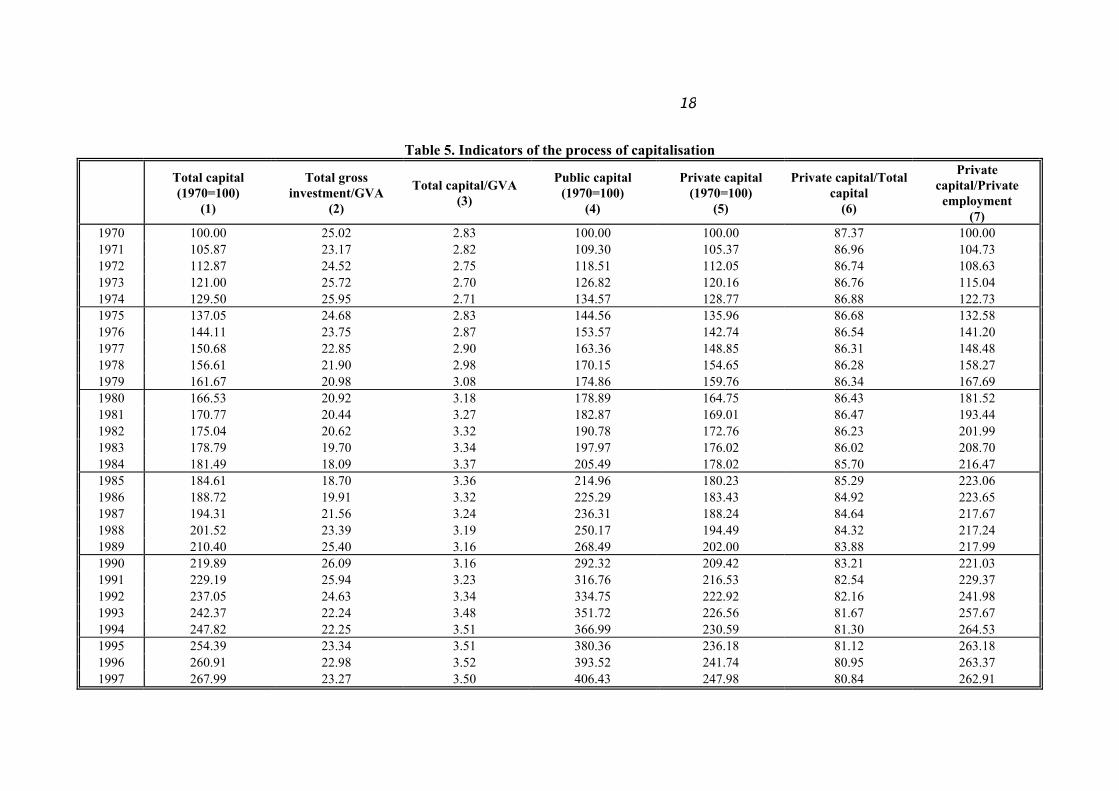
The wealth of information can be exploited in many ways, from the aggregate and
regional viewpoints. Some features that now, thanks to this series, it is possible to know, appear
in table 5. The data refer to the Spanish total but are also available at regional level, and those
referring to public capital also at provincial level.
Table 5 reflects the intense process of capitalisation of the Spanish economy in the last
twenty-seven years, especially intense in the first part of the period, as the accumulated stock
was multiplied practically by three (column 1). This growth was the result of an important
participation, with the corresponding cyclical profile, of investment in GVA. For most of the
period, with the exception of the years of serious economic crisis 1981-1986, was over 20%, and
even over 25% in the periods of expansion (column 2). Consequently, the capital/product ratio
rose from 2.83 to 3.51 (column 3).
17
Table 4. Capital Output Ratio. International Comparison
1970-1975 1975-1980 1980-1985 1985-1990 1970-1990
Australia 3.68 3.92 4.11 4.04 3.93
Belgium 3.30 3.57 3.76 3.84 3.61
Canada 3.97 4.07 4.43 4.47 4.24
Denmark 5.71 5.94 5.91 5.67 5.79
Finland 5.39 5.92 5.93 5.91 5.79
France 2.89 3.01 3.13 3.13 3.03
Italy 3.67 3.66 3.78 3.89 3.75
Japan 1.91 2.45 2.77 2.98 2.52
Netherlands 3.61 3.65 3.80 3.73 3.70
Norway 4.53 4.76 5.10 5.26 4.92
Spain 2.77 2.97 3.31 3.24 3.07
Sweden 4.16 4.35 4.52 4.54 4.40
United Kingdom 3.13 3.27 3.50 3.38 3.31
U S A 3.52 3.64 3.78 3.65 3.64
West Germany 3.57 3.75 3.98 4.01 3.82
Source: ISDB (OECD) (1999). Spain: Fundación BBV/IVIE.
18
Table 5. Indicators of the process of capitalisation
Total capital
(1970=100) (1)
Total gross investment/GVA
(2)
Total capital/GVA (3)
Public capital (1970=100)
(4)
Private capital (1970=100)
(5)
Private capital/Total capital
(6)
Private capital/Private employment
(7) 1970 100.00 25.02 2.83 100.00 100.00 87.37 100.00 1971 105.87 23.17 2.82 109.30 105.37 86.96 104.73 1972 112.87 24.52 2.75 118.51 112.05 86.74 108.63 1973 121.00 25.72 2.70 126.82 120.16 86.76 115.04 1974 129.50 25.95 2.71 134.57 128.77 86.88 122.73 1975 137.05 24.68 2.83 144.56 135.96 86.68 132.58 1976 144.11 23.75 2.87 153.57 142.74 86.54 141.20 1977 150.68 22.85 2.90 163.36 148.85 86.31 148.48 1978 156.61 21.90 2.98 170.15 154.65 86.28 158.27 1979 161.67 20.98 3.08 174.86 159.76 86.34 167.69 1980 166.53 20.92 3.18 178.89 164.75 86.43 181.52 1981 170.77 20.44 3.27 182.87 169.01 86.47 193.44 1982 175.04 20.62 3.32 190.78 172.76 86.23 201.99 1983 178.79 19.70 3.34 197.97 176.02 86.02 208.70 1984 181.49 18.09 3.37 205.49 178.02 85.70 216.47 1985 184.61 18.70 3.36 214.96 180.23 85.29 223.06 1986 188.72 19.91 3.32 225.29 183.43 84.92 223.65 1987 194.31 21.56 3.24 236.31 188.24 84.64 217.67 1988 201.52 23.39 3.19 250.17 194.49 84.32 217.24 1989 210.40 25.40 3.16 268.49 202.00 83.88 217.99 1990 219.89 26.09 3.16 292.32 209.42 83.21 221.03 1991 229.19 25.94 3.23 316.76 216.53 82.54 229.37 1992 237.05 24.63 3.34 334.75 222.92 82.16 241.98 1993 242.37 22.24 3.48 351.72 226.56 81.67 257.67 1994 247.82 22.25 3.51 366.99 230.59 81.30 264.53 1995 254.39 23.34 3.51 380.36 236.18 81.12 263.18 1996 260.91 22.98 3.52 393.52 241.74 80.95 263.37 1997 267.99 23.27 3.50 406.43 247.98 80.84 262.91

19
The growth of public capital (column 4) was more intense than that of private capital
(column 5) over almost the whole period. The accumulated result of the respective rates of
accumulation is that public infrastructures were multiplied by 4 and private capital by 2.5. The
latter rate is a fundamental determinant of the evolution of total capital stock, because the greater
part of it is private capital.
The break-down of total capital into public and private enables us to observe that the
second represents more than 80% of total capital, although as can be appreciated in column (6) it
has progressively lost importance, especially since the establishment of democracy in Spain
(1977) and the expansion of public services of the last twenty years.
The rapid rate of growth of public capital was accompanied by changes in its structure,
outstanding among them being the expansion of social infrastructures (education and health) and
urban ones, and the loss of relative importance of railways and water structures.
20
Private capital, though growing more slowly, did so at a rate that caused the
capital/labour ratio to be notably intensified (column 7) and allowed notable improvements in
productivity. Nevertheless, the serious problem of unemployment suffered by Spain poses the
question of whether in order to relieve it, it would be necessary to achieve even higher rates of
accumulation of private capital.
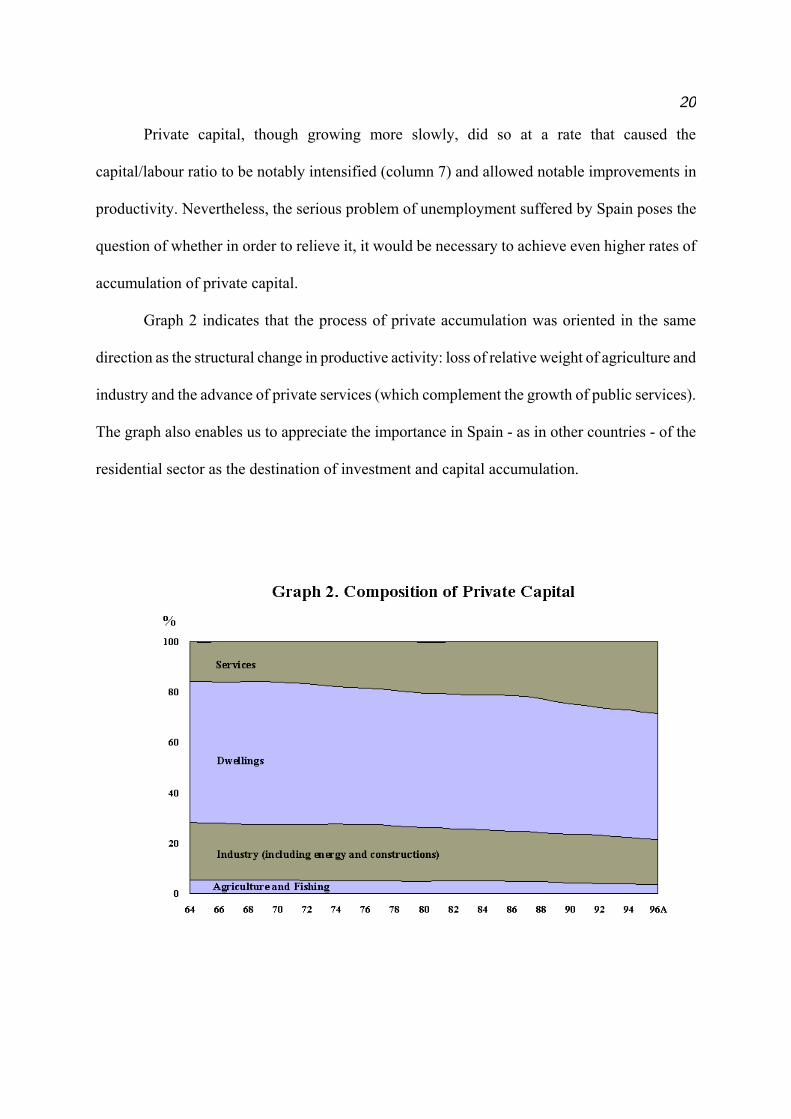
Graph 2 indicates that the process of private accumulation was oriented in the same
direction as the structural change in productive activity: loss of relative weight of agriculture and
industry and the advance of private services (which complement the growth of public services).
The graph also enables us to appreciate the importance in Spain - as in other countries - of the
residential sector as the destination of investment and capital accumulation.

21
IV. APPLICATIONS
The analysis of the capital series from different viewpoints has improved the knowledge
of the process of the growth of the economy of Spain and its regions. As examples of these
possibilities, we list below some of the results of studies already made on the basis of the
estimates mentioned.
a) The economic growth of Spain and its regions has practically all been due to the
contributions of two factors: the process of capitalisation and technical progress; on the other
hand the contribution of employment is close to zero (Mas, Maudos, Pérez and Uriel (1998)).
b) The improvements in efficiency were driven by the change in the productive structure
and the expansion in the endowments of infrastructures and human capital, both favoured by the
development of public policies (Pérez, Goerlich and Mas (1996), and Pérez and Serrano (1998)).
c) The endowments of public capital are shown to be of importance in explaining the
gains in productivity of the Spanish economy. This result, first found for the U.S. economy by
Aschauer (1989), is maintained irrespective of the area of analysis selected. Mas, Maudos, Pérez
and Uriel considered the industrial sector (1993) and the whole private sector of the economy
(1994a). In both it is found that public capital has a significant positive effect on labour
productivity. This result is maintained when the variable being studied is total factor productivity
(Mas, Maudos, Pérez and Uriel (1998)).
d) Breaking down public capital by functions, it can be seen that the infrastructures most
directly related to the productive process (roads, water infrastructures, urban structures and
ports) are those which positively affect productivity, the effect of infrastructures of a social
nature (education and health) being insignificant in practically all estimations (1994a and 1996).
22
e) The estimations of time series on which the above conclusions are based pose the
problem of overestimating the role of public capital when projecting into the future the
importance that they had in the past. The hypothesis that the positive effects of public capital are
greatest in the first stages of development, when the first parts of the network of infrastructures
are installed, is tested in Mas, Maudos, Pérez and Uriel (1996). The recursive estimation of the
elasticity of labour productivity with respect to productive public capital allows us to conclude
that it gradually decreases as the economy advances in development.
f) The network characteristic of many productive infrastructures makes the public capital
endowments of both a particular region and of its neighbours important in the explanation of
gains in productivity. The spillover effects of public capital are tested in Mas, Maudos, Pérez and
Uriel (1996).
g) The endowments of public capital have tended over time to become uniform from
region to region. Mas, Maudos, Pérez and Uriel (1994b) and Pérez, Goerlich and Mas (1996)
describe this process from two viewpoints: a) reduction of regional inequalities of endowment as
indicated by dispersion statistics, and b) higher growth rate of the capital stock of those regions
that initially started from most unfavourable positions. Conditioned convergence equations are
also estimated, enabling the testing of the positive effect of endowments of public capital on
convergence of per capita incomes of the Spanish regions, although this effect disappears as the
endowments become equalised among regions.
h) The effect of public capital on efficiency gains is analysed in Mas, Maudos, Pérez and
Uriel (1998), distinguishing between total factor productivity (Solow's residual) and a stricter
measurement of efficiency which discounts the effect of the use of public capital.

23
V. CONCLUSIONS
The statistical series of the endowments of capital stock of an economy constitute
information of great interest for the analysis of long run economic processes, the factors behind
economic growth, and advances in productivity, technical progress and efficiency. The public
and private capital stock series for the Spanish economy presented in this paper offer a wealth of
data with many possibilities of use, thanks to its territorial, functional and regional
disaggregation.
The number of analyses made since the publication of the series, both by the group who
drew them up and by many other researchers19, is indicative of their interest, and allow
appreciation of the decisive role that capital accumulation has played in the modernisation of the
Spanish economy in recent decades.

24
ACKNOWLEDGMENTS
This article represents a part of the results of the research carried out by the Valencian
Institute for Economic Research (IVIE) into capital endowments and regional development in
collaboration with the BBV Foundation, in the framework of the DGICYT's research program
SEC 98-0895. A summary of it appeared in the Appendix to Mas, Maudos, Pérez and Uriel
(1998).
25
NOTES
1. See, for example, the study by the Commercial University of Deusto (1968).
2. See Ward (1976), US Bureau of Economic Analysis (1993), Paccoud (1983) and OECD
(1993).
3. See Munnell (1992) for a description of the effects of public capital according to the level of
geographical disaggregation (national or state). For the Spanish case, the spillover effects
between regions have been analysed in Mas, Maudos, Pérez and Uriel (1996).
4. BBV Foundation - IVIE (1995), (1996) and (1998).
5. See http://www.bancoreg.fbbv.es.
6. Spain has a population of close to forty million inhabitants. Administratively it is divided into
seventeen regions, some of them enjoying a high level of autonomy, especially in expenditure
decisions. The regions are of very unequal size, in terms both of area and of population. Of the
seventeen regions, ten consist of more than one province, Andalucía and Castilla-León being the
biggest in area, with eight and nine provinces respectively. The seven remaining regions consist
of a single province, Madrid having the highest proportion of the population of this group.
7. For a detailed description of the methodologoy followed see Fundación BBV/IVIE (1996).
8. 1. Permanent inventory method; 2. Inventory of physical assets; and 3. Composite physical
indices. For the estimation of private capital the following procedures have also been used: 4.
Analysis based on accounting values; 5. Analysis of insured values; 6. Analysis of Stock
Exchange values; 7. Savings accumulation models; and 8. Capitalisation of income flows. See
Ward (1976).

26
9. The appropriateness of using capital stock series obtained by the permanent inventory
procedure in estimations of aggregate production functions has been questioned from several
viewpoints. See, for example, Miller, E. (1990).
10. A more detailed description can be found in Ward (1976).
11. In the latest publication of the OECD (1998), the data for the USA are expressed at constant
prices using chained quantity indices.
12. See Paccoud, T. (1983).
13. See Ward (1976), BEA (several years) and A.Munnell (1990).
14. In current statistical terminology they are called "density functions" instead of "frequency
curves".
15. In subsequent literature, although Winfrey's work has been quoted on numerous occasions,
the original source has hardly ever been used. Proof of this is the fact that, on various occasions
(e.g. in Paccoud (1983)), the Winfrey symmetrical curves have been presented as normal curves.
16.European System of Integrated Economic Accounts. This system is full consistent with the
System of National Accounts (SNA).
17. University of Deusto (1968).
18. See Ward (1976), Keese, Richardson and Salon (1991), OECD (1993).
19. For example, Cuadrado and García Greciano (1995), Villaverde and Pérez (1996), de Rus
(1996), Ezquiaga and Perelli (1998), Bean (1996), Pissarides and Wasmer (1996), Quah (1996),
Venables and Gasiorek (1996), González-Páramo, J.M. (1995), de la Fuente and Vives (1995).