Embed Size (px)
Citation preview
Estimation of the absolute surface air temperature of the Earth
P. D. Jones1,2 and C. Harpham1
Received 22 January 2013; revised 20 March 2013; accepted 22 March 2013; published 29 April 2013.
[1] Average temperatures for the hemispheres and the globe are generally expressed asanomalies from a base period. Most users of these data and the underlying constituent griddeddatasets do not require the values in absolute degrees, but a number of users might require thisadditional detail. An example group of users are climate modellers, who want to directlycompare their simulations with reality in absolute units. Reanalysis datasets offeropportunities of assessing earlier absolute temperature estimates, but until recently theirquality over data-sparse regions of the world was questionable. Here, we assess the latestReanalysis (ERA-Interim) which is available from 1979 to the present against earlier directestimates. Globally averaged ERA-Interim and the earlier direct estimates of absolute surfacetemperatures across the world are about 0.55�C different for the 1981–2010 period, withERA-Interim cooler. The difference is only 0.29�C for the Northern Hemisphere, but larger at0.81�C for the Southern Hemisphere. Spatially, the largest differences come from the PolarRegions, particularly the Antarctic.
Citation: Jones, P. D., and C. Harpham (2013), Estimation of the absolute surface air temperature of the Earth,J. Geophys. Res. Atmos., 118, 3213–3217, doi:10.1002/jgrd.50359.
1. Introduction
[2] Most analyses producing time series of global andhemispheric averages of surface air temperatures showresults relative to a base period such as 1961–1990 [e.g.,Jones et al., 2012 and Morice et al., 2012]. The base periodmay differ [e.g., the 1901–2000 used by Vose et al., 2012],but the key aspect is that the series are shown as anomalies.For use in climate monitoring, anomalies are perfectlyadequate, but a small number of users are interested in theabsolute temperature value for the base period even thoughthe addition of this constant doesn’t alter the characteristicsof the time series. Hence, although rarely used, themost widely quoted value for the global average for the1961–1990 period is 14.0�C developed by Jones et al.[1999], where the derivation is extensively discussed. Thisinvolved producing values for all 5� by 5� latitude/longitudegrid boxes. Over land areas, the absolute values relate to theaverage elevation of each grid box and also to how individ-ual Met Services calculate monthly averages, while for theocean, they relate to the absolute values of marine air tem-peratures. Spatial interpolation of the 1961–1990 averages(12 monthly fields) was undertaken, using elevation overland to infill all the missing grid boxes [see completediscussion in Jones et al., 1999]. Average values for the
hemispheres are 14.6�C for the Northern Hemisphere(NH) and 13.4�C for the Southern Hemisphere (SH). Thiswas not the first attempt to derive such a value from obser-vational data. Crutcher and Meserve [1970] and Taljaardet al. [1969] derived hemispheric averages from atlasesnominally based on earlier periods (~1931–1965). Theirresults for hemispheric averages were 14.9�C for the NHand 13.3�C for the SH. When combined, these give a valuefor the globe of 14.1�C. As the difference in the global aver-age time series between the two base periods is about 0.2�C(1961–1990 warmer than ~1931–1965), the differencebetween the two estimates (with Jones et al., 1999 cooler) is0.3�C (0.1�C+0.2�C). Assuming the 0.2�C time series offsetapplies equally to both hemispheres, it is surprising to notethat the two estimates differ more in the much bettersampled NH than the less sampled SH. The earlier workfrom 1969 and 1970 did not estimate errors, but Joneset al. (1999) estimated that their global value of 14�C shouldbe within 0.5�C of the true value.[3] Reanalyses offer possibilities for additional means of
estimating absolute surface air temperature averages for theNH, SH, and Globe. The second generation of these[NCEP/NCAR and ERA-40, Kistler et al., 2001 andUppala et al., 2005, respectively] had potentially seriousshortcomings in the estimation of surface temperatures inboth Polar Regions, especially the Antarctic. The latestreanalysis [ERA-Interim, Dee et al., 2011, the third gener-ation] is a considerable improvement in this regard, and thepurpose of this article is to compare the absolute surfacetemperature estimates with those from Jones et al. [1999].ERA-Interim learned a lot from ERA-40, particularly withrespect to the input satellite, radiosonde, and surfacedatasets used, and was chosen principally for this reason.Additionally, ERA-40 and later ERA-Interim have alreadybeen compared with earlier versions of the CRUTEM and
1Climatic Research Unit, School of Environmental Sciences, Universityof East Anglia, Norwich, UK.
2Center of Excellence for Climate Change Research / Department ofMeteorology, King Abdulaziz University, Jeddah, Saudi Arabia.
Corresponding author: P. D. Jones, Climatic Research Unit, School ofEnvironmental Sciences, University of East Anglia, Norwich, NR4 7TJ,UK. ([email protected])
©2013. American Geophysical Union. All Rights Reserved.2169-897X/13/10.1002/jgrd.50359
3213
JOURNAL OF GEOPHYSICAL RESEARCH: ATMOSPHERES, VOL. 118, 3213–3217, doi:10.1002/jgrd.50359, 2013
HadCRUT datasets [Simmons et al., 2004, 2010]. ERA-Interimis available from 1979 to the present, so we choose the baseperiod 1981–2010. For this period, ERA-Interim is complete.ERA-Interim is available on a grid resolution of approximately0.7� by 0.7� latitude/longitude, which was degraded to the 5�by 5� grid boxes used by Jones et al. [1999]. Section 2 dis-cusses issues with updating the Jones et al. [1999] absoluteanalysis to the 1981–2010 period. Section 3 compares thetwo climatologies and discusses the differences, particularlyin the context of the potential accuracy of ERA-Interim forthe 1981–2000 period. Section 4 presents some conclusions.
2. Analyses
[4] Jones et al. [1999] discuss the development of the1961–1990 climatology. Adjusting this to the more recentperiod (1981–2010) necessitates using time series data fromthe grid-box datasets of CRUTEM4 and HadCRUT4 [Joneset al., 2012 andMorice et al., 2012]. Neither CRUTEM4 norHadCRUT4 undertake any extrapolation of anomaly data toneighbouring unfilled grid boxes. Both datasets are at theirmost complete during the period from 1951 to 2010, butthey include missing areas, where there are no observations,which increase for earlier periods.[5] By definition the average of the 30 years for 1961–1990
should be zero, but some grid boxes are missing or incom-plete. Here we calculate averages for the two 30-yearperiods from HadCRUT4 and accept the offset of the two
periods if there are at least 20 years of data in each period.In the first step, these calculations are undertaken monthlyand result in adjustments for about 66% of the possible 5�by 5� grid boxes. In terms of the area, the grid boxes thatcannot be estimated are a much smaller percentage of thetotal surface area of the Earth, than the 34% (100–66) wouldimply. Most of the grid boxes where adjustments betweenthe two base periods cannot be undertaken are principallyin the Polar Regions (more so in the Antarctic than theArctic) and also some of the Southern Oceans. In laterdiscussion, the ~34% of grid boxes where adjustments ofbase periods using HadCRUT4 could not be accomplishedare referred to as AREAX. For the second step, estimateshave to be made for the AREAX areas. There are a numberof choices available to derive 1981–2010 averages fromthose for 1961–1990. The first two options are simply eitherretain the 1961–1990 average [i.e., Jones et al., 1999] orreplace the 1961–1990 with the value from ERA-Interimfor 1981–2010. We refer to these as Options 1 and 2.[6] A third option would be to interpolate the difference
field between the two 30-year periods to estimate valuesfor the AREAX areas where direct calculation was notpossible. Here, as the purpose of the exercise is to assesswhether ERA-Interim is useful, we just consider the firsttwo options. We present the results as annual time seriesin absolute degrees Celsius for the global average and forthe NH and SH. In all cases, the global average is the simpleaverage of the NH and SH.
Global (option 1)
Year1980 1984 1988 1992 1996 2000 2004 2008
12.0
13.0
14.0
15.0
16.0
HadCRUT4ERA−Interim
°C
Global (option 2)
Year1980 1984 1988 1992 1996 2000 2004 2008
HadCRUT4ERA−Interim
NH (option 1)
Year1980 1984 1988 1992 1996 2000 2004 2008
13.0
14.0
15.0
16.0
17.0
HadCRUT4ERA−Interim
°C
NH (option 2)
Year1980 1984 1988 1992 1996 2000 2004 2008
HadCRUT4ERA−Interim
SH (option 1)
Year1980 1984 1988 1992 1996 2000 2004 2008
11.0
12.0
13.0
14.0
15.0
12.0
13.0
14.0
15.0
16.0
13.0
14.0
15.0
16.0
17.0
11.0
12.0
13.0
14.0
15.0
HadCRUT4ERA−Interim
°C
SH (option 2)
Year1980 1984 1988 1992 1996 2000 2004 2008
HadCRUT4ERA−Interim
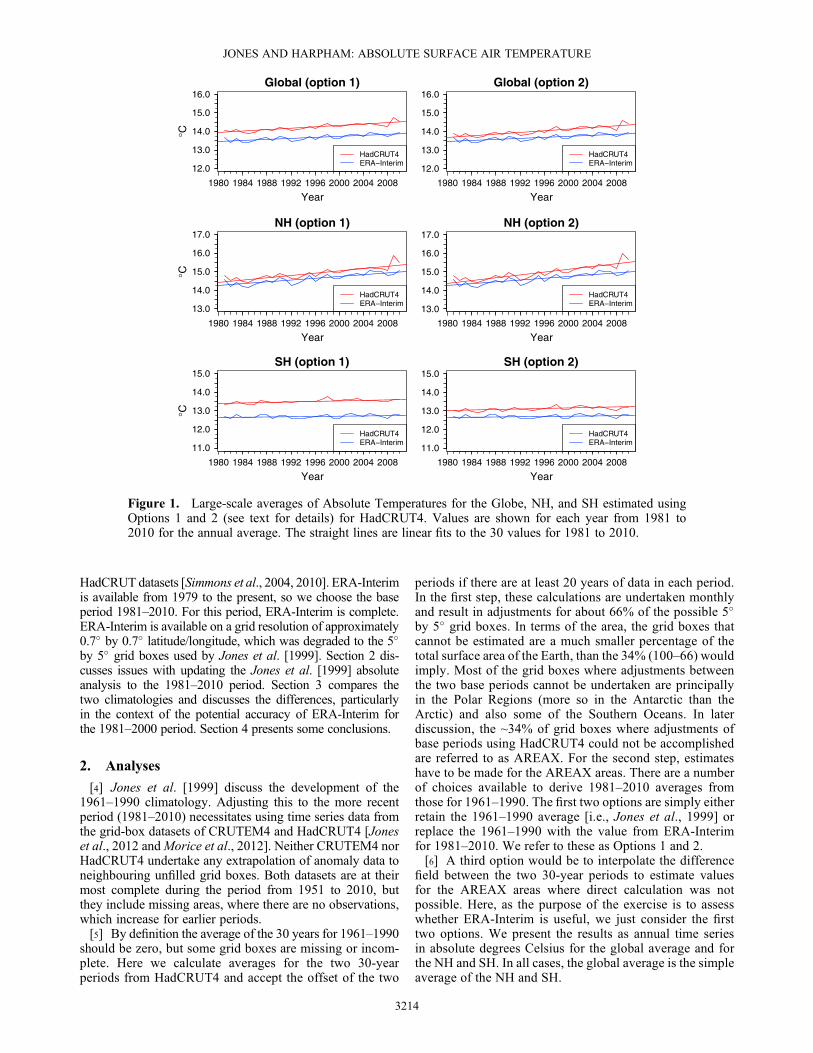
Figure 1. Large-scale averages of Absolute Temperatures for the Globe, NH, and SH estimated usingOptions 1 and 2 (see text for details) for HadCRUT4. Values are shown for each year from 1981 to2010 for the annual average. The straight lines are linear fits to the 30 values for 1981 to 2010.
JONES AND HARPHAM: ABSOLUTE SURFACE AIR TEMPERATURE
3214
3. Results[7] In all the subsequent time series plots, hemispheric
averages for HadCRUT4 and ERA-Interim are calculated asarea-weighted values of all the 5� by 5� grid boxes in absolutedegrees. For HadCRUT4, this involves adding the anomalyvalue for that month (and hence seasons and the year) to the
absolute value using either Option 1 or 2. For grid boxeswith missing anomaly values, this means assuming theanomaly value is zero for that month (i.e., using the appro-priate 30-year average). For the complete ERA-Interim,the averaging is straightforward. For both datasets, globalaverages are the averages of the hemispheric values.
MAM (option 1)
180 90W 0 60E 150E 180 90W 0 60E 150E
180 90W 0 60E 150E 180 90W 0 60E 150E
180 90W 0 60E 150E 180 90W 0 60E 150E
180 90W 0 60E 150E 180 90W 0 60E 150E
180 90W 0 60E 150E 180 90W 0 60E 150E
90S
60S
30S
0
30N
60N
90NMAM (option 2)
−20
−10
0
10
20
Diff
eren
ce in
Deg
C
JJA (option 1)
90S
60S
30S
0
30N
60N
90NJJA (option 2)
−20
−10
0
10
20
Diff
eren
ce in
Deg
C
SON (option 1)
90S
60S
30S
0
30N
60N
90NSON (option 2)
−20
−10
0
10
20
Diff
eren
ce in
Deg
C
DJF (option 1)
90S
60S
30S
0
30N
60N
90NDJF (option 2)
−20
−10
0
10
20
Diff
eren
ce in
Deg
C
Annual (option 1)
90S
60S
30S
0
30N
60N
90NAnnual (option 2)
−20
−10
0
10
20
Diff
eren
ce in
Deg
C
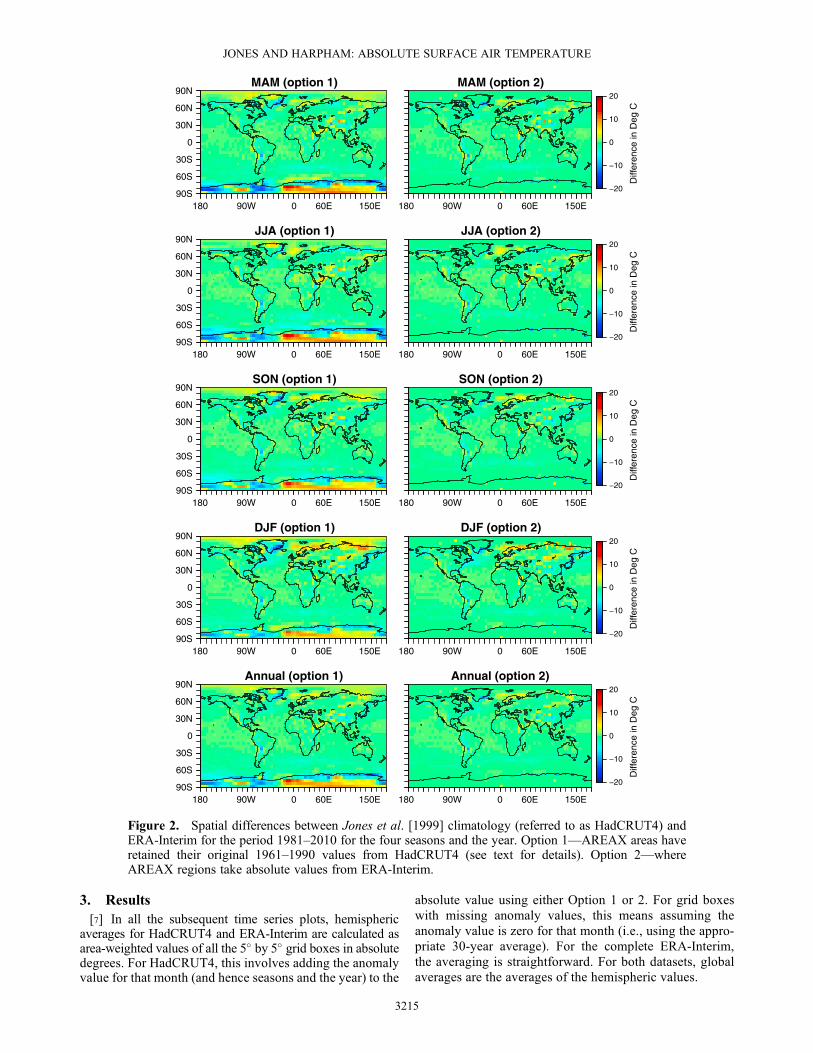
Figure 2. Spatial differences between Jones et al. [1999] climatology (referred to as HadCRUT4) andERA-Interim for the period 1981–2010 for the four seasons and the year. Option 1—AREAX areas haveretained their original 1961–1990 values from HadCRUT4 (see text for details). Option 2—whereAREAX regions take absolute values from ERA-Interim.
JONES AND HARPHAM: ABSOLUTE SURFACE AIR TEMPERATURE
3215
[8] Figure 1 shows annual averages for the NH, SH, andGlobe for each year from 1981 to 2010 in absolute degreesCelsius for both options. The left side shows the results ofcalculating annual averages for the NH, SH, and Globe foreach year from 1981 to 2010 using Option 1 (i.e., assumingall areas in the 1961–1990 climatology that cannot be esti-mated from HadCRUT4 using the 1981–2010 period—i.e.,the AREAX areas, retain their 1961–1990 absolute value).
The right side of Figure 1 shows similar series for Option 2where AREAX areas take the 1981–2010 absolute valuesfrom ERA-Interim. In both series of plots, the absolute valuesfor each year refer to 1981–2010, and for ERA-Interim (theblue lines) values are the same in both figures. There is littledifference at these scales between the two red series in bothplots, but Option 1 values tend to be slightly warmer thanOption 2 for the series referred to as HadCRUT4. The differ-ences are larger in the SH, and as will be shown in the nextplots of spatial differences most of these differences comefrom the Antarctic.[9] Figure 2 shows maps of the differences (for the 30-year
average based on 1981–2010) between ERA-Interim andHadCRUT4 for Options 1 and 2, for the four seasons and forthe year. For Option 1, differences between ERA-Interimand HadCRUT4 are larger and principally occur for AREAXareas so over the Antarctic and to a lesser extent over partsof Greenland. Over the Antarctic, the differences are posi-tive over the higher elevation areas of the continent andnegative around the coastal areas. The differences areslightly larger in MAM and JJA than in SON and DJF.Warmer ERA-Interim values during the northern winter(DJF) are evident over Northern Eurasia. For Option 2where ERA-Interim absolute values have been used forAREAX areas, the differences are zero. For the remaining66% of grid boxes, differences tend to occur at isolated gridboxes over the land areas or in regions around coastlinesespecially in higher northern latitudes. Sometimes the dif-ferences are seasonally specific (particularly in the northernwinter, DJF, in northern Eurasia), but more often they areconsistent between the seasons. The land differences aresuggestive of possible differences in elevation (particularlyover the Himalayas and the Andes) or due to differencesbetween the surface (land, sea or ice) evident in Joneset al. [1999] and used by ERA-Interim. Over the Antarctic,the differences that do occur are at the locations of all thestations in the CRUTEM4 dataset over continental Antarc-tica. ERA-Interim is cooler for the coastal sites and warmerfor the two inland sites.
MAM (option 1)
HadCRUT4 (°C)
ER
A−
inte
rim (
°C)
ER
A−
inte
rim (
°C)
ER
A−
inte
rim (
°C)
ER
A−
inte
rim (
°C)
ER
A−
inte
rim (
°C)
−60 −20 0 20 40 −60 −20 0 20 40
−60 −20 0 20 40 −60 −20 0 20 40
−60 −20 0 20 40 −60 −20 0 20 40
−60 −20 0 20 40 −60 −20 0 20 40
−60 −20 0 20 40 −60 −20 0 20 40
−60
−40
−20
0
20
40
60N−90N20N−60N20S−20N20S−60S60S−90S
MAM (option 2)
HadCRUT4 (°C)
HadCRUT4 (°C) HadCRUT4 (°C)
HadCRUT4 (°C) HadCRUT4 (°C)
HadCRUT4 (°C) HadCRUT4 (°C)
HadCRUT4 (°C) HadCRUT4 (°C)
−60
−40
−20
0
20
40
60N−90N20N−60N20S−20N20S−60S60S−90S
JJA (option 1)
−60
−40
−20
0
20
40
60N−90N20N−60N20S−20N20S−60S60S−90S
JJA (option 2)
−60
−40
−20
0
20
40
60N−90N20N−60N20S−20N20S−60S60S−90S
SON (option 1)
−60
−40
−20
0
20
40
60N−90N20N−60N20S−20N20S−60S60S−90S
SON (option 2)
−60
−40
−20
0
20
40
60N−90N20N−60N20S−20N20S−60S60S−90S
DJF (option 1)
−60
−40
−20
0
20
40
60N−90N20N−60N20S−20N20S−60S60S−90S
DJF (option 2)
−60
−40
−20
0
20
40
60N−90N20N−60N20S−20N20S−60S60S−90S
ANN (option 1)
−60
−40
−20
0
20
40
60N−90N20N−60N20S−20N20S−60S60S−90S
ANN (option 2)
−60
−40
−20
0
20
40
60N−90N20N−60N20S−20N20S−60S60S−90S
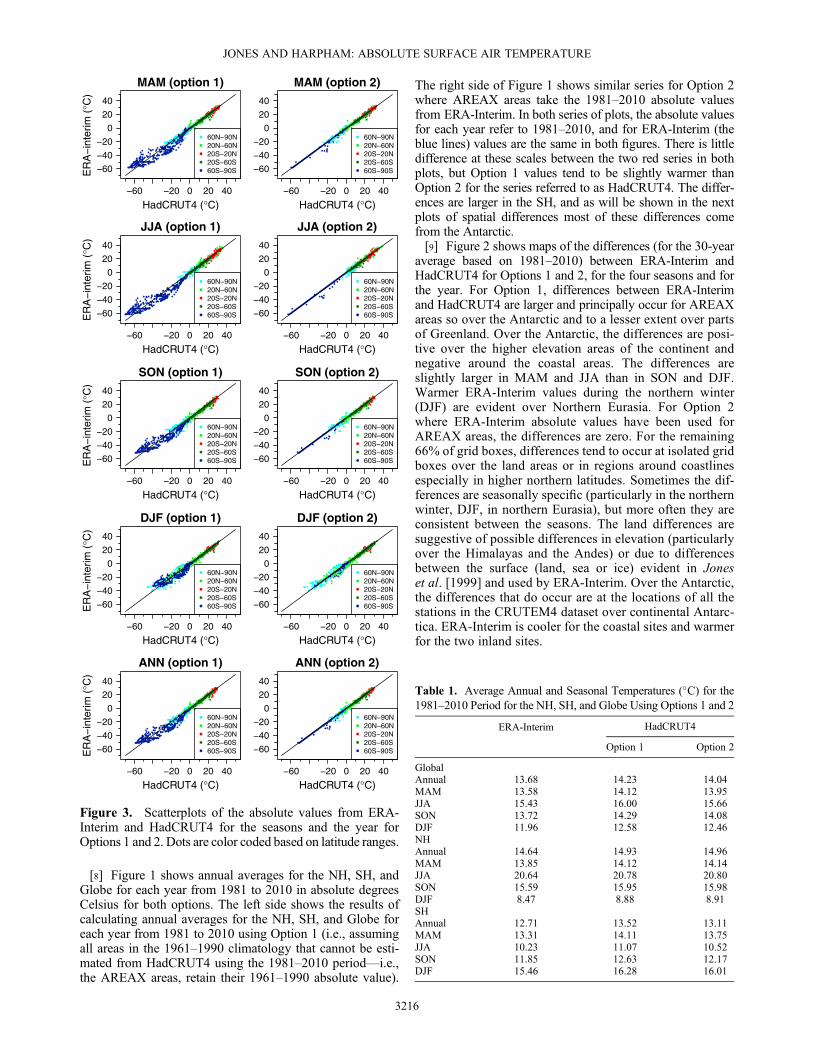
Figure 3. Scatterplots of the absolute values from ERA-Interim and HadCRUT4 for the seasons and the year forOptions 1 and 2. Dots are color coded based on latitude ranges.
Table 1. Average Annual and Seasonal Temperatures (�C) for the1981–2010 Period for the NH, SH, and Globe Using Options 1 and 2
ERA-Interim HadCRUT4
Option 1 Option 2
GlobalAnnual 13.68 14.23 14.04MAM 13.58 14.12 13.95JJA 15.43 16.00 15.66SON 13.72 14.29 14.08DJF 11.96 12.58 12.46NHAnnual 14.64 14.93 14.96MAM 13.85 14.12 14.14JJA 20.64 20.78 20.80SON 15.59 15.95 15.98DJF 8.47 8.88 8.91SHAnnual 12.71 13.52 13.11MAM 13.31 14.11 13.75JJA 10.23 11.07 10.52SON 11.85 12.63 12.17DJF 15.46 16.28 16.01
JONES AND HARPHAM: ABSOLUTE SURFACE AIR TEMPERATURE
3216
[10] Figure 3 shows scatterplots of the absolute tempera-tures by season and year, color coded by latitude band.These plots are another way of plotting the absolute differ-ences between the two climatologies. For Option 1, thescatterplots show that the largest differences occur for thehigher latitudes of the SH (60–90�S). The line of pointswith little difference in their very cold temperatures forERA-Interim values (particularly in JJA) is due toHadCRUT4 having much larger spatial differences for thegrid boxes in the 85–90�S zone. The least differences forOption 1 occur for DJF (summer season in the SH). ForOption 2, where ERA-Interim has been assumed for theAREAX areas, the largest differences are for the DJF season.In this case, though, the areas showing the greatest differencesare in the higher latitudes of the NH. The differences in thehigher latitudes of the SH occur at the locations of the Antarc-tic station locations. The two dots left of the diagonal are forthe South Pole and Vostok station, whilst those on the rightare the coastal stations of East Antarctica.[11] Table 1 gives the hemispheric and global averages for
both datasets and Options 1 and 2 by seasons and the annualaverage. Option 1 for HadCRUT4 results in warmer temper-atures for the SH compared to Option 2, but there is little dif-ference for the NH. For Option 1, this SH difference comesprincipally from the cooler ERA-Interim over parts of Antarc-tica, countered to some extent by warmer ERA-Interim valuesin central parts of the continent. AssumingOption 1, the globalaverage is 0.55�C warmer for HadCRUT4 compared to ERA-Interim. This is made up from 0.29�C for the NH and 0.81�Cfor the SH. For the NH, the difference is larger in the wintercompared to the summer season, but there is little seasonalcontrast for the SH. The accuracy of the surface temperaturefield is not specifically addressed by Dee et al. [2011] but acold bias in the background field in the troposphere is noted.Based on an analysis of the typical temperature “increments”from the background forecast [see discussion in Simmonset al., 2004] due to the land temperature observations (oftenreferred to as SYNOP data) assimilated every 6 h, there is anoverall global cold bias of ERA-Interim of between 0.2 and0.3�C (A. J. Simmons, personal communication, 2013). Thiscold bias, which can be considered as the effect of the tem-perature observations on the model [Simmons et al., 2004],is a global average that masks spatial and seasonal variationsof up to�1.5�C, which when averaged are larger in the SHcompared to the NH. If we take this cold bias to be 0.25�C,the global difference in the climatologies is ~0.3�C.
4. Conclusions
[12] In this paper, we have discussed the issue of the abso-lute surface temperature of the Earth. The difference betweenthe value developed for 1961–1990 by Jones et al. [1999]and that from ERA-Interim are within 0.55�C, a value that ismarginally larger than the 0.5�C uncertainty estimate givenby Jones et al. [1999] for their climatology. The two are easily
within the uncertainty estimate if the 0.2–0.3�C cold bias inERA-Interim is acknowledged. The absolute surface tempera-ture of the world is likely to be between 13.7 and 14.0�C forthe 1961–1990 period and 13.9 and 14.2�C for 1981–2010.The spatial detail reveals that most of this difference comesfrom Antarctica and to a lesser extent Greenland and theimmediate coastal areas around these two landmasses. Thereare also large differences along the coastlines of northernEurasia particularly in DJF. These differences are suggestiveof issues over the two landmasses and their adjacent sea-iceareas, which for large parts of Antarctica makes ERA-Interim up to 10�C cooler. High-elevation areas of Antarcticaare much warmer (5–6�C) than the two sites with long records.ERA-Interim, therefore, has markedly reduced temperaturegradients between the interior and coastal sites than evidentat the limited number of sites in eastern Antarctica.
[13] Acknowledgments. This work has been supported by the USDoE(Grant DE-SC0005689). The authors thank the reviewers, especially RussVose. The ERA-Interim data was downloaded from the BADC and ECMWFwebsites and the paper benefitted from discussions with Adrian Simmons andDick Dee.
ReferencesCrutcher, H. L., and J. M. Meserve (1970), Selected-level heights, temper-atures and dew point temperatures for the Northern Hemisphere, NAVAIR50-1C-52 rev., U.S. Navy, Chief Naval Operations, Washington, D. C., 17pp. plus charts, 11 pp. 1 18 figs., 144 charts.
Dee, D. P., et al. (2011), The ERA-Interim reanalysis: configuration andperformance of the data assimilation system, Q.J.R. Meteorol. Soc.,137, 553–597, doi:10.1002/qj.828.
Jones, P. D., M. New, D. E. Parker, S. Martin, and I. G. Rigor (1999),Surface air temperature and its variations over the last 150 years, Rev.Geophys., 37, 173–199.
Jones, P. D., D. H. Lister, T. J. Osborn, C. Harpham, M. Salmon, andC. P. Morice (2012), Hemispheric and large-scale land surface air temper-ature variations: An extensive revision and an update to 2010, J. Geophys.Res., 117, D05127, doi:10.1029/2011JD017139.
Kistler R., et al. (2001), The NCEP–NCAR 50-year reanalysis: Monthlymeans CD-ROM and documentation, Bull. Am. Meteorol. Soc., 82,247–267.
Morice, C. P., J. J. Kennedy, N. A. Rayner, and P. D. Jones (2012),Quantifying uncertainties in global and regional temperature change usingan ensemble of observational estimates: the HadCRUT4 dataset,J. Geophys. Res., 117, D08101, doi:10.1029/2011JD017187.
Simmons, A. J., P. D. da Jones, V. Costa Bechtold, A. C. M. Beljaars, P. W.Kållberg, S. Saarinen, S. M. Uppala, P. Viterbo, and N. Wedi, (2004),Comparison of trends and low-frequency variability in CRU, ERA-40and NCEP/NCAR analyses of surface air temperature, J. Geophys. Res.,109, D24115, doi:10.1029/2004JD006306.
Simmons, A. J., K. M. Willett, P. D. Jones, P. W. Thorne, and D. Dee(2010), Low-frequency variations in surface atmospheric humidity,temperature and precipitation: Inferences from reanalyses and monthlygridded observational datasets, J. Geophys. Res. 115, D01110, doi:10.1029/2009JD012442.
Taljaard, J. J., H. van Loon, H. C. Crutcher, and R. L. Jenne, (1969),Climate of the Upper Air, Southern Hemisphere, vol. I, Temperatures,Dew Points and Heights at Selected Pressure Levels, NAVAIR 50-1C-55, 135 pp., Chief Nav. Operations, Washington, D.C.
Uppala S. M., et al. (2005). The ERA-40 re-analysis, Q. J. R. Meteorol.Soc., 131, 2961–3012, doi:10.1256/qj.04.176.
Vose, R. S., et al. (2012), NOAA’s merged land-ocean surface temperatureanalysis, Bull. Am. Meteorol. Soc. 93, 1677–1685, doi:10.1175/BAMS-D-11-00241.1.
JONES AND HARPHAM: ABSOLUTE SURFACE AIR TEMPERATURE
3217