Embed Size (px)
Citation preview
COPYRIGHT
FOUNTAIN
HEAD PRESS
Estimation of Absolute Zero Objective: To determine the difference between the absolute (Kelvin) temperature scale and
the Celsius scale, and obtain an estimate of absolute zero Equipment: 125-mL Erlenmeyer flask assembly with stopper and pinch clamp; 600-mL
beaker; Bunsen burner; ring stand with iron ring and clamp; wire-gauze pad; pan or trough filled with water; thermometer
Safety: Wear safety goggles at all times when working at the lab bench. Waste: None INTRODUCTION The measurement of temperature uses scales that are based on arbitrary, empirical reference points. The Fahrenheit scale, created in 1724, established the reference point of 0.0oF as the temperature of a brine solution consisting of water, ice, and ammonium chloride. The second reference point was the freezing point of pure water, which was determined to be 32oF. After additional refinements by other scientists, the boiling point of water was determined to be about 1800 higher than the freezing point, or 212oF. The Celsius (or centigrade) scale was developed by the Swedish astronomer Anders Celsius in 1744. The first reference point was the freezing point of water, which was set as 0.0oC; the second reference point of 100oC coincided with the boiling point of pure water. The advantage of this scale is that the reference points are conveniently set exactly 100 degrees apart. The need for an absolute temperature scale was recognized by William Thomson (also known as Lord Kelvin), who established the Kelvin scale in 1848 using an “air-thermometer” based on the thermal expansion of atmospheric gases. Lord Kelvin determined that absolute zero coincide with 0.273oC, and proposed that a temperature change of 1.0oC was equal to a change of 1.0 degree on the Kelvin scale (or 1.0 Kelvin—the term degree is not applied to temperatures on the Kelvin scale). The relationship between these two temperature scales in shown in Equation (1). K = oC + 273 (1) The concept of absolute temperature is critical in many areas of chemistry. The third law of thermodynamics, for example, states that the entropy of a pure, crystalline solid at 0 Kelvin is equal to zero. The gas laws also relate the properties of gases to absolute temperature. Charles’s Law, for example, states that the volume of a gas is directly proportional to absolute temperature.
COPYRIGHT
FOUNTAIN
HEAD PRESS
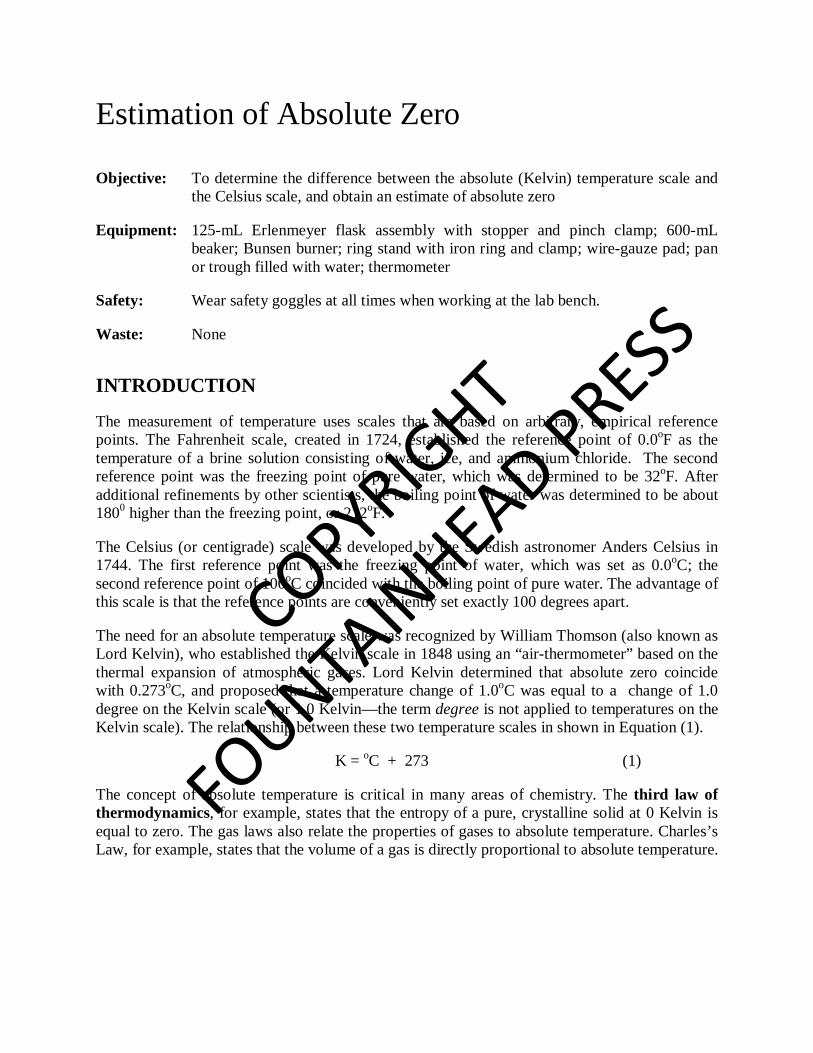
The behavior of ideal gases is explained by the following postulates of the kinetic molecular theory:
1. Most of the volume occupied by a sample of gas is empty space; the volume occupied by the atoms or molecules is essentially negligible.
2. Atoms or molecules in the gas phase do not interact with each other due to the large distances between them.
3. The kinetic energy of a gas sample is directly proportional to absolute temperature. One consequence of this is that the volume occupied by a gas sample will decrease as temperature decreases at constant pressure.
Postulates 1 and 3 provide a basis for estimating the value of absolute zero. Combining these two postulates, the volume occupied by the gas should approach a value of zero as the temperature approaches absolute zero. At absolute zero the kinetic energy of the atoms or molecules is zero and they occupy no volume. For an ideal gas, a plot of volume vs. temperature should allow us to extrapolate to zero volume to estimate absolute zero. Air, which consists primarily of N2 and O2, behaves as an ideal gas under most conditions. Some gases, such as water vapor, do not behave ideally. Significant interactions between the molecules in the gas phase result in non-linear behavior, and a volume slightly less than that of an ideal gas under similar conditions. In this lab, we will use the concept of an air-thermometer to verify the relationship between the Celsius and Kelvin scales illustrated in Eq. (1). Starting with the ideal gas law, we can rearrange to obtain a relationship between volume and temperature as:
𝑉𝑉 = 𝑛𝑛𝑛𝑛𝑛𝑛𝑃𝑃
= �𝑛𝑛𝑛𝑛𝑃𝑃� 𝑇𝑇 (2)
Assuming a constant number of moles at constant pressure, Eq. (2) reduces to V = k T (3) where k is a constant and T is the temperature in Kelvin. If we can measure the volume occupied by the gas at two different temperatures, then we can set up a ratio between the two measurements as indicated in Equation (4).
𝑉𝑉1𝑉𝑉2
= (𝑘𝑘𝑇𝑇1)(𝑘𝑘𝑇𝑇2) (4)
The constants will cancel. If we let Y equal the constant in Eq. (1), we can rewrite Eq. (1) as T (K) = t (oC) + Y (5) and we can rewrite Eq. (4) as:
𝑉𝑉1𝑉𝑉2
= (𝑡𝑡1 + 𝑌𝑌)(𝑡𝑡2 + 𝑌𝑌) (6)

COPYRIGHT
FOUNTAIN
HEAD PRESS
If V1, V2, t1, and t2 are all known by experimental measurement, this equation can be solved algebraically to determine the value of Y. Using our air-thermometer, we can measure the volume of air accurately by replacing it with an equal volume of water and measuring the mass of water. From the mass and density of water we can determine volume. The volume occupied by the gas will be determined at two different temperatures: Thigh, which equals the boiling point of water (100oC), and Tlow, which is approximately room temperature(~20o). Using the volume-temperature relationship in Eq. (6) we can estimate the value of Y. Alternatively, we can perform a graphical analysis in which we plot volumes vs. temperature (in oC) and extrapolate to zero volume. The point at which the line intersects the x-axis represents the difference between 0.0 oC and absolute zero on the Kelvin scale.

COPYRIGHT
FOUNTAIN
HEAD PRESS
Pre-Lab Questions
1. List two assumptions of the kinetic molecular theory cited in this lab exercise, and how they are relevant to the estimation of absolute zero.
2. A student performed this experiment and collected the following data: Vhigh at Thigh (100.0 oC) = 262 mL Vlow at Tlow (22.4 oC) = 201 mL
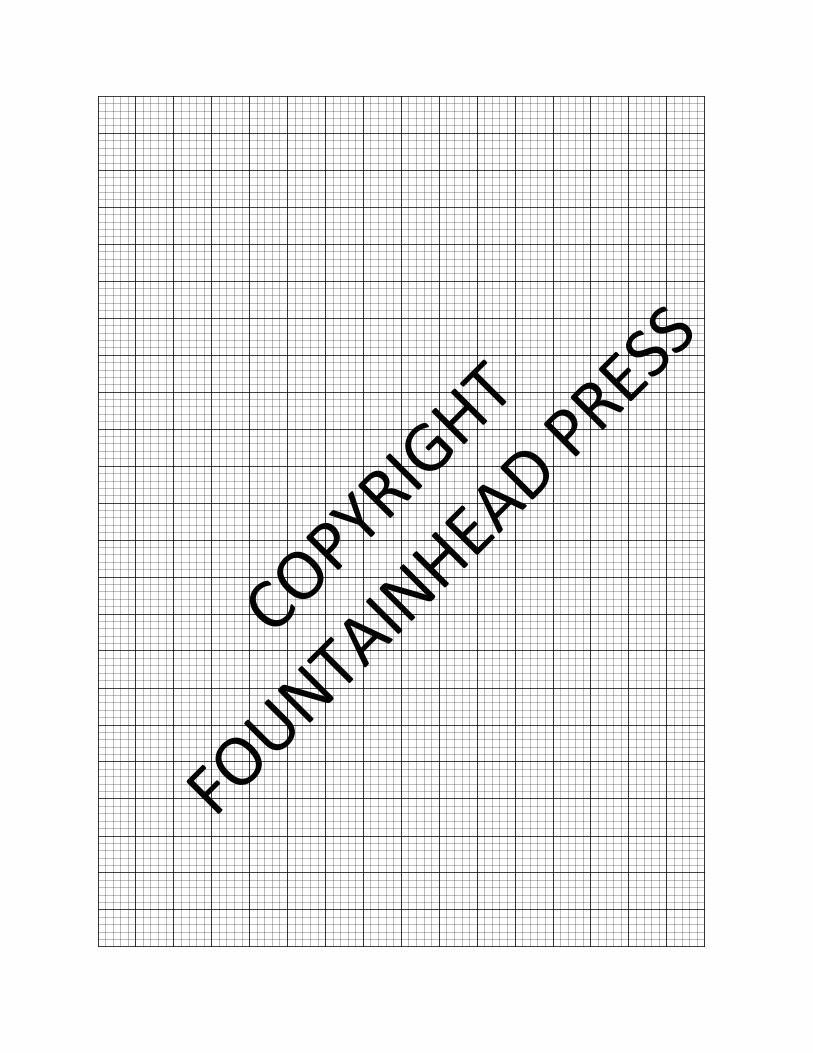
a) Plot volume on the ordinate (y-axis) vs. temperature on the abscissa (x-axis). Draw a line connecting the points, and extrapolate this line to where it intersects the x-axis.
Y = ____________ oC
b) Calculate the percent error between the experimentally determined value of Y and the accepted value of absolute zero, ˗273 oC.
% error = ___________%
3. Extrapolation using more than two data points can decrease the error in the estimated value.
How could you modify the procedure to obtain a reliable third data point, e.g., volume at a third temperature?

COPYRIGHT
FOUNTAIN
HEAD PRESS

COPYRIGHT
FOUNTAIN
HEAD PRESS
PROCEDURE 1. Obtain the necessary stopper/tubing assembly from the lab cart and assemble the
Erlenmeyer flask apparatus as illustrated in Figure 1. Ensure that the tubing connections are tight and will not leak. Have your TA check the apparatus before continuing.
2. Weigh the flask assembly (Erlenmeyer+stopper+tubing+pinch clamp) to the nearest 0.1 g,
and record this mass on line 4 on your Data Sheet. 3. Fill the 600-mL beaker with about 300 mL
of tap water, and place it on the wire gauze pad/ring stand as indicated in Figure 1. Lower the flask assembly into the beaker until the water level in the beaker is even with the bottom of the stopper in the neck of the flask. Make sure that the flask is not making contact with the bottom or sides of the beaker. Clamp the flask securely in this position as indicated in Figure 1.
4. Open the pinch clamp on the tubing so that
the tubing is open, but the pinch clamp is still securely attached to the tubing. Heat the water in the beaker until it boils, and continue boiling for 5 minutes.
Figure 1. Air-Thermometer apparatus 5. Measure the temperature of the boiling water in your beaker, and record this temperature as
Thigh on line 1 on your Data Sheet. 6. Keep the water boiling while you close the pinch clamp on the tubing. Tighten the
extension clamp holding the rubber stopper assembly, and use this clamp as a handle to move the flask assembly. Remove the flask assembly from the beaker and submerge it in the pan or trough containing cold tap water.
7. With the flask neck and tubing submerged under the surface of the water, carefully open
the pinch clamp. Water will flow into the flask as the air in the flask contracts as it cools. Be sure to keep the flask and tubing submerged during this entire process!

COPYRIGHT
FOUNTAIN
HEAD PRESS
8. While holding the flask and tubing under water, allow the flask to cool for 10 minutes. You can also run cold tap water over the flask to cool it more quickly, but be sure to keep the flask and tubing submerged under water.
9. While keeping the flask submerged, adjust the level of the flask in the trough so that the water level inside the flask matches the water level outside the flask (i.e., in the trough), as illustrated in Figure 2. This step ensures that the pressure inside and outside the flask are equal. When the water levels are equal, close the pinch clamp tightly and remove the flask assembly from the trough. Measure the temperature of the water in the trough, and record this value on line 2 on your Data Sheet as Tlow.
Figure 2. Procedure to equalize pressure in the air thermometer apparatus
10. With the flask assembly upright on the bench top, remove any water in the plastic tubing above the pinch clamp using a paper towel or cotton swab. Then open the pinch clamp and allow any water in the tubing to drain into the flask. Remove the extension clamp, dry the flask assembly with a towel, and reweigh the assembly. Record the mass on line 6 on your Data Sheet. Calculate the mass of water that was sucked into the flask assembly by difference, and record this mass on line 7 on your Data Sheet.
11. Using a piece of tape or a marker, mark the level of the bottom of the stopper on the neck of the flask assembly. Remove the stoppers and fill the flask to the brim with tap water. Open the pinch clamp slightly and re-insert the stoppers, pushing them down until the bottom of the stopper assembly aligns with the marker or tape on the neck of the flask. This process will cause some water to fill the tubing in the stopper assembly. If the level of water in the tubing is below the position of the pinch clamp, add water to the tubing. Once the level of water in the tubing is above the level of the pinch clamp, tighten the clamp and remove any excess water. The volume of water in the flask assembly is now the same as the volume of air in the original sample. Reweigh the water-filled flask assembly and record your mass on line 3 on the Data Sheet. Again, calculate the mass of water in the filled flask by difference. Record this mass on line 5 on your Data Sheet. (Note: the volume of water in the flask will not be the same as the nominal volume printed on the flask.)
12. Perform the required calculations for Trial #1. Record your results and plot your data as instructed. Report your results to your TA before continuing.
COPYRIGHT
FOUNTAIN
HEAD PRESS
13. Repeat the experiment with a second clean, dry Erlenmeyer flask. It is important that you use a different flask for the second attempt, since it will be difficult to remove all the water vapor from the previous flask. The presence of water vapor would contribute to the partial pressure in the flask and affect your results.
14. If time permits, perform a third trial.
CALCULATIONS
Perform the following calculations for each trial, and record your results on the Data Sheet in the appropriate spaces.
1. Calculate the volume of water drawn into the flask for each trial using Equation (7).
Volume (mL) = mass H2O (g) x density of water (g/mL) (7)
The mass of water drawn into the flask was calculated by difference, and is found on line 7 on the Data Sheet. The density of water can be assumed to be 1.00 g/mL (3 significant. figures.) for the water temperatures typically encountered in this exercise.
2. In a similar fashion, calculate the volume of water required to completely fill the flask and stopper assembly, using the mass of water from line 5 of the Data Sheet. This volume equals the volume of air in the flask assembly at the high temperature. Record this on the Data Sheet as Vhigh.
3. The volume of air in the flask at the low temperature (Tlow) can be found as the difference between Vhigh and the volume of water drawn into the flask at Tlow. Record this volume on your Data Sheet as Vlow.
4. Using Eq. (6), calculate the value of Y algebraically. Record this value on line 8 on the Data Sheet.
5. Prepare a plot of Volume vs. T (oC). To ensure that you have enough room to extrapolate your plot, rotate your graph paper 90o so that the x-axis is on the longer side of the graph. Allow enough room to the right of the origin (x = 0) to plot volumes at both Thigh and Tlow, and enough room on the left of the origin to extrapolate your plot to where it intersects the x-axis.
6. Plot your Vhigh and Vlow values on the graph paper, and extrapolate the line to where it intersects the x-axis. Determine the temperature (in 0C) at the point of intercept. Record this temperature as Y on line 10 on your Data Sheet.
COPYRIGHT
FOUNTAIN
HEAD PRESS
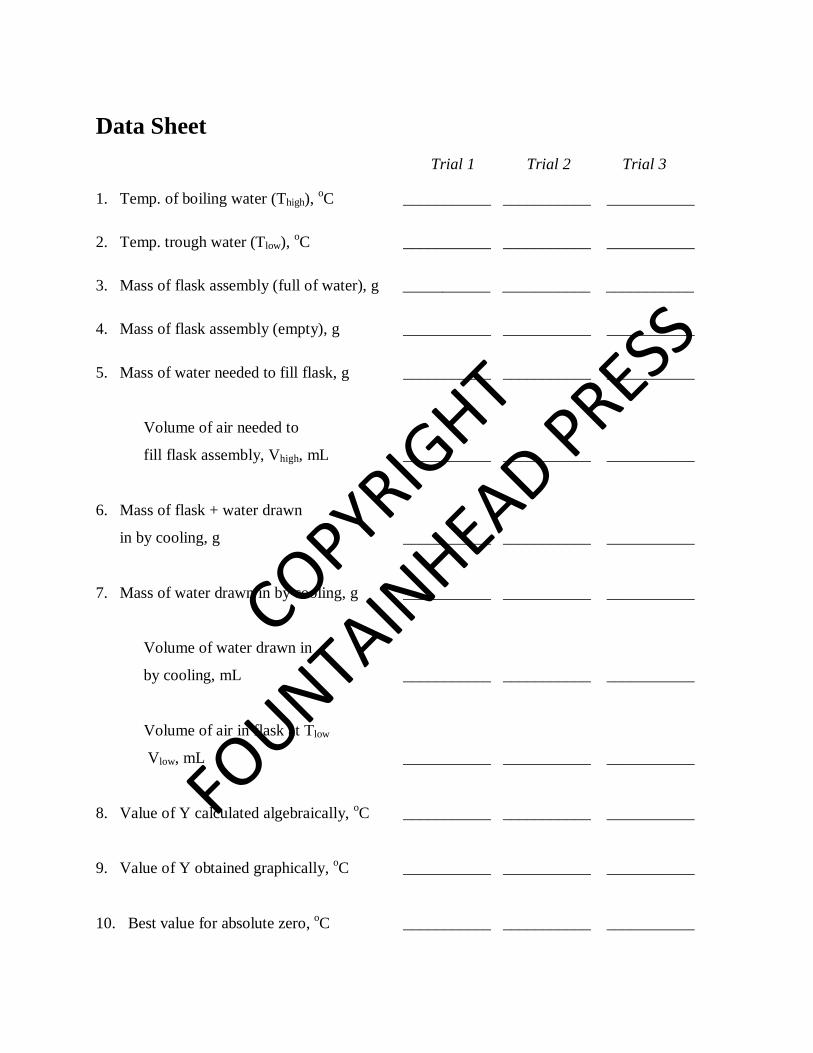
Data Sheet
Trial 1 Trial 2 Trial 3
1. Temp. of boiling water (Thigh), oC ___________ ___________ ___________
2. Temp. trough water (Tlow), oC ___________ ___________ ___________
3. Mass of flask assembly (full of water), g ___________ ___________ ___________
4. Mass of flask assembly (empty), g ___________ ___________ ___________
5. Mass of water needed to fill flask, g ___________ ___________ ___________
Volume of air needed to
fill flask assembly, Vhigh, mL ___________ ___________ ___________
6. Mass of flask + water drawn
in by cooling, g ___________ ___________ ___________
7. Mass of water drawn in by cooling, g ___________ ___________ ___________
Volume of water drawn in
by cooling, mL ___________ ___________ ___________
Volume of air in flask at Tlow
Vlow, mL ___________ ___________ ___________
8. Value of Y calculated algebraically, oC ___________ ___________ ___________
9. Value of Y obtained graphically, oC ___________ ___________ ___________
10. Best value for absolute zero, oC ___________ ___________ ___________
COPYRIGHT
FOUNTAIN
HEAD PRESS
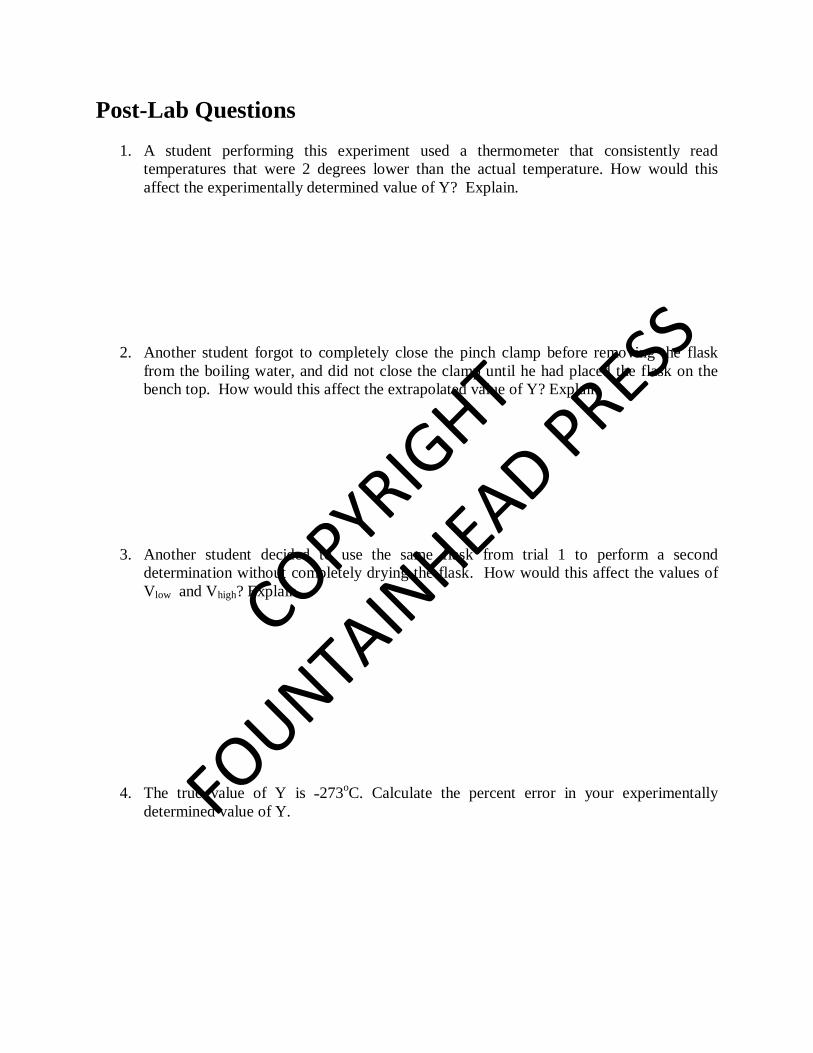
Post-Lab Questions 1. A student performing this experiment used a thermometer that consistently read
temperatures that were 2 degrees lower than the actual temperature. How would this affect the experimentally determined value of Y? Explain.
2. Another student forgot to completely close the pinch clamp before removing the flask from the boiling water, and did not close the clamp until he had placed the flask on the bench top. How would this affect the extrapolated value of Y? Explain.
3. Another student decided to use the same flask from trial 1 to perform a second determination without completely drying the flask. How would this affect the values of Vlow and Vhigh? Explain.
4. The true value of Y is ˗273oC. Calculate the percent error in your experimentally determined value of Y.
COPYRIGHT
FOUNTAIN
HEAD PRESS

COPYRIGHT
FOUNTAIN
HEAD PRESS

![The absolute zero vector. - ardix.be · The absolute zero vector. By Karel Van de Rostyne Abstract Set theory [1] and theory of vector spaces [2] are considered as mature theories](https://img.pdfslide.us/doc/110x75/5f73310fcef57653e50778fe/the-absolute-zero-vector-ardixbe-the-absolute-zero-vector-by-karel-van-de-rostyne.jpg)