Embed Size (px)
Citation preview
REGULAR ARTICLE
Estimation of plant litter pools and decomposition-relatedparameters in a mechanistic model
Signe Kynding Borgen & Lars Molstad &
Sander Bruun & Tor Arvid Breland &
Lars Reier Bakken & Marina Azzaroli Bleken
Received: 2 November 2009 /Accepted: 19 April 2010# Springer Science+Business Media B.V. 2010
Abstract Modeling the C and N dynamics duringdecomposition of plant residues depends on robustestimation of the litter pool partitioning (LPP) ofresidues, i.e. the fraction of their C and N allocated torapidly and slowly decomposing pools. We searchedfor ways to estimate LPP by analyzing data on C and Nmineralization during decomposition of 60 widelydifferent plant residues, using a simple model with twolitter pools and one microbial pool. LPP and relevantglobal parameters were estimated by model optimiza-tion (Levenberg-Marquardt-least-squares algorithm) inone operation. These kinetically-defined LPP valueswere used in regression analyses against data fromstepwise chemical digestion (SCD) and near-infraredreflectance (NIR) analysis of the plant residues. LPP
predicted by these regression models resulted in betterperformance than LPP from measured neutral-detergent-soluble (NDS) C and N when validated onindependent data (n=15 plant residues). The resultsdemonstrated the potential improvement by simulta-neous estimation of residue specific LPP and globalparameters, and that kinetically-defined LPP can beequally well predicted by NIR as by total N and NDS-C.Model failure for a minority of the plant-residues couldpartly be removed by altering the microbial C/N ratio(global optimum 7.1) within the range 5–15, possiblyreflecting a variable dominance of bacteria or fungi.
Keywords Nmineralization/immobilization .
Near infrared reflectance spectrometry (NIR) .
Neutral detergent soluble (NDS) . Optimization .
Soil organic matter model
Introduction
Plant litter decomposition is an important source ofmineral nitrogen (N) for organic, low-input and someconventional agricultural systems (Seneviratne 2000).Nitrogen is frequently the key nutrient limitingagricultural productivity and causes several negativeenvironmental impacts. In low-input systems, acareful synchronization of N mineralization with cropgrowth (Myers et al. 1997) is a necessity to sustainhigh production while minimizing environmentalimpacts such as greenhouse gas emissions and nitrate
Plant SoilDOI 10.1007/s11104-010-0404-4
Responsible Editor: Keith Paustian.
Electronic supplementary material The online version of thisarticle (doi:10.1007/s11104-010-0404-4) containssupplementary material, which is available to authorized users.
S. K. Borgen (*) : L. Molstad : T. A. Breland :L. R. Bakken :M. A. BlekenDepartment of Plant and Environmental Sciences,Norwegian University of Life Sciences,P.O. Box 5003, 1432 Ås, Norwaye-mail: [email protected]
S. BruunPlant and Soil Science Laboratory,Department of Agriculture and Ecology,University of Copenhagen,Thorvaldsensvej 40,DK-1871 Frederiksberg C, Denmark
leaching. Predicting N immobilization/mineralizationduring decomposition of crop residues and greenmanures requires a modeling approach that takesadequate account of plant residue quality in thesimplest way possible.
Most soil organic matter (SOM) models are based onthe assumption that decomposition can be modeled byconceptual pools that decay according to first-orderkinetics with pool-specific rate constants (Minderman1968; Paustian et al. 1997). Multi-compartmentalecosystem models such as CANDY (Franko et al.1995), CENTURY (Parton et al. 1987), DAISY (Bruunet al. 2003), DNDC (Li et al. 1994), NCSOIL(Nicolardot and Molina 1994), ROTHC (Coleman etal. 1997), SOILN (Johnsson et al. 1987), and STICS(Nicolardot et al. 2001) all include SOM sub-models ofvarying complexity. Although the structure of the soilmicrobial communities may influence the decomposi-tion rates, most models ignore this component, sincethe main factor driving decomposition is the chemicaland physical nature of the litter compounds (Swift etal. 1979). Most commonly, plant residues are parti-tioned into a rapidly and a slowly decomposing litterpool (Pansu et al. 2003). While this partitioning isspecific for each plant residue type, the decay rates ofthe two (or more) litter pools and other parametersgoverning C and N mineralization during decomposi-tion (microbial decay rate, growth yield, and C/N ratio)are usually global (shared), that is, common for allplant residues. Two methodological problems arise inthis type of modeling: 1) what is the best approach topartition litter between easily degradable and recalci-trant C and N pools, and 2) how can we find the bestset of global parameter values applicable to a broadrange of agricultural crop residues?
Direct quantification of the litter pools by chemicalanalyses is complicated due to the diversity ofmolecular structures and bonds within the major plantcompounds (Paustian et al. 1997) and due to thephysical heterogeneity of plant residues (Chesson1997). Stepwise chemical digestion (SCD) separatesorganic material into fractions of soluble, cellulose,hemicellulose and lignin-like substances (Mertens etal. 2002; Van Soest et al. 1991). Using SCD data topartition C and N into the litter pools of mechanisticSOM models can improve predictions of C and Nmineralization relative to a default constant value(Probert et al. 2005; Quemada and Cabrera 1995),especially if the C/N ratio of each fraction is
determined (Henriksen and Breland 1999a; Henriksenet al. 2007). However, it is not obvious how such datashould be analyzed in order to partition residue C andN into rapidly and slowly decomposing litter pools.Water-soluble C and N have been found to underes-timate the rapidly decomposing litter pool in theDAISY model (De Neergaard et al. 2002), and the useof SCD data in a mechanistic three-litter-pool modelresulted in somewhat overestimated plant residue C andN mineralization (Henriksen et al. 2007). Henriksenet al. (2007) also predicted SCD data from nearinfrared reflectance spectra (NIR) data, which resultedin similar model performance as using SCD datadirectly. NIR provides repeatable and accurate mea-surements with low cost and time consumption and is,therefore, commonly used for prediction of fractionsobtained by SCD (Foley et al. 1998; Pasquini 2003). Alitter decomposability index (Gillon et al. 1999) andparameters of various C and N mineralization models(Bruun et al. 2005; Joffre et al. 2001) have beenpredicted from NIR, as well as plant biochemicalfractions (Stenberg et al. 2004).
An alternative to chemical analysis (or to usingNIR to predict such data) is to estimate litter poolpartitioning by model fitting to measured C and Nmineralization, as done by Breland and Eltun (1999)for SOM pools. Fitting partitioning parameters in thismanner would make them kinetically defined accord-ing to the C and N mineralization trajectoriesobserved for each plant residue. However, minerali-zation experiments are time-consuming and costly;hence, we need alternative predictors. One alternativewould be to conduct a regression analysis ofkinetically-defined partitioning parameters (depen-dent variable) against SCD-data. Another alternativeis to use NIR spectra as prediction variables (bypartial least square regression), thus circumventing alinkage to chemically-extractable plant components.To our knowledge, this approach has not been testedbefore.
There is an interdependency, however, between theresidue-specific partitioning and global (shared)parameters such as decay rates of the litter pools andmicrobial biomass as well as the parameters govern-ing the C/N stoichiometry of microbial reactions(microbial growth yield and C/N ratio of microbialbiomass). By interdependency, we mean that thepartitioning of plant residue C and N into litter poolsto achieve correctly predicted C and N dynamics is
Plant Soil
dependent on the global parameters used. Conse-quently, an estimation of residue-specific partitioningparameters by model fitting would benefit if theglobal parameters were adjusted simultaneously. Toour knowledge no attempts have previously beenmade to perform a combined optimization of globaland residue-specific parameters. Such a simultaneousoptimization applying a large dataset would effective-ly search the parameter space for a set of globalparameter values and individual pool partitioning foreach plant residue, improving simulations for a widerrange of plant residues, hence, increasing modelprecision and generality. However, with precisionand generality as model objectives, realism is likelyto be compromised (Levins 1966).
The use of global parameters for modeling decom-position of all plant residues implicitly assumes thatthe microbial communities involved in their degrada-tion have identical characteristics (capacity fordegrading specific compounds, growth yield, C/Nratio and decay rate) for all plant residues. This is notnecessarily the case; plant residues could selectivelyenhance or inhibit different components of microbialcommunities, e.g., fungal or microbial growth, result-ing in altered decomposition capacity, growth yields,and other biomass C/N ratios than that for themajority of plant compounds. The C and Nmineralization patterns of such materials would bepoorly predicted by the model, not so much becausethe litter pool partitioning is wrong but because theglobal parameter values are inadequate for theseparticular materials. Investigation of these individualplant materials could test if model performance wouldimprove by changing the litter decay rates, microbialgrowth yield or biomass C/N ratio, implicitly testingif model inadequacy could be caused by selectivestimulations of microbes with a different capacity fordegradation and C and N assimilation than thosedegrading the majority of plant residues.
Our objective was to assess the performance of atwo-litter-pool SOM model (Nitrosim) when theinitial sizes of the litter pools were determined eitheras neutral detergent soluble (NDS) or by regressionmodels of kinetically-defined litter pools. The latterimplied estimating the litter pool partitioning param-eters by model optimization on a comprehensivecalibration dataset of C mineralization and N immo-bilization/mineralization from plant residues (n=60)and then selecting and evaluating the predictors based
on either SCD or NIR data. Predictors were eithersimple-linear, multiple-linear, or PLS (partial leastsquares) regression models. On an external validationdataset (n=15), we tested the hypothesis that theregressions of kinetically-defined litter pools wouldimprove model performance as compared to the directtranslation of NDS data to partitioning. We were alsointerested in finding out if data from NIR were betterthan SCD as regression model predictor variables.
A closely related objective was to investigate theimprovements from simultaneously optimizing theresidue-specific litter pool partitioning and the inter-related global parameters (litter pool decay rates andmicrobial growth yield and C/N ratio). We hypothe-sized that this approach would identify a set of globalparameters that increases the number of crop residuesfor which Nitrosim can adequately simulate C and Nmineralization. We further hypothesized that modelinadequacy remaining after such simultaneous opti-mization could still be serious for certain residues, notdue to inadequate litter pool partitioning but becausethe global parameters are inadequate. Therefore, in asearch for potentially explanatory patterns related tomicrobial community structure, alternative values forthe global and residue-specific parameters wereinvestigated in exploratory optimizations using dataof single outstanding residues.
Materials and methods
The data
We used published data from controlled experimentsof a joint Nordic research project (Jensen et al. 2005).CO2 evolution and mineral N (Nmin = N-NH4
+ and N-NO3
−) from 76 plant materials incubated in a sandysoil at 15°C were measured in triplicate at 14 and8 occasions (m=14 for C and m=8 for N), respec-tively, over 217 days. Factors potentially influencingC and N mineralization, except for plant resourcequality, were standardized. Details of the incubation,plant materials, and soil are described by Jensen et al.(2005). SCD was used to quantify C and N in theNDS, hemicellulose, cellulose and lignin fractions,and NIR spectra were recorded (Stenberg et al. 2004).The residues used were from plants commonlycultivated in Scandinavia. They covered a broadspectrum of plant residue qualities (SM Table 1),
Plant Soil
implying that N mineralization patterns varied fromlong-term net immobilization from, e.g., stems ofhemp and wheat, to rapid net mineralization, as seenfor green leaves of turnip rape and winter rye. Patternsdisplaying immobilization followed by a mineraliza-tion were also represented (SM Figure 1). The plantmaterials were incubated in five different countries.We used the batch from Iceland as validation data(n=15 plant materials), which was, therefore, exclud-ed from the optimization procedures. The remainingfour incubation batches are referred to as thecalibration dataset.
The Nitrosim model
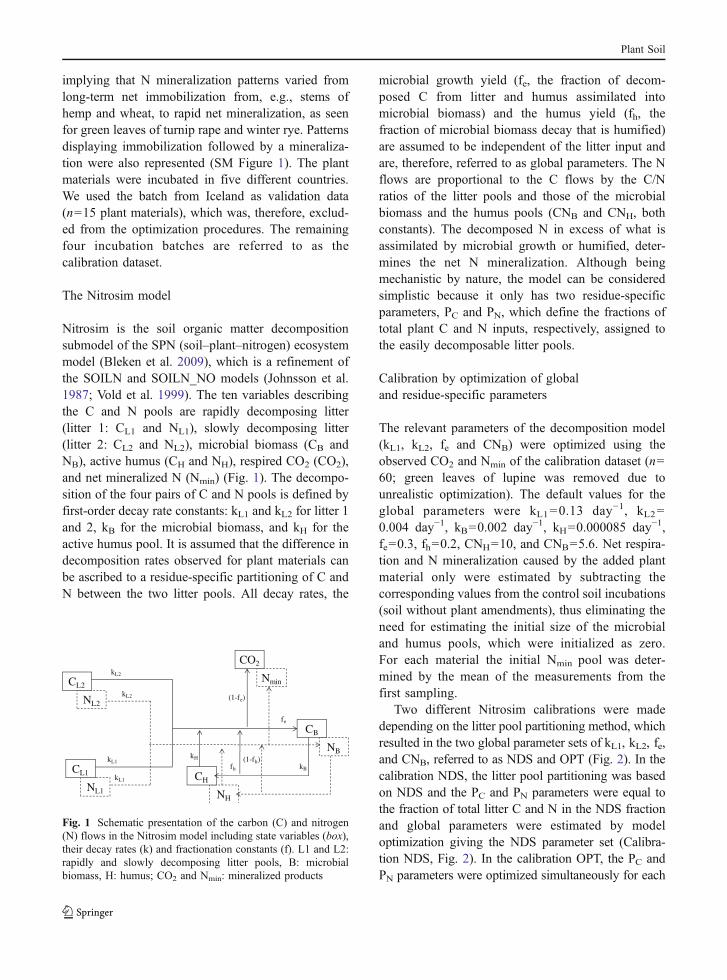
Nitrosim is the soil organic matter decompositionsubmodel of the SPN (soil–plant–nitrogen) ecosystemmodel (Bleken et al. 2009), which is a refinement ofthe SOILN and SOILN_NO models (Johnsson et al.1987; Vold et al. 1999). The ten variables describingthe C and N pools are rapidly decomposing litter(litter 1: CL1 and NL1), slowly decomposing litter(litter 2: CL2 and NL2), microbial biomass (CB andNB), active humus (CH and NH), respired CO2 (CO2),and net mineralized N (Nmin) (Fig. 1). The decompo-sition of the four pairs of C and N pools is defined byfirst-order decay rate constants: kL1 and kL2 for litter 1and 2, kB for the microbial biomass, and kH for theactive humus pool. It is assumed that the difference indecomposition rates observed for plant materials canbe ascribed to a residue-specific partitioning of C andN between the two litter pools. All decay rates, the
microbial growth yield (fe, the fraction of decom-posed C from litter and humus assimilated intomicrobial biomass) and the humus yield (fh, thefraction of microbial biomass decay that is humified)are assumed to be independent of the litter input andare, therefore, referred to as global parameters. The Nflows are proportional to the C flows by the C/Nratios of the litter pools and those of the microbialbiomass and the humus pools (CNB and CNH, bothconstants). The decomposed N in excess of what isassimilated by microbial growth or humified, deter-mines the net N mineralization. Although beingmechanistic by nature, the model can be consideredsimplistic because it only has two residue-specificparameters, PC and PN, which define the fractions oftotal plant C and N inputs, respectively, assigned tothe easily decomposable litter pools.
Calibration by optimization of globaland residue-specific parameters
The relevant parameters of the decomposition model(kL1, kL2, fe and CNB) were optimized using theobserved CO2 and Nmin of the calibration dataset (n=60; green leaves of lupine was removed due tounrealistic optimization). The default values for theglobal parameters were kL1=0.13 day−1, kL2=0.004 day−1, kB=0.002 day−1, kH=0.000085 day−1,fe=0.3, fh=0.2, CNH=10, and CNB=5.6. Net respira-tion and N mineralization caused by the added plantmaterial only were estimated by subtracting thecorresponding values from the control soil incubations(soil without plant amendments), thus eliminating theneed for estimating the initial size of the microbialand humus pools, which were initialized as zero.For each material the initial Nmin pool was deter-mined by the mean of the measurements from thefirst sampling.
Two different Nitrosim calibrations were madedepending on the litter pool partitioning method, whichresulted in the two global parameter sets of kL1, kL2, fe,and CNB, referred to as NDS and OPT (Fig. 2). In thecalibration NDS, the litter pool partitioning was basedon NDS and the PC and PN parameters were equal tothe fraction of total litter C and N in the NDS fractionand global parameters were estimated by modeloptimization giving the NDS parameter set (Calibra-tion NDS, Fig. 2). In the calibration OPT, the PC andPN parameters were optimized simultaneously for each
NL1
CL1
NL2
CL2
NB
CB
NH
CH
Nmin
CO2
kB
kL1
fe
kH
kL2
fh
(1-fe)
kL2
kL1 (1-fh)
Fig. 1 Schematic presentation of the carbon (C) and nitrogen(N) flows in the Nitrosim model including state variables (box),their decay rates (k) and fractionation constants (f). L1 and L2:rapidly and slowly decomposing litter pools, B: microbialbiomass, H: humus; CO2 and Nmin: mineralized products
Plant Soil
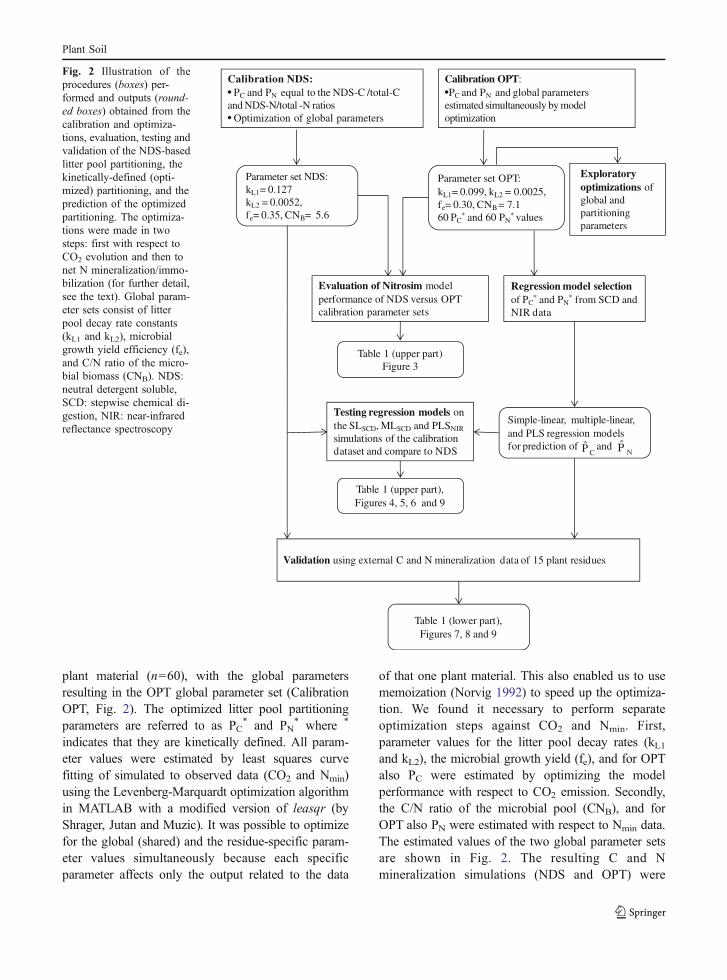
plant material (n=60), with the global parametersresulting in the OPT global parameter set (CalibrationOPT, Fig. 2). The optimized litter pool partitioningparameters are referred to as PC
* and PN* where *
indicates that they are kinetically defined. All param-eter values were estimated by least squares curvefitting of simulated to observed data (CO2 and Nmin)using the Levenberg-Marquardt optimization algorithmin MATLAB with a modified version of leasqr (byShrager, Jutan and Muzic). It was possible to optimizefor the global (shared) and the residue-specific param-eter values simultaneously because each specificparameter affects only the output related to the data
of that one plant material. This also enabled us to usememoization (Norvig 1992) to speed up the optimiza-tion. We found it necessary to perform separateoptimization steps against CO2 and Nmin. First,parameter values for the litter pool decay rates (kL1and kL2), the microbial growth yield (fe), and for OPTalso PC were estimated by optimizing the modelperformance with respect to CO2 emission. Secondly,the C/N ratio of the microbial pool (CNB), and forOPT also PN were estimated with respect to Nmin data.The estimated values of the two global parameter setsare shown in Fig. 2. The resulting C and Nmineralization simulations (NDS and OPT) were
Calibration NDS:• PC and PN equal to the NDS-C /total-C and NDS-N/total -N ratios• Optimization of global parameters
Validation using external C and N mineralization data of 15 plant residues
Calibration OPT:•PC and PN and global parameters estimated simultaneously by model optimization
Exploratory optimizations of global and partitioning parameters
Regression model selection of PC
* and PN* from SCD and
NIR data
Evaluation of Nitrosim model performance of NDS versus OPT calibration parameter sets
Testing regression models on the SLSCD, MLSCD and PLSNIR
simulations of the calibration dataset and compare to NDS
Table 1 (upper part), Figures 4, 5, 6 and 9
Parameter set OPT: kL1= 0.099, kL2 = 0.0025, fe= 0.30, CNB = 7.1 60 PC
* and 60 PN* values
Parameter set NDS:kL1= 0.127kL2 = 0.0052, fe= 0.35, CNB= 5.6
Table 1 (upper part) Figure 3
Simple-linear, multiple-linear, and PLS regression modelsfor prediction of and
CP̂ NP̂
Table 1 (lower part), Figures 7, 8 and 9
Fig. 2 Illustration of theprocedures (boxes) per-formed and outputs (round-ed boxes) obtained from thecalibration and optimiza-tions, evaluation, testing andvalidation of the NDS-basedlitter pool partitioning, thekinetically-defined (opti-mized) partitioning, and theprediction of the optimizedpartitioning. The optimiza-tions were made in twosteps: first with respect toCO2 evolution and then tonet N mineralization/immo-bilization (for further detail,see the text). Global param-eter sets consist of litterpool decay rate constants(kL1 and kL2), microbialgrowth yield efficiency (fe),and C/N ratio of the micro-bial biomass (CNB). NDS:neutral detergent soluble,SCD: stepwise chemical di-gestion, NIR: near-infraredreflectance spectroscopy
Plant Soil
evaluated by statistics of mean absolute errors andmodeling efficiency (Evaluation of Nitrosim, Fig. 2)
Exploratory optimizations
In order to investigate the causes of remaining modelfailure after the simultaneous optimization (OPT), weconducted individual model optimizations for differentglobal parameters (Exploratory optimizations, Fig. 2).We explored the consequences of assigning local(residue-specific) parameter scope to the global param-eters (kL1, kL2, fe, and CNB) for selected materials asfollows: i) litter pool decay rates (kL1 and kL2) wereassigned local scope for the residues with the largestmodel errors for C and N mineralization (n=5), alsoallowing PC and PN to be re-estimated, ii) microbialgrowth yield (fe) was assigned local scope for allresidues in the calibration data (n=60), while keepingPC
* and PN* fixed, and iii) the C/N ratio of the
microbial biomass (CNB) was assigned local scopetogether with PC and PN for selected residues whosePN
* was either 1 or 0 (n=7). Optimizations for kL1,kL2, and fe explored the assumption that model failurewas not due to an inappropriate litter partitioning, butinstead caused by inadequate global parameter values,while optimizations for CNB additionally soughtexplanations for unrealistically optimized PN
* values.
Predictors of the kinetically-defined litter poolpartitioning: selection of regression models
To find general predictors of the kinetically-definedlitter pool partitioning parameters PC
* and PN* the
relationships between them and potential litter qualitydescriptors, such as C and N in the SCD fractions andNIR data were investigated. We built cross-validatedsimple-linear, multiple-linear, and PLS regressionmodels and selected the best one for each of the threeregression procedures (Regression model selection,Fig. 2).
We observed that the best results were obtained whenquantities of C and N in litter (mg C or N g−1 plant DM,calculated as CL1
* = PC* × CTOT and NL1
* = PN* ×
NTOT) rather than the actual optimized fractions, wereused as the dependent variables in the regressionmodels. The quantity estimated by the three regressionmodels, referred to as bCL1 and bNL1, together withmeasured total C and N (CTOT and NTOT) in eachresidue, were used to calculate the predictions of the
kinetically-defined litter pool partitioning parametersbPC and bPN. In the process, values outside the range of0–1 occurred for a few residues, and these weretruncated to zero or one.
The performance of the simple-linear, multiple-linear and PLS regression models was tested on thecalibration dataset (Testing regression models, Fig. 2)in order to evaluate the loss of information connectedto the regression procedures. The Nitrosim simula-tions using the three regression models for predictionof the kinetically-defined pool partitioning are re-ferred to as SLSCD, MLSCD, and PLSNIR. We appliedthe same statistics as for the Nitrosim evaluation andthe validation procedure (see below).
Simple- and multiple-linear regression models basedon SCD fractions
Model combinations were constructed using allavailable SCD fractions (C and N in NDS, hemicel-lulose, cellulose and lignin and total). Simple-linearmodels with one independent variable and multiple-linear models with several independent variables wereselected based on the highest coefficient of determi-nation (R2). Further criteria for selection were p≤0.05for all variables included in the model and Mallow’sCp, as computed by Proc Reg with the SAS software(SAS Institute Inc 1989). Because of the collinearitybetween the variables, we decided to limit the numberof independent variables to a maximum of three in theML models. The best models were fully cross-validated (a leave-one-out approach) using MLR inUnscrambler® software, which gave the final models.
Partial least squares regression models based on NIR
Partial least squares (PLS1) analyses were performedin Unscrambler, to construct regression models forestimation of the kinetically-defined partitioningparameters, PC
* and PN*, from NIR data. To avoid
jeopardizing model robustness, we used only the1100–2500 nm range of the NIR (Bruun et al. 2005).The spectra were transformed from the measuredreflectance (R) into absorbance by A = log (1/R). Tosmooth the spectra and minimize the effects ofnonspecific scatter, we further transformed the datataking the Savitzky-Golay second derivative by fittingthe spectra to a second-order polynomial functionwith four (2nd4) and eight (2nd8) adjacent points on
Plant Soil
both sides. Fully cross-validated models with amaximum of ten PLS components were run usingthe three data formats (un-transformed, 2nd4, and2nd8). The best models for bCL1 and bNL1 were chosenfor the Nitrosim simulation (PLSNIR) by selecting thenumber of PLS components giving rise to the loweststandard error of prediction (SEP), which is calculatedas the standard deviation of the residuals.
External validation of NDS and regression modelpredictions of kinetically-defined partitioning
To compare NDS-based partitioning with regressionmodels predicting the kinetically-defined pool parti-tioning, we used a validation dataset (n=15) consist-ing of samples incubated in Iceland (Validation,Fig. 2). The statistics applied were the same as forthe evaluation of the simultaneous optimization, thetesting regression models, and the external validation.The Nitrosim simulations using regression models topredict the litter pool partitioning are referred to asSLSCD, MLSCD, and PLSNIR.
Evaluation statistics for decomposition modelperformance of simulated C and N mineralization
Nitrosim performance was evaluated for the fivesimulation runs (OPT, NDS, SLSCD, MLSCD, andPLSNIR) by calculating the mean absolute error MAE(1.1) and the modeling efficiency EF (1.2) for allplant materials:
MAE ¼PN
i¼1 yi � byij jN
ð1:1Þ
EF ¼PN
i¼1 yi � yð Þ2 �PNi¼1 yi � byið Þ2PN
i¼1 yi � yð Þ2 ð1:2Þ
Where yi is the i’th of the N observations (N =m×n, n=60 and 15 plant materials in the calibrationand validation datasets, and m=14 and 8 samplingoccasions of CO2 and Nmin, respectively), byi is thecorresponding values predicted by the Nitrosimmodel, and y is the average of the observed values.MAE values were also calculated for the individualplant materials (N = m).
Frequentist statistics based on hypothesis testingand P values have been criticized for being poor
criteria for selection of ecological models because ofthe inherent stochasticity, scale-dependency, andnonlinearity of the systems under study (Burnhamand Anderson 2002; Hastings et al. 2005). In modelevaluation, elements of information theory can beimplemented by AIC (an information criterion) toextract and separate information from noise (Akaike1973). AIC of the j’th model (or simulation run) wascalculated in R software and according to Burnhamand Anderson (2002) as
AICj ¼ N ln1
N
XN
i¼1yi � byið Þ2
� �þ 2K;
where K=2 and is the number of free parameters. TheAkaike weights wj that quantify the probability thatsimulation model j ( j = 1, 2... J ) is best among the Jmodels tested, were calculated as
wj ¼ e�$AICj=2PJj¼1 e
�$AICj=2;
with the relative AIC differences (ΔAICj) being$AICj¼ AICj�AICmin and AICmin is the smallestAIC value. Due to its obvious advantage, the OPTmodel was not included; hence, J=4.
Results
Model performance by simultaneous optimizationfor global and residue-specific parameters
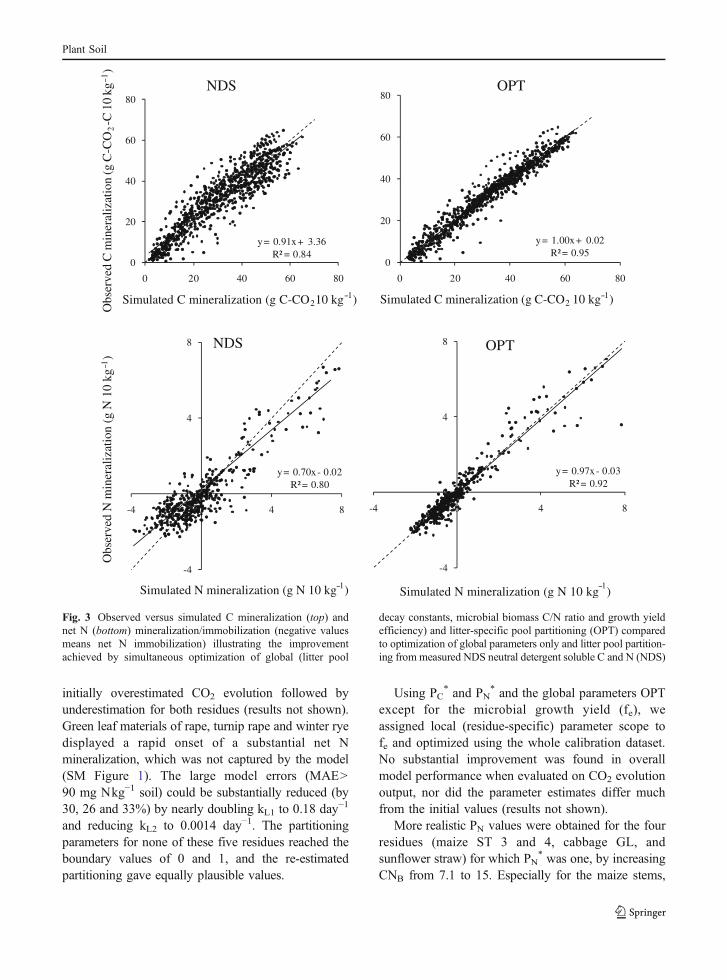
The improvement in model performance from thesimultaneous optimization of global and residue-specific parameters was considerable compared tooptimization of global parameters only. This is seen inhigher EFs and ∼50% reduction of MAE both for C andN mineralization (Table 1). The improved performancefrom OPT was partly due to an effective reduction of asystematic over-estimation of N-mineralization duringthe early phase and an underestimation during the latephase of the incubations (results not shown). Also, for Cmineralization the OPT calibration removed most of thetemporal bias by eliminating the initial underestimation.The systematic bias visible in the plot of observedversus predicted values was reduced; the regressionlines cohered around the 1:1 line of perfect agreement(OPT, Fig. 3). Especially for N, the regression lineswere no longer significantly different from the bisect.
Plant Soil
Compared to calibration NDS, calibration OPTresulted in lower decay rates of kL1=0.099 day−1 andkL2=0.0025 day−1, and microbial growth yield of fe=0.30, but an increase in the C/N ratio of the microbialbiomass to 7.1 (Fig. 2). The kinetically-definedpartitioning assigned more C and less N to the rapidlydecomposing pool (litter 1) than measured as NDS.Mean values of the optimized fraction parameters(PC
*=0.54 and PN*=0.44) were 30 % larger for PC but
46 % smaller for PN than the measured NDS fractions(PC=0.47 and PN=0.82). The C/N ratios of theoptimized litter 1 pool varied much more (20thpercentile, median and 80th percentile: 19, 32 and 152)than the NDS-C/NDS-N ratios (same statistics: 10, 18and 28). Consequently, the optimized slowly decompos-ing pool (litter 2) had lower C/N ratios (same statistics: 9,37, 90) than measured by SCD (same statistics: 42, 140,267). The PN
* values differed more than PC* values,
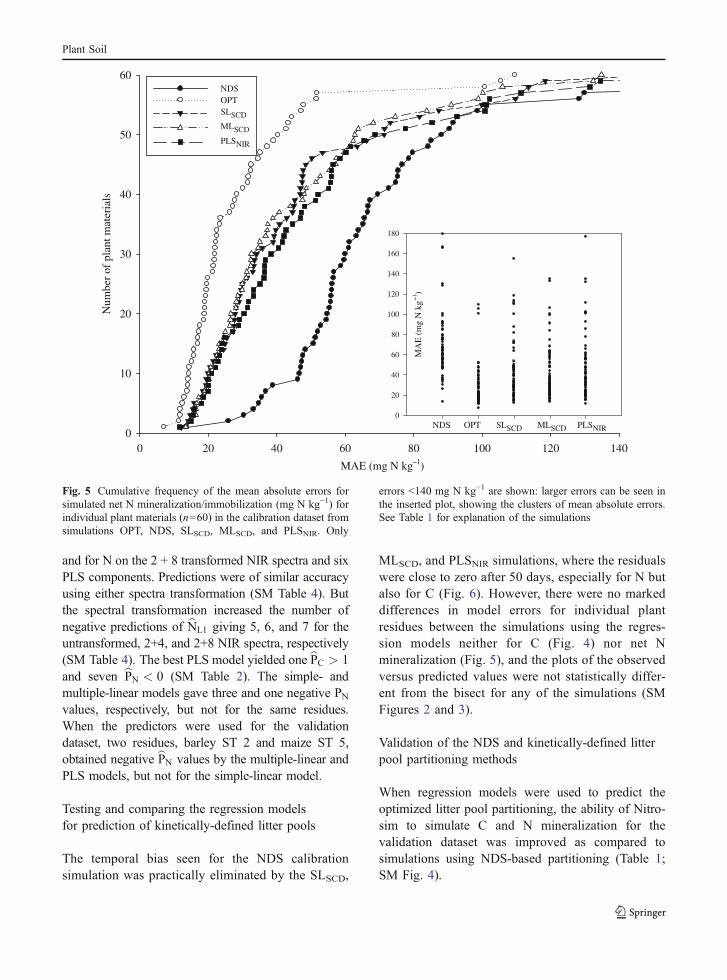
hence, the relative improvement potential in modelperformance was greater for N than for C mineraliza-tion (Table 1), which is also seen from the relativedistance between NDS and OPT in the cumulatedfrequency plots of individual mean absolute errors(Figs. 4 and 5). For six plant materials [barley spikes
(SP), elephant grass, wheat green leaves (GL) 2, wheatstems (ST) 2, 4 and 5] the optimization assigned all Nto the slowly decomposing litter pool (i.e., PN
*=0, SMTable 2). Measured NDS-N fractions of these residueswere between 0.67 and 0.91 (SM Table 2) indicatingthat the PN
* estimates were somewhat unrealistic.However, they all had small N contents (<3 % Nexcept for elephant grass with 13% N). Consequently,large model errors were not observed (SM Table 3).
Exploratory optimizations finding alternativeparameter values for outlying plant residues
Although the simultaneous optimization of litter poolpartitioning and global parameters (OPT) resulted ingood agreement between simulations and measure-ments for a majority of plant residues, large modelerrors (MAE>700 mg C kg−1 soil) still occurred forgreen leaves (GL) of barley and wheat spikes (SP) no2, which showed a substantially underestimated Cmineralization (SM Figure 1 and SM Table 3).Decreasing kL1 to 0.03 significantly reduced the errorsfor both residues (e.g. from 1100 to 350 mg C kg−1
soil for wheat SP 2) and eliminated the pattern of
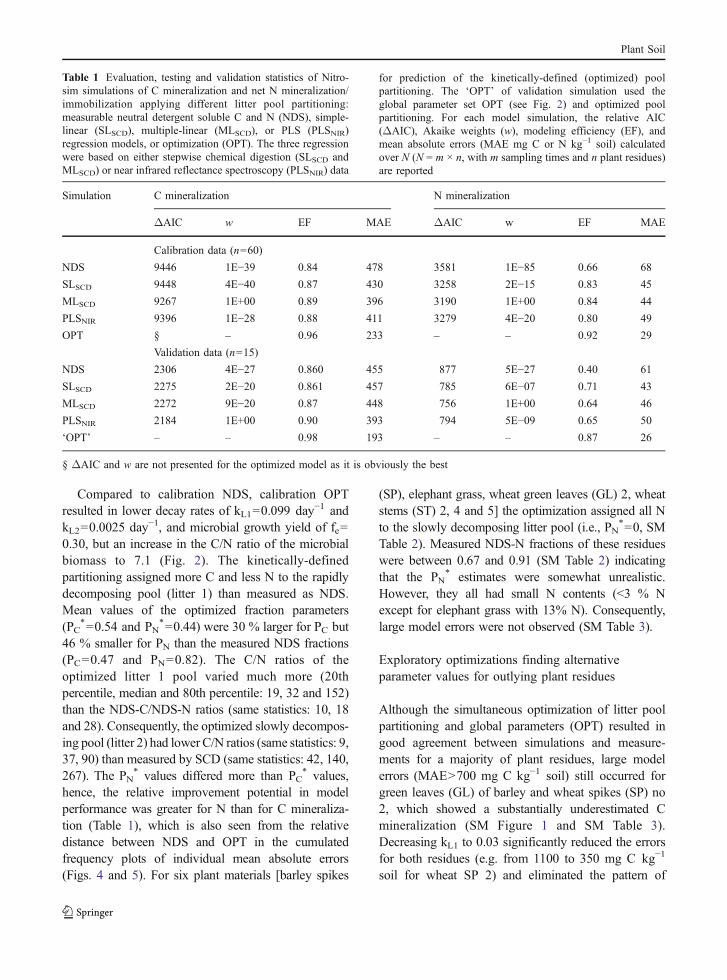
Table 1 Evaluation, testing and validation statistics of Nitro-sim simulations of C mineralization and net N mineralization/immobilization applying different litter pool partitioning:measurable neutral detergent soluble C and N (NDS), simple-linear (SLSCD), multiple-linear (MLSCD), or PLS (PLSNIR)regression models, or optimization (OPT). The three regressionwere based on either stepwise chemical digestion (SLSCD andMLSCD) or near infrared reflectance spectroscopy (PLSNIR) data
for prediction of the kinetically-defined (optimized) poolpartitioning. The ‘OPT’ of validation simulation used theglobal parameter set OPT (see Fig. 2) and optimized poolpartitioning. For each model simulation, the relative AIC(ΔAIC), Akaike weights (w), modeling efficiency (EF), andmean absolute errors (MAE mg C or N kg−1 soil) calculatedover N (N = m × n, with m sampling times and n plant residues)are reported
Simulation C mineralization N mineralization
ΔAIC w EF MAE ΔAIC w EF MAE
Calibration data (n=60)
NDS 9446 1E−39 0.84 478 3581 1E−85 0.66 68
SLSCD 9448 4E−40 0.87 430 3258 2E−15 0.83 45
MLSCD 9267 1E+00 0.89 396 3190 1E+00 0.84 44
PLSNIR 9396 1E−28 0.88 411 3279 4E−20 0.80 49
OPT § – 0.96 233 – – 0.92 29
Validation data (n=15)
NDS 2306 4E−27 0.860 455 877 5E−27 0.40 61
SLSCD 2275 2E−20 0.861 457 785 6E−07 0.71 43
MLSCD 2272 9E−20 0.87 448 756 1E+00 0.64 46
PLSNIR 2184 1E+00 0.90 393 794 5E−09 0.65 50
‘OPT’ – – 0.98 193 – – 0.87 26
§ ΔAIC and w are not presented for the optimized model as it is obviously the best
Plant Soil
initially overestimated CO2 evolution followed byunderestimation for both residues (results not shown).Green leaf materials of rape, turnip rape and winter ryedisplayed a rapid onset of a substantial net Nmineralization, which was not captured by the model(SM Figure 1). The large model errors (MAE>90 mg Nkg−1 soil) could be substantially reduced (by30, 26 and 33%) by nearly doubling kL1 to 0.18 day−1
and reducing kL2 to 0.0014 day−1. The partitioningparameters for none of these five residues reached theboundary values of 0 and 1, and the re-estimatedpartitioning gave equally plausible values.
Using PC* and PN
* and the global parameters OPTexcept for the microbial growth yield (fe), weassigned local (residue-specific) parameter scope tofe and optimized using the whole calibration dataset.No substantial improvement was found in overallmodel performance when evaluated on CO2 evolutionoutput, nor did the parameter estimates differ muchfrom the initial values (results not shown).
More realistic PN values were obtained for the fourresidues (maize ST 3 and 4, cabbage GL, andsunflower straw) for which PN
* was one, by increasingCNB from 7.1 to 15. Especially for the maize stems,
y = 0.91x + 3.36R² = 0.84
0
20
40
60
80
0 20 40 60 80
Obs
erve
d C
min
eral
izat
ion
(g C
-CO
2-C
10
kg)
Simulated C mineralization (g C-CO2 10 kg )
NDS
y = 1.00x + 0.02R² = 0.95
0
20
40
60
80
0 20 40 60 80
Simulated C mineralization (g C-CO2 10 kg )
OPT
y = 0.70x - 0.02R² = 0.80
-4
0
4
8
-4 0 4 8
Obs
erve
d N
min
eral
izat
ion
(g N
10
kg)
Simulated N mineralization (g N 10 kg )
NDS
y = 0.97x - 0.03R² = 0.92
-4
0
4
8
-4 0 4 8
Simulated N mineralization (g N 10 kg )
OPT
Fig. 3 Observed versus simulated C mineralization (top) andnet N (bottom) mineralization/immobilization (negative valuesmeans net N immobilization) illustrating the improvementachieved by simultaneous optimization of global (litter pool
decay constants, microbial biomass C/N ratio and growth yieldefficiency) and litter-specific pool partitioning (OPT) comparedto optimization of global parameters only and litter pool partition-ing from measured NDS neutral detergent soluble C and N (NDS)
Plant Soil
model performance was significantly improved(∼60%) and the overestimated initial net N immobili-zation reduced. Cabbage GL and sunflower strawdisplayed more erratic mineralization patterns; conse-quently, model improvements were smaller. Theunrealistic PN
* values of zero were corrected to 0.78(elephant grass), 0.38 (wheat GL 2) and 0.28 (rape ST2) when reducing CNB from 7.1 to 5. Model errorsincreased slightly for elephant grass and rape ST, butfor wheat GL MAE was reduced by 44 %.
Selection of the regression models based on SCDor NIR data
The cross-validated regression models for predic-tion of the kinetically-defined partitioning parame-ters gave similar correlation coefficients between
predicted and optimized values; for carbon r=0.81,0.87, 0.84 and for nitrogen r=0.93, 0.94, 0.89, forthe simple-, multiple-linear and PLS models, respec-tively. No single model was clearly better thanothers; however, standard error of prediction wassmallest for the multiple-linear model (SM Table 4).The cross-validated simple regression modelsbCL1 ¼ 0:67CNDS þ 99:8 and bNL1¼ 0:658NTOT � 2:1predicted the optimized partitioning parameterswell. All units are mg C or N g−1 DM. bNL1 couldequally well be predicted from NDS-N. Thecross-validated multiple regression models werebCL1¼ 0:52CNDSþ1:14NNDS � 0:54CTOTþ358:5 andbNL1 ¼ 0:703NNDS �4:3NLIGN þ 0:29. Red cloverwas excluded in both bNL1 models because of its highleverage. The best PLS models were for C based on theuntransformed NIR spectra and nine PLS components,
MAE (mg C kg 1)200 400 600 800
Num
ber
of p
lant
mat
eria
ls
0
10
20
30
40
50
60
NDSOPTSLSCD
MLSCD
PLSNIR
0
200
400
600
800
1000
1200
NDS OPT SLSCD MLSCD PLSNIR
MA
E (
mg
C k
g 1
)
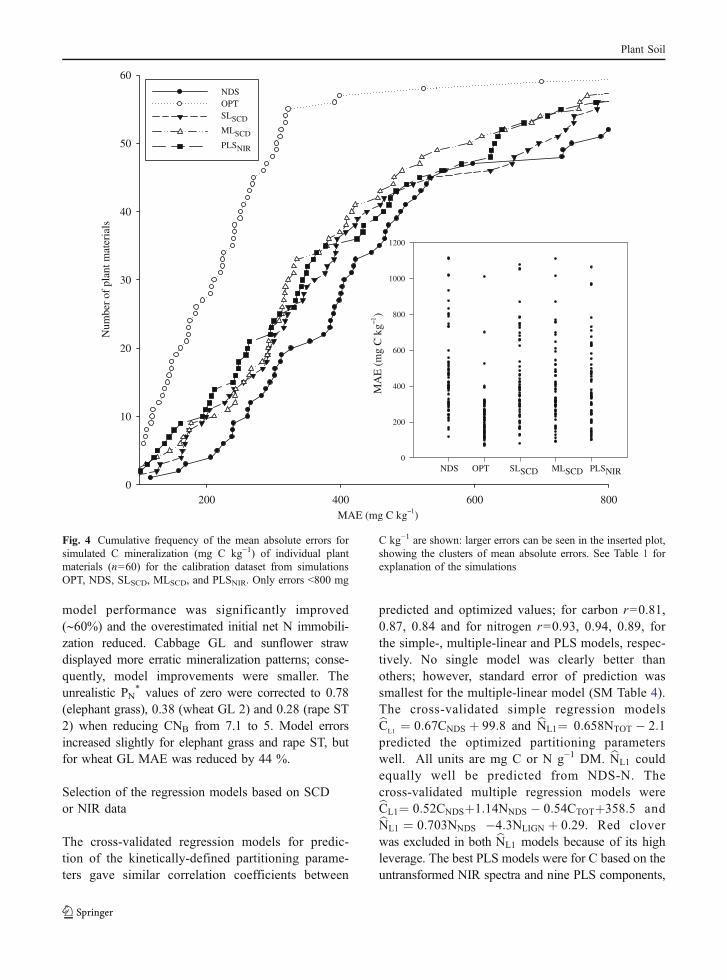
Fig. 4 Cumulative frequency of the mean absolute errors forsimulated C mineralization (mg C kg−1) of individual plantmaterials (n=60) for the calibration dataset from simulationsOPT, NDS, SLSCD, MLSCD, and PLSNIR. Only errors <800 mg
C kg−1 are shown: larger errors can be seen in the inserted plot,showing the clusters of mean absolute errors. See Table 1 forexplanation of the simulations
Plant Soil
and for N on the 2 + 8 transformed NIR spectra and sixPLS components. Predictions were of similar accuracyusing either spectra transformation (SM Table 4). Butthe spectral transformation increased the number ofnegative predictions of bNL1 giving 5, 6, and 7 for theuntransformed, 2+4, and 2+8 NIR spectra, respectively(SM Table 4). The best PLS model yielded one bPC > 1and seven bPN < 0 (SM Table 2). The simple- andmultiple-linear models gave three and one negative PNvalues, respectively, but not for the same residues.When the predictors were used for the validationdataset, two residues, barley ST 2 and maize ST 5,obtained negative bPN values by the multiple-linear andPLS models, but not for the simple-linear model.
Testing and comparing the regression modelsfor prediction of kinetically-defined litter pools
The temporal bias seen for the NDS calibrationsimulation was practically eliminated by the SLSCD,
MLSCD, and PLSNIR simulations, where the residualswere close to zero after 50 days, especially for N butalso for C (Fig. 6). However, there were no markeddifferences in model errors for individual plantresidues between the simulations using the regres-sion models neither for C (Fig. 4) nor net Nmineralization (Fig. 5), and the plots of the observedversus predicted values were not statistically differ-ent from the bisect for any of the simulations (SMFigures 2 and 3).
Validation of the NDS and kinetically-defined litterpool partitioning methods
When regression models were used to predict theoptimized litter pool partitioning, the ability of Nitro-sim to simulate C and N mineralization for thevalidation dataset was improved as compared tosimulations using NDS-based partitioning (Table 1;SM Fig. 4).
MAE (mg N kg 1)
0 20 40 60 80 100 120 140
Num
ber
of p
lant
mat
eria
ls
0
10
20
30
40
50
60NDSOPTSLSCD
MLSCD
PLSNIR
MA
E (
mg
N k
g 1)
0
20
40
60
80
100
120
140
160
180
NDS OPT SLSCD MLSCD PLSNIR
Fig. 5 Cumulative frequency of the mean absolute errors forsimulated net N mineralization/immobilization (mg N kg−1) forindividual plant materials (n=60) in the calibration dataset fromsimulations OPT, NDS, SLSCD, MLSCD, and PLSNIR. Only
errors <140 mg N kg−1 are shown: larger errors can be seen inthe inserted plot, showing the clusters of mean absolute errors.See Table 1 for explanation of the simulations
Plant Soil
Simulated CO2 evolution
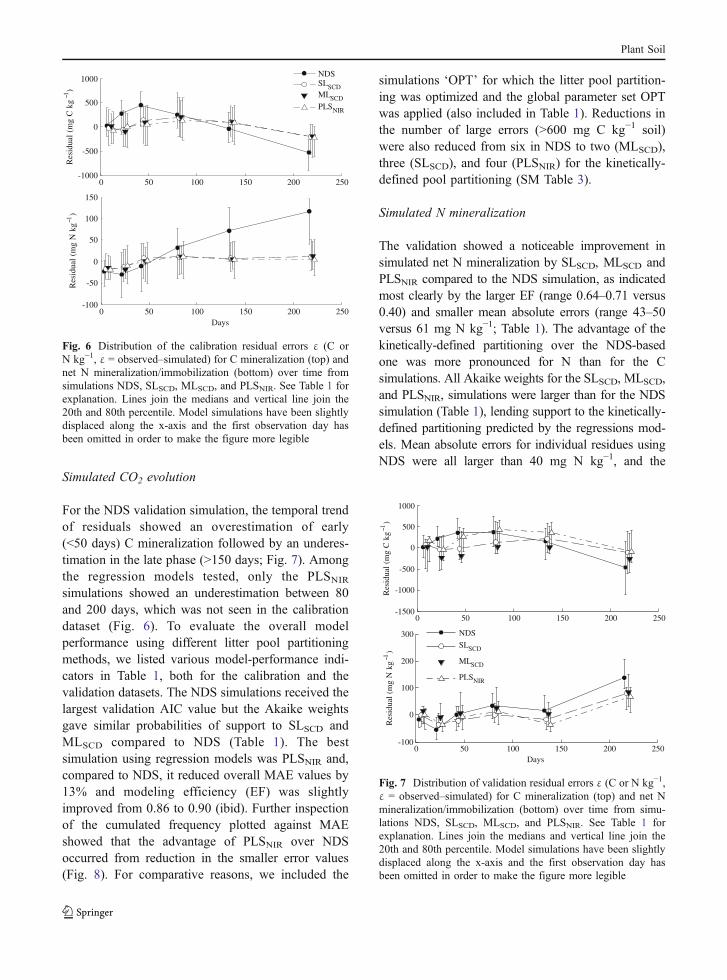
For the NDS validation simulation, the temporal trendof residuals showed an overestimation of early(<50 days) C mineralization followed by an underes-timation in the late phase (>150 days; Fig. 7). Amongthe regression models tested, only the PLSNIR
simulations showed an underestimation between 80and 200 days, which was not seen in the calibrationdataset (Fig. 6). To evaluate the overall modelperformance using different litter pool partitioningmethods, we listed various model-performance indi-cators in Table 1, both for the calibration and thevalidation datasets. The NDS simulations received thelargest validation AIC value but the Akaike weightsgave similar probabilities of support to SLSCD andMLSCD compared to NDS (Table 1). The bestsimulation using regression models was PLSNIR and,compared to NDS, it reduced overall MAE values by13% and modeling efficiency (EF) was slightlyimproved from 0.86 to 0.90 (ibid). Further inspectionof the cumulated frequency plotted against MAEshowed that the advantage of PLSNIR over NDSoccurred from reduction in the smaller error values(Fig. 8). For comparative reasons, we included the
simulations ‘OPT’ for which the litter pool partition-ing was optimized and the global parameter set OPTwas applied (also included in Table 1). Reductions inthe number of large errors (>600 mg C kg−1 soil)were also reduced from six in NDS to two (MLSCD),three (SLSCD), and four (PLSNIR) for the kinetically-defined pool partitioning (SM Table 3).
Simulated N mineralization
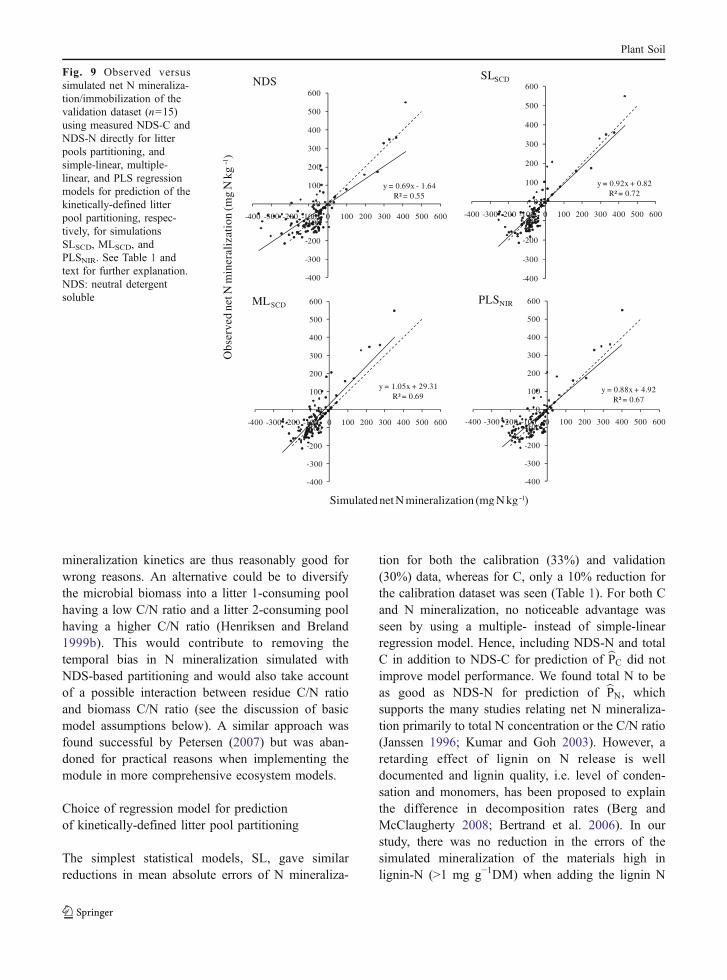
The validation showed a noticeable improvement insimulated net N mineralization by SLSCD, MLSCD andPLSNIR compared to the NDS simulation, as indicatedmost clearly by the larger EF (range 0.64–0.71 versus0.40) and smaller mean absolute errors (range 43–50versus 61 mg N kg−1; Table 1). The advantage of thekinetically-defined partitioning over the NDS-basedone was more pronounced for N than for the Csimulations. All Akaike weights for the SLSCD, MLSCD,and PLSNIR, simulations were larger than for the NDSsimulation (Table 1), lending support to the kinetically-defined partitioning predicted by the regressions mod-els. Mean absolute errors for individual residues usingNDS were all larger than 40 mg N kg−1, and the
0 50 100 150 200 250-1000
-500
0
500
1000R
esid
ual
(mg
C k
g )
0 50 100 150 200 250-100
-50
0
50
100
150
Days
Res
idua
l (m
g N
kg
1 )NDSSLSCDMLSCDPLSNIR
1
Fig. 6 Distribution of the calibration residual errors ε (C orN kg−1, ε = observed–simulated) for C mineralization (top) andnet N mineralization/immobilization (bottom) over time fromsimulations NDS, SLSCD, MLSCD, and PLSNIR. See Table 1 forexplanation. Lines join the medians and vertical line join the20th and 80th percentile. Model simulations have been slightlydisplaced along the x-axis and the first observation day hasbeen omitted in order to make the figure more legible
0 50 100 150 200 250-1500
-1000
-500
0
500
1000
Res
idua
l (m
g C
kg
)
0 50 100 150 200 250-100
0
100
200
300
Days
Res
idua
l (m
g N
kg
)
NDS
SLSCD
MLSCD
PLSNIR
1 1
Fig. 7 Distribution of validation residual errors ε (C or N kg−1,ε = observed–simulated) for C mineralization (top) and net Nmineralization/immobilization (bottom) over time from simu-lations NDS, SLSCD, MLSCD, and PLSNIR. See Table 1 forexplanation. Lines join the medians and vertical line join the20th and 80th percentile. Model simulations have been slightlydisplaced along the x-axis and the first observation day hasbeen omitted in order to make the figure more legible
Plant Soil
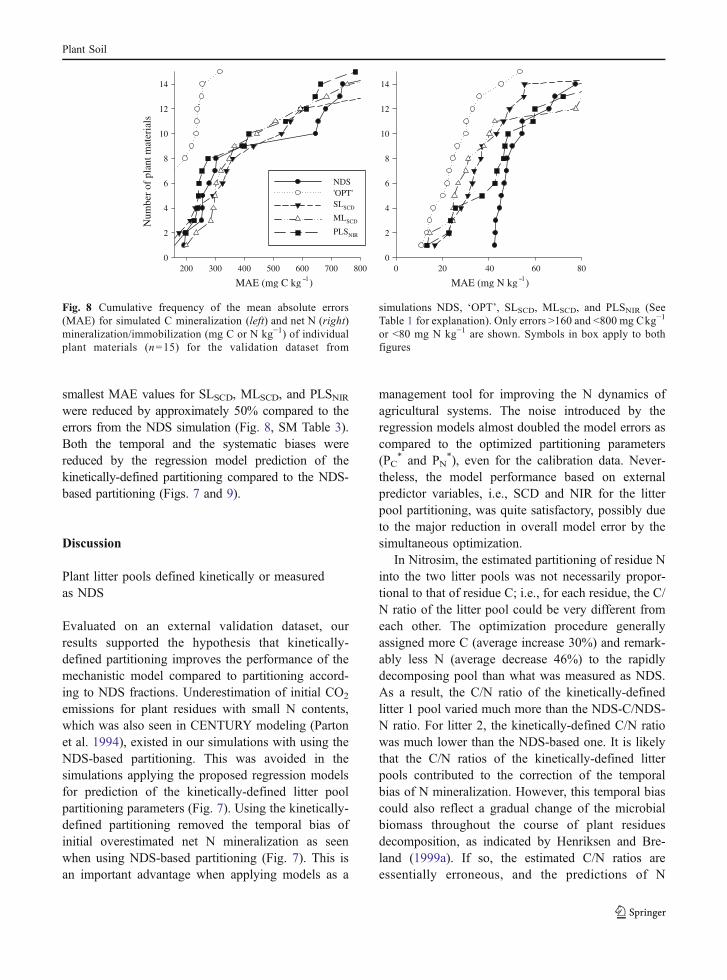
smallest MAE values for SLSCD, MLSCD, and PLSNIRwere reduced by approximately 50% compared to theerrors from the NDS simulation (Fig. 8, SM Table 3).Both the temporal and the systematic biases werereduced by the regression model prediction of thekinetically-defined partitioning compared to the NDS-based partitioning (Figs. 7 and 9).
Discussion
Plant litter pools defined kinetically or measuredas NDS
Evaluated on an external validation dataset, ourresults supported the hypothesis that kinetically-defined partitioning improves the performance of themechanistic model compared to partitioning accord-ing to NDS fractions. Underestimation of initial CO2
emissions for plant residues with small N contents,which was also seen in CENTURY modeling (Partonet al. 1994), existed in our simulations with using theNDS-based partitioning. This was avoided in thesimulations applying the proposed regression modelsfor prediction of the kinetically-defined litter poolpartitioning parameters (Fig. 7). Using the kinetically-defined partitioning removed the temporal bias ofinitial overestimated net N mineralization as seenwhen using NDS-based partitioning (Fig. 7). This isan important advantage when applying models as a
management tool for improving the N dynamics ofagricultural systems. The noise introduced by theregression models almost doubled the model errors ascompared to the optimized partitioning parameters(PC
* and PN*), even for the calibration data. Never-
theless, the model performance based on externalpredictor variables, i.e., SCD and NIR for the litterpool partitioning, was quite satisfactory, possibly dueto the major reduction in overall model error by thesimultaneous optimization.
In Nitrosim, the estimated partitioning of residue Ninto the two litter pools was not necessarily propor-tional to that of residue C; i.e., for each residue, the C/N ratio of the litter pool could be very different fromeach other. The optimization procedure generallyassigned more C (average increase 30%) and remark-ably less N (average decrease 46%) to the rapidlydecomposing pool than what was measured as NDS.As a result, the C/N ratio of the kinetically-definedlitter 1 pool varied much more than the NDS-C/NDS-N ratio. For litter 2, the kinetically-defined C/N ratiowas much lower than the NDS-based one. It is likelythat the C/N ratios of the kinetically-defined litterpools contributed to the correction of the temporalbias of N mineralization. However, this temporal biascould also reflect a gradual change of the microbialbiomass throughout the course of plant residuesdecomposition, as indicated by Henriksen and Bre-land (1999a). If so, the estimated C/N ratios areessentially erroneous, and the predictions of N
MAE (mg C kg )
200 300 400 500 600 700 800
Num
ber
of p
lant
mat
eria
ls
0
2
4
6
8
10
12
14
MAE (mg N kg )
0 20 40 60 800
2
4
6
8
10
12
14
NDS'OPT'SLSCD
MLSCD
PLSNIR
1 1
Fig. 8 Cumulative frequency of the mean absolute errors(MAE) for simulated C mineralization (left) and net N (right)mineralization/immobilization (mg C or N kg−1) of individualplant materials (n=15) for the validation dataset from
simulations NDS, ‘OPT’, SLSCD, MLSCD, and PLSNIR (SeeTable 1 for explanation). Only errors >160 and <800 mg Ckg−1
or <80 mg N kg−1 are shown. Symbols in box apply to bothfigures
Plant Soil
mineralization kinetics are thus reasonably good forwrong reasons. An alternative could be to diversifythe microbial biomass into a litter 1-consuming poolhaving a low C/N ratio and a litter 2-consuming poolhaving a higher C/N ratio (Henriksen and Breland1999b). This would contribute to removing thetemporal bias in N mineralization simulated withNDS-based partitioning and would also take accountof a possible interaction between residue C/N ratioand biomass C/N ratio (see the discussion of basicmodel assumptions below). A similar approach wasfound successful by Petersen (2007) but was aban-doned for practical reasons when implementing themodule in more comprehensive ecosystem models.
Choice of regression model for predictionof kinetically-defined litter pool partitioning
The simplest statistical models, SL, gave similarreductions in mean absolute errors of N mineraliza-
tion for both the calibration (33%) and validation(30%) data, whereas for C, only a 10% reduction forthe calibration dataset was seen (Table 1). For both Cand N mineralization, no noticeable advantage wasseen by using a multiple- instead of simple-linearregression model. Hence, including NDS-N and totalC in addition to NDS-C for prediction of bPC did notimprove model performance. We found total N to beas good as NDS-N for prediction of bPN, whichsupports the many studies relating net N mineraliza-tion primarily to total N concentration or the C/N ratio(Janssen 1996; Kumar and Goh 2003). However, aretarding effect of lignin on N release is welldocumented and lignin quality, i.e. level of conden-sation and monomers, has been proposed to explainthe difference in decomposition rates (Berg andMcClaugherty 2008; Bertrand et al. 2006). In ourstudy, there was no reduction in the errors of thesimulated mineralization of the materials high inlignin-N (>1 mg g−1DM) when adding the lignin N
y = 0.88x + 4.92R² = 0.67
-400
-300
-200
-100
0
100
200
300
400
500
600
-400 -300 -200 -100 0 100 200 300 400 500 600
PLSNIR
y = 0.69x - 1.64R² = 0.55
-400
-300
-200
-100
0
100
200
300
400
500
600
-400 -300 -200 -100 0 100 200 300 400 500 600
NDS
y = 1.05x + 29.31R² = 0.69
-400
-300
-200
-100
0
100
200
300
400
500
600
-400 -300 -200 -100 0 100 200 300 400 500 600
MLSCD
y = 0.92x + 0.82R² = 0.72
-400
-300
-200
-100
0
100
200
300
400
500
600
-400 -300 -200 -100 0 100 200 300 400 500 600
SLSCD
Obs
erve
d ne
t N m
iner
aliz
atio
n (m
g N
kg
)
Simulated net N mineralization (mg N kg )
1
1
Fig. 9 Observed versussimulated net N mineraliza-tion/immobilization of thevalidation dataset (n=15)using measured NDS-C andNDS-N directly for litterpools partitioning, andsimple-linear, multiple-linear, and PLS regressionmodels for prediction of thekinetically-defined litterpool partitioning, respec-tively, for simulationsSLSCD, MLSCD, andPLSNIR. See Table 1 andtext for further explanation.NDS: neutral detergentsoluble
Plant Soil
variable to the regression model. We conclude thatlignin does not need to be considered for estimationof the kinetically-defined N litter pools of commonagricultural plant residues. Application of the SLregression model proposed here requires plant residueanalysis of NDS-C and total N. Although extractionof NDS-C is less demanding than the extraction of allSCD fractions, it is costly and much less likely to beroutinely applied for modeling than NIR analysis.
Generally, NIR analysis produce more preciseand repeatable measurement than wet chemistry(Shepherd et al. 2005). Although in the validation,the NIR simulation was slightly better than SL andML for prediction of C mineralization, improve-ments were marginal and for N mineralization, NIRperformed slightly poorer than the other two regres-sion models. There was no obvious relationshipbetween plant biochemical compositions and largemodel errors from the NIR simulation. This studyconfirmed the well-established ability of NIR topredict plant composition and related decompositionmodel parameters (Bruun et al. 2005; Foley et al.1998; Shepherd et al. 2005; Stenberg et al. 2004).Considering the time and cost efficiency of NIRanalysis, our results advocate the use of NIR as astandard procedure for litter pool partitioning ofSOM models.
Validity of basic model concepts and parametervalues for modeling soil C and N turnover
There are three implicit assumptions in modelingplant residue mineralization by a two-litter-poolmodel optimized on global parameters and residue-specific pool partitioning: 1) plant residue decompos-ability can be expressed by two components eachhaving the same decay rate for all plant materials, 2)microbial growth yield is unaffected by the quality ofcarbon substrate and process rate, and 3) the C/N ratioof the active microbes is unaffected by substratequality (unless N assimilation is limited by availablemineral N in soil). These assumptions appearedacceptable for a majority of the plant materials,except for a few outlying residues as presented inthe exploratory optimizations. For these plant resi-dues, the exploratory optimizations could tentativelyidentify the cause of model failure as either an altereddecay rate for the easily decomposable litter fraction(kL1 reduced for wheat SP 2 and barley GL and
increased for green leaves of rape, turnip rape andwinter rye), or as an altered C/N ratio of the biomass(CNB increased from 7 to 15 for maize stems anddecreased to 5 for wheat GL 2). These alternative kL1and CNB values for individual plant residues arewithin a realistic range, but they should be taken ashypothetical explanations for model failure, whichwould require further experimental testing. In con-trast, the exploratory optimizations did not identifythe global microbial growth yield (fe=0.3) as a causeof model failure for any of the plant residues. Thisindicates that the growth yield was practicallyunaffected by the residue qualities tested, legitimizingthe use of a common growth yield for all substrates.This notion is supported by experimental evidence; arecent study showed that microbial communitiessourced from lignified and herbaceous soil habitats,were found to decompose low- and high-quality litterwith similar apparent growth yield (Strickland et al.2009). Moreover, soils with different fungal/bacterialbiomass ratio were found to decompose glucose withsimilar apparent growth yield (Thiet et al. 2006).
In summary, the exploratory simulations suggestedthat a few plant residues deviated from the rest byselectively stimulating microbes with either a highC/N ratio (15, presumably dominated by fungi) or alow C/N ratio (5, presumably dominated by bacteria),whereas the effective growth yield (as modeled) wasvery similar for all plant residues. Our value formicrobial growth yield was 0.30, which is lower thanthe range 0.45–0.60 applied in many other models(Corbeels et al. 1999; Corbeels et al. 2005; DeNeergaard et al. 2002; Henriksen et al. 2007; Muelleret al. 1997; Parton et al. 1987). There is no realconflict here; however, since the effect of fe on thesimulated C and N mineralization during residuedecomposition depends on the decay rate of thebiomass (higher biomass decay rates would demandhigher fe values). The values of the biomass decayrate (kB) of the cited papers are substantially higherthan our relatively low value of 0.002 day−1. We cantentatively identify two alternative calibration regimeshere, one operating with low fe and kB values and onewith high fe and kB values. The latter has been chosenby many authors to comply with measured microbialbiomass, but this tends to underestimate initial net Nmineralization and overestimate late N mineralizationduring litter decomposition (De Neergaard et al.2002). A solution to reducing this temporal bias in
Plant Soil
simulated biomass and net N mineralization has beento introduce a biomass pool with a lower decay rate(Henriksen and Breland 1999b), or a pool oftemporarily protected biomass residues (Mueller etal. 1997). Our lower values for this parameter set(fe and kB), appears to achieve reasonable Ndynamics for the great majority of plant residues(including those with high C/N ratios) without suchcomplicating elements. The implication of this pa-rameter set is, however, that simulated biomass ismuch higher than that normally measured by chloro-form fumigation or microscopy.
Due to the relatively short incubation period wedid not calibrate the humification coefficient (fh=0.2was used), which regulates the fraction of decayingbiomass transferred to the stable humus pool (kH=8.5×10⁻⁵). We investigated the sensitivity of themodel output to changes in this parameter. Adjustingfh up or down by 50 % had a negligible effect inmodel errors of approximately 1% of MAE for CO2
and <1 % for N (result not shown). The fact thatmodel performance was insensitive to changes in fh isof practical importance because it allows adjustmentof this parameter against long-term soil C and N datawithout deteriorating its ability to predict short term Cand N dynamics.
The experiments simulated were planned so as toensure ample mineral N contents of the soilsthroughout the incubations. Thus, microbial N assim-ilation was never limited by mineral N, and phenom-ena evoked by N limitation of microbial growth werenever encountered. Consequently, it would be mean-ingless in our case to introduce N limitation feedbackson the decomposition rates as suggested by Manzoniand Porporato (2007) and implemented in the modelof Henriksen and Breland (1999b). This is not to saythat we deny that such phenomena occur, only thatthey would not occur in our experiment.
Conclusions
The combined determination of litter pool partitioningand interrelated global parameters effectively identi-fied a set of global parameters by which the Cmineralization and N immobilization/mineralizationof a large variety of plant materials could beadequately simulated by a simple mechanistic two-litter pool model. As an alternative to this kinetic
determination of plant residue partitioning (whichrequire time-consuming incubation experiments), wefound that the partitioning could be estimated withreasonable results by regression models using moreeasily measureable variables such as near infraredanalyses (NIR) or a truncated stepwise chemicaldigestion scheme (total N and NDS-C). Therefore,we consider the developed regression models, andespecially the NIR model due to its convenient, rapidanalysis, to improve the ability for robust estimationof kinetically-defined plant litter pools in SOMmodels. Although certain plant materials posed achallenge to the simplistic model structure, mineral-ization from the vast majority of the 75 agriculturalcrop residues were simulated well by Nitrosim.
Acknowledgements We thank the collaborators of the jointNordic research project Characterization of plant residuequality for prediction of decomposition and nitrogen releasein agricultural soils for generation of the data used in this work.
References
Akaike H (1973) Information theory as an extension of themaximum likelihood principle. In: Petrov B, Csaki F (eds)Second International Symposium on Information Theory.Akademiai Kiado, Budapest
Berg B, McClaugherty C (2008) Plant litter. Decomposition,humus formation and carbon sequestration. Springer,Heidelberg, p 1
Bertrand I, Chabbert B, Kurek B, Recous S (2006) Can thebiochemical features and histology of wheat residues explaintheir decomposition in soil? Plant Soil 281:291–307
Bleken MA, Herrmann A, Haugen LE, Taube F, Bakken L(2009) SPN: A model for the study of soil-plant nitrogenfluxes in silage maize cultivation. Eur J Agron 30:283–295
Breland TA, Eltun R (1999) Soil microbial biomass andmineralization of carbon and nitrogen in ecological,integrated and conventional forage and arable croppingsystems. Biol Fertil Soils 30:193–201
Bruun S, Christensen BT, Hansen EM, Magid J, Jensen LS(2003) Calibration and validation of the soil organic matterdynamics of the Daisy model with data from the Askovlong-term experiments. Soil Biol Biochem 35:67–76
Bruun S, Stenberg B, Breland TA, Gudmundsson J, HenriksenTM, Jensen LS, Korsaeth A, Luxhoi J, Palmason F,Pedersen A, Salo T (2005) Empirical predictions of plantmaterial C and N mineralization patterns from nearinfrared spectroscopy, stepwise chemical digestion andC/N ratios. Soil Biol Biochem 37:2283–2296
Burnham K, Anderson D (2002) Model selection and multi-model inference. Springer, New York
Chesson A (1997) Plant degradation by ruminants: parallelswith litter decomposition in soils. In: Cadish G, Giller K
Plant Soil
(eds) Driven by nature: plant litter quality and decompo-sition. CAB International, Oxon
Coleman K, Jenkinson DS, Crocker GJ, Grace PR, Klir J,Korschens M, Poulton PR, Richter DD (1997) Simulatingtrends in soil organic carbon in long-term experimentsusing RothC-26.3. Geoderma 81:29–44
Corbeels M, Hofman G, Van Cleemput O (1999) Simulation ofnet N immobilisation and mineralisation in substrate-amended soils by the NCSOIL computer model. BiolFertil Soils 28:422–430
Corbeels M, McMurtrie RE, Pepper DA, O’Connell AM (2005)A process-based model of nitrogen cycling in forestplantations Part I. Structure, calibration and analysis ofthe decomposition model. Ecol Model 187:426–448
De Neergaard A, Hauggaard-Nielsen H, Jensen LS, Magid J(2002) Decomposition of white clover (Trifolium repens)and ryegrass (Lolium perenne) components: C and Ndynamics simulated with the DAISY soil organic mattersubmodel. Eur J Agron 16:43–55
Foley WJ, McIlwee A, Lawler I, Aragones L, Woolnough AP,Berding N (1998) Ecological applications of near infraredreflectance spectroscopy a tool for rapid, cost-effectiveprediction of the composition of plant and animal tissuesand aspects of animal performance. Oecologia 116:293–305
Franko U, Oelschlagel B, Schenk S (1995) Simulation oftemperature, water and nitrogen dynamics using the modelcandy. Ecol Model 81:213–222
Gillon D, Houssard C, Joffre R (1999) Using near-infraredreflectance spectroscopy to predict carbon, nitrogen andphosphorus content in heterogeneous plant material.Oecologia 118:173–182
Hastings A, Arzberger P, Bolker B, Collins S, Ives AR,Johnson N, Palmer M (2005) Quantitative bioscience forthe 21st century. Bioscience 55:511–517
Henriksen TM, Breland TA (1999a) Evaluation of criteria fordescribing crop residue degradability in amodel of carbon andnitrogen turnover in soil. Soil Biol Biochem 31:1135–1149
Henriksen TM, Breland TA (1999b) Nitrogen availabilityeffects on carbon mineralization, fungal and bacterialgrowth, and enzyme activities during decomposition ofwheat straw in soil. Soil Biol Biochem 31:1121–1134
Henriksen TM, Korsaeth A, Breland TA, Stenberg B, JensenLS, Bruun S, Gudmundsson J, Palmason F, Pedersen A,Salo T (2007) Stepwise chemical digestion, near-infraredspectroscopy or total N measurement to take account ofdecomposability of plant C and N in a mechanistic model.Soil Biol Biochem 39:3115–3126
Janssen B (1996) Nitrogen mineralization in relation to C:N ratioand decomposability of organic amterials. Plant Soil 181:39–45
Jensen LS, Salo T, Palmason F, Breland TA, Henriksen TM,Stenberg B, Pedersen A, Lundstrom C, Esala M (2005)Influence of biochemical quality on C and N mineralisa-tion from a broad variety of plant materials in soil. PlantSoil 273:307–326
Joffre R, Agren GI, Gillon D, Bosatta E (2001) Organic matterquality in ecological studies: theory meets experiment.Oikos 93:451–458
Johnsson H, Bergstrom L, Jansson PE, Paustian K (1987)Simulated nitrogen dynamics and losses in a layeredagricultural soil. Agric Ecosyst Environ 18:333–356
Kumar K, Goh K (2003) Nitrogen release from crop residuesand organic amendments as affected by biochemicalcomposition. Commun Soil Sci Plant Anal 34:2441–2460
Levins R (1966) Strategy of model building in populationbiology. Am Sci 54:421–431
Li CS, Frolking SE, Harriss RC, Terry RE (1994) Modelingnitrous-oxide emissions from agriculture—a Florida case-study. Chemosphere 28:1401–1415
Manzoni S, Porporato A (2007) Theoretical analysis ofnonlinearities and feedbacks in soil carbon and nitrogencycles. Soil Biol Biochem 39:1542–1556
Mertens DR, Allen M, Carmany J, Clegg J, Davidowicz A,Drouches M, Frank K, Gambin D, Garkie M, GildemeisterB, Jeffress D, Jeon CS, Jones D, Kaplan D, Kim GN,Kobata S, Main D, Moua X, Paul B, Robertson J, TaysomD, Thiex N, Williams J, Wolf M (2002) Gravimetricdetermination of amylase-treated neutral detergent fiber infeeds with refluxing in beakers or crucibles: collaborativestudy. J AOAC Int 85:1217–1240
Minderman G (1968) Addition, decomposition, and accumula-tion of organic matter in forests. J Ecol 56:355–362
Mueller T, Jensen LS, Magid J, Nielsen NE (1997) Temporalvariation of C and N turnover in soil after oilseed rapestraw incorporation in the field: simulations with the soil-plant-atmosphere model DAISY. Ecol Model 99:247–262
Myers R, van Nordwijk M, Vityakon P (1997) Synchrony ofnutrients release and plant demand: plant litter quality, soilenvironment and farmer management options. In: CadishG, Giller K (eds) Driven by nature: plant litter quality anddecomposition. CAB International, Oxon
Nicolardot B,Molina JAE (1994) C andN fluxes between pools ofsoil organic-matter—model calibration with long-term fieldexperimental-data. Soil Biol Biochem 26:245–251
Nicolardot B, Recous S, Mary B (2001) Simulation of C and Nmineralisation during crop residue decomposition: asimple dynamic model based on the C: N ratio of theresidues. Plant Soil 228:83–103
Norvig P (1992) Paradigms of artificial intelligence programming:case studies in common lisp. Kaufmann, San Francisco
Pansu M, Thuries L, Larre-Larrouy MC, Bottner P (2003)Predicting N transformations from organic inputs in soil inrelation to incubation time and biochemical composition.Soil Biol Biochem 35:353–363
Parton W, Schimel D, Cole C, Ojima D (1987) Analysis offactors controlling soil organic matter levels in GreatPlains grasslands. Soil Sci Soc Am J 51:1173–1179
Parton WJ, Ojima DS, Cole CV, Shimel DS (1994) A generalmodel for soil organic matter dynamics: sensitivity to litterchemistry, texture and management. In: Bryant RB,Arnold RW (eds) Quantitative modeling of soil formingprocesses. Soil Science Society of America, Madison
Pasquini C (2003) Near infrared spectroscopy: fundamentals,practical aspects and analytical applications. J Braz ChemSoc 14:198–219
Paustian K, Ågren G, Bosaata E (1997) Modelling litter qualityeffects on decomposition and soil organic matter dynam-ics. In Driven by nature. Plant litter quality and decom-position. CAB International, Wallingford
Petersen BM (2007) Modelling organic matter turnover inagricultural soils. PhD Thesis. University of Copenhagenand Aarhus
Plant Soil
Probert ME, Delve RJ, Kimani SK, Dimes JP (2005) Modellingnitrogen mineralization from manures: representing qualityaspects by varying C: N ratio of sub-pools. Soil BiolBiochem 37:279–287
Quemada M, Cabrera ML (1995) Ceres-N model predictions ofnitrogen mineralized from cover crop residues. Soil SciSoc Am J 59:1059–1065
SAS Institute Inc (1989) SAS/STAT® User’s Guide. SAS InstituteInc
Seneviratne G (2000) Litter quality and nitrogen release intropical agriculture: a synthesis. Biol Fertil Soils 31:60–64
Shepherd KD, Vanlauwe B, Gachengo CN, Palm CA (2005)Decomposition and mineralization of organic residuespredicted using near infrared spectroscopy. Plant Soil277:315–333
Stenberg B, Jensen LS, Nordkvist E, Breland TA, Pedersen A,Gudmundsson J, Bruun S, Salo T, Palmason F, HenriksenTM, Korsaeth A (2004) Near infrared reflectancespectroscopy for quantification of crop residue, green
manure and catch crop C and N fractions governingdecomposition dynamics in soil. J Near Infrared Spec-trosc 12:331–346
Strickland MS, Osburn E, Lauber C, Fierer N, Bradford MA(2009) Litter quality is in the eye of the beholder: initialdecomposition rates as a function of inoculum character-istics. Funct Ecol 23:627–636
Swift M, Heal O, Anderson J (1979) Decomposition interrestrial ecosystems. Blackwellm, Norfolk
Thiet RK, Frey SD, Six J (2006) Do growth yield efficienciesdiffer between soil microbial communities differing infungal: bacterial ratios? Reality check and methodologicalissues. Soil Biol Biochem 38:837–844
Van Soest P, Robertson J, Lewis B (1991) Symposium:carbohydrate methodology, metabolism, and nutritionalimplications in dairy cattle. J Dairy Sci 74:3583–3597
Vold A, Breland TA, Søreng JS (1999) Multiresponse estima-tion of parameter values in models of soil carbon andnitrogen dynamics. J Agr Biol Envir St 4:290–309
Plant Soil