Embed Size (px)
Citation preview
ESTIMATION OF PLACENTA FUNCTION USING T2* MEASUREMENTS DURING HYPER- AND NORMOXIA
May 9th, 12 am, Computer no 73
Mother + O2 maskMother w/o mask
4142
0 10 20 30 100
40 50 60 70 80 90
ESTIMATION OF PLACENTA FUNCTION USING T2* MEASUREMENTS DURING
HYPER- AND NORMOXIA
4142
• David Alberg Peters • Department of Clinical Engineering, Central Denmark Region, Aarhus,
Denmark• [email protected]
• Anne Sørensen• Department of Obstetrics and Gynecology, Aarhus University, Aalborg
Hospital, Denmark
• Torben Fründ• Department of Radiology, Aarhus University, Aalborg Hospital,
Denmark
• Ole Bjarne Christiansen• Department of Obstetrics and Gynecology, Aarhus University, Aalborg
Hospital, Denmark
• Niels Uldbjerg• Department of Obstetrics and Gynecology, Aarhus University
Hospital, Denmark.
May 9th, 12 am, Computer no 73
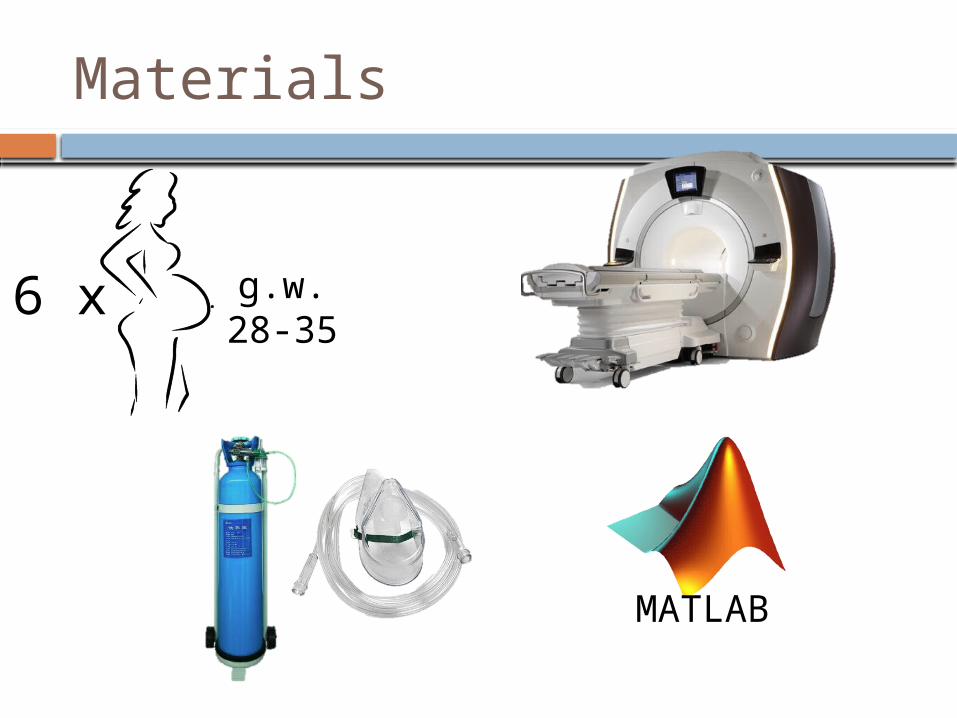
Materials
6 x g.w.28-35
MATLAB
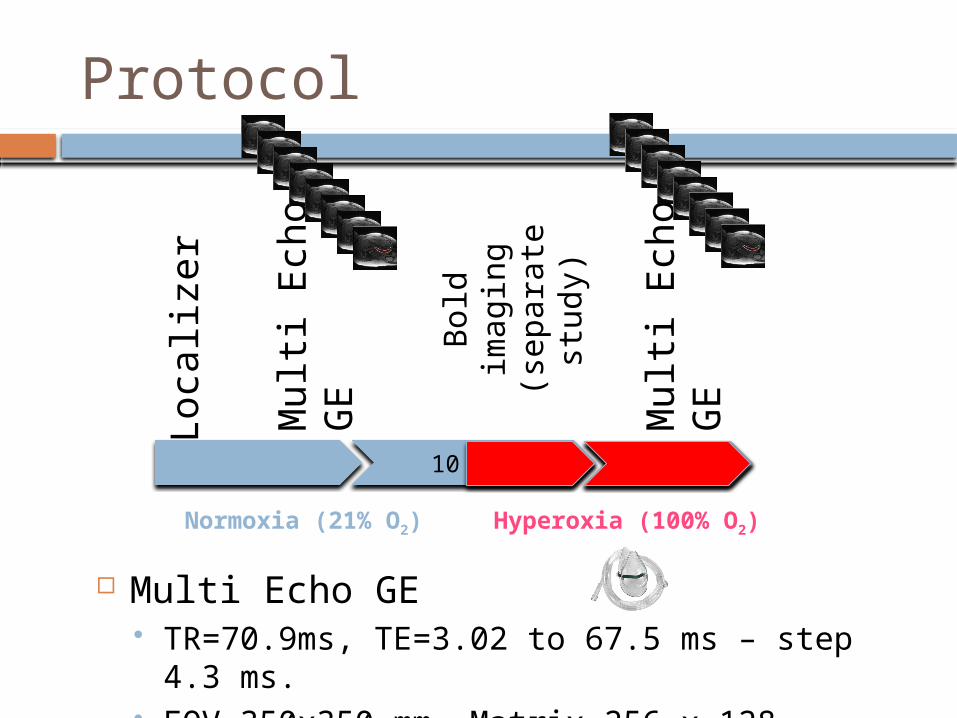
Protocol
Loca
lizer
Mult
i Ech
o
GE
10 min
Mult
i Ech
o
GEBold
im
ag
ing
(sep
ara
te
stu
dy)
Multi Echo GE TR=70.9ms, TE=3.02 to 67.5 ms – step 4.3
ms. FOV 350x350 mm, Matrix 256 x 128, Three 8
mm slices
Normoxia (21% O2) Hyperoxia (100% O2)
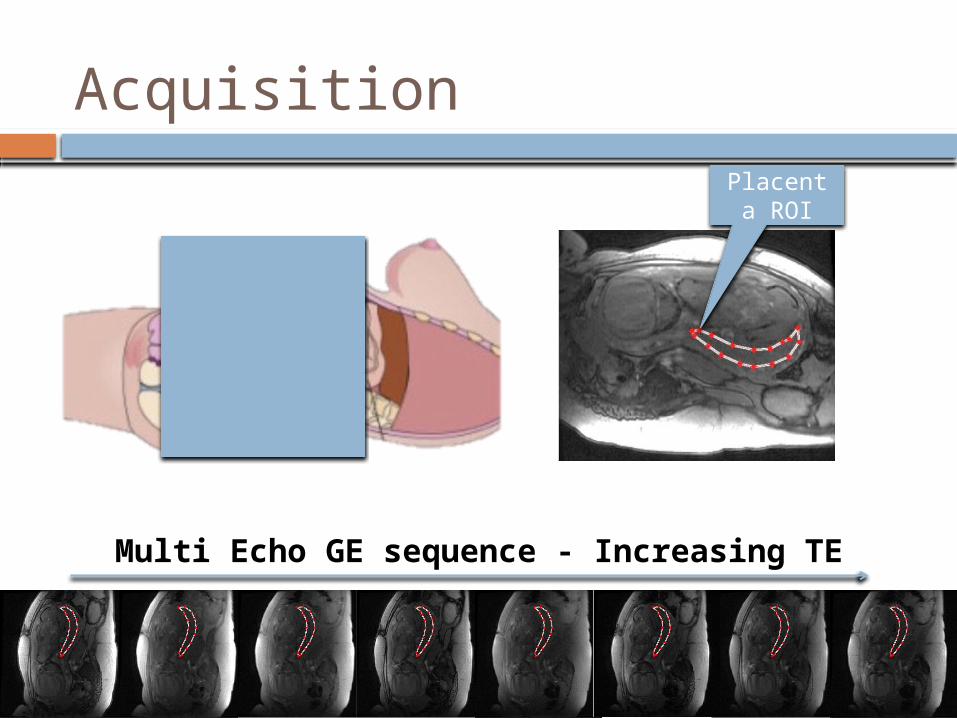
Acquisition
Multi Echo GE sequence - Increasing TE
Placenta ROI
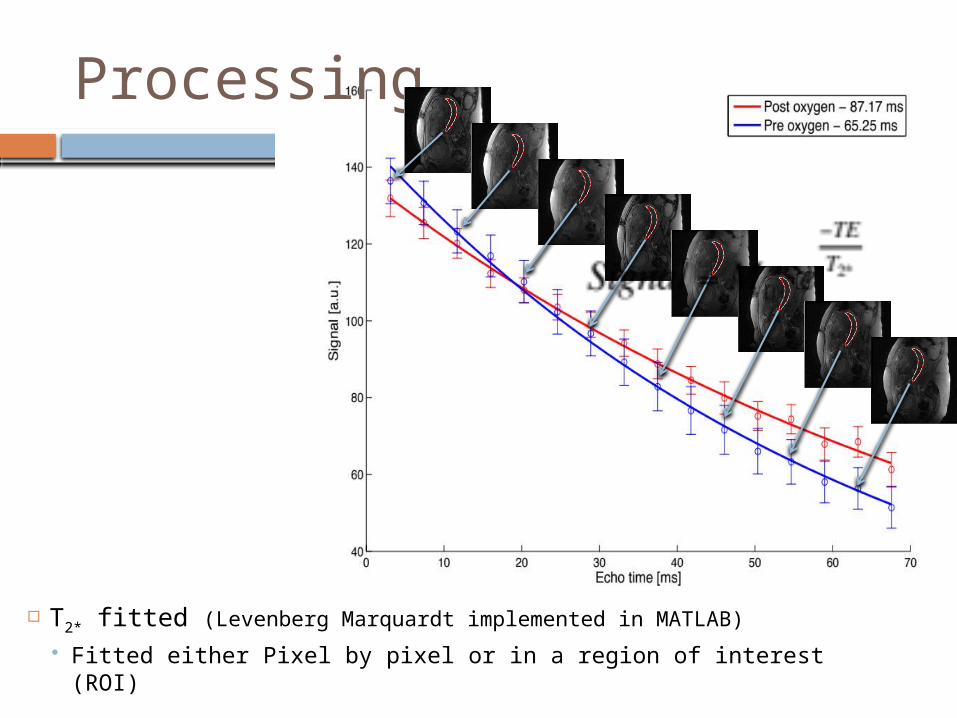
Processing
T2* fitted (Levenberg Marquardt implemented in MATLAB)
Fitted either Pixel by pixel or in a region of interest (ROI)
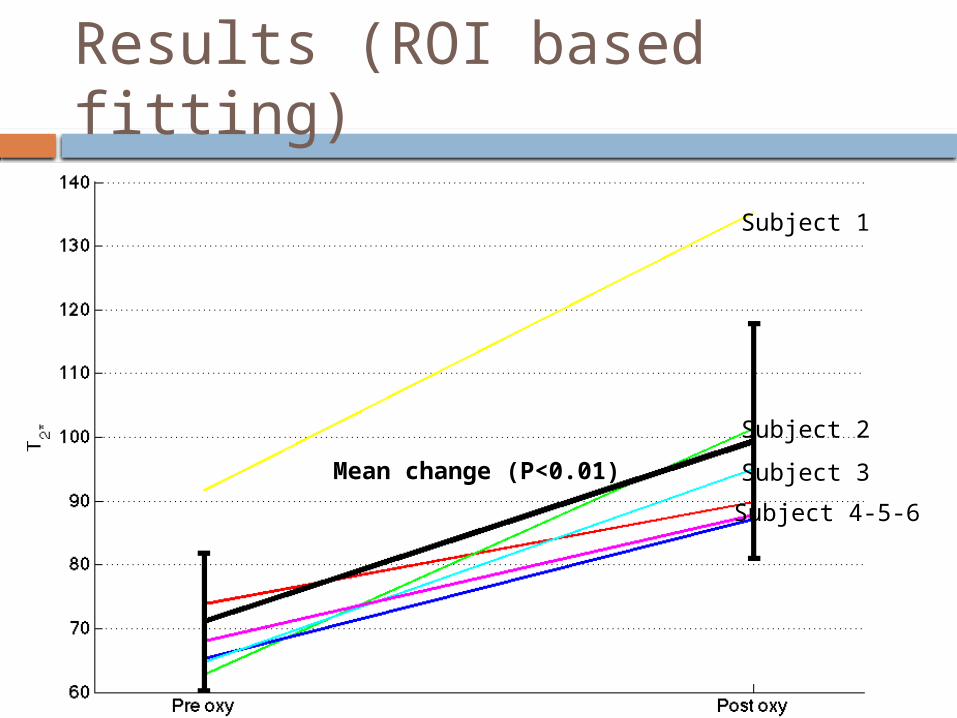
Results (ROI based fitting)
Subject 1
Subject 2
Subject 3
Subject 4-5-6
Mean change (P<0.01)
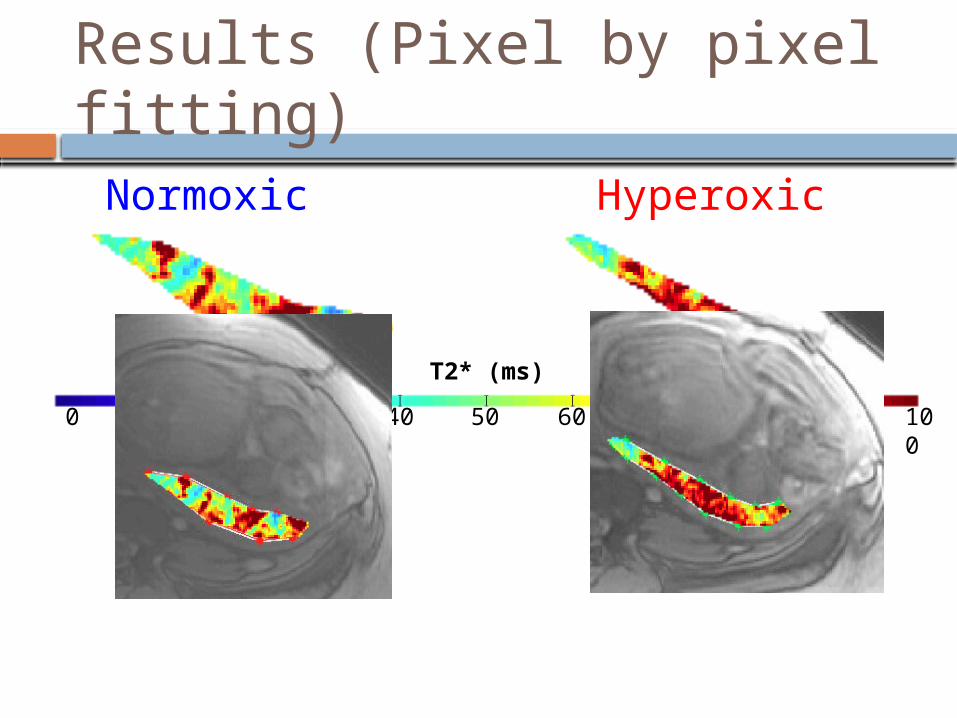
Results (Pixel by pixel fitting)
0 10 20 30 100
40 50 60 70 80 90
Normoxic Hyperoxic
T2* (ms)
Conclusion
T2* increases significantly in the placenta when the mother breathes oxygen
The change in T2* is inhomogeneously distributed in the placenta
The change in T2* is most likely caused by a change in the pO2 of the blood in placenta
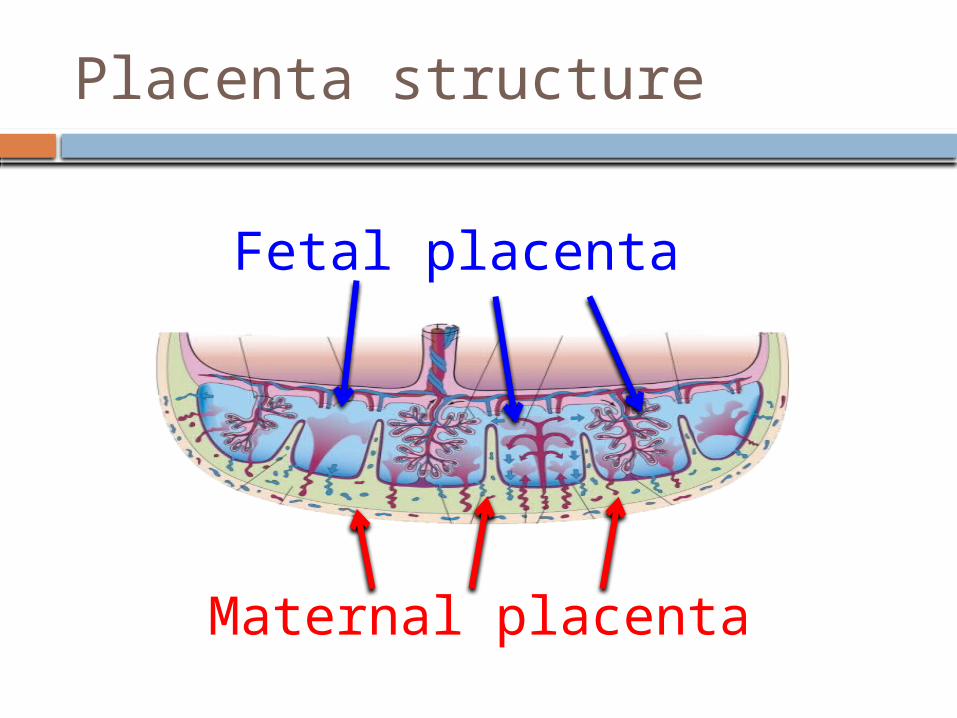
Placenta structure
Fetal placenta
Maternal placenta
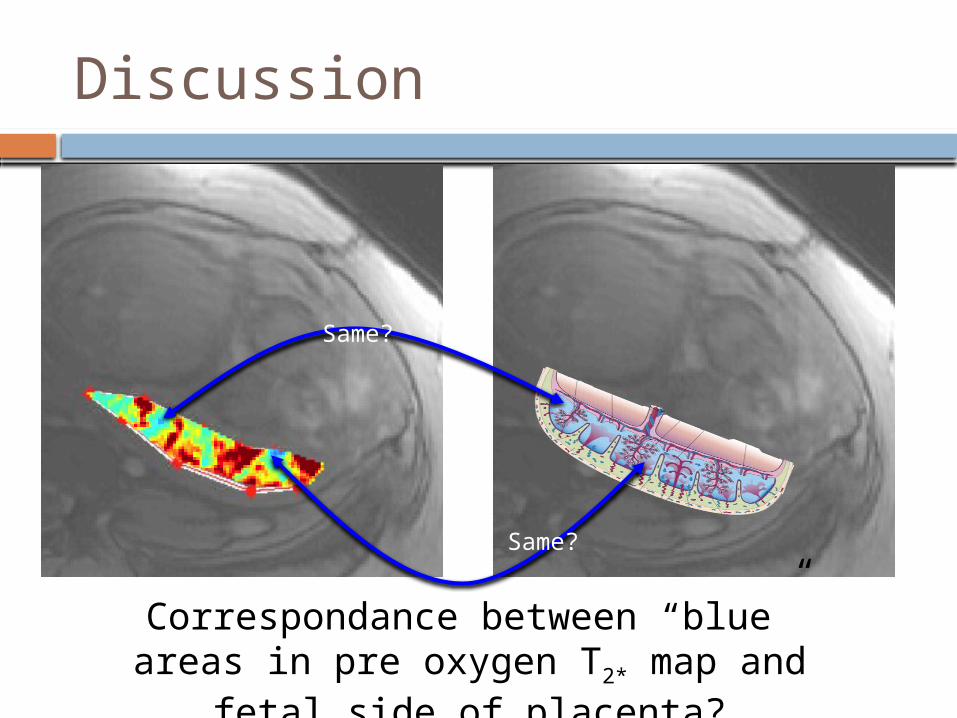
Discussion
Correspondance between “blue” areas in pre oxygen T2* map and fetal side of
placenta?
Same?
Same?
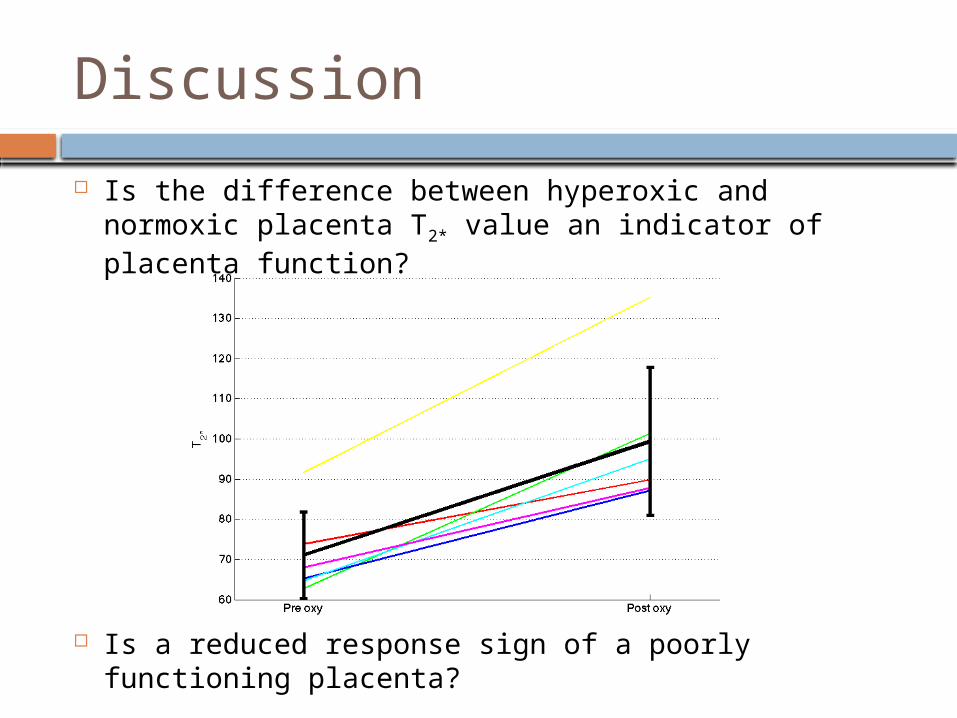
Discussion
Is the difference between hyperoxic and normoxic placenta T2* value an indicator of placenta function?
Is a reduced response sign of a poorly functioning placenta?