Embed Size (px)
Citation preview

This file has been cleaned of potential threats.
If you confirm that the file is coming from a trusted source, you can send the following SHA-256
hash value to your admin for the original file.
9084fa3878e39ac885ccf7c98eface8c0764bf5e921f3d752c0abef40fe9fac7
To view the reconstructed contents, please SCROLL DOWN to next page.

Sadhana Vol. 35, Part 3, June 2010, pp. 373–392. © Indian Academy of Sciences
Estimation of permanent displacements of the Tehri dam inthe Himalayas due to future strong earthquakes
ANIRUDDHA SENGUPTA
Department of Civil Engineering, Indian Institute of Technology,Kharagpur 721 302, West Bengale-mail: [email protected]
MS received 14 January 2001; revised 9 December 2009; accepted 1 May 2010
Abstract. The objective of this paper is to estimate permanent displacementsof Tehri dam due to an earthquake of magnitude Mw = 8·5, the occurrence ofwhich has a high probability in the region, and for an earthquake of magnitudeMw = 7·0, for which the dam has been currently designed. A two-dimensionalfinite element analysis and five different semi-empirical and empirical methods,like, Seed and Makdisi’s method, Newmark’s double integration method, Jansen’smethod, Swaisgood’s method and Bureau’s method have been utilized to study theprobable dynamic behaviour of the dam and their results are compared to get a rangeof values within which, the permanent displacement of the dam, is estimated tolie. The present study shows that the predicted displacements due to an earthquakeof magnitude Mw = 7·0 are significant but not enough to compromise the safetyof the dam. However, the displacements predicted for an earthquake of magnitudeMw = 8·5 are quite high and might cause rupture of filter zones. The maximumdeformations (755 cm for Mw = 8·5 and 43 cm for Mw = 7·0) are predicted bySeed and Makdisi’s method while the minimum deformations (14 cm for Mw = 8·5and 2·5 cm for Mw = 7·0) are computed by Jansen’s method.
Keywords. Tehri dam; dynamic behaviour; displacement; earthquake; finiteelement analysis.
1. Introduction
Estimating permanent displacements that an earthen/rockfill embankment dam will undergoduring an earthquake shaking is a very difficult task. The effort is made more difficult by themyriad of factors that are involved and lack of reliable field data. The ground vibrations at a siteare unique to the particular earthquake causing them and to the site-specific conditions existingat the dam. The characteristics of a dam, such as, type of construction, structural height,upstream and downstream reservoir levels affect the response of the structure (USBR, 1989).Significant amount of work has been done over the years towards understanding the seismicbehaviour of earth and rockfill dams starting with the fifth Rankine lecture by Newmark(Newmark 1965). Newmark (1965) and Seed (1966) were the first to propose methods of
373

374 Aniruddha Sengupta
analysis for predicting the permanent displacements of dams subjected to earthquake shaking.Seed & Martin (1966), Ambraseys & Sarma (1967), Lin & Whitman (1983) used shear beamanalysis to study the dynamic response of embankment dams. The failure of Sheffield Dam(Seed et al 1969) and San Fernando Dam (Seed 1973) prompted Seed and other researchersto further review and modify the Newmark’s method to study seismic stability of earth androckfill dams (Sarma 1975; Serff et al 1976; Makdisi & Seed 1978; Seed 1979; Seed 1981;Romo & Resendiz 1981; Resendiz & Romo 1982; Abdel-Ghaffar & Scott 1978; Abdel-Ghaffar & Scott 1979; Lin & Whitman 1986; Elgamal et al 1990; Yan 1991; Gazetas &Dakoulas 1992; Bray & Travasarou 2007). Newmark treated the sliding mass as a rigid body.However, Seed and other researchers recognized that an embankment dam responds as aflexible structure and introduced a technique to estimate the amplification of ground motionsto the crest of the dam. The analysis is then based on estimating the maximum peak crestacceleration and maximum acceleration of the potentially sliding mass. From where, yieldacceleration of the sliding mass and ultimately displacement of the crest of the dam areestimated. Around the same time, some of the researchers (Jansen 1990; Swaisgood 1995;Bureau 1997) were trying to tackle the problem from a completely different angle. Theirmethods are empirical in nature and based on statistical analyses of data from a limited numberof failure case histories. These methods are very simplistic in nature and often used by damdesigners to gain confidence about the results obtained from more rigorous analyses. With theadvent of fast computers and significant progress in nonlinear material modelling and testing,the embankment dams are increasingly being studied by finite element and finite differencemethods with advanced nonlinear material models (Zienkiewicz et al 1980; Vrymoed 1981;Mejia et al 1982; Prevost et al 1985; Gazetas & Uddin 1994; Martin et al 1993; Martin &Sengupta 1994; Sengupta & Martin 1996; Sengupta & Martin 1997; Li et al 2008). In somecases, experts (Mejia & Seed 1983; Elgamal & Abdel-Ghaffar 1987; Gazetas & Dakoulas1992; Papalou & Bielak 2004) have even recommended three-dimensional analysis to includeeffects of canyon, and other site-specific geometric irregularities on the dynamic stability ofa dam. The sophisticated analytical tools, like boundary elements, finite element and finitedifference methods are the most recommended method. However, realistic deformation valuesmay be expected from such advanced analyses only when the material models and the materialparameters are capable of accurately simulating real life scenario. Though significant progresshas been made in modelling material behaviour still most of the material models performpoorly when comes to reality check. Though three-dimensional analyses are very commonin concrete dams, it is not that often done for earth and rockfill dams. The reason is that thesenatural materials are highly nonhomogeneous in nature. Their properties depend on lift size,water content, compaction effort, etc., which often can not be properly quantified. Also oftenthe exact direction of the ground motion in case of a future earthquake can not be properlydetermined in a dam which has not previously experienced any such event. Even with allthese limitations, dynamic finite element analysis of embankment dam is recommended forproper evaluation of its seismic safety.
In order to meet the huge demand for power by the industries and ever increasing population,several hydro-power projects are coming up in the Himachal Pradesh, Sikkim, Bhutan andAssam. Thus there is a good reason to have a fresh look into the Himalayan seismicity andthe performance of these new as well as old dams located in the Himalaya regions. This paperreviews some of the simplified methods to estimate seismic displacements of a high rockfilldam and compares their performance with that obtained from a 2-D nonlinear finite elementanalysis. In this study a high rockfill dam, called Tehri dam nested in the Garhwal Himalayais chosen. The earthquake-induced displacement of the dam is studied by various established

Permanent displacement of Tehri dam 375
Figure 1. Typical cross-section of Tehri dam.
methods when subjected to two hypothetical earthquakes, one with magnitude (Mw) 7·0 andpeak ground acceleration (PGA) of 0·23 g and another with magnitude (Mw) 8·5 and PGAof 0·45 g.
2. Tehri dam
The Tehri dam is located at 30◦28′ North and 78◦30′ East, very near the town of Tehri inthe Garhwal region of Uttaranchal in India. The rockfill dam is built on the Bhagirathi River,which flows in a deep, nearly triangular canyon at the site. The dam, conceived in 1949 andsanctioned in 1972, is the fifth highest dam in the world. It is 260·5 m in height at the deepestpoint. The crest is 20 m wide and spans 574 m across the valley. The base width of the damin upstream–downstream direction is nearly 1 kilometer. A 9·5 m of freeboard is provided atthe crest. The upstream slope of the dam is 2·5(H):1(V). The downstream slope is 2(H):1(V).The rockfill dam has an inclined impervious core made of clayey materials and upstream-downstream shells of graded gravel topped with blasted rocks. A detail description of the damis given by Thatte (Thatte 1992). Figure 1 shows a typical cross-section of the dam assumedin the present analyses. The locations of the slide surfaces are shown in figure 2. Almost nopublished information is available on the in situ strengths of the dam materials. Based on pastexperiences of similar dams and the description of the dam materials given by Thatte, thein situ drained strengths of the dam materials have been estimated. The nonlinear properties(shear modulus and damping) of the dam materials utilized for the shear beam analyses areadopted from Seed et al (1986). Table 1 shows the drained strengths of the dam materialsassumed in the present analyses.
3. Seismicity at Tehri dam
A number of large magnitude (Mw > 7) earthquakes have occurred along the Himalayanmountain belt, four of which (1897 Assam earthquake (MS > 8·7), 1905 Kangra earthquake
Figure 2. Location of U/s and D/s failure surfaces.

376 Aniruddha Sengupta
Table 1. Material strength parameters.
Densities in t/m3
Zones of dam Moist Saturated Cohesion, c′ Friction Angle, φ′
U/S Rock fill 1·92 2·16 0·00 40·00D/S Rock fill 2·08 2·24 0·00 35·00Core 1·86 2·00 0·00 30·00Rock, Weather Rock 2·30 0·00 45·00
(MS > 8·6), 1934 Bihar earthquake (MS = 8·4) and 1950 Assam earthquake (MS = 8·7))had magnitude greater than 8 (Richter 1958). Many eminent researchers in this field (Khattri1993; Bilham & Szeliga 2008; Feldl & Bilham 2006; Rajendran & Rajendran 2005) believethat strain is persistently building up along the Himalayan collision arc by the convergence ofthe Indian and Asian plates. This strain is released by great earthquakes only. However, the fourgreat earthquakes in the past have ruptured only 200 to 450 km of the plate boundary, leavingunruptured sections in between called seismic gaps. The unruptured section of Himalayabetween the rupture zones of Kangra & Bihar earthquakes is called central Himalayan seismicgap. The Tehri dam is located within this seismic gap. There has been considerable controversyconcerning the seismic intensity to which the Tehri dam may be subjected to as no greatearthquake have occurred in this gap region within the past 200 years (Gaur 1993; Iyengar1993). The above researchers believe that the earthquakes in the past two centuries have notbeen representative of infrequent great (Mw > 8) plate boundary event that could occur. It isreasoned that recent earthquakes may have responded to different elastic driving forces fromthose that drove the mega quakes of medieval times. It is suspected that an alternate source ofenergy to cause a great earthquake exists in the form of elastic and gravitational energy andis stored in flexure of the Indian plate, and is now sufficiently mature to sustain a mega quakeof Mw > 8 (Ambraseys & Jackson 2003; Ambraseys & Bilham 2000).
In this paper, the seismic behaviour of the Tehri dam has been studied for two earthquakemotions. The first one is an Mw = 7, PGA = 0·23 g earthquake for which the dam has beendesigned (Thatte 1992). The second motion is for an Mw = 8·5, PGA = 0·45 g hypotheticalearthquake. This second motion represents MCE of the region according to some experts andinitially recommended by THDC (1990) and High Level Committee of Experts (1990). Thereare considerable controversies between the experts regarding the validity of these motions.The proper way of coming up with a motion is to establish seismic sources within 500 kmand their maximum potential, and perform probabilistic seismic hazard analysis. But this isneither the objective nor within the scope of the present work.
4. Selection of response spectra and ground motion for present study
In absence of any site-specific data, the response spectra and the corresponding groundmotions for the Tehri dam design were developed synthetically. These are given by Thatte(1992) and Finn (1993). In the present study, the artificially generated response spectra givenby Thatte (1992) have been utilized for the simplified analyses. Figure 3 shows the responsespectra corresponding to 5%, 7%, 10%, and 15% damping and scaled to 0·23 g PGA. Forthe 0·45 g, the same response spectra have been arithmetically scaled to 0·45 g. One of the

Permanent displacement of Tehri dam 377
Figure 3. Design response spectra for 0·23 g PGA at 5, 7, 10 and 15% of critical damping.
advantages of using the same response spectra as those proposed by Thatte is that the dis-placements from the present study can be compared with the past theoretical study reportedby him (Thatte 1992).
The finite element study of the dam requires a representative ground motion to be specified.In absence of any data from the region, Thatte (1992) and Finn (1993) have utilized artificialground motion. In the present study, a number of earthquake motions are reviewed and09/19/1985 Michoacan Mexico City Earthquake (Mw = 7·6, PAPANOA, N90W component)motion is selected based on its PGA, frequency content, focal depth, etc. The selected motionis a far field rock motion with focal depth of 20 km and epicentral distance of 83 km. Most ofthe Himalayan earthquakes have similar shallow focal depth (Khattri 1993). The maximumacceleration, a, maximum velocity, v, maximum displacement, d , and predominant periodare 221·96 cm/s2, 5·01 cm/s, 0·62 cm, and 0·14 s, respectively for the selected motion. Thus,the value of v2/ad is given by 0·18 which lies between 0·06 and 0·4 as recommended byNewmark (1965). The value of v/a is found to be 0·023 which is less than 0·1, confirmingthat it is a rock motion (Newmark 1965). Figure 4 shows a comparison between the responsespectra (at 0% damping) of the selected motion and that given by Thatte (1992). The figurealso confirms suitability of the selected motion for the present case. The selected motion isarithmetically scaled to 0·45 g to study dam behaviour during a Mw = 8·5 earthquake.
5. Response spectra analyses of Tehri dam
Earth dams are large 3-D structures constructed from inelastic and non-homogeneous materi-als. Consequently, the computation of natural frequencies and modes of vibration is extremelydifficult and as a result, existing theories and analyses of earth dams make many simplifyingassumptions (Abdel-Ghaffar & Scott 1978). The approach selected for this study consistedof performing a response spectrum analysis of the dam modelled as a shear beam with vari-able stiffness (triangular shape). The assumed response spectra at 5%, 7%, 10% and 15% ofcritical damping for the Mw = 7, PGA = 0·23 g earthquake are taken from Thatte (1992)and shown in figure 3. The response spectra for the Mw = 8·5, PGA = 0·45 g earthquake are

378 Aniruddha Sengupta
Figure 4. Comparison of response spectra given by Thatte (1992) and that of Michoacan earthquakeof 1985.
Figure 5. Dependency of stiffness and damping of gravelly soils on strain level (Seed et al 1986).

Permanent displacement of Tehri dam 379
Table 2. Results of response spectrum analysis.
Magnitude of earthquake (Mw)
7·0 8·5Maximum crest acceleration, amax 0·62 g 0·96 gPredominant period, To 1·10 sec 1·10 secAverage equivalent strain 0·015% 0·03%Strain compatible damping 8% 9 %
obtained by arithmetic scaling of the same spectral acceleration for the 0·45 g PGA. The straindependency of stiffness and damping of soils causes nonlinearity between the level of exci-tation and the level of dynamic response. The shear beam procedure is adopted for the dammaterials (rockfill) by following an equivalent linear approach that amounts to calculatingdynamic soil properties iteratively until those properties are compatible with the calculatedstrain level. The curves used in the analysis to characterize the dependency of stiffness anddamping of gravelly materials on strain level are proposed by Seed et al (1986) and shownin figure 5. Convergence to strain-compatible properties of the constitutive dam materials isachieved within two and three cycles of iterations for the 7·0 and 8·5 magnitude earthquakes,respectively. The results of the response spectrum analyses for the two selected earthquakemotions in terms of maximum crest acceleration, natural period of the dam and strain com-patible damping are shown in table 2. The amplification of the motion through the dam isfound to be 2·69 for Mw = 7 and 2·1 for the Mw = 8·5 earthquakes.
6. Determination of permanent displacements by simplified method
6.1 Seed and Makdisi’s method
The simplified procedure developed by Makdisi & Seed (1978) follows the premise thatpermanent displacements take place whenever the rigid body acceleration, Kmax, of a potentialsliding mass exceeds the yield acceleration, Ky , for that mass. The yield acceleration isdetermined by performing a series of pseudo-static analyses. Makdisi and Seed have relatedthe rigid body acceleration for various sliding masses to the peak acceleration at the crestof the dam and to the depth of the sliding mass. Once the yield accelerations have beendetermined, the permanent displacements, U , for a given ratio of Ky/Kmax, can be obtained,since it is only a function of the magnitude of the earthquake, the fundamental period of thedam and the rigid body acceleration.
The yield acceleration, Ky is defined as that average acceleration which produces a hori-zontal inertia force on a potential sliding mass to yield a factor of safety of unity and thuscausing it to experience permanent displacements. Yield accelerations are determined for threepotential sliding masses on the upstream slope and three sliding masses on the downstreamslope of Tehri dam. The locations of the slide surfaces are shown in figure 2. The upstreamand downstream water levels are assumed at 830 m (maximum normal operating pool) and594 m, respectively during an earthquake. The strength parameters for the dam and foundationmaterials for the stability analyses are given in table 1. The stability analyses are performedaccording to Simplified Bishop’s method. Table 3 summarizes the results of the static stabilityanalysis and the values of yield acceleration, Ky for all the six cases.

380 Aniruddha Sengupta
Table 3. Yield accelerations.
Factor of safety Yield acceleration (Ky)Zones of dam Location of surface (FS) in static case corresponding to a FS of 1
Downstream 1/3 height 1·61 0·225Slope 2/3 height 1·51 0·191
Full height 1·49 0·182Upstream 1/3 height 2·37 0·281Slope 2/3 height 2·47 0·255
Full height 2·35 0·228
Makdisi and Seed showed that a unique relationship exists between the yield acceleration,Ky , the depth of slip surface, y/h, and the ratio of the maximum rigid body acceleration,Kmax to the maximum crest acceleration, amax. The relationship shown in figure 6 is usedto determine the values of, Kmax, for each sliding mass under the design motion. The upperbound curve is utilized in the present analysis.
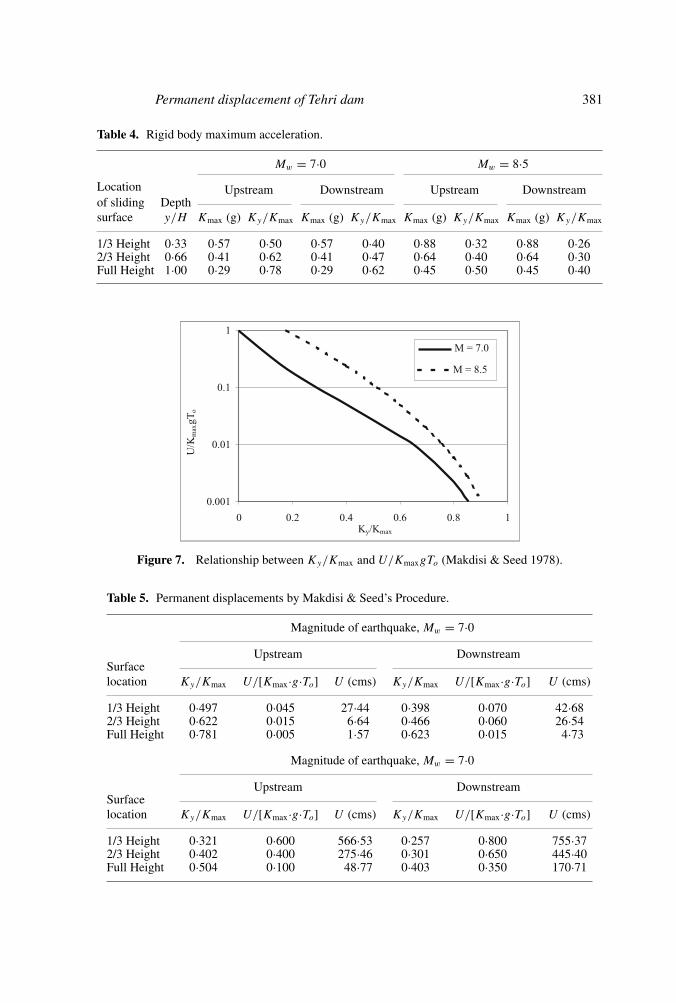
The values of Kmax and Ky/Kmax for all the cases are shown in table 4. The horizontaldisplacement, U , for each of the sliding masses is estimated from the curves shown in figure 7.These curves (adopted from Makdisi & Seed 1978) relate displacement, U , with the magnitude(Mw) of earthquake, Ky/Kmax, and the period of the dam, To. The displacements of theTehri dam thus obtained for Mw = 7·0 and Mw = 8·5 magnitude earthquakes are shown intable 5.
Figure 6. Relationship between y/h and Kmax/amax (Makdisi & Seed 1978).
Permanent displacement of Tehri dam 381
Table 4. Rigid body maximum acceleration.
Mw = 7·0 Mw = 8·5Location Upstream Downstream Upstream Downstreamof sliding Depthsurface y/H Kmax (g) Ky/Kmax Kmax (g) Ky/Kmax Kmax (g) Ky/Kmax Kmax (g) Ky/Kmax
1/3 Height 0·33 0·57 0·50 0·57 0·40 0·88 0·32 0·88 0·262/3 Height 0·66 0·41 0·62 0·41 0·47 0·64 0·40 0·64 0·30Full Height 1·00 0·29 0·78 0·29 0·62 0·45 0·50 0·45 0·40
Figure 7. Relationship between Ky/Kmax and U/KmaxgTo (Makdisi & Seed 1978).
Table 5. Permanent displacements by Makdisi & Seed’s Procedure.
Magnitude of earthquake, Mw = 7·0Upstream Downstream
Surfacelocation Ky/Kmax U/[Kmax·g·To] U (cms) Ky/Kmax U/[Kmax·g·To] U (cms)
1/3 Height 0·497 0·045 27·44 0·398 0·070 42·682/3 Height 0·622 0·015 6·64 0·466 0·060 26·54Full Height 0·781 0·005 1·57 0·623 0·015 4·73
Magnitude of earthquake, Mw = 7·0Upstream Downstream
Surfacelocation Ky/Kmax U/[Kmax·g·To] U (cms) Ky/Kmax U/[Kmax·g·To] U (cms)
1/3 Height 0·321 0·600 566·53 0·257 0·800 755·372/3 Height 0·402 0·400 275·46 0·301 0·650 445·40Full Height 0·504 0·100 48·77 0·403 0·350 170·71

382 Aniruddha Sengupta
6.2 Double integration method
This method of computing the earthquake-induced deformation is based on the sliding wedgeanalogy proposed by Newmark (1965). According to this method, sliding of a failure massoccurs whenever the inertia of the mass exceeds the frictional resistance along the slidingsurface. The frictional resistance is characterized by the yield acceleration, Ky . Relative dis-placements are calculated by double integration of the difference between mass accelerationand yield acceleration.
Since dynamic stresses and accelerations are directly related, it is surmised that it is possibleto replace an actual acceleration history by a number of cycles of sinusoidal wave form ofconstant amplitude in the same manner as it is customary to replace a time history of stressesby a number of cycles of stresses of constant amplitude. Following the procedure developed bySeed & Idriss (1971) to convert an actual irregular stress time history into repetition of severalstress cycles of constant amplitude, the equivalent acceleration time history is constructed.The Mw = 8·5 earthquake is modelled by 26 cycles of identical full sinusoidal waves. Theaverage value of acceleration amplitude, aavg is calculated as 2/3 of PGA and found to be0·3 g. The 7·0 magnitude earthquake is modelled by 15 cycles of identical full sinusoidalwaves. The average value of acceleration amplitude, aavg, for this case is found to be 0·15 g.The equivalent time history of acceleration may then be represented by a sine wave given by:
K(t) = aavgSin
(2 · π · t
T
). (1)
The calculated displacements are a function of T , period of the acceleration time history. Thelonger the period, the larger are the computed displacements. The period of the motion is afunction of the foundation conditions, magnitude of the earthquake, distance to the sourceand intensity of shaking. For embankment dams, it typically lies between 0·1 second and 1·0second.
For the Mw = 7·0 earthquake, the yield accelerations for the upstream and downstreamslopes are greater than the average value of acceleration amplitude, aavg of 0·15 g. In otherword, the factors of safety for sliding of both the slopes of Tehri dam are greater than unityunder Mw = 7·0 magnitude earthquake. Thus the displacements of both the slopes of Tehridam are negligible for the Mw = 7·0 earthquake. However, this is not the case for theMw = 8·5 earthquake. The Mw = 8·5 earthquake is modelled by 26 cycles of identical fullsinusoidal waves. The total displacement is computed by multiplying the displacement at theend of each cycle by the total number of cycles (26). It is assumed that the displacement istriggered at time, t1 when the acceleration of the base exceeds the yield acceleration, Ky .After time, t1, the resistance to displacement, expressed in terms of Ky , did not diminish afterdisplacement has been initiated. It is assumed that the negative portion of the wave followsdirectly after the positive one. The area under the negative portion is that required to bringthe relative velocity back down to zero before the start of the next cycle. Figure 8 shows thewhole scheme graphically.
As may be seen from figure 8, t1 and t2 are the limits within which the ground acceleration(K) exceeds yield acceleration (Ky). The values of the limits t1 and t2 are computed for boththe cases by solving the following equations:
K(t1) − Ky = 0, (2)
K(t2) − Ky = 0. (3)

Permanent displacement of Tehri dam 383
Figure 8. One cycle of ground motion and its velocity component.
The predominant period of the dam is 1·1 sec from response spectra analysis. The values oft1 and t2 at this period of motion are found to be 0·137 sec and 0·363 sec, respectively for theupstream slope and 0·104 sec and 0·396 sec, respectively for the downstream slope of the dam.
In figure 8, t3 is the time at which mass velocity, V , equals resisting velocity, Vy . The valueof t3 can be obtained by solving the following equation:
∫ t3
t1
K(t)dt −∫ t3
t1
Kydt = 0. (4)
The value of t3 is 0·482 sec for the upstream slope and 0·558 sec for the downstream slope ofthe Tehri dam.
An expression for the resisting velocity, Vy can be obtained, as follows, by integrating theyield acceleration, Ky :
Vy(t) = Ky · t − Ky · t1. (5)
An expression for mass velocity, V , is obtained by integrating equation (1) as follows:
V (t) = −aavgT
2 · π· Cos
(2 · π · t
T
)+ aavg
T
2 · π· Cos
(2 · π · t1
T
). (6)
The relative displacement, d, of the dam at the end of each cycle is then computed by inte-grating the difference between the mass velocity and the yield velocity as follows:
d =∫ t3
t1
(V (t) − Vy(t))dt. (7)

384 Aniruddha Sengupta
Figure 9. Amplification at the embankment dams during an earthquake.
According to the double integration method, total relative displacement of the Tehri dam atthe end of an Mw = 8·5 earthquake is estimated to be between 52·8 cm for the upstream slopeand 147·4 cm for the downstream slope.
6.3 Jansen’s method
Jansen (1990) developed the following empirical relationship between earthquake magnitude,M , the maximum crest or near crest acceleration, Km, the yield acceleration, Ky , and the totalsettlement at the crest, U :
U = [48·26(M/10)8(Km − Ky)]/√
Ky. (8)
The value of amplification at the crest (Km) in the above equation can be obtained fromfigure 9.
This method does not consider the height of dam directly in the displacement estimate.The total settlement at the crest, U , at different surface location are shown in table 6. The
Table 6. Estimate of total settlement of Tehri dam from Jansen’s method.
Upstream slope Downstream slopeValue of Magnitude of Location of criticalKm (in g) earthquake (Mw) sliding surface Ky (g) U (cms) Ky (g) U (cms)
1/3 Height 0·281 1·45 0·225 1·950·56 7·0 2/3 Height 0·255 1·66 0·191 2·34
Foundation 0·228 1·93 0·182 2·451/3 Height 0·281 8·91 0·225 11·51
0·64 8·5 2/3 Height 0·255 10·03 0·191 13·50Foundation 0·228 11·35 0·182 14·13

Permanent displacement of Tehri dam 385
above table shows that the maximum displacement estimated by Jansen’s method is between1·93 cm and 2·45 cm for Mw = 7 earthquake. While the maximum displacement is estimatedto be between 11·35 cm and 14·13 cm for the Mw = 8·5 earthquake.
6.4 Swaisgood’s method
Swaisgood (1995) developed a methodology to estimate earthquake-induced crest settlementbased on statistical treatment of empirical information developed from a detailed review ofthe seismic performance of some 54 existing embankment dams. This relationship relates thecrest settlement, �. (expressed as percentage of the combined dam and alluvium thickness)to a Seismic Energy Factor (SEF), dam type (Ktyp), dam height (H), and depth of alluvium(At) as follows:
�. (%) = SEF × Ktyp × Kdh × Kat. (9)
The seismic energy factor (SEF) in the above equation is dependent on the possible magnitudeof earthquake (M) and peak ground acceleration (PGA) at the dam site and is expressed as:
SEF = e(0·7168∗M+6·405∗PGA−9·098). (10)
The factor Ktyp depends on the type of dam construction. Ktyp is 1·187 for earth core rockfilldams and concrete faced rockfill dams, 1·363 for earthfill dams, and 4·620 for hydraulic filldams.
The factor Kat depends on the alluvial thickness (At) present beneath the dam. The greaterthe depth of alluvium, greater is the deformation in the dam. It also reflects the fact that thenatural periods of vibration with deep and soft soil deposits are longer than that of rock siteswith no alluvium.
Kat = 0·851 ∗ e(0·00368∗At). (11)
The factor Kdh relates dam height (H) to the settlement as follows:
Kdh = 9·134 ∗ H−0·437. (12)
The above factor indicates that the higher dams settle less than smaller dams. This may be dueto the fact that the resonant frequencies of shorter dams are closer to the natural frequenciesof the earthquake vibrations.
Table 7 summarizes all the Swaisgood’s factors and the estimated settlements of the Tehridam for the two assumed earthquakes.
Table 7. Estimate of crest settlements at Tehri dam by Swaisgood’s method.
Magnitude of Relative Crestearthquake, Mw SEF Ktyp Kdh Kat settlement, % settlement, in cm
7·0 0·07 1·187 0·478 0·851 0·034 8·88·5 0·9 1·187 0·478 0·851 0·43 112·0

386 Aniruddha Sengupta
Figure 10. Relative settlement (%) Vs. ESI (Bureau 1997).
6.5 Bureau’s method
Bureau (1997) presented a relationship, figure 10, which relates relative crest settlement (%)to the Earthquake Severity Index (ESI). Bureau has defined the earthquake severity index(ESI) by the following empirical equation:
ESI = PGA ∗ (M − 4·5)3. (13)
The crest settlements of Tehri dam, as obtained by this method, are shown in table 8.
7. Determination of permanent deformations by finite element method
The finite element method is known to be one of the most versatile tools available to datefor the dynamic analysis of an embankment dam. However, the accuracy of the result isvery much dependent on the material model chosen and on the corresponding materialparameters.
Table 8. Crest settlements by Bureau’s method.
Peak ground Earthquake Crestacceleration (PGA) magnitude (Mw) ESI settlement (cms)
0·23 g 7·0 3·59 18–23·40·45 g 8·5 28·8 521–782

Permanent displacement of Tehri dam 387
Figure 11. The selected ground motion scaled to 0·23 g.
In this study, a finite element program called, PLAXIS (PLAXIS 2D, 2002) is utilized forthe dynamic analyses of the Tehri dam. PLAXIS (version 8) is a commercial finite elementpackage intended for the two-dimensional analysis in terms of deformation and stability ingeotechnical engineering. PLAXIS is equipped with advanced features and material modelsto deal with various aspects of complex geotechnical problems. The steps required for thedynamic analysis in Plaxis are: construction of dam geometry, specifying material modelsfor each zone of the dam and assigning materials parameters to the respective zones, meshgeneration, applying boundary conditions, and defining steady state phreatic surface. Thenumerical analysis is done in three stages. In the first stage, the gravity force is turned on. Inthis stage the undrained behaviour of soil is ignored. In the next stage, the static analysis isdone where the dam is built and the reservoir is impounded. In the third stage, the dynamicanalysis is carried out. In this stage, acceleration time history of the selected earthquake isspecified. The output in terms of acceleration, deformation, pore pressures and stresses areviewed at the end of each stage of analysis.
In absence of any reliable data on the acceleration time history for the region, the 23 sec ofthe recorded ground motion of the 1985 Michoacan Mexico City Earthquake (Mw = 7·6) wasselected for this study. The ground motion was scaled to 0·23 g and 0·45 g, and applied at thebase of the dam to compute the permanent deformations of the dam during the earthquakes.Figure 11 shows the selected ground motion scaled to 0·23 g. The numerical analyses predicted
Figure 12. Deformation at the end of 23 sec of 0·23 g earthquake motion (deformation magnified 100times).

388 Aniruddha Sengupta
Figure 13. Deformation at the end of 23 sec of 0·45 g earthquake motion (deformation magnified 100times).
no liquefaction of the dam and its foundation during the earthquakes. Figures 12 and 13 showthe deformed dam geometry at the end of 23 sec of 0·23 g and 0·45 g earthquake motions,respectively. In both the figures deformations are magnified 100 times. The figures indicatethat most of the deformations will be in the upper part of the upstream shell of the dam. Forthe Mw = 7 earthquake the upstream face shall deform by 50 cm while for the Mw = 8·5event, it will deform by 110 cm. The downstream shell shall deform by 20 cm and 51 cm forthe Mw = 7 and Mw = 8·5 magnitude earthquakes. The vertical deformation was computedat the crest of the dam while horizontal deformation was obtained at the upstream berm ofthe dam for both the earthquakes. Figure 14 shows the vertical displacements at the crest ofthe dam for the 0·23 g and 0·45 g earthquakes. Figure 15 shows the horizontal displacementsof the upstream berm of the dam for both the earthquakes. Since unusually large freeboardis maintained for this dam, in neither earthquake cases there will be overtopping of the dam.However for the Mw = 8·5 theoretical event, there can be breaching of the upper portionof the filter/drain located by the side of the core which might cause uncontrollable seepageleading it to possible failure.
Figure 14. Vertical displacements at the crest of the dam.

Permanent displacement of Tehri dam 389
Figure 15. Horizontal displacements at the U/S berm of the dam.
8. Results
Table 9 summarizes a comparison of the displacements of Tehri dam predicted by differentempirical methods and a finite element method for Mw = 7·0 and Mw = 8·5 earthquakes. Theresults show a large variation, which is not surprising as the methods do not have any thing incommon among them. Some of the statistical-based models are developed from completelydifferent set of record. For the Mw = 7 earthquake, the displacement of the upstream shellvaries between 1·93 cm and 50 cm. The displacement of the downstream shell varies between2·45 cm and 42·68 cm. The double integration method does not show any displacementsfor this case. For the Mw = 8·5 hypothetical earthquake, the displacements vary between11·35 cm and 566·53 cm for the upstream shell, and 14·13 cm to 782 cm for the downstreamshell.
Thatte (1992) reported that plastic displacement for Mw = 7 earthquake obtained by Seed’smethod was 17·37 cm and 48·25 cm for upstream and downstream slopes assuming the damto be a rigid structure. The crest displacement was computed to be 52 cm when the damwas assumed to be non-rigid. Interestingly, these values are very close to the displacementsobtained by the 2-D finite element method.
Table 9. Comparison of deformations predicted by different methods.
Deformations (cms) at Mw = 7·0 Deformations (cms) at Mw = 8·5Methods used Upstream Downstream Upstream Downstream
Seed & Makadisi’s 27·44 42·68 566·53 755·37Double integration — — 52·80 147·00Jansen 1·93 2·45 11·35 14·13Swaisgood 8·80 8·80 112·00 112·00Bureau 18·00 23·40 521·00 782·00Finite element 50·00 20·00 110·00 51·00

390 Aniruddha Sengupta
The large variation in the reported displacements of Tehri dam due to an earthquake indicatesthat the mechanism of failure in large rockfill dams may not be properly understood and moreresearch is required in this area. The Tehri dam is located in a narrow canyon. Thus there is apossibility of magnification of acceleration through the dam due to the effect of canyon. Thiscanyon effect has not been considered in the present study and should be looked at in nearfuture.
9. Conclusions
• The present study indicates that the displacements due to an earthquake of magnitude (Mw)
7·0 are significant but not enough to compromise the safety of Tehri dam.• The displacements due to a hypothetical earthquake of magnitude Mw = 8·5 are quite large.
They might lead to a rupture in the existing 1m thick filter zones, resulting in uncontrollableseepage.
• The 2-D finite element analyses show that the maximum deformations occur along theupper reaches of the upstream face of the dam while the surface at the foundation level hasalmost negligible deformations.
• For the Mw = 7 earthquake, the maximum displacement is predicted by the finite elementmethod, while for the Mw = 8·5 earthquake, Seed and Makdisi’s method predicts themaximum displacements.
• All the simplified methods predict larger displacements on the downstream face of the dam,but finite element method predicts almost two times larger displacements for the upstreamface of the dam.
• Among the simplified methods, the maximum displacements are computed by Seed andMakdisi’s method, while the minimum displacements are obtained by Jansen’s method.
• The large variation of the seismic displacements predicted by different methods indicatesscope for further research in this area and stresses on the need for the instrumentation of thedams and verification of different methods in predicting seismic displacements of dams.The different dams coming up in the Himalayan region should be properly instrumentedto record ground motions, amplification of motions through the dam and displacements ofthe dam, so that better understanding of the seismic behaviours of large earth and rockfilldams can be achieved and proper mitigation measures can be put in place before hand incase a disaster strikes.
References
Abdel-Ghaffar A M, Scott R F 1978 An investigation of the dynamic characteristics of an earth dam,Report No. EERL 78-02, Earthquake Engineering Research Laboratory, California Institute ofTechnology, Pasadena, Calif
Abdel-Ghaffar A M, Scott R F 1979 Analysis of earth dam response to earthquakes. J. Geotech. Eng.Div. ASCE 105(12): 1379–1404
Ambraseys N, Bilham R 2000 A note on the kangra MS = 7·8 earthquake of 4 April 1905. CurrentScience 79(1): 45–50
Ambraseys N, Jackson D 2003 A note on early earthquakes in northern india and southern tibet.Current Science 84(4): 570–582
Ambraseys N N, Sarma S K 1967 The response of earth dams to strong earthquakes. Geotechnique17(9): 181–213

Permanent displacement of Tehri dam 391
Bilham R, Szeliga W 2008 Interaction between the himalaya and the flexed indian plate – Spatialfluctuations in seismic hazard in india in the past millennium? Seismic Engineering Conf. Comm.The 1908 Messina & Reggio Calabria Earthquake, eds. A Santini, N Moraci, Am. Inst. of PhysicsConf. Proc. 224–231
Bray J D, Travasarou T 2007 Simplified procedure for estimating earthquake-induced deviatoric slopedisplacements. J. Geotech. Eng. Div. ASCE 133(4): 381–392
Bureau G 1997 Evaluation methods and acceptability of seismic deformations in embankment dams.Proc. 19th Cong. on Large Dams Florence, Italy 500–510
Elgamal A M, Abdel-Ghaffar A M 1987 Elasto-plastic seismic response of 3-D earth dams: applica-tions. J. Geotech. Eng. Div. ASCE 113(11): 1309–1325
Elgamal A M, Scott R F, Succarieh M F, Yan L 1990 La Villita dam response during five earthquakesincluding permanent deformation. J. Geotech. Eng. Div. ASCE 116(10): 1443–1462
Feldl N, Bilham R 2006 Great himalayan earthquakes and the Tibetan plateau. Nature 444: 165–170Finn W D L 1993 Seismic design considerations for dams in himalaya with references to Tehri dam.
In: earthquake hazard and large dams in the himalaya, ed. V K Gaur, INTACH, New Delhi, 116–134Gaur V K 1993 Earthquake Hazard and Large Dams in the Himalayas, INTACH, New DelhiGazetas G, Dakoulas P 1992 Seismic analysis and design of rockfill dams: State of the art. Soil
Dynamics and Earthquake Eng. 11: 27–61Gazetas G, Uddin N 1994 Permanent deformation on preexisting sliding surfaces in dams. J. Geotech.
Eng. Div. ASCE 120(11): 2041–2060High Level Committee of Experts 1990 Report on Safety Aspects of Tehri dam Project, Govt. of IndiaIyengar R N 1993 How safe is the proposed Tehri dam to earthquake. Current Science 65(5): 384–392Jansen R B 1990 Estimation of embankment dam settlement caused by earthquake. Int. Water Power &
Dam Construction 42(12): 35–40Khattri K N 1993 An overview of seismicity of himalaya, In: earthquake hazard and large dams in
the himalaya, ed. V K Gaur, INTACH, New Delhi 35–62Li H, Chi S, Lin G, Zhong H 2008 A modified approach for determination of nonlinear properties in
seismic response analyses for 200 m high core rock-fill dams. Can. Geotech. J. 45(8): 1064–1072Lin J S, Whitman R V 1983 Decoupling approximation to the evaluation of earthquake-induced plastic
slip in earth dams. Earthquake Eng. and Struct. Dynamics 11: 667–678Lin J S, Whitman R V 1986 Earthquake induced displacements of sliding block. J. Geotech. Eng. Div.
ASCE 105(12): 1427–1434Makdisi F I, Seed H B 1978 Simplified procedure for estimating dam and embankment earthquake-
induced deformations. J. Geotech. Eng. Div. ASCE 104(7): 849–867Martin P P, Niznik J A, Sengupta A 1993 Prediction of static and dynamic deformation response of
blue ridge dam, Georgia, USA, Int. Workshop on Dam Safety Evaluation, SwitzerlandMartin P P, Sengupta A 1994 Numerical analysis of bath county upper reservoir dam. 3rd ICOLD
Benchmark Workshop on Numerical Analysis of Dams (Theme B1), Paris (France), Sept. 29–30Mejia L H, Seed H B 1983 Comparison of 2D and 3D dynamic analyses of earth dams. J. Geotech.
Eng. Div. ASCE 109(11): 1383–1398Mejia L H, Seed H B, Lysmer J 1982 Dynamic analysis of earth dam in three-dimensions. J. Geotech.
Eng. Div. ASCE 108(12): 1586–1604Newmark N M 1965 Effects of earthquakes on dams and embankments. Geotechnique 15(2): 139–159Papalou A, Bielak J 2004 Nonlinear seismic response of earth dams with canyon interaction.
J. Geotech. Eng. Div. ASCE 130(1): 103–110Plaxis 2D-A Finite Element Code for Soil and Rock Analyses 2002 R B J Brinkgreve (eds), Ver-
sion 8, Delft University of Technology & Plaxis b.v., The Netherlands, A.A Balkema PublishersLisse/bingdon/Exton(PA)/Tokyo
Prevost J H, Abdel-Ghaffar A M, Lacy S J 1985 Nonlinear dynamic analyses of an earth dam.J. Geotech. Eng. Div. ASCE 111(7): 882–897
Rajendran C P, Rajendran K 2005 The status of central seismic gap: A perspective based on the spatialand temporal aspects of the large himalayan earthquakes. Tectonophysics 395: 19–39

392 Aniruddha Sengupta
Resendiz D, Romo M P 1982 El Infiernillo and La Villita dams: Seismic behaviour. J. Geotech. Eng.Div. ASCE 108(1): 109–130
Richter C F 1958 Elementary seismology, Freeman, San Francisco 764Romo M P, Resendiz D 1981 Computed and observed deformation of two embankment dams during
earthquake. Dams and Earthquakes, Thomas Telford Ltd, London 267–274Sarma S K 1975 Seismic stability of earth dams and embankments. Geotechnique 25(4): 743–761Seed H B 1966 A method for earthquake-resistant design of earth dams. J. Soil Mech. Found. Div.
ASCE 92(1): 13-41Seed H B 1973 Analysis of the Slides in the San Fernando Dams during the Earthquake of
February 9, 1971, Report No. EERC 73-2, Earthquake Engineering Research Center, Univ. ofCalifornia, Berkeley, Calif
Seed H B 1979 Consideration in the earthquake resistant design of earth and rockfill dams. Geotech-nique 29(3): 234–249
Seed H B 1981 Lessons from the performance of earth dams during earthquake, Dams and Earthquakes,Thomas Telford Ltd (England) 97–104
Seed H B, Idriss I M 1971 A simplified procedure for evaluating soil liquefaction potential. J. SoilMech. Found. Div. ASCE 97(9): 1249–1274
Seed H B, Lee K L, Idriss I M 1969 Analysis of the sheffield dam failure. J. Soil Mech. Found. Div.ASCE 95(6): 1453–1490
Seed H B, Martin G R 1966 The seismic coefficient in earth dam design. J. Soil Mech. Found. Div.ASCE 92(3): 25–58
Seed H B, Wong R T, Idriss I M, Tokimatsu K 1986 Moduli and damping factors for dynamic analysisof cohesionless soils. J. Geotech. Eng. Div. ASCE 112(11): 1016–1032
Sengupta A, Martin P P 1996 Prediction of the seismic response and deformations of a hydraulic filldam. CHILECOLD 96, Santiago, Chile
Sengupta A, Martin P P 1997 Earthquake-induced permanent deformations in earth dams: From achallenge to practice, ICOLD 97, Madrid, Spain
Serff N, Seed H B, Makdisi F I, Chang C Y 1976 Earthquake induced deformations of earth dams,Report No. EERC 76-4, Earthquake Engineering Research Center, Univ. of California, Berkeley,Calif
Swaisgood J R 1995 Estimating deformation of embankment dams caused by earthquakes. ASDSOWestern Regional Conf. Montana, USA 1–7
Thatte C D 1992 Earthquakes, Dam design and Tehri project. J. Ind. Geot. 22(1): 1–41THDC 1990 A seismic design of Tehri dam, A Report submitted by Tehri Hydro Development Cor-
poration Ltd.USBR 1989 Seismic design and analysis of embankment dams, Design Standards, Chapter 13, DS-
13(13)-7, United States Department of the Interior, Bureau of Reclamation, Denver, ColoradoVrymoed J 1981 Dynamic FEM model of Oroville dam. J. Geotech. Eng. Div. ASCE 107(8):
1057–1077Yan Liping 1991 Seismic deformation analysis of earth dams: A Simplified Method, Report No. SML
91-01, Soil Mechanics Laboratory, California Institute of Technology, Pasadena, CalifZienkiewicz O C, Leung K H, Hinton E 1980 Earth dam analysis for earthquakes: Numerical solutions
and constitutive relations for nonlinear (damage) analysis, Design of Dams to Resist Earthquake,ICE, London 141–156