Embed Size (px)
Citation preview
FAA CENTER OF EXCELLENCE FOR ALTERNATIVE JET FUELS & ENVIRONMENT
Project manager: Dan Williams, Jim Hileman, Nate Brown, FAALead investigator: Wallace E. Tyner, Purdue University
Estimation of Land Use Change Emission Values for Aviation Biofuels Production
Project 13-C-AJFE-PU
September 26 & 27, 2017Alexandria, VA
Opinions, findings, conclusions and recommendations expressed in this material are those of the author(s)and do not necessarily reflect the views of ASCENT sponsor organizations.
2
Motivation
ICAO agreed to implement a Global Market-based Measure (GMBM) scheme – Carbon Offsetting and Reduction Scheme for International
Aviation (CORSIA) (39th Assembly, 2016).– Aviation biofuels (biojet) are expected to play an important role.
We need to know to what extent aviation biofuels can
help reduce emissions.
Induced Land Use Change (ILUC) emissions will be a
part of the aviation biofuel emission estimates for the
ICAO/CAEP/AFTF process, so we need the best possible
estimated values.
3
Induced Land Use Change Impacts
• Reduced consumption of the feedstock in non-biofuel uses.
• Switching among crops to produce more of the biofuel commodity.
• Changes at the extensive margin to convert pasture and forest to cropland.
• Changes at the intensive margin to increase crop yield, engage in more double cropping, and increase cultivation of unused land.
• Shifts in global production and trade.
4
Estimating ILUC emissions
• First, estimate the global land use change using an economic equilibrium model– CARD–FAPRI (FASOM, US EPA), GTAP-BIO (CARB)– MIRAGE-BioF (EU), GLOBIOM (EU)
• Second, calculate emissions using an emission factor/accounting model– plant biomass carbon, – soil carbon, – forgone carbon sequestration
• There are important disparities among models/estimations – Modelling theoretical background– Baseline assumptions, shock size, simulation approach– Emissions calculation (amortization periods, etc.).
5
Objectives
Our long term objective is to provide reliable ILUC
emission estimates for different types of aviation biofuels
produced in any region of the world.
Our near term objectives are
• To test simulations for aviation biofuels produced in
four regions using GTAP-BIO and AEZ-EF.
• In collaboration with the GLOBIOM group, validate
parameters and address uncertainty associated with
ILUC modeling.

6
GTAP-BIO
• Computable general equilibrium (CGE) model
• Originally created by incorporating GTAP-AEZ into GTAP-E for biofuels policy analysis.
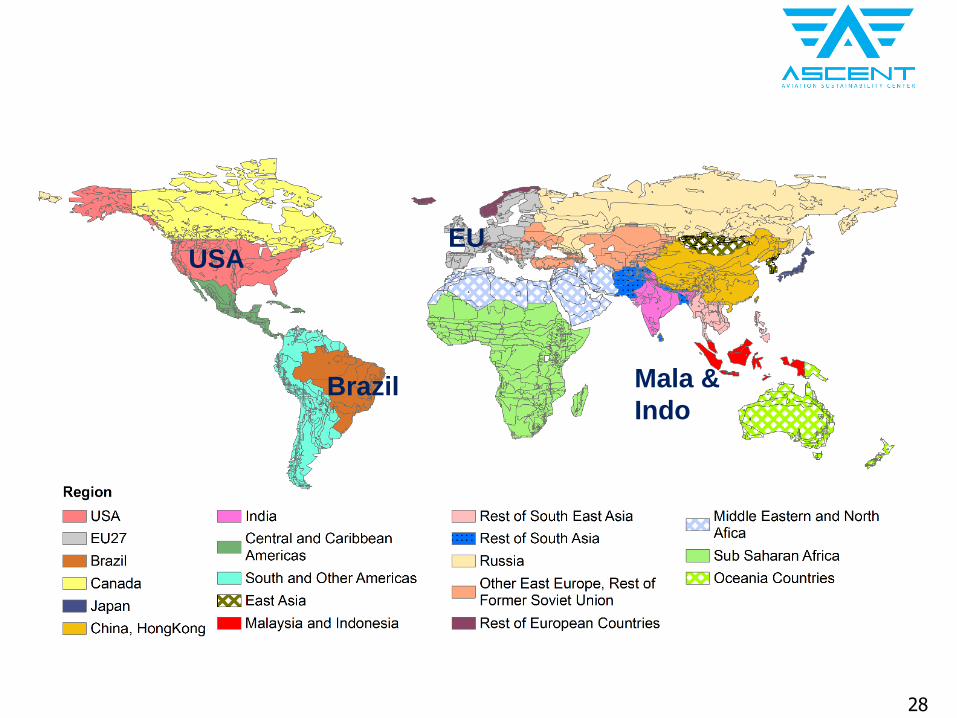
• Aggregated to 19 regions, disaggregated agricultural, biofuels, and other related sectors.
• Land was disaggregated into up to 18 Agro-Ecological Zones (AEZs) in each region
• GTAP database (2011 base year).
• Land database – Cropland, Pasture, Accessible forest– Harvested area for all crops

7
Aviation biofuels production shock
to 2035 (mandate)
GTAP-BIO and AEZ-EF

8
Study scope
• Pathways– ASTM approved technologies
• Fischer-Tropsch biojet (FTJ) which represents both FT-SPK and FT-SKA, HEFA, SIP, and ATJ
– Feedstocks that entail higher risks to induce LUC– Agricultural and forestry residues, waste tallow, used
cooking oil (UCO), municipal solid waste (MSW), and microalgae are excluded.
• Regions– USA, EU, Brazil, Malaysia & Indonesia– Major biofuels producing and jet fuel consumption
regions
• Shock– Biojet production in 2035, CORSIA policy target
9
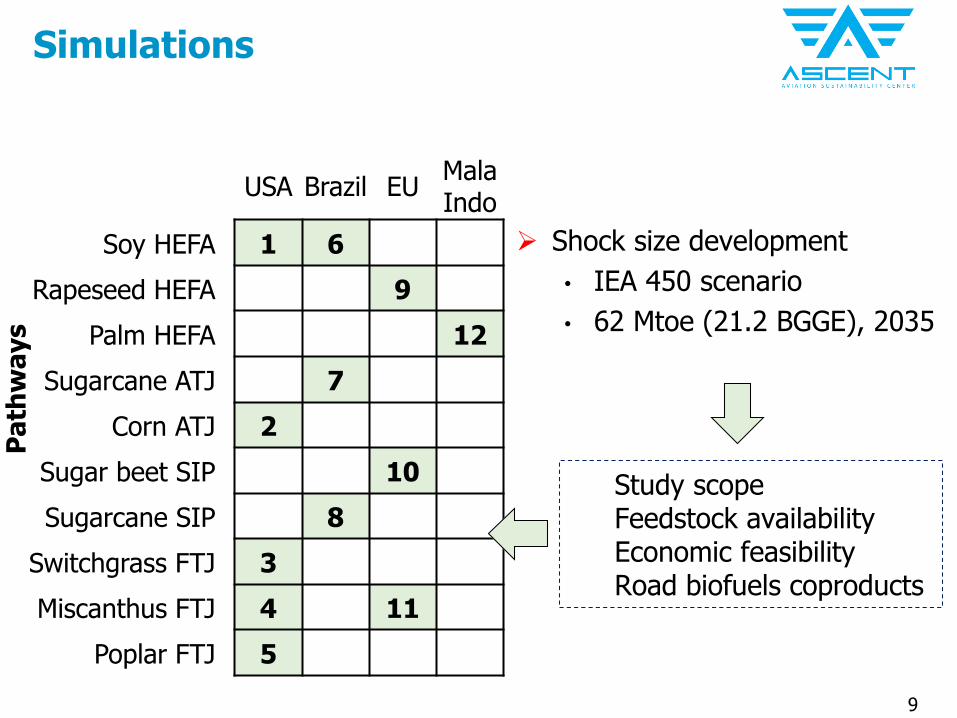
Simulations
USA Brazil EUMalaIndo
Soy HEFA 1 6
Rapeseed HEFA 9
Palm HEFA 12
Sugarcane ATJ 7
Corn ATJ 2
Sugar beet SIP 10
Sugarcane SIP 8
Switchgrass FTJ 3
Miscanthus FTJ 4 11
Poplar FTJ 5
Pa
thw
ays
Shock size development
• IEA 450 scenario
• 62 Mtoe (21.2 BGGE), 2035
Study scopeFeedstock availabilityEconomic feasibilityRoad biofuels coproducts
10
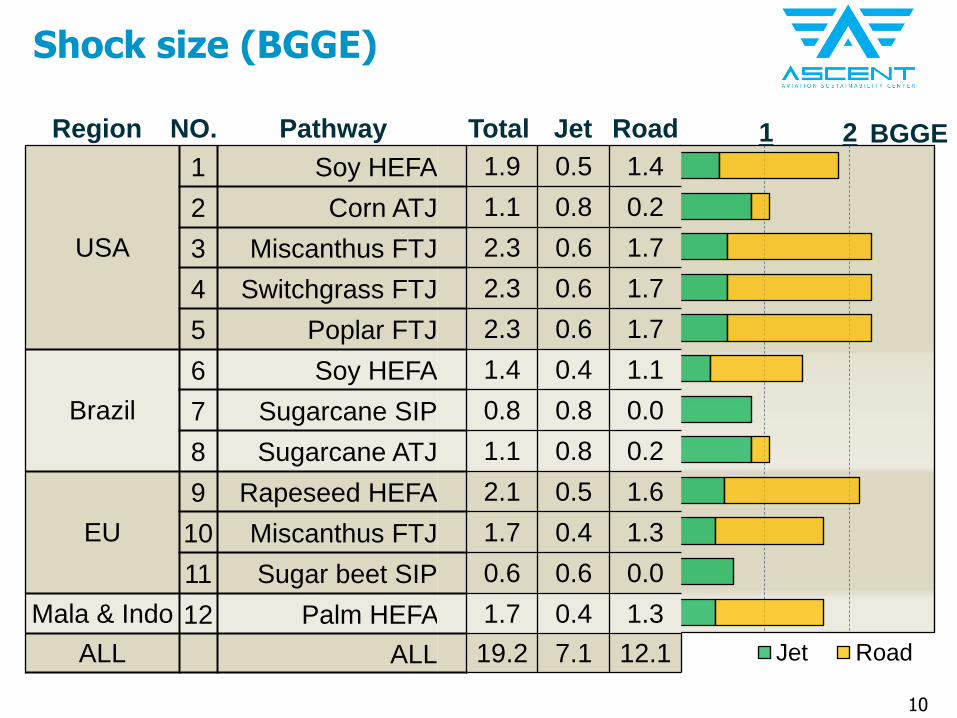
Shock size (BGGE)
Jet Road
USA
1 Soy HEFA 1.9 0.5 1.4
2 Corn ATJ 1.1 0.8 0.2
3 Miscanthus FTJ 2.3 0.6 1.7
4 Switchgrass FTJ 2.3 0.6 1.7
5 Poplar FTJ 2.3 0.6 1.7
Brazil
6 Soy HEFA 1.4 0.4 1.1
7 Sugarcane SIP 0.8 0.8 0.0
8 Sugarcane ATJ 1.1 0.8 0.2
EU
9 Rapeseed HEFA 2.1 0.5 1.6
10 Miscanthus FTJ 1.7 0.4 1.3
11 Sugar beet SIP 0.6 0.6 0.0
Mala & Indo 12 Palm HEFA 1.7 0.4 1.3
ALL ALL 19.2 7.1 12.1
21 BGGEJet RoadTotalPathwayRegion NO.
11
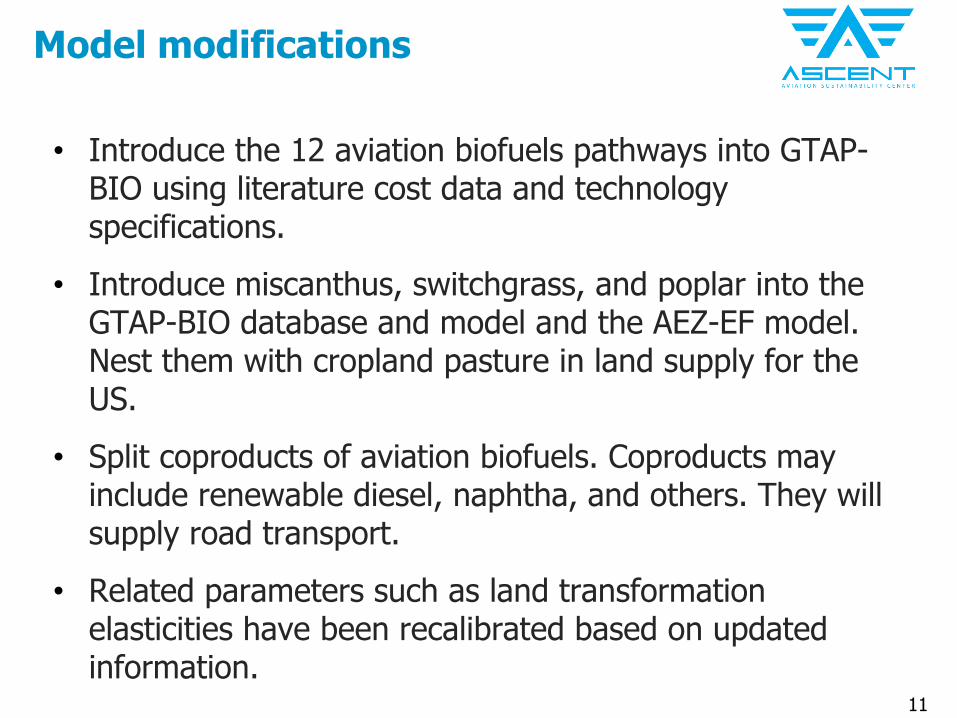
Model modifications
• Introduce the 12 aviation biofuels pathways into GTAP-BIO using literature cost data and technology specifications.
• Introduce miscanthus, switchgrass, and poplar into the GTAP-BIO database and model and the AEZ-EF model. Nest them with cropland pasture in land supply for the US.
• Split coproducts of aviation biofuels. Coproducts may include renewable diesel, naphtha, and others. They will supply road transport.
• Related parameters such as land transformation elasticities have been recalibrated based on updated information.

12
Market-mediated responses

13
GTAP ILUC CI (gCO2e/MJ)
USA
1 Soy HEFA 20
2 Corn ATJ 15
3 Miscanthus FTJ -30
4 Switchgrass FTJ 3
5 Poplar FTJ 15
Brazil
6 Soy HEFA 20
7 Sugarcane SIP 5
8 Sugarcane ATJ 4
EU
9 Rapeseed HEFA 18
10 Miscanthus FTJ 1
11 Sugar beet SIP 11
Mala & Indo 12 Palm HEFA 50
ALL ALL 9
60
30-yr. gCO2e/MJ
-30 20030-yrPathwayRegion NO.

14
SIP & ATJ
• US ATJ and EU SIP– Stronger crop switching
from soybean, wheat, other feed crops so that export decreases
– Deforestation in other regions
• CP plays important role in USA and Brazil; CP has a lower EF than pasture.
• Two Brazil sugar pathways are similar in LUC pattern
• 0.2-0.5% feedstock yield growth
0.0
0.2
0.4
0.6
0.8
1.0
1.2
Co
rn A
TJ
Sugar
AT
J
Sug
ar S
IP
Bee
t S
IP
USA Brazil Brazil EU
Mil
lion
ha
Forest
Pasture
Cropland
pasture
Cropland
intensification
Crop switching
Global LUC decomposition
15
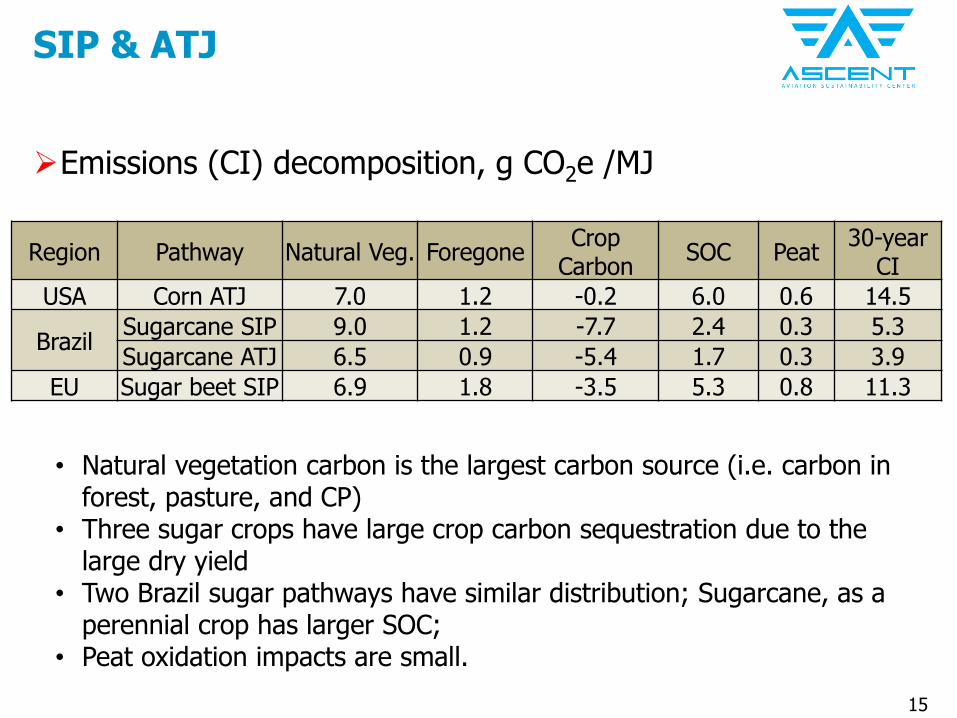
SIP & ATJ
• Natural vegetation carbon is the largest carbon source (i.e. carbon in forest, pasture, and CP)
• Three sugar crops have large crop carbon sequestration due to the large dry yield
• Two Brazil sugar pathways have similar distribution; Sugarcane, as a perennial crop has larger SOC;
• Peat oxidation impacts are small.
Emissions (CI) decomposition, g CO2e /MJ
Region Pathway Natural Veg. ForegoneCrop
CarbonSOC Peat
30-year CI
USA Corn ATJ 7.0 1.2 -0.2 6.0 0.6 14.5
BrazilSugarcane SIP 9.0 1.2 -7.7 2.4 0.3 5.3
Sugarcane ATJ 6.5 0.9 -5.4 1.7 0.3 3.9
EU Sugar beet SIP 6.9 1.8 -3.5 5.3 0.8 11.3
16
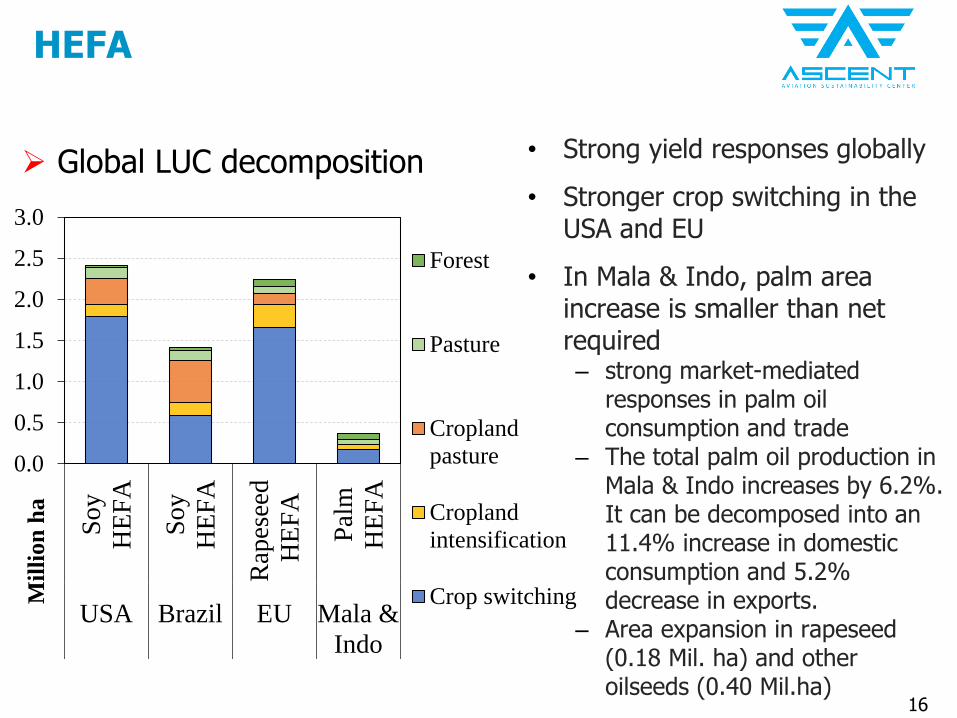
HEFA
• Strong yield responses globally
• Stronger crop switching in the USA and EU
• In Mala & Indo, palm area increase is smaller than net required– strong market-mediated
responses in palm oil consumption and trade
– The total palm oil production in Mala & Indo increases by 6.2%. It can be decomposed into an 11.4% increase in domestic consumption and 5.2% decrease in exports.
– Area expansion in rapeseed (0.18 Mil. ha) and other oilseeds (0.40 Mil.ha)
0.0
0.5
1.0
1.5
2.0
2.5
3.0
So
y
HE
FA
So
y
HE
FA
Rap
esee
d
HE
FA
Pal
m
HE
FA
USA Brazil EU Mala &
Indo
Mil
lion
ha
Forest
Pasture
Cropland
pasture
Cropland
intensification
Crop switching
Global LUC decomposition

17
HEFA
• USA soy HEFA, trade impact– Decrease in soybean and soy oil export
• Soybean export to China decreases by 11%• Soybean oil export to Central and Caribbean Americas
decrease by 19.8%• Export from Brazil and Mala & Indo increases
– US imports of palm oil, rapeseed oil, and other vegetable oils increase by 1.3%, 0.9%, and 8.1%, respectively.
– Strong increase in meal export (59%).
18
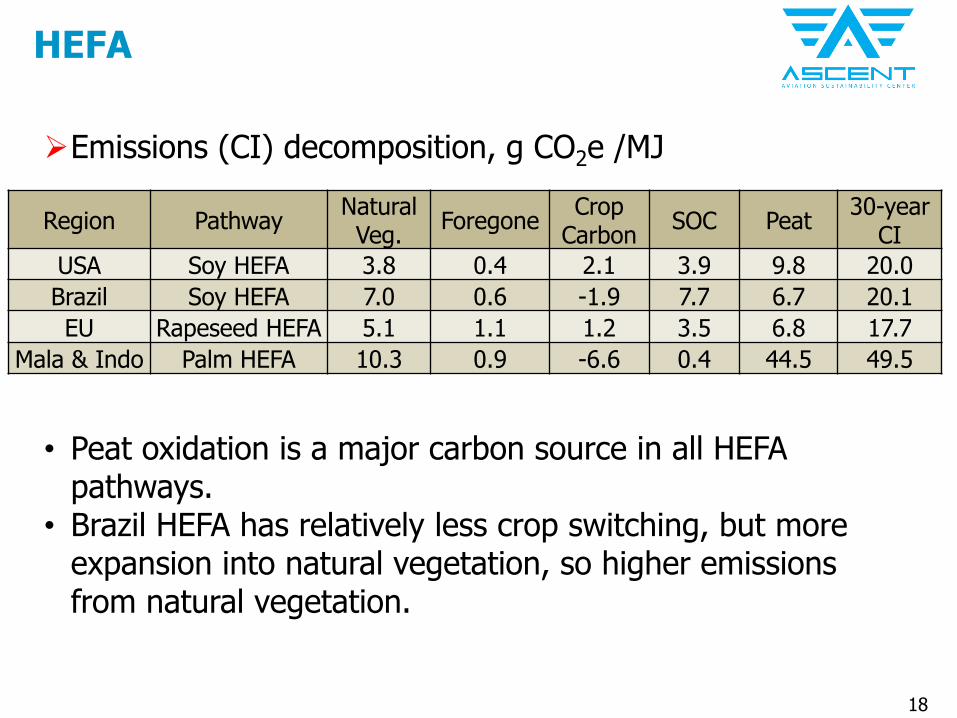
HEFA
• Peat oxidation is a major carbon source in all HEFA pathways.
• Brazil HEFA has relatively less crop switching, but more expansion into natural vegetation, so higher emissions from natural vegetation.
Emissions (CI) decomposition, g CO2e /MJ
Region PathwayNatural Veg.
ForegoneCrop
CarbonSOC Peat
30-year CI
USA Soy HEFA 3.8 0.4 2.1 3.9 9.8 20.0
Brazil Soy HEFA 7.0 0.6 -1.9 7.7 6.7 20.1
EU Rapeseed HEFA 5.1 1.1 1.2 3.5 6.8 17.7
Mala & Indo Palm HEFA 10.3 0.9 -6.6 0.4 44.5 49.5
19
Schedule and Status
We have updated the GTAP data base and model from 2004 to 2011.
Aviation biofuels and cellulosic crops have been introduced into the data base and the new model.
We have done test simulations with the new model for 12 aviation biofuels pathways.
Currently, we are working on comparing results between
GTAP-BIO and GLOBIOM. This process helps improve both models.
We will test the sensitivity of important parameters.

20
Recent Accomplishments and Contributions
• Presentations to the ICAO/CAEP/AFTF group in February
and June in 2017.
Publications
• Taheripour, Farzad, Xin Zhao, and Wallace E. Tyner. "The impact of considering land intensification and updated data on biofuels land use change and emissions estimates." Biotechnology for biofuels 10.1 (2017): 191.
21
Summary
• Summary statement– Producing aviation biofuels using land-based feedstocks will
induce global land use change.– Our preliminary results show that vegetable oil HEFA pathways
will have relatively higher carbon intensity, largely due to the related peat oxidation.
– Cellulosic crops tend to have small or even negative ILUC emission mainly due to the high soil carbon sequestrations.
• Next steps?– Work with the GLOBIOM group to improve both models based on
the available information
• Key challenges/barriers– Comparisons between GTAP-BIO and GLOBIOM can be
challenging given the differences in model design, data base, emissions accounting, etc.
22
Acknowledgements
• David Cui provided support with some of the model simulations.
• Hugo Valin from IIASA has been collaborating on model comparison activities.
Participants
• Farzad Taheripour, Research Associate Professor, Purdue University• Xin Zhao, PhD student, Purdue University

23
Thanks
Questions and Comments
24
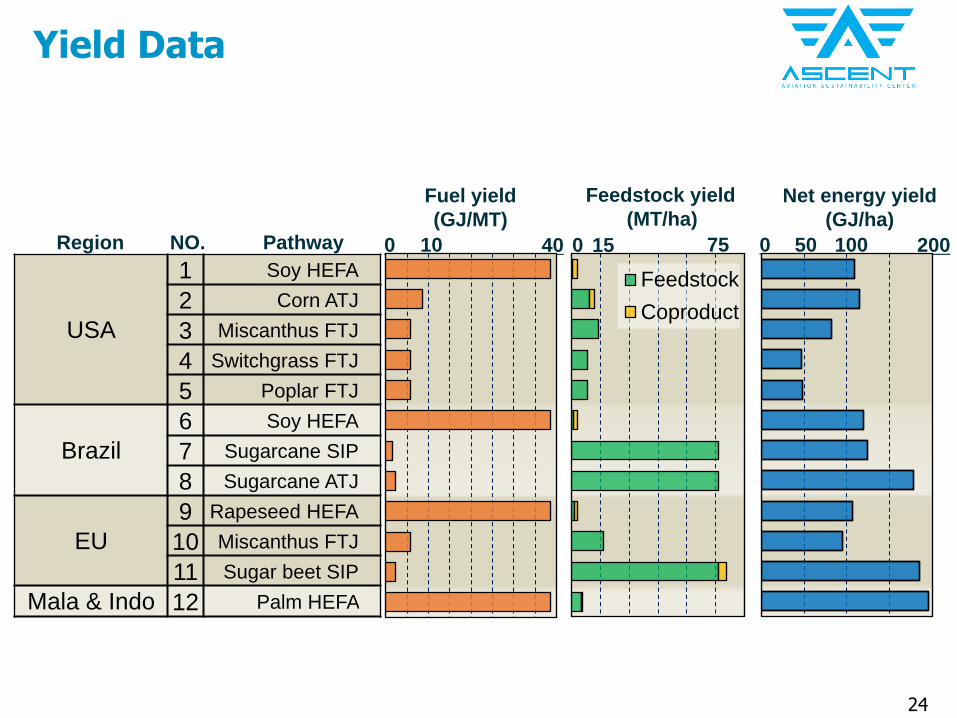
USA
1 Soy HEFA
2 Corn ATJ
3 Miscanthus FTJ
4 Switchgrass FTJ
5 Poplar FTJ
Brazil
6 Soy HEFA
7 Sugarcane SIP
8 Sugarcane ATJ
EU
9 Rapeseed HEFA
10 Miscanthus FTJ
11 Sugar beet SIP
Mala & Indo 12 Palm HEFA
20015
Feedstock yield
(MT/ha)
75 100500400
Fuel yield
(GJ/MT)
Net energy yield
(GJ/ha)
10 0PathwayRegion NO.
Feedstock
Coproduct
Yield Data
25
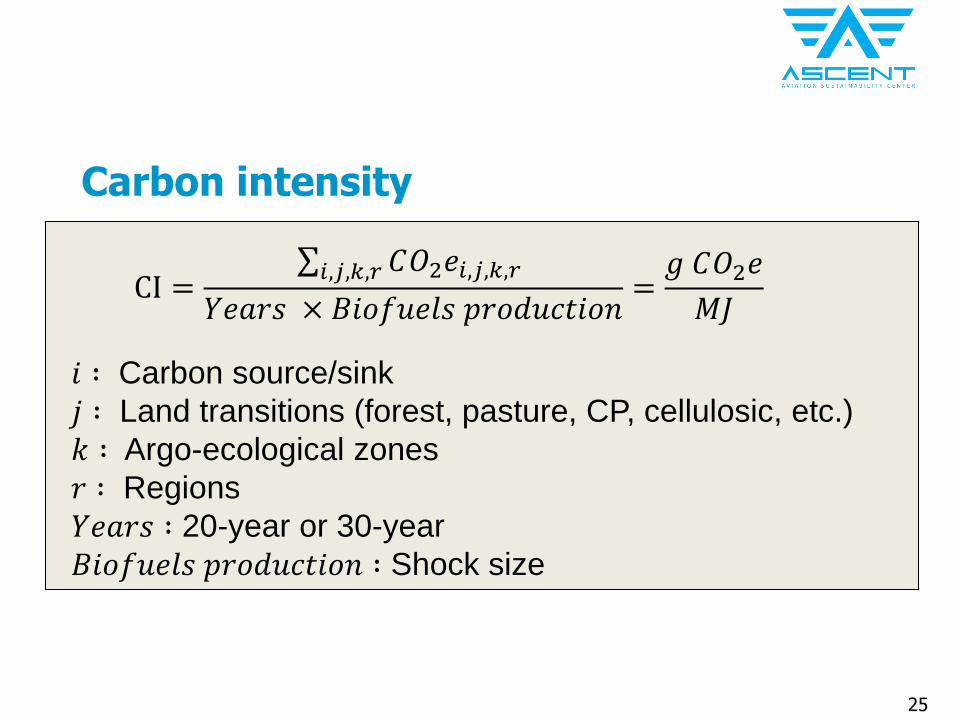
Carbon intensity
𝑖 ∶ Carbon source/sink
𝑗 ∶ Land transitions (forest, pasture, CP, cellulosic, etc.)
𝑘 ∶ Argo-ecological zones
𝑟 ∶ Regions
𝑌𝑒𝑎𝑟𝑠 ∶ 20-year or 30-year
𝐵𝑖𝑜𝑓𝑢𝑒𝑙𝑠 𝑝𝑟𝑜𝑑𝑢𝑐𝑡𝑖𝑜𝑛 ∶ Shock size
CI =σ𝑖,𝑗,𝑘,𝑟 𝐶𝑂2𝑒𝑖,𝑗,𝑘,𝑟
𝑌𝑒𝑎𝑟𝑠 × 𝐵𝑖𝑜𝑓𝑢𝑒𝑙𝑠 𝑝𝑟𝑜𝑑𝑢𝑐𝑡𝑖𝑜𝑛=𝑔 𝐶𝑂2𝑒
𝑀𝐽
26
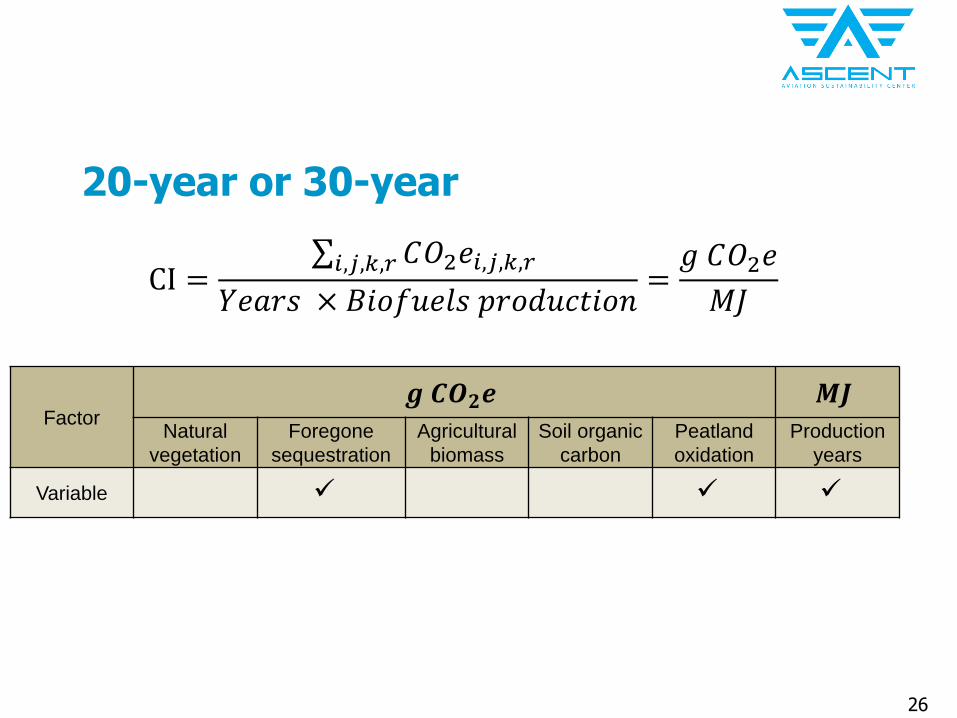
20-year or 30-year
CI =σ𝑖,𝑗,𝑘,𝑟 𝐶𝑂2𝑒𝑖,𝑗,𝑘,𝑟
𝑌𝑒𝑎𝑟𝑠 × 𝐵𝑖𝑜𝑓𝑢𝑒𝑙𝑠 𝑝𝑟𝑜𝑑𝑢𝑐𝑡𝑖𝑜𝑛=𝑔 𝐶𝑂2𝑒
𝑀𝐽
Factor𝒈 𝑪𝑶𝟐𝒆 𝑴𝑱
Natural
vegetation
Foregone
sequestration
Agricultural
biomass
Soil organic
carbon
Peatland
oxidation
Production
years
Variable

27
Brief History of GTAP
• This week GTAP celebrates its 25th anniversary, having been founded in 1992.
• We are now using the 9th version of the data base (2011) and developing the 10th (2014).
• The data base contains 140 countries and regions and 57 economic sectors plus all the biofuel sectors
• Land is divided into 18 agro-ecological zones (AEZs)
• The GTAP model and data base are publically available.
28
USA
Brazil
EU
Mala &
Indo

29
ILUC from the US RFS mandates (corn ethanol)
30
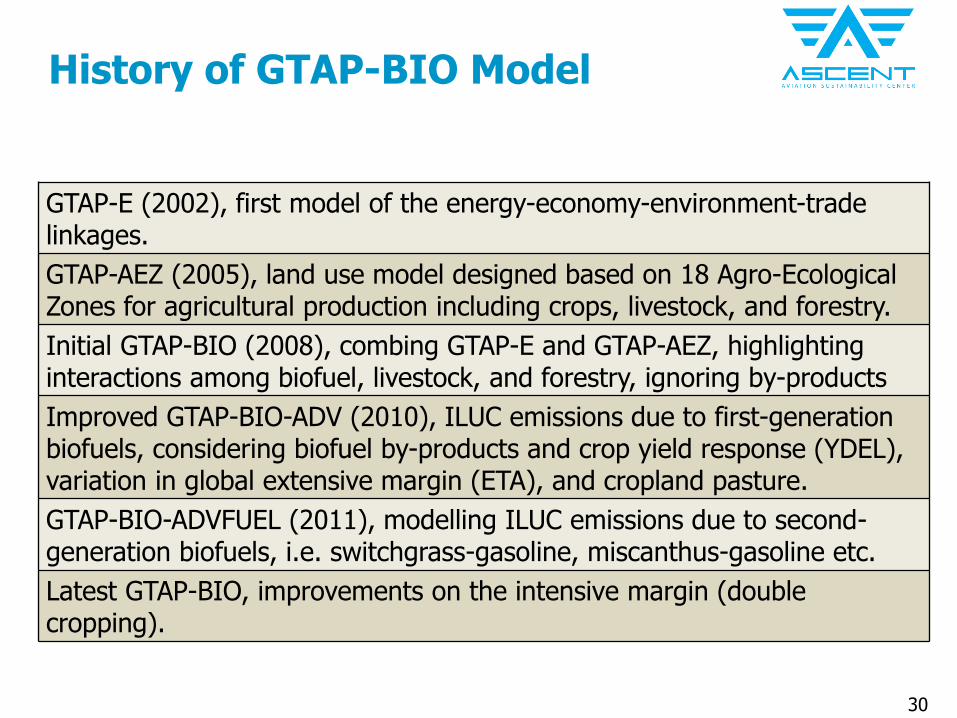
History of GTAP-BIO Model
GTAP-E (2002), first model of the energy-economy-environment-trade linkages.
GTAP-AEZ (2005), land use model designed based on 18 Agro-Ecological Zones for agricultural production including crops, livestock, and forestry.
Initial GTAP-BIO (2008), combing GTAP-E and GTAP-AEZ, highlighting interactions among biofuel, livestock, and forestry, ignoring by-products
Improved GTAP-BIO-ADV (2010), ILUC emissions due to first-generation biofuels, considering biofuel by-products and crop yield response (YDEL), variation in global extensive margin (ETA), and cropland pasture.
GTAP-BIO-ADVFUEL (2011), modelling ILUC emissions due to second-generation biofuels, i.e. switchgrass-gasoline, miscanthus-gasoline etc.
Latest GTAP-BIO, improvements on the intensive margin (double cropping).
31
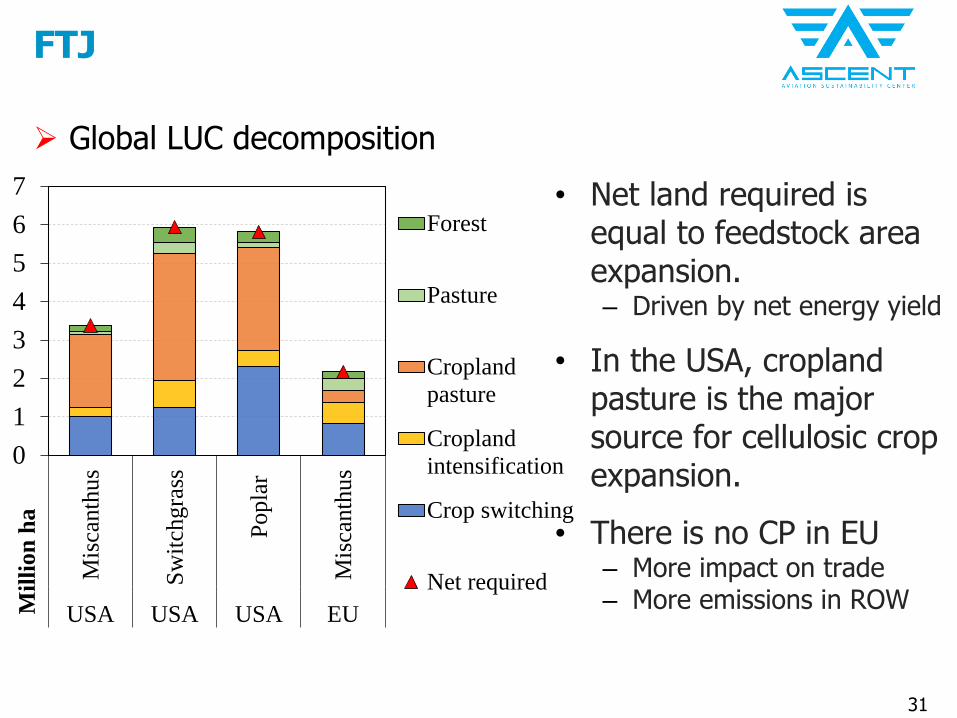
FTJ
• Net land required is equal to feedstock area expansion.– Driven by net energy yield
• In the USA, cropland pasture is the major source for cellulosic crop expansion.
• There is no CP in EU– More impact on trade– More emissions in ROW
Global LUC decomposition
0
1
2
3
4
5
6
7
Mis
canth
us
Sw
itch
gra
ss
Popla
r
Mis
canth
us
USA USA USA EUMil
lion
ha
Forest
Pasture
Cropland
pasture
Cropland
intensification
Crop switching
Net required

32
FTJ
• As perennial crops, cellulosic crops entail high sequestration in soil and biomass– Miscanthus has the highest
sequestration due to the high yield
– Poplar has relatively lower sequestration in soil
• For EU miscanthus– Relatively more global
deforestation compared with the US miscanthus FTJ
-35-30-25-20-15-10-505
101520
Mis
can
thu
s F
TJ
Sw
itch
gra
ss F
TJ
Pop
lar
FT
J
Mis
can
thu
s F
TJ
USA EU
g C
O2e
/MJ
30-year CI


![€¦ · Web view2009. 4. 23. · [Cr2O72-] Reverse Rate. A. increases increases. B. increases decreases. C. decreases decreases. D. decreases increases. 31. A small amount of H2SO4](https://img.pdfslide.us/doc/110x75/608f2c47b9e3f5096f2e5efc/web-view-2009-4-23-cr2o72-reverse-rate-a-increases-increases-b-increases.jpg)


![[MS-SIP]: Session Initiation Protocol ExtensionsMS-SIP].pdfSession Initiation Protocol Extensions SIP. . SIP message.](https://img.pdfslide.us/doc/110x75/5e7f8669844925290d6f8357/ms-sip-session-initiation-protocol-extensions-ms-sippdf-session-initiation.jpg)