Embed Size (px)
Citation preview
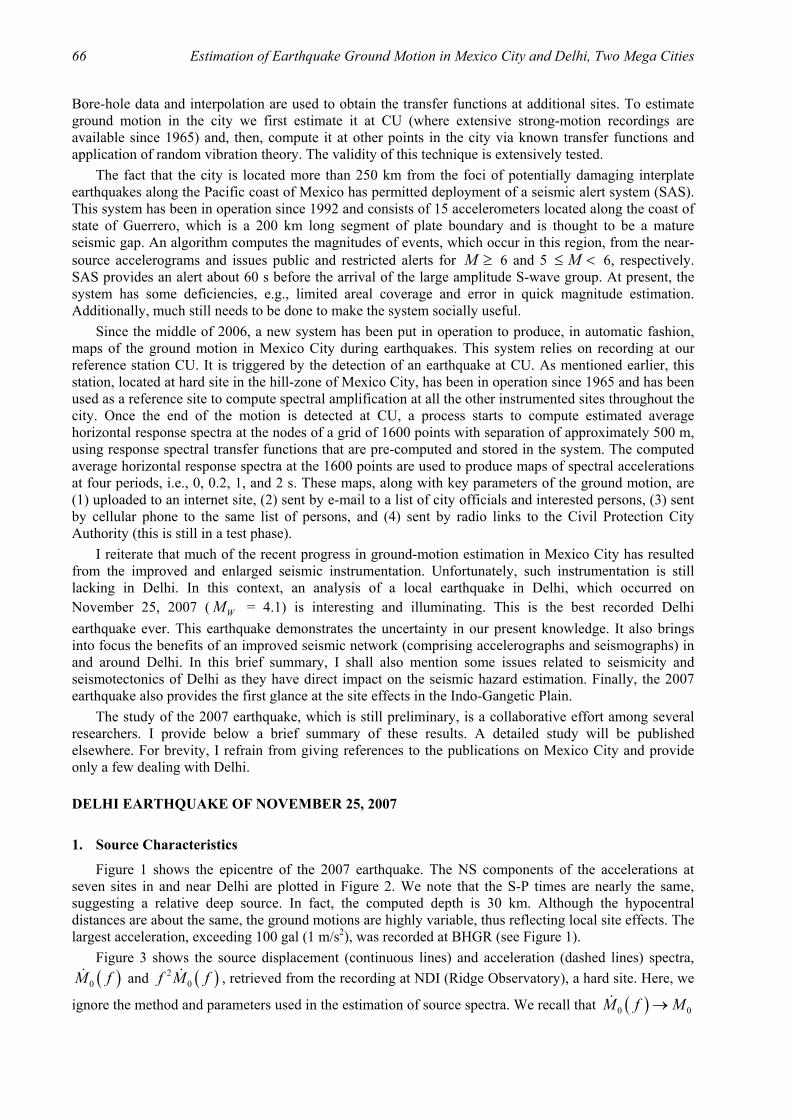
ISET Journal of Earthquake Technology, Paper No. 504, Vol. 46, No. 2, June 2009, pp. 65–76
29th ISET Annual Lecture
ESTIMATION OF EARTHQUAKE GROUND MOTION IN MEXICO CITY AND DELHI, TWO MEGA CITIES
Shri Krishna Singh Instituto de Geofísica
Universidad Nacional Autónoma de México México D.F., México
ABSTRACT
Mexico City and Delhi are subject to strong shaking from large/great plate-boundary, thrust earthquakes located at distances exceeding ~250 km, and from moderate/large local and regional earthquakes. Since the 1985 Michoacan earthquake ( WM = 8), which caused severe damage and loss of lives in Mexico City, our capability of ground-motion estimation in the Valley of Mexico for future earthquakes has greatly improved. A seismic alert system has been in operation since 1992, which provides ~60 s of alert time to the city before the occurrence of intense ground motion. Based on real-time recording at a reference station in the city and known transfer functions of hundreds of sites, shake maps are available within ~5 min of the arrival of S waves. Seismic instrumentation in Delhi is sparse. Our knowledge of local and regional seismicity and seismotectonics for Delhi, therefore, remains poor and estimation of ground motions and site effects is subject to large uncertainty. We illustrate some of these deficiencies from an analysis of the well-recorded Delhi earthquake of November 25, 2007 ( WM = 4.1).
KEYWORDS: Seismic Hazard in Delhi, Ground Motion Estimation in Delhi, Seismotectonics of Delhi, Site Effects in Delhi
INTRODUCTION
It was an honour for me to give the 29th ISET Annual Lecture at Indian Institute of Technology Roorkee. I chose earthquake ground-motion estimation in the mega cities of Mexico City and Delhi as the topic of the lecture. I am more knowledgeable about Mexico City since I live and work there. My forays in ground-motion and seismic hazard estimation in Delhi have come about from sporadic collaborations with my colleagues in India. Tectonic settings of Mexico City and Delhi to some extent are similar: both cities are subject to strong shaking from large/great plate-boundary, thrust earthquakes located at distances exceeding ~250 km, and from moderate/large local and regional earthquakes. For this reason, the experience gained in one city could be useful in the hazard mitigation in the other. Our capability to estimate ground motion in Mexico City has radically improved since the devastating Michoacan earthquake of 1985 ( WM = 8). Although the earthquake was located about 350 km away, it caused unprecedented damage and about 20,000 deaths in the city. It triggered eight accelerographs in the Valley of Mexico. The recordings clearly demonstrated extremely large amplifications and unusually long coda waves in the lake-bed zone of the city. These two characteristics of the ground motion were the main cause of the damage and the destruction. Since 1985 there has been a significant increase in the seismic instrumentation in Mexico (comprising both accelerographs and broadband seismographs). Presently, there are about 100 accelerographs in operation in the city, some of which are located in bore-holes, tall buildings, and on bridges. The data collected since 1985 and its analysis have permitted us a better understanding of the seismicity and source characteristics, attenuation of seismic waves from interplate earthquakes along the Mexican subduction zone and inslab earthquakes in the subducted Cocos plate below Mexico, and amplification of seismic waves in Mexico City. Transfer functions of many soft sites with respect to a reference hard site (denoted as CU) are determined based on the earthquake recordings.
66 Estimation of Earthquake Ground Motion in Mexico City and Delhi, Two Mega Cities
Bore-hole data and interpolation are used to obtain the transfer functions at additional sites. To estimate ground motion in the city we first estimate it at CU (where extensive strong-motion recordings are available since 1965) and, then, compute it at other points in the city via known transfer functions and application of random vibration theory. The validity of this technique is extensively tested. The fact that the city is located more than 250 km from the foci of potentially damaging interplate earthquakes along the Pacific coast of Mexico has permitted deployment of a seismic alert system (SAS). This system has been in operation since 1992 and consists of 15 accelerometers located along the coast of state of Guerrero, which is a 200 km long segment of plate boundary and is thought to be a mature seismic gap. An algorithm computes the magnitudes of events, which occur in this region, from the near-source accelerograms and issues public and restricted alerts for M ≥ 6 and 5 M≤ < 6, respectively. SAS provides an alert about 60 s before the arrival of the large amplitude S-wave group. At present, the system has some deficiencies, e.g., limited areal coverage and error in quick magnitude estimation. Additionally, much still needs to be done to make the system socially useful. Since the middle of 2006, a new system has been put in operation to produce, in automatic fashion, maps of the ground motion in Mexico City during earthquakes. This system relies on recording at our reference station CU. It is triggered by the detection of an earthquake at CU. As mentioned earlier, this station, located at hard site in the hill-zone of Mexico City, has been in operation since 1965 and has been used as a reference site to compute spectral amplification at all the other instrumented sites throughout the city. Once the end of the motion is detected at CU, a process starts to compute estimated average horizontal response spectra at the nodes of a grid of 1600 points with separation of approximately 500 m, using response spectral transfer functions that are pre-computed and stored in the system. The computed average horizontal response spectra at the 1600 points are used to produce maps of spectral accelerations at four periods, i.e., 0, 0.2, 1, and 2 s. These maps, along with key parameters of the ground motion, are (1) uploaded to an internet site, (2) sent by e-mail to a list of city officials and interested persons, (3) sent by cellular phone to the same list of persons, and (4) sent by radio links to the Civil Protection City Authority (this is still in a test phase). I reiterate that much of the recent progress in ground-motion estimation in Mexico City has resulted from the improved and enlarged seismic instrumentation. Unfortunately, such instrumentation is still lacking in Delhi. In this context, an analysis of a local earthquake in Delhi, which occurred on November 25, 2007 ( WM = 4.1) is interesting and illuminating. This is the best recorded Delhi earthquake ever. This earthquake demonstrates the uncertainty in our present knowledge. It also brings into focus the benefits of an improved seismic network (comprising accelerographs and seismographs) in and around Delhi. In this brief summary, I shall also mention some issues related to seismicity and seismotectonics of Delhi as they have direct impact on the seismic hazard estimation. Finally, the 2007 earthquake also provides the first glance at the site effects in the Indo-Gangetic Plain. The study of the 2007 earthquake, which is still preliminary, is a collaborative effort among several researchers. I provide below a brief summary of these results. A detailed study will be published elsewhere. For brevity, I refrain from giving references to the publications on Mexico City and provide only a few dealing with Delhi.
DELHI EARTHQUAKE OF NOVEMBER 25, 2007
1. Source Characteristics
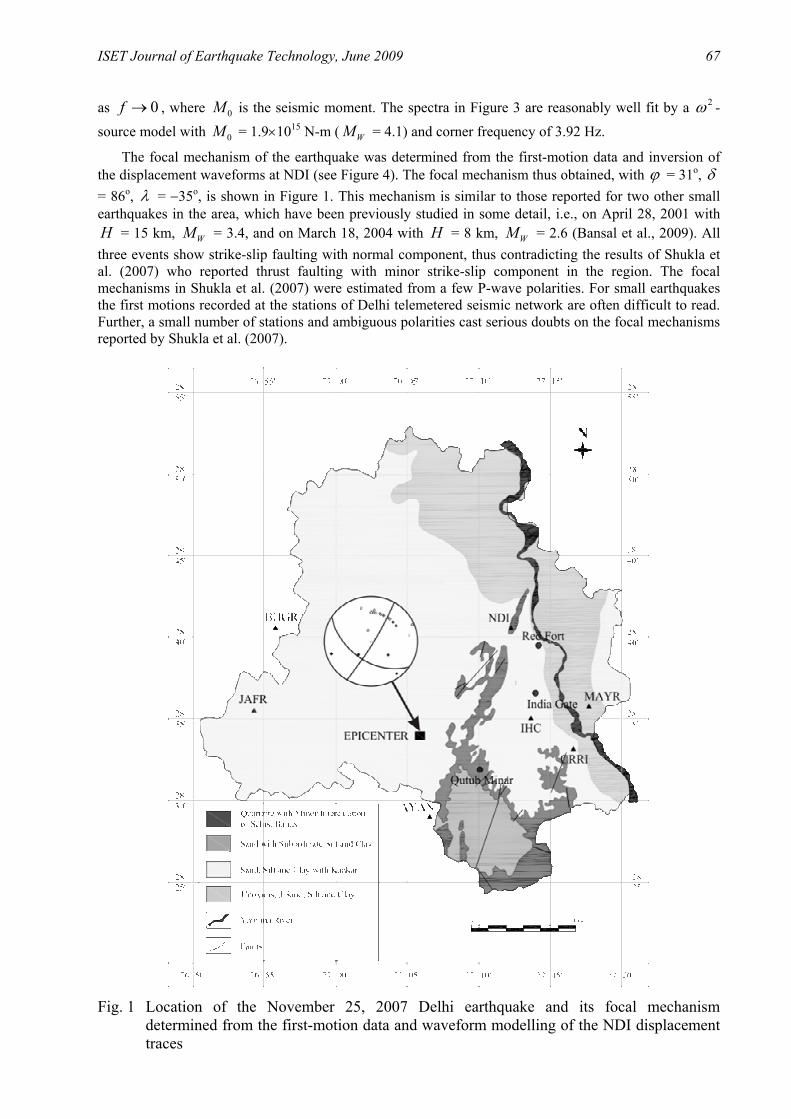
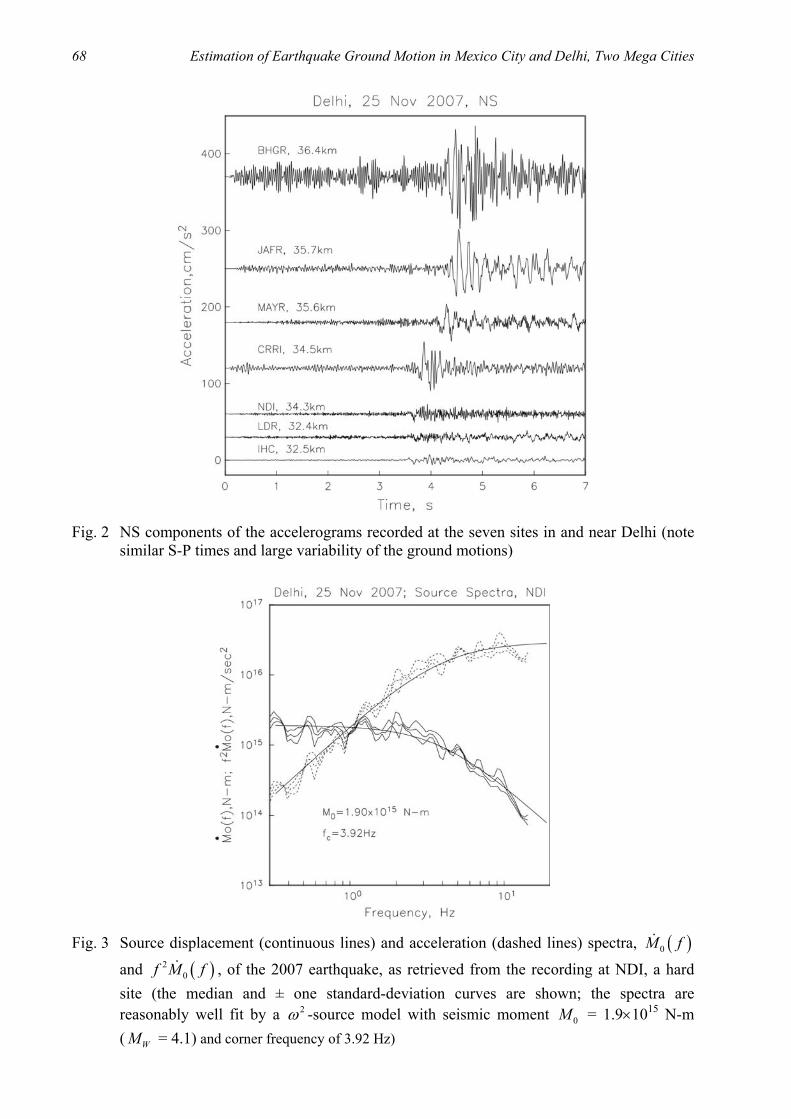
Figure 1 shows the epicentre of the 2007 earthquake. The NS components of the accelerations at seven sites in and near Delhi are plotted in Figure 2. We note that the S-P times are nearly the same, suggesting a relative deep source. In fact, the computed depth is 30 km. Although the hypocentral distances are about the same, the ground motions are highly variable, thus reflecting local site effects. The largest acceleration, exceeding 100 gal (1 m/s2), was recorded at BHGR (see Figure 1). Figure 3 shows the source displacement (continuous lines) and acceleration (dashed lines) spectra,
( )0M f and ( )20f M f , retrieved from the recording at NDI (Ridge Observatory), a hard site. Here, we
ignore the method and parameters used in the estimation of source spectra. We recall that ( )0 0M f M→
ISET Journal of Earthquake Technology, June 2009 67
as 0f → , where 0M is the seismic moment. The spectra in Figure 3 are reasonably well fit by a 2ω -
source model with 0M = 1.9×10¹⁵ N-m ( WM = 4.1) and corner frequency of 3.92 Hz.
The focal mechanism of the earthquake was determined from the first-motion data and inversion of the displacement waveforms at NDI (see Figure 4). The focal mechanism thus obtained, with ϕ = 31o, δ = 86o, λ = −35o, is shown in Figure 1. This mechanism is similar to those reported for two other small earthquakes in the area, which have been previously studied in some detail, i.e., on April 28, 2001 with H = 15 km, WM = 3.4, and on March 18, 2004 with H = 8 km, WM = 2.6 (Bansal et al., 2009). All three events show strike-slip faulting with normal component, thus contradicting the results of Shukla et al. (2007) who reported thrust faulting with minor strike-slip component in the region. The focal mechanisms in Shukla et al. (2007) were estimated from a few P-wave polarities. For small earthquakes the first motions recorded at the stations of Delhi telemetered seismic network are often difficult to read. Further, a small number of stations and ambiguous polarities cast serious doubts on the focal mechanisms reported by Shukla et al. (2007).
Fig. 1 Location of the November 25, 2007 Delhi earthquake and its focal mechanism
determined from the first-motion data and waveform modelling of the NDI displacement traces
68 Estimation of Earthquake Ground Motion in Mexico City and Delhi, Two Mega Cities
Fig. 2 NS components of the accelerograms recorded at the seven sites in and near Delhi (note
similar S-P times and large variability of the ground motions)
Fig. 3 Source displacement (continuous lines) and acceleration (dashed lines) spectra, ( )0M f
and ( )20f M f , of the 2007 earthquake, as retrieved from the recording at NDI, a hard
site (the median and ± one standard-deviation curves are shown; the spectra are reasonably well fit by a 2ω -source model with seismic moment 0M = 1.9×10¹⁵ N-m ( WM = 4.1) and corner frequency of 3.92 Hz)
ISET Journal of Earthquake Technology, June 2009 69
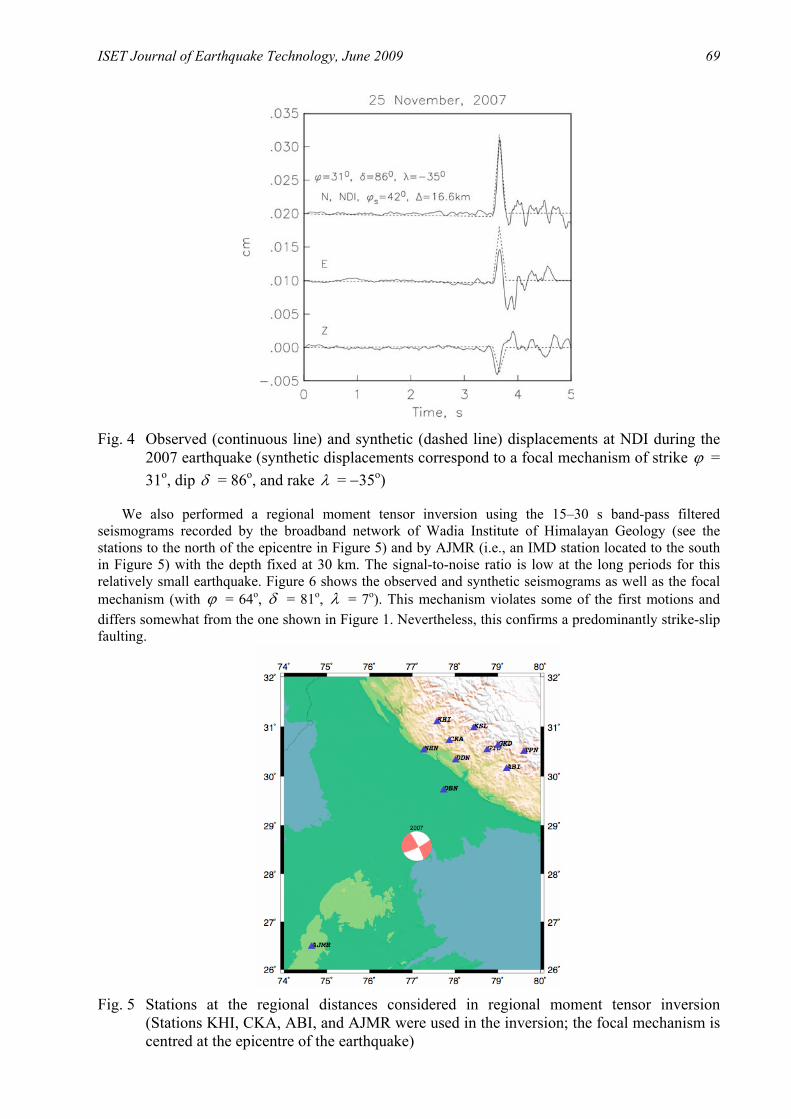
Fig. 4 Observed (continuous line) and synthetic (dashed line) displacements at NDI during the
2007 earthquake (synthetic displacements correspond to a focal mechanism of strike ϕ = 31o, dip δ = 86o, and rake λ = −35o)
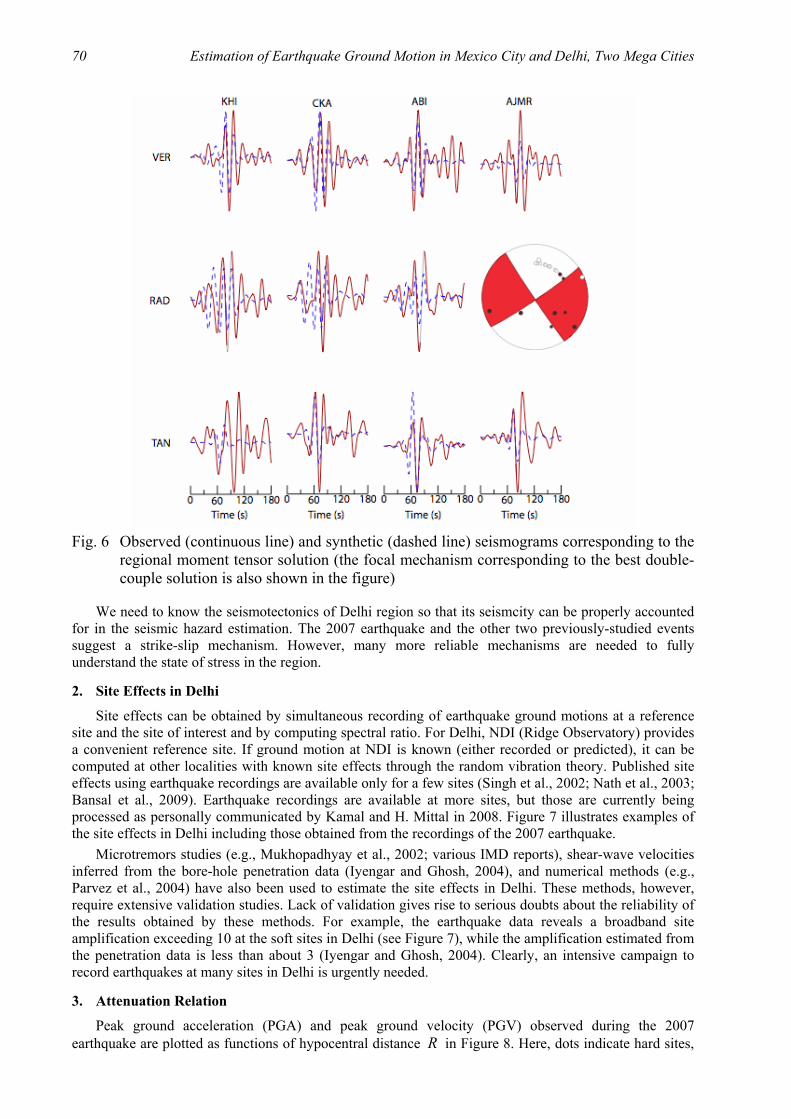
We also performed a regional moment tensor inversion using the 15–30 s band-pass filtered seismograms recorded by the broadband network of Wadia Institute of Himalayan Geology (see the stations to the north of the epicentre in Figure 5) and by AJMR (i.e., an IMD station located to the south in Figure 5) with the depth fixed at 30 km. The signal-to-noise ratio is low at the long periods for this relatively small earthquake. Figure 6 shows the observed and synthetic seismograms as well as the focal mechanism (with ϕ = 64o, δ = 81o, λ = 7o). This mechanism violates some of the first motions and differs somewhat from the one shown in Figure 1. Nevertheless, this confirms a predominantly strike-slip faulting.
Fig. 5 Stations at the regional distances considered in regional moment tensor inversion
(Stations KHI, CKA, ABI, and AJMR were used in the inversion; the focal mechanism is centred at the epicentre of the earthquake)
70 Estimation of Earthquake Ground Motion in Mexico City and Delhi, Two Mega Cities
Fig. 6 Observed (continuous line) and synthetic (dashed line) seismograms corresponding to the
regional moment tensor solution (the focal mechanism corresponding to the best double-couple solution is also shown in the figure)
We need to know the seismotectonics of Delhi region so that its seismcity can be properly accounted for in the seismic hazard estimation. The 2007 earthquake and the other two previously-studied events suggest a strike-slip mechanism. However, many more reliable mechanisms are needed to fully understand the state of stress in the region.
2. Site Effects in Delhi
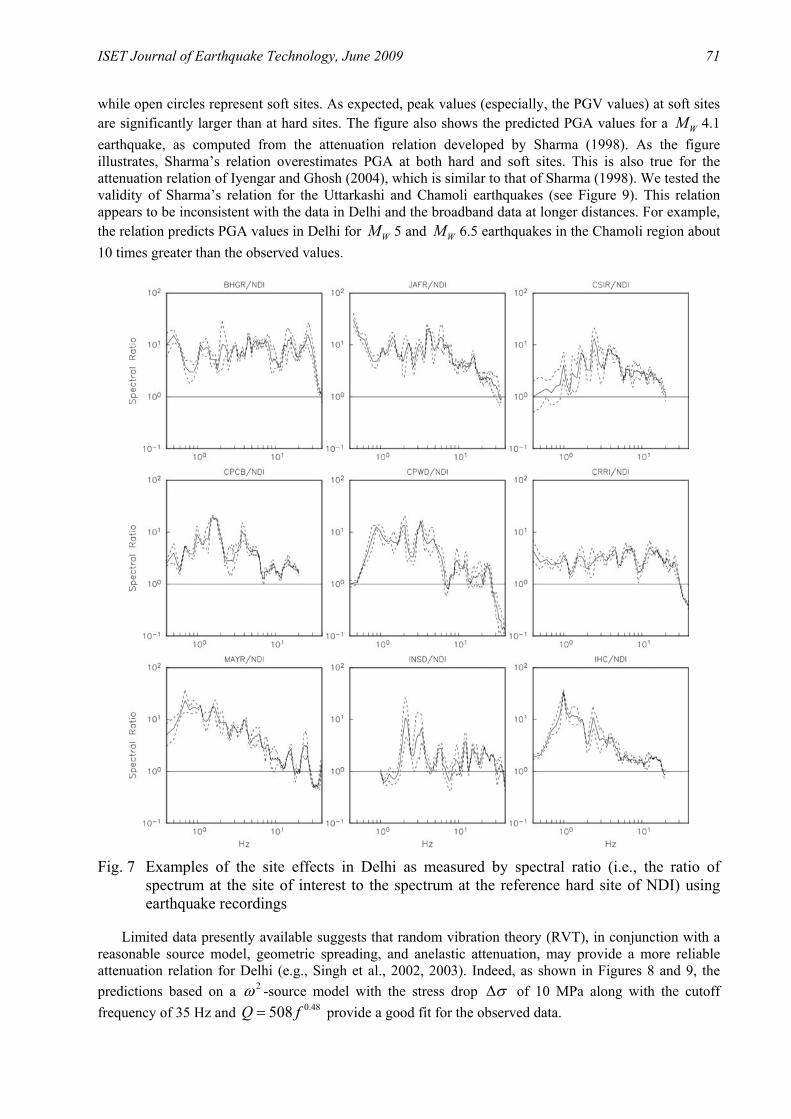
Site effects can be obtained by simultaneous recording of earthquake ground motions at a reference site and the site of interest and by computing spectral ratio. For Delhi, NDI (Ridge Observatory) provides a convenient reference site. If ground motion at NDI is known (either recorded or predicted), it can be computed at other localities with known site effects through the random vibration theory. Published site effects using earthquake recordings are available only for a few sites (Singh et al., 2002; Nath et al., 2003; Bansal et al., 2009). Earthquake recordings are available at more sites, but those are currently being processed as personally communicated by Kamal and H. Mittal in 2008. Figure 7 illustrates examples of the site effects in Delhi including those obtained from the recordings of the 2007 earthquake. Microtremors studies (e.g., Mukhopadhyay et al., 2002; various IMD reports), shear-wave velocities inferred from the bore-hole penetration data (Iyengar and Ghosh, 2004), and numerical methods (e.g., Parvez et al., 2004) have also been used to estimate the site effects in Delhi. These methods, however, require extensive validation studies. Lack of validation gives rise to serious doubts about the reliability of the results obtained by these methods. For example, the earthquake data reveals a broadband site amplification exceeding 10 at the soft sites in Delhi (see Figure 7), while the amplification estimated from the penetration data is less than about 3 (Iyengar and Ghosh, 2004). Clearly, an intensive campaign to record earthquakes at many sites in Delhi is urgently needed.
3. Attenuation Relation
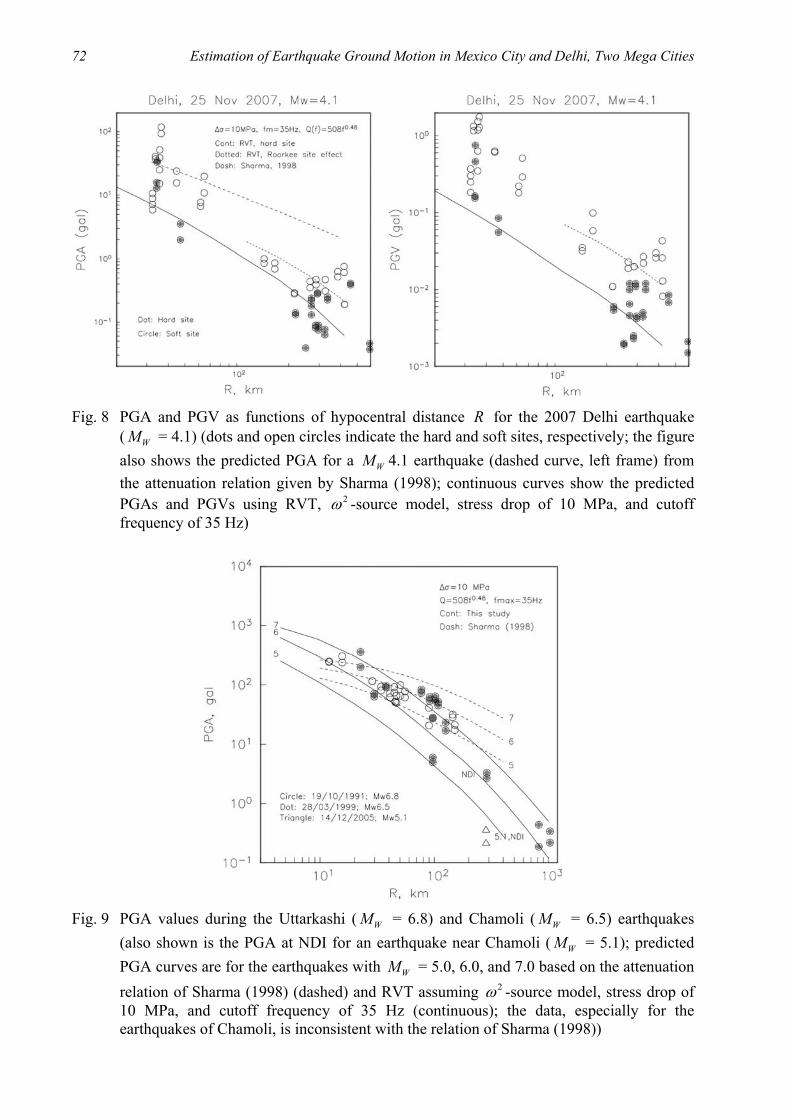
Peak ground acceleration (PGA) and peak ground velocity (PGV) observed during the 2007 earthquake are plotted as functions of hypocentral distance R in Figure 8. Here, dots indicate hard sites,
ISET Journal of Earthquake Technology, June 2009 71
while open circles represent soft sites. As expected, peak values (especially, the PGV values) at soft sites are significantly larger than at hard sites. The figure also shows the predicted PGA values for a WM 4.1 earthquake, as computed from the attenuation relation developed by Sharma (1998). As the figure illustrates, Sharma’s relation overestimates PGA at both hard and soft sites. This is also true for the attenuation relation of Iyengar and Ghosh (2004), which is similar to that of Sharma (1998). We tested the validity of Sharma’s relation for the Uttarkashi and Chamoli earthquakes (see Figure 9). This relation appears to be inconsistent with the data in Delhi and the broadband data at longer distances. For example, the relation predicts PGA values in Delhi for WM 5 and WM 6.5 earthquakes in the Chamoli region about 10 times greater than the observed values.
Fig. 7 Examples of the site effects in Delhi as measured by spectral ratio (i.e., the ratio of
spectrum at the site of interest to the spectrum at the reference hard site of NDI) using earthquake recordings
Limited data presently available suggests that random vibration theory (RVT), in conjunction with a reasonable source model, geometric spreading, and anelastic attenuation, may provide a more reliable attenuation relation for Delhi (e.g., Singh et al., 2002, 2003). Indeed, as shown in Figures 8 and 9, the predictions based on a 2ω -source model with the stress drop σ∆ of 10 MPa along with the cutoff frequency of 35 Hz and 0.48508Q f= provide a good fit for the observed data.
72 Estimation of Earthquake Ground Motion in Mexico City and Delhi, Two Mega Cities
Fig. 8 PGA and PGV as functions of hypocentral distance R for the 2007 Delhi earthquake
( WM = 4.1) (dots and open circles indicate the hard and soft sites, respectively; the figure also shows the predicted PGA for a WM 4.1 earthquake (dashed curve, left frame) from the attenuation relation given by Sharma (1998); continuous curves show the predicted PGAs and PGVs using RVT, 2ω -source model, stress drop of 10 MPa, and cutoff frequency of 35 Hz)
Fig. 9 PGA values during the Uttarkashi ( WM = 6.8) and Chamoli ( WM = 6.5) earthquakes
(also shown is the PGA at NDI for an earthquake near Chamoli ( WM = 5.1); predicted PGA curves are for the earthquakes with WM = 5.0, 6.0, and 7.0 based on the attenuation relation of Sharma (1998) (dashed) and RVT assuming 2ω -source model, stress drop of 10 MPa, and cutoff frequency of 35 Hz (continuous); the data, especially for the earthquakes of Chamoli, is inconsistent with the relation of Sharma (1998))
ISET Journal of Earthquake Technology, June 2009 73
4. Site Effects in the Indo-Gangetic Plain
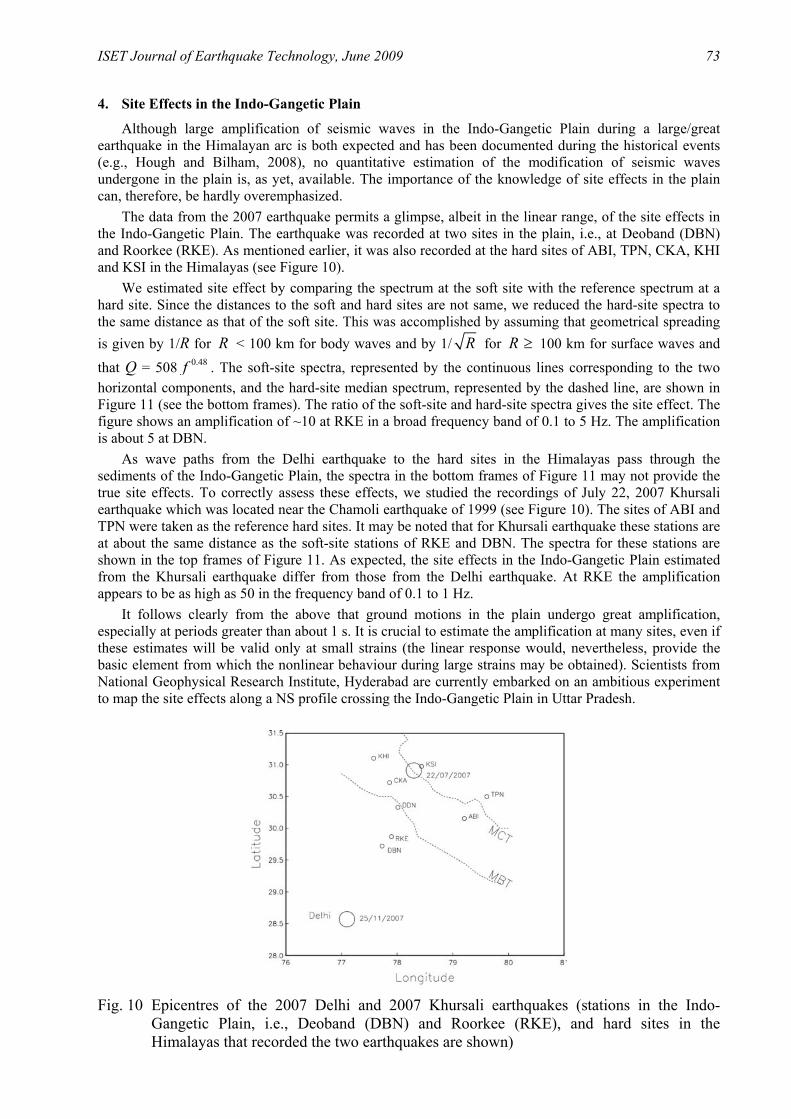
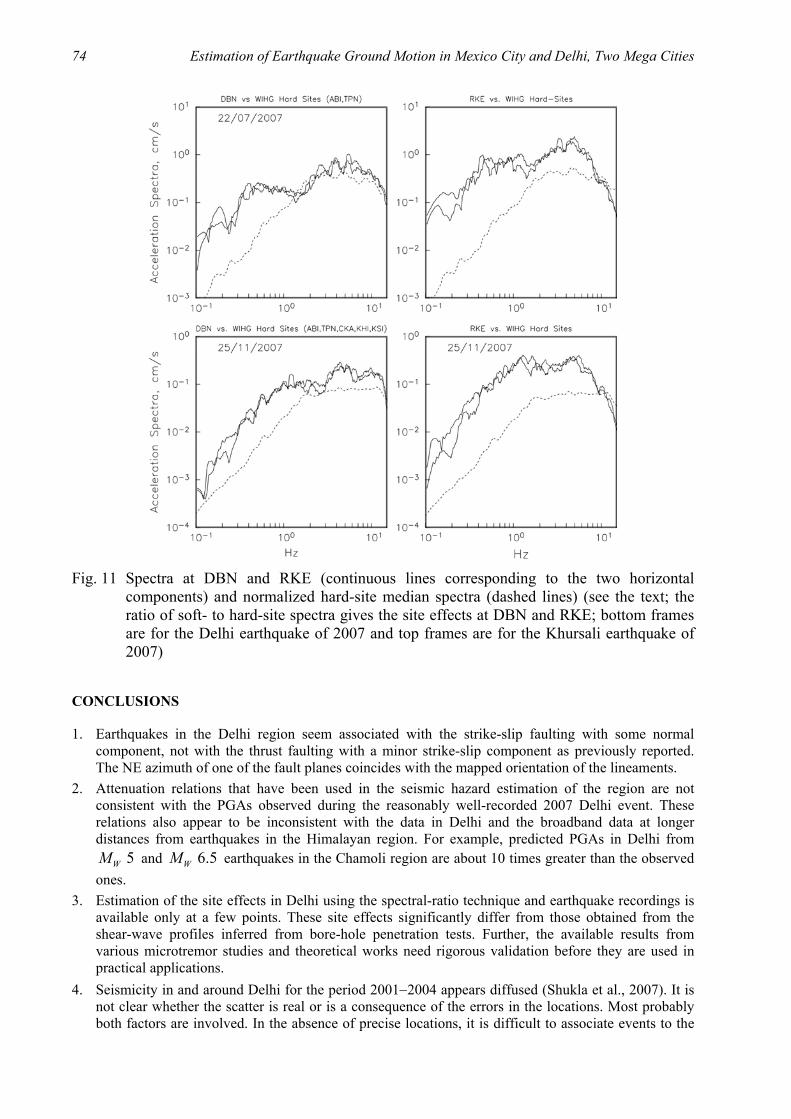
Although large amplification of seismic waves in the Indo-Gangetic Plain during a large/great earthquake in the Himalayan arc is both expected and has been documented during the historical events (e.g., Hough and Bilham, 2008), no quantitative estimation of the modification of seismic waves undergone in the plain is, as yet, available. The importance of the knowledge of site effects in the plain can, therefore, be hardly overemphasized. The data from the 2007 earthquake permits a glimpse, albeit in the linear range, of the site effects in the Indo-Gangetic Plain. The earthquake was recorded at two sites in the plain, i.e., at Deoband (DBN) and Roorkee (RKE). As mentioned earlier, it was also recorded at the hard sites of ABI, TPN, CKA, KHI and KSI in the Himalayas (see Figure 10). We estimated site effect by comparing the spectrum at the soft site with the reference spectrum at a hard site. Since the distances to the soft and hard sites are not same, we reduced the hard-site spectra to the same distance as that of the soft site. This was accomplished by assuming that geometrical spreading is given by 1/R for R < 100 km for body waves and by 1/ R for R ≥ 100 km for surface waves and that Q = 508 0.48f . The soft-site spectra, represented by the continuous lines corresponding to the two horizontal components, and the hard-site median spectrum, represented by the dashed line, are shown in Figure 11 (see the bottom frames). The ratio of the soft-site and hard-site spectra gives the site effect. The figure shows an amplification of ~10 at RKE in a broad frequency band of 0.1 to 5 Hz. The amplification is about 5 at DBN. As wave paths from the Delhi earthquake to the hard sites in the Himalayas pass through the sediments of the Indo-Gangetic Plain, the spectra in the bottom frames of Figure 11 may not provide the true site effects. To correctly assess these effects, we studied the recordings of July 22, 2007 Khursali earthquake which was located near the Chamoli earthquake of 1999 (see Figure 10). The sites of ABI and TPN were taken as the reference hard sites. It may be noted that for Khursali earthquake these stations are at about the same distance as the soft-site stations of RKE and DBN. The spectra for these stations are shown in the top frames of Figure 11. As expected, the site effects in the Indo-Gangetic Plain estimated from the Khursali earthquake differ from those from the Delhi earthquake. At RKE the amplification appears to be as high as 50 in the frequency band of 0.1 to 1 Hz. It follows clearly from the above that ground motions in the plain undergo great amplification, especially at periods greater than about 1 s. It is crucial to estimate the amplification at many sites, even if these estimates will be valid only at small strains (the linear response would, nevertheless, provide the basic element from which the nonlinear behaviour during large strains may be obtained). Scientists from National Geophysical Research Institute, Hyderabad are currently embarked on an ambitious experiment to map the site effects along a NS profile crossing the Indo-Gangetic Plain in Uttar Pradesh.
Fig. 10 Epicentres of the 2007 Delhi and 2007 Khursali earthquakes (stations in the Indo-
Gangetic Plain, i.e., Deoband (DBN) and Roorkee (RKE), and hard sites in the Himalayas that recorded the two earthquakes are shown)
74 Estimation of Earthquake Ground Motion in Mexico City and Delhi, Two Mega Cities
Fig. 11 Spectra at DBN and RKE (continuous lines corresponding to the two horizontal
components) and normalized hard-site median spectra (dashed lines) (see the text; the ratio of soft- to hard-site spectra gives the site effects at DBN and RKE; bottom frames are for the Delhi earthquake of 2007 and top frames are for the Khursali earthquake of 2007)
CONCLUSIONS
1. Earthquakes in the Delhi region seem associated with the strike-slip faulting with some normal component, not with the thrust faulting with a minor strike-slip component as previously reported. The NE azimuth of one of the fault planes coincides with the mapped orientation of the lineaments.
2. Attenuation relations that have been used in the seismic hazard estimation of the region are not consistent with the PGAs observed during the reasonably well-recorded 2007 Delhi event. These relations also appear to be inconsistent with the data in Delhi and the broadband data at longer distances from earthquakes in the Himalayan region. For example, predicted PGAs in Delhi from
5WM and 6.5WM earthquakes in the Chamoli region are about 10 times greater than the observed ones.
3. Estimation of the site effects in Delhi using the spectral-ratio technique and earthquake recordings is available only at a few points. These site effects significantly differ from those obtained from the shear-wave profiles inferred from bore-hole penetration tests. Further, the available results from various microtremor studies and theoretical works need rigorous validation before they are used in practical applications.
4. Seismicity in and around Delhi for the period 2001−2004 appears diffused (Shukla et al., 2007). It is not clear whether the scatter is real or is a consequence of the errors in the locations. Most probably both factors are involved. In the absence of precise locations, it is difficult to associate events to the
ISET Journal of Earthquake Technology, June 2009 75
mapped faults. The percentage of events which should be considered random is therefore not known. These uncertainties lead to unreliable seismic hazard estimation.
5. A matter of serious concern is the difference in the seismicity rates of Delhi and the surrounding region (excluding the Himalayan arc) as reported by Iyengar and Ghosh (2004) and Shukla et al. (2007). The area covered in the former study is about 2×10⁵ km2, while it is 4×10⁴ km2 in the latter work. The normalized seismicity rate (per year per unit area) in Iyengar and Ghosh (2004) is 10 times smaller than that in Shukla et al. (2007). What is the reason for such a large difference? One possibility is that seismicity is actually higher in a smaller area than that in a larger area. It is also possible that the earthquake catalogue used in Iyengar and Ghosh (2004) is incomplete. In any case, it is critically important to resolve this issue.
6. Results at a couple of sites in the Indo-Gangetic Plain have shown large amplification over a broad frequency range. It is of urgent need to carry out an extensive site effect study in the plain, preferably based on earthquake recordings.
In summary, our present knowledge of seismicity, seismotectonics, attenuation relation and site effects in Delhi is very poor. As a consequence, estimation of seismic hazard in the city is fraught with uncertainties. As shown above, analysis of a single, reasonably well-recorded earthquake can lead to significant improvement in our knowledge. Clearly, there is an urgent need for an improved and enlarged seismic instrumentation in and around Delhi. The recent installation of 20 accelerographs in Delhi by IIT-Roorkee should prove useful. However, only a denser network of seismographs will properly resolve the issues of seismicity, seismotectonics, and site effects.
ACKNOWLEDGMENTS
Strong-motion and seismographic network in Mexico are funded by several institutions in Mexico including UNAM, Mexico City Government, Interior Ministry of Mexico, CONACyT, and by NSF of USA. The data from India used in this study were obtained under the projects funded by Ministry of Earth Sciences and Department of Science and Technology (DST), Government of India to IMD, WIHG, IIT-Roorkee, CBRI and NGRI. The research reported here was partly funded by CONACyT and DST under the Indo-Mexican Cooperation Programme in Science and Technology. Some results reported here are preliminary. Also, the list of authors in the final manuscript on the analysis of the 2007 Delhi earthquake will include all participants in this research.
REFERENCES
1. Bansal, B.K., Singh, S.K., Dharmaraju, R., Pacheco, J.F., Ordaz, M., Dattatrayam, R.S. and Suresh, G. (2009). “Source Study of Two Small Earthquakes of Delhi, India, and Estimation of Ground Motion from Future Moderate, Local Events”, Journal of Seismology, Vol. 13, No. 1, pp. 89–105.
2. Hough, S.E. and Bilham, R. (2008). “Site Response of the Ganges Basin Inferred from Re-evaluated Macroseismic Observations from the 1897 Shillong, 1905 Kangra and 1934 Nepal Earthquakes”, Journal of Earth System Science, Vol. 117, No. S2, pp. 773–782.
3. Iyengar, R.N. and Ghosh, S. (2004). “Microzonation of Earthquake Hazard in Greater Delhi Area”, Current Science, Vol. 87, No. 9, pp. 1193–1202.
4. Mukhopadhyay, S., Pandey, Y., Dharmaraju, R., Chauhan, P.K.S., Singh, P. and Dev, A. (2002). “Seismic Microzonation of Delhi for Ground-Shaking Site Effects”, Current Science, Vol. 82, No. 7, pp. 877–880.
5. Nath, S.K., Sengupta, P., Srivastav, S.K., Bhattacharya, S.N., Dattatrayam, R.S., Prakash, R. and Gupta, H.V. (2003). “Estimation of S-Wave Site Response in and around Delhi Region from Weak Motion Data”, Earth and Planetary Sciences, Proceedings of the Indian Academy of Sciences, Vol. 112, No. 3, pp. 441–462.
6. Parvez, I.A., Vaccari, F. and Panza, G.F. (2004). “Site-Specific Microzonation Study in Delhi Metropolitan City by 2-D Modeling of SH and P-SV Waves”, Pure and Applied Geophysics, Vol. 161, No. 5-6, pp. 1165–1184.
76 Estimation of Earthquake Ground Motion in Mexico City and Delhi, Two Mega Cities
7. Sharma, M.L. (1998). “Attenuation Relationship for Estimation of Peak Ground Horizontal Acceleration Using Data from Strong-Motion Arrays in India”, Bulletin of the Seismological Society of America, Vol. 88, No. 4, pp. 1063–1069.
8. Sharma, M.L., Wason, H.R. and Dimri, R. (2003). “Seismic Zonation of the Delhi Region for Bedrock Ground Motion”, Pure and Applied Geophysics, Vol. 160, No. 12, pp. 2381–2398.
9. Shukla, A.K., Prakash, R., Singh, R.K., Mishra, P.S. and Bhatnagar, A.K. (2007). “Seismotectonics Implications of Delhi Region through Fault Plane Solutions of Some Recent Earthquakes”, Current Science, Vol. 93, No. 12, pp. 1848–1853.
10. Singh, S.K., Mohanty, W.K., Bansal, B.K. and Roonwal, G.S. (2002). “Ground Motion in Delhi from Future Large/Great Earthquakes in the Central Seismic Gap of the Himalayan Arc”, Bulletin of the Seismological Society of America, Vol. 92, No. 2, pp. 555–569.
11. Singh, S.K., Bansal, B.K., Bhattacharya, S.N., Pacheco, J.F., Dattatrayam, R.S., Ordaz, M., Suresh, G., Kamal and Hough, S.E. (2003), “Estimation of Ground Motion for Bhuj (26 January 2001;
WM 7.6) and for Future Earthquakes in India”, Bulletin of the Seismological Society of America, Vol. 93, No. 1, pp. 353–370.