Embed Size (px)
Citation preview
1
Estimation of Capacity of Escalators in LondonUnderground
Paul DavisLondon School of Economics and Political SciencesLondon, WC2A 2AEUK
Goutam DuttaIndian Institute of ManagementAhmedabad-380015, Gujarat, India

2
Abstract
In this paper we discuss a deterministic model for computing the capacity of theescalator in London Underground. We develop this model from fundamentalprinciples of engineering by separating the capacities of standing and walking side ofthe escalator. By collecting real world data, we find the accuracy of this capacitycomputation. We also develop a multiple regression model that considers the effect ofrise of the escalator with the capacity. We discuss the technical and behaviouralreasons for differences in capacities of two methods.
3
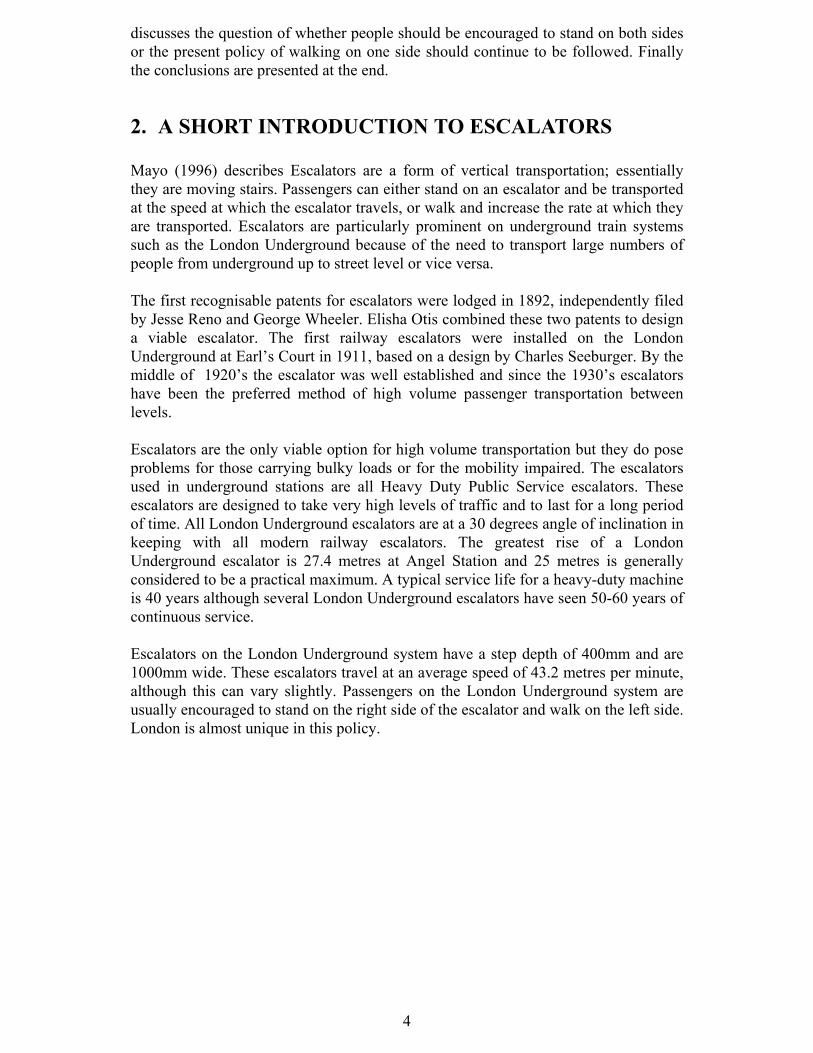
1. INTRODUCTION
Transport for London (TfL), is an executive arm of the Greater London Authority(GLA) reporting to London’s Mayor. It is made up of many predecessororganisations covering almost all transport modes in London, including the tube.London Underground (LU) manages the day-to-day tube operations, serving 275stations and 3 million customers each day. There are 409 escalators on the LU system– the longest one is 60 metres at Angel station. The Operational Department of theLondon School of Economics (LSE) has undertaken a study of escalator capacity onthe tube. LU provided advice and support during the LSE study.
There is a little information on the dynamics of passenger behaviour on and aroundescalators. This is accentuated by the fact that escalators in the London Transportsystem are almost unique in that they have both standing and walking sides ratherthan just standing on both sides. This not only reduces the applicability of work doneon escalators elsewhere but also complicates the problem considerably. There hasbeen little work done in the past, which separates the walking and standing sides of anescalator. Below is a list of the questions, which are addressed in this paper.
1) What is the capacity of an escalator?
• LU Guidelines use a figure of 100 passengers per minute (ppm) whilstpedestrian simulation models accept that for short periods of time thisfigure is 120 ppm.
• Are the guidelines accurate or should a change to them berecommended?
• Is a single figure for escalator capacity justifiable or are escalatorsdifferent enough to warrant more than one figure?
2) What factors affect the capacity of an escalator?
• Is there a difference in capacity between up and down escalators?• Does the approach to an escalator have an effect on capacity?• Does the rise of an escalator affect its capacity?• Does a double escalator have a lower capacity than two single
escalators?• Does the purpose of the journey have an effect on capacity?
3) Would capacity be increased if both sides of an escalator were for standingpassengers only?• Would this conclusion be different for different escalators?
Section 2 introduces an escalator in brief. Section 3 is a summary of the interestingstudies on and around the subject of escalator capacity. In the following section(section 4), there is a description of the work done for this project and details on howthe work was done. This includes a section on how the data was collected, with anemphasis on making the data from different escalators comparable. Section 5 dealswith the theoretical work, all done prior to the collection of any data. Section 6 looksat the data on up escalators and finds some relationships as well as finding reasons forthose relationships, whilst Section 7 does the same for the down escalators. Section 8
4
discusses the question of whether people should be encouraged to stand on both sidesor the present policy of walking on one side should continue to be followed. Finallythe conclusions are presented at the end.
2. A SHORT INTRODUCTION TO ESCALATORS
Mayo (1996) describes Escalators are a form of vertical transportation; essentiallythey are moving stairs. Passengers can either stand on an escalator and be transportedat the speed at which the escalator travels, or walk and increase the rate at which theyare transported. Escalators are particularly prominent on underground train systemssuch as the London Underground because of the need to transport large numbers ofpeople from underground up to street level or vice versa.
The first recognisable patents for escalators were lodged in 1892, independently filedby Jesse Reno and George Wheeler. Elisha Otis combined these two patents to designa viable escalator. The first railway escalators were installed on the LondonUnderground at Earl’s Court in 1911, based on a design by Charles Seeburger. By themiddle of 1920’s the escalator was well established and since the 1930’s escalatorshave been the preferred method of high volume passenger transportation betweenlevels.
Escalators are the only viable option for high volume transportation but they do poseproblems for those carrying bulky loads or for the mobility impaired. The escalatorsused in underground stations are all Heavy Duty Public Service escalators. Theseescalators are designed to take very high levels of traffic and to last for a long periodof time. All London Underground escalators are at a 30 degrees angle of inclination inkeeping with all modern railway escalators. The greatest rise of a LondonUnderground escalator is 27.4 metres at Angel Station and 25 metres is generallyconsidered to be a practical maximum. A typical service life for a heavy-duty machineis 40 years although several London Underground escalators have seen 50-60 years ofcontinuous service.
Escalators on the London Underground system have a step depth of 400mm and are1000mm wide. These escalators travel at an average speed of 43.2 metres per minute,although this can vary slightly. Passengers on the London Underground system areusually encouraged to stand on the right side of the escalator and walk on the left side.London is almost unique in this policy.

5
3. LITERATURE SURVEY
In this section, we discuss the previous studies on and around the subject of escalatorcapacity. We found however that very little, if any, work has been done which hasseparated the standing and walking sides of an escalator.
3.1. Passenger space on escalators
Depth
18’’
(457mm)
Breadth
24’’ (610mm)
Figure3.1 - The Human ellipse
Fruin (1987) discusses the concept of passenger space. Above is a diagram of thehuman ellipse. The person is represented by a round head and rectangular shouldersand the space a person needs to feel comfortable (termed the human ellipse) is alsoshown. It is possible that the measurements would be different in the differentcountries, although any difference is unlikely to be great. It is known that people inthe Far East have considerably smaller human ellipses both because they arephysically smaller on average but also because they have less need for personal space,presumably due to cultural and other differences. It should be noted that the additionalspace around the shoulders is not as great as that directly in front or behind anindividuals’ face.
3.2. Standing on escalators
Onepersonper step
Side bySide{
In frontof eachother {
Figure 3.2 - The effect of the human ellipse
The diagram above shows the effect of this human ellipse on escalator travel. Thediagram on the right (which assumes that everybody stands) shows how humancontact can and often is avoided on an escalator. Only one person stands on each stepand people do not stand in front of each other. The diagram on the left shows twosituations. Firstly, people standing side by side, this involves only a small overlap ofpersonal space and is therefore often tolerated. Fortunately, this does allow people towalk past each other on the escalator without causing too much discomfort. People are

6
also shown standing directly in front of one another. This clearly causes an invasionof personal space and is something that people tend to avoid. Certainly, three peoplestanding directly in front of each other on an up escalator as shown in the diagram isvery unusual unless the people know each other very well!!
Therefore, standing people will invariably leave one empty step between them and theperson in front meaning that on average people stand on every second step. Furtherresearch is necessary to ascertain whether this is a true average.
In his work, Fruin (1987) also addresses passenger sub-optimising behaviour.Passengers will generally attempt to optimise their own escalator experience but thisdoes not lead to optimisation of the escalator experience for all passengers as a whole.As passengers are waiting to board an escalator they no doubt wish that people wouldstand closer together. However, when a passenger actually comes to board anescalator, the time saving he can make by stepping on the step behind the person infront is so minimal as to not warrant consideration when compared against the issuesof personal comfort and space. This is a classic case of user optimisation not leadingto system optimisation.
3.3. A study of escalators and associated flow systems
The work by Mayo (1966) is perhaps the most interesting work on the subject ofescalator capacity. The bulk of this study is looking at the controllable aspects of anescalator, which can affect capacity. Mayo lists these controllable factors as:• Escalator speed• Geometry of approach• Ticket gates
According to the study, the ticket gate is usually unimportant. This study is mostsuccessful in finding an optimum escalator speed. Mayo then proceeds to list thosevariables he considers to be uncontrollable:
• Walk:stand Ratio• Vertical rise• Total flow of passengers• Distance of escalator from platform
With respect to walk stand ratio, an interesting claim in this study is that “in a crushcondition, passengers enter the system at the same rate whether with walking orstanding intentions, and what they do on the escalator has no effect on capacity.”
As far as vertical rise is considered, Mayo states that more people are prepared towalk up a shorter escalator (obviously!!). The total flow of passengers also affects thewalk/stand ratio. The distance from the platform to the escalator also affects theelevator. If the passengers come straight from the platform onto the escalator they arebunched and pass on in a mass. Passageways however tend to smooth out thetrainload, depending on their length and complexity”i and therefore passengers willreach the escalator over a longer period of time.

7
This study (Mayo, 1996) looks at the escalator as only part of a flow system from theplatform to the ticket gates. The only part of interest to this report is that concerningescalators. Mayo found a correlation between the capacity of an escalator and thespeed at which it is travelling. He found that people stand closer together on a slowermoving escalator but there are more steps per unit time with a faster moving escalator(obviously!!). When these two factors are taken into account a regression line ofcapacity against speed is produced which shows maximum capacity to be obtainableat approximately 150 feet/minute.
In doing this Mayo produces a multiple regression equation, which includes theregression factors, escalator speed in feet per minute (s), vertical rise in feet (h) andtraffic flow in passengers per hour (t). He finds that:
Capacity (max.) = 1.329s - 0.0055s2 - 0.875h + 0.0112t + 0.0075hs - 11.20
and
Capacity (mean) = 1.553s - 0.0059s2 - 0.265h + 0.0163t + 0.032hs - 68.33
Where capacity (max.) is the maximum reading at an escalator in passengers perminute and capacity (mean) the average reading, also in passengers per minute. Mayouses the traffic flow regression factor to take into account the fact that some escalatorsare busier than others.
Mayo then proceeds to look at the problem of the approach to the escalator. He triesto simplify the problem by looking at escalators in isolation and by merely looking atthe geography of the approach rather than the possibilities of traffic flow which occurdue to the existence of other escalators. He comes to the conclusion that openapproaches (unrestricted access) result in the highest capacity, explaining this by thefact that passengers are able to approach the escalator five or six abreast. He does nothave enough data for his results to be statistically conclusive.
3.4. Escalator handling capacity: standards versus practice
The work by Al-Sharif (1996) is an attempt to estimate the number of passengersusing an escalator through the amount of power being taken up by the escalator. Hefound that because some people walk up (or down) escalators, people (even those ofthe same weight) do not consume the same amount of energy on an escalator. Thosewho walk up an escalator are partially using their own energy to get to the top.Interestingly, once there are enough people on a down escalator, the escalator actuallystarts to generate power back into the system.
In his paper, Al-Sharif discusses the concept about the human ellipse, which isdiscussed earlier. The he considers walking on escalators. He uses walking speedsfound by Andrews & Boyes (1977) and also the percentage of passengers who walk,to find a walking factor, which, if divided into the standing capacity, can be used tofind the true capacity.
8
3.5. Pedestrian planning and design
The work by Fruin (1987) is one of the most complete study regarding the dynamicsof pedestrian movement. This work was done in the USA, where the passengers standon both sides of the escalator, and the speeds of the escalators and size of thepassengers are different. The most relevant aspects of this work is described below.
1) The “empty step” phenomenon. This is an explanation of the fact that capacityon an escalator is never as high as it should be in theory (if two people werestanding on every step). Even in the heaviest of traffic with the most agilecommuters, empty steps still appear on escalators, which reduce capacity.There are two reasons for this. The first the inability of the users to board theunit quickly enough. This refers to peoples slight hesitancy in boarding anescalator. The second is a simple personal desire for a more comfortablehuman space or personal space. To achieve this personal space, passengerslike to keep other passengers out of their human ellipse.
2) On stairs, people generally keep two vacant steps between themselves and theperson in front. Whilst Fruin does not discuss walking on escalators it isassumed that people behave the same way on escalators. Fruin also states thatthe capacity of stairs are not greatly affected by the volume of traffic because,as long as people have two steps in front of them they are easily able to move,stairs rarely get congested in the same way walkways do and people aretherefore not forced to ‘shuffle’
3.6. Study at Road Research Laboratory
Study at Road Research Laboratory (1969) deals with road traffic (i.e. cars, lorries,buses etc.) rather than pedestrian traffic, but there is one central idea in this study isrelated to roundabouts. In discussing the capacity of a junction to a roundabout, it isfound that in addition to the traffic on the roundabout and the diameter of theroundabout, the entry width to the roundabout is a very important parameter. In otherwords, for each extra metre width of the entrance, the number of vehicles able to passon to the roundabout increases. The width need not be enough to allow an extra carthrough, as that would obviously increase capacity. This can perhaps be likened topeople approaching escalators (and most probably to people approaching stairways orpassageways). If people have more space from which to approach, capacity will beincreased. This agrees with Mayo’s findings.

9
4. RESEARCH METHODOLOGY
In this section, there is a description of each phase of this study. This description is inrough chronological order. Each phase merges into the next phase but in thisdescription there is an attempt to keep the phases separated for purposes of clarity.
4.1. Analysis and application of theoryThis includes an application of queuing theory to the problem of escalator capacityusing assumptions from past studies. One reason for doing this work is to establishwhat data needs to be found to both improve the assumptions and to cover those areasof the problem which are currently not covered.
4.2. Collection of the dataAll data was collected in 10 of the busiest underground stations, all in central London.All stations are characterised by high numbers of commuters in the morning andvarying proportions of leisure travellers in the evening. Many of the stations haveseveral escalators and data was collected only at the busiest escalators.
As the intention was to study capacity flows of passengers the only times of interestwere the morning and evening peak times. In the morning this lasted from 08:00 to09:30 and in the evening from 17:15 to 18:45. The biggest peak is between 08:45 to09:00.
Data collection was more fruitful on the up escalators than the down escalators, thereason for this is explained below:• The highest levels of traffic are generally caused when people get off trains
because they get off in large batches rather than when people arrive from streetlevel, which they do over a period of time.
• Therefore the highest levels of traffic occur either when people are exiting stationsor when they are interchanging (either between underground lines or from otherrail systems to the underground).
• As a consequence, most capacity situations occur in the morning when people,who have come from a large number of stations around London, exit at a relativelysmall number of stations in central London. As a result, most capacity situationsconcern only up escalators. When people return to their homes in the evening, theyarrive at the station over a period of time rather than in batches.
• The exceptions to this are the interchange stations. At Victoria Station peopleinterchange between British Rail and the underground, at Holborn and Green Parkpeople interchange between different underground lines and at Bank peopleinterchange between the underground and the Docklands Light Railway.
• Down escalators were usually busiest in the afternoon and many of the busiestescalators were in stations with a high proportion of non-commuters travelling.Non-commuters, in particular tourists, may turn out to have a significant effect onescalator capacity and should not be forgotten as a factor.
The down escalator data is not as useful as would be desired since capacity situationsare rarely reached. The bottlenecks on the stations are usually deliberately held backfrom the escalators and are at the ticket gates. This is to ensure that the numbers ofpeople on the platforms are not allowed to approach unsafe levels.
10
Below is a description of how data was collected; the points are listed inchronological order.• The first thing to do is to gain an understanding of passenger movement around the
escalator and establish what a ‘good sized queue’ at that escalator looks like. Someescalators generate crush queues whilst other queues are more orderly. It isnecessary to understand the sort of queues generated in order to establish at whatpoint the escalator is approaching capacity.
• Data was only collected when the escalator appeared to be approaching capacity.This was done by waiting for the build up of a queue, starting the clock once thequeue got beyond a certain size and counting until the queue got small again. Thereason for this being that it is with the longest queues that people are most likely tobe encouraged to maximise the potential capacity of the escalator. This also madeit easier to compare different escalators.
• Passengers were counted simultaneously on both sides of the escalator, ensuringthat standing and walking data were kept separate. Passengers were counted asthey passed a particular point (marked either by the ‘stand on the right’ signs or bya specific advert), which was usually some 2.0 to 2.5 metres above ground level inorder that people passing the point could be easily seen and distinguished fromother people at all times.
• Time was also spent watching passengers in order to try and explain particularbehaviour patterns and explain why some escalators have a greater capacity thanothers. Any unusual passenger behaviour was noted.
• The rise of the escalator was noted and a sketch of the approach to the escalatorwas made.
All the quantitative data were put into a spreadsheet. All the qualitative data wereeither explained in words or in diagrams, or stored on the computer to be referred tolater.
4.3. Analysis of the resultsThis phase can be separated into two sections, which were completed simultaneously.1. The statistical analysis of the data The data was collected together with information on the rise; the approach and other
aspects of the escalator, which it was thought may turn out to be important. Thesefactors were included in a multiple regression in different ways to find the mostlikely causes of varying escalator capacities.
2. The diagrammatic/logical analysis of the data Rather than simply show that certain factors were significant in affecting escalator
capacity, there was also an attempt to explain why these factors were ofimportance and in what way they affected capacity. This was largely done throughthe use of logical argument backed up with diagrams.
As an example of how these two methods were combined, statistical tests showedsome escalators to have unusually low capacity? An examination of the diagram ofapproach to the escalators may show a common feature. If it can be logically arguedthat this feature could have a detrimental effect on capacity, it would be worthwhile toinclude it as a regression factor in the final model.
11
5. ANALYSIS AND APPLICATION OF THEORY
The theoretical capacity of an escalator, assuming that two people stand on every stepand that the escalator is travelling at 43.2 metres per minute, is 216 ppm. This sectiondeals with the reasons why this is never achieved.
5.1. Capacity of the standing side of an escalator
In this section only half of the escalator is dealt with, that half where people standonly. An estimate is found for the capacity of the escalator, although it should beappreciated that there is a necessity for a certain amount of queuing before capacitywill be reached.
v = speed of escalator (metres/minute)D = depth of an escalator step (this is the distance from the front to the back of a step,not the height.)qs = proportion of steps used whilst standing
Steps per minute, Ss = v/D - the number of steps passing a point on the escalator each minute.
Capacity per minute, Cs = Ss*qs - the number of people passing a point on the escalator each minute.
We know that: v = 43.2 metres/minute,D = 0.40 metres,
And assuming: qs = 0.50 - assuming that on average people stand on every other step.
Capacity, Cs = 54.00 ppm.
Therefore, capacity of the standing side of an escalator will be roughly 54 people.
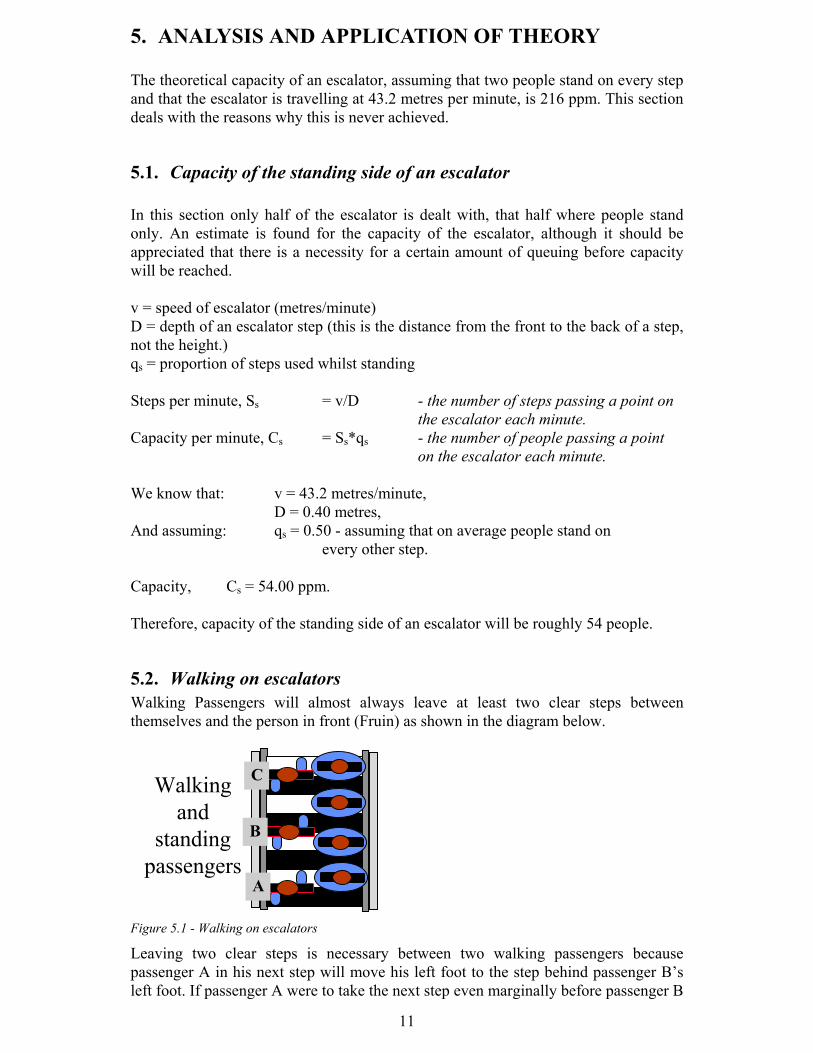
5.2. Walking on escalatorsWalking Passengers will almost always leave at least two clear steps betweenthemselves and the person in front (Fruin) as shown in the diagram below.
Walkingand
standingpassengers
A
B
C
Figure 5.1 - Walking on escalators
Leaving two clear steps is necessary between two walking passengers becausepassenger A in his next step will move his left foot to the step behind passenger B’sleft foot. If passenger A were to take the next step even marginally before passenger B

12
and they were not so far apart, they would bump into each other. Therefore, whilststanding passengers only require two steps at any one time, walking passengersrequire three. This, taken in isolation will have the effect of leading to a reducedcapacity. However, passengers generally walk at a speed fast enough to overcomethis.
5.2.1. Capacity of the walking side of an escalatorHere, an estimate is found for the capacity of the walking side of an escalator,although it should be appreciated that there is a necessity for a certain amount ofqueuing for the walking side before capacity will be reached.
u = speed at which passengers walk up escalatorqw = proportion of steps used whilst walking
Effective speed of the escalator = v+u - As people are walking, the effective speed at
which they are walking.Effective steps per minute, Sw = (v+u)/D - the effective number of steps is
similarly increased.Capacity per minute, Cw = Sw* qw - the number of people passing a
point on the escalator each minute.
We know that: v = 43.2 metres/minute,D = 0.40 metres,
And assuming: u = 36 metres/minute, andqw = 0.33 - assuming that on average people require three steps
each to walk up.
Capacity, Cs = 66.00 people per minute.
Therefore, capacity of the walking side of an escalator will be roughly 66 people.Total capacity, including both standing and walking sides, will be approximately 120people per minute.
5.3. Passenger dynamics on and around escalatorsIn the previous sub-section some simple calculations were done regarding thetheoretical capacity of an escalator. In this section the aspects of passenger behaviour,which will affect capacity of an escalator, are addressed. The reader is introduced tothe behaviour of passengers on and around escalators. This will explain why thetheoretical capacity is sometimes not reached and sometimes exceeded.
• Capacity on the walking side can only be achieved where there are enoughpassengers wishing to walk. Frequent users of escalators on the undergroundsystem will be aware that there are sometimes sizeable queues for the escalator andyet one side of the escalator is empty. It is possible that in a queue of passengersfor the escalator, nobody will wish to walk. In such a situation, the potentialcapacity of the walking side of an escalator, as worked out above is of littleconsequence. Probably, the most important part of this project will be decidingwhat factors change the number of people who walk.
• Queues of passengers wishing to board an escalator can be of two main differenttypes. These are shown in the diagram below. The crush situation is the most

13
extreme queue. It is more likely to occur where there is enough room at theapproach of the escalator, where the escalator is close to the platform(s) andtherefore less time for people to space themselves out and where people can arriveat the escalator from more than one direction. In the crush situation, there appearsto be no separation of those wishing to stand and those wishing to walk. In theorderly queue, such a separation exists and the queue of those wishing to walk istherefore able to move considerably faster than those wishing to standing.
����������������������������������������������������������������������������������������������������������������������������������������������������������������������������������������������������������������������������������������������������������������������������������������������������������������
������������������������������������������������������������������������������������������������������������������������������������������������������������������������������������������������������������������������������������������������������������������������������������������������������������������������������������������������
������������������������������������������������
Crush situation
�������������������������������������������������������
������������������������������������������������������������������������������������������������������������������������������������������������������
����������������������������������������������������
�����������������������������������������������������������������������������������������������������������������������
���������������������������������������������������������������������������������������������������������������������������������������������������������������������������������������������������������������������������������������������������
������������������������������
Orderly queue
Only passengers going up are shown.
Figure 5.2 - Two types of queues
It would seem that in the case of the orderly queue there is considerably greateradvantage to walking up the escalator than in the crush queue. However, peoplemay equally well be encouraged to deliberately get in the wrong queue in order tojump the queue for the standing side of the escalator.
• People crossing between the two sides of an escalator are another common featureof escalator travel on the London Underground system. If both sides of an escalatorwere walking or standing there would be no advantage in crossing from one side toanother but with the two sides subject to different policies, such an advantage canexist. Below is a list of the reasons why this occurs:
a) People deliberately enter the queue they can see is moving faster and thencross over onto the other side of the escalator as they reach the escalator,
b) People do not realise there is a difference between the two sides of anescalator until they get on it or have nearly reached it,
c) The queue is such that the passenger has little choice about how he or shemoves forward.
The effect of people crossing over is often to disrupt the flow of traffic in some way.Ideally one would wish to be able to count the number of people crossing over oneach escalator but that is not a practical option.
6. ANALYSIS OF UP ESCALATOR DATAData has been collected from all up escalators for which there is sufficientinformation and relationships have been found. The simplest and most obvious
14
relationship is that between capacity and the vertical rise of the escalator and that isthe point at which this analysis starts.
6.1. The effect of riseFactors other than rise may have an effect on capacity. For this section of the analysisit was desirable that any such effects should be minimised. This was done as follows:
1. Where there were two up escalators side by side, there always appeared to besignificant differences between the two capacities (although the rise was thesame). This is because of• The differing layouts (near a wall, near a down escalator, etc.)• The choice facing individuals on which escalator to use. The result which most seems to describe capacity was used. This was usuallythe higher result (because we are interested in the maximum capacity) but wasalso the result which had the least complicating factors.
2. One set of data, escalator 6 at Embankment station, is highly coloured by thefact that there is a wide nearby staircase. It was noticed, whilst measurementswere being taken, that many people, on seeing a queue for the escalator,decided to take the stairs. It is reasonable to assume that the proportion of‘walkers’ to ‘standees’ in this stairs group will be significantly different tothose who chose the escalator. The measurements from this escalator arehighly unusual and are therefore not included in the analysis below.
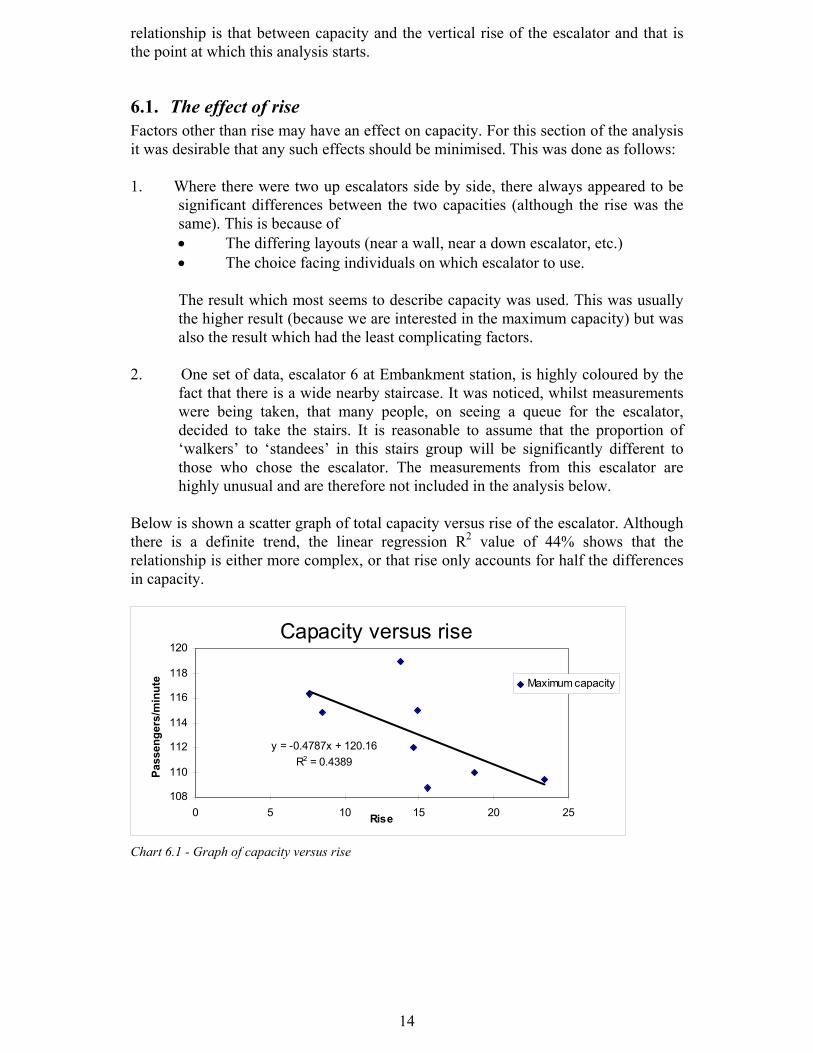
Below is shown a scatter graph of total capacity versus rise of the escalator. Althoughthere is a definite trend, the linear regression R2 value of 44% shows that therelationship is either more complex, or that rise only accounts for half the differencesin capacity.
Capacity versus rise
y = -0.4787x + 120.16R2 = 0.4389
108
110
112
114
116
118
120
0 5 10 15 20 25Rise
Pass
enge
rs/m
inut
e Maximum capacity
Chart 6.1 - Graph of capacity versus rise
15
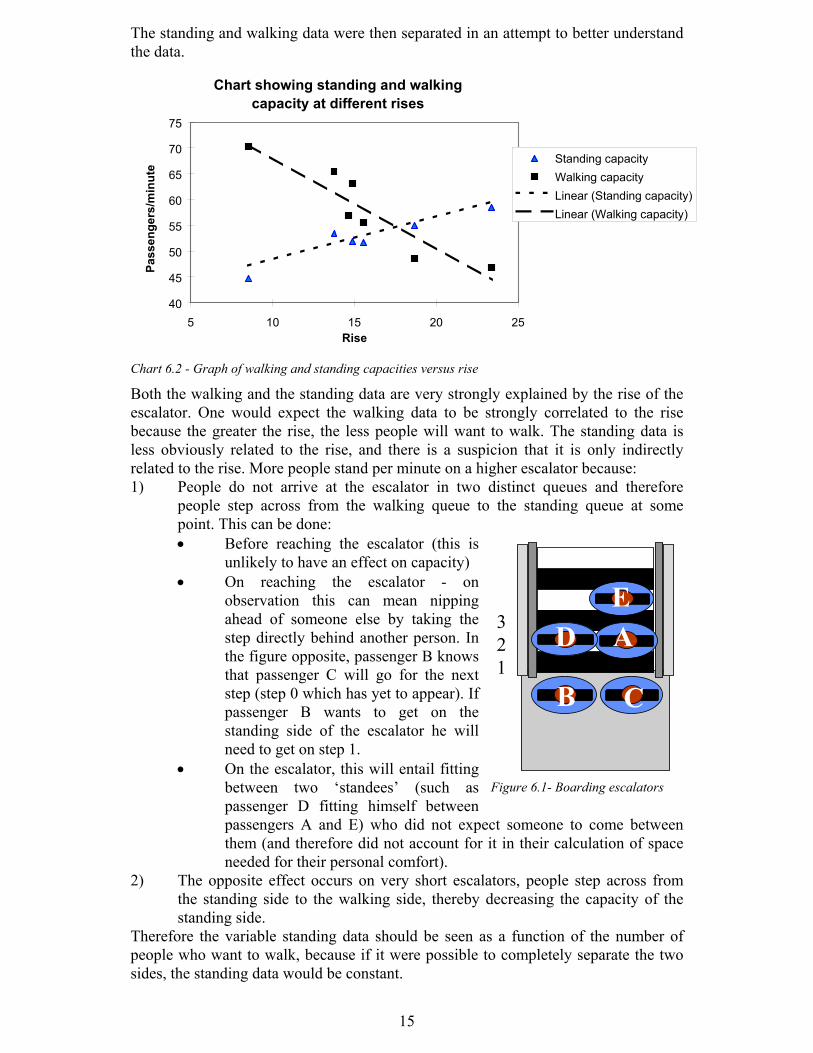
The standing and walking data were then separated in an attempt to better understandthe data.
40
45
50
55
60
65
70
75
5 10 15 20 25Rise
Pass
enge
rs/m
inut
e Standing capacityWalking capacityLinear (Standing capacity)Linear (Walking capacity)
Chart showing standing and walking capacity at different rises
Chart 6.2 - Graph of walking and standing capacities versus rise
Both the walking and the standing data are very strongly explained by the rise of theescalator. One would expect the walking data to be strongly correlated to the risebecause the greater the rise, the less people will want to walk. The standing data isless obviously related to the rise, and there is a suspicion that it is only indirectlyrelated to the rise. More people stand per minute on a higher escalator because:1) People do not arrive at the escalator in two distinct queues and therefore
people step across from the walking queue to the standing queue at somepoint. This can be done:• Before reaching the escalator (this is
unlikely to have an effect on capacity)• On reaching the escalator - on
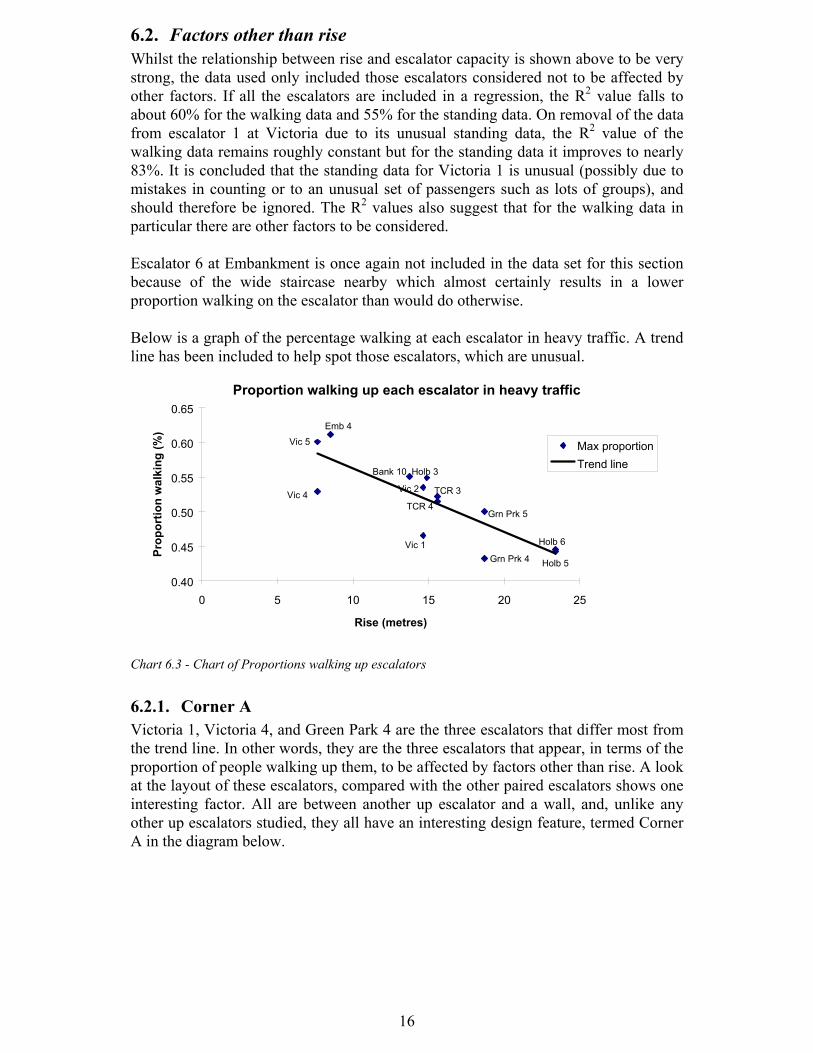
observation this can mean nippingahead of someone else by taking thestep directly behind another person. Inthe figure opposite, passenger B knowsthat passenger C will go for the nextstep (step 0 which has yet to appear). Ifpassenger B wants to get on thestanding side of the escalator he willneed to get on step 1.
• On the escalator, this will entail fittingbetween two ‘standees’ (such aspassenger D fitting himself betweenpassengers A and E) who did not expect someone to come betweenthem (and therefore did not account for it in their calculation of spaceneeded for their personal comfort).
2) The opposite effect occurs on very short escalators, people step across fromthe standing side to the walking side, thereby decreasing the capacity of thestanding side.
Therefore the variable standing data should be seen as a function of the number ofpeople who want to walk, because if it were possible to completely separate the twosides, the standing data would be constant.
321
A
CB
ED
Figure 6.1- Boarding escalators
16
6.2. Factors other than riseWhilst the relationship between rise and escalator capacity is shown above to be verystrong, the data used only included those escalators considered not to be affected byother factors. If all the escalators are included in a regression, the R2 value falls toabout 60% for the walking data and 55% for the standing data. On removal of the datafrom escalator 1 at Victoria due to its unusual standing data, the R2 value of thewalking data remains roughly constant but for the standing data it improves to nearly83%. It is concluded that the standing data for Victoria 1 is unusual (possibly due tomistakes in counting or to an unusual set of passengers such as lots of groups), andshould therefore be ignored. The R2 values also suggest that for the walking data inparticular there are other factors to be considered.
Escalator 6 at Embankment is once again not included in the data set for this sectionbecause of the wide staircase nearby which almost certainly results in a lowerproportion walking on the escalator than would do otherwise.
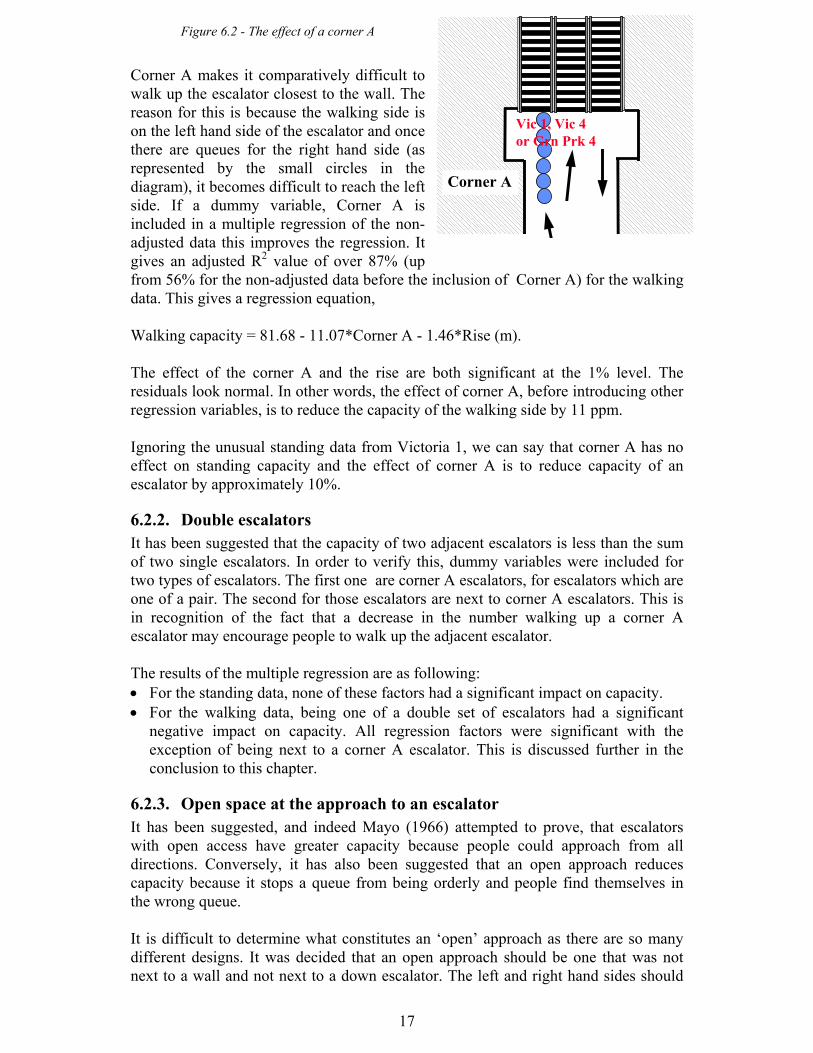
Below is a graph of the percentage walking at each escalator in heavy traffic. A trendline has been included to help spot those escalators, which are unusual.
Proportion walking up each escalator in heavy traffic
0.40
0.45
0.50
0.55
0.60
0.65
0 5 10 15 20 25
Rise (metres)
Prop
ortio
n w
alki
ng (%
)
Max proportionTrend line
Vic 4
Bank 10
Emb 4Vic 5
Grn Prk 5
Grn Prk 4
TCR 4TCR 3
Holb 3
Vic 2
Vic 1 Holb 6
Holb 5
Chart 6.3 - Chart of Proportions walking up escalators
6.2.1. Corner AVictoria 1, Victoria 4, and Green Park 4 are the three escalators that differ most fromthe trend line. In other words, they are the three escalators that appear, in terms of theproportion of people walking up them, to be affected by factors other than rise. A lookat the layout of these escalators, compared with the other paired escalators shows oneinteresting factor. All are between another up escalator and a wall, and, unlike anyother up escalators studied, they all have an interesting design feature, termed CornerA in the diagram below.
17
Figure 6.2 - The effect of a corner A
Corner A makes it comparatively difficult towalk up the escalator closest to the wall. Thereason for this is because the walking side ison the left hand side of the escalator and oncethere are queues for the right hand side (asrepresented by the small circles in thediagram), it becomes difficult to reach the leftside. If a dummy variable, Corner A isincluded in a multiple regression of the non-adjusted data this improves the regression. Itgives an adjusted R2 value of over 87% (upfrom 56% for the non-adjusted data before the inclusion of Corner A) for the walkingdata. This gives a regression equation,
Walking capacity = 81.68 - 11.07*Corner A - 1.46*Rise (m).
The effect of the corner A and the rise are both significant at the 1% level. Theresiduals look normal. In other words, the effect of corner A, before introducing otherregression variables, is to reduce the capacity of the walking side by 11 ppm.
Ignoring the unusual standing data from Victoria 1, we can say that corner A has noeffect on standing capacity and the effect of corner A is to reduce capacity of anescalator by approximately 10%.
6.2.2. Double escalatorsIt has been suggested that the capacity of two adjacent escalators is less than the sumof two single escalators. In order to verify this, dummy variables were included fortwo types of escalators. The first one are corner A escalators, for escalators which areone of a pair. The second for those escalators are next to corner A escalators. This isin recognition of the fact that a decrease in the number walking up a corner Aescalator may encourage people to walk up the adjacent escalator.
The results of the multiple regression are as following:• For the standing data, none of these factors had a significant impact on capacity.• For the walking data, being one of a double set of escalators had a significant
negative impact on capacity. All regression factors were significant with theexception of being next to a corner A escalator. This is discussed further in theconclusion to this chapter.
6.2.3. Open space at the approach to an escalatorIt has been suggested, and indeed Mayo (1966) attempted to prove, that escalatorswith open access have greater capacity because people could approach from alldirections. Conversely, it has also been suggested that an open approach reducescapacity because it stops a queue from being orderly and people find themselves inthe wrong queue.
It is difficult to determine what constitutes an ‘open’ approach as there are so manydifferent designs. It was decided that an open approach should be one that was notnext to a wall and not next to a down escalator. The left and right hand sides should
Vic 1, Vic 4or Grn Prk 4�����������������������������������
�������������������������������������������������������������������������������������������������������������������������������������������������������������������������������
���������������������������������������������������������������������������������������������������������������������������������������
��������������������������������������������������������������������������������������������������������������������������������������������������������������������������������������������������������������������������������
������������������������������������������������������������������������������������������������������������������������������������������������������������������������������������
��������������������������������������������������������������������������������������������������������������������������������������������������������������������������������������������������������������������������
������������������������������������������������������������������
Corner A
18
be looked at separately. Below, an example is given of what is considered to be an‘open’ approach.
������������������������������������������������������������������������������������������������������������������������������������������������������������������������������������������������������������������������������������������������������������������������������
����������������������������������������������������������������
������������������������������������������������������������������������������������������������������������������������������������������������������������������������������������������������������������������������������������������������������������������������������������������������������������������������������������
11 3322
Figure 6.3 - Example of open and not open escalators
Escalator Left side Right side1 Not open (next to wall) Open2 Open Not open (next to down escalator)
The openness of the left and right sides of an escalator were included in a multipleregression with mixed results. The standing data suggested that an open right sidemight increase capacity of the standing side of the escalator by about 1.7 ppm.However, the results were not very significant. The walking data suggested that anopen left side might increase capacity of the walking side by about 4 ppm. Once,again, the results were not very significant.
These results correlate with Mayo (1966). An open approach does seem to increasecapacity but there is not enough data for the results to be significant at a 90%confidence level.
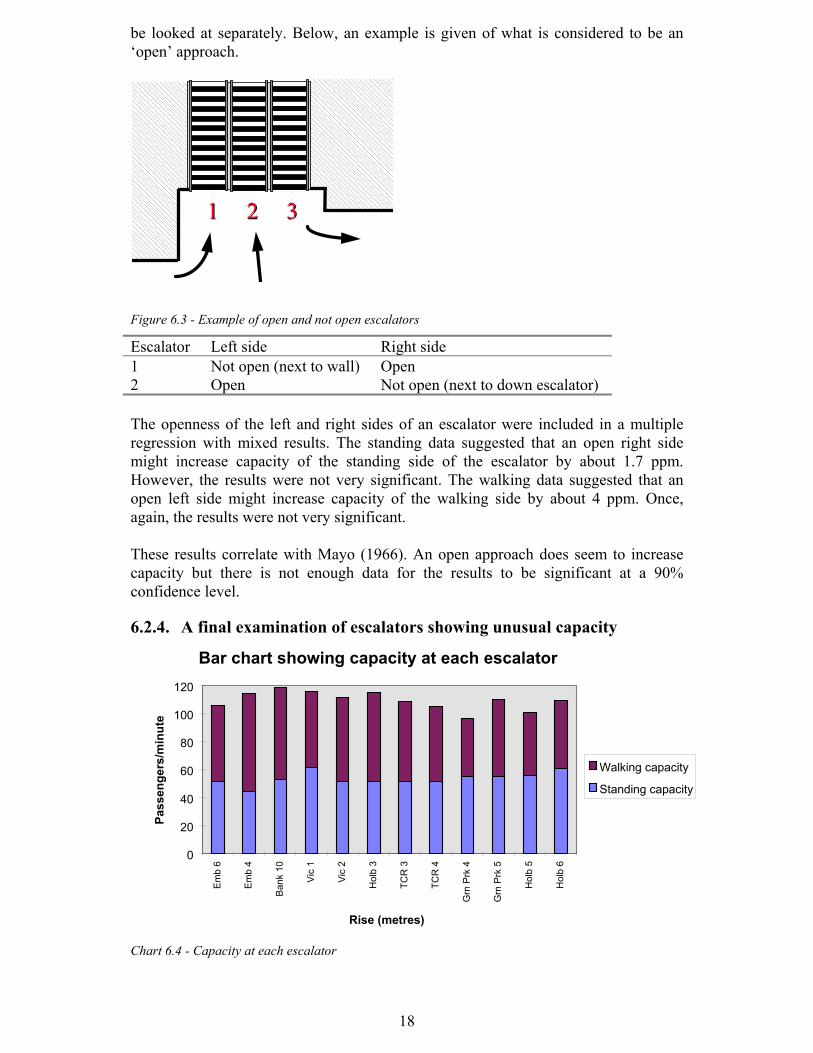
6.2.4. A final examination of escalators showing unusual capacity
0
20
40
60
80
100
120
Emb
6
Emb
4
Bank
10
Vic
1
Vic
2
Hol
b 3
TCR
3
TCR
4
Grn
Prk
4
Grn
Prk
5
Hol
b 5
Hol
b 6
Rise (metres)
Pass
enge
rs/m
inut
e
Walking capacity
Standing capacity
Bar chart showing capacity at each escalator
Chart 6.4 - Capacity at each escalator

19
1) Holborn 6 appears to have ahigher capacity than theadjacent escalator, 5. Thishigher capacity is shown inboth the walking and thestanding figures. It is believedthat this is because escalator 6is close to the entrance fromthe Central line (entrance B)and there is little to slow thetraffic in between, whereaspeople from entrance A havealready been slowed down bythe previous escalator, have tocross people from escalator 4and a lot of people from thePiccadilly line are actually changing on to the Central line anyway andtherefore do not need to go up escalators 5 or 6.
1) One other escalator that is unusual in terms of its total capacity is escalator 10at Bank station. This high capacity is dueto a slightly higher than expected standingcapacity and a higher than expectedwalking capacity. There are two possiblereasons for this:• the very simple layout of the
station. There was no opportunityfor passengers to go in differentdirections and cross each other, andthere is only a straight corridor tobe negotiated.
• the narrow stairs had the effect oftaking a few of the people whowant to walk. Therefore, thecommon problem of people stepping from the standing side to thewalking side was reduced.
6.2.5. The effect of non-commutersIn this section the question examined is whether commuters are more efficientpassengers than non-commuters. It is generally presumed that commuters will be ableto best maximise capacity because of the following reasons:• They know where they are going because they do the journey every day. Other
passengers may stop in awkward positions to confer, read signs or maps.• Time is of value to commuters. They either don’t want to be late for work or want
to get home as soon as possible, they want to minimise travel time as far as theycan. Other passengers will usually not be in a hurry and are therefore less likely,for instance, to walk up escalators.
• Commuters are used to travelling on escalators and therefore are less likely tohesitate as they approach escalators.
• Commuters are less likely to be elderly, mobility impaired or travelling withchildren or luggage, all factors which may slow down passengers.
����������������������������������������������������������������������������������������������������������������������������������������������������������
������������������������������������������������
44 55 66
��������������������������������������������������������������������������������������������������������������������������������������������������������������������������������
������������������������������������������
������������������������������������������������������������������������������������������������������������������������������������������������������������������������������������������������������������������������������������������������������������������������������������������������������������������������
������������������������������������������������������������������������������������
77
in
use
Not
AA
BB��������������������������������������������������������������������������������������������������������������
Figure 6.4 - Holborn escalators 4-7
��������������������������������������������������������������������������������������������������������������������������������������������������������������������������������������
��������������������������������������������������
��������������������������������������������������������������������������������������������������������������������������������������������������������������������������������������
��������������������������������������������������
������������������������������������������������������������������������������������������������������������������������
������������������������������������������������������������������������������������������������
1010 1111
Figure 6.5 - Bank escalator 10

20
Unfortunately, there are not many stations and not many times of the week whenescalators get very busy with the majority of travellers not being commuters. Twostations which fit the bill were Leicester Square and Tottenham Court Road, both on aFriday night. By contrast, all other readings at up escalators were taken at times whenthe great majority of the travellers were commuters.
The data was included in a multiple regression, the results of which are given below:• Non-commuters are more likely to stand, the number of standees at capacity
increases by 3.6 ppm. This result is significant with a p-value of 0.024.• The number of walkers at capacity decreases by 10.9 ppm. This is a very
significant result and tallies with the logical assumption that non-commuters, beingin less of a hurry, are less likely to walk up escalators.
• Overall, therefore, the effect of non-commuters is to decrease the capacity of anescalator by over 7 ppm.
6.3. ConclusionIn this section the main factors which have an effect on capacity are included in onemultiple regression. The ‘open approach’ and ‘next to a corner A escalator’ factorsare not included because they do not appear to be significant. Also the non-commuterescalator readings are not included because it is better to keep them separate and limitthe number of regression factors. The regression factors therefore are:• Rise (metres)• Double escalator (where =1 means that an escalator is one of a pair, =0 otherwise)• Corner A escalator (where =1 means an escalator is next to a corner A, =0
otherwise)
6.3.1. Standing dataAs has already been established, only the rise significantly affects the numbersstanding. The other factors discussed above have no impact. If the open approach onthe right hand side is included this leads to an increase in capacity of about 1.8passengers, but this is not a significant result, p-value = 0.14. If the majority ofpassengers are non-commuters, capacity will increase by 3.6 ppm.
Standing capacity (in terms of passengers per minute on a 1000 mm wide escalatortravelling at 73.2m/min) = 41.27 + 0.73*rise (metres)
This gives an adjusted R2 value of 81.00% and normally distributed residuals. Thefactors are highly significant and there is also a 95% level of confidence that theeffect of rise is between 0.49 and 0.96.
6.3.2. Walking dataWalking capacity (in terms of passengers per minute on a 1000 mm wide escalatortravelling at 73.2m/min) = 83.49 - 1.20*rise - 8.05*(double escalator) -6.90*(corner A escalator)
The adjusted R2 value = 85%. The residuals are normally distributed. Once again, allthe factors are significant at the 99% level but the 95% confidence intervals on theeffect of the factors are larger than with the standing data. The findings are listedbelow:• Having a double escalator reduces capacity by 8.05 ppm on each escalator, this is
highly significant,
21
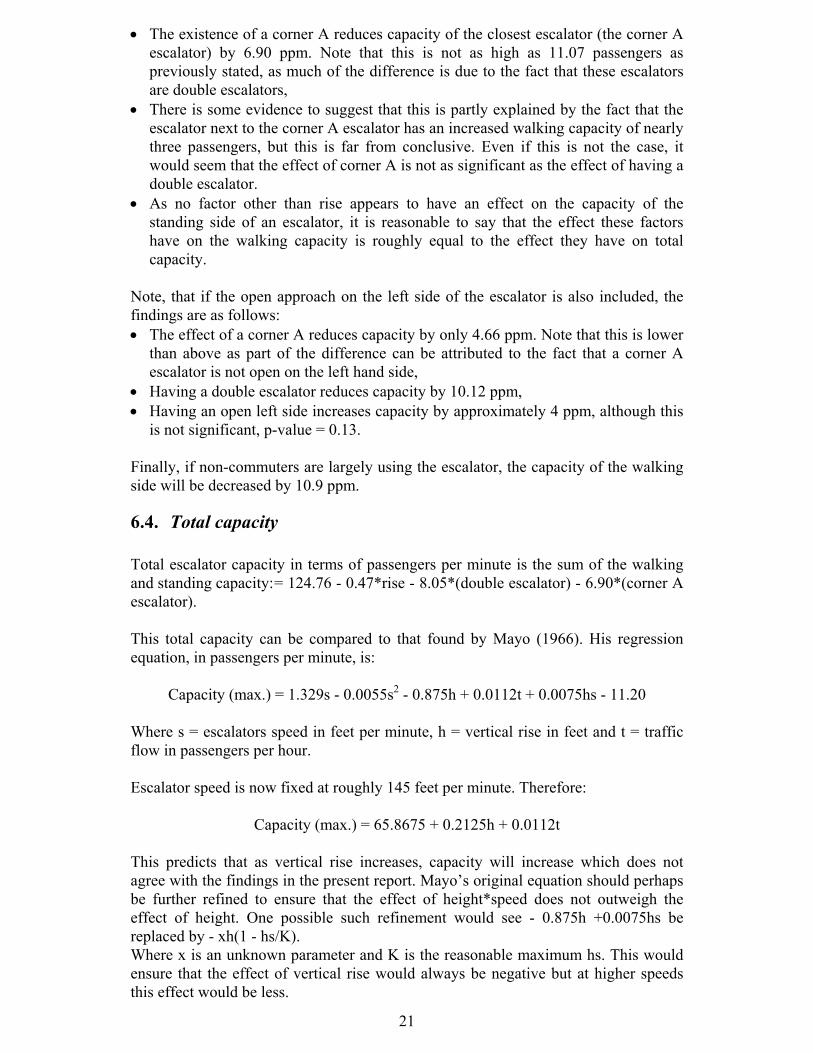
• The existence of a corner A reduces capacity of the closest escalator (the corner Aescalator) by 6.90 ppm. Note that this is not as high as 11.07 passengers aspreviously stated, as much of the difference is due to the fact that these escalatorsare double escalators,
• There is some evidence to suggest that this is partly explained by the fact that theescalator next to the corner A escalator has an increased walking capacity of nearlythree passengers, but this is far from conclusive. Even if this is not the case, itwould seem that the effect of corner A is not as significant as the effect of having adouble escalator.
• As no factor other than rise appears to have an effect on the capacity of thestanding side of an escalator, it is reasonable to say that the effect these factorshave on the walking capacity is roughly equal to the effect they have on totalcapacity.
Note, that if the open approach on the left side of the escalator is also included, thefindings are as follows:• The effect of a corner A reduces capacity by only 4.66 ppm. Note that this is lower
than above as part of the difference can be attributed to the fact that a corner Aescalator is not open on the left hand side,
• Having a double escalator reduces capacity by 10.12 ppm,• Having an open left side increases capacity by approximately 4 ppm, although this
is not significant, p-value = 0.13.
Finally, if non-commuters are largely using the escalator, the capacity of the walkingside will be decreased by 10.9 ppm.
6.4. Total capacity
Total escalator capacity in terms of passengers per minute is the sum of the walkingand standing capacity:= 124.76 - 0.47*rise - 8.05*(double escalator) - 6.90*(corner Aescalator).
This total capacity can be compared to that found by Mayo (1966). His regressionequation, in passengers per minute, is:
Capacity (max.) = 1.329s - 0.0055s2 - 0.875h + 0.0112t + 0.0075hs - 11.20
Where s = escalators speed in feet per minute, h = vertical rise in feet and t = trafficflow in passengers per hour.
Escalator speed is now fixed at roughly 145 feet per minute. Therefore:
Capacity (max.) = 65.8675 + 0.2125h + 0.0112t
This predicts that as vertical rise increases, capacity will increase which does notagree with the findings in the present report. Mayo’s original equation should perhapsbe further refined to ensure that the effect of height*speed does not outweigh theeffect of height. One possible such refinement would see - 0.875h +0.0075hs bereplaced by - xh(1 - hs/K).Where x is an unknown parameter and K is the reasonable maximum hs. This wouldensure that the effect of vertical rise would always be negative but at higher speedsthis effect would be less.

22
7. ANALYSIS OF DOWN ESCALATOR DATA
The down escalator data does not give the conclusive results that appeared in the upescalator data. A list of the differences in collecting data at up and down escalators isgiven in section 3.3. In the analysis below a total of seven escalators are consideredbecause these were the only escalators where capacity was reached. Attempts weremade to take data from fifteen escalators. See for a table of the full results
7.1. The non-walking ‘walking’ sideOnce down escalators get beyond a certain traffic level, ‘walking’ passengers are, infact, not walking. On reaching the bottom of the escalator passengers are not to ableto get away fast enough and as a result the passengers behind them have to stopwalking to avoid bumping into them. This effect gradually works its way back up theescalator so that eventually the only time people can walk is when they first get on theescalator. This is the case on all escalators although on some escalators it happenswith lower passenger flows than at others.It should not be surprising that this happens because it can be shown that walkingpassengers are likely to be moving at a faster speed on the escalator than when theyget off. The average vertical walking speed on down stairs is 0.34 metres/second andescalators are thought to have a very similar vertical walking speed to stairs.• This works out as an average diagonal speed of 0.68 metres/second.• Add this to the average escalator speed of 0.72 metres/second and we get a
combined speed of 1.40 metres/second.• Compare this with the horizontal walking speed of 1.34 metres per second and it
should be clear that passengers will not be able to move away as fast as they comeoff the escalator.
• Passengers often pause briefly on alighting an escalator in order to ensure theirfoot placement is correct. This compounds the problem.
• As people find themselves having to stop on the down escalators, many peopleseem to move as far forward as possible which means standing directly behind theperson in front. On reaching the end of the escalator they have to wait for thatperson to move well out of the way before being able to move themselves.
• Therefore, once one person has to stop before getting off the escalator, the problemwill get worse rather than better.
• This does have the interesting side effect that people are generally standing closertogether than the normal alternate step.
Figure 7.1a: Passengers walkingdown freely
Figure 7.1c: More passengershave to stop, having moved asfar forward as possible
Figure 7.1b: One passenger stopsand other passengers move as farforward as possible
Figure 7.1 - Passengers having to stop on down escalators
23
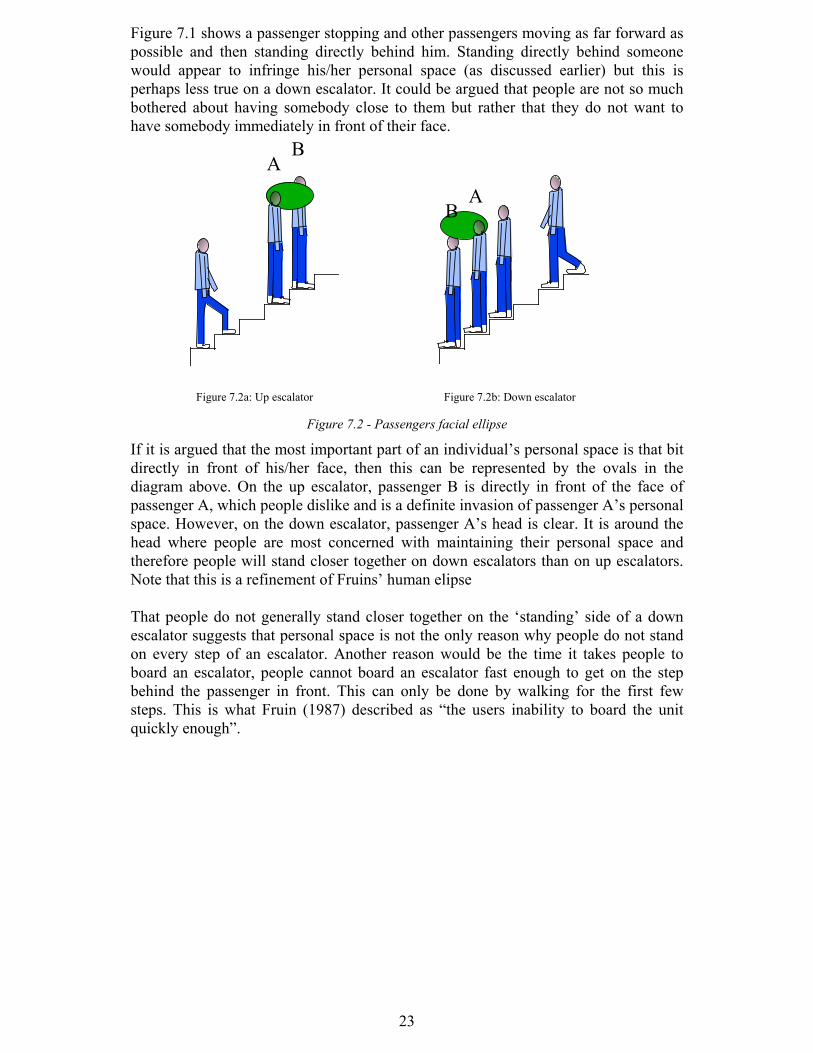
Figure 7.1 shows a passenger stopping and other passengers moving as far forward aspossible and then standing directly behind him. Standing directly behind someonewould appear to infringe his/her personal space (as discussed earlier) but this isperhaps less true on a down escalator. It could be argued that people are not so muchbothered about having somebody close to them but rather that they do not want tohave somebody immediately in front of their face.
Figure 7.2a: Up escalator Figure 7.2b: Down escalator
AB
BA
Figure 7.2 - Passengers facial ellipse
If it is argued that the most important part of an individual’s personal space is that bitdirectly in front of his/her face, then this can be represented by the ovals in thediagram above. On the up escalator, passenger B is directly in front of the face ofpassenger A, which people dislike and is a definite invasion of passenger A’s personalspace. However, on the down escalator, passenger A’s head is clear. It is around thehead where people are most concerned with maintaining their personal space andtherefore people will stand closer together on down escalators than on up escalators.Note that this is a refinement of Fruins’ human elipse
That people do not generally stand closer together on the ‘standing’ side of a downescalator suggests that personal space is not the only reason why people do not standon every step of an escalator. Another reason would be the time it takes people toboard an escalator, people cannot board an escalator fast enough to get on the stepbehind the passenger in front. This can only be done by walking for the first fewsteps. This is what Fruin (1987) described as “the users inability to board the unitquickly enough”.

24
7.2. The results
Walking and standing capacities at different down escalators132.54
114.22127.69
104.68118.4 114.92 120
0.00
20.00
40.00
60.00
80.00
100.00
120.00
140.00
Vict
oria
6
Oxf
ord
circ
us 1
1
Vict
oria
3
Hol
born
2
Gre
enPa
rk 6
Gre
enPa
rk 1
Hol
born
5
Escalator
Pass
enge
rs/m
inut
e
Standing capacityWalking capacityTotal capacity
Chart 7.1 - Chart of capacities of different escalators
In the above chart the escalators are arranged in order of rise with the shortest beingVictoria 6. There is no obvious relationship between rise and capacity. The totalcapacities do vary widely, between 104 and 132 ppm, as does the proportion walking.It is proposed in the following section to look at some of the individual escalators,find reasons why they give unusual readings and then try to find some uniformity inthe results.
7.2.1. Holborn 2This has a particularly low capacity despite being very busy because of the temporarylayout of the approach to the escalator.
7.2.2. Green Park 1This escalator is unusual in that it is the only escalator where more than half of thepassengers choose to stand. While there were a lot of non-commuters (who certainlyseem more likely to stand than commuters), there is no reason to suppose that thepassengers would be any different from those using escalator 6 at Green Park as thetwo sets of readings were taken at similar times. Once again, it is believed that this isdue to the approach to the escalator which encourages people to use the standing siderather than the walking side of the escalator. Once again these results will not be usedin further analysis.
7.2.3. The effect of non-commutersWith the removal of two unusual results, we now have only five data points fromwhich to derive conclusions. The effect of non-commuters would appear to be a largedecrease in numbers.
Commuters Non-commutersStanding capacity 49.81 50.69Walking capacity 76.93 65.63Total capacity 126.74 116.31Proportion walking 0.61 0.56
25
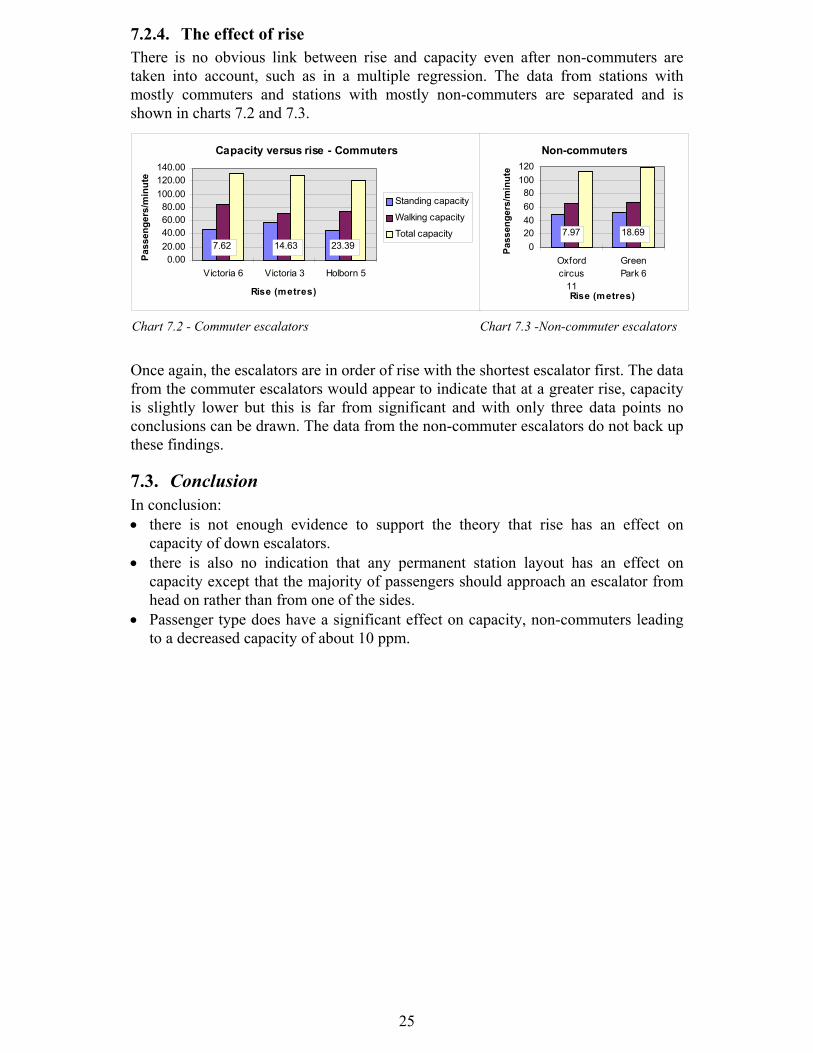
7.2.4. The effect of riseThere is no obvious link between rise and capacity even after non-commuters aretaken into account, such as in a multiple regression. The data from stations withmostly commuters and stations with mostly non-commuters are separated and isshown in charts 7.2 and 7.3.
Once again, the escalators are in order of rise with the shortest escalator first. The datafrom the commuter escalators would appear to indicate that at a greater rise, capacityis slightly lower but this is far from significant and with only three data points noconclusions can be drawn. The data from the non-commuter escalators do not back upthese findings.
7.3. ConclusionIn conclusion:• there is not enough evidence to support the theory that rise has an effect on
capacity of down escalators.• there is also no indication that any permanent station layout has an effect on
capacity except that the majority of passengers should approach an escalator fromhead on rather than from one of the sides.
• Passenger type does have a significant effect on capacity, non-commuters leadingto a decreased capacity of about 10 ppm.
Capacity versus rise - Commuters
0.0020.0040.0060.0080.00
100.00120.00140.00
Victoria 6 Victoria 3 Holborn 5
Rise (metres)
Pass
enge
rs/m
inut
e
Standing capacity
Walking capacity
Total capacity7.62 23.3914.63
Chart 7.2 - Commuter escalators
Non-commuters
020406080
100120
Oxfordcircus
11
GreenPark 6
Rise (metres)
Pass
enge
rs/m
inut
e
7.97 18.69
Chart 7.3 -Non-commuter escalators
26
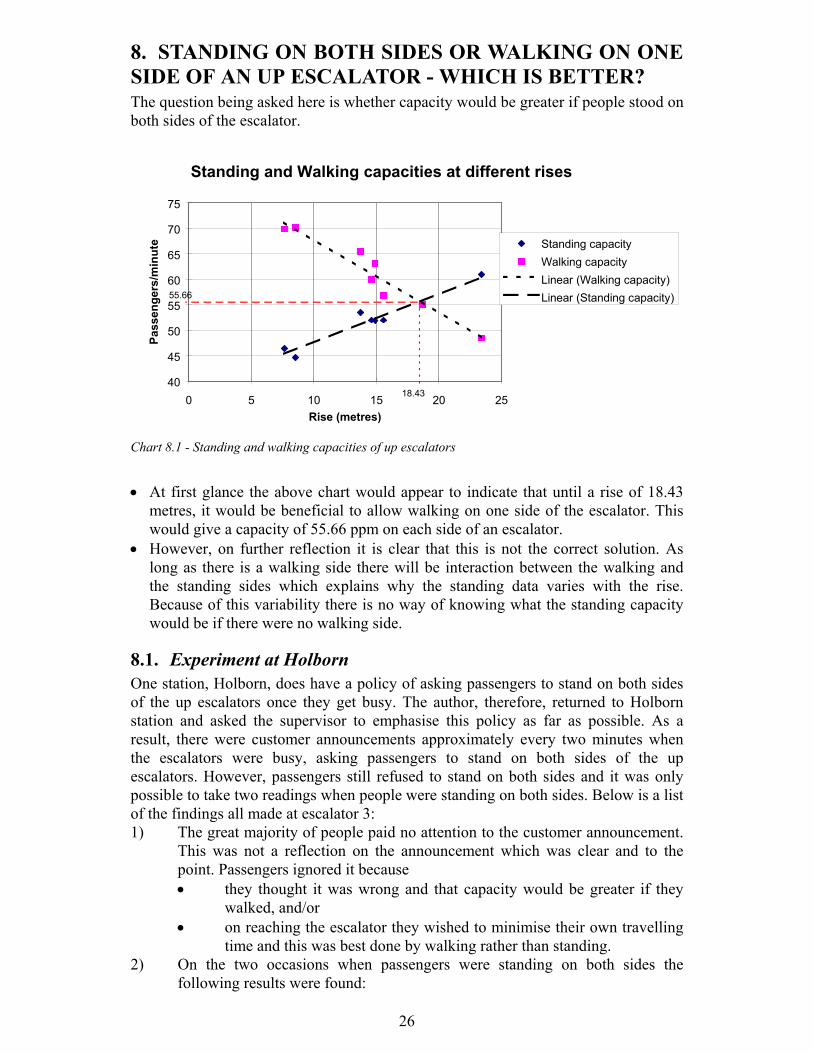
8. STANDING ON BOTH SIDES OR WALKING ON ONESIDE OF AN UP ESCALATOR - WHICH IS BETTER?The question being asked here is whether capacity would be greater if people stood onboth sides of the escalator.
40
45
50
55
60
65
70
75
0 5 10 15 20 25Rise (metres)
Pass
enge
rs/m
inut
e Standing capacityWalking capacityLinear (Walking capacity)Linear (Standing capacity)
Standing and Walking capacities at different rises
18.43
55.66
Chart 8.1 - Standing and walking capacities of up escalators
• At first glance the above chart would appear to indicate that until a rise of 18.43metres, it would be beneficial to allow walking on one side of the escalator. Thiswould give a capacity of 55.66 ppm on each side of an escalator.
• However, on further reflection it is clear that this is not the correct solution. Aslong as there is a walking side there will be interaction between the walking andthe standing sides which explains why the standing data varies with the rise.Because of this variability there is no way of knowing what the standing capacitywould be if there were no walking side.
8.1. Experiment at HolbornOne station, Holborn, does have a policy of asking passengers to stand on both sidesof the up escalators once they get busy. The author, therefore, returned to Holbornstation and asked the supervisor to emphasise this policy as far as possible. As aresult, there were customer announcements approximately every two minutes whenthe escalators were busy, asking passengers to stand on both sides of the upescalators. However, passengers still refused to stand on both sides and it was onlypossible to take two readings when people were standing on both sides. Below is a listof the findings all made at escalator 3:1) The great majority of people paid no attention to the customer announcement.
This was not a reflection on the announcement which was clear and to thepoint. Passengers ignored it because• they thought it was wrong and that capacity would be greater if they
walked, and/or• on reaching the escalator they wished to minimise their own travelling
time and this was best done by walking rather than standing.2) On the two occasions when passengers were standing on both sides the
following results were found:
27
• an average of 49.4 passengers stand on the standing side per minute(comparable with the norm at escalator 3),
• an average of 75.6 passengers stand on the walking side per minute(roughly ten passengers more per minute than would walk on thewalking side).
3) That there were large differences between the two sides of the escalator showsthat even during the two periods when people were standing on both sides,passengers were not treating both sides as standing sides. In fact:• the reason passengers were standing was because one or two
individuals stood and therefore forced everyone behind them to stand,• passengers on the walking side were continually trying to move
forward and in both cases were eventually able to walk again asobstructing passengers were persuaded to either start walking or moveover to the standing side,
• The great majority of passengers wanted to walk and this was clear intheir behaviour even when they were being forced to stand.
4) Having a walking side does have the advantage that people in a rush (whoprobably place a higher value on their time) can proceed quickly. It is perhapsa useful way of separating different types of passengers (commuters vs. non-commuters or those in a rush vs. those with time to spare) whilst keeping bothhappy.
This experiment at Holborn was not successful in indicating what the capacity of anescalator would be if passengers were persuaded to stand on both sides for anythingmore than short periods of time. To find out the capacity if passengers treated bothsides of an escalator as standing sides it would be necessary to:1. use data from equally busy escalators on railway systems where it is the norm to
stand on both sides of an escalator. This data would need to be collected in thesame way and even then may not be equivalent to data collected with Londoncommuters.
2. Collect sufficient data to allow the construction of a simulation model ofpedestrian behaviour on and around escalators. Collection of such data would bevery time consuming.
3. Try and find the capacity from the theory. An attempt is made below.
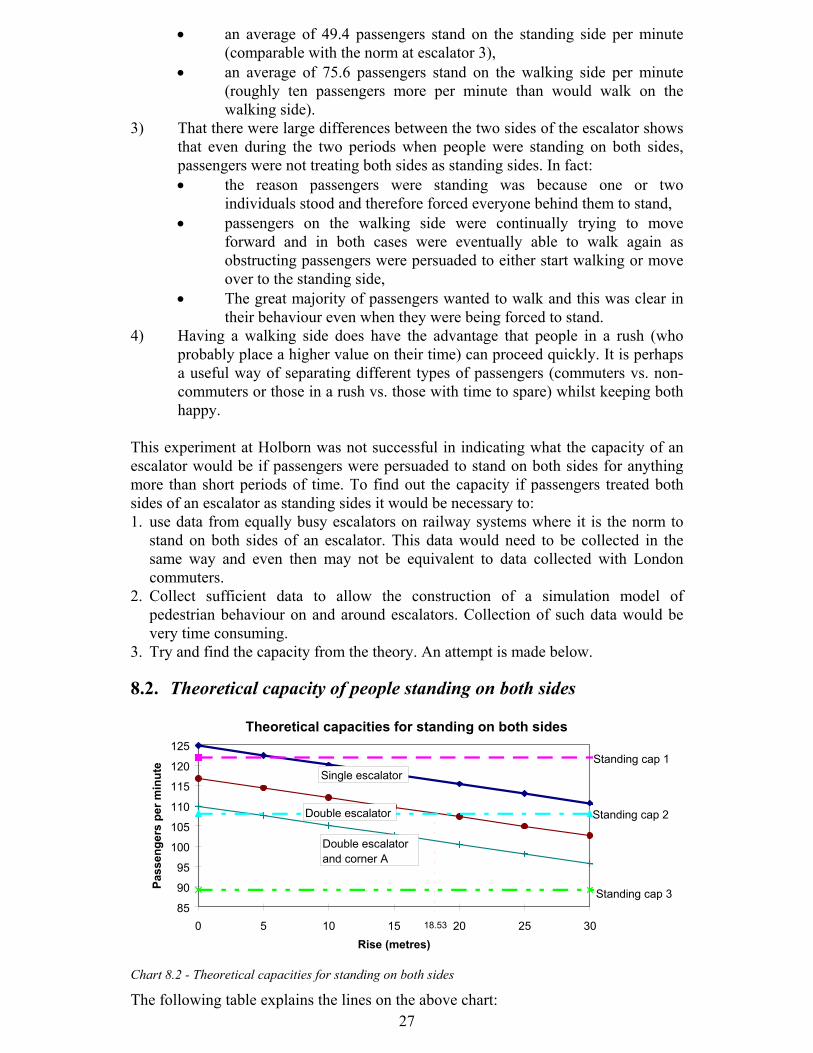
8.2. Theoretical capacity of people standing on both sides
Theoretical capacities for standing on both sides
85
90
95
100
105
110
115
120
125
0 5 10 15 20 25 30Rise (metres)
Pass
enge
rs p
er m
inut
e Standing cap 1
Standing cap 2
Single escalator
Double escalator
Double escalator and corner A
Standing cap 3
18.53
Chart 8.2 - Theoretical capacities for standing on both sides
The following table explains the lines on the above chart:
28
Line name DescriptionSingle escalator This represents the capacity of a single escalator at different risesDouble escalator This represents the capacity of one of a double bank of escalatorsDouble escalatorand corner A
As above but also a corner A escalator
Standing cap 1 Double the maximum recorded capacity of the standing sideStanding cap 2 Capacity if each person uses two stepsStanding cap 3 Double the minimum recorded capacity of the standing side
Standing cap 1 and 3 represent the full range of possible capacities of an escalatorwith passengers standing on both sides. Both are unlikely in themselves because whenthey were recorded it was noted that people were stepping from the walking side tothe standing side or vice versa. It is the belief of the author that capacity of anescalator, travelling at 43.2 metres/minute, where people stood on both sides would be108 ppm (standing cap 2) because that would allow an average of two steps perperson on each side. This figure is also approximately midway between standing caps1 and 3.
If this assumption is correct, then for a single escalator there will never be a rise atwhich standing on both sides would be preferable. For a double escalator with a risegreater than about 18.5 metres, capacity would be greater if people could beencouraged to stand on both sides. Finally, for a double escalator with a corner A, atall levels of rise to be found on the London Underground system, it would beadvantageous to persuade people to stand on both sides.
8.3. ConclusionIt is therefore concluded that :• Passengers will not stand on both sides of an escalator simply because they are
asked to.• When passengers do stand on both sides capacity is high but this is only because
the majority of passengers do not treat the left hand side as a standing side.• However, except for short periods of time, passengers will not stand on both sides
unless they are persuaded (such as through an advertising campaign) to treat bothsides as standing sides.
• If passengers could be persuaded to treat both sides as standing sides, capacitywould not be so high and, if the assumptions made are correct, it would only beadvantageous for high rise double escalators and for corner A double escalators.
• To impose such a selective policy would be even more difficult than persuadingpassengers to stand on all escalators and the benefit gained would be minimal.
29
9. EXTENSIONS AND SCOPE FOR FURTHER WORK
To move towards a policy of standing on both sides would be unpopular and wouldpenalise those who are most rushed and those who place most value on their time.The conclusions made in this paper are generic and can be applied to escalators ofwidth 1000 mm, speed 43.2 metres per minute and where passengers stand on theright and walk on the left. It would be expected for the general results to be applicableto escalators at all speeds but the exact percentages may vary. These results are notapplicable to escalators where passengers stand on both sides.
1) Rise affects the capacity of up escalators. Rise has a negative effect on thecapacity of the walking side but a positive effect on the capacity of thestanding side. The effect on the walking side is greater than the standing sideand overall, for every metre in rise, capacity is reduced by 0.47 ppm.
2) Up escalators, which are one of a pair, do not have the same capacity as singleescalators. Their capacity is approximately 7-8% lower than the equivalentsingle escalator, all of this effect is seen in the walking data.
3) The approach to an up escalator can have an effect on the capacity of thatescalator• A corner A (explained in section 6.2.1) reduces capacity by about 5%,
all on the walking side.• Escalators with an open approach seem to have higher capacity than
average, both on the walking and standing sides, although this isneither significant in capacity terms or statistically.
• There is some evidence, contrary to this, that a corridor effect tunnelspeople to the escalator and is able to provide higher capacity. Thissituation is achieved where up and down escalator flows are keptlargely separate and there is only a single up escalator. This way, thereis little interaction between passengers trying to go in oppositedirections or crossing each other.
4) Passenger type has an effect on capacity. This is true for both up and downescalators. When passengers are largely non-commuters, capacity is reducedby 8-9%. The effect appears to be greater on down escalators because on upescalators some of the reduction in walking capacity is counterbalanced by anincrease in the standing capacity.
5) An experiment at Holborn revealed that passengers are unlikely to bepersuaded, on an ad hoc basis, to stand on both sides of an escalator even ifthat were considered to be advantageous. Through theoretical analysis, it isconcluded that standing on both sides may be preferable in terms ofmaximising capacity at a limited number of escalators, but as it appears to beso unpopular, there would be little hope of imposing such a policy.
9.1. Recommendations• The capacity figure of 120 ppm as used by pedestrian simulation models at present
is at the upper limit for capacity of up escalators. If a single figure is to be used itshould be 110 ppm.
• It is recommended that a variable rate be used because of the large differences incapacity. For instance, the predicted capacity of a 24 metre rise escalator which is
30
one of a pair and has a corner A is 98 ppm compared with 120 ppm for a single 10metre rise escalator without a corner A.
• For down escalators, 120 ppm would appear to be an understatement, 125 ppmwould be more accurate. Whether this need be a variable figure is not certain dueto the lack of data.
• With the increasing importance of off peak flows, this report also highlights thefact that non-commuters lead to lower capacities than commuters, byapproximately 8-9%.
Other recommendations are the following:• To maximise the capacity of an escalator, the approach to an escalator should be
kept open but should also be orderly. Whilst, it is helpful for people to approachthe escalator from all angles and not be impeded by factors such as a corner A, it isalso important that cross flows (caused by a combination of two escalators side byside and more than one angle of approach) and opposing flows (caused bypassengers from an opposing escalator) are kept to a minimum.
• No attempt should be made to persuade passengers to stand on both sides of anescalator. Such a policy would only be advantageous at a limited number ofescalators and would in any case be very difficult to enforce.
9.2. Recommended further work1) Further work could be done to establish the validity of the suggestion that an
open approach increases capacity of an escalator. Both this study and Mayo’swork suggest this but in both cases there is not enough data for this to be asignificant result. However, the present study also suggests that even if this istrue, the improvement may not be very large.
2) Further work needs to be done on the capacity of down escalators. Theproblem encountered by the author was that the down escalators rarely gotbusy enough to be at capacity. If more data at a wider range of escalatorscould be found there may turn out to be other factors affecting capacity. Onthe walking side of an escalator passengers always stop walking once capacityis reached and therefore, the capacity at which they are forced to stop walkingis of importance. It is the suspicion of the author that the layout of the stationas people get off the escalator could be of significance in determiningescalator capacity. An open layout will allow people to get away faster andwill therefore increase capacity.
3) It would be interesting, if enough data could be found, to quantify the effectof passengers going in opposite directions. In this report, the effect of twoescalators side by side has been quantified, but the effect of opposing trafficflows has not.
4) Finally, it is recommended that more work is done in determining the truecapacity of escalators where people stand on both sides. This would be mosteasily done by using data from escalators in transport systems where that is thecommon practice.
31
10. BIBLIOGRAPHY
J. Medhurst, Vertical Transportation in Railway Engineering, Course Notes, LondonUnderground Limited.
A.J. Mayo (1966), A study of escalators and associated flow systems, M.Sc. DegreeReport, Imperial College of Science and Technology (University of London).
L. Al-Sharif (1996), Escalator handling capacity: standards versus practice, Internalreport, London Underground Ltd.
J.J. Fruin (1987), Pedestrian planning and design, Revised Edition, Elevator World,Inc. Educational Services Division.
Road Research Laboratory (1969), - 3.2 Junction Capacity, Road ResearchLaboratory.