Embed Size (px)
Citation preview

Estimating the Service Population of a Large MetropolitanUniversity Campus
Elin Charles-Edwards & Martin Bell
Received: 2 April 2012 /Accepted: 20 July 2012 /Published online: 19 August 2012# Springer Science+Business Media B.V. 2012
Abstract Conventional population estimates prepared by statistical agencies typical-ly focus on the population resident in a given geographic area at a defined point intime, but in practice many locations undergo substantial daily, weekly and seasonalflux in population numbers. Such fluctuations exert wide-ranging impacts for goodsand services in destination areas, such that increasing recognition is being given to theneed for more refined estimates that capture these ‘service populations’. While anumber of methods have been proposed to count visitors or estimate temporarypopulations, systematic testing has been limited, and the evidence suggests that nosingle methodology is effective at multiple spatial and temporal scales. This paperutilises a hybrid approach which couples cordon counts based on multiple technol-ogies with administrative data and an on-line survey to estimate the daily, weekly andseasonal fluctuation in the population of a large Australian metropolitan Universitycampus. Our results trace the rise and fall of the campus population over the course ofthe day, identify the scale and duration of the peak, and show how populationnumbers vary from day to day and over the course of the teaching semester. Wetrack aggregate flows to and from Campus by mode of travel and find they signif-icantly exceed the on-campus population peak, underlining its sensitivity to time-tabling of classes and other events. We also identify strong correlations between datasources which assist in validating the estimates and, together with evolving technol-ogies, offer potential avenues for substantial cost saving in future estimations.
Keywords Population estimates . Service populations . Temporarymobility . Daytimepopulations . Commuting
Appl. Spatial Analysis (2013) 6:209–228DOI 10.1007/s12061-012-9079-y
E. Charles-Edwards (*) :M. BellSchool of Geography, Planning and Environmental Management, The University of Queensland,Brisbane, Australiae-mail: [email protected]
M. Belle-mail: [email protected]
Introduction
A sound understanding of the size, distribution and dynamics of human populations isessential to many facets of human endeavour, including sustainable development,environmental protection and cost-effective planning. Population estimates are funda-mental to the provision and planning of local goods and services, for emergencyplanning, and a basic input to formulae for resource allocation; they also determinepolitical representation and serve as the denominators of essential socio-economicindicators, such as crime rates (Harper and Mayhew 2011; Smith 1989). Despite theirconsiderable sophistication, conventional population estimates prepared by nationalstatistical agencies are often poorly suited to these purposes as they ignore thediurnal, weekly and seasonal flux in population numbers arising from temporaryforms of population mobility. Recognition of the importance of these cyclic popula-tion shifts has given rise to a new term in the literature of applied demography,service populations, defined to encompass not only permanent residents, but alsothose overnight and daytime visitors who place increased demand on goods, facilitiesand services in a region, locality or area (Cook 1996). Such estimates have applica-tion for multiple purposes including infrastructure planning and service delivery at avariety of spatial scales. The call for such estimates is increasingly widespread(United Nations 2008; House of Representatives 2006), the lack of data at theappropriate spatial and temporal resolution remains a significant barrier to theirproduction. Allied to this is the absence of agreement on any clearly defined, reliablemethodology (Smith 1989).
This paper reports on a study undertaken to estimate the diurnal, weekly and seasonalvariation in the service population of a major Australian metropolitan university cam-pus, and the population flows that underlie these variations. Located 7 km from theBrisbane CBD, the St Lucia campus of the University of Queensland (UQ) is one of thelargest daily traffic generators in the Brisbane region, a rapidly growing metropolis of3.1 million people. People visit the campus for a range of reasons—to work, to study, toexercise, to participate in cultural activities—with visits varying both in timing andduration. The resulting fluctuations in the campus population are not reflected in anyofficial statistics and this dearth of information seriously hinders both physical planningand the timely and efficient provision of goods and services on campus. A clearunderstanding of the movements to and from the campus which drive these fluctuations,together with their spatial pattern, timing and modal split, is also needed to understandthe University’s impact on the wider urban system.
In this paper we focus on estimating the service population and capturing thetemporal fluctuation in population numbers on the St Lucia campus. We also identifythe underlying flows. We begin by reviewing the range of alternative approaches tomeasuring temporary populations. While each offers strengths and has limitations,their application is ultimately shaped by the spatial setting and available data. Weadopt a hybrid approach interleaving several elements to exploit the strengths ofavailable data sources, and show how these are applied to generate, and cross-check,estimates for the St Lucia campus at varying time scales. The results trace thesystematic rise and fall in the population of the UQ St Lucia campus over the courseof an average day, week and teaching year, and reveal the underlying populationflows which drive these variations.
210 E. Charles-Edwards, M. Bell
Estimating Temporary Populations
For the researcher seeking to estimate short term fluctuation in populations, a keychallenge lies in the design of a strategy which not only enumerates residents,but also captures overnight and daytime visitors to an area. The diversity ofspace-time behaviours that drive diurnal, weekly and seasonal variations inpopulation generally precludes the application of any single procedure. Instead,analysts are forced to draw on a range of techniques which must be adapted tothe specific purpose. These are of two broad types: techniques designed toestimate how the total population stock changes over time, and, techniques thatprovide for the continuous measurement of population flows, the latter based onthe assumption that an initial stock estimate exists. A number of data sources andtechniques capturing population stocks and population flows have been used forthe estimation of service populations, and these are summarised in Table 1. Weelaborate their applications, strengths and limitations below.
The population census is the primary source of data on the size, distribution andcomposition of populations in more than 160 countries around the world (UnitedNations Statistical Division 2011). Despite the general trend towards a usual residentframework as the standard for population statistics, many censuses also collect
Table 1 Summary of existing approaches to the estimation of service populations
Data source/technique Type Strengths Limitations
Census data (Belland Ward 1998;McPhersonand Brown 2004)
Stocks • De facto censuses canprovide full counts ofresident and visitorpopulations withingeographic areas
• Will not necessarily reflectthe service population ofan area at other points inthe year
• Census can provideinformation on commuterpopulations based onplace of work
• Assumes a standardwork-time model
Administrative records(Muller and Hall 2003)
Stocks • Useful method to estimatepopulations that are hardto reach at the destination(e.g., second home owners)
• Does not directly countthe service populationof an area at a particularpoint in space and time
Aerial methods(Raybould et al. 2000)
Stocks • Effective methodologyfor estimating large outdoorcrowds at un-ticketed events
• Limited to simple,outdoor spaces
Symptomatic indicators(Goldschmidt andDahl 1976)
Stocksandflows
• Allows continuous estimatesof service populations to bemade in both a timely andcost effective manner
• Difficult to establish baselinerelationships betweensymptomatic indicators andde facto populations
Cordon counts(Schmitt 1992)
Flows • Produces continuous counts ofpopulation within designated areas
• Resource intensive
• Need to establish initialstock estimates
Travel surveys (Collinsand Greaves 2007)
Flows • Can produce continuous estimatesof the service population of largeareas
• Subject to high samplingvariability
Estimating the Service Population of a Large Metropolitan University Campus 211

information on various forms of temporary population. For example, the AustralianCensus of Population and Housing collects data both on the place of enumeration ofeach individual on census night and on their place of usual residence, effectivelyproviding a snapshot of the location and characteristics of people away from home onone night every 5 years (Bell and Ward 1998). However, as many forms of temporarymobility are seasonal (Smith 1989) census counts will not necessarily reflect patternsof temporary mobility at other points in the year. Another class of census questionthat capture service populations are those collecting information on multiple resi-dences. The 2011 Census of England and Wales asked respondents if they stay atanother address for more than 30 days a year and if so, for details of that address,while the 2001 Italian Population Census asked whether during the past 12 monthsindividuals had lived in private or institutional accommodation (e.g., relatives orfriends house, barracks, hospital) away from their usual residence. Details of thetiming and duration of stay in other residences is usually not collected, however,limiting the utility of these data for estimation purposes.
Information on place of work is also collected in many population censuses,including the Australian Census of Population and Housing. Due to the routine natureof the standard work-time model (e.g., 9 am to 5 pm, Monday to Friday) these datacan be used to produce daytime population estimates on the assumption that themajority of workers are at their place of work during these hours. However, peopleleave their home in the daytime for a range of other reasons, including for education,health care, shopping and recreation and these activities tend to lack the routinesobserved in the daily commute. For specialized activity nodes such as universitycampuses, place of work data dramatically underestimate the daytime population, asthe majority of visitors are not engaged in paid employment at the destination. A lackof data on the daily schedules of these visitors further compounds the problem.Moreover, while census data can provide useful insights into the size and compositionof service populations in some regions, the lack of temporal specificity limit theirutility for estimating seasonal and daily flux in population numbers.
An alternative to census statistics are data collected for administrative purposes.For example, estimates of the number of second homeowners have been generatedbased on land registry, tax and population register data for parts of Sweden (Mullerand Hall 2003), while estimates of the daytime population of urban areas across theUnited States have been made using data on school enrolments and business em-ployment records (Sleeter and Wood 2006). Administrative data can be used toestimate the overall service population of a region, but again lack temporal specific-ity, and consequently do not reflect the population present within an area at any givenpoint in time. As with census data, the utility of administrative data therefore dependson both the nature of the area under investigation and on the purpose for whichestimates are being made. For the study reported here, data on student enrolments andstaff numbers provide a general guide as to the potential service population of thecampus, but staff and student schedules are flexible, so these totals are a poor proxyfor the number of people on campus at any one time.
Faced with these limitations, other researchers interested in estimating transientpopulations have turned to primary data collection. One of the simplest methods is thegrid/density, or Jacobs methods (Reporting: The Perils of Crowd Counting 1967),which utilises aerial photography to estimate crowd size. The method involves
212 E. Charles-Edwards, M. Bell
dividing the area occupied by a crowd (usually captured via aerial photography) intogrid cells then determining an average population count for those cells. This methodhas been widely used to estimate crowd size, including at the 2009 inauguration ofUS president Barak Obama (Watson and Yip 2011), and remains the standard forestimating large outdoor crowds. While this method is effective in providing snap-shots of the count for areas with simple morphologies, it is less readily applied tocomplex precincts with a mixture of indoor and outdoor spaces, such as a Universitycampus (Raybould et al. 2000).
The direct enumeration of service populations can be costly and time consuming,leading some researchers to suggest the use of symptomatic data such as retail and taxreceipts, electricity and water usage as an alternative means of estimating the fluctu-ation in population numbers (Smith 1989). Goldschmidt and Dahl (1976) usedwastewater flows as a symptomatic indicator of population stocks in Ocean City,Maryland. Estimates of elderly snowbird populations have been produced on asimilar basis for Phoenix, Arizona, with residential electricity connections as theproxy indicator (Krug Friedman 1988). The indirect approach is appealing because itenables estimates of variations in visitor populations to be produced cheaply and in atimely manner. In practice, however, it has proven difficult to identify and accessappropriate symptomatic indicators.
The alternative to estimating population stocks from existing or primary datais to establish an accounting framework, in which inwards and outwards flowsare monitored, then added to, or subtracted from, an initial population estimate.Cordon counts, which tally individuals as they cross an imaginary line or cordon,have long been used for the purpose of generating both daytime (Foley 1952)and temporary population estimates (Schmitt 1992). Compared with the methodsconsidered above, cordon counts have the advantage that they not only provideaccurate information on the size of the service population, but also track its variationover time and reveal the population flows which underpin the observed variations.The major deficiency is that cordon counts have traditionally come at the cost of alarge enumeration burden. However, the emergence of new counting technologies,such as infrared, blue-tooth, video and thermal counters, is now providing mecha-nisms to reduce this burden by generating continuous estimates of population flows(Dietmar et al. 2009).
Travel surveys also enable the flows into and out of an area to be estimated (Foley1952), and can provide additional information on the timing and destination of trips,the purpose of travel, modes of transport and the characteristics of movers (Collinsand Greaves 2007). However, such surveys are expensive to run, and require largesamples if estimates are needed at a relatively fine level of spatial and temporalresolution or for less common types of mobility.
While a range of methods for the estimation of service populations can thereforebe identified, no single approach provides a panacea in any given setting. Analystsmust therefore be prepared to draw together a variety of data sources and applyinnovative techniques to produce estimates of service populations bounded to partic-ular times and places. In the next section, we set out the hybrid methodologydeveloped to estimate the diurnal, weekly and seasonal variation in the servicepopulation of the University of Queensland St Lucia campus, and identify theunderlying population flows.
Estimating the Service Population of a Large Metropolitan University Campus 213

Data and Methods
The University of Queensland, located in the Queensland State Capital,Brisbane, is one of Australia’s largest Universities, with more than 45,000enrolled students and around 7,000 professional and academic staff (Universityof Queensland 2011). The main campus is situated in the suburb of St Lucia, 7 kmsouthwest of the city centre on a 114 ha site, bounded on three sides by the BrisbaneRiver. In addition to hosting faculty-based teaching, learning and research activities,the St Lucia campus is home to a number of collaborative research institutes, retailand recreational facilities, as well as ten residential colleges and one commercialaccommodation provider. The population accessing the university is diverse, com-prising University students, academic and professional staff, staff of affiliated insti-tutions located on campus (e.g., the Commonwealth Scientific and IndustrialResearch Organisation), support staff, and users of campus recreational and culturalfacilities.
The service population of the University of Queensland St Lucia campuscan be segmented into two components: an overnight population made up ofpermanent and temporary residents of the colleges, and the daytime populationcomprised of staff employed by the university and by ancillary organisations locatedon campus, students visiting the campus for lectures, tutorials, research or privatestudy and other visitors who come to the campus for recreational and other purposes.To complicate the task, these populations are not entirely discrete: students arecommonly employed in casual teaching roles, and many staff and students also visitthe campus for recreation. Multiple strategies are therefore needed to capture theovernight and daytime populations, and care is needed in interpretation of existingdata sources.
The population of the St Lucia campus, like that of other urban activity nodes,varies widely depending on the particular time of day, day of the week and month ofthe year. These variations are largely dictated by the timing of the teaching semester,but they also reflect the working time model of staff on campus, and the usage patternof the various recreational and cultural facilities. To capture the fluctuation in campuspopulation at these various time scales a multi-faceted strategy was developed,combining administrative records, cordon counts and a travel survey. Together, thesedata were use to generate a series of estimates of the campus population coveringthree distinct time spans: hourly variation across a day during the teaching semester;day to day variation across a 7 day week; and weekly variation over the teachingsemester.
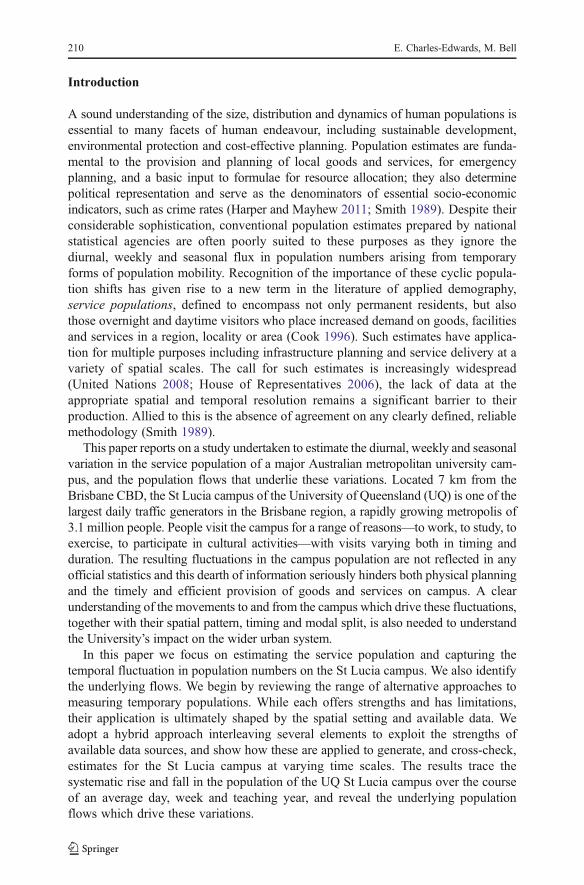
Figure 1 provides an overview of the methodology. Baseline estimates of theservice population of the St Lucia campus were first generated by combiningadministrative counts of the overnight population on campus with information froma cordon count of all movements on and off campus on Tuesday the 9th of August2011, nominated as a “typical” semester weekday. The peak campus population onthis day was adopted as the designated baseline from which estimates of the day today and weekly variation in the campus population were subsequently generatedusing information on flows to and from campus, including pedestrian counts andpublic transport patronage, each of which extended over somewhat different timeperiods. The data sources and methodology are elaborated below.
214 E. Charles-Edwards, M. Bell

Administrative Records
Annual resident population estimates produced by the Australian Bureau of Statisticsreference a standard statistical geography that does not match the area covered by theUQ St Lucia campus. As of the 30th June 2010, the Estimated Resident Population ofSt Lucia, the large residential suburb where the campus is located, sat at 11,629—afigure several times larger than the expected overnight population of the campusitself. More spatially disaggregated usual resident counts from 2006 Census ofPopulation and Housing, which better concord with the campus geography, placethe resident population of the campus at 2,269, but the residential capacity of thecampus has increased markedly since that time. To provide a reliable baseline figureof the overnight population of the campus, it was therefore necessary to adoptalternate means. Accordingly, current estimates of the resident population weremade by contacting officials at each of the residential colleges and commercialaccommodation with a request for information on the resident populations of theirfacility. It was assumed that the resident population represents the overnightpopulation of the campus during semester. College accommodation is used moresporadically outside the University teaching semester, and no reliable data werereadily available.
Cordon Count
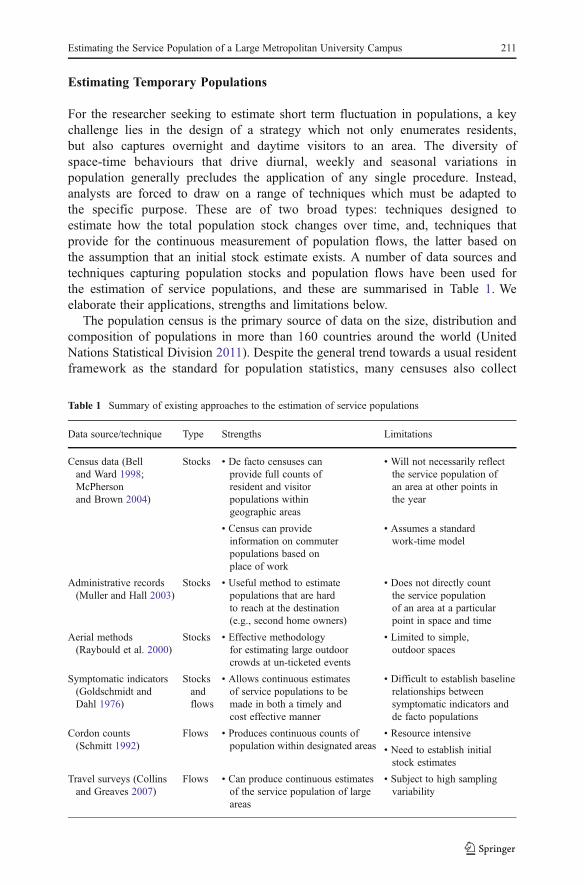
Despite being surrounded on three sides by the Brisbane River, the St Lucia campusis a highly porous locality with ten possible points of entry involving multiple modesof travel, including bus, ferry (CityCat), car, bicycle and walking (Fig. 2).
Cordon counts were established at each of the ten observation points, using anumber of technologies including manual counts, bi-directional infrared counters,and pneumatic traffic counters. These data were combined with Translink publictransport ticketing data (see below) and harmonised to produce final estimates of theflows to and from campus. The various collection methods are described below.
l
ll
ll
l
l lll
llll
ll l l
l
l ll
l l
l
l
l
Fig. 1 Overview of the strategy for the estimation of the service population of the UQ St Lucia campus
Estimating the Service Population of a Large Metropolitan University Campus 215
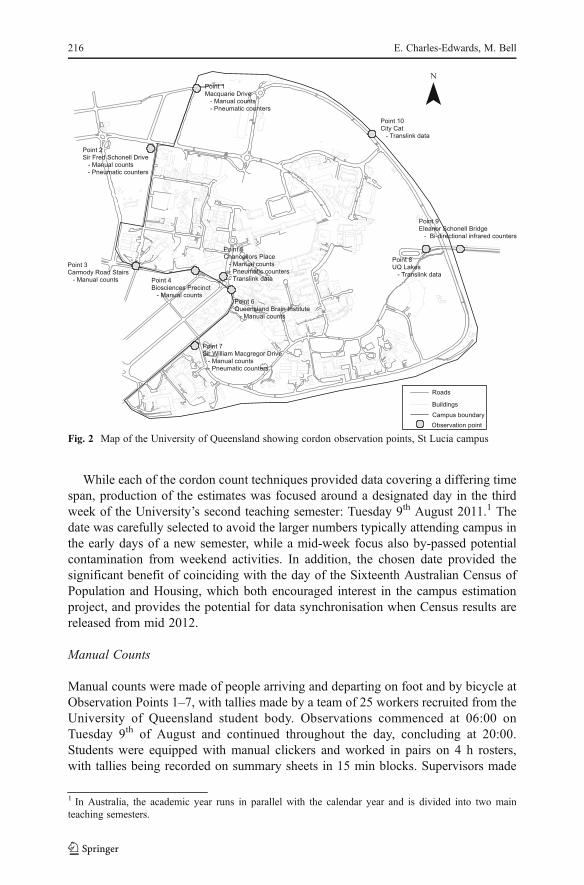
While each of the cordon count techniques provided data covering a differing timespan, production of the estimates was focused around a designated day in the thirdweek of the University’s second teaching semester: Tuesday 9th August 2011.1 Thedate was carefully selected to avoid the larger numbers typically attending campus inthe early days of a new semester, while a mid-week focus also by-passed potentialcontamination from weekend activities. In addition, the chosen date provided thesignificant benefit of coinciding with the day of the Sixteenth Australian Census ofPopulation and Housing, which both encouraged interest in the campus estimationproject, and provides the potential for data synchronisation when Census results arereleased from mid 2012.
Manual Counts
Manual counts were made of people arriving and departing on foot and by bicycle atObservation Points 1–7, with tallies made by a team of 25 workers recruited from theUniversity of Queensland student body. Observations commenced at 06:00 onTuesday 9th of August and continued throughout the day, concluding at 20:00.Students were equipped with manual clickers and worked in pairs on 4 h rosters,with tallies being recorded on summary sheets in 15 min blocks. Supervisors made
1 In Australia, the academic year runs in parallel with the calendar year and is divided into two mainteaching semesters.
Fig. 2 Map of the University of Queensland showing cordon observation points, St Lucia campus
216 E. Charles-Edwards, M. Bell
regular rounds of the observation points to check on progress, safety and morale.While counts of pedestrians and cyclists would ideally be made on a continuousbasis, labour costs and availability, coupled with the probability of job fatigue, limitedthe manual counts to a single day. Estimates for other weekdays and for weekendswere derived as described below.
Bi-Directional Infrared Counters
Infrared counters which capture movements via a beam are now a well-establisheditem of cordon-count technology (Dietmar et al. 2009) and two such counters providecontinuous estimates of the number of pedestrians, and of the number of cyclistscrossing the Eleanor Schonell Bridge (Observation Point 9). These data are admin-istered by the Brisbane City Council and were made available for the study. Thesedata have the advantage of full 24 h coverage and were available for a 2 week periodencompassing the baseline date of the study and for the whole of calendar year 2010.Although the infrared counters are susceptible to enumeration error during periods ofpeak usage, they provide good quality data on the number of pedestrians and cyclistsentering and leaving campus via this route.
Pneumatic Traffic Counters
To capture the number of vehicles entering and leaving campus, pneumatic trafficcounters were installed at Observation Points 1, 2, 5 and 7, providing data on trafficflows each day from the same 2 week period from August 2nd to 17th 2011.Pneumatic counters provide automated estimates of the number, class and speed ofvehicles, with 24 h coverage tallied into 15 min blocks, but they do not identify thenumber of passengers in each vehicle. To provide this information, an occupancysurvey was conducted concurrently with the manual counts. Occupancy of both in-and out- bound vehicles was surveyed and average occupancy rates were then appliedto traffic volumes to estimate the numbers entering and leaving campus by motorvehicle.
Translink Public Transport Ticketing Data
The number of passengers arriving and departing the St Lucia campus by bus andferry (Observation Points 5, 8 and 10) was estimated using electronic ticketing datamade available by the Translink Transit Authority, which is responsible for managingall public transportation in South East Queensland. Translink operates an integratedticketing system, and a smartcard (“Go Card”) system, which allows passengers totravel on multiple transport modes within South East Queensland on a single ticket. Auseful by-product of these systems, are data on the number of passengers boardingbuses, ferries and trains, classified by location, route number and timing. The Trans-link data provide accurate information on the number of alighting passengers, who‘touch-on’ or ‘touch-off’ their Go Cards upon arrival or departure from UQ, but Go-Card usage is not universal. To fine tune the electronic data, a survey of Go Cardusage was conducted at Observation Point 8, concurrent with the manual counts. Theresults revealed near universal usage of Go-Cards (97 %) and furnished adjustment
Estimating the Service Population of a Large Metropolitan University Campus 217
factors which were used to inflate the Translink data on bus and ferry passengerstravelling to the University of Queensland.
Travel Survey of UQ Staff and Students
The fieldwork described above captured flows to and from campus over varying timeperiods, but did not cover all forms of transport to the same extent, and inevitablyinvolved some estimation and extrapolation from one location or time period toanother. To provide a cross check on these estimates, an online survey was conductedin parallel with the fieldwork to examine the travel behaviour of UQ staff andstudents and their attendance on campus. As noted earlier, university staff andstudents are not the only people who utilise the campus, but they do represent anoverwhelming majority. Conversely, not all UQ staff or students attend the maincampus at St Lucia, so the registers of current staff and students are by no meansdirectly congruent with the potential service population of the Campus. Nevertheless,survey data do provide a valuable check on the field results.
The survey was implemented via an email sent by central administration to all7,188 staff and 41,110 students of the University of Queensland, with an invitation toparticipate in an on-line survey. An entry into a prize draw for AUS$200 wasprovided as an incentive and an embedded weblink took respondents to the surveyform which was managed through the commercial facility, SurveyMonkey. Thesurvey sought information on respondent’s time of arrival, time of departure andmode of travel to the St Lucia campus each day during the week from Monday 8th toFriday 12th August (Appendix 1). The survey also asked respondents to identify theirprincipal mode of travel, and to indicate whether they left campus at any timebetween first arrival and final departure for the day. Response rates were modest,standing at just 19.5 % for staff and 9.7 % for students (Table 2), which are lower thanthe levels generally achieved in on-line surveys (Shih and Xitao 2008) possiblyreflecting low levels of engagement with university emails among students and aperceived high respondent burden among university staff. Despite this, the data providea valuable cross-check on the estimates derived from field observation, as will be shownbelow, and furnish additional detail on the timing of arrivals and departures separatelyfor staff and students in a form that is not available from the field data.
Based on the information collected with this mix of data sources (Table 3) a seriesof estimates of the size and variation in the population of the UQ St Lucia campuswere generated for the course of a single day, a full seven day week, and a universityteaching year. Estimates were not made for non-teaching periods because the com-position of the campus population, which ultimately drives population numbers, ismarkedly different when undergraduate students are not on campus. We now discusseach of these time frames in turn.
Table 2 Online travel survey response statistics
Respondent category Population Valid responses Achieved survey response rate (%)
Staff 7,188 1,404 19.5
Students 41,110 3,996 9.7
218 E. Charles-Edwards, M. Bell

Estimating the Campus Daytime Population
Estimates of the daytime population of the UQ St Lucia campus on a “typical”semester day were constructed from data on the campus resident population andestimates of population flows made from the cordon counts on Tuesday 9th August.Campus arrivals and departures, summed across all observation points and transportmodes, were tallied at 15 min intervals and added to the overnight population toproduce rolling estimates of the rise and fall of the campus population.
A number of adjustments were needed to harmonise the data and complete theestimation procedure:
& As manual counting of pedestrian and cyclist flows did not commence until 06:00on the survey day and was concluded by 20:00, movements of pedestrians andcyclists outside of these times were imputed. This was done on a pro-rata basisusing counts from the bi-directional infrared counters situated on the EleanorSchonell Bridge.
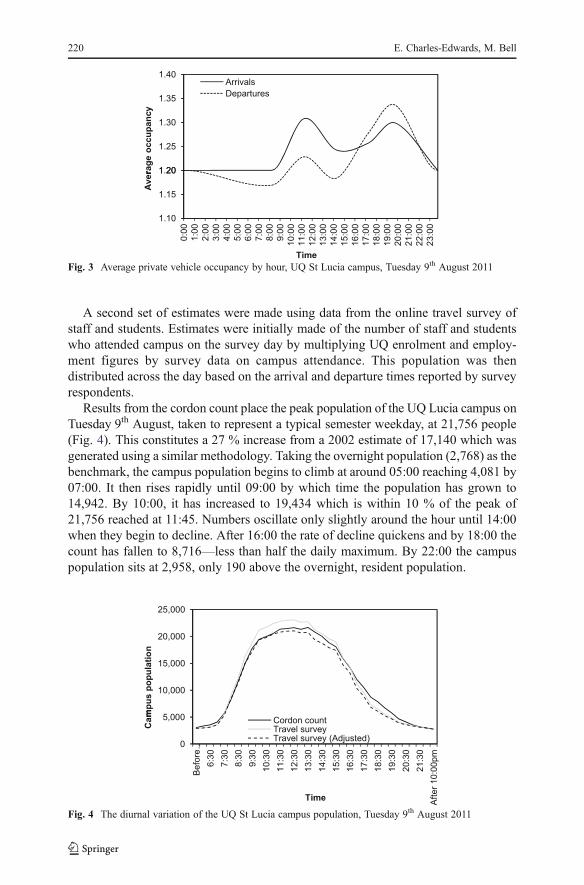
& The average number of passengers per vehicle, as determined by the occupancysurvey, was applied to the traffic counts to estimate the number of people arrivingand departing campus by car. These values varied significantly across in- and out-bound vehicles, and over the course of the day). Changes in average vehicleoccupancy over the course of the day were interpolated using a cubic spline (Fig. 3).
& Translink data on alighting passengers were adjusted to account for those notusing the Go Card ticketing system. The proportion of alighting passengers usingGo Cards (97 %) did not vary significantly over the course of the day.
& Balancing factors were applied to ensure that total daily inflows matched totaldaily outflows.
Table 3 Summary of data collection methods
Captures Period % of total flowson reference day
Manual counts Pedestrians and cyclists atObservation Points 1–7
1. Reference day 17.7
Bi-directionalinfrared counters
Pedestrians and cyclists atobservation point 9
1. Reference day 5.8
2. Week around reference day
3. All of 2010
Pneumatictraffic counters
Vehicles at ObservationPoints 2, 5, and 7
1. Reference day 40.4
Vehicle occupancy surveyconducted at Observationpoint 2
2.2 weeks around reference day
Translink data Bus passengers at ObservationPoints 5 and 8
1. Reference day 36.1
CityCat passengers atObservation Point 10
2. All of 2010 and 2011(Daily totals)
Travel survey Reported arrivals anddepartures of staff and students
1. Reference day na
2. Week around reference day
Estimating the Service Population of a Large Metropolitan University Campus 219
A second set of estimates were made using data from the online travel survey ofstaff and students. Estimates were initially made of the number of staff and studentswho attended campus on the survey day by multiplying UQ enrolment and employ-ment figures by survey data on campus attendance. This population was thendistributed across the day based on the arrival and departure times reported by surveyrespondents.
Results from the cordon count place the peak population of the UQ Lucia campus onTuesday 9th August, taken to represent a typical semester weekday, at 21,756 people(Fig. 4). This constitutes a 27 % increase from a 2002 estimate of 17,140 which wasgenerated using a similar methodology. Taking the overnight population (2,768) as thebenchmark, the campus population begins to climb at around 05:00 reaching 4,081 by07:00. It then rises rapidly until 09:00 by which time the population has grown to14,942. By 10:00, it has increased to 19,434 which is within 10 % of the peak of21,756 reached at 11:45. Numbers oscillate only slightly around the hour until 14:00when they begin to decline. After 16:00 the rate of decline quickens and by 18:00 thecount has fallen to 8,716—less than half the daily maximum. By 22:00 the campuspopulation sits at 2,958, only 190 above the overnight, resident population.
Fig. 3 Average private vehicle occupancy by hour, UQ St Lucia campus, Tuesday 9th August 2011
Fig. 4 The diurnal variation of the UQ St Lucia campus population, Tuesday 9th August 2011
220 E. Charles-Edwards, M. Bell
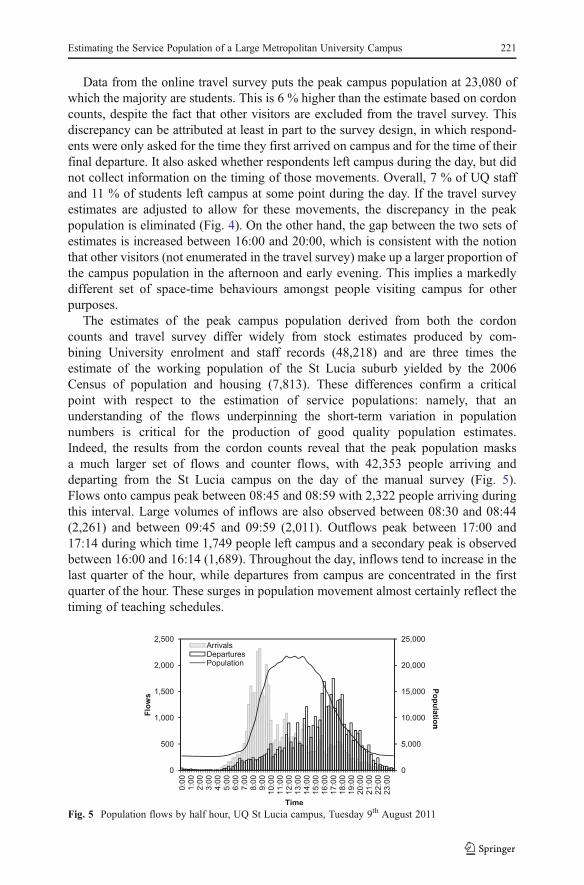
Data from the online travel survey puts the peak campus population at 23,080 ofwhich the majority are students. This is 6 % higher than the estimate based on cordoncounts, despite the fact that other visitors are excluded from the travel survey. Thisdiscrepancy can be attributed at least in part to the survey design, in which respond-ents were only asked for the time they first arrived on campus and for the time of theirfinal departure. It also asked whether respondents left campus during the day, but didnot collect information on the timing of those movements. Overall, 7 % of UQ staffand 11 % of students left campus at some point during the day. If the travel surveyestimates are adjusted to allow for these movements, the discrepancy in the peakpopulation is eliminated (Fig. 4). On the other hand, the gap between the two sets ofestimates is increased between 16:00 and 20:00, which is consistent with the notionthat other visitors (not enumerated in the travel survey) make up a larger proportion ofthe campus population in the afternoon and early evening. This implies a markedlydifferent set of space-time behaviours amongst people visiting campus for otherpurposes.
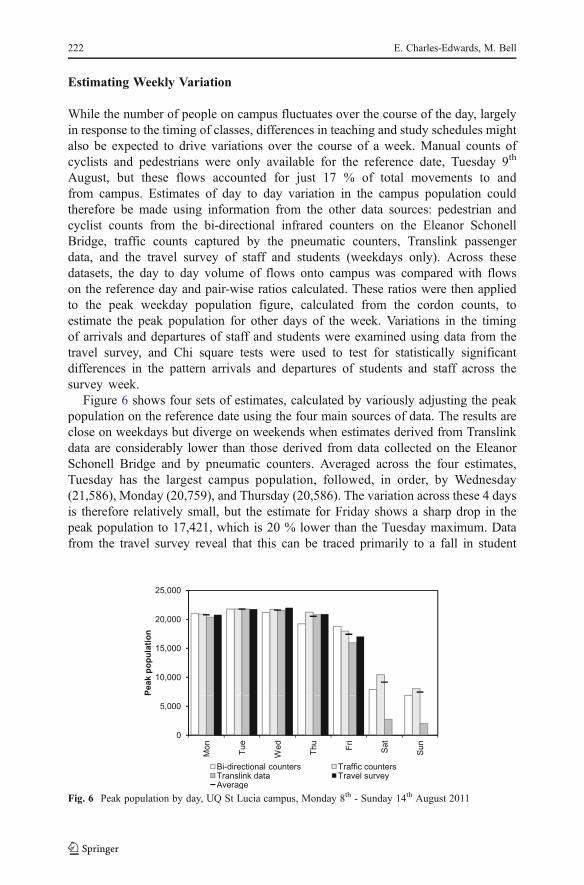
The estimates of the peak campus population derived from both the cordoncounts and travel survey differ widely from stock estimates produced by com-bining University enrolment and staff records (48,218) and are three times theestimate of the working population of the St Lucia suburb yielded by the 2006Census of population and housing (7,813). These differences confirm a criticalpoint with respect to the estimation of service populations: namely, that anunderstanding of the flows underpinning the short-term variation in populationnumbers is critical for the production of good quality population estimates.Indeed, the results from the cordon counts reveal that the peak population masksa much larger set of flows and counter flows, with 42,353 people arriving anddeparting from the St Lucia campus on the day of the manual survey (Fig. 5).Flows onto campus peak between 08:45 and 08:59 with 2,322 people arriving duringthis interval. Large volumes of inflows are also observed between 08:30 and 08:44(2,261) and between 09:45 and 09:59 (2,011). Outflows peak between 17:00 and17:14 during which time 1,749 people left campus and a secondary peak is observedbetween 16:00 and 16:14 (1,689). Throughout the day, inflows tend to increase in thelast quarter of the hour, while departures from campus are concentrated in the firstquarter of the hour. These surges in population movement almost certainly reflect thetiming of teaching schedules.
Fig. 5 Population flows by half hour, UQ St Lucia campus, Tuesday 9th August 2011
Estimating the Service Population of a Large Metropolitan University Campus 221
Estimating Weekly Variation
While the number of people on campus fluctuates over the course of the day, largelyin response to the timing of classes, differences in teaching and study schedules mightalso be expected to drive variations over the course of a week. Manual counts ofcyclists and pedestrians were only available for the reference date, Tuesday 9th
August, but these flows accounted for just 17 % of total movements to andfrom campus. Estimates of day to day variation in the campus population couldtherefore be made using information from the other data sources: pedestrian andcyclist counts from the bi-directional infrared counters on the Eleanor SchonellBridge, traffic counts captured by the pneumatic counters, Translink passengerdata, and the travel survey of staff and students (weekdays only). Across thesedatasets, the day to day volume of flows onto campus was compared with flowson the reference day and pair-wise ratios calculated. These ratios were then appliedto the peak weekday population figure, calculated from the cordon counts, toestimate the peak population for other days of the week. Variations in the timingof arrivals and departures of staff and students were examined using data from thetravel survey, and Chi square tests were used to test for statistically significantdifferences in the pattern arrivals and departures of students and staff across thesurvey week.
Figure 6 shows four sets of estimates, calculated by variously adjusting the peakpopulation on the reference date using the four main sources of data. The results areclose on weekdays but diverge on weekends when estimates derived from Translinkdata are considerably lower than those derived from data collected on the EleanorSchonell Bridge and by pneumatic counters. Averaged across the four estimates,Tuesday has the largest campus population, followed, in order, by Wednesday(21,586), Monday (20,759), and Thursday (20,586). The variation across these 4 daysis therefore relatively small, but the estimate for Friday shows a sharp drop in thepeak population to 17,421, which is 20 % lower than the Tuesday maximum. Datafrom the travel survey reveal that this can be traced primarily to a fall in student
Fig. 6 Peak population by day, UQ St Lucia campus, Monday 8th - Sunday 14th August 2011
222 E. Charles-Edwards, M. Bell

numbers on campus. Teaching timetables are commonly arranged to limit the numberof classes on the last day of the working week but this reduction in attendance almostcertainly reflects a preference on the part of both students and staff to work fromhome, or engage in other pursuits, in the lead-up to the weekend.
Results from the travel survey confirm lower attendance on the Friday, but also revealstatistically significant differences in the timing of student arrivals on campus (χ2089,(31), p00.00) and of student and staff departures from campus (Student: χ20245 (31)p00.00; Staff: χ2059 (31) p00.00) on Fridays compared with the reference day,Tuesday the 9th of August. Chi square tests applied to student and staff movements onMonday through Thursday revealed no statistically significant differences indistribution of arrival and departures at the 0.05 confidence level. The difference inthe pattern of student arrivals on Friday compared with other weekdays is driven by adrop in student arrivals on Friday afternoons. The variation in departures is morepronounced with staff and students clearly heading home (or to the pub!) earlier onFridays than on other days.
While weekday estimates are closely aligned across the four datasets, the Translinkdata yield a much lower estimate of the weekend population than the other datasources. Differences in the modal split of transport to and from campus on weekendsare the likely cause of this discrepancy, with lower public transport usage relative toother transport modes dampening the figure. This highlights a key issue in the use ofpartial counts for the extrapolation of service populations, namely that changes in theunderlying relationships can have a marked impact on results. Excluding the Trans-link estimates from the calculations, the average peak populations on the Saturday(9,160) and Sunday (7,449) following the survey, were less than half the averageweekday population.
Estimating Variation Over the Teaching Semester
It is highly desirable to generate service population estimates for periods extendingbeyond a single day or week, however, replicating the methodology described in“Estimating the Campus Daytime Population” on a weekly or monthly basis isimpractical. Partial flow data are, however, available and can be used to generateestimates of the campus population at regular intervals throughout the year. Twodatasets were available for this purpose: Translink passenger embarkation data for2010 and 2011, and pedestrian and bicycle counts captured by the bi-directionalcounters on the Eleanor Schonell Bridge in 2010. On the study reference day(Tuesday, August 9th, 2011) these two sources accounted for 5.8 % and 36.1 % ofcampus flows respectively. Data from the bi-directional counters were unavailable forpart of 2011 due to technical failure. For this reason, estimates were only producedfor the 2010 teaching year.
To generate estimates of the peak campus population over the Universityteaching semester, partial flows data were compared to equivalent totals on thereference day and pair-wise ratios were calculated. These ratios were thenapplied to the reference day peak population. Underpinning this approach isan assumption of stability in the modal split of population flows on and off campus; in
Estimating the Service Population of a Large Metropolitan University Campus 223
the temporal pattern of arrivals and departures on and off campus; and in the size of theovernight population.
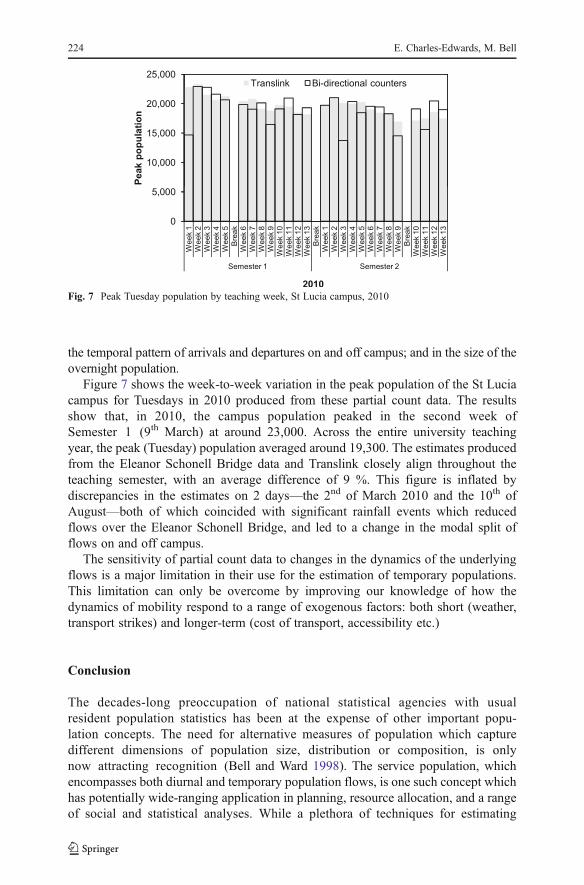
Figure 7 shows the week-to-week variation in the peak population of the St Luciacampus for Tuesdays in 2010 produced from these partial count data. The resultsshow that, in 2010, the campus population peaked in the second week ofSemester 1 (9th March) at around 23,000. Across the entire university teachingyear, the peak (Tuesday) population averaged around 19,300. The estimates producedfrom the Eleanor Schonell Bridge data and Translink closely align throughout theteaching semester, with an average difference of 9 %. This figure is inflated bydiscrepancies in the estimates on 2 days—the 2nd of March 2010 and the 10th ofAugust—both of which coincided with significant rainfall events which reducedflows over the Eleanor Schonell Bridge, and led to a change in the modal split offlows on and off campus.
The sensitivity of partial count data to changes in the dynamics of the underlyingflows is a major limitation in their use for the estimation of temporary populations.This limitation can only be overcome by improving our knowledge of how thedynamics of mobility respond to a range of exogenous factors: both short (weather,transport strikes) and longer-term (cost of transport, accessibility etc.)
Conclusion
The decades-long preoccupation of national statistical agencies with usualresident population statistics has been at the expense of other important popu-lation concepts. The need for alternative measures of population which capturedifferent dimensions of population size, distribution or composition, is onlynow attracting recognition (Bell and Ward 1998). The service population, whichencompasses both diurnal and temporary population flows, is one such concept whichhas potentially wide-ranging application in planning, resource allocation, and a rangeof social and statistical analyses. While a plethora of techniques for estimating
Fig. 7 Peak Tuesday population by teaching week, St Lucia campus, 2010
224 E. Charles-Edwards, M. Bell

temporary populations have been proposed, these have rarely been compared andtested, applied in practice, or harnessed to provide a systematic profile of populationflux. As a result, and despite extensive effort, there remains a distinct and troublinglack of clarity as to the most appropriate and reliable methodology for estimatingthese populations.
This paper adopted a hybrid approach to estimate the service population of alarge Australian metropolitan university campus combining administrative, cor-don count, and survey data. Despite being one of the largest daily trafficgenerators in the city of Brisbane, there are no reliable estimates of the sizeof the population on the University of Queensland St Lucia campus on anysingle day or at any point in time. Neither census data on place of work, noradministrative statistics on staff and student enrolments provide an adequatemeasure of the campus population, as they omit key groups and fail to takeaccount of the varying timetables that drive marked fluctuations in the numberson campus over different timeframes. Our approach aimed to by-pass theselimitations by harnessing a range of techniques and data sources to directlymonitor the movements of people to and from the campus, in a way whichprovided information not only on the population stock at various points in time,but also on the underlying flows. Field techniques included manual, infra-redand pneumatic counts at ten observation points on the campus periphery,coupled with secondary data on public transport passengers. At the same timewe implemented a discrete on-line survey to provide a cross-check on the fieldsurvey results.
The estimates place the peak population of the St Lucia campus at a little below22,000, with numbers showing a sharp rise between 07:30 and 09:30 from theovernight population of around 2,700, a broad plateau between 09:30 and 15:30,followed by a steady fall until early evening. This peak was almost ten times theofficial estimate of the resident population recorded at the 2006 Census, and threetimes the Census estimate of the daytime working population (which omits students)recorded for the entire suburb within which the campus is located. Over the first4 days of the working week, day to day variation was slight, but on Friday the peakpopulation dropped by 20 %, probably reflecting a reduction in the number ofscheduled classes. While there is little formal teaching contact on weekends, studentscome onto campus to utilise library and laboratory facilities, and the population countis heavily supplemented by sporting fixtures and visitors attracted to the recreationalfacilities and pleasant grounds of the campus. As a result, weekend numbersremained relatively high, with figures for Saturday and Sunday standing at 46 %and 35 % respectively of the weekday average.
As well as providing up-to-date information of direct practical utility that is notavailable from any other source, this project offers a number of lessons for estimatingtemporary populations in similar settings. First, it is apparent that a hybrid approachcombining a variety of data sources and enumeration techniques can be forged into acoherent and effective methodology to tackle complex problems in population esti-mation in a way that delivers credible results covering varying time scales. Inpractice, such a strategy offers distinct benefits because comparisons can be madebetween data sources designed to capture particular types of movement and system-atic relationships can be established. This in turn enables estimates to be made with
Estimating the Service Population of a Large Metropolitan University Campus 225
confidence for flows, or time periods, for which only partial data are available. In thisproject, we were able to establish clear relationships between the manual counts, onthe one hand, and the data delivered by infrared and pneumatic sensors, and byticketing data, on the other. Pedestrian and some cycle movements could therefore beimputed for some timeframes, reducing the need for more labour intensive, andexpensive, manual counting.
A second valuable finding from the current research was the close correlationbetween estimates obtained from the on-line survey, compared with those derivedfrom field observation. Remote, retrospective surveys of time and activity budgetswould seem likely prone to error, and the response rates achieved were modest,despite use of an officially sanctioned survey delivered with incentives to a captivepopulation. Nevertheless, the on-line survey delivered results remarkably similar tothose obtained from field observation, but at significantly lower cost. At the veryleast, the ease and economy of implementing such surveys argues in their favour, ifonly for triangulation, where a suitable sampling frame is available.
A third beneficial feature of the strategy adopted for this project is in providingestimates of the inwards and outwards flows that underpin the changes in populationnumbers on campus. These flows were substantial, with the daily volume of move-ment double the peak weekday campus population. This implies a high level ofturnover against which small changes in temporal distribution would exert potentiallylarge impacts on campus population numbers. With some first year classes approach-ing 1,000 students, timetabling decisions therefore have potentially far-reachingeffects. The overall intensity of movement and the attendant spatial patterns reveallinks to the broader metropolitan context with implications for transport planning, aswell as for the design of pathways to facilitate movement within the campus itself.The cordon counts and travel survey used in this project also delivered estimates ofthe relative importance of different modes of transport used to access the campus.These will be reported elsewhere with comparisons against a previous survey, con-ducted in 2002, to explore shifts in transport usage over time.
It is clear that an understanding of the volume, timing and character of populationflows is critical to understanding the dynamics of service populations and a necessaryprecondition for the estimation of any service population. The implication is that afundamental shift in how demographers think about measuring populations is re-quired – one in which the temporal distribution of population flows driving observedchanges in service populations is as important as our traditional preoccupation withunderstanding their spatial distribution. Until recently, capturing population flows athigh levels of spatial and temporal resolution has been a costly and time consumingexercise. The emergence of automated approaches such as infra-red counters andelectronic ticketing systems, as used in this project, has greatly facilitated the trackingprocess, and the emergence of the latest technologies such as video-capture andlocation tracking systems linked to mobile phones, GPS and internet services isnow opening a new generation of reliable, cost-effective techniques (Ahas et al.2007). In an epoch of rapidly rising demand for timely, cost-efficient information,these technologies promise a potential revolution in the delivery of data whichcapture both population stocks and flows, in real time and on a continuous basis.These in turn will enable novel questions with respect to the dynamics of servicepopulations to be explored. Examples include the response of service populations to
226 E. Charles-Edwards, M. Bell

variations in weather and climate, the impact of changes elsewhere in the urbansystem on the population of large urban activity nodes, and the effect of externalshocks, including both man-made events and natural disasters, on population countsand spatial dynamics.
Acknowledgments The authors gratefully acknowledge the University of Queensland’s Properties andFacilities Division who funded this study.
Appendix 1
Screen shot of online travel survey of UQ staff and students.
References
Ahas, R., Aasa, A., Mark, U., Pae, T., & Kull, A. (2007). Seasonal tourism spaces in Estonia: case studywith mobile positioning data. Tourism Management, 28, 898–910.
Bell, M., & Ward, G. (1998). Patterns of temporary mobility in Australia: evidence from the 1991 Census.Australian Geographical Studies, 36(1), 58–81.
Collins, A., & Greaves, S. (2007). Daytime population tracking for planning and pollution exposureassessment. Road and Transport Research: A Journal of Australian and New Zealand Research andPractice, 16(1), 55.
Estimating the Service Population of a Large Metropolitan University Campus 227
Cook, T. (1996). When ERPs aren’t enough - a discussion of issues associated with service populationestimation. Canberra: Australian Bureau of Statistics.
Dietmar, B., Brandle, N., Seer, S., Ray, M., & Kitazawa, K. (2009). Measurement of pedestrian move-ments: A comparative study on various existing systems. In J. P. Timmermans (Ed.), Pedestrianbehavior: Models, data collection and applications. Bingley: Emerald Group Publishing Limited.
Foley, D. L. (1952). The daily movement of population into central business districts. American Sociolog-ical Review, 17(5), 538–543.
Goldschmidt, P., & Dahl, A. (1976). Demoflush: Estimating population in seasonal resort communities.Growth and Change, 7, 44–48.
Harper, G., & Mayhew, L. (2011). Using administrative data to count local populations. Applied SpatialAnalysis and Policy, 1–26. doi:10.1007/s12061-011-9063-y.
House of Representatives. (2006). Managing our coastal zone in a changing climate: The time to act isnow. Canberra: Standing Committee on Climate Change, Water, Environment and the Arts.
Krug Friedman, S. (1988). Forecasting a seasonal population. Business Economics, 23, 48–52.McPherson, T., & Brown, M. (2004). Estimating Daytime and Nighttime Population Distributions in U.S.
Cities for Emergency Response Activities. Paper presented at the Symposium on Planning, Nowcasting,and Forecasting in the Urban Zone, 84th AMS Annual Meeting, Seattle.
Muller, D. K., & Hall, C. M. (2003). Second homes and regional population distribution: on administrativepractices and failures in Sweden. Espace, Populations, Societes, 2, 251–261.
Raybould, M., Mules, T., Fredline, E., & Tomljenovic, R. (2000). Counting the herd. Using aerialphotography to estimate attendance at open events. Event Management, 6(1), 25–32.
Reporting: The Perils of Crowd Counting (1967). Time, Apr 1967, Retrieved 11 February 2011.Schmitt, R. (1992). Estimating Hawaii’s de facto population. Applied Demography, 7(2), 1–3.Shih, T.-H., & Xitao, F. (2008). Comparing response rates from web and mail surveys: a meta analysis.
Field Methods, 20, 249–271.Sleeter, R., & Wood, N. (2006). Estimating daytime and nightime population density for coastal commun-
ites in Oregon (pp. 26–29). Vancouver: Annual Conference of the Urban and Regional InformationSystems Association.
Smith, S. K. (1989). Toward a methodology for estimating temporary residents. Journal of the AmericanStatistical Association, 84(406), 430–436.
United Nations. (2008). Principles and recommendations for population and housing censuses, revision 2.New York: Department of Economic and Social Affairs.
United Nations Statistical Division (2011). 2010 World population and housing census programme. http://unstats.un.org/unsd/demographic/sources/census/2010_PHC/default.htm. Accessed 01 Jan 2011.
University of Queensland (2011). UQ key statistics. http://www.mis.admin.uq.edu.au/Content/UQKeyStatistics.aspx.
Watson, R., & Yip, P. (2011). How many were there when it mattered? Estimating the sizes of crowds.Significance, 8(3), 104–107.
228 E. Charles-Edwards, M. Bell