Embed Size (px)
Citation preview

1 +1Fisheries and Oceans Pêches et OcéansCanada Canada
Canadian Stock Assessment SecretariatResearch Document 98/9 3
Not to be cited withoutpermission of the authors '
Secrétariat canadien pour l'évaluation des stocksDocument de recherche 98/9 3
Ne pas citer sansautorisation des auteurs '
Estimating the percentage of hatchery-reared juvenilecoho salmon in the Strait of Georgia in 1997
R.J . Beamish, R . Sweeting and Z. Zhan g
Department of Fisheries and OceansPacific Biological Station, Nanaimo, B .C. V9R 5K6
' This series documents the scientific basis forthe evaluation of fisheries resources inCanada. As such, it addresses the issues ofthe day in the time frames required and thedocuments it contains are not intended asdefinitive statements on the subjects addressedbut rather as progress reports on ongoinginvestigations .
Research documents are produced in theofficial language in which they are provided tothe Secretariat .
1 La présente série documente les basesscientifiques des évaluations des ressourceshalieutiques du Canada. Elle traite desproblèmes courants selon les échéanciersdictés. Les documents qu'elle contient nedoivent pas être considérés comme desénoncés définitifs sur les sujets traités, maisplutôt comme des rapports d'étape sur lesétudes en cours .
Les documents de recherche sont publiés dansla langue officielle utilisée dans le manuscritenvoyé au secrétariat .
ISSN 1480-4883Ottawa, 1998
Canad'

Abstract
The marking of a large number of hatche ry coho in 1997 by removal of the leftpelvic fin provided an oppo rtunity to estimate the percentage of hatche ry andwild coho in the Strait of Georgia . The survey of juvenile coho abundance anddistribution in the Strait of Georgia and Puget Sound in 1997 provided samplesthat enabled estimates of hatche ry and wild coho to be determined prior to anyfishe ry . These marked coho and catches from surveys in June/July and inSeptember indicated the propo rt ion of juvenile hatche ry coho within the Strait ofGeorgia ranged from 76-79% . If estimates of smolts from enhanced adults (i .e .,hatche ry fish spawning in the wild) were included as hatche ry releases,estimates of hatche ry percentages in the catch could be as high as 87% . Bothhatche ry and wild juvenile coho remained within the Strait of Georgia until afterSeptember, several months after coho left Puget Sound . There was nodifference in the length of coho with or without the left pelvic fin .
Résumé
En 1997, le marquage d'un grand nombre de saumons coho, par ablation de lanageoire pelvienne, a permis d'estimer la propo rt ion des sujets sauvages et dessujets d'élevage dans le détroit de Georgia . Les échantillons prélevés au coursd'un relevé effectué en 1997, pour étudier l'abondance et la répa rt ition desjuvéniles dans le détroit de Georgia et la baie Puget, ont permis de prédire lesproportions des saumons coho sauvages et d'élevage avant le début de lasaison de la pêche . Selon les résultats du marquage ainsi que ceux des relevésde juin - juillet et de septembre, la propo rtion des juvéniles d'élevage dans ledétroit de Georgia aurait été de 76 à 79 % . Si, de surcroît, on comptait commejuvéniles d'élevage les saumoneaux de frayères naturelles issus de parentsd'élevage, la propo rt ion estimée des prises de coho d'élevage pourrait s'élever à87 % . Les juvéniles des deux groupes, sauvage et d'élevage, sont demeurésdans le détroit de Georgia après septembre, soit plusieurs mois après le dépa rtdu coho de la baie Puget. Aucune différence de taille n'a été observée entre lessujets ayant subi l'ablation de la nageoire pelvienne et les autres .
I
INTRODUCTION
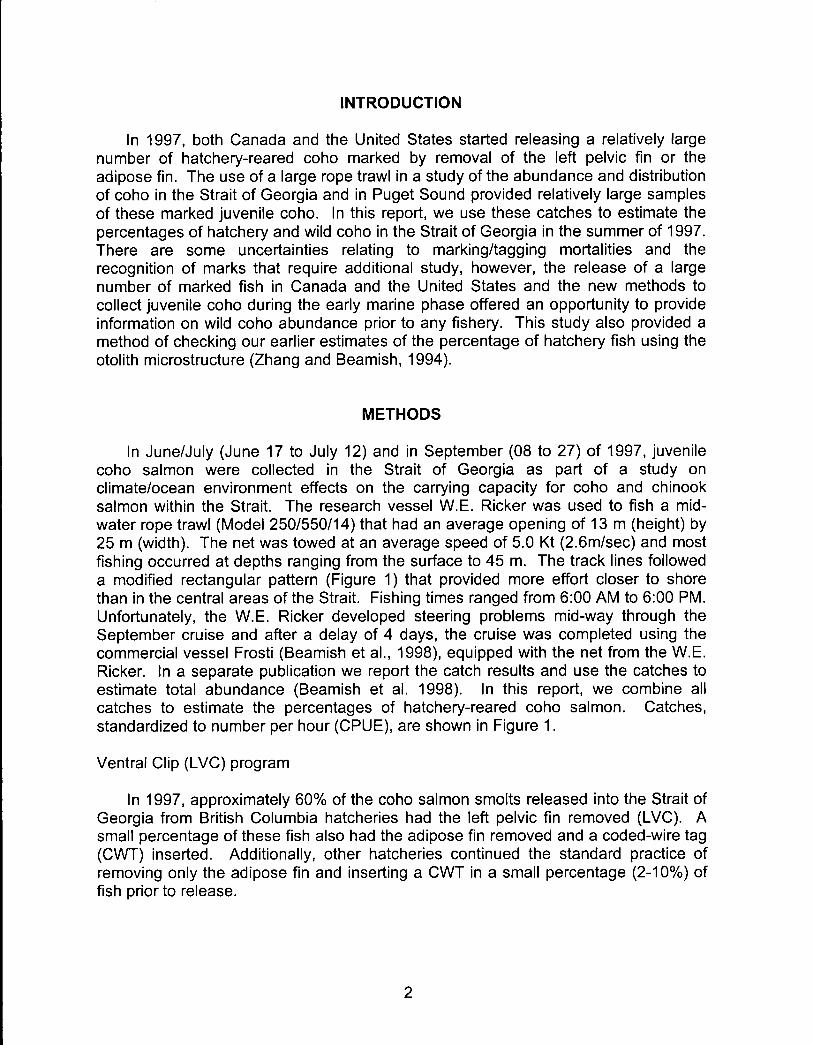
In 1997, both Canada and the United States started releasing a relatively largenumber of hatchery-reared coho marked by removal of the left pelvic fin or theadipose fin . The use of a large rope trawl in a study of the abundance and distributionof coho in the Strait of Georgia and in Puget Sound provided relatively large samplesof these marked juvenile coho . In this report, we use these catches to estimate thepercentages of hatchery and wild coho in the Strait of Georgia in the summer of 1997 .There are some uncertainties relating to marking/tagging mortalities and therecognition of marks that require additional study, however, the release of a largenumber of marked fish in Canada and the United States and the new methods tocollect juvenile coho during the early marine phase offered an opportunity to provideinformation on wild coho abundance prior to any fishery . This study also provided amethod of checking our earlier estimates of the percentage of hatchery fish using theotolith microstructure (Zhang and Beamish, 1994) .
METHODS
In June/July (June 17 to July 12) and in September (08 to 27) of 1997, juvenilecoho salmon were collected in the Strait of Georgia as part of a study onclimate/ocean environment effects on the carrying capacity for coho and chinooksalmon within the Strait . The research vessel W.E . Ricker was used to fish a mid-water rope trawl (Model 250/550/14) that had an average opening of 13 m (height) by25 m (width) . The net was towed at an average speed of 5.0 Kt (2 .6m/sec) and mostfishing occurred at depths ranging from the surface to 45 m . The track lines followeda modified rectangular pattern (Figure 1) that provided more effort closer to shorethan in the central areas of the Strait . Fishing times ranged from 6:00 AM to 6:00 PM.Unfortunately, the W .E . Ricker developed steering problems mid-way through theSeptember cruise and after a delay of 4 days, the cruise was completed using thecommercial vessel Frosti (Beamish et al ., 1998), equipped with the net from the W .E.Ricker . In a separate publication we report the catch results and use the catches toestimate total abundance (Beamish et al . 1998). In this report, we combine allcatches to estimate the percentages of hatchery-reared coho salmon . Catches,standardized to number per hour (CPUE), are shown in Figure 1 .
Ventral Clip (LVC) progra m
In 1997, approximately 60% of the coho salmon smolts released into the Strait ofGeorgia from British Columbia hatcheries had the left pelvic fin removed (LVC). Asmall percentage of these fish also had the adipose fin removed and a coded-wire tag(CWT) inserted . Additionally, other hatcheries continued the standard practice ofremoving only the adipose fin and inse rt ing a CWT in a small percentage (2-10%) offish prior to release .
2
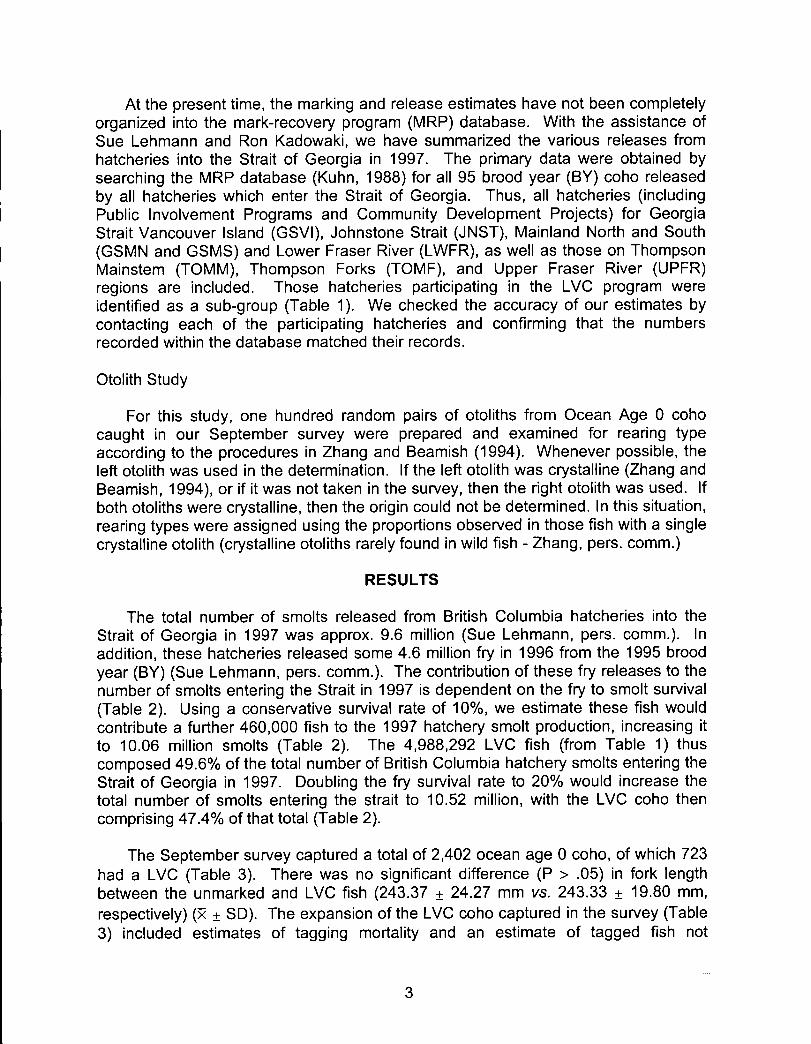
At the present time, the marking and release estimates have not been completelyorganized into the mark-recovery program (MRP) database . With the assistance ofSue Lehmann and Ron Kadowaki, we have summarized the various releases fromhatcheries into the Strait of Georgia in 1997 . The primary data were obtained bysearching the MRP database (Kuhn, 1988) for all 95 brood year (BY) coho releasedby all hatcheries which enter the Strait of Georgia . Thus, all hatcheries (includingPublic Involvement Programs and Community Development Projects) for GeorgiaStrait Vancouver Island (GSVI), Johnstone Strait (JNST), Mainland North and South(GSMN and GSMS) and Lower Fraser River (LWFR), as well as those on ThompsonMainstem (TOMM), Thompson Forks (TOMF), and Upper Fraser River (UPFR)regions are included . Those hatcheries participating in the LVC program wereidentified as a sub-group (Table 1) . We checked the accuracy of our estimates bycontacting each of the participating hatcheries and confirming that the numbersrecorded within the database matched their records .
Otolith Study
For this study, one hundred random pairs of otoliths from Ocean Age 0 cohocaught in our September survey were prepared and examined for rearing typeaccording to the procedures in Zhang and Beamish (1994) . Whenever possible, theleft otolith was used in the determination . If the left otolith was crystalline (Zhang andBeamish, 1994), or if it was not taken in the survey, then the right otolith was used . Ifboth otoliths were crystalline, then the origin could not be determined . In this situation,rearing types were assigned using the proportions observed in those fish with a singlecrystalline otolith (crystalline otoliths rarely found in wild fish - Zhang, pers . comm . )
RESULTS
The total number of smolts released from British Columbia hatcheries into theStrait of Georgia in 1997 was approx. 9.6 million (Sue Lehmann, pers . comm.) . Inaddition, these hatcheries released some 4 .6 million fry in 1996 from the 1995 broodyear (BY) (Sue Lehmann, pers . comm.) . The contribution of these f ry releases to thenumber of smolts entering the Strait in 1997 is dependent on the fry to smolt survival(Table 2) . Using a conservative survival rate of 10%, we estimate these fish wouldcontribute a further 460,000 fish to the 1997 hatche ry smolt production, increasing itto 10 .06 million smolts (Table 2). The 4,988,292 LVC fish (from Table 1) thuscomposed 49 .6% of the total number of British Columbia hatche ry smolts entering theStrait of Georgia in 1997 . Doubling the fry survival rate to 20% would increase thetotal number of smolts entering the strait to 10 .52 million, with the LVC coho thencomprising 47 .4% of that total (Table 2) .
The September survey captured a total of 2,402 ocean age 0 coho, of which 723had a LVC (Table 3). There was no significant difference (P > .05) in fork lengthbetween the unmarked and LVC fish (243 .37 ± 24 .27 mm vs. 243.33 ± 19 .80 mm,respectively) (x ± SD) . The expansion of the LVC coho captured in the survey (Table3) included estimates of tagging mortality and an estimate of tagged fish no t
3

recognized ( i .e ., awareness) . While ventral fin clipping mo rtality can range from 6-25% (PSC 1995, 1997), we have no measures of the mortality for the 1997 programand used conservative error estimates of 7% for mortality and 7% for awareness.
We estimated the number of United States (US) hatche ry fish using informationfrom our earlier Puget Sound surveys (Beamish et al . 1998) . In our sets in PugetSound in June/July, 1696 coho were caught, of which 280 (17%) had adipose clipsOnly 50, or 17 .8%, of these adipose clipped fish also had a CWT . In the Strait ofGeorgia we considered all adipose clipped fish without a CWT to be US fish andadded to this number all fish with a CWT from a US hatche ry to obtain an initialAmerican contribution . We also assumed that 70% of the coho in Puget Sound werehatche ry reared (Bill Tweit, WDFW, pers . comm .) and, therefore, 70% of theestimated coho from Puget Sound in our catches in the Strait of Georgia would befrom US hatcheries . Thus, the 40 US coho caught in our September survey (Table 3)expanded to 177 US hatche ry-reared coho (including a 7% awareness factor) . Basedon these assumptions, the total hatche ry contribution (Canadian and US) to ourSeptember catch was 1840 coho, representing 76.6% of the total catch and,therefore, of the total coho smolt population within the Strait of Georgia in Septemberof 1997 .
The remaining 24 .4% of the coho population in the September survey that werenot estimated to have been reared in hatcheries are a mixture of offspring from bothwild spawners and hatche ry-reared fish which spawned in the wild . The escapementdatabase enumerates all fish spawning in a river regardless of origin and, as a result,both wild fish and hatche ry-reared fish spawning in the river are included . However,in some areas returning hatche ry spawners may contribute substantially to the totalescapement (e.g ., Big Qualicum, Chilliwack, and Quinsam) . For example, at theQuinsam hatche ry in 1990 there was a total estimated escapement of 25,000 fish tothe river, of which the hatche ry took 8400 spawners . Based on CWT returns, it wasestimated that there were 16,926 hatche ry coho that returned to the river andhatchery combined, leaving 8563 (33.6%) wild spawners . Similarly, at the BigQualicum hatchery it was estimated that wild escapements to the river in 1990, 1991and 1992 were 13 .0, 13 .0 and 26 .7% respectively. These number indicate that nearly80% of the spawning occurring in these river systems may be by fish released ashatche ry-reared coho . For the purposes of this paper, we define wild coho as theoffspring of parents that reared in the wild, and enhanced coho as the offspring ofparents which were hatche ry reared but which spawned in the wild . All cohospawning in the wild, regardless of parental origin, are considered to be naturalspawners.
Based on releases (and sex ratios) of adult coho back into the rivers to spawnnaturally, it is estimated that 19,600 females spawned naturally in 1995 (Sue Lehman,pers. comm .). Using an average fecundity of 2699 eggs per female (Sandercock,1991) and an egg-to-smolt survival of 2% (Sandercock, 1991), the number ofenhanced F, coho smolts would be approximately 1 .06 million . In a sense, theenhanced smolts derived from this calculation are "theoretical hatchery" smolts as i t
4

was assumed that hatchery fish paired with hatchery fish . This is also a minimalestimate, as there is no accurate estimate of the total number of spawning fish in allthese river systems ( i .e., including fish that did not return to the hatchery) . Our pointis that a large percentage of escapements are either releases from hatcheries orhatchery fish that did not return to the hatchery at all. The importance relates toobtaining a true estimate of wild spawners, assuming that there can be agreementson the definition of a wild coho. If we include these potential 1,058,000 enhancedsmolts into our calculations, the total number of non-wild coho smolts entering theStrait of Georgia in 1997 rises to approximately 11 .12 million, and the percentage ofLVC coho adjusts to 44.9% (4988292/11,118,000) . The number of coho smolts in thesurvey increases to 1837 (825 caught/44 .9%) + 177 (US contribution) which means atotal of 2014 fish or 83.8%, an increase of approximately 7% from the 76 .6% estimatebased only on hatchery releases .
In the June/July survey (data not shown), 523 ocean age 0 coho were capturedand 162 of these had a LVC. The mean fork length of these two groups was notsignificantly different (160 .30 ± 27 .05 mm vs. 158.25 ± 15.02 mm)(P > 0.05, x± SD).We adjusted the LVC captures by adding 7% for both mortality and awareness (as inTable 3), which produced an adjusted estimate of 184 LVC coho . As the LVC fishcomprise 49 .6% of the total hatchery smolts released into the Strait of Georgia, thisadjusted catch can be regarded as representing 371 (184/49 .6%) hatchery coho. Inaddition, there were 4 US tags caught and a further 6 fish with adipose clips but noCWT's. These 10 fish are adjusted (as in Table 3) to represent 44 US hatchery fish,and the total hatchery contribution in the June/July survey is estimated (as in Table 3)as 415/523 or 79 .3% which is similar to the 76 .6% estimated in the Septembersurvey .
Otolith Results
Of the 100 pairs of otoliths examined from the September survey, 21 pairs werefound to be both c rystalline (Table 4) and thus hatche ry or wild origin could not bedetermined directly . A further 17 pairs were found to have one c rystalline otolith . Ofthe 62 pairs of non-c rystalline otoliths, 39 were determined to be hatchery in originand 23 to be from naturally spawned fish . Of the 17 pairs with a single c rystallineotolith, 15 (or 88%) were determined to be of hatche ry origin and 2 (12%) to benatural . Using the same propo rt ions for the 21 double crystalline otoliths, 88% or18.53 fish were assigned as hatche ry in origin and 2 .47 or 12% as non-hatche ry orwild (Table 4) . Thus, 72 .5% of the 100 pairs of otoliths sampled were determined tobe from fish of hatche ry origin and 27 .5% to be from fish derived from naturalspawners.
Movement of Puget Sound Coho into the Strait of Georgi a
The relatively large numbers of adipose clipped coho released into Puget Soundwith and without a CWT provided an oppo rtunity to study the movement of US cohointo the Strait of Georgia. In the June/July su rvey, we estimated 10 of the 523 coho
5

which were captured had a US mark and, in September, 40 of the 2402 capturedcoho had a US mark . The percentage in both cases is vi rtually identical (1 .9% vs .1 .7%, respectively) .
DISCUSSION
The survey of coho abundance in the Strait of Georgia and in Puget Sound usinga large rope trawl produced samples of coho from most areas throughout theirdistribution . The analysis of the samples indicated that hatchery fish in the Strait ofGeorgia in June/July and in September comprised approximately 76-79% of thepopulation . We believe this estimate to be conservative because the combinedclipping mortality and missed recognition (awareness) may exceed 14%. Whilemo rtalities due to adipose clip of juvenile coho have routinely been estimated as 2 .4%(PSC 1997), the limited number of studies examining post-clip mo rtality of ventral finsranges from 6-25%, with values as high as 50% (PSC, 1995, 1997) . Values rangingfrom 0-90% have also been repo rted (PSMFC 1992) . We arbitrarily chose 7% post-clip mo rtality rates in our calculations as it was close to the minimal estimate repo rtedand was also a conservative value. In addition to the mo rtality estimates, remainingpo rt ions of the pelvic fins have a large regenerative capacity, unlike adipose fin clips .Coombs et aI . (1990) found 50% of left/right pelvic fins clipped from Atlantic salmonsmolts had regenerated almost completely within 3 months, a similar time frame tofish caught in the September survey . The proper identification of fish withregenerated fin clips in our survey would be extremely difficult, and our awarenessfactor, and thus catches, of LVC fish may be underestimated . We again chose aconservative 7% value for this potential error. If the true error percentages combineto approach 25% rather than the 14% used in this analysis, the estimated hatche rypercentage would be approximately 83% . Regardless, the percentage of hatcheryfish within the Strait of Georgia population appears to be considerably higher thanprevious repo rts (e.g ., Cross et al . 1991) .
The possible inclusion of enhanced fish may appear to be an incorrect inclusionof wild fish in the hatchery fish category . However, it is important to recognize that alarge number of hatchery fish do spawn naturally, instead of being spawned artificiallyin hatcheries . If the offspring are a direct result of two hatchery parents, in theorythey are still hatchery fish . While these fish subsequently do undergo naturalselection pressures, it is only when these enhanced progeny return and spawnnaturally would we consider the subsequent Fz offspring to be wild . The recognition ofthese enhanced fish spawning naturally is a critical consideration in any wild cohomanagement policy . We believe it is important to recognize that some of the largerescapements have high percentages of spawning coho that were released fromhatcheries in the previous year . It appears that the situation is repeated each year .Our assumption of including the offspring of naturally spawning enhanced fish withhatchery-reared fish allowed us to estimate the total number of "hatchery fish"produced and would be a maximum estimate. This assumption highly oversimplifiesthe problem of separating offspring of hatchery and naturally spawning coho . Theappropriate issue really is to be able to identify and protect the truly wild coho . We
6

suggest that the hatche ry coho percentage of 75-80% is sufficiently high to indicatethat there is some urgency in addressing the need to develop a wild cohomanagement policy .
Fish growth did not appear to be adversely affected by the removal of the leftpelvic fin, as indicated by the absence of any size differences between LVC and non-clipped coho in either the June/July or the September survey. The apparent absenceof an impact on feeding and/or growth, at least during the early marine phase, is inagreement with previous reports (Coombs et al ., 1990) . The question of clippingmortality, growth and survival effects was addressed at several of the hatcheriesinvolved in the LVC program (e .g ., Big Qualicum and Inch Creek) by special markingstudies (Sue Lehmann, pers comm .). Catch and escapement data in 1998 willprovide new information on these questions .
The otolith method provided an estimate of 72 .5% hatche ry fish in the Strait ofGeorgia in 1997, a value similar to but slightly lower than the estimates determinedfrom the LVC program . While Zhang et al . (1995) observed that the accuracy ofdeterminations for coded-wire tagged (CWT) hatche ry coho was approximately 91 %,a pitfall with the otolith method of identifying coho rearing type is that it is difficult tovalidate the method for wild coho . The LVC program provided an oppo rtunity toindependently assess the accuracy of the conclusions based on otoliths . Largenumbers of double c rystalline otoliths complicate the proper identification of originusing the microstructure method . We assign the rearing type of coho with twocrystalline otoliths in propo rt ion to the hatche ry-wild percentages we observe for cohowith only one c rystalline otolith . We know from our unpublished studies thatcrystalline otoliths are relatively common in coho reared in hatcheries and relativelyrare in wild coho, thus we think that our approach is valid . Fu rthermore, thepropo rt ion of c rystalline otoliths in enhanced coho has yet to be examined . Thesample sizes used the otolith microstructure method are also smaller, which mayintroduce fu rther variability . Regardless, the estimate of 72.5% hatchery fish was ve rysimilar to the 76 .6% estimate obtained via the LVC method . If large numbers of cohoare marked in the future, it may not be appropriate to continue to use otolith basedestimates even though they can provide a direct method of measuring rearing types .The difference in the development of otolith microstructure between hatche ry and wildcoho is impo rtant and the causes and consequences of c rystalline otolithdevelopment in hatche ry-reared coho should be asce rtained .
The June/July survey, similar to September, provided a minimal estimate of 79%for hatchery reared fish in the ocean age 0 coho population within the Strait ofGeorgia . The similarity of these percentages over these 3-4 months indicated thatthere was no selective migration of marked fish out of the strait during this period .Furthermore, the catches of coho in the Strait of Juan de Fuca and off the west coastin the summer, fall and winter indicated that LVC coho were not detected untilOctober (Appendix 1), indicating that relatively large numbers of both hatchery andnaturally spawning coho remain in the Strait of Georgia until at least the end ofSeptember.
7

Lastly, the relatively large numbers of coho with adipose clips in Puget Soundprovided an opportunity to study the movement of coho from Puget Sound into theStrait of Georgia . In another report (Beamish et al . 1998), we show that almost all thecoho left Puget Sound between July and September (1997) . Despite this movementout of the sound, there was no increase in percentages of US coho caught within theStrait of Georgia in the September survey, suggesting that most of the coho migratingfrom Puget Sound proceed to either Juan de Fuca or further out to the west coast .
In summa ry, in summer and early fall of 1997 we took advantage of a newmarking program instituted by DFO to estimate the propo rt ion of hatche ry and wildcoho within the Strait of Georgia . The high percentage of hatche ry fish, and thepossibility that these percentages may be as high as 75%, indicate that wild coho maybe in low abundance . If total abundance of hatche ry and wild fish is also low, then theactual numbers of wild coho may be ve ry low relative to the abundance's in the 1960sand 1970s .
Acknowledgments
This project could not succeed without the support and cooperation of theWashington Department of Fish and Wildlife (Mr . Bill Tweit, Mr. John Long) . We alsoappreciate the assistance of Sue Lehmann and Don Bailey (Habitat and EnhancementBranch, DFO), Ron Kadowaki, and Mr . Ray Scarsbrook . Funding for this project comesfrom the high priority fund of the Assistant Deputy Minister of the Canadian Departmentof Fisheries and Oceans .
REFERENCES
Beamish, R.J ., D. McCaughran, M. Folkes and R .M . Sweeting . (1998) The use oftrawl surveys to produce prefishery abundance indices of juvenile coho salmon .Pacific Stock Assessment Review Committee (PSARC) S98-14, 28 pp .
Coombs, K .A., J .K . Bailey, C .M . Herbinger and G .W. Friars . (1990) . Evaluation ofvarious external marking techniques for Atlantic salmon. Am. Fish . Soc. Symp .7 :142-146 .
Cross, C . L ., L . Lapi and E .A. Perry . 1991 . Production of chinook and coho salmonfrom British Columbia hatcheries, 1971 through 1989. Can . J . Fish. Aquat. Sci,Tech . Rep. 1816, 48 pp .
Kuhn, B .R (1988) . The MRP-Reporter Program : a data extraction and reporting toolfor the mark recovery program database . Can . J . Fish . Aquat. Sci . Tech . Rep .1625, 145pp .
8

Pacific States Marine Fisheries Commission (PSMFC) . 1992. Mass markinganadromous salmonids : techniques, options and compatibility with the coded-wire tag system . Pacific States Marine Fisheries Commission, Portland, Oregon .34 pp .
Pacific Salmon Commission (PSC) . 1995. Report of the Ad-Hoc Selective FisheryEvaluation Committee to the Pacific Salmon Commission . Pacific SalmonCommission, Vancouver, British Columbia . 193 pp .
Pacific Salmon Commission (PSC) . 1997 . An update on the implications of the use ofthe ventral fin clip as a mass mark for -coho salmon . Pacific SalmonCommission, Vancouver, British Columbia . 8 pp .
Zhang, Z . and R.J. Beamish. (1994) . Use of otolith microstructure to identify hatchery-reared and wild Pacific salmon . NPAFC 90, 26 pp .
9

Figure 1 . Standardized catch (number caught/hour) of ocean age 0 coho salmon forSeptember 1997 survey .
10

Table 1 . Left Ventral Clipped coho released from British Columbiahatcheries into the Strait of Georgia in 1997 .
HatcheryBig QualicumCapilanoChehalisChilliwackInch CreekPuntledge
TOTALS :
Number Number PercentReleased with LVC * Marked964532 964478** 99 .99463342 432891 93.43837455 834990 99 .711673623 1671430 99 .87436669 434296 99.46650886 650307 99 .9 15026507 4988292^ 99 .24
* Includes fish with coded wire tags (ie., Left Ventral and Adiposefins removed) .
** Includes 18984 partial clips from Big Qualicum .^ Excludes 30143 fish from Capilano which were unclipped and
7972 AD only (no CWT) fish
Table 2 . Estimates of the contribution of fed fry (released in 1996) to theoverall smolt population entering the Strait of Georgia in 1997 .
Fry to Smolt
Survival Rate
10%
20%
Contribution to Total Percent
1997 smolts number LVC
of smolts
460,000 -10,060,000 49 .6
920,000 -10,520,000 47 . 4
Note: Based on fry releases of 4 .6 Million in 1996 and releasesof 9.6 Million smolts in 1997.
11

Table 3 . Estimates of percentage of ocean age 0 hatchery coho in the Straitof Georgia for September 1997 .
A. Total number of Age 0 coho caught 240 2
Total number of LVC fish in above 723+ Correction for clipping mortality (7%) 51+ Correction for awareness of mark (7%) 51
Corrected Total for Survey 82 5
B . Percentage of BC hatchery smolts with LVCmarks (Table 1 )
Estimated total BC hatchery fish in survey(825 fish/49 .5 %)
49 . 6
1663
C . Number of Adipose clips in survey wit heither no CWT or US tag (assume all US) 40
Expanded US hatche ry componen t40 fish%17% clip rate = 235 fis h235 fish x 70% hatche ry 165Plus 7% error rate 12
Estimated US hatche ry coho in survey 17 7
Number of hatchery fish in catch 1840Percentage of hatchery fish in catch 76 . 6
12

Table 4 . The number and proportions of wild and hatchery coho determinedfrom otolith microstructure analysis . Fish with both otoliths in thecrystalline form cannot be determined and are therefore assignedan origin, based on proportions observed in fish with singlecrystalline otolith .
Otolith type Hatche ry Origin Wild Origin Unknown
Both normal 39 23 -
One c rystalline 15 2 -
Both crystalline 2 1
Assigned origin* 18.53 2.47 -
TOTAL 72 .53 27 .47 -
Percentage 72.53 27 .47 -
* Fish with double crystalline otoliths assigned origins based onproportion of those with single crystalline otolith . Note that thecrystalline otoliths are commonly found in wild fish .
13

Appendix 1 . Breakdown of coho catches in 1997 and 1998 by survey and by region .The catch for each region is further broken down into proportions of coho with leftventral fin clips (LVC), those with adipose clips (AD clip) and those coho with an ADclip and with an implanted CWT (included in AD total) .
1 . June 17 to July 1 0
Catch AreaNo . Coho
CaughtPercentagewith LVC
Percentag ewith AD clip
Percentagewith CWT
Strait of Georgia 523 31 .0 8.0 8 . 0Juan de Fuca 226 0 .0 27 .9 9 . 7Puget Sound 1696 0 .0 16 .5 4 . 3West Coast 81 0 .0 25 .9 25 . 9
2 . September 08-2 7
Catch AreaNo. Coh o
CaughtPercentagewith LVC
Percentag ewith AD clip
Percentag ewith CWT
Strait of Georgia 2402 30 .1 2.6 2 . 3Juan de Fuca - - - -Puget Sound 69 1 .4 14 .5 5 . 8West Coast - - - -
3 . October 17-3 0
Catch AreaNo. Coho
CaughtPercentagewith LVC
Percentagewith AD clip
Percentag ewith CWT
Strait of Georgia 625 26.6 5 .6 4 . 8Juan de Fuca - - - -Puget Sound - - - -West Coast 685 2 .2 11 .1 3 . 6
4 . February 10-23, March 04-0 7
Catch AreaNo. Coho
CaughtPercentagewith LVC
Percentagewith AD clip
Percentagewith CWT
Strait of Georgia 1 - - -Juan de Fuca 478 6 .1 9 .0 4 . 2Puget Sound - - - -West Coast 960 6.5 12 .3 3 . 9
14