Embed Size (px)
Citation preview

December 30, 2012
· 52 ·
China Petroleum Processing and Petrochemical Technology 2012,Vol. 14, No. 4, pp 52-63Simulation and Optimization
Corresponding Author: Dr. Wang Guoqing, Telephone: +86-10-
59202725; 59202775; E-mail: [email protected].
1 Introduction
Steam cracking furnace is one of the most important equipment in the petrochemical industry, because it produces many vital chemical products, including ethylene, propylene, and butadiene. Hydrocarbons in the suspended coils of radiant section are heated up to the cracking reaction temperature with long flame burners[1] in the furnace floor and/or wall radiation burners in furnace sides. Cracking reactions of hydrocarbons takes place in the steam cracker, from which different kinds of olefinic products are produced.The steam cracking furnace has been the focus of numerous studies because of its great significance in the petrochemical industry. However, many important parameters deemed beneficial to the operation and the design of steam cracking furnaces are not available because of limitations in measurement methods. With the development of computer technology and theoretical mathematics, however, researchers can now conveniently use numerical simulation to model the operation of steam cracking furnace. Simulations of steam cracking
furnaces include the external or internal zones of tubes and two coupled parts containing the flow, chemical reaction, radiation of flue gas, and cracking reactions of hydrocarbon materials.Researchers have made use of the computational fluid dy-namics (CFD) method to simulate the flow, combustion, radiation, and heat transfer of steam cracking furnaces. Oprins and Heynderickx[2] simulated a non-symmetric flow in steam cracking furnaces to confirm improve-ments in the thermal efficiency of furnaces through the compensation for radiation heat. They[3] later showed that a fully non-structured tetrahedral grid in the orientation of cell interfaces has a random distribution, which also causes the alignment of cell interfaces with coordinate directions to be random. However, the accurate flow and pressure field results for the simulation of an industrial thermal cracking furnace are obtained by tetrahedral grid generation procedure. Niaei, et al.[4] used the zone method to perform coupled simulations of a reactor and a radiant
Estimating the Operation Status of Steam Cracking Furnace Using Numerical Simulation with Combustion Models
Zhou Xianfeng1, 2; Yang Yuanyi1; Wang Guoqing2; Zhang Lijun2; Liu Yi2
(1. College of Chemical Engineering, Beijing University of Chemical Technology, Beijing 100029; 2. Beijing Research Institute of Chemical Industry, SINOPEC, Beijing 100013)
Abstract: An accurate and complete geometric model was constructed to simulate the combustion, flow and temperature environment in the radiant section of the steam cracking furnace. Simulation of flow and radiation status has utilized the standard k-ε model and P1 model. The finite-rate/eddy-dissipation (finite-rate/ED) combustion model and non-premixed combustion model were both used to simulate accurately the combustion and the operation status of the steam cracking furnace. Three different surfaces of the steam cracking furnace were obtained from the simulation, namely: the flue gas tem-perature field of the entrance surface in long flame burners, the central surface location of tubes, and the crossover section surface. Detailed information on the flue gas temperature and the mass concentration fraction of these different surfaces in the steam cracking furnace can also be obtained by the simulation. This paper analyzed and compared the simulation results with the two combustion models, estimated the operation status of the steam cracking furnace, and reported that the finite-rate/ED model is appropriate to simulate the steam cracking furnace by comparing key simulation data with actual test data. This work has also provided a theoretical basis for simulating and operating the steam cracking furnace.
Key words: steam cracking furnace; operation status; combustion model; numerical simulation; flue gas

· 53 ·
box. Stefanidis, et al.[5-7] achieved the simulation of flow, temperature, and concentration fields in the radiant sec-tion using the combustion and radiation models. Habibi, et al.[6] performed a three-dimensional simulation of flow in an industrial-scale steam cracking furnace with three types of radiation models, viz. the discrete ordinates model (DOM), the P1 model, and the Rosseland radiation model. Results of the DOM and P1 models are very simi-lar. Wang and Zhang[7], Lan, et al.[8], and Zhou and Jia[9]
summarized the numerical simulations of heat transfer and reactions in steam cracking furnaces and introduced simulation results such as the flow, temperature fields, heat flux distributions, and concentration distributions. Han, et al.[10], Zhang, et al.[11], and Hu, et al.[12] used the CFD method to perform coupled simulation studies on the flow, combustion, heat transfer, and thermal cracking reactions in the steam cracking furnaces. The simulation results on velocity, temperature, species’ concentration fields, and reactor tube heat flux distributions served as the theoretical bases for optimizing the geometrical struc-ture and the operational parameters in steam cracking furnaces.In summary, researchers have emphasized the simulation of flow, temperature, velocity, and species’ concentration fields in the radiant section by using multi-simulation methods. The simulation of steam cracking furnaces
focuses on the combustion of fuel gas, so the selected combustion model is important in the simulation. This paper aims to investigate the effect of combustion models on the numerical simulation of steam cracking furnace. The two combustion models used are the finite-rate/eddy-dissipation (finite-rate/ED) combustion model and the non-premixed combustion model. The chemical reaction, flow, and radiation models are supplemented by the combustion model used hereby.
2 Modeling Approach
2.1 Turbulent flow modelA simple flow model, the standard k-ε model[13], was used in this paper. The standard k-ε model is categorized under turbulence model and has become the workhorse of practical flow calculations since it was proposed by Launder and Spalding[14]. In turbulent flow and heat transfer simulations, the standard k-ε model has many advantages, such as robustness, economy, and reasonable accuracy. It is a semi-empirical model based on transport equations relating to turbulence kinetic energy (k) and its dissipation rate (ε). The transport equations for the mass, momentum, turbulent kinetic energy, and dissipation rate of turbulent kinetic energy are described in Table 1.
Table 1 Governing equations of flow mode
Title Equation
Mass equationδδ x
pui
i( ) = 0 (1)
Momentum quationδδ
δδ
δδ
δδ
δδ
δδδx
pu upx x
u ux
ux
uuj
i jeff
i jeff
i
j
j
iij
i
i
( ) = + + −
23
(2)
k-equationδδ
δδ
δδ
µµσ
δδ
ρεtpk
xpku
xkx
G Gi
ij
t
k jk b( ) ( )+ = +
+ + − −YY Sm k+ (3)
ε-equationδδ
ρεδδ
ρεδδ
µµσ
δεδ
ε
εεt x
ux x
CkG
ii
j
t
jk( ) ( ) (+ = +
+ +1 CC G C
kSb3 2
2
ε ε ερε) − + (4)
p p pkeff = +
23
(5)
µ µ µeff t= + (6)
µεµt pC k
=2
(7)
In Table 1 Gk is the generation of turbulence kinetic energy because of mean velocity gradients, Gb is the generation of turbulence kinetic energy because of
buoyancy, and Ym represents the contribution of fluctuating dilatation in compressible turbulence to the overall dissipation rate. The constants C1ε, C2ε, Cμ, σk, and σε have
Zhou Xianfeng, et al. Estimating the Operation Status of Steam Cracking Furnace Using Numerical Simulation with Combustion Models

China Petroleum Processing and Petrochemical Technology
· 54 ·
the following default values: C1ε=1.44, C2ε=1.92, Cμ=0.09, σk=1.0, σε=1.3, while Sk and Sε are the user-defined source terms.
2.2 Radiation modelThe P1 radiation model is based on the expansion of radiation intensity I into an orthogonal series of spherical harmonics[15-16]. The P1 radiation model has several advantages over other radiation models. The radiant transfer equation of P1 model is a diffusion equation, which is readily to be solved with less CPU power. The model also includes the effect of scattering, and it works reasonably well because of the large optical thickness of combustion applications. It can be easily applied to complicated geometries with curvilinear coordinates. Therefore, the use of P1 radiation model to simulate steam cracking furnaces is reasonable[8].
2.3 Combustion modelWhen the steam cracking furnace is operating, fuel gas and air are injected into the radiant section from differ-ent entrances of long flame burners. The spraying speed of fuel gas is high, and the entrance of air are encircled with those of fuel gas, so fuel gas and air are mixed and burned very fast. Therefore, the finite-rate/ED model and the non-premixed model could be applied practically for the simulation of steam cracking furnaces and for the combustion of fuel in long flame burners.
2.3.1 Finite-rate/eddy-dissipation modelThe finite-rate/ED model can simulate the mixing and the transport of chemical species by solving conserva-tion equations that describe the convection, diffusion, and reaction sources for each species. In the finite-rate/ED model, turbulence or the Arrhenius chemical kinetic cal-culations control the reaction rate. In the same hardware base, the computation rate with turbulence is much faster than that with the Arrhenius chemical kinetic calculations. Multiple, simultaneous chemical reactions that take place in bulk phase can particularly be simulated with the finite-rate/ED model. Therefore, this finite-rate/ED model is widely used in combustion simulations.This model also provides a turbulence–chemistry interac-tion model based on the work of Magnussen and Hjertag-er[17]. The net rate Ri,r on production of species i resulted
from reaction r is given by the smaller one of the two expressions below:
R v M Ak
Yv Mi r i r w i
R
R r w R, , ,
, ,
min= ′′
ρ
ε (8)
R v M ABk
PY
v Mi r i r w i
F
j r w jj
N, , ,, ,
= ′′
∑∑
ρε
(9)
In Equations (8) and (9), the chemical reaction rate is
governed by the large-eddy mixing time scale ke
, as re-
ferred to in the eddy-breakup model of Spalding[18]. Com-bustion is also present, albeit without needs for an igni-tion source, whenever turbulence is present.The main components of fuel gas in the present paper consist of methane and hydrogen. The reaction kinetics mechanisms of methane[19] and hydrogen[5] are shown in Equations (10), (11), and (12), with corresponding intrin-sic reaction rate Equations (13), (14), and (15), respec-tively:
CH4+1.5O2=CO+2H2O (10)CO+0.5O2=CO2 (11)H2=0.5O2=H2O (12)r C CRT10
13 -125604/CH-0.3
O1.3=1.5×10 e
4 4 (13)r C C CRT11
20 -167472/CO H O
0.5O0.25=3.98×10 e
2 2 (14)r C C12
13O0.5
H=102 2 (15)
2.3.2 Non-premixed modelNon-premixed model shows that the fuel and the oxidizer enter the reaction zone in distinctly separated streams. The simulation can take advantage of non-premixed model because the long flame burners of steam cracking furnace also have inlets of fuel and air. The approach of non-premixed model is specifically developed to simulate a turbulent diffusion flame characteristic of fast chemical reactions. The method used by the model is computation-ally efficient because it does not require the solution of a large number of species transport equations compared with that used by the finite-rate/ED model. The non-premixed model mainly involves the solution of transport equations for one or two conserved scalars known as mixture fractions. Equations for individual spe-cies are not solved. Species concentrations are instead derived from the predicted mixture fraction. Thermo-chemical calculations are preprocessed and tabulated. The interaction of turbulence and chemistry can be described
2012,14(4):52-63
· 55 ·
in an assumed-shape probability density function. The model mainly considers that under a certain set of simplified assumptions, the instantaneous state of thermo-chemical fluid is related to the mixture fraction f. The mixture fraction can be written in terms of atomic mass fraction[20]:
fz zz z
i i
i i
=−−,
, ,
ox
fuel ox (16)
In the above equation Zi represents the mass fraction of the element i. The subscript ox denotes the value at the oxidizer stream inlet, and the subscript fuel denotes the value at the fuel stream inlet. If the diffusion coefficients for all species are equal, Equation (16) is identical for all elements, and the definition of mixture fraction is unique. The mixture fraction is the elemental mass fraction that originates from the fuel stream. The mixture fraction is 1 and 0 for the fuel inlet and the air inlet, respectively.
3 Description of the Simulation
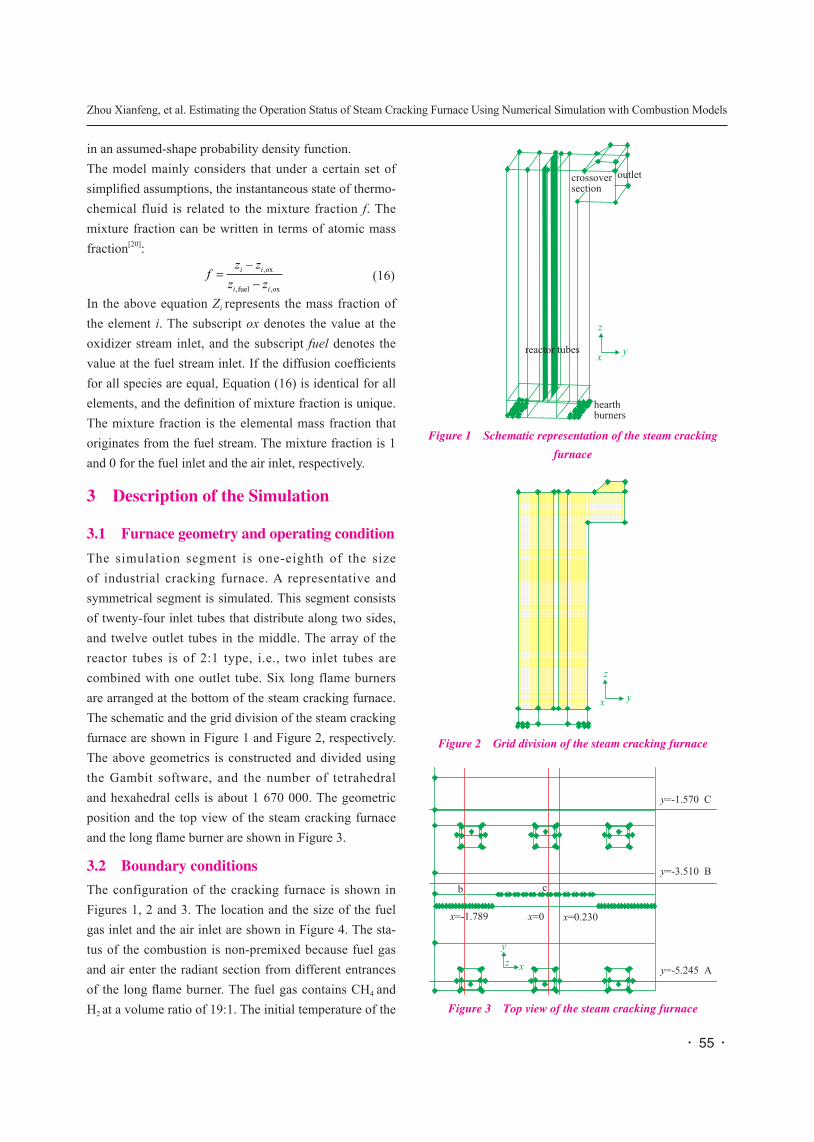
3.1 Furnace geometry and operating conditionThe simulation segment is one-eighth of the size of industrial cracking furnace. A representative and symmetrical segment is simulated. This segment consists of twenty-four inlet tubes that distribute along two sides, and twelve outlet tubes in the middle. The array of the reactor tubes is of 2:1 type, i.e., two inlet tubes are combined with one outlet tube. Six long flame burners are arranged at the bottom of the steam cracking furnace. The schematic and the grid division of the steam cracking furnace are shown in Figure 1 and Figure 2, respectively. The above geometrics is constructed and divided using the Gambit software, and the number of tetrahedral and hexahedral cells is about 1 670 000. The geometric position and the top view of the steam cracking furnace and the long flame burner are shown in Figure 3.
3.2 Boundary conditions The configuration of the cracking furnace is shown in Figures 1, 2 and 3. The location and the size of the fuel gas inlet and the air inlet are shown in Figure 4. The sta-tus of the combustion is non-premixed because fuel gas and air enter the radiant section from different entrances of the long flame burner. The fuel gas contains CH4 and H2 at a volume ratio of 19:1. The initial temperature of the
Figure 1 Schematic representation of the steam cracking furnace
Figure 2 Grid division of the steam cracking furnace
Figure 3 Top view of the steam cracking furnace
Zhou Xianfeng, et al. Estimating the Operation Status of Steam Cracking Furnace Using Numerical Simulation with Combustion Models

China Petroleum Processing and Petrochemical Technology
· 56 ·
fuel gas is 303.15 K, and the gauge pressure is 0.27 MPa; the initial temperature of air is 298.15 K, and its gauge pressure is 0. The dimension and boundary conditions of the simulated segment are presented in Table 2.
Table 2 Dimensions and boundary conditions of the steam cracking furnace
Items Value
Furnace segment
Length (x-direction), m 4.71(xmin=-2.425 m, xmax= 2.285 m)
Width (y-direction), m 3.55(ymin=-5.450 m, ymax= -1.900 m)
Height (z-direction), m 14.395 (zmin=0, zmax= 14.395 m)
Number of long flame burners 6
Number of inlet tubes 24
Length of an inlet tube, m 13.802
Number of outlet tubes 12
Length of an outlet tube, m 13.802
Fuel composition, m%
CH4 0.993
H2 0.007
Firing condition
Fuel gas flow rate, kg/s 0.303
Fuel gas pressure (gauge), Pa 270 000
Excess oxygen ratio, m% 10
Air flow rate, kg/s 5.751
Air pressure (gauge), Pa 0
The thermal condition of the tubes is not constant but must have enough heat flux to cope with the needs of external and internal zones of the reactor tubes. The amount of heat flux along the tubes is consistent with the heat demand of the cracking reaction in the reactor tubes. The circumferentially absorbed heat of the tubes with the same height is uniform because the tubes are arranged ac-
cording to coordinates. Therefore, the computed heat flux is used as a boundary condition of the reactor tubes. The ratio of the computed heat flux to the average heat flux is described in Table 3.
Table 3 Heat flux in the tube wallTube length
(from the inlet), m
Heat flux/average heat flux, %
Tube length (from the inlet),
m
Heat flux/average heat flux, %
0.48 128.98 15.05 92.27
2.40 116.37 16.74 97.83
4.32 113.08 18.43 100.52
6.20 112.83 20.14 99.88
8.05 110.93 21.95 95.58
9.85 105.13 23.36 91.18
11.63 94.02 25.26 82.59
13.34 84.24 26.68 74.64
3.3 Numerical schemeThe transport equations for the mass, momentum, energy, turbulent kinetic energy, and dissipation rates of turbulent kinetic energy are solved by implicit formulation of base pressure and by semi-implicit method for pressure-linked equations. The operating status of steam cracking furnace is timed to a steady state with specified absolute velocity and the standard atmospheric pressure. The steps in the simulation computation are as follows. Firstly, the fluid flow of mixed gas is computed. Secondly, the flue gas temperature field is calculated by means of the two combustion models. Thirdly, the heat flux func-tion of the tubes is appended to continue the simulation until the steady results are reached. The selection of smaller under-relaxation factors is crucial in the computa-tion to avoid divergence in the solution outcome. When the status of every step has been stabilized, large under-relaxation factors are used to accelerate the convergence.
4 Results and Discussion
The required heat for cracking reactions in the reactor tubes is supplied via the combustion of fuel gas in the long flame burners. The combustion state of the fuel gas would certainly affect the yield of target products. In this paper, the operation status of steam cracking furnace can be simulated with the two combustion models. The simu-lation results are mainly given in terms of the flue gas
Figure 4 Top view of the single hearth burner
2012,14(4):52-63

· 57 ·
temperature and the mass concentration of species.The simulation results include the flue gas temperature field, the mass concentration of gas on the surface of en-trance to the long flame burners, the flue gas temperature field at the location near the tubes and the crossover sec-tion. With the geometric location of the long flame burn-ers and the reactor tubes in the steam cracking furnace finalized, the representational surfaces and lines were selected: y=-5.245 m of surface (A surface, surface of the fuel inlet) of the long flame burners’ spout, y=-3.510 m of surface (B surface, location near the tube) of the middle of the inlet and outlet tubes in the y direction, and y=-1.570 m of surface (C surface, outlet surface) of the crossover section outlet. At the same time, in the A surface with x=0.23 m, line a was selected, i.e., y=-5.245 m, x=0.23 m; in the B surface with x=-1.789 m, line b was selected, i.e., y=-3.510 m, x=-1.789 m; and in the B surface with x=0, line c was selected, i.e., y=-3.510 m, x=0. These surfaces and lines are shown in Figure 3.
4.1 Profile of long flame burners
Research results on combustion states with respect to long flame burners are the basis of the numerical simulation of steam cracking furnaces. The A surface represents the cen-tral inlet of the fuel gas, and the simulation result of the A surface could well reflect the combustion state of the fuel gas. Line a in the A surface would respond to the change in operation status with the steam cracking furnace height.Figure 5 shows the flue gas temperature field of the A sur-face simulated by two combustion models. The left and right segments denote the computational results obtained with the finite-rate/ED model and the non-premixed mod-el, respectively. The flue gas temperature in the finite-rate/ED model ranges from 298.15 K to 1 745.14 K, whereas that in the non-premixed model ranges from 298.15 K to 2 024.52 K. However, the flue gas temperature in the non-premixed model increases at the bottom of the steam cracking furnace. The changes in the parameters of line a were analyzed to obtain further information on the status of flue gas combustion.Figure 6 shows the flame shape and the size of the A sur-face simulated by the two combustion models. When the CO mass concentration is equal to or greater than 0.0015, the size and the shape of the area can denote the combus-
Figure 5 Flue gas temperature fields of the A surface simulated by two combustion models
Figure 6 Flame shape and size of the A surface simulated by two combustion models
tion flame situation. Observation of the combustion status of the steam cracking furnace shows that the shape of the combustion flame is flat, and the flame area does not cover all the space. The two flame shapes in the numeri-cal simulation shown in Figure 6 are therefore completely dissimilar. The computational results with non-premixed model show no special flame shape, but the flame area is very large. Therefore, the flame pattern in the numerical simulation obtained with the finite-rate/ED model con-forms to the actual situation of long flame burners.Figure 7 shows the z velocity contours of the A surface expressed by the two combustion models. High-speed fields appear in the fuel gas inlet. The z velocity of the up-per area expressed by the finite-rate/ED model decreases gradually, whereas that of the upper area expressed by
Zhou Xianfeng, et al. Estimating the Operation Status of Steam Cracking Furnace Using Numerical Simulation with Combustion Models
China Petroleum Processing and Petrochemical Technology
· 58 ·
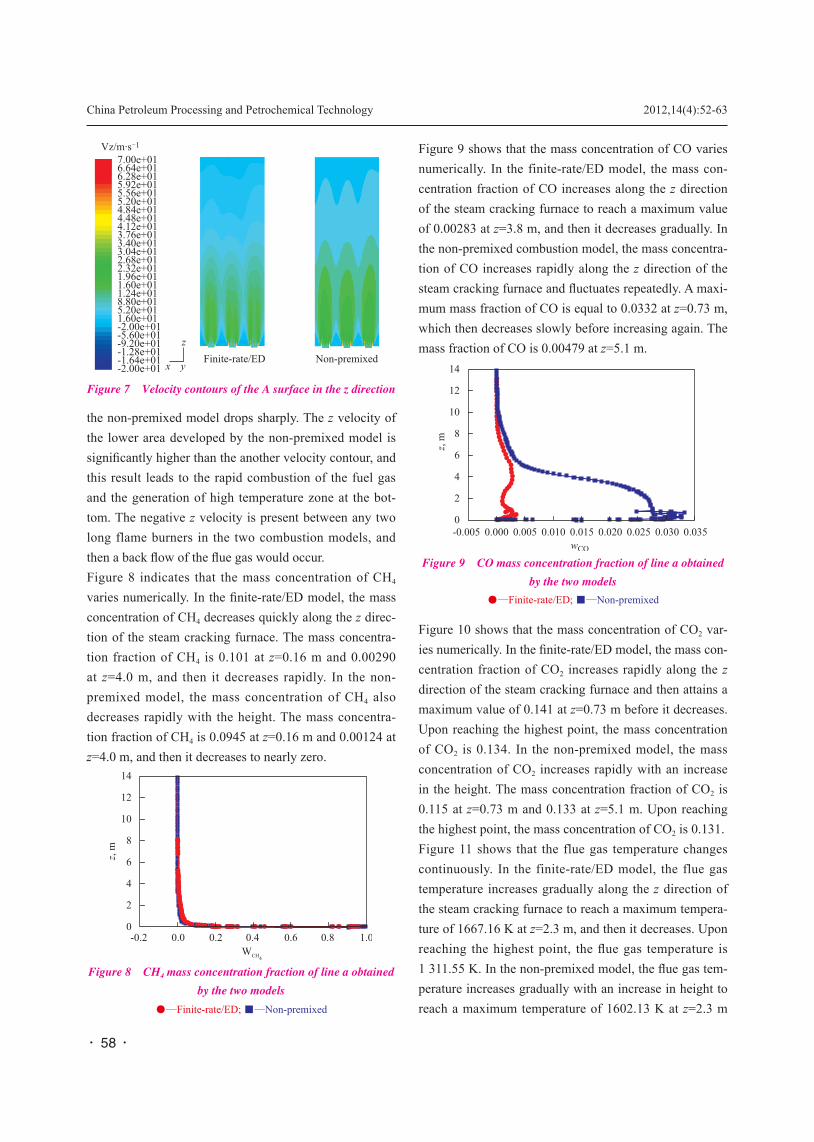
the non-premixed model drops sharply. The z velocity of the lower area developed by the non-premixed model is significantly higher than the another velocity contour, and this result leads to the rapid combustion of the fuel gas and the generation of high temperature zone at the bot-tom. The negative z velocity is present between any two long flame burners in the two combustion models, and then a back flow of the flue gas would occur.Figure 8 indicates that the mass concentration of CH4 varies numerically. In the finite-rate/ED model, the mass concentration of CH4 decreases quickly along the z direc-tion of the steam cracking furnace. The mass concentra-tion fraction of CH4 is 0.101 at z=0.16 m and 0.00290 at z=4.0 m, and then it decreases rapidly. In the non-premixed model, the mass concentration of CH4 also decreases rapidly with the height. The mass concentra-tion fraction of CH4 is 0.0945 at z=0.16 m and 0.00124 at z=4.0 m, and then it decreases to nearly zero.
Figure 8 CH4 mass concentration fraction of line a obtained by the two models
●—Finite-rate/ED; ■—Non-premixed
Figure 9 shows that the mass concentration of CO varies numerically. In the finite-rate/ED model, the mass con-centration fraction of CO increases along the z direction of the steam cracking furnace to reach a maximum value of 0.00283 at z=3.8 m, and then it decreases gradually. In the non-premixed combustion model, the mass concentra-tion of CO increases rapidly along the z direction of the steam cracking furnace and fluctuates repeatedly. A maxi-mum mass fraction of CO is equal to 0.0332 at z=0.73 m, which then decreases slowly before increasing again. The mass fraction of CO is 0.00479 at z=5.1 m.
Figure 9 CO mass concentration fraction of line a obtained by the two models
●—Finite-rate/ED; ■—Non-premixed
Figure 10 shows that the mass concentration of CO2 var-ies numerically. In the finite-rate/ED model, the mass con-centration fraction of CO2 increases rapidly along the z direction of the steam cracking furnace and then attains a maximum value of 0.141 at z=0.73 m before it decreases. Upon reaching the highest point, the mass concentration of CO2 is 0.134. In the non-premixed model, the mass concentration of CO2 increases rapidly with an increase in the height. The mass concentration fraction of CO2 is 0.115 at z=0.73 m and 0.133 at z=5.1 m. Upon reaching the highest point, the mass concentration of CO2 is 0.131.Figure 11 shows that the flue gas temperature changes continuously. In the finite-rate/ED model, the flue gas temperature increases gradually along the z direction of the steam cracking furnace to reach a maximum tempera-ture of 1667.16 K at z=2.3 m, and then it decreases. Upon reaching the highest point, the flue gas temperature is 1 311.55 K. In the non-premixed model, the flue gas tem-perature increases gradually with an increase in height to reach a maximum temperature of 1602.13 K at z=2.3 m
Figure 7 Velocity contours of the A surface in the z direction
2012,14(4):52-63

· 59 ·
and 1630.56 K at z=4.4 m, and then it decreases. Upon reaching the highest point, the flue gas temperature is 1329.68 K.Figure 11 shows that the maximum temperature of the flue gas calculated by the non-premixed model is higher than the case using the finite-rate/ED model, and this forms a higher-temperature zone at the bottom of the steam cracking furnace. This result is likely to accelerate a secondary cracking reaction in the reactor tubes. The mass fraction of CH4 decreases quickly along the z direc-tion of the steam cracking furnace as depicted by the two combustion models. This phenomenon demonstrates that the changes in reaction rates are very fast as indicated by the two models used in the numerical simulation. How-ever, combustion of the fuel gas predicted by the non-premixed model is incomplete, so the mass concentration of CO is very high at the bottom zone of the steam crack-ing furnace. In summary, the computational results show that the finite-rate/ED model is more appropriate than the
non-premixed model in estimating the operation status of the steam cracking furnace.
4.2 Flue gas temperature field of the B surfaceFigure 12 shows the flue gas temperature field of the B surface in the radiant section of the steam cracking fur-nace. The B surface lies in the middle of the inlet and out-let tubes along the y direction of the steam cracking fur-nace. The flue gas temperature field of the B surface could show the heat flux of nearby tubes to estimate the endo-thermic cracking reaction in the reactor tubes. In Figure 12 the flue gas temperature simulated by the finite-rate/ED model ranges from 1297.47 K to 1467.45 K, whereas that simulated by the non-premixed model ranges from 1315.76 K to 1484.69 K. The overall temperature of the B surface simulated using the non-premixed model is higher than the case using the finite-rate/ED model, especially in the lower part of the reactor tubes.To maintain the flue gas temperature distribution on the wall of inlet and outlet tubes calculated by the two com-bustion models, line b (at y=-3.510 m, and x=-1.789 m) and line c (at y=-3.510 m, and x=0) in the B surface were intercepted. Lines b and c could react to the flue gas tem-perature on the wall surface of the inlet and outlet tubes. Figure 13 and Figure 14 show the change in the flue gas temperature of lines b and c predicted by the two combus-tion models.
Figure 12 Flue gas temperature field of the B surface simulated by the two models
Figure 13 shows the flue gas temperature data of line b obtained by means of the two combustion models. The
Figure 10 CO2 mass concentration fraction of line a obtained by the two models
●—Finite-rate/ED; ■—Non-premixed
Figure 11 Flue gas temperature of line a obtained by the two models
●—Finite-rate/ED; ■—Non-premixed
Zhou Xianfeng, et al. Estimating the Operation Status of Steam Cracking Furnace Using Numerical Simulation with Combustion Models
China Petroleum Processing and Petrochemical Technology
· 60 ·
red and blue curves denote the computational results of the finite-rate/ED model and the non-premixed model, respectively. The trend on changes in the flue gas tem-perature achieved by using the two combustion models is similar. For the case of the finite-rate/ED model, the flue gas temperature increases gradually along the z direction of steam cracking furnace, with a maximum temperature equating to 1461.44 K at z=3.9 m, and then it decreases to 1326.52 K at z=12.0 m. Upon reaching the highest point, the flue gas temperature is 1299.05 K. For the case of the non-premixed model, the flue gas temperature increases gradually along the z direction of steam cracking furnace, with a maximum temperature equating to 1 482.53 K at z=4.7 m, and then it decreases to 1344.13 K at z=12.0 m. Upon reaching the highest point, the flue gas temperature is 1318.03 K.
Figure 13 Temperature profile of line b●—Finite-rate/ED; ■—Non-premixed
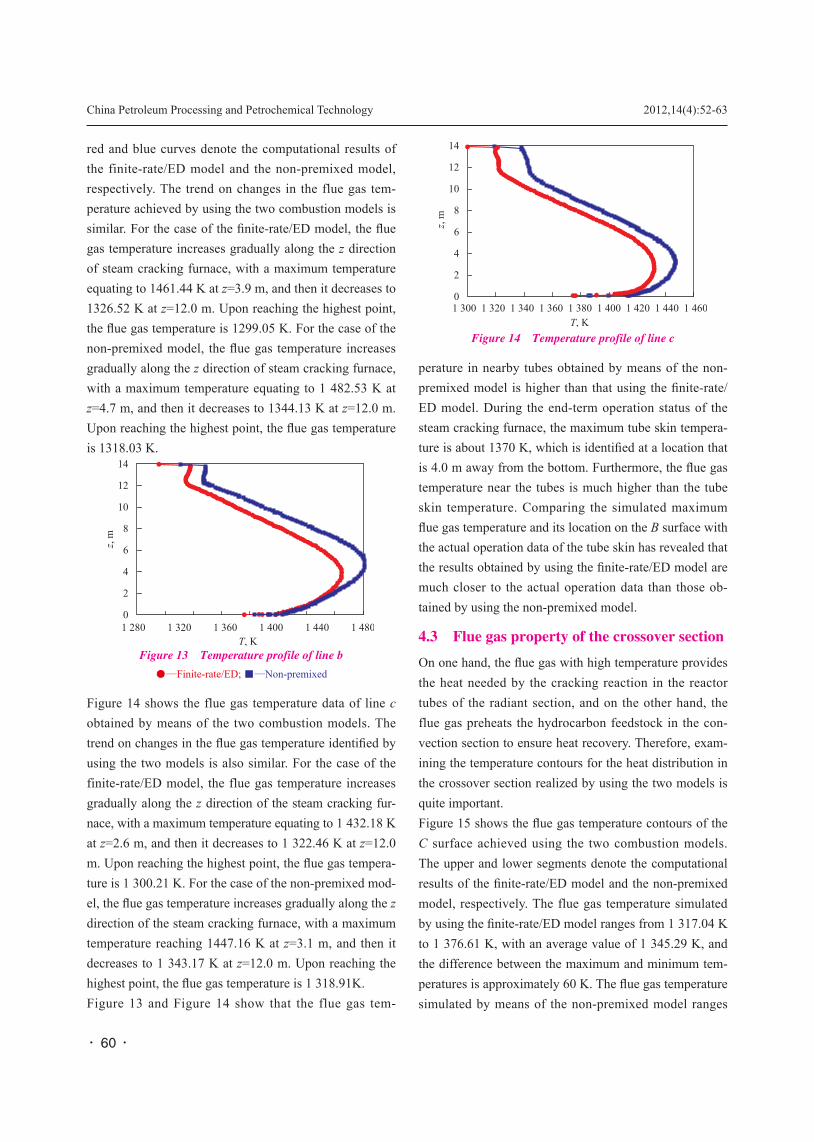
Figure 14 shows the flue gas temperature data of line c obtained by means of the two combustion models. The trend on changes in the flue gas temperature identified by using the two models is also similar. For the case of the finite-rate/ED model, the flue gas temperature increases gradually along the z direction of the steam cracking fur-nace, with a maximum temperature equating to 1 432.18 K at z=2.6 m, and then it decreases to 1 322.46 K at z=12.0 m. Upon reaching the highest point, the flue gas tempera-ture is 1 300.21 K. For the case of the non-premixed mod-el, the flue gas temperature increases gradually along the z direction of the steam cracking furnace, with a maximum temperature reaching 1447.16 K at z=3.1 m, and then it decreases to 1 343.17 K at z=12.0 m. Upon reaching the highest point, the flue gas temperature is 1 318.91K. Figure 13 and Figure 14 show that the flue gas tem-
perature in nearby tubes obtained by means of the non-premixed model is higher than that using the finite-rate/ED model. During the end-term operation status of the steam cracking furnace, the maximum tube skin tempera-ture is about 1370 K, which is identified at a location that is 4.0 m away from the bottom. Furthermore, the flue gas temperature near the tubes is much higher than the tube skin temperature. Comparing the simulated maximum flue gas temperature and its location on the B surface with the actual operation data of the tube skin has revealed that the results obtained by using the finite-rate/ED model are much closer to the actual operation data than those ob-tained by using the non-premixed model.
4.3 Flue gas property of the crossover sectionOn one hand, the flue gas with high temperature provides the heat needed by the cracking reaction in the reactor tubes of the radiant section, and on the other hand, the flue gas preheats the hydrocarbon feedstock in the con-vection section to ensure heat recovery. Therefore, exam-ining the temperature contours for the heat distribution in the crossover section realized by using the two models is quite important.Figure 15 shows the flue gas temperature contours of the C surface achieved using the two combustion models. The upper and lower segments denote the computational results of the finite-rate/ED model and the non-premixed model, respectively. The flue gas temperature simulated by using the finite-rate/ED model ranges from 1 317.04 K to 1 376.61 K, with an average value of 1 345.29 K, and the difference between the maximum and minimum tem-peratures is approximately 60 K. The flue gas temperature simulated by means of the non-premixed model ranges
Figure 14 Temperature profile of line c
2012,14(4):52-63

· 61 ·
from 1 335.09 K to 1 389.28 K with an average value of 1 364.09 K, and the difference between the maximum and minimum temperatures is about 55 K. Therefore, the results of the numerical simulation achieved by using the finite-rate/ED model suggest less energy flowing into the convection section than those of the simulation achieved by means of the non-premixed model under the same mass flowrate of the flue gas. According to the testing data, the temperature of the flue gas is about 1 370.00 K, and the location of the test thermocouple is about 1.5 m away from the furnace wall. A distance of 1.5 m could be approximate-ly the location with a maximum temperature, so the simu-lation result obtained by the finite-rate/ED model is more accurate than that obtained by the non-premixed model.
Table 4 Flue gas property of C surface with the two models and test results
C surfaceTotal flow of flue gas, kg/s
Volume fraction, %
CH4 O2 CO CO2
Simulated by the finite-rate/ED
model4.638 3.941e-8 0.02019 2.786e-6 10.54
Simulated by the non-premixed
model4.741 1.141e-5 0.01739 2.447e-5 10.09
Actual test data 4.650 0 0.02000 3.000e-6 10.70
Table 4 shows the volume concentration of CH4, O2, CO, and CO2 identified by three cases, respectively. The simu-lation results obtained by the finite-rate/ED model are very close to the actual test data. The volume concentra-tions of CH4, and CO calculated by means of the non-pre-
mixed model are obviously higher than the corresponding data calculated by using the finite-rate/ED model, where-as the volume concentrations of CO2, and O2 calculated by the non-premixed model are lower than those calculated by using the finite-rate/ED model. Comparison of the com-putational data shows that the combustion state is more complete, and the simulation data are closer to the actual test data when the finite-rate/ED model is adopted rather than the case in which the non-premixed model is used.
5 Conclusions
This paper uses numerical methods to simulate the flow, combustion, and the heat transfer in the radiant section of a steam cracking furnace. This work estimates the operation status of the steam cracking furnace by examin-ing the effect of two combustion models using numerical simulation methods. The results show that the finite-rate/ED combustion model is more appropriate than the non-premixed combustion model for simulating the steam cracking furnace and estimating its operation status.The temperature of the bottom zone in the profile of floor for long flame burners is lower when the finite-rate/ED model is used than the case where the non-premixed mod-el is adopted. The mass concentration of CO is very high at the bottom zone of the steam cracking furnace, so the extent of fuel gas combustion simulated by using the non-premixed model is incomplete at the bottom. Upon exam-ining the combustion status of the steam cracking furnace, checking the profile of the middle surface of tubes, and comparing the operating temperature and test data, it is obvious that the finite-rate/ED model can determine the reasonable temperature distribution coupled with the loca-tion of the flue gas. Moreover, the temperature field data of the crossover section identified by using the finite-rate/ED model is more uniform without any overheated points than those determined by using the non-premixed model. Determining the operation status of the steam cracking furnace is quite important in order to obtain the simula-tion results especially in the circumstances when little experimental data are available. In a word, computational results obtained by using the finite-rate/ED model are closer to the actual test data than the case where the non-premixed model is used to simulate the operating status of a steam cracking furnace. Therefore, use of the finite-rate/
Figure 15 Flue gas temperature contours of C surface achieved using the two models
Zhou Xianfeng, et al. Estimating the Operation Status of Steam Cracking Furnace Using Numerical Simulation with Combustion Models

China Petroleum Processing and Petrochemical Technology
· 62 ·
ED model can provide a theoretical basis for simulating the operation of steam cracking furnaces.
NOMENCLATUREA—Empirical constant equal to 4.0B—Empirical constant equal to 0.5C1ε, C2ε, C3ε, Cμ—Standard k –ε model parameterGk—Production of turbulent kinetic energy by velocity gradient, J/(m3·s)Gb—Production of turbulent kinetic energy by buoyancy, J/(m3·s)k—Turbulent kinetic energy per unit mass, m2/s2
q—Heat flux, W/m2
Ri—Net rate of production of species i by chemical reac-tion (units vary)Sk, Sε—User-defined source termst—Time, sui, uj—Velocity component in the ith, jth direction, m/sxi, xj—Coordinate direction in the ith, jth direction, mYR—Mass fraction of a particular reactant RYP—Mass fraction of any product species PYm—Fluctuating dilatation in compressible turbulence to the overall dissipation rateε—Dissipation rate of turbulent kinetic energy, m2/s3
μ—Molecular viscosity, kg/(m·s)μt —Turbulent viscosity, kg/(m·s)ρ—Density, kg/m3
p—Pressure, Paσk—Standard k-ε model related Prandtl parameter, σk=1.0σε—Standard k-ε model related Prandtl parameter, σε=1.3α—Absorption coefficient, 1/mn—Refractive indexσs—Scattering coefficient, 1/mσ—Stefan-Boltzmann constant, 5.672·10-8 W/(m2·K4)T—Temperature, K.
Acknowledgements: This work was gratefully supported by the
technology development fund of China Petroleum & Chemical
Corporation (Sinopec 409045).
References[1] �Heynderickx G J, Oprins A J M, Marin G B, et al. Three-
dimensional flow patterns in cracking furnaces with long-
flame burners[J]. AIChE J, 2001, 47 (2): 388-400
[2] �Oprins A J M, Heynderickx G J. Three-dimensional
asymmetric flow and temperature fields in cracking
furnaces[J]. Ind Eng Chem Res, 2001, 40, 5087-5094
[3] �Oprins A J M, Heynderickx G J. Calculation of three-
dimensional flow and pressure fields in cracking furnaces[J].
Chem Eng Sci, 2003, 58: 4883-4893
[4] �Niaei A, Towfighi J, Sadrameli S M, et al. The combined
simulation of heat transfer and pyrolysis reactions in
industrial cracking furnaces[J]. Appl Therm Eng, 2004, 24:
2251-2265
[5] �Stefanidis G D, Merci B, Heynderickx G J, et al. CFD
simulations of steam cracking furnaces using detailed
combustion mechanisms[J]. Comput Chem Eng, 2006, 30
(4): 635-639
[6] �Habibi A, Merci B, Heynderickx G J. Impact of radiation
models in CFD simulations of steam cracking furnaces[J].
Comput Chem Eng, 2007, 31: 1389-1406
[7] �Wang G Q, Zhang L J. Numerical simulation of gas flow
and heat transfer in cracking heater[J]. Petrochem Technol,
2005, 34 (7): 652-655 (in Chinese)
[8] �Lan X Y, Gao J S, Xu C M, et al. Numerical simulation of
transfer and reaction process in ethylene furnaces[J]. Chem
Eng Res Design, 2007, 85 (A12): 1565-1579
[9] �Zhou H Z, Jia Z G. Three dimensional numerical simulation
of flow and combustion in firebox of steam cracking
furnace[J]. Petrochem Technol, 2007, 36 (6): 584-590 (in
Chinese)
[10] �Han Y L, Xiao R, Zhang M Y. Combustion and pyrolysis
reactions in a naphtha cracking furnace[J]. Chem Eng
Technol, 2006, 29 (1): 112-120
[11] �Zhang Z H, Huang G Q, Wu X. Numerical simulation of
combustion of USC ethylene cracking furnace[J]. Chem
Ind Eng Prog, 2008, 27 (2): 255-260
[12] �Hu G H, Wang H G., Qian F. Numerical simulation on
flow, combustion and heat transfer of ethylene cracking
furnaces[J]. Chem Eng Sci, 2010, 66(8): 1600-1611
[13] �User’s Guide of Fluent Documentation, version 6.3, USA:
ANSYS, Inc. 2006
[14] �Launder B E, Spalding D B. Lectures in Mathematical
Models of Turbulence[M]. London: Academic Press, 1972
[15] �Cheng P. Two-dimensional radiating gas flow by a moment
method[J]. AIAA Journal, 1964(2): 1662
[16] �Siegel R, Howell J R. Thermal Radiation Heat Transfer[M].
Washington DC: Hemisphere Publishing Corporation, 1992
2012,14(4):52-63
· 63 ·
[17] �Magnussen B F, Hjertager B H. On mathematical models
of turbulent combustion with special emphasis on soot
formation and combustion[C]//16th Symp. (Int’l.) on
Combustion, 1976
[18] �Spalding D B. Mixing and chemical reaction in steady
confined turbulent flames[C]//13th Symp. (Int’l.) on
Combustion, 1970
[19] �Yapıcı H, Kayataş N, Albayrak B, et al. Numerical
calculation of local entropy generation in a methane–air
burner[J]. Energy Conversion and Management, 2005, 46:
1885-1919
[20] �Sivathanu Y R, Faeth G M. Generalized state relationships
for scalar properties in non-premixed hydrocarbon/air
flames[J]. Combustion and Flame, 1990, 82(2): 211-230
Successful Application of Third Generation Series of Resid Hydrotreating Catalysts at Dalin Refinery of China Petroleum
Corporation in Taiwan
Recently the RHT series of resid hydrotreating catalysts independently developed by the SINOPEC Research Institute of Petroleum Processing (RIPP) have been suc-cessfully used in the #1 RDS unit at the Dalin refinery of the CPC Corporation of Taiwan, while cranking out qualified products, symbolizing the successful offshore application of SINOPEC’s third-generation RHT series of high-performance resid hydrotreating catalystsThe third-generation RHT series of resid hydrotreating catalysts provided by RIPP after assessment of relevant catalysts in a long-cycle test conducted by the Petroleum Refining Research Institute (PRRI) of the CPC Corpora-tion of Taiwan have been proved to possess high demetal-lation activity and high metal tolerance with extended
service life to cope with a stable operating cycle of more than 573 days in compliance with the A+ certification. The #1 RDS unit at the Dalin refinery of the CPC Corpo-ration of Taiwan rated at 1.5 Mt/a can process a low-qual-ity feed oil, and the service life of hydrotreating catalysts used to be about 11 months upon operating on inferior oil in the presence of previous hydrotreating catalysts. Since the excellent performance of RIPP’s RHT series of cata-lysts was identified during the catalytic activity assessment tests carried out by PRRI, the Dalin refinery of the CPC Corporation expects to extend the operating cycle of the #1 RDS unit to 16 months, and RIPP has finally won the bid on supply of the third-generation RHT series catalyst thank to the wonderful performance of these catalysts.
New 1,3-Phenylenediamine Manufacture Process Successfully Developed by Qingdao Science and Technology University
The production unit using a new process for manufacture of 1,3-phenylenediamine developed independently by the Qingdao Science and Technology University (QSTU) has been successfully put on stream at the Shandong Ekesen Chemical Company with its production capacity reach-ing 10 kt/a and all technical indicators complying with or exceeding the expected targets. The new process has reduced the production energy consumption in big chunks to realize effective separation of three products, namely ortho-, meta-, and para-phenylenediamine, with the prod-uct purity reaching the polymerization grade (99.9%). It is said that this company has for the first time realized this goal among domestic rivals. It is learned that the novel long-life and high-activity hy-
drotreating catalyst developed by QSTU, is characterized by a catalyst consumption of 3 kg on each ton of products obtained, and this hydrotreating process can dramatically re-duce the discharge of wastewater from m-phenylenediamine unit. Furthermore, the coupled rectification process has been developed to drastically reduce the production energy consumption, which is around 0.15 tons of standard coal equivalent per ton of product obtained. Along with reduc-tion of energy consumption the high-efficiency separation of ortho-, meta- and para-isomers of phenylenediamine has been achieved to make the purity of m-phenylenediamine comply with the polymerization-grade level. Currently, m-phenylenediamine manufactured by this novel process is being sold and recognized positively by the customers.
Zhou Xianfeng, et al. Estimating the Operation Status of Steam Cracking Furnace Using Numerical Simulation with Combustion Models