Embed Size (px)
Citation preview
Estimating Tester to Developer Ratios (or Not)
Kathy Iberle (Hewlett-Packard)Sue Bartlett (IIS/STEP
Technology)
Copyright Kathy Iberle, Sue Bartlett 2001 2
Introduction Estimating with minimal data Can ratios be used? A correction method for estimates
made using tester-developer ratios
Copyright Kathy Iberle, Sue Bartlett 2001 3
How Many Testers Do I need? The traditional way to estimate
Project information -> Work breakdown
Work breakdown -> Tester hours Estimates with less information
Minimal project information -> Rules of thumb
Rules of thumb -> Tester hours
Copyright Kathy Iberle, Sue Bartlett 2001 4
When Accuracy is not CriticalIn the authors’ experience, estimates
with 20% or more error are useful for: Long-term staffing predictions
12-24 months out The projects to be tested aren’t defined yet
Bidding on a large number of small projects Errors tend to cancel each other out A fast bid process wins business
Copyright Kathy Iberle, Sue Bartlett 2001 5
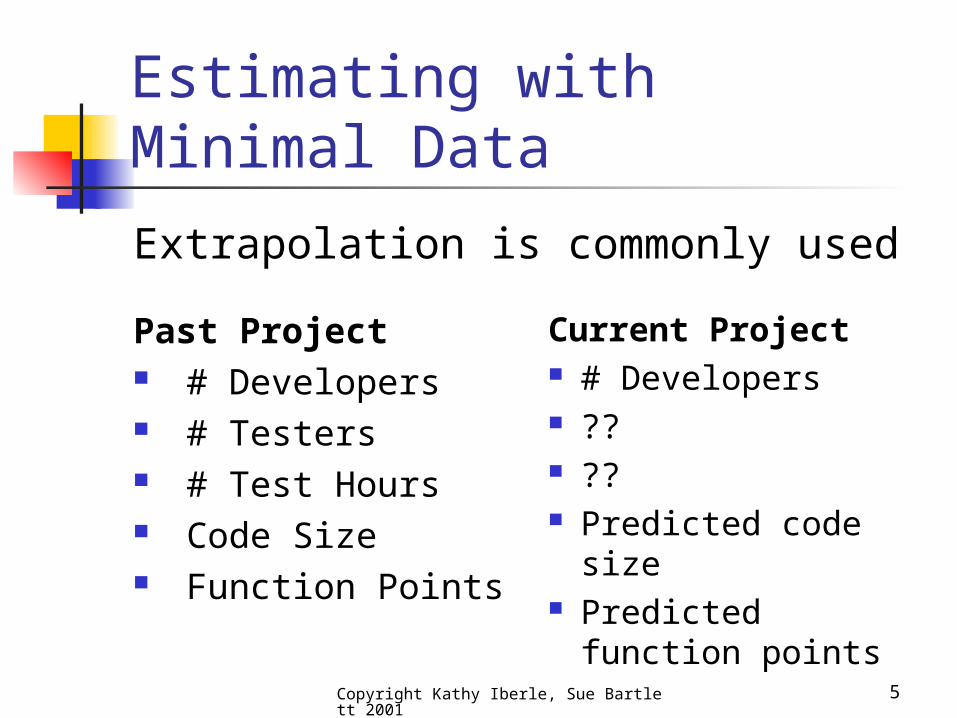
Estimating with Minimal Data
Past Project # Developers # Testers # Test Hours Code Size Function Points
Current Project # Developers ?? ?? Predicted code size Predicted function
points
Extrapolation is commonly used
Copyright Kathy Iberle, Sue Bartlett 2001 6
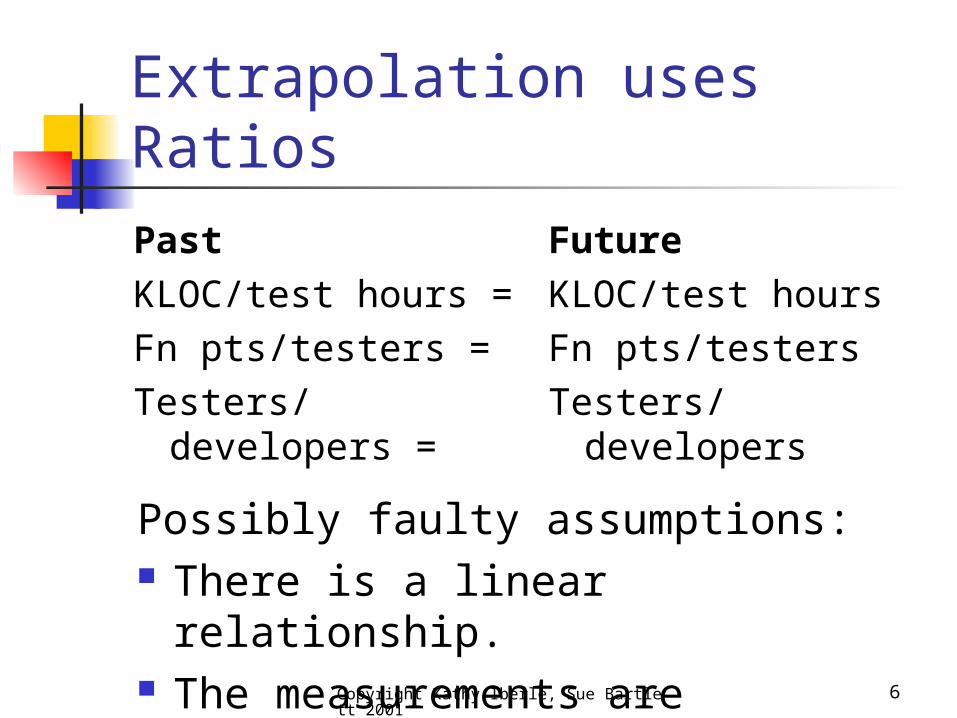
Extrapolation uses Ratios
PastKLOC/test hours = Fn pts/testers =Testers/developers
=
FutureKLOC/test hoursFn pts/testersTesters/developers
Possibly faulty assumptions: There is a linear relationship. The measurements are repeatable.
Copyright Kathy Iberle, Sue Bartlett 2001 7
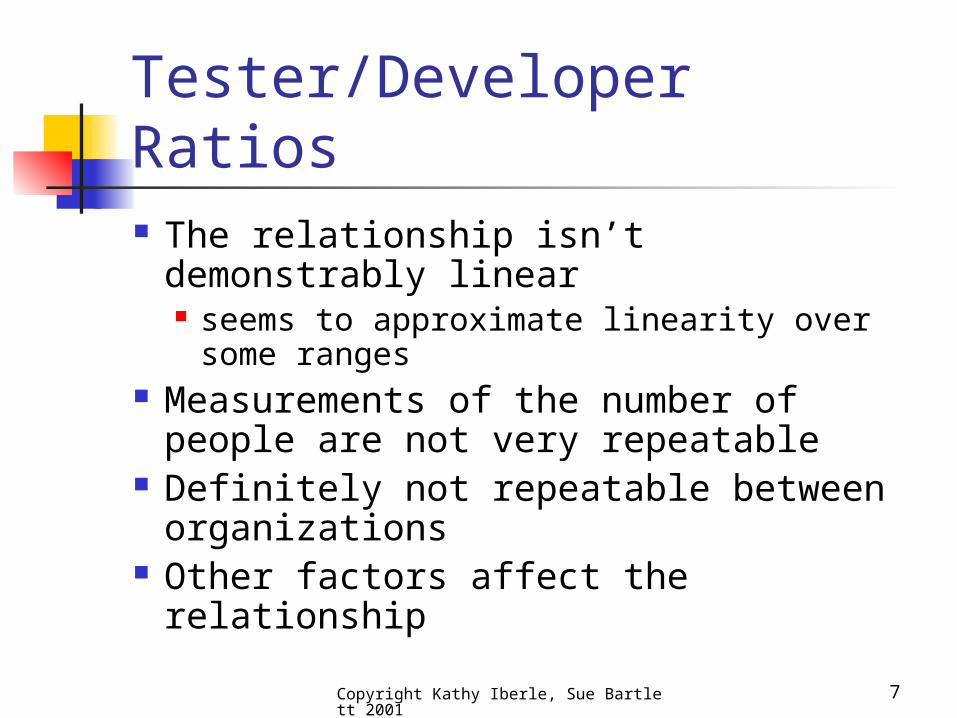
Tester/Developer Ratios The relationship isn’t demonstrably
linear seems to approximate linearity over
some ranges Measurements of the number of
people are not very repeatable Definitely not repeatable between
organizations Other factors affect the relationship
Copyright Kathy Iberle, Sue Bartlett 2001 8
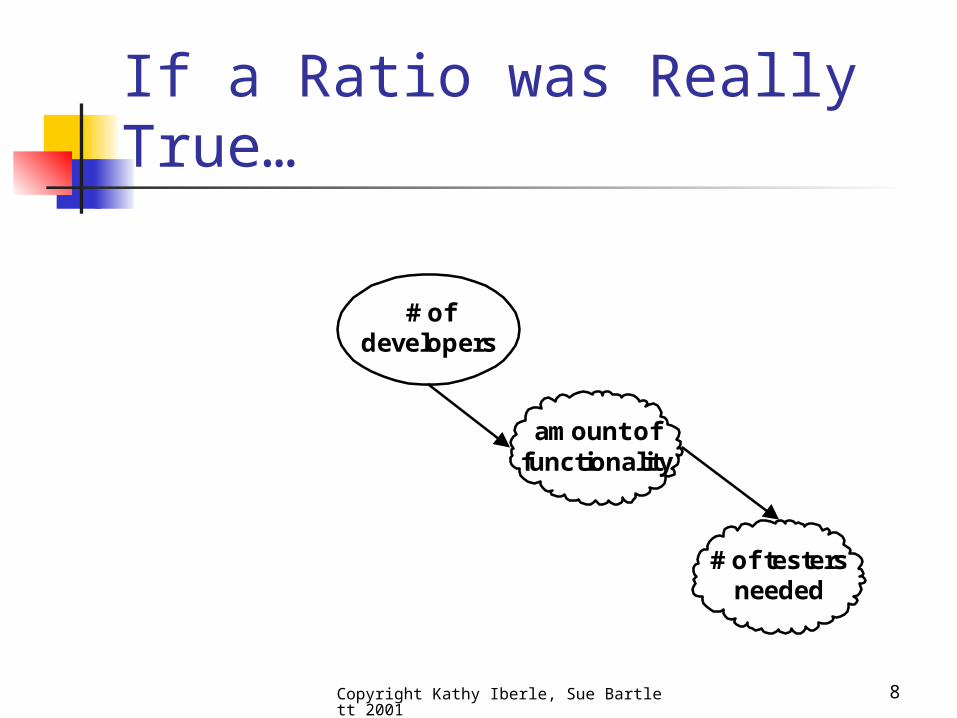
If a Ratio was Really True…
# of testersneeded
# ofdevelopers
amount offunctionality
Copyright Kathy Iberle, Sue Bartlett 2001 9
What Most People Do… Get the best previous data available Try to use the same measurement
methods to measure the current data Use your own data, not someone else’s
Extrapolate using a ratio Correct the estimate based on their
experience
Copyright Kathy Iberle, Sue Bartlett 2001 10
Yet Another Way to Correct A systematic correction using a
cause-effect model Covers a lot of the common factors
that cause differences Supplies some mental tools to
think about “canceling out”
Copyright Kathy Iberle, Sue Bartlett 2001 11
Where did the model come from This model is based on work done
at STMR 3 in Oct 2000 by 14 test lab managers and consultants Brainstormed factors that affect the
ratio of testers to developers Based on personal observation Relative, not absolute
The authors sorted and grouped the factors to produce this model
Copyright Kathy Iberle, Sue Bartlett 2001 12
Why use a model? We think this models what we do by
“intuition” or “experience” The systematic model might be
more accurate than “intuition” An explicit model encourages better
thinking We incorporate the experience of
others into the model, increasing accuracy
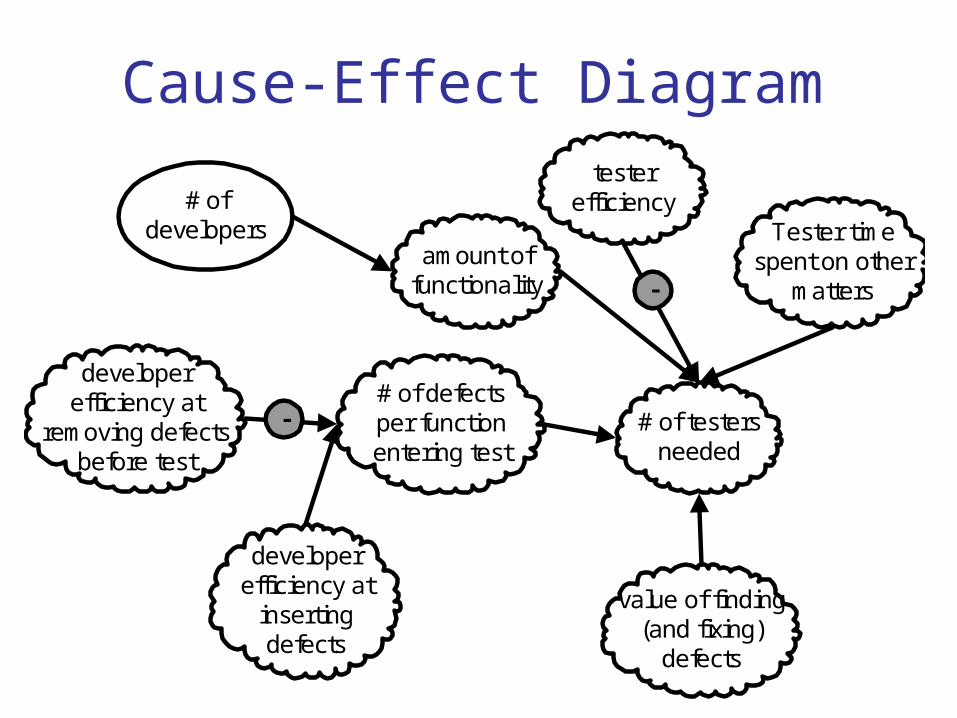
Cause-Effect Diagramtester
efficiency
# of defectsper functionentering test
# of testersneeded
# ofdevelopers Tester time
spent on othermatters
value of finding(and fixing)
defects
developerefficiency at
insertingdefects
developerefficiency at
removing defectsbefore test
-amount of
functionality
-
Copyright Kathy Iberle, Sue Bartlett 2001 14
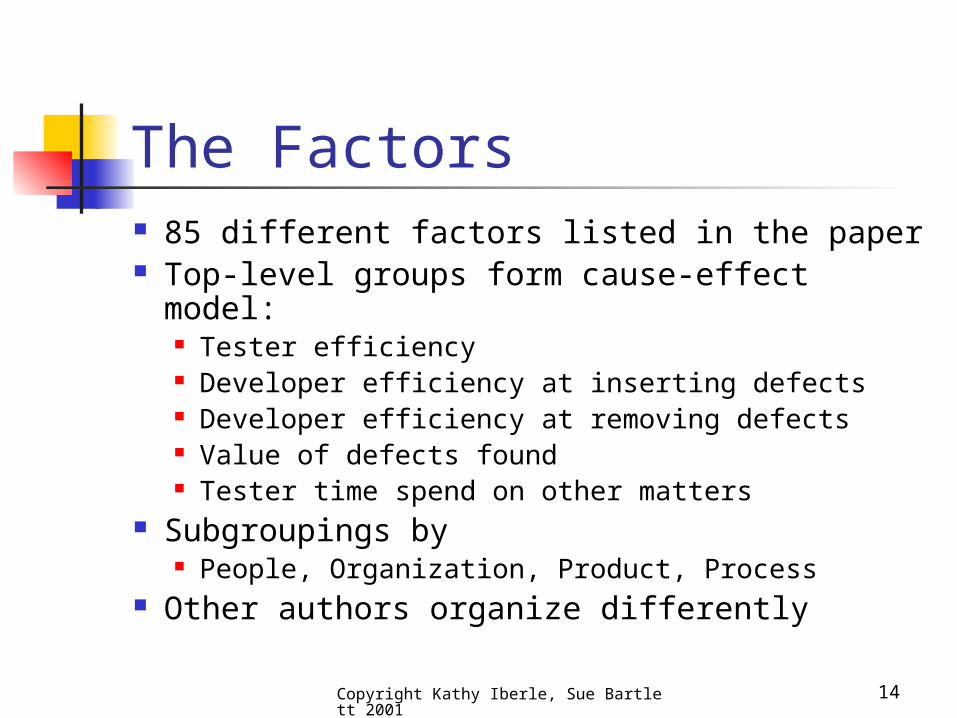
The Factors 85 different factors listed in the paper Top-level groups form cause-effect model:
Tester efficiency Developer efficiency at inserting defects Developer efficiency at removing defects Value of defects found Tester time spend on other matters
Subgroupings by People, Organization, Product, Process
Other authors organize differently
Copyright Kathy Iberle, Sue Bartlett 2001 15
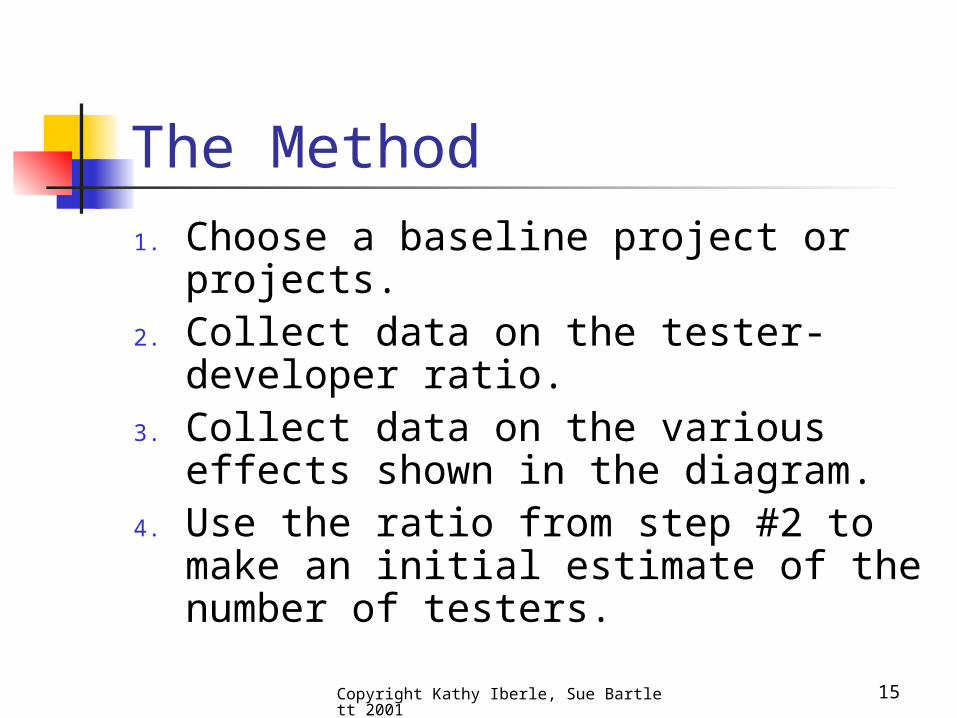
The Method1. Choose a baseline project or
projects.2. Collect data on the tester-
developer ratio.3. Collect data on the various effects
shown in the diagram.4. Use the ratio from step #2 to make
an initial estimate of the number of testers.
Copyright Kathy Iberle, Sue Bartlett 2001 16
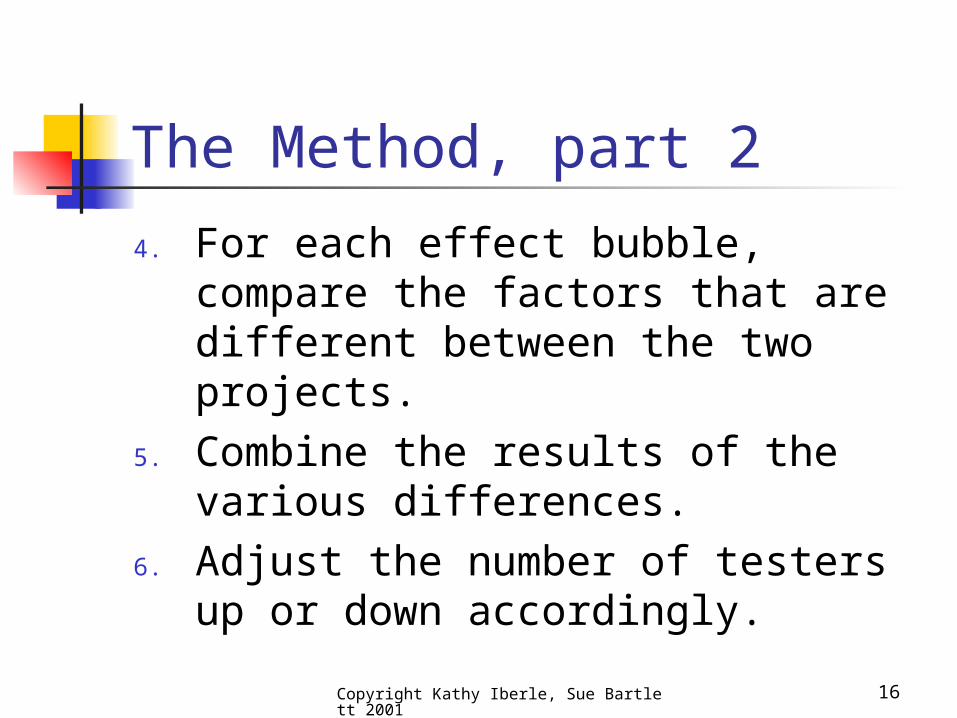
The Method, part 2
4. For each effect bubble, compare the factors that are different between the two projects.
5. Combine the results of the various differences.
6. Adjust the number of testers up or down accordingly.
Copyright Kathy Iberle, Sue Bartlett 2001 17
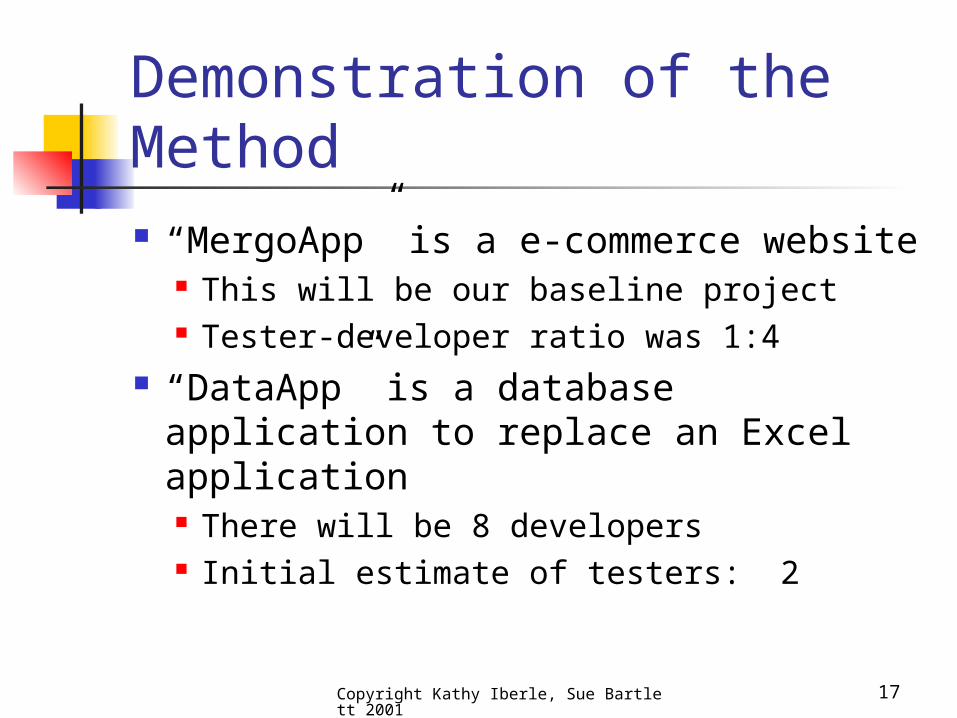
Demonstration of the Method “MergoApp” is a e-commerce website
This will be our baseline project Tester-developer ratio was 1:4
“DataApp” is a database application to replace an Excel application There will be 8 developers Initial estimate of testers: 2
Copyright Kathy Iberle, Sue Bartlett 2001 18
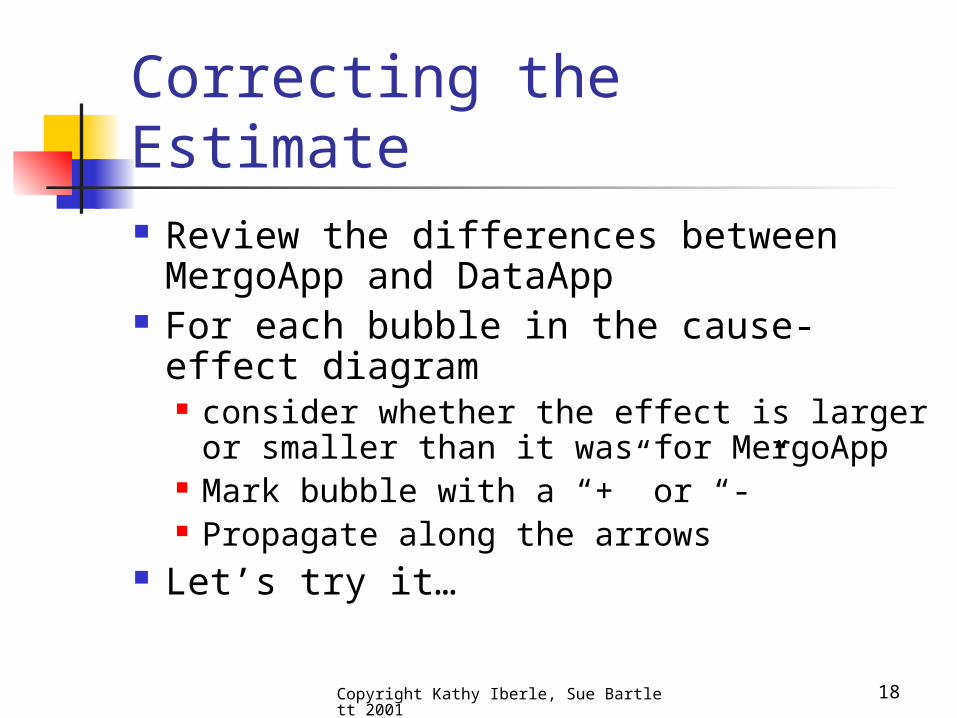
Correcting the Estimate Review the differences between
MergoApp and DataApp For each bubble in the cause-effect
diagram consider whether the effect is larger or
smaller than it was for MergoApp Mark bubble with a “+” or “-” Propagate along the arrows
Let’s try it…
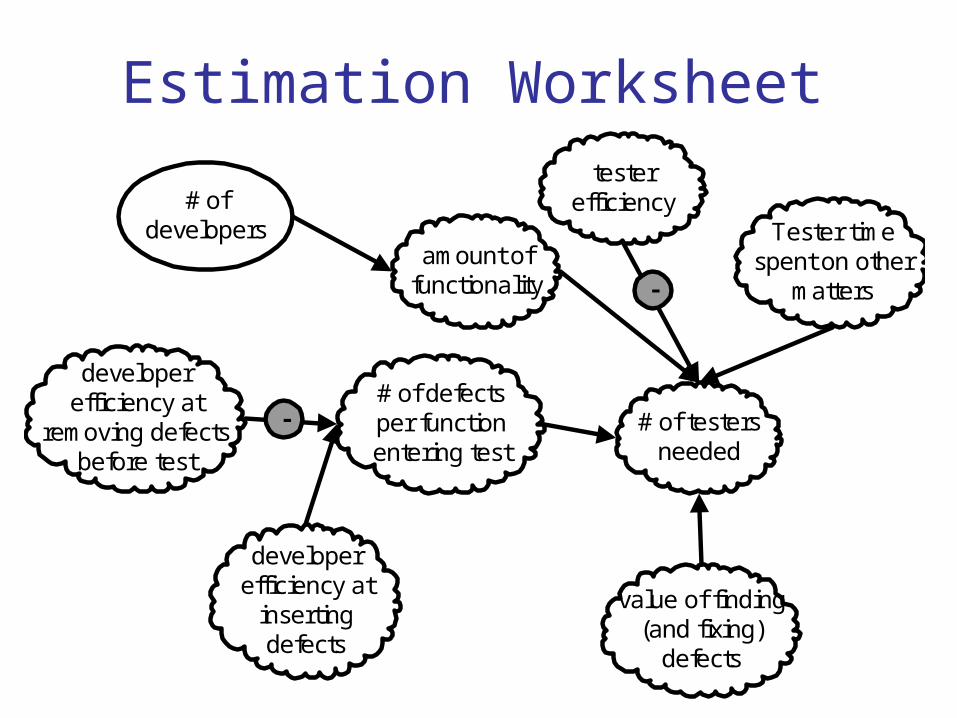
Estimation Worksheettester
efficiency
# of defectsper functionentering test
# of testersneeded
# ofdevelopers Tester time
spent on othermatters
value of finding(and fixing)
defects
developerefficiency at
insertingdefects
developerefficiency at
removing defectsbefore test
-amount of
functionality
-
Copyright Kathy Iberle, Sue Bartlett 2001 20
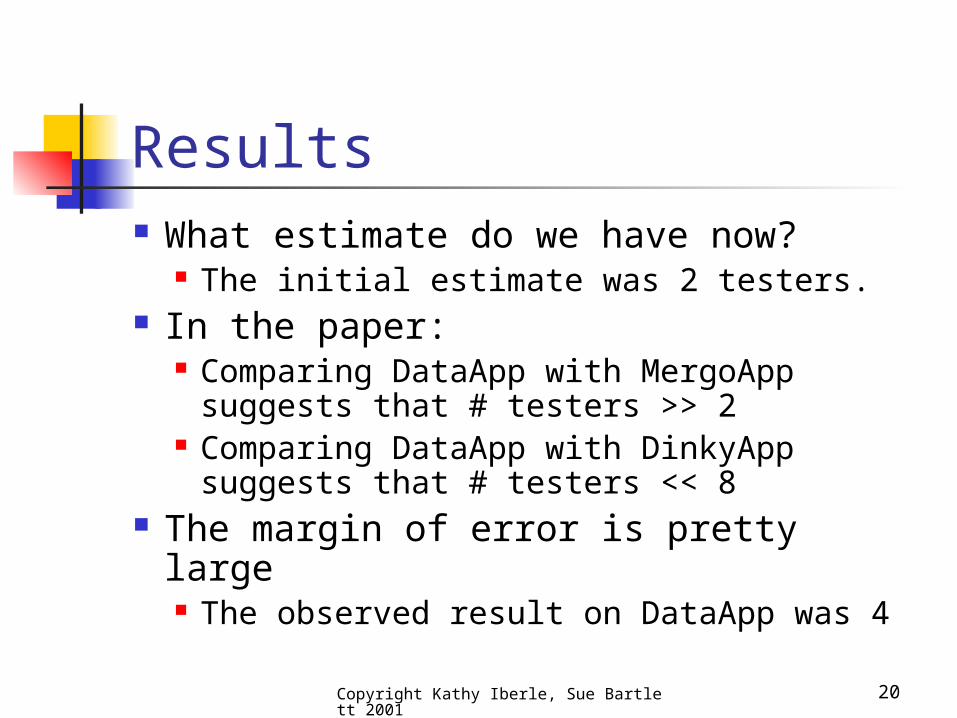
Results What estimate do we have now?
The initial estimate was 2 testers. In the paper:
Comparing DataApp with MergoApp suggests that # testers >> 2
Comparing DataApp with DinkyApp suggests that # testers << 8
The margin of error is pretty large The observed result on DataApp was 4
Copyright Kathy Iberle, Sue Bartlett 2001 21
What Will Happen If You Try? We tested the model on ~4 projects Margin of error was about 50% Using two baselines, margin of error
was obvious (this is good) Estimates always need real-time
corrections during the project If you try this, we’d like to hear
whether it worked
Copyright Kathy Iberle, Sue Bartlett 2001 22
More Handy Uses for the Cause-Effect Diagram Illustrate the lack of accuracy in your
estimates Walk your management through part of
the estimation-upon-estimation process Explain your intuitive judgements Predict the effect of changes
Demonstrate why the change should reduce or increase the number of testers
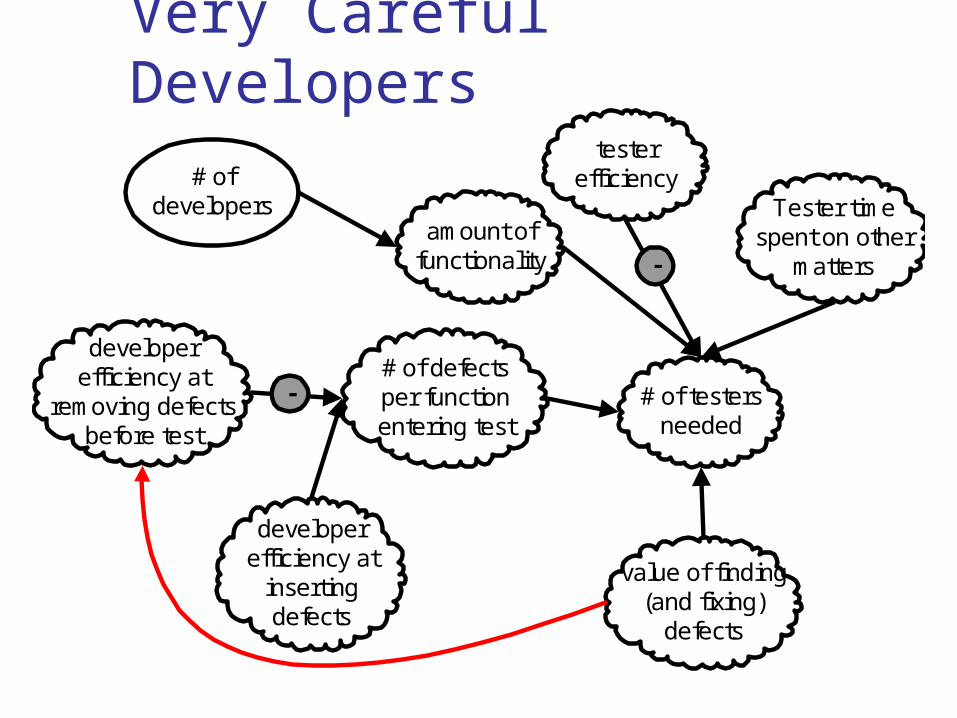
Very Careful Developerstester
efficiency
# of defectsper functionentering test
# of testersneeded
# ofdevelopers Tester time
spent on othermatters
value of finding(and fixing)
defects
developerefficiency at
insertingdefects
developerefficiency at
removing defectsbefore test
-amount of
functionality
-
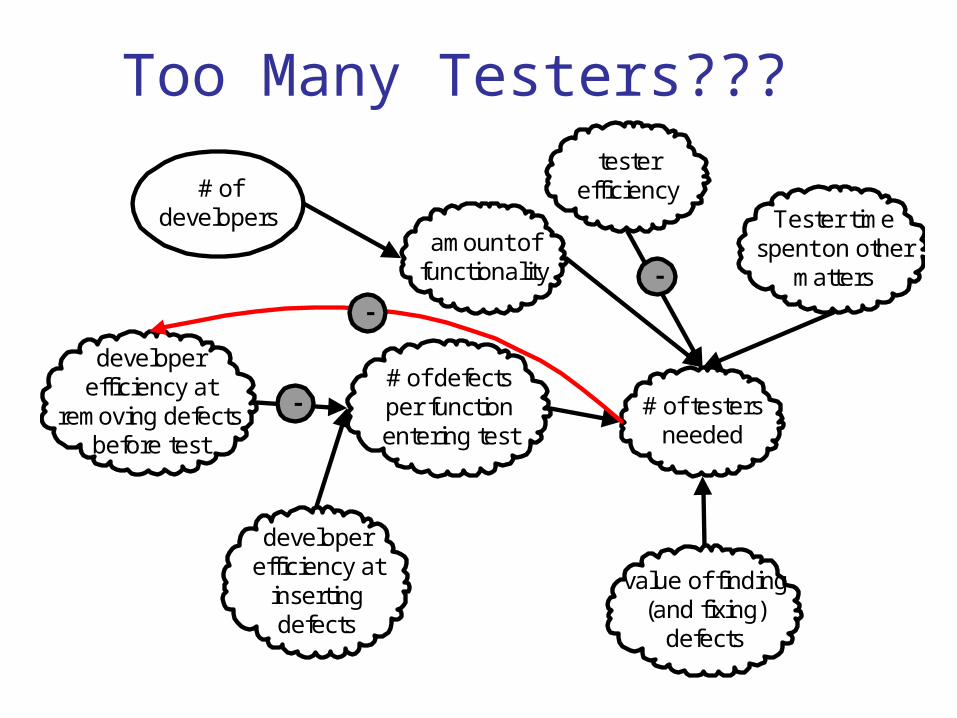
Too Many Testers???tester
efficiency
# of defectsper functionentering test
# of testersneeded
# ofdevelopers Tester time
spent on othermatters
value of finding(and fixing)
defects
developerefficiency at
insertingdefects
developerefficiency at
removing defectsbefore test
-amount of
functionality
-
-
Copyright Kathy Iberle, Sue Bartlett 2001 25
Summary Ratios are used to estimate with
minimal data The estimates will need to be
corrected for the effect of various factors
The cause-effect diagram is useful for reasoning about those corrections
Copyright Kathy Iberle, Sue Bartlett 2001 26
More information A list of factors to use with the
model appears in our paper A Visio version of the cause-effect
diagram is on the CD Also posted at www.kiberle.com
Copyright Kathy Iberle, Sue Bartlett 2001 27
References Effects diagrams
G.M. Weinberg, Quality Software Management, Vol. 1: Systems Thinking. (New York: Dorset House Publishing, 1992).
Other papers about estimates Johanna Rothman, “It Depends: Deciding on the Correct
Ratio of Developers to Testers”. http://www.jrothman.com/Papers/ItDepends.html.
Kaner, Hendrickson, and Brock, “Managing the Proportion of Testers to (Other) Developers”. Quality Week 2001 Proceedings.
Elisabeth Hendrickson, “Better Testing, Worse Quality?". SM/ASM 2001. www.QualityTree.com.