Embed Size (px)
Citation preview

1
ESTIMATING TECHNICAL AND ALLOCATIVE EFFICIENCY BY
MEANS OF A BAYESIAN APPROACH: AN APPLICATION TO THE
POSTAL SECTOR
José Baños-Pino and Ana Rodríguez-Álvarez University of Oviedo, Oviedo Efficiency Group
ABSTRACT
The aim of this paper is to study the technology of the Spanish State Postal and
Telegraph Society sector (Correos, hereafter). Concretely, we analyze economic
efficiency (technical and allocative) and scale economies of the Correos’ units of
production (cost centers). To do this, we employ a methodology based of an input
distance function which is the dual of the cost function. Applying duality theory, we
also develop an economic model to assess the effect of postal infrastructures on the
operators’ costs. In order to carry out the empirical model, bayesian econometrics is
applied to estimate the parameters in the input distance function and the technical
efficiency terms.
KEYWORDS: Bayesian econometrics, scale economies, postal infrastructure shadow
price, Spanish postal sector technical and allocative efficiency.
1. INTRODUCTION
The postal sector has been undergoing a profound transformation over the last decades,
largely as a result of social changes produced by the rapid development of technology
and communication. The liberalization of this sector (which was traditionally provided
by a monopolistic public or regulated operator) has been the main bet in Europe in
order to improve efficiency and quality levels. Consequently, the EU policy in the
postal sector seeks to complete the internal market for postal services and to ensure,
through an appropriate regulatory framework, an efficient, reliable and good-quality
postal service to all its citizens at affordable prices.

2
In Spain, as in other European countries, postal sector was regulated during decades. It
was not until the end of 1985 when Spain decided to join the European Community as a
full member. In this way, European laws and regulations started to have a permanent
impact in Spain (for more details see Escribano et al. 2003, 2004). Nowadays, Correos
is the administrator of the largest nationwide postal network and the principal operator
in the market. It is charged with providing the universal postal service until 2025 and it
is obliged to provide competitors with wholesale access to its network, in accordance
with Act 43/2010 of 30 December 2010 on the Universal Postal Service Act, rights of
users and the postal market. Despite the liberalisation initiated by the EU Directives of
1997/67/EC; 2002/39/EC or 2008/6/EC, Correos has a turnover 10 times as large as its
biggest competitor, Unipost.1
Some figures may be useful to analyze the productivity of the Correos. Following DBK
report (2013), the evolution of the number of shipments and the sectorial turnover has
recorded an average annual rate of reduction of 9.2% and 9.4% per cent respectively in
the period 2012-2011. The market value stood at 1,635 million euros in 2012, recording
a decline of 9% compared to 2011, the year in which it had posted a decrease of 1%. On
the other hand, the number of workers has decreased considerably in the last 10 years
(from 63,000 workers in 2002 to 55,000 workers in 2012).
By analyzing these figures the question that arises is how it is possible to improve the
productivity of the company. The aim of this paper is to analyze the technology of the
postal sector in Spain. By doing so, we will be able to know several characteristics of
this technology that could be useful for the regulator agent in order to find optimal ways
to improve the provision of the postal service. This is especially relevant in a context
where demand of postal services is falling due to the growing use of digital media and
where postal markets are open to competition. Moreover, and as Pateiro et al. (2012)
pointed out, the welfare gain from the increasing competition could be offset by the loss
of efficiency if there are new inefficient operators and if prices are not related with the
costs. In this sense, an inadequate ruling of access to the postal network during the
1 In this sense, in 2014, the Comisión Nacional de los Mercados y la Competencia has imposed a fine on
the postal service provider Correos for abusing its dominant position.
For details see: ec.europa.eu/competition: European Competition Network: ECN, Brief 01/2014.

3
liberalization process can affect the network efficiency. Because of this, in this paper we
calculate the (shadow) price for granting access to the postal network to a new operator.
Deprins et al. (1984) were the pioneers in analyzing technical efficiency of the postal
sector. They use Belgian postal data to compare several methods of measuring technical
efficiency and calculate an average labor-efficiency of about 90%. Palm (1987) uses a
Cobb-Douglas production function and as a result he obtains an efficiency index with a
large dispersion. Register (1988), who analyzes the technical efficiency for the postal
administration in the USA after the reorganization in 1970, uses a frontier function in
order to construct an efficiency index between the years 1955-1985. His results show
that the changes in the reorganization led to a significant improvement in efficiency. For
their part, Perelman and Pestieau (1994) analyze technical efficiency by comparing 16
European countries using a panel data and obtaining levels of efficiency ranged between
39 and 90 %. Borenstein et al. (2004) study post offices in Brazil with non-parametric
techniques (DEA) and found about 44% of the offices located on the frontier. Felisberto
(2013) assesses the effect of liberalization on innovation in the postal sector using as a
proxy for innovation (among others) labor productivity. To do this, data from seventeen
European countries over eleven years is collected. He finds evidence that liberalization
has a positive effect on innovation.
At the national level, the existing literature analyzing the productive activity and
efficiency of the postal sector is scarce. Morales Piñero (2009) compares the efficiency
and effectiveness of the Spanish public operator relative to other European operators.
With this aim, he uses a panel data, modeling a translog average cost function with
fixed effects. From the results he stresses that the different delivery times (quality) are
important for the explanation of efficiency. Moreover, Iturralde and Quiros (2008)
analyze technical and productive change in the Postal European Union and compare the
Spanish case with other European countries. According to their results, important
technical inefficiencies and high dispersion across operators are observed.
On the other hand, several studies have analyzed economic efficiency by means of a
cost frontier. Filippini and Zola (2005) for post offices in Switzerland; Moriarty et al.

4
(2006) and Horncastle et al. (2006) for Royal Mail’s delivery offices; Filippini and
Koller (2012a) for Swiss Post’s postal delivery units or Cazals et al. (2008, 2011) for
postal services in the UK are some examples.
Moreover, scale economies are widely analyzed in this sector. The vast majority of
empirical results reveal the existence of scale economies. In this sense, Hunt and Lyink
(1991); Rogerson and Takis (1993); Cohen and Chu (1997); Cazals et al. (2005);
Filippini and Zola (2005); Bradley et al. (2006); d’Alcantara and Amerlynck (2006) as
well as Farsi et al. (2006) found scale economies in this sector. The exception to these
results is Mizutani and Uranishi (2003) where authors did not find evidence of scale
economies in the postal industry.
More recent works are Filippini and Koller (2012a, 2012b). In the first one, they
analyze economies of scale and scope in Swiss Post's post offices and franchised postal
agencies under consideration of different underlying production technologies and
unobserved factors using a latent class model. The results confirm the existence of
unobserved heterogeneity and of increasing economies of scale and scope. In the
second one, they analyze the cost structure of Swiss Post’s postal delivery units by
analyzing several models to deal with the problem of the unobserved heterogeneity in a
panel data.
All examples above analyze productive (technical or cost) efficiency by using
production or cost functions. The cost function allows multi-output technologies and
therefore its use is obviously more suitable than the former in order to analyze Correos’
technology. However, cost function assumes cost minimization and exogeneity of input
prices and these assumptions could be questionable in the postal sector. To solve these
problems, we propose the use of an input distance function which does not assume
exogeneity in the price of the factors. This property could be significantly relevant for
our aims, as the provision of postal infrastructures is conditioned by the performance of
the public sector. Moreover, the input distance function does not assume cost
minimization. This feature is especially attractive when analyzing the public sector,

5
regulated sector or other subjects related to optimal provision of inputs, where generally
the assumption of costs-minimizing behaviors is questioned.
In order to carry out the estimation, bayesian econometric techniques are applied. The
Bayesian approach to stochastic frontiers presents advantages in terms of formally
deriving posterior densities for individual efficiencies, while it allows easy
incorporation of economic restrictions (see van den Broeck et al., 1994; Koop et al.,
1997; or Griffin and Steel, 2008). This method will be superior to the frequently applied
classical maximum likelihood statistics, since it considers unknown parameters as
random variables, specified as prior distributions.
In short, the aim of this paper is to estimate an input distance function by using
Bayesian econometrics to capture the technology of postal sector. To our knowledge,
this is the first paper to address both issues. In the empirical investigation of these
issues, a broad data set of Spanish postal sector is analyzed at the level of production
units (cost centers) which constitutes the second contribution of this paper.
2. CAPTURING POSTAL SECTOR TECHNOLOGY
The objective of this section is to explain the several concepts that can help us to
understand technology in the Spanish postal sector: technical efficiency; scale
economies; allocative efficiency and the postal infrastructure shadow price.
2.a. Concept and measurement of the technical efficiency
According to Farrel (1957), a company is technically efficient with regard to others
when producing a given amount of output with the minimum amount of inputs (input-
oriented). Mathematically, the index of technical efficiency is defined as:
TEI(y, x) = min: x L(y) [1]
Where L(y) is the set of possibilities of production and λ is a scalar which takes values
between 0 and 1 (0 < ≤ 1) representing the reduction of the radial consumption of
inputs to obtain the maximum possible output. An alternative form of defining the

6
technical efficiency is through the Shephard's distance function (1953, 1970). The input
distance function is the reciprocal of the Farrel index of technical efficiency. We can
define it formally as:
DI (y, x) = max1/: x L (y) [2]
where λ is the above defined scalar. As a result, DI measures the maximum potential
equiproportional reduction of the inputs. It takes the value one when the company is
located on the frontier and will reach a higher value to the unit when they did not use
the resources efficiently.
That is to say, if DI equals one it indicates that the company is technically efficient and
a value higher than the unit shows us the degree of the efficiency achieved by the
company. The input distance function fulfills the following properties: is no decreasing
in inputs, is decreasing in outputs, homogeneous of degree one, concave in inputs and
valid for multiproduct technology (see Färe and Primont, 1995 for details). Moreover,
given that the distance function allows us to choose the orientation, in our study we will
estimate an input distance function, where we assume that the inputs are endogenous
and the outputs exogenous, what seems to be more consistent with the Spanish postal
sector.
Because of this, in this study we will use stochastic input distance frontier which, in
accordance with the expression [2] and assuming short-run with a quasi-fixed factor
(K), can be defined as:
1 = 𝐷𝐼 (x, y, K) [3]
2.b. Concept and measurement of Returns to Scale
Since the estimation of the distance function allows capturing the technology, it will
also be possible to determine the returns to scale. The returns to scale measure the
changes in the production resulting from a proportional change in all the inputs. As
shown by Färe and Primont (1995), the elasticity of scale can be defined as follows:

7
yy
DI
K)y,(x,
1 [4]
where 𝐷𝐼 (𝑦, 𝑥, 𝐾)/𝑦 is the coefficient of the first order of the distance function
regarding the vector of the outputs.
The equation [4] can take different values; this way a value higher than one indicates
the existence of increasing returns to scale; a value equal to one indicates that there are
constant returns to scale; and finally a value lower than one indicates the presence of
decreasing return to scale.
2.c. Concept and measurement of the allocative efficiency
Given the technology and the prices of the production factors, an entrepreneur is
allocatively efficient when is capable of producing using a proportion of these so
company’s costs are minimized. To analyze allocative efficiency, Färe and Grosskopf
(1990) use the dual theory cost function/input distance function as follow:
D(y,x,K) = minWs W
sx : C(y,W
s,K) = 1 [5]
C(y,ws,K) = minx w
s x : D(y, x, K )= 1 [6]
Where ws is the price vector of the factors that minimize y’s production cost given x and
K. Shadow price vector (ws) only will coincide with market price vector (w) if the
chosen amount of factors (x) is optimal for a given K value.
On the other hand, C (y, ws, K) is the shadow cost function which indicates the
minimum cost to produce y with a given input vector (x) and K, and WS =
K),wC(y,
ws
s
is the shadow price vector normalized by the cost.
From this duality, Shephard (1970) establishes a relationship between variable inputs
and their prices through the following equations:

8
Shephard’s lemma: i
sss
iw
K),wC(y,K),w(y,x
[7]
Dual of Shephard’s lemma:i
s
ix
K)x,D(y, K)x,(y,W
[8]
Thus, the duality between the input distance function and the cost function enables the
identification of the shadow price vector (normalized) that minimizes the variable costs,
given y, x, and K. Therefore, regarding these shadow prices, the cost minimization
condition is always met.
However, such shadow price vector (ws) may or may not coincide with the market price
vector (w). Only when shadow prices and market prices coincide, companies minimize
costs with respect to such market prices. Therefore, by using the methodology of the
distance function, there is no need to assume that companies minimize costs with
respect to the market prices which is especially attractive when analyzing postal sector.
Given any two inputs i , j = 1 , 2, ..., n, applying [8] we obtain the shadow price as
shown:
D ( )
x
D ( , )
x
w
w
I
i
I
j
i
s
j
s
y, x
y x [9]
If the assumptions of cost minimization were met, this ratio should be equal to the ratio
of market prices of the inputs. However, if the inputs are not chosen in the right
proportion, which is to say, if we incur in allocative inefficiency, these price ratios will
differ. In order to study the amount and the direction of such deviation, Färe and
Grosskopf (1990) introduce parametric correction (ki) between the input’s market price
and its shadow price:
wis = ki wi [10]
Dividing expression [10] by the corresponding to the input j , we obtain:
9
w
wk
w
w
i
s
j
s ij
i
j
[11]
where kij = ki/kj
Equation [11] determines whether both ratios differ, so we can obtain the sense of the
allocative inefficiency as follows:
• If kij = 1, factor i and factor j are used in their optimum proportions to minimize
costs, ie, the enterprise is allocatively efficient.
• If kij > 1, factor i is underused with respect to factor j.
• If kij < 1, factor i is overused with respect to factor j.
2.d. Effect of postal infrastructures on variable costs
The postal infrastructure network (K), which is a quasi-fixed variable in our short-run
model, becomes especially relevant in this section. To analyze the effect on the
infrastructural postal network in the technology, we will explore again the duality
between the input distance function and the cost function. We start with the Lagrangian
(L) associated with the equation [6]:
L = wsx + µ [1-D(y, x, K)] [12]
where µ is the Lagrange multiplier. Applying the envelope theorem, we obtain:
K
K)x,D(y,
K
K),wC(y, s
[13]
To explain µ’ s value, we take into account the minimum first order conditions
associated to [12] , which can be expressed as follows:
0x
K)x,D(y,w
x
L s
[14]
0K)x,D(y,1λ
L
[15]

10
Multiplying equation [14] by x we obtain:
0xx
K)x,D(y,xws
[16]
Since D is a first degree homogeneous function in x, by applying Euler's theorem and
[16], the following expression should be true:
1 K)x,D(y,xx
K)x,D(y,
[17]
Furthermore, considering that ws as the shadow price vector which minimizes the cost
for a given x and K, by clearing µ in [16] we obtain:
K),wC(y,xw ss [18]
Finally, according to the value obtained for µ, equation [13] can be expressed as
follows:
K
K)x,D(y,
K),wC(y,
K
K),wC(y,
s
s
[19]
Namely, the value D(y, x, K)/K is equal (in absolute terms) to the marginal
contribution of the infrastructure to the change in variable costs (normalized). So, since
C (y, ws, K) is always positive, if the derivative of the distance function with respect to
K were also positive, equation [19] would indicate that savings in cost may be possible
thanks to the increase of infrastructure provisions, and vice versa if the derivative of the
distance function with respect to K were negative . Thus, we can calculate the stress on
the variable production costs due to the different postal infrastructure stocks (postal
networks) available in the economy.
However, since the value of C (y, ws, K) is not directly observable (it depends on
shadow prices, ws), equation [19] makes it impossible to calculate the savings (or the

11
increase) on the cost of the infrastructure. To overcome this drawback, the model is
redefined in logarithmic terms, so equation [17] becomes:
ln1 = ln D(y, x, K) [20]
In addition, we also know that:
K
D
lnK
K)x,lnD(y,
K
K)x,D(y,
[21]
The definition of normalized shadow cost function is: a function that optimizes the
observed cost in a frontier point given the amount of factors used. Therefore, the
following must be true:
D
CK),wC(y, s [22]
where C
D is the observed cost at a point on the isoquant (on the production function) .
Then, using [19], [21] and [22], we finally obtain the expression:
KPK
C
lnK
K)x,lnD(y,
K
K)x,C(y,
[23]
which is the definition of the shadow price of the quasi-fixed input of the infrastructure,
a postal network in this particular case, PK.
Since both C (variable cost) and K (stock of postal network infrastructure) are observed
variables, equation [23] shows us how to obtain the shadow price of the postal
infrastructures (PK) in monetary terms once an input distance function is estimated.

12
Figure 1. The shadow price of quasi-fixed capital
An interpretation of the meaning of this shadow price is offered in Figure 1. To
illustrate it, let’s consider two variables inputs -intermediate consumption (IC) and
employment (L). In the case of a change in the infrastructure provision, which implies
an increase from K0 to K1, the equilibrium point will change, for example, from
situation A to B, implying a reduction in the use of intermediate consumption and an
increase in employment. Overall, this new rearrangement of variable factors would lead
to a reduction in the company’s variable production costs, which in turn would imply a
shift of the isocost towards the origin. The change in the isocost value would, in turn,
reduce the cost or the shadow price associated with the infrastructure.
Moreover, the elasticity of the variable cost with regards to the quasi-fixed input K is
given by:
lnK
K)x,lnD(y,
C
K
K
K)x,C(y,ε KC,
[24]
P
A
B
IC
L
ICB ICA
Y0 (K0)
Y0
(K1)
LB
LA

13
Logically, if C,K were zero, it would indicate that public capital on postal infrastructure
would have no impact on the variable costs of private companies wishing to access
them.
In short, with an input distance function it is possible to obtain useful information about
Correos’s technology (technical and allocative efficiency levels and scale economies of
the different production units operating in the postal sector) facilitates the correct
assessment of the value that operators give to accessing the postal network
infrastructure.
3. DATA
In order to carry out the objectives of this research we used the information facilitated
by the National Commission of the Postal Sector (Comisión Nacional del Sector
Postal) about the following cost units: in 2009 there are data about 49 rural offices, 544
urban offices and 962 delivery units, while in 2010 data on from 50 rural offices, 544
urban offices and 986 delivery units are available. As a result, we have a total of 3.135
observations from the years 2009 and 2010, distributed to 99 rural offices, 1.088 urban
offices and 1.948 delivery units.
Regarding the outputs, we classified them into five categories: ordinary inter-city
letters, certified inter-city letters, ordinary local letters, certified local letters, and money
orders and parcels. On the other hand, we consider three input variables: labor, transport
units and intermediate consumptions. Labor represents the number of full-time
equivalent employees in each office2. Transport units are the vehicles used in the
different cost units, obtained by dividing the transport cost of each office (fuel, repairs,
maintenance, insurance, etc.) between the average cost of mail delivery vehicles
(motorcycles, cars, vans and trucks). Intermediate consumptions refer to the expenditure
on repairs, preservation, maintenance and supply. In addition, we use a quasi -fixed
input given by the monetary value in the balance sheets of tangible and intangible fixed
assets for each office, as a proxy of the postal infrastructures. These inputs were
2 The information available has not allowed us its division into different categories.

14
elaborated on bases of the analytical accounting of Grupo Correos and its annual report.
In Table 1, we summarize the descriptive statistics of the inputs and outputs used in the
estimation of the distance function.
Table 1.- Descriptive Statistics
Years 2009-2010
Mean Median Maximum Minimum Standard
Dev.
Variable inputs:
Labor 20,43 10,91 474,09 0,46 39,59
Transport units 3,14 1,48 45,91 0,02 4,21
Intermediate consumptions (thousands of euros)
43,63 6,74 843,48 0,16 101,19
Quasi -fixed input
Postal infrastructures (thousands of euros)
676,09 350,09 8.771,12 0,13 842,9
Outputs:
Ordinary inter-city letter (thousands of units)
1.640,49 768,12 27.328,19 0,00 2.390,75
Certified inter-city letter (thousands of units)
59,23 30,13 883,57 0,96 84,31
Ordinary local letter (thousands of units)
290,32 182,20 6.723,71 0,00 792,10
Certified local letter (thousands of units)
20,83 2,30 603,14 0,00 52,88
Money orders and parcels (thousands of units)
3,27 1,61 47,73 0,05 5,12
4. METHODOLOGY AND ECONOMETRICS SPECIFICATION
According to equation [3] and assuming a Cobb-Douglas technology with multiple
outputs and inputs,3 and once we imposed the homogeneity of degree one in inputs (see
for example Coelli and Perelman, 2000), the econometric specification of the stochastic
distance frontier would be defined as:
3 In an attempt to capture the complex postal sector technology as precisely as possible, we have
considered a large number of variables (five outputs and two inputs). By doing so, and given we use a
Bayesian approach to estimate the model, is not feasible to test the validity of the Cobb-Douglas over the
Translog functional form.

15
−𝐿𝑛𝑋𝑛1𝑡 = 𝛽0 + ∑ 𝛽𝑖𝐿𝑛 (𝑋𝑛𝑖𝑡
𝑋𝑛𝑙𝑡) + ∑ 𝛼𝑖𝐿𝑛𝑌𝑛𝑖𝑡 + ∑
𝑖𝐶𝐶𝐴𝐴𝑖 +19
251
32 ∑ 𝑖𝑃𝑜𝑝𝑢𝑙𝑎𝑡𝑖𝑜𝑛𝑖 +3
2
𝛾𝑖 ln 𝐾𝑛𝑡 + v𝑛𝑡 − u𝑛𝑡 [25]
Where n =1,…,N is cost center unit; t =2009, 2010 is time; X is the vector of inputs
(X=1, … 3); Y the vector of outputs (Y=1, … 5) and K is the postal infrastructure
(quasi-fixed input). In addition to the inputs and outputs, we included two additional
variables into the last equation: CCAA is a dummy that gathers specific characteristics
of each autonomous community while Population is an artificial variable that refers the
population served by a postal office. In this way, Population1 indicates a population
served greater than 50,000 inhabitants; Population2 indicates a population between
5,000 and 50,000 inhabitants and Population3 a population less than 5,000 inhabitants.
Finally, unt represents the degree of the technical efficiency, unt N+
(0, σu2); and vnt is
the term of random perturbation that follows the distribution vnt N(0, σv2). The
expression [25] is the function to be estimated. In addition, in this study we propose the
application of the model developed by Hadri (1999), where the error component vnt is
normally distributed with the mean equal to zero and variance σvnt2 , the latter depending
on a vector of explicative variables z. That is to say:
σvnt2 = g(z,) [26]
where δ is a vector of parameters to estimate. This specification permits to model an
error of non-constant variance (with heteroskedasticity) as a function of a set of
variables, which is considered the most appropriate in response to the large difference
in the sample observation, which includes postal cost centers of diverse size and
production specialization. According to equation [26] we assume that σvnt2 depends on
several variables. Concretely, we are interested in analysing the relationship between
heteroskedasticity, time and type of office as follows:
Ln σvnt2 = 0 + 1 𝐷𝑦𝑒𝑎𝑟 + 2𝐷𝑡𝑦𝑝𝑒 𝑜𝑓 𝑜𝑓𝑓𝑖𝑐𝑒 [27]
where Dyear (2009 or 2010) and Dtype of office (rural, urban or delivery) are dummies.

16
In summary, this work proposes the estimation of the system of equations [25] and [27]
which will be resolved jointly with the objective of calculation of the technical
efficiency in the Spanish postal sector. The estimation of the system [25-27] will allow
us to calculate the indices of the technical efficiency (TE) for each cost center
(production unit) in each period through the following expression:
TEnt = exp (- unt) [28]
In this way, we ensure that 0 < TEnt ≤ 1. So, if TEnt takes the value one the cost center
works on the production frontier and is technically efficient, whereas if it reaches a
value lower than one it implies that it incurs inefficiency. The more distant the TEnt
index is from unity, the more technically inefficient the analyzed production unit will
be.
5. EMPIRICAL RESULTS
Equations [25-27] have been simultaneously estimated by using a Bayesian approach.
This methodology combines prior information about the parameters of interest with the
observed information contained in the data and then, using the Bayes theorem, it leads
to the posterior distributions of the parameters. Therefore, firstly we should assign prior
distributions for the parameters introduced in the input distance model (25). The
distribution assumed for the , , , and parameters are multivariate normal, i.e.
N(0, ), where 0 is a vector of zero means and −1, the inverse of the variance, is a
precision diagonal matrix with priors set to 0.0001 for all coefficients. Besides, these
distributions should be truncated to take into account the regularity conditions.
Regarding the inefficiency term ui, we suppose it follows a half-normal distribution
(Aigner et. al. 1977), uN N+(0, ), with a gamma distribution for
-1 G(1,1/37.5), as
van den Broeck et al. or Griffin and Steel (2007) detail. Finally, given the specification
for our idiosyncratic error term vN2 and according to (27), we impose a normal
distribution for the parameters, N(0, ).
17
To proceed with the Bayesian inference, the model was run using the WinBUGS
package, which implements Markov Chain Monte Carlo (MCMC) techniques. For our
application, the MCMC algorithm involved 200,000 iterations where the first 20,000
were discarded in a burn-in phase, and the chain was thinned every 8 draws in order to
remove autocorrelations. The means of the parameters of the input distance function and
their 95% confidence intervals are presented in Table 2. Given that the variables have
been previously divided by their geometric mean, first order parameters in Table 2 show
the elasticity of the distance function at the sample mean. All input and output
coefficients are significant and have the expected sign, thus the estimated distance
function satisfies the theory’s requirements (decreasing outputs and non-decreasing
inputs).
Once the model is estimated, it is possible to discover useful features of technology
such as the elasticity of scale. Applying equation [4] and using the coefficients shown
on Table 2, elasticity of scale features a value of 1.048. This would indicate that the
production technology of Correos’ postal services in Spain presents increasing returns
to scale.
On the other hand, and in an attempt to capture the influence of the environmental
factors on the technology we have included the artificial variable “Autonomous
Communities”, defining a dummy variable which would reflect unobservable and time
invariant aspects specific for each region, such as its specific orography and
geographical situation. Also, regarding the Autonomous Communities dummies
included in equation (30), it must be stated that the region of Andalusia was eliminated.
Therefore, the estimated coefficients shown in Table 2 indicate each region’s position
with regards to the reference point.
Moreover, and regarding the population dummies, Table 2 presents the coefficients of
the population served less than 50,000 inhabitants (Population2; Population3) versus
population greater than 50,000 inhabitants (Population1), used as a reference variable.
Both coefficients are positive and significant, indicating that the centers with lower
population to serve appear to be the most efficient. This can be explained if we take into
account that the centers with more population served use more resources to do so.

18
Therefore, it would not be accurate to claim higher inefficiency but a different and more
costly activity in terms of required resources.
As we have explained above, this paper follows the model proposed by Hadri (1999)
which assumes that the random error term (vnt) may be heteroskedastic due to both, time
and the different activity of every office due to several factors (for example, population
densities among others). Results shown in Table 2 lead us to deduce that the random
perturbation term suffers indeed from heteroskedasticity, which is explained by the type
of office (rural office, urban office or delivery center) and time. From the results we can
deduce the presence of heteroskedasticity, concretely the variance of the v error term is
a function of the type of office and time. As expected, units and urban offices have less
variance than rural offices. In consequence, we may infer the existence of a density
effect. That is to say, units and urban centers (with not very extensive but highly
populated distribution network) can perform their service better than rural offices (with
wider networks but less clientele). This introduces heteroskedasticity as a function of
the density. Moreover, according to the results, the variance of the random error term is
a negative function of time.
With regard technical efficiency (TE), the TE indexes for each cost unit is calculated
using the estimate of the distance function and applying the equation [28]. Figures 2, 3
and 4 show the TE values achieved by rural offices, urban units and delivery centers by
Autonomous Community, respectively. In all cases, the TE values are very close than
one (around 95%) which indicates high efficiency. Moreover, from Figure 5 which
analyses TE by region without distinguishing by type of center, we can also deduce that
there are not significant differences between the TE indexes by Autonomous
Communities.
On the other hand, Table 3 shows the joint comparative of the TE values (at the sample
mean) for the 1,580 Correos’ cost centers, including rural offices, urban offices and
delivery units in 2009 and 2010. The TE index values of all offices have a mean value
close to 0.95. In other words, this value indicates that, using the set of existing cost
centers as a reference point, it could be possible to reach their production levels cutting
resources by 5% (radial reduction of all inputs on 1/0.95).

19
Table 2. Input Distance Function Estimated
Variable Mean 2.50% 97.50%
Constant -0.1663 -0.1989 -0.1354
Variable Intputs
Ln (X2/X1) (Transport units/Labor) 0.1848 0.1627 0.2069
Ln (X3/X1) (Intermediate consumption /Labor) 0.0899 0.0655 0.1145
Outputs
Ln Y1 (ordinary inter-city letter) -0.6280 -0.7026 -0.5363
Ln Y2 (certified inter-city letter) -0.1508 -0.1823 -0.1175
Ln Y3 (ordinary local letter) -0.0718 -0.0894 -0.0518
Ln Y4 (certified local letter) -0.0055 -0.0129 -0.0021
Ln Y5 (money orders and parcels) -0.0975 -0.1132 -0.0821
Quasi-fixed input
Ln K (tangible fixed and intangible assets) 0.1346 0.09081 0.1794
Autonomous Community
ARAGON -0.0160 -0.0597 0.0277
ASTURIAS -0.0493 -0.0942 -0.0051
BALEARIC ISLANDS -0.1170 -0.1594 -0.0743
BASQUE COUNTRY 0.0092 -0.0278 0.0468
CANARY ISLANDS -0.2534 -0.2888 -0.2181
CANTABRIA -0.0287 -0.0865 0.0280
CASTILE AND LEÓN -0.0179 -0.0521 0.0165
CASTILE-LA MANCHA 0.0966 0.0638 0.1288
CATALONIA -0.0498 -0.0736 -0.0265
CEUTA -0.2127 -0.4611 0.0334
EXTREMADURA 0.0642 0.0241 0.1034
GALICIA -0.0528 -0.0840 -0.0216
LA RIOJA -0.0020 -0.0706 0.0673
MADRID -0.1953 -0.2257 -0.1657
MELILLA -0.2697 -0.5160 -0.0224
MURCIA -0.0135 -0.0558 0.0295
NAVARRA 0.0186 -0.0383 0.0767
VALENCIA 0.0069 -0.0200 0.0341
Population
5,000 inh. < Population2 < 50,000 inh. 0.2119 0.1861 0.2380
Population3 < 5,000 inhabitants 0.1179 0.0781 0.1576
Estimation of the heteroskedastic model for the Ln ( 2
v )component
Constant 0.5563 0.3836 0.6861
Type of office -0.0188 -0.0246 -0.0130
Year -0.0002 -0.0003 -0.0001
Nº observations = 3.135

20
Figure 2.- Technical Efficiency Indexes (Rural Offices) by Autonomous Community
Figure 3.- Technical Efficiency Indexes (Urban Offices) by Autonomous Community
0.00 0.10 0.20 0.30 0.40 0.50 0.60 0.70 0.80 0.90 1.00
Valencia
Navarre
Mucia
Madrid
La Rioja
Galicia
Extremadura
Catalonia
Castile- La Mancha
Castile and León
Cantabria
Canary Islands
Basque Country
Balearic Islands
Asturias
Aragon
Andalusia
0.00 0.10 0.20 0.30 0.40 0.50 0.60 0.70 0.80 0.90 1.00
Valencia
Navarre
Mucia
Madrid
La Rioja
Galicia
Extremadura
Catalonia
Castile- La Mancha
Castile and León
Cantabria
Canary Islands
Basque Country
Balearic Islands
Asturias
Aragon
Andalusia

21
Figure 4.- Technical Efficiency Indexes (Delivery Centers) by Autonomous Community
Figure 5. Technical Efficiency Indexes (all cost centers) by Autonomous Community
0.00 0.10 0.20 0.30 0.40 0.50 0.60 0.70 0.80 0.90 1.00
Valencia
Navarre
Mucia
Madrid
La Rioja
Galicia
Extremadura
Catalonia
Castile- La Mancha
Castile and León
Cantabria
Canary Islands
Basque Country
Balearic Islands
Asturias
Aragon
Andalusia
0.00 0.10 0.20 0.30 0.40 0.50 0.60 0.70 0.80 0.90 1.00
Valencia
Navarre
Mucia
Madrid
La Rioja
Galicia
Extremadura
Catalonia
Castile- La Mancha
Castile and León
Cantabria
Canary Islands
Basque Country
Balearic Islands
Asturias
Aragon
Andalusia

22
Table 3.- Technical Efficiency Indexes. Descriptive Statistics for all cost centers
(years 2009 and 2010).
Rural
Offices
Urban
Offices
Delivery
Centers
All
Offices
Mean 0.9539 0.9457 0.9478 0.9473
Median 0.9540 0.9464 0.9484 0.9478
Maximum 0.9616 0.9697 0.9835 0.9835
Minimum 0.9465 0.8895 0.9041 0.8895
Standard Deviation 0.0028 0.0072 0.0086 0.0082
Number of observations 99 1.088 1.948 3.135
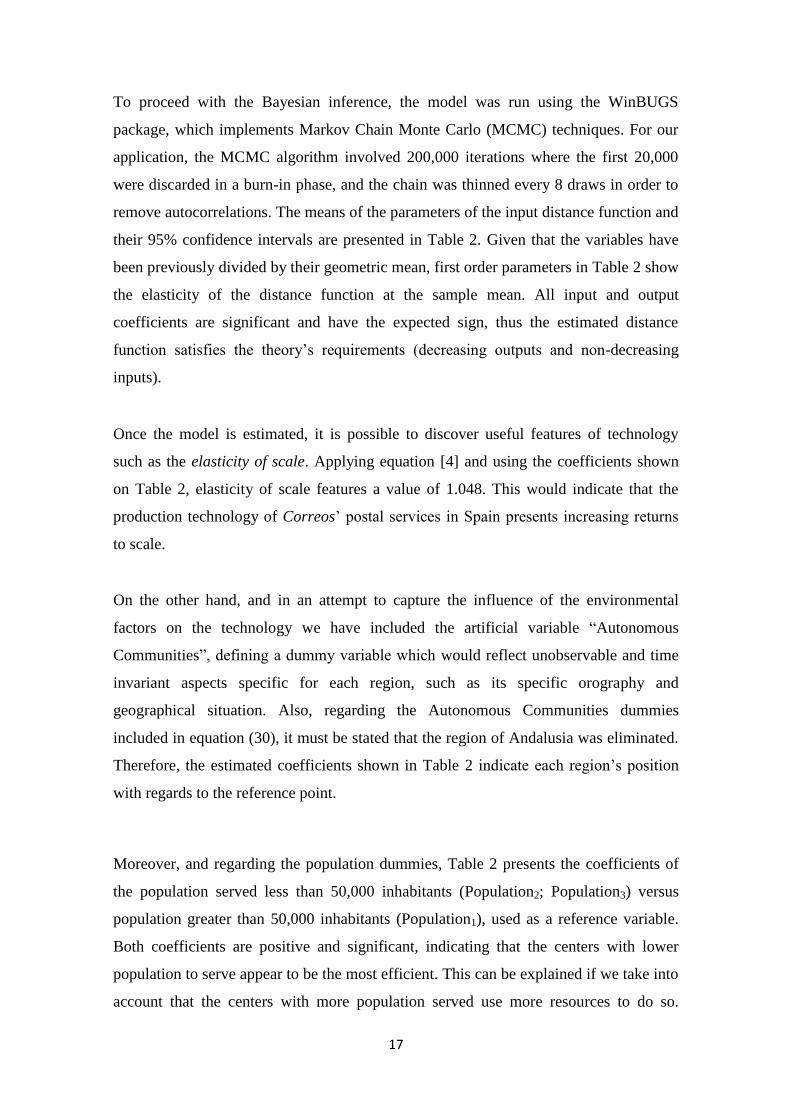
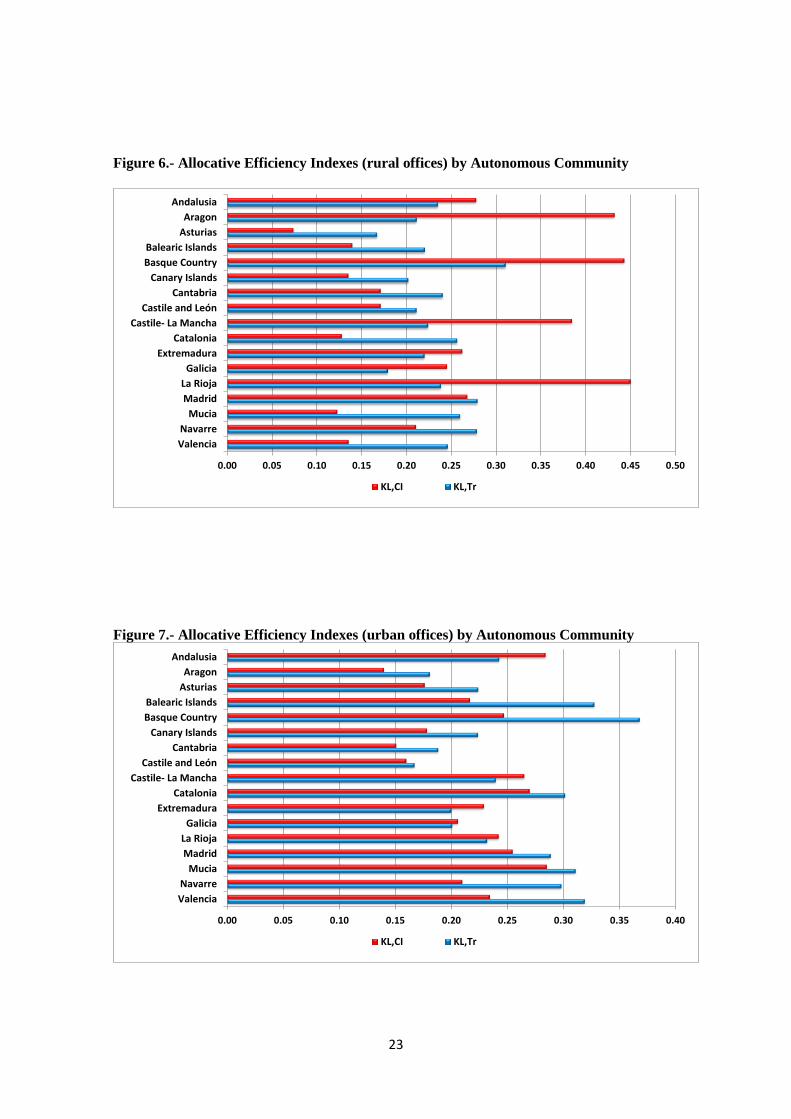
Regarding allocative efficiency (AE), Figures 6, 7, 8 and 9 show the results for the
allocative inefficiency indexes kij (see equation 11) of the rural offices, urban offices,
delivery centers and for all cost centers by Autonomous Communities, respectively.
More specifically, two types of indicators are shown. The first one (kL, Tr) refers to how
cost centers assign the labor factor (L) in relation to the transport elements (Tr). The
second one, kL , CI, reflects the production units allocation of labor (L) in terms of
intermediate consumption (IC).
Regarding the use that all cost centers (rural, urban and delivery centers) make of
transport elements and intermediate consumption, we see that all KL, TR and KL, CI values
are less than one, which denotes that the labor factor is used beyond its optimal
proportion. However, there is an exception to this result. According to Figure 8 Madrid
could be overusing intermediate consumption input with regard to labor (kL,CI greater
than one). However, it is necessary to consider that this kL,CI value for Madrid is very
close to one (the allocative efficiency value), as Figure 9 also shows. Similarly,
Catalonia, Valencia, Navarra and Basque Country have kL,CI values close to the efficient
level. Another finding from Figure 8 is that delivery centers have better allocative
efficiency levels (closer than one) than the other types of cost centers.
23
Figure 6.- Allocative Efficiency Indexes (rural offices) by Autonomous Community
Figure 7.- Allocative Efficiency Indexes (urban offices) by Autonomous Community
0.00 0.05 0.10 0.15 0.20 0.25 0.30 0.35 0.40 0.45 0.50
Valencia
Navarre
Mucia
Madrid
La Rioja
Galicia
Extremadura
Catalonia
Castile- La Mancha
Castile and León
Cantabria
Canary Islands
Basque Country
Balearic Islands
Asturias
Aragon
Andalusia
KL,CI KL,Tr
0.00 0.05 0.10 0.15 0.20 0.25 0.30 0.35 0.40
Valencia
Navarre
Mucia
Madrid
La Rioja
Galicia
Extremadura
Catalonia
Castile- La Mancha
Castile and León
Cantabria
Canary Islands
Basque Country
Balearic Islands
Asturias
Aragon
Andalusia
KL,CI KL,Tr

24
Figure 8.- Allocative Efficiency Indexes (Delivery Centers) by Autonomous Community
Figure 9.- Allocative Efficiency Indexes (all cost centers) by Autonomous Community
Finally, Tables 4 and 5 summarize the main descriptive statistics of the allocative
efficiency indexes (KL,Tr, KL,CI ) by cost center. On average, the degree of detected
allocative inefficiency is similar between rural and urban offices, and it improves when
0.00 0.20 0.40 0.60 0.80 1.00
Valencia
Navarre
Mucia
Madrid
La Rioja
Galicia
Extremadura
Catalonia
Castile- La Mancha
Castile and León
Cantabria
Canary Islands
Basque Country
Balearic Islands
Asturias
Aragon
Andalusia
KL,CI KL,Tr
0.00 0.10 0.20 0.30 0.40 0.50 0.60 0.70 0.80 0.90 1.00
Valencia
Navarre
Mucia
Madrid
La Rioja
Galicia
Extremadura
Catalonia
Castile- La Mancha
Castile and León
Cantabria
Canary Islands
Basque Country
Balearic Islands
Asturias
Aragon
Andalusia
KL,CI KL,Tr

25
we consider delivery units. However, we must conclude that the magnitude of the
calculated allocative efficiency indexes should alert us because estimated allocative
efficiency indexes show that Correos’ cost centers units in Spain are far from using the
input combinations in order to minimize production costs, especially considering the
volume of their staff.
Table 4.- Allocative Efficiency (KL,Tr) Indexes.
Descriptive Statistics for all cost centers (years 2009 and 2010).
Rural
Offices
Urban
Offices
Delivery
centers
Mean 0.2296 0.2528 0.3558
Median 0.2261 0.2769 0.3564
Maximum 0.3745 0.6260 1.1781
Minimum 0.1271 0.0380 0.0420
Standard Deviation 0.0426 0.1099 0.0916
Number of observations 99 1.088 1.948
Table 5.- Allocative Efficiency (KL,CI) Indexes.
Descriptive Statistics for all cost centers (years 2009 and 2010).
Rural
Offices
Urban
Offices
Delivery
centers
Mean 0.2785 0.2427 0.6417
Median 0.1846 0.2223 0.2704
Maximum 1.6303 1.3638 2.9660
Minimum 0.0368 0.0324 0.0394
Standard Deviation 0.2636 0.1326 0.6641
Number of observation 99 1.088 1.948
Additionally, this research presents an economic model to assess the effect of postal
infrastructures on the operators’ costs. The positive sign of the quasi-fixed coefficient
indicates that Correos’ current postal network infrastructure leads to savings on the
variable costs of its production units. If we accept that different operators share
Correos’ productive technology, their gaining access to its postal network would be
beneficial. As we have explained above, once the input distance function has been
estimated, it is possible to calculate the shadow price of quasi-fixed input capital. To do
so, just multiply the coefficient previously obtained from the input distance function

26
given by expression lnK
K)x,lnD(y,
by the ratio variable cost/infrastructure stock
following equation [23].
In the event that a market dealer would like access Correos’ postal network, and since it
would be easier for the regulator to know the company’s variable costs than its fixed
value, in order to approximate the "toll" of network usage we should multiply the
estimated coefficient of equation [25] by the variable costs of the operator. That is, if
C denotes the operator’s annual variable cost, the amount to be demanded each year for
granting access to the postal network would be, in monetary terms:
CC
lnK
K)x,lnD(y, [29]
Equation [29] might be applied to any Correos’ cost center or to any other postal
operator wishing to use Correos’ current postal network infrastructure. Moreover, it
should be interpreted as the true valuation (shadow price) done by companies
(operators) of those infrastructures.
In this way, from estimated coefficients the shadow evaluation of the cost to access the
postal network has been quantified annually at an average of 13.46 % of the variable
costs of each operator willing to use Correos’ postal network.
6. CONCLUSIONS
In this paper technology of the Sociedad Estatal Correos y Telégrafos sector has been
analysed. Concretely, we have analyzed economic efficiency (technical and allocative)
and scale economies of the Correos’ units of production. To do this, we have employed
a methodology based of an input distance. Moreover, applying duality theory, we have
also developed an economic model to assess the effect of postal infrastructures on the
operators’ costs. To this aim, we have taken into account 1,580 cost centers, analyzed
between 2009 and 2010. In order to estimate econometrically the distance function, we
have considered five types of outputs: ordinary or certified inter-city letters, ordinary or

27
certified local letters, money orders and parcels. We have also used for the estimation
three variables factors of production: labor, transport elements, intermediate
consumption and the postal infrastructure as a quasi-fixed input. In order to carry out
the estimation, bayesian econometrics techniques have been applied. This method has
been revealed superior to the frequently applied classical maximum likelihood statistics,
since this method considers unknown parameters as random variables, specified as prior
distributions.
In the estimation of the distance function we have also considered the importance of the
population served and of the environmental factors in the provision of services. The
obtained results state that the centers with lower population -population to serve less
than 50,000 inhabitants -appear as technically more efficient. This can be explained by
the fact that precisely the centers that have to face with more population are those that
would need more resources in order to serve it. As a result, it would not be rigorous to
speak about greater inefficiency in this case but about a more costly activity in terms of
the employed factors, a circumstance that should be taken into account by the market
regulator.
Moreover, from the results we have contrasted the presence of increasing returns to
scale in the production technology in the Correos’ cost centers. More specifically, we
estimated an average elasticity of scale equal to 1.048. On the other hand, the
comparison of the different cost centers under study manifests that, on average, the
different offices share similar indicators of technical efficiency (around 95%).
In addition to the calculation of the index of technical inefficiency, we were able to
estimate if the different offices use optimally their factors of production from the
perspective of the costs. In this regard, from the measurement of the allocative
efficiency we deduce that, on average, the factor labor is systematically over employed
in relation to other production inputs, transport elements and intermediate consumption.
Madrid delivery unit is the sole exception because, unlike other centers, it overuses the
intermediate consumptions variable with regard labor. Also, we have contrasted that, on
average, the detected degree of the allocative inefficiency is similar between the rural

28
and urban offices, being the situation improved in the case of delivery units. In short,
the magnitude of the computed indices of allocative inefficiency allow us to conclude
that the units of Correos are still quite far away from operating with the possible
minimum costs of production.
Finally, the exploitation of the duality between the cost function and the distance
function has allowed us to measure the relevance of the access to the postal
infrastructures network regarding certain economic variables, especially in terms of
production costs. The results have confirmed that stock of postal infrastructures (postal
network) positively affects the production levels of the operators. Furthermore, we have
presented a theoretical model that provides an easily applicable rule to approximate the
monetary value that should be charged annually to each operator willing to use Correos’
postal network.

29
7. REFERENCES
Aigner, D., Lovell, K. and Schmidt, P. (1977): “Formulation and estimation of
stochastic frontier production function models”, Journal of Econometrics, 6, pp. 21-37.
Borenstein, D., Becker, J. L. and Prado V. J. (2004): “Measuring the efficiency of
Brazilian post office stores using data envelopment analysis”, International Journal of
Operations and Production Management, 24 (10), pp. 1055-1078.
Bradley, M., Colvin, J. and Perkins, M. (2006): “Measuring scale and scope economies
with a structural model of postal delivery”, Working Paper Series in Economics nº 195,
University of Lüneburg.
Cazals, C., Florens J. P. and Soteri, S. (2005): “Delivery costs for postal services in the
UK: some results on scale economies with panel data”, in M.A. Crew y P.R.
Kleindorfer (eds): Regulatory and Economic Challenges in the postal and delivery
sector, Kluwer Academic Publishers, Boston, MA, pp. 203-212.
Cazals, C., Dudley, P., Florens, J. P. and Rodriguez, F. (2008): "Delivery offices cost
frontier: a robust non parametric approach with exogenous variables", The Review of
Network Economics, 7(2), pp.294-308.
Cazals, C., Dudley, P., Florens, J. P. and Jones, M. (2011): “The effect of unobserved
heterogeneity in stochastic frontier estimation: comparison of cross section and panel
with simulated data for the Postal”, The Review of Network Economics, 10(3), pp. 1-22.
Coelli. T. and Perelman, S. (2000): “Technical efficiency of European railways: A
distance function approach”, Applied Economics, 32(15), pp. 1967-1976.
Cohen, R. H. and Chu, E. H. (1997): “A measure of scale economies for postal
systems”, in M.A Crew and P.R. Leindorfer (eds): Managing change in the postal and
delivery industry, Kluwer Academic Publishers, Boston, MA, pp. 115-132.
D´Alcantara, G. and Amerlynck, B. (2006): “Profitability of the universal service postal
provider under entry with economies of scale in collection”, in M.A. Crew and P. R.
Kleindorfer (eds): Progress toward liberalization of the postal and delivery sector,
Springer, New York, pp. 39-58.

30
Deprins, D., Simar, L. and Tulkens, H. (1984): “Measuring labor-efficiency in post
offices”, in M. Marchand, P. Pestieu and H. Tulkens (eds): The performance of public
enterprises: concepts and measurement, North-Holland, Amsterdam. pp. 243-267.
Escribano, A., González, P. and Lasheras, J. (2003): “Regulación y análisis económico
del servicio postal en España”, Información Comercial Española, 808, pp. 161-188
Escribano, A., González, P.; Lasheras, J. (2004): “Evolution and Analysis of the Market
Structure of Postal Services in Spain”, in M.A. Crew and P. R. Kleindorfer (eds):
Competitive transformation of the postal and delivery sector, Springer, Massachusetts,
pp. 287-310.
Färe, R. and Grosskopf, S. (1990): “A distance function approach to price efficiency”,
Journal of Public Economics, 43, pp. 123-126.
Färe, R. and Primont, D. (1995): Multi-output production and duality: theory and
applications, Kluwer Academic Publishers, Boston, MA.
Farrell, M. J. (1957): “The measurement of productive efficiency”, Journal of the Royal
Statistical Society, Series A, General, 120, pp. 253-281.
Farsi, M., Filippini, M. and Trinkner, M. (2006): “Economies of scale, density and
scope in Swiss Post’s Mail Delivery”, Swiss Economics Working Paper 5.
Felisberto, C. (2013): “Liberalisation, competition and innovation in the postal sector”,
Empirical Economics, 44, pp. 1207-1434.
Filippini, M. and Koller, M. (2012 a): “Cost efficiency measurement in postal delivery
networks”, Quaderno 12-06, University of Lugano.
Filippini, M. and Koller, M. (2012 b): “Economies of scale and scope in postal outlets
under consideration of unobserved heterogeneity”, Annals of Public and Cooperative
Economics, 83(4), pp. 435-443
Filippini, M. and Zola, M. (2005): “Economies of scale and cost efficiency in the postal
services: empirical evidence from Switzerland”, Applied Economics Letters, 12, pp.
437-441.
Griffin, J. and Steel, M. (2007): “Bayesian stochastic frontier analysis using
WinBUGS”, Journal of Productivity Analysis, 27, pp. 163-173.
31
Griffin, J. and Steel, M. (2008): “Flexible mixture modelling of stochastic frontiers”,
Journal of Productivity Analysis, 29, pp. 33-50.
Hadri, K. (1999): “Estimation of a Doubly Heteroscedastic Stochastic Frontier Cost
Function”, Journal of Business Economics and Statistics 17 (3), pp. 359-363
Horncastle, A., Jevons, D., Dudley, P. and Thanassoulis, E. (2006): “Efficiency analysis
of delivery offices in the Postal Sector using Stochastic Frontier and Data Envelopment
Analysis”, in M. A. Crew and P. R. Kleindorfer (eds): Liberalization in the postal and
delivery sector, Edward Elgar, Cheltenham, UK and Northampton, MA, pp. 149-164.
Hunt, L. and Lynk. E. (1991): “An empirical examination of the case for post office
divestiture in the UK”, Scottish Journal of Political Economy, 38, pp. 177-191.
Iturralde, M. J. and Quiros, C. (2008): “Liberalización y eficiencia en el sector postal de
la Unión Europea”, Economía Industrial, 361, pp. 121-132
Koop, G., Osiewalski J. and Steel, M. (1997): “Bayesian efficiency analysis through
individual effects: hospital cost frontiers”, Journal of Econometrics 76, pp. 77-106.
Mizutani, F. and Uranishi, S. (2003): “The Post Office vs. Parcel Delivery Companies:
Competition effects on costs and productivity”, Journal of Regulatory Economics, 23,
pp. 299-319
Morales Piñero, J. (2009): Reforma de empresas públicas y su efecto en la eficiencia y
la eficacia: el caso de los servicios postales de España, Universitat Autònoma de
Barcelona.
Moriarty, R., Yorke, S., Harman, G., Cubbin, J., Meschi, M. and Smith, P. (2006):
Economic analysis of the efficiency of Royal Mail Units and the implications for
Regulatory Policy, in M. A. Crew and P. R. Kleindorfer (eds): Liberalization in the
postal and delivery sector, Edward Elgar, Cheltenham, UK and Northampton, MA, pp.
165-182.
Palm, A. (1987): “La performance technique de Dix Huit-services postaux”, Annales de
L´ Economie Publique, Sociale et Cooperativa, 3, pp. 305-319.
Pateiro, C., García, J. M. and Barreiro, J. M. (2012): “Las dimensiones territoriales
urbana e interurbana de la liberalización del sector postal y cuestiones de ineficiencia
del acceso a la red”, Revista de Economía Pública Urbana, 17, pp. 79-105

32
Perelman, S. and Pestieu, P. (1994): “A comparative performance study of postal
services: a productive efficiency approach”, Annales d´Economie et de Statisque, 33,
pp. 187-202.
Register, C. A. (1988): “Technical efficiency within the US postal services and the
postal reorganization act of 1970”, Applied Economics, 20, pp. 1185-1197.
Rogerson, C. M., Takis, W. M. and Lenard, T. M. (1993): “Economies of scale and
scope and competititon in postal services”, in M. A. Crew and P. R. Kleindorfer (eds):
Regulation and the nature of postal delivery services, Kluwer Academic Publishers,
Boston, MA, pp. 109-132.
Shephard, R. W. (1953): Cost and Production Functions, Princeton University Press,
Princeton.
Shephard, R. W. (1970): Theory of Cost and Production Functions, Princeton
University Press, Princeton.
Van den Broeck, J., Koop, G., Osiewalski, J. and Steel, M. (1994): “Stochastic frontier
models: A Bayesian perspective”, Journal of Econometrics, 61, pp. 273-303.