Embed Size (px)
Citation preview
Estimating Readmission Rates using Incomplete Data: Implications for Two
Methods of Hospital Profiling
William J. O’Brien, Qi Chen, Hillary J. Mull, Ann Borzecki, Michael Shwartz, Amresh Hanchate, Amy K. Rosen
HERC Health Economics SeminarJuly 17, 2013
VA Boston Healthcare SystemCenter for Organization, Leadership and Management Research
1
Poll
What is your primary professional role?ResearcherClinicianQuality managerHospital administrationOther
2
Background• Readmission rates are reported on CMS and VA
Hospital Compare sites.
• CMS penalizes hospitals under the ACA’s Hospital Readmissions Reduction Program.
• Both potentially omit information about dual users.
• Purpose of study is to determine changes in VA readmission rates and hospital profiles after including Medicare fee-for-service records.
3
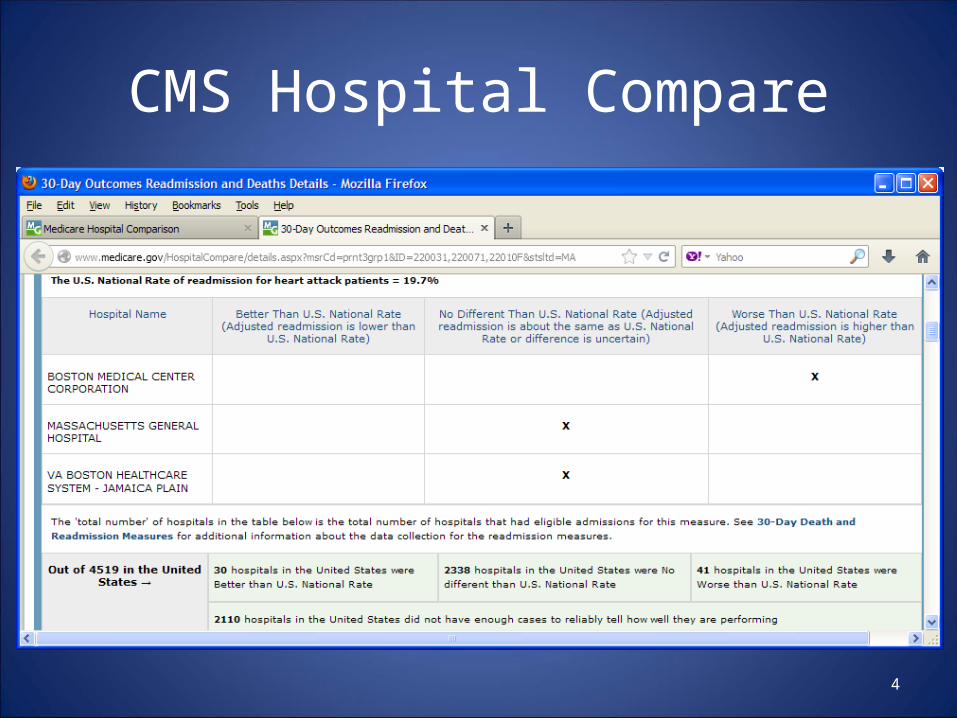
CMS Hospital Compare
4
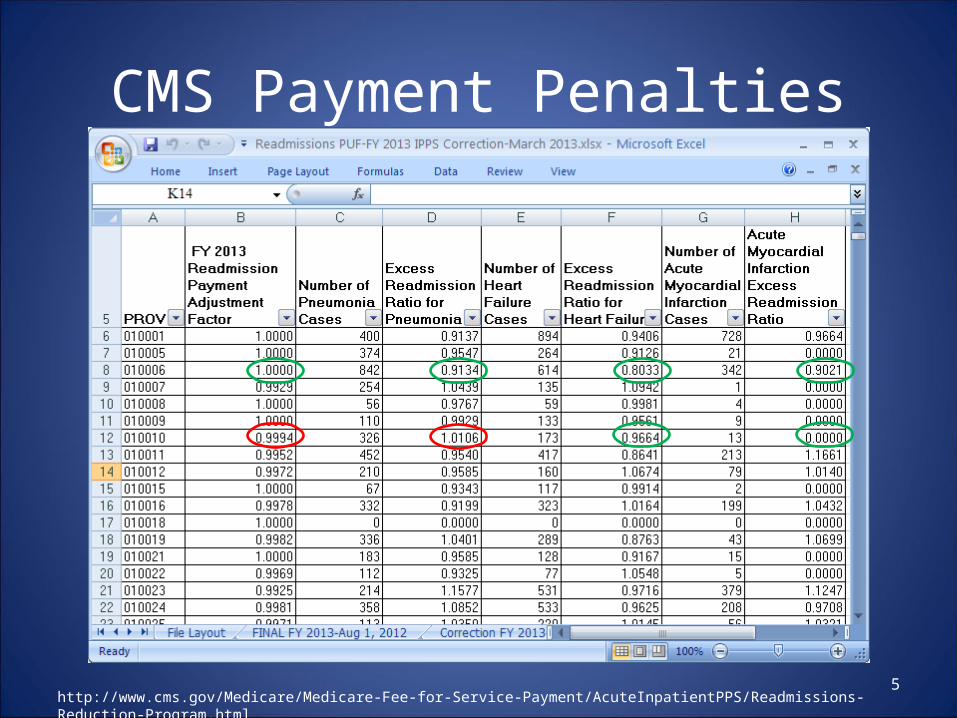
CMS Payment Penalties
5http://www.cms.gov/Medicare/Medicare-Fee-for-Service-Payment/AcuteInpatientPPS/Readmissions-Reduction-Program.html
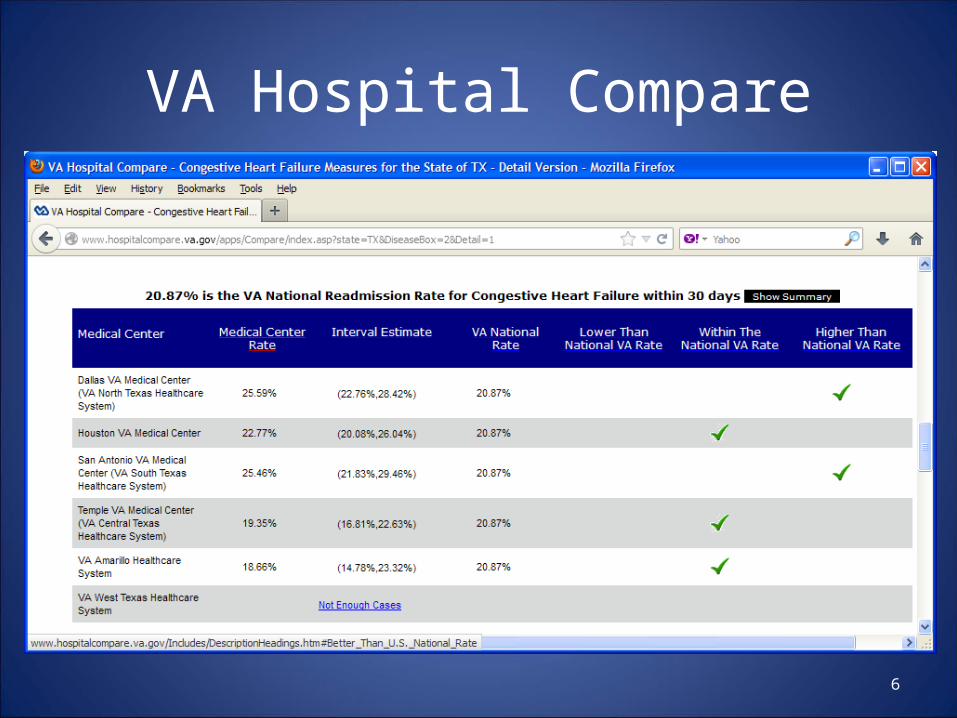
VA Hospital Compare
6
Poll
Do you know anyone who has used VA or CMS Hospital Compare to guide healthcare decisions?YesNo
7
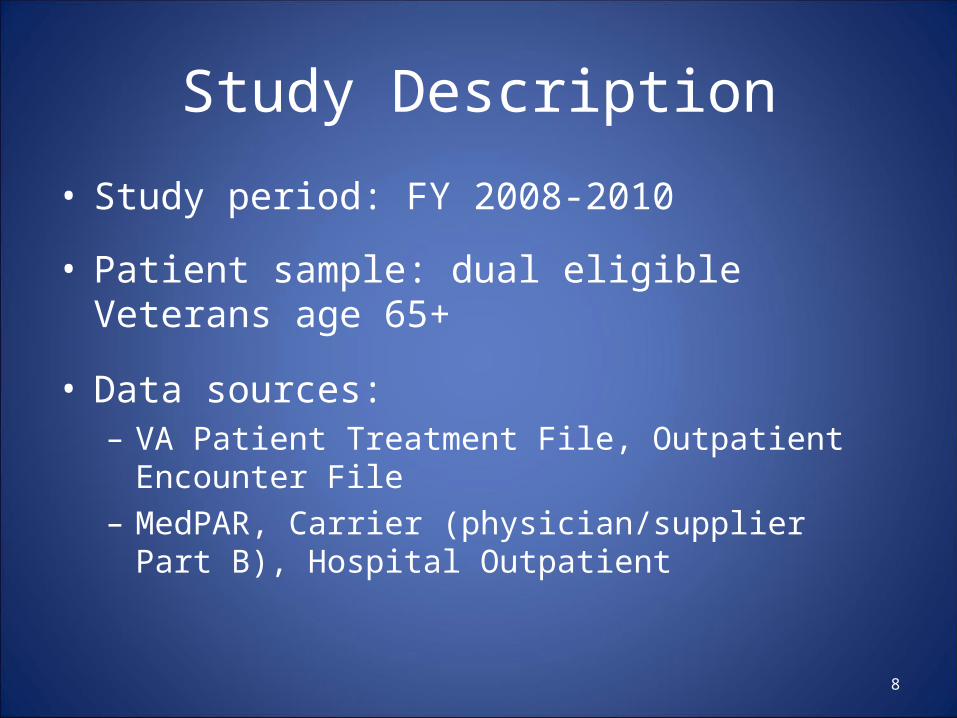
Study Description
• Study period: FY 2008-2010
• Patient sample: dual eligible Veterans age 65+
• Data sources: – VA Patient Treatment File, Outpatient Encounter File – MedPAR, Carrier (physician/supplier Part B), Hospital
Outpatient
8
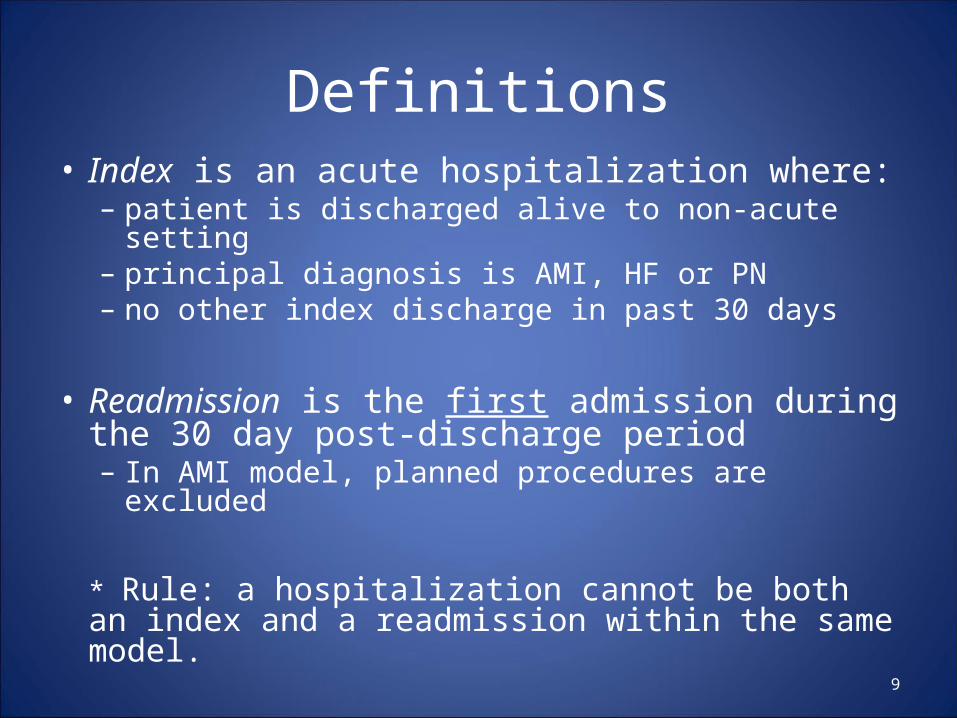
Definitions• Index is an acute hospitalization where:
– patient is discharged alive to non-acute setting– principal diagnosis is AMI, HF or PN– no other index discharge in past 30 days
• Readmission is the first admission during the 30 day post-discharge period– In AMI model, planned procedures are excluded
* Rule: a hospitalization cannot be both an index and a readmission within the same model.
9
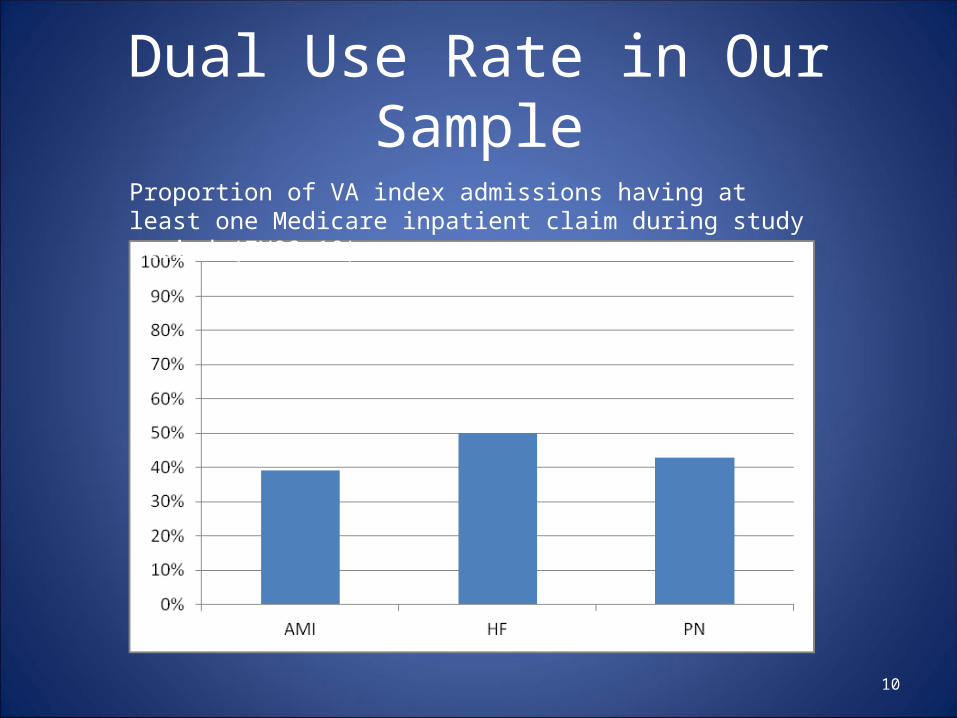
Dual Use Rate in Our Sample
10
Proportion of VA index admissions having at least one Medicare inpatient claim during study period (FY08-10).
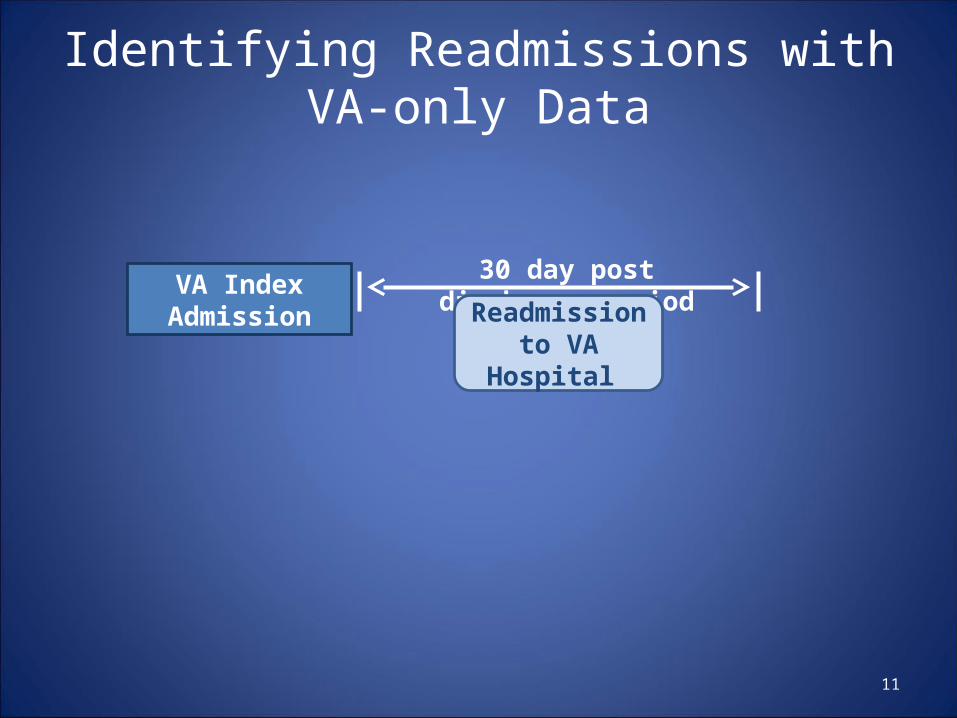
Identifying Readmissions with VA-only Data
11
VA Index Admission
30 day post discharge period
Readmission to VA Hospital
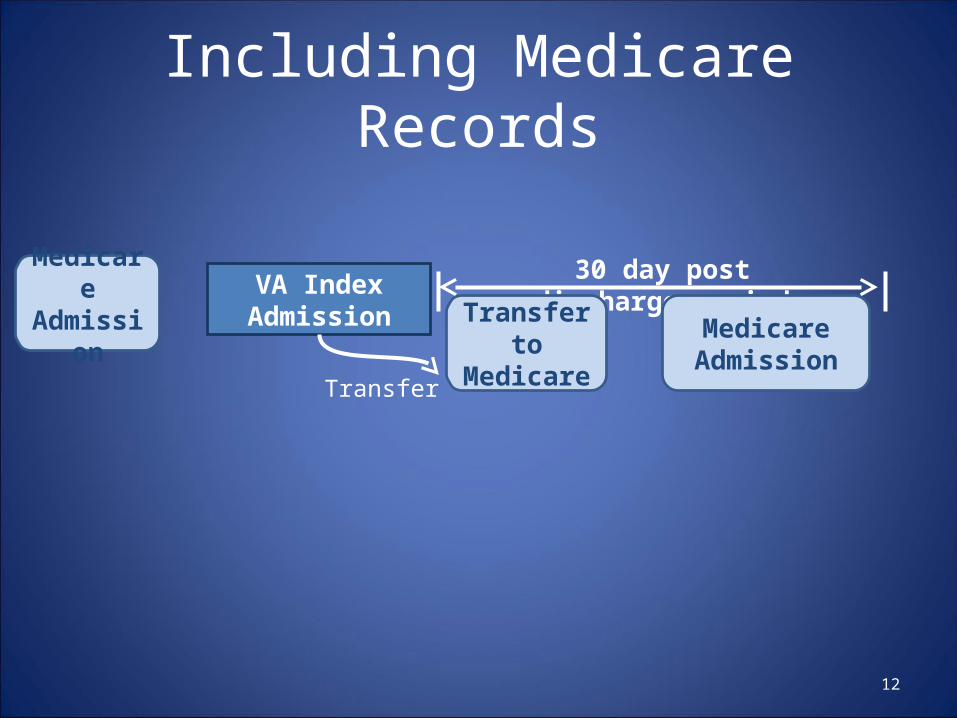
Including Medicare Records
12
VA Index Admission
30 day post discharge period
Medicare Admission
Medicare Admission Transfer to
MedicareTransfer
13
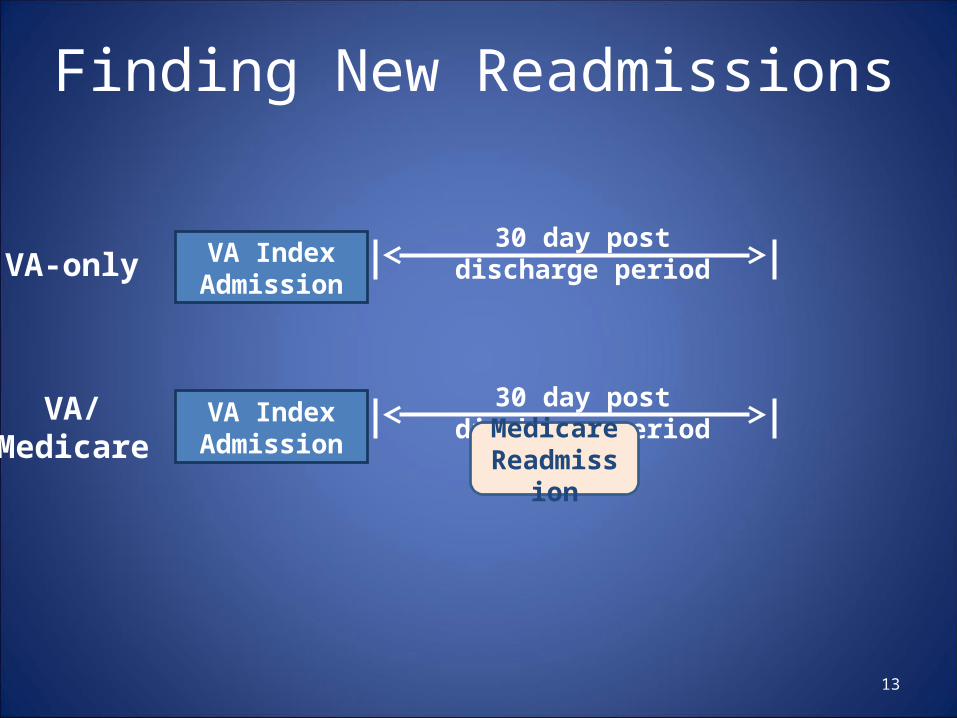
Finding New Readmissions
VA Index Admission
30 day post discharge period
VA Index Admission
30 day post discharge period
Medicare Readmission
VA-only
VA/Medicare
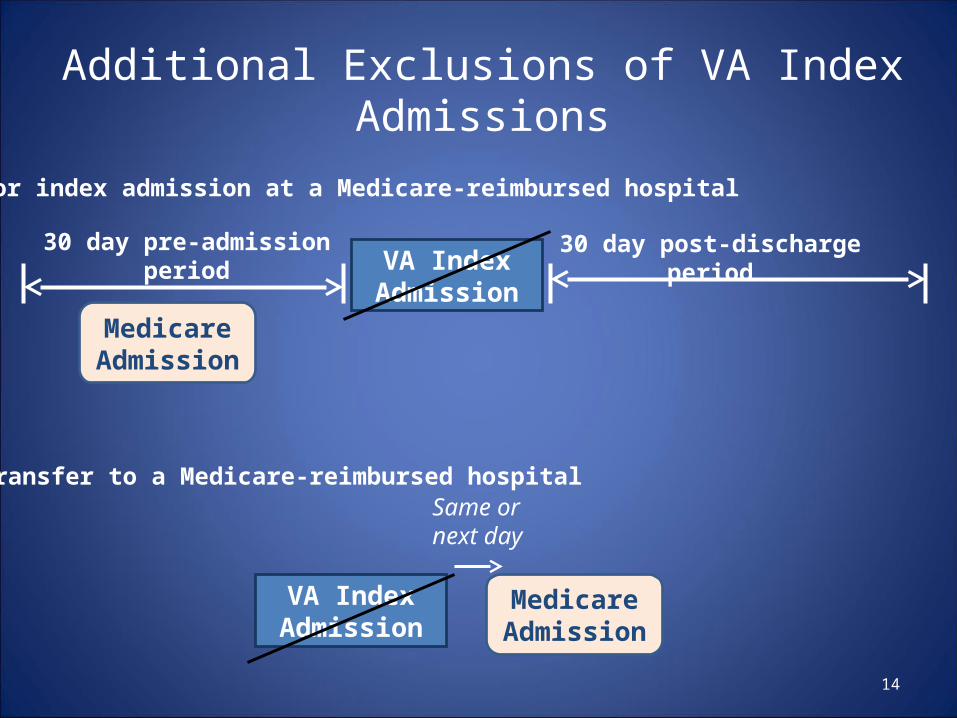
Additional Exclusions of VA Index Admissions
14
VA Index Admission
30 day post-discharge period
Medicare Admission
30 day pre-admission period
VA Index Admission
Medicare Admission
Same or next day
a. Prior index admission at a Medicare-reimbursed hospital
b. Transfer to a Medicare-reimbursed hospital
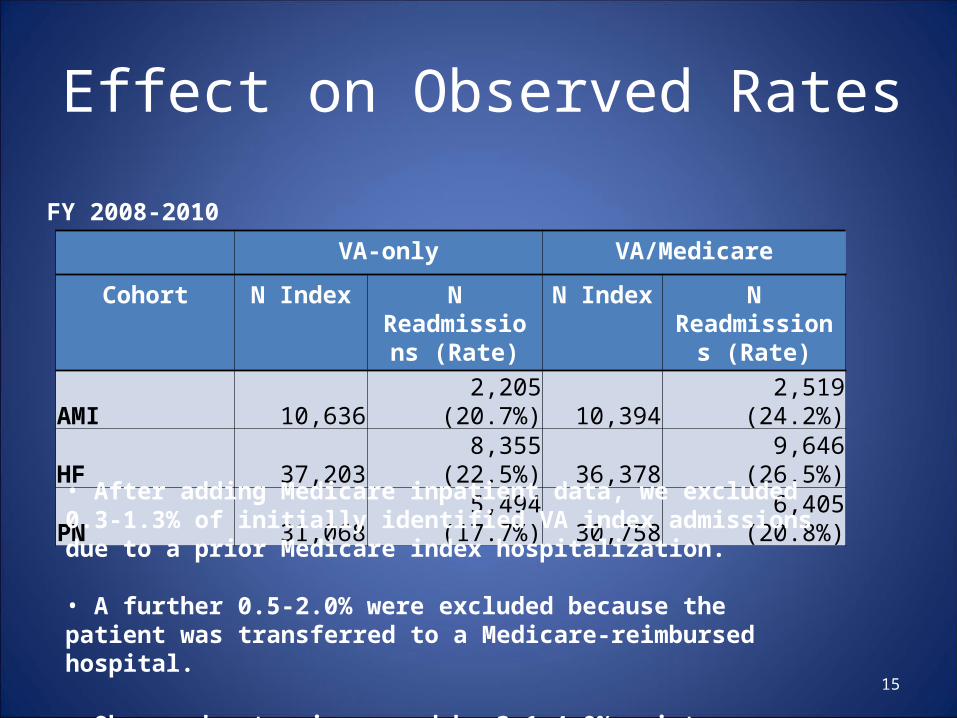
Effect on Observed Rates
15
VA-only VA/Medicare
Cohort N Index N Readmissions
(Rate)
N Index N Readmissions (Rate)
AMI 10,636 2,205 (20.7%) 10,394 2,519 (24.2%)HF 37,203 8,355 (22.5%) 36,378 9,646 (26.5%)PN 31,068 5,494 (17.7%) 30,758 6,405 (20.8%)
FY 2008-2010
• After adding Medicare inpatient data, we excluded 0.3-1.3% of initially identified VA index admissions due to a prior Medicare index hospitalization. • A further 0.5-2.0% were excluded because the patient was transferred to a Medicare-reimbursed hospital.
• Observed rates increased by 3.1-4.0% points.
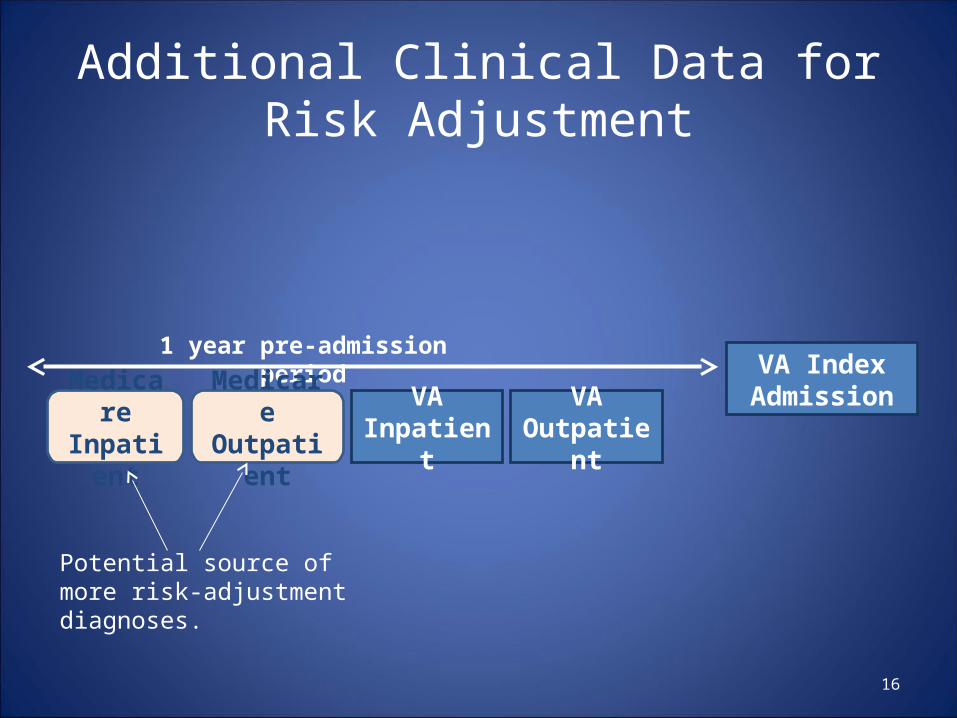
Additional Clinical Data for Risk Adjustment
16
VA Index Admission
1 year pre-admission period
Medicare Inpatient
Medicare Outpatient
VA Outpatient
VA Inpatient
Potential source of more risk-adjustmentdiagnoses.
Poll
Will the additional Medicare clinical data increase the prevalence of risk factors for readmission?Slight increaseSignificant increaseNo changeNot sure
17
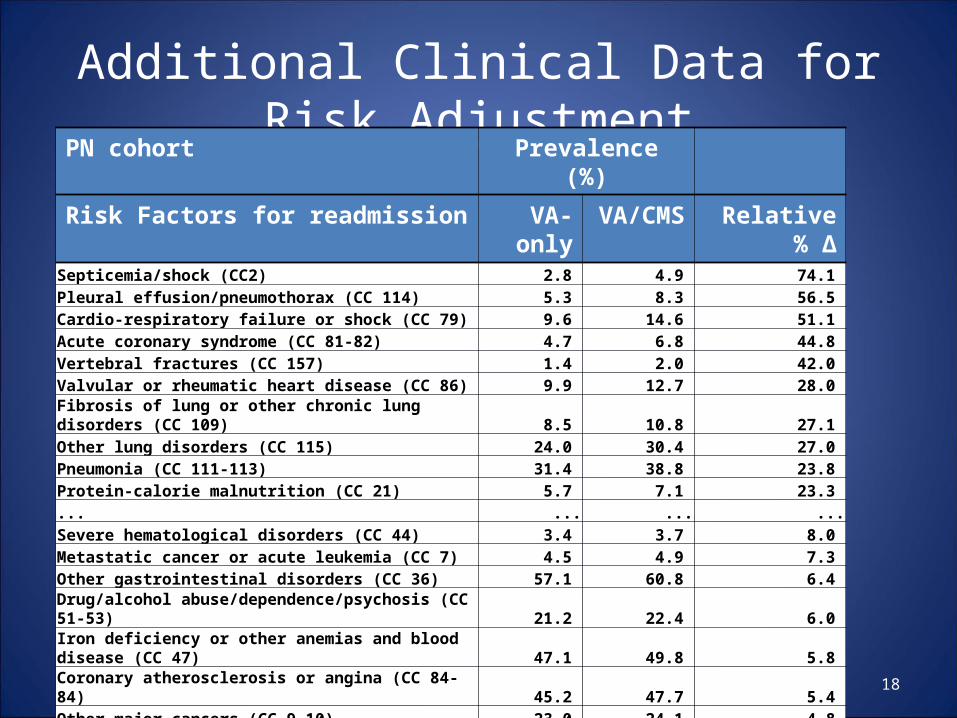
Additional Clinical Data for Risk Adjustment
18
PN cohort Prevalence (%)
Risk Factors for readmission VA-only VA/CMS Relative % ΔSepticemia/shock (CC2) 2.8 4.9 74.1 Pleural effusion/pneumothorax (CC 114) 5.3 8.3 56.5 Cardio-respiratory failure or shock (CC 79) 9.6 14.6 51.1 Acute coronary syndrome (CC 81-82) 4.7 6.8 44.8 Vertebral fractures (CC 157) 1.4 2.0 42.0 Valvular or rheumatic heart disease (CC 86) 9.9 12.7 28.0 Fibrosis of lung or other chronic lung disorders (CC 109) 8.5 10.8 27.1 Other lung disorders (CC 115) 24.0 30.4 27.0 Pneumonia (CC 111-113) 31.4 38.8 23.8 Protein-calorie malnutrition (CC 21) 5.7 7.1 23.3 ... ... ... ...Severe hematological disorders (CC 44) 3.4 3.7 8.0 Metastatic cancer or acute leukemia (CC 7) 4.5 4.9 7.3 Other gastrointestinal disorders (CC 36) 57.1 60.8 6.4 Drug/alcohol abuse/dependence/psychosis (CC 51-53) 21.2 22.4 6.0 Iron deficiency or other anemias and blood disease (CC 47) 47.1 49.8 5.8 Coronary atherosclerosis or angina (CC 84-84) 45.2 47.7 5.4 Other major cancers (CC 9-10) 23.0 24.1 4.8 Lung or other severe cancers (CC 8) 9.4 9.8 4.4 COPD (CC 108) 56.5 58.9 4.2 Diabetes mellitus (DM) or DM complications (CC 15-20, 119-120) 40.7 42.0 3.2
Risk-adjustment Models
19
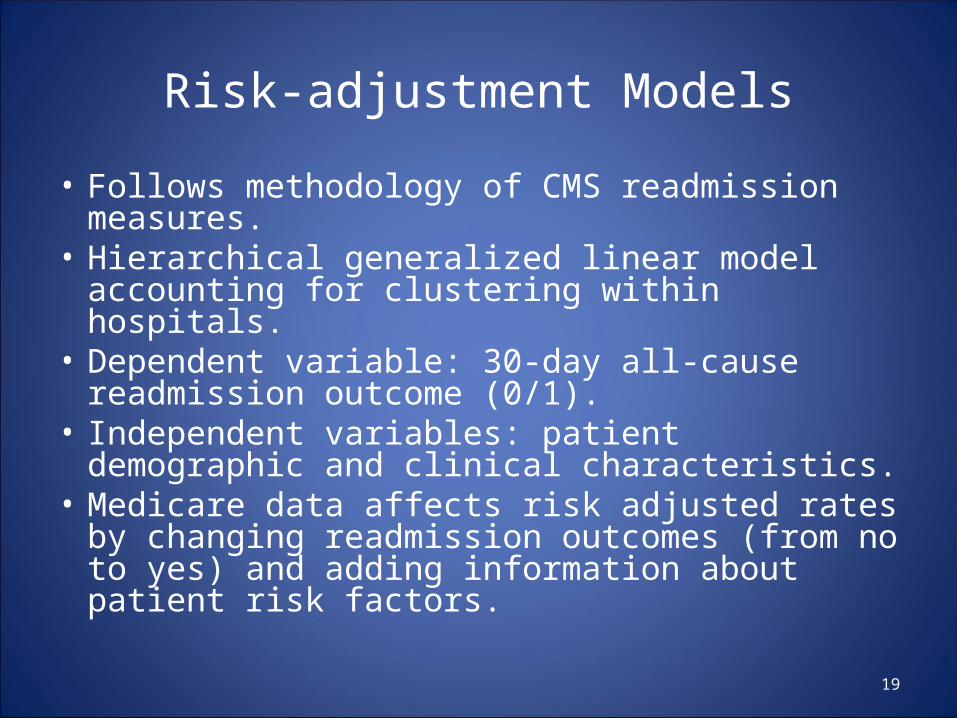
• Follows methodology of CMS readmission measures.
• Hierarchical generalized linear model accounting for clustering within hospitals.
• Dependent variable: 30-day all-cause readmission outcome (0/1).
• Independent variables: patient demographic and clinical characteristics.
• Medicare data affects risk adjusted rates by changing readmission outcomes (from no to yes) and adding information about patient risk factors.
Poll
What is the effect of the additional outcome and risk information on models’ predictive ability of 30-day readmission? Slight improvementSignificant improvement
No changeNot sure
20
Effect on Model Discrimination
21
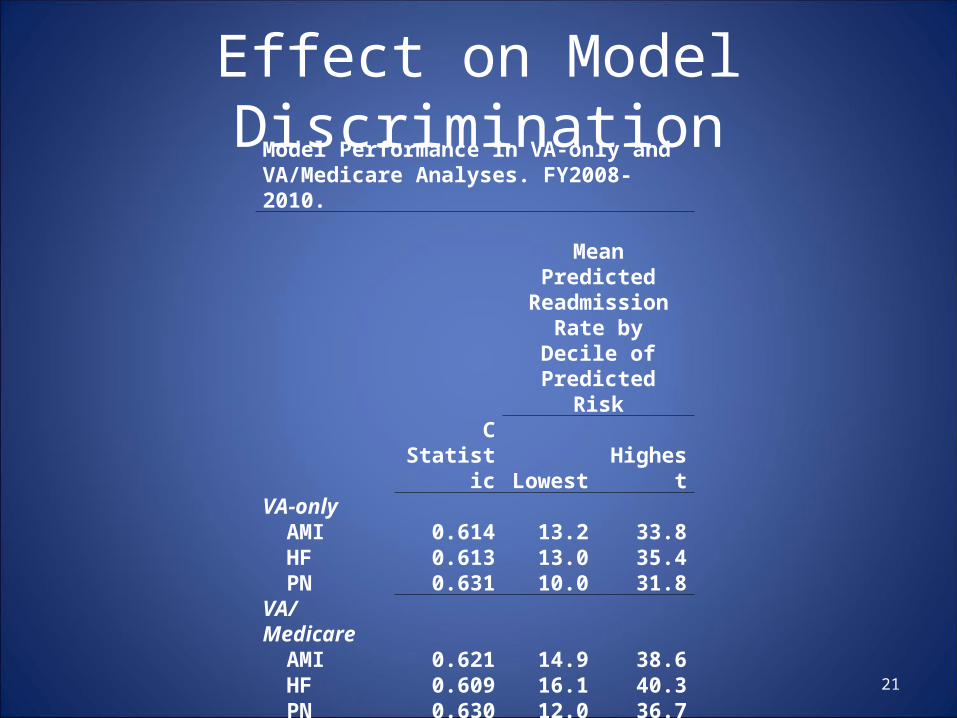
Model Performance in VA-only and VA/Medicare Analyses. FY2008-2010.
Mean Predicted Readmission Rate
by Decile of Predicted Risk
C Statistic Lowest HighestVA-only
AMI 0.614 13.2 33.8HF 0.613 13.0 35.4PN 0.631 10.0 31.8
VA/MedicareAMI 0.621 14.9 38.6HF 0.609 16.1 40.3PN 0.630 12.0 36.7
DifferenceAMI 0.007HF -0.004PN -0.001
AMI=acute myocardial infarction; HF=heart failure; PN=pneumonia
Output from Models: P/E Ratio
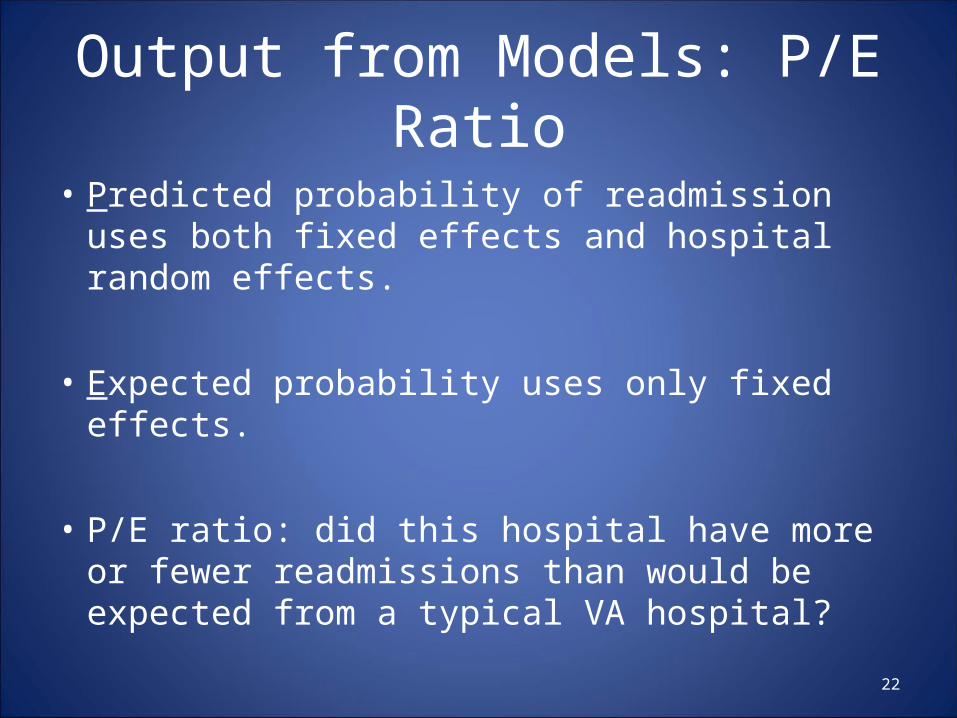
• Predicted probability of readmission uses both fixed effects and hospital random effects.
• Expected probability uses only fixed effects.
• P/E ratio: did this hospital have more or fewer readmissions than would be expected from a typical VA hospital?
22
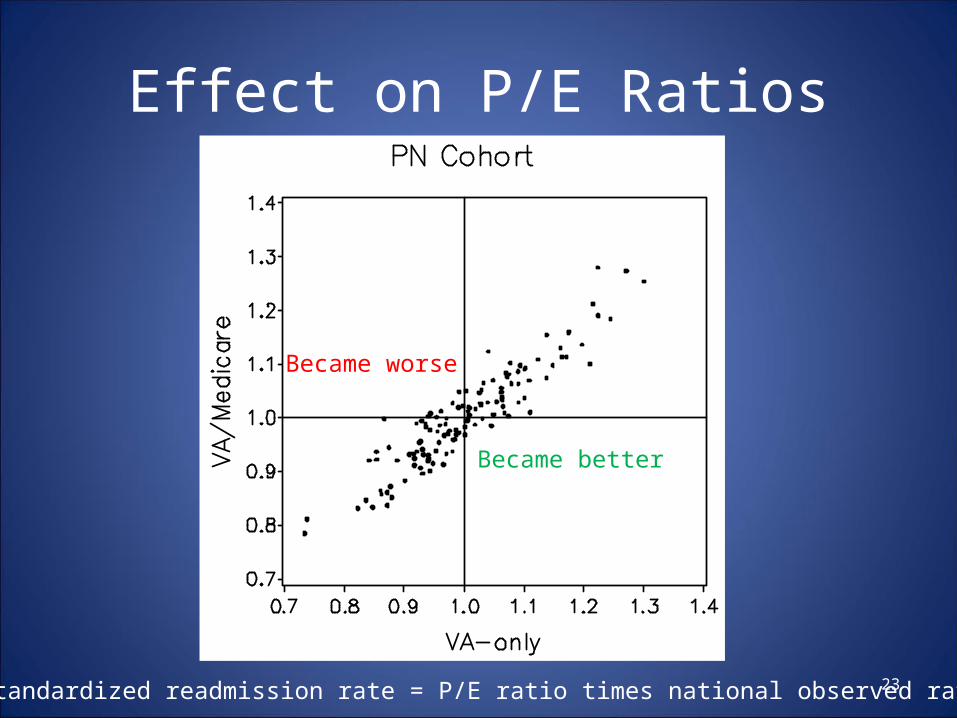
Effect on P/E Ratios
23* Risk-standardized readmission rate = P/E ratio times national observed rate.
Became better
Became worse
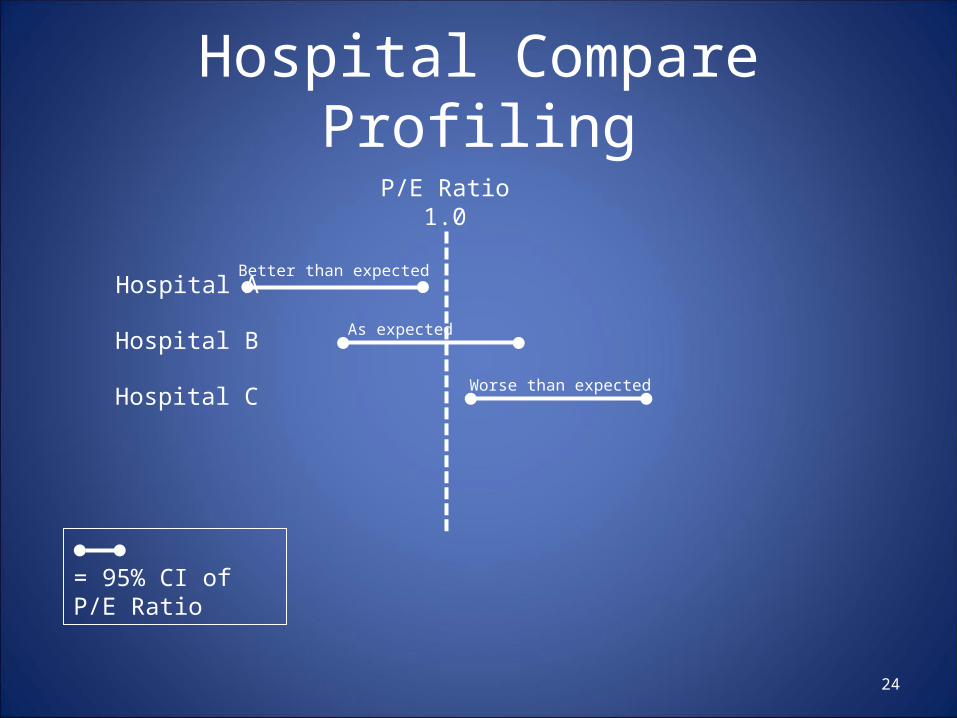
= 95% CI of P/E Ratio
Hospital Compare Profiling
24
P/E Ratio1.0
Hospital A
Hospital B
Hospital C
Better than expected
As expected
Worse than expected
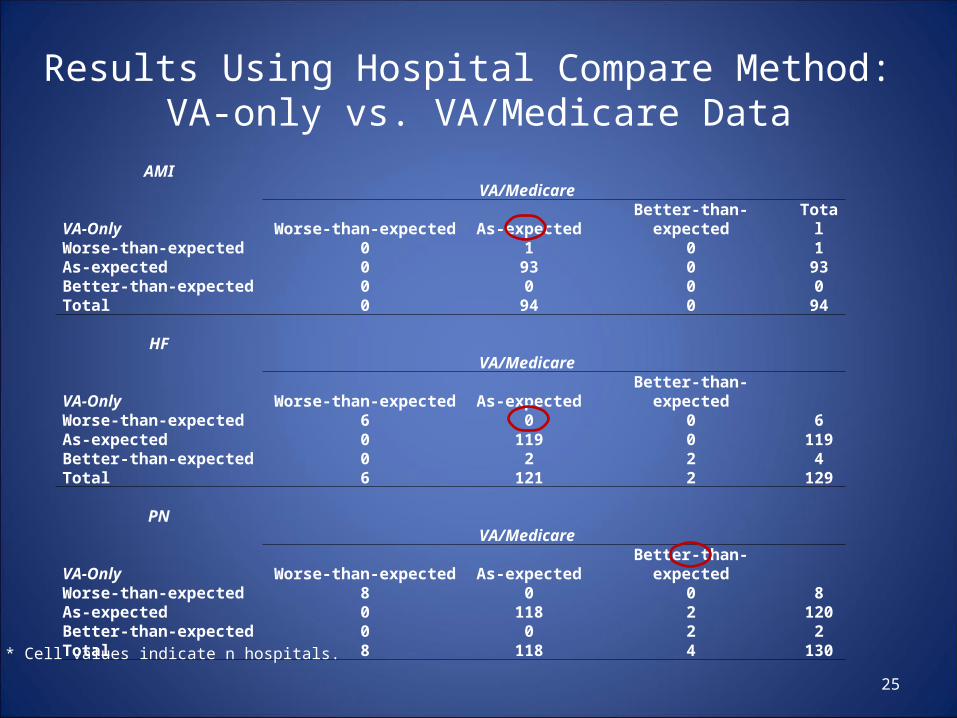
Results Using Hospital Compare Method: VA-only vs. VA/Medicare Data
25
AMIVA/Medicare
VA-Only Worse-than-expected As-expected Better-than-expected TotalWorse-than-expected 0 1 0 1As-expected 0 93 0 93Better-than-expected 0 0 0 0Total 0 94 0 94
HFVA/Medicare
VA-Only Worse-than-expected As-expected Better-than-expectedWorse-than-expected 6 0 0 6As-expected 0 119 0 119Better-than-expected 0 2 2 4Total 6 121 2 129
PNVA/Medicare
VA-Only Worse-than-expected As-expected Better-than-expectedWorse-than-expected 8 0 0 8As-expected 0 118 2 120Better-than-expected 0 0 2 2Total 8 118 4 130
* Cell values indicate n hospitals.
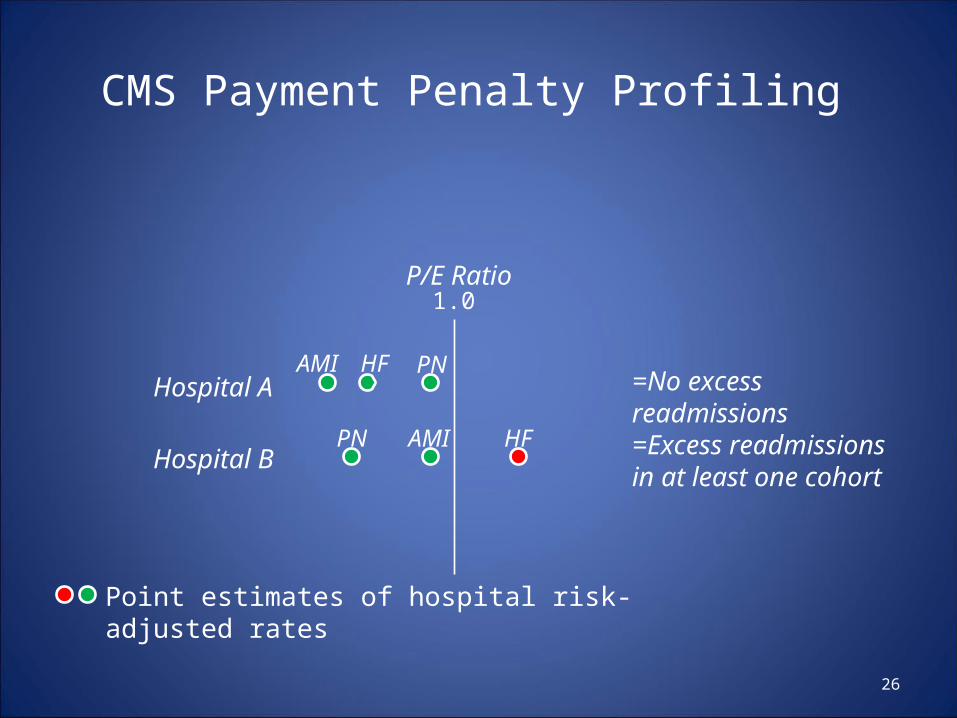
CMS Payment Penalty Profiling
26
P/E Ratio
Hospital A
Hospital B
Point estimates of hospital risk-adjusted rates
=No excess readmissions
=Excess readmissions in at least one cohort
AMI
AMI
HF
HF
PN
PN
1.0
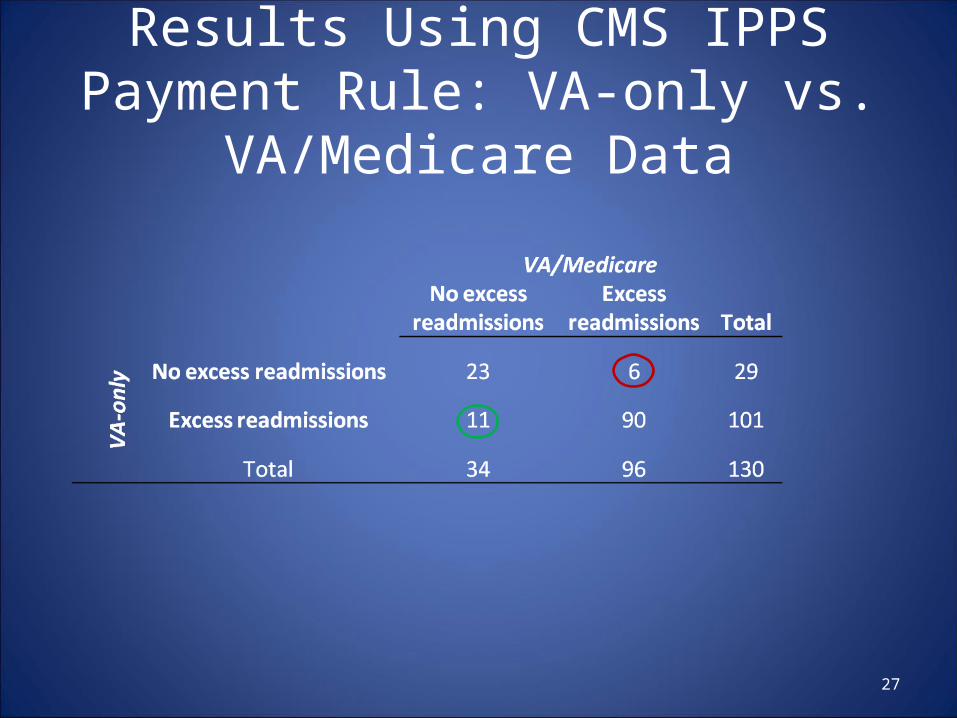
Results Using CMS IPPS Payment Rule: VA-only vs. VA/Medicare Data
27
Summary of Results
28
• Medicare data changed the readmission performance rating of only 1-2% of VA hospitals in the Hospital Compare method.
• However, 13% of VA hospitals were classified discordantly in the method CMS uses to penalize IPPS hospitals for excess readmissions.
• Additional risk and outcome information did not improve model performance.
Conclusion
• Inclusion of Medicare data in an assessment of VA hospital readmission rates provides a more comprehensive view of the care patients receive.
29
Policy Implication
• An assessment of a healthcare system’s readmission rates should use all available information, to the extent possible, about patients’ care from outside sources.
• Hospital QI initiatives should be based on information about all readmissions, including those to outside providers.
30
Future Research
• Are there other ways to improve model performance? – Additional data sources. – Social support/SES data appropriate?
• Are hospital characteristics associated with Medicare dual use?– Urban vs. rural location– Proximity to other acute care hospitals– Patient preferences
31
Thank You
William J. O’[email protected]
Funded by VA HSR&D.“Validating and Classifying VA Readmissions for
Quality Assessment and Improvement” (IIR 09-369-2)
Amy Rosen, PI.
32