Embed Size (px)
Citation preview

Estimating price rigidity in coffee markets: A cross country
comparison
Ph.D candidate: Iqbal Syed
Supervisor: Prof. Kevin Fox
UNSW
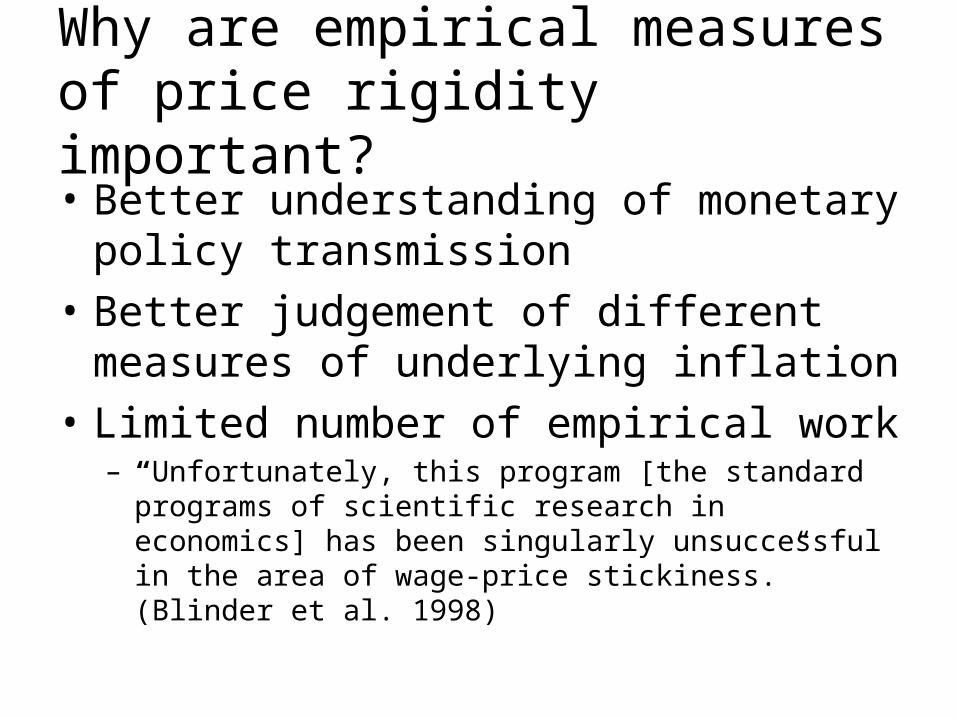
Why are empirical measures of price rigidity important?• Better understanding of monetary policy
transmission
• Better judgement of different measures of underlying inflation
• Limited number of empirical work– “Unfortunately, this program [the standard programs of
scientific research in economics] has been singularly unsuccessful in the area of wage-price stickiness.” (Blinder et al. 1998)
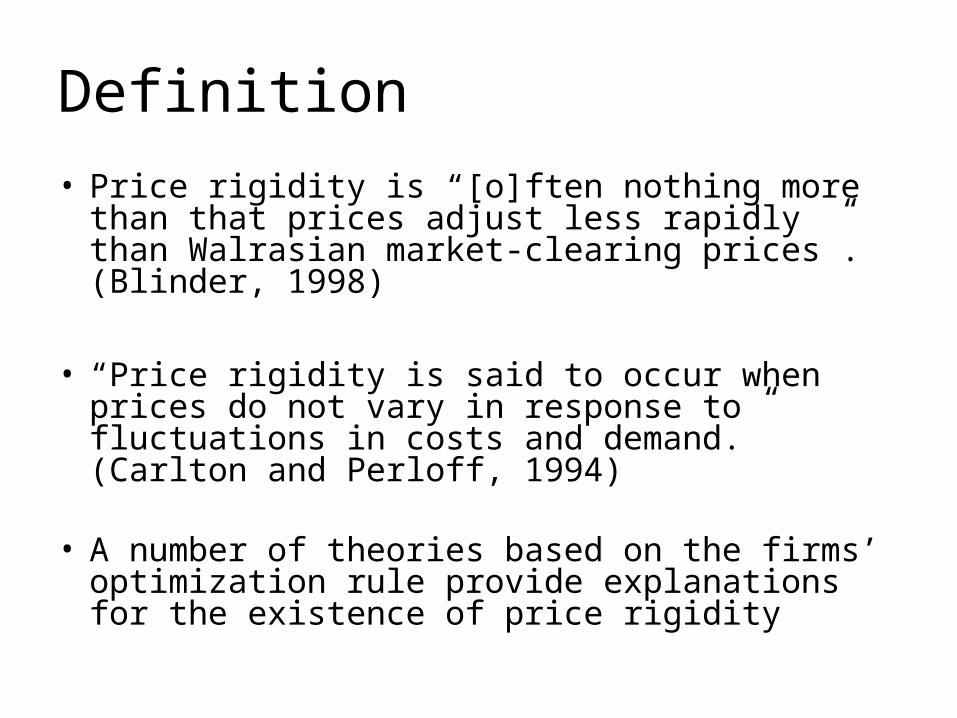
Definition
• Price rigidity is “[o]ften nothing more than that prices adjust less rapidly than Walrasian market-clearing prices”.(Blinder, 1998)
• “Price rigidity is said to occur when prices do not vary in response to fluctuations in costs and demand.” (Carlton and Perloff, 1994)
• A number of theories based on the firms’ optimization rule provide explanations for the existence of price rigidity
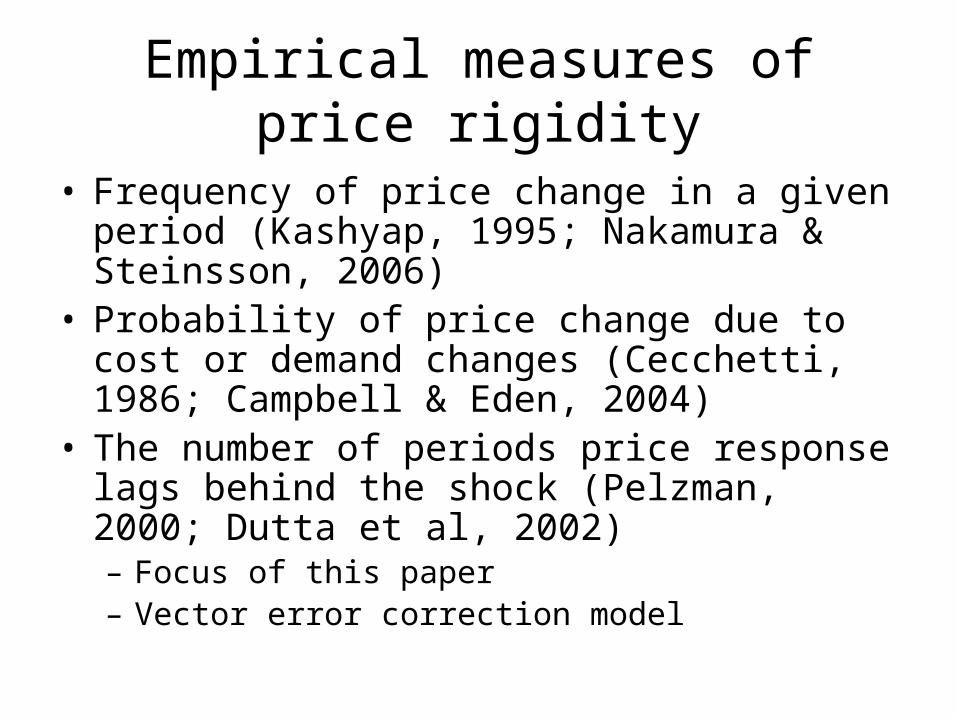
Empirical measures of price rigidity
• Frequency of price change in a given period (Kashyap, 1995; Nakamura & Steinsson, 2006)
• Probability of price change due to cost or demand changes (Cecchetti, 1986; Campbell & Eden, 2004)
• The number of periods price response lags behind the shock (Pelzman, 2000; Dutta et al, 2002)– Focus of this paper– Vector error correction model
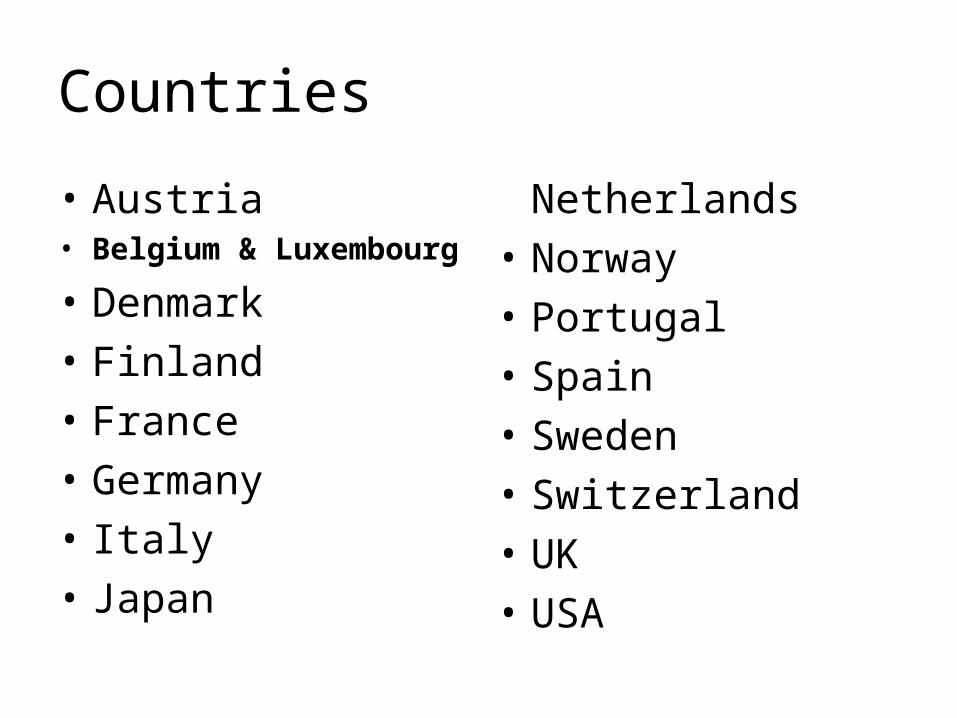
Countries
• Austria• Belgium & Luxembourg
• Denmark
• Finland
• France
• Germany
• Italy
• Japan
Netherlands• Norway• Portugal• Spain• Sweden• Switzerland• UK• USA
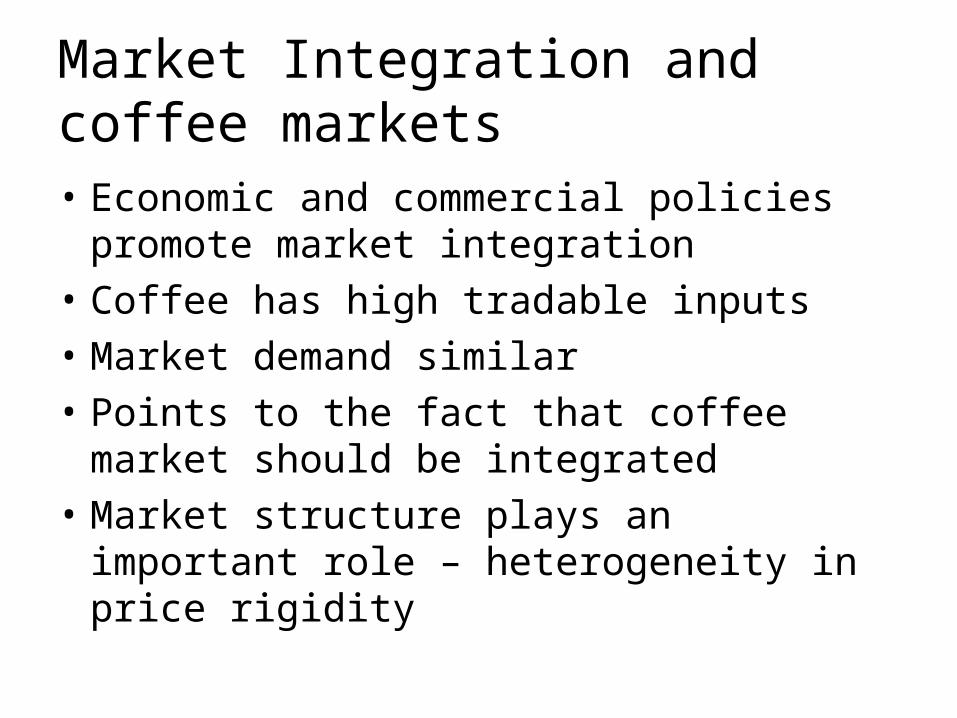
Market Integration and coffee markets• Economic and commercial policies
promote market integration
• Coffee has high tradable inputs
• Market demand similar
• Points to the fact that coffee market should be integrated
• Market structure plays an important role – heterogeneity in price rigidity
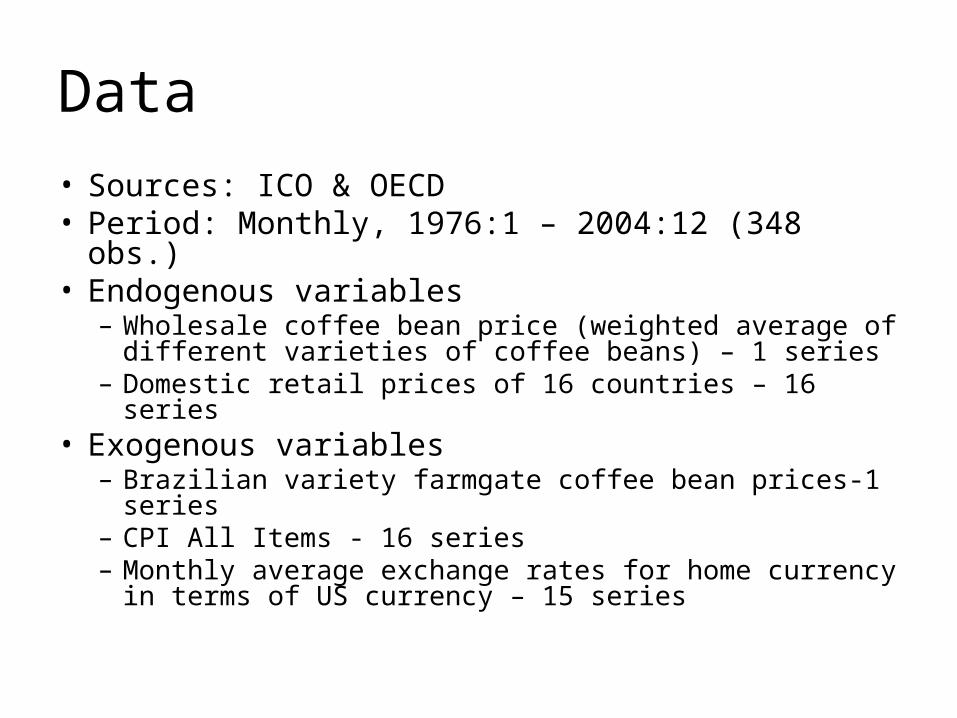
Data
• Sources: ICO & OECD• Period: Monthly, 1976:1 – 2004:12 (348 obs.)• Endogenous variables
– Wholesale coffee bean price (weighted average of different varieties of coffee beans) – 1 series
– Domestic retail prices of 16 countries – 16 series• Exogenous variables
– Brazilian variety farmgate coffee bean prices-1 series– CPI All Items - 16 series– Monthly average exchange rates for home currency in
terms of US currency – 15 series
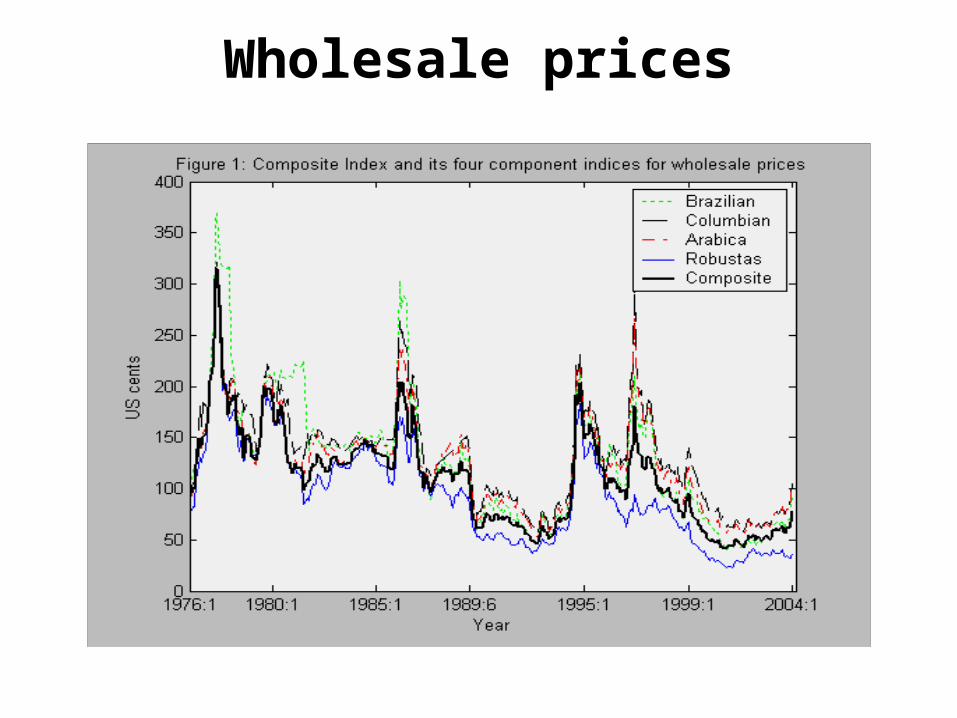
Wholesale prices
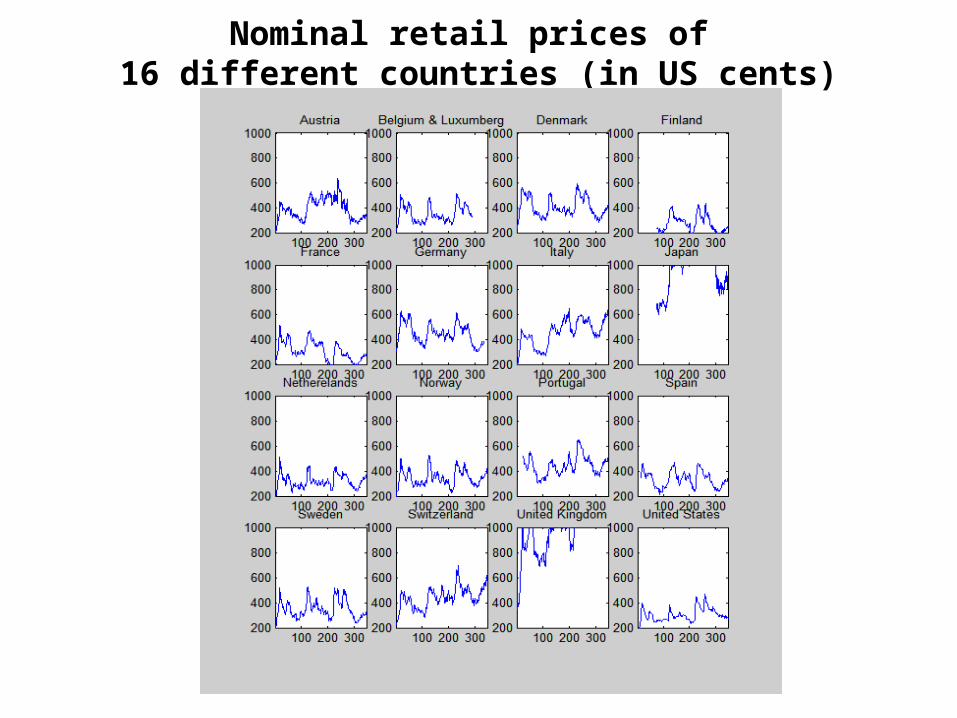
Nominal retail prices of 16 different countries (in US cents)
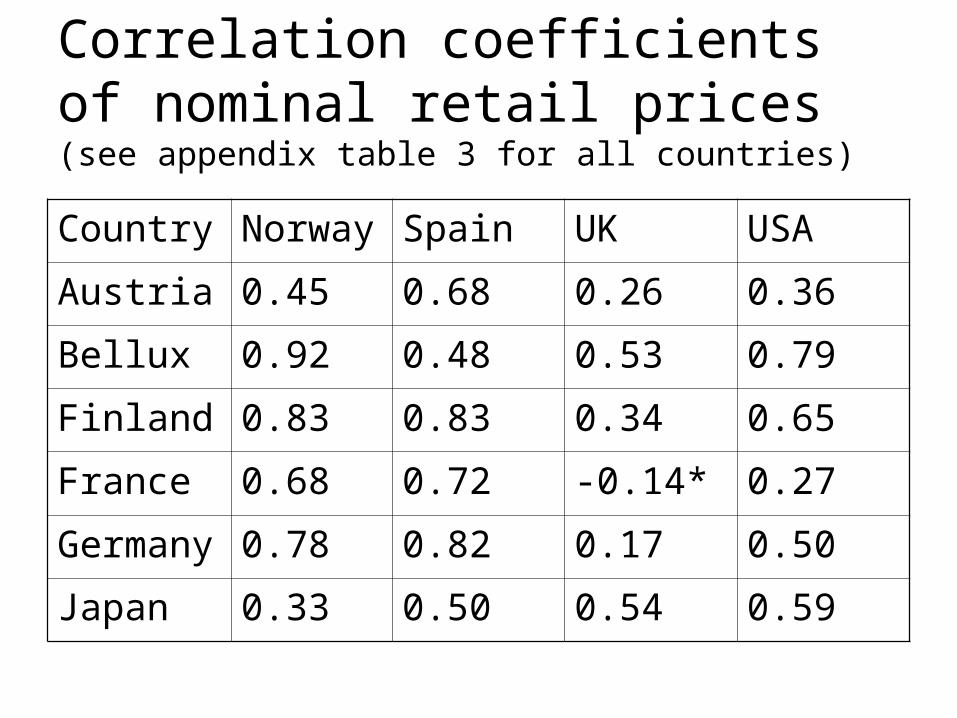
Correlation coefficients of nominal retail prices(see appendix table 3 for all countries)
Country Norway Spain UK USA
Austria 0.45 0.68 0.26 0.36
Bellux 0.92 0.48 0.53 0.79
Finland 0.83 0.83 0.34 0.65
France 0.68 0.72 -0.14* 0.27
Germany 0.78 0.82 0.17 0.50
Japan 0.33 0.50 0.54 0.59
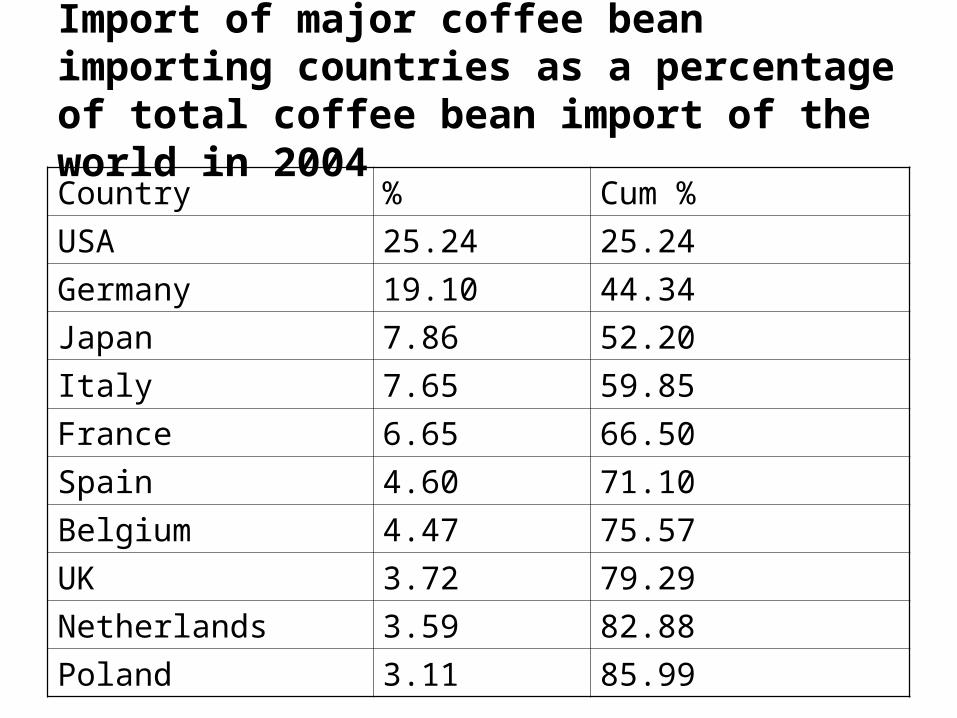
Import of major coffee bean importing countries as a percentage of total coffee bean import of the world in 2004Country % Cum %
USA 25.24 25.24
Germany 19.10 44.34
Japan 7.86 52.20
Italy 7.65 59.85
France 6.65 66.50
Spain 4.60 71.10
Belgium 4.47 75.57
UK 3.72 79.29
Netherlands 3.59 82.88
Poland 3.11 85.99
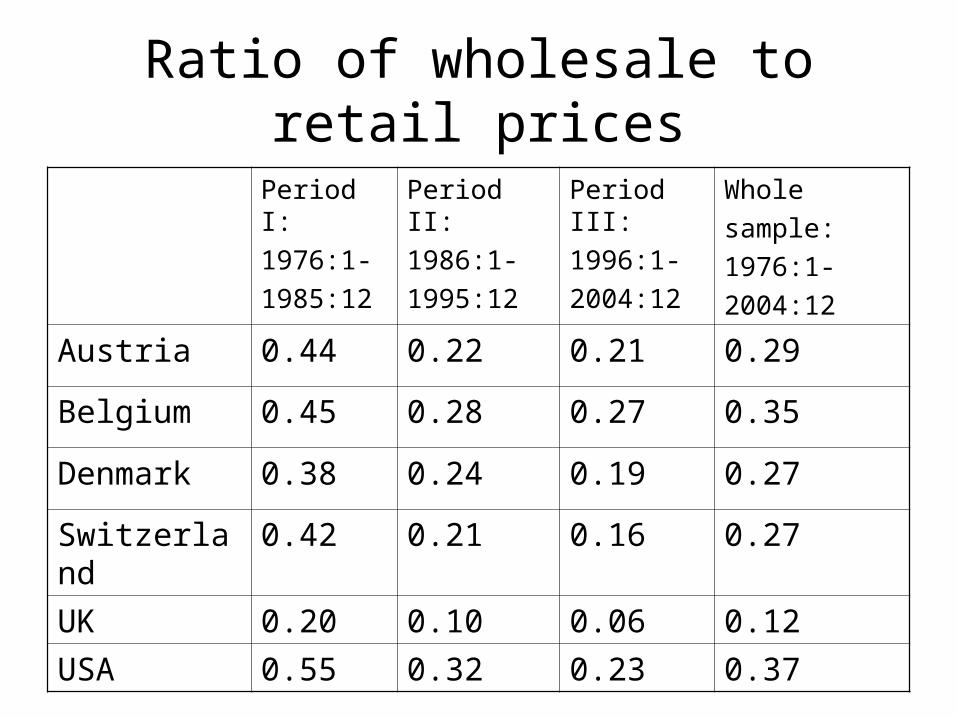
Ratio of wholesale to retail prices
Period I:
1976:1-
1985:12
Period II:
1986:1-
1995:12
Period III:
1996:1-
2004:12
Whole
sample:
1976:1-
2004:12
Austria 0.44 0.22 0.21 0.29
Belgium 0.45 0.28 0.27 0.35
Denmark 0.38 0.24 0.19 0.27
Switzerland 0.42 0.21 0.16 0.27
UK 0.20 0.10 0.06 0.12
USA 0.55 0.32 0.23 0.37
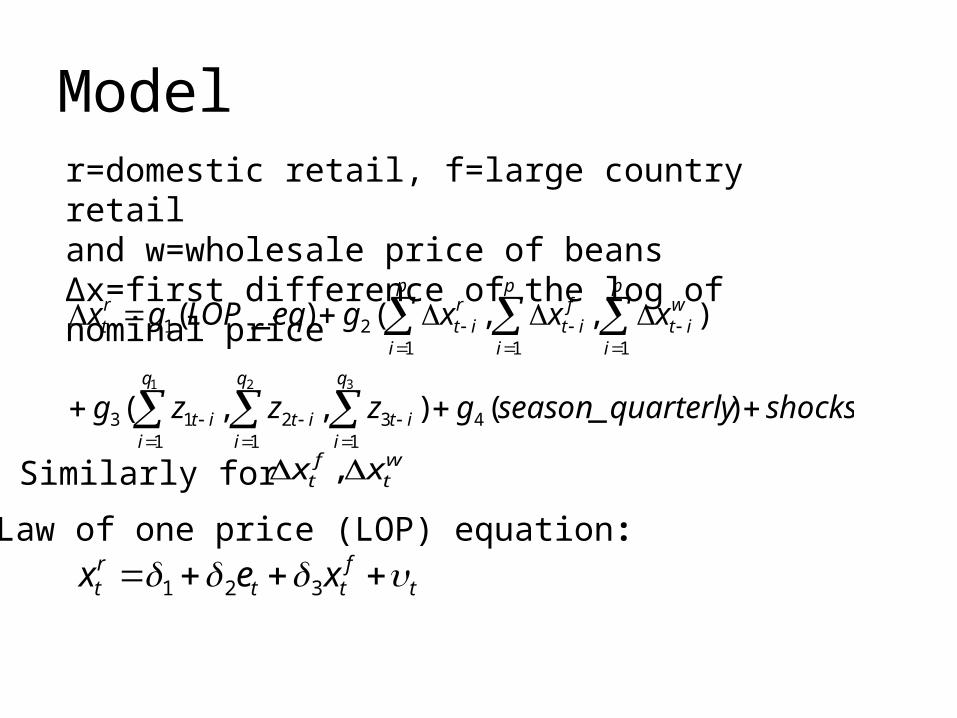
Model
1 2 3
1 1 143213
11121
)_(),,(
),,()_(
q
i
q
i
q
iititit
p
i
wit
p
i
fit
p
i
rit
rt
shocksquarterlyseasongzzzg
xxxgeqLOPgx
r=domestic retail, f=large country retail and w=wholesale price of beans∆x=first difference of the log of nominal price
Law of one price (LOP) equation:
tftt
rt xex 321
Similarly for wt
ft xx ,

Identification
rt
ft
wt
rtt
rt
rt
ft
wt
ftt
ft
rt
ft
wt
wtt
wt
xEx
xEx
xEx
3231
2321
1312
)(
)(
)(
After recursive identification
rt
ft
wt
rtt
rt
ft
wt
ftt
ft
wt
wtt
wt
xEx
xEx
xEx
3231
21
)(
)(
)(
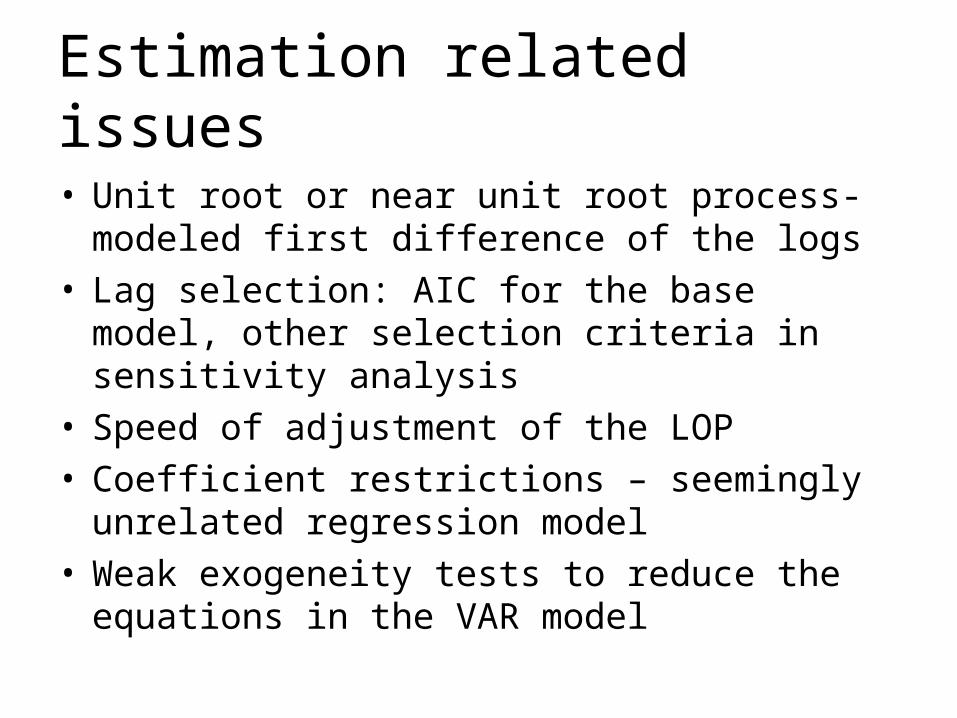
Estimation related issues
• Unit root or near unit root process- modeled first difference of the logs
• Lag selection: AIC for the base model, other selection criteria in sensitivity analysis
• Speed of adjustment of the LOP• Coefficient restrictions – seemingly unrelated
regression model• Weak exogeneity tests to reduce the equations
in the VAR model
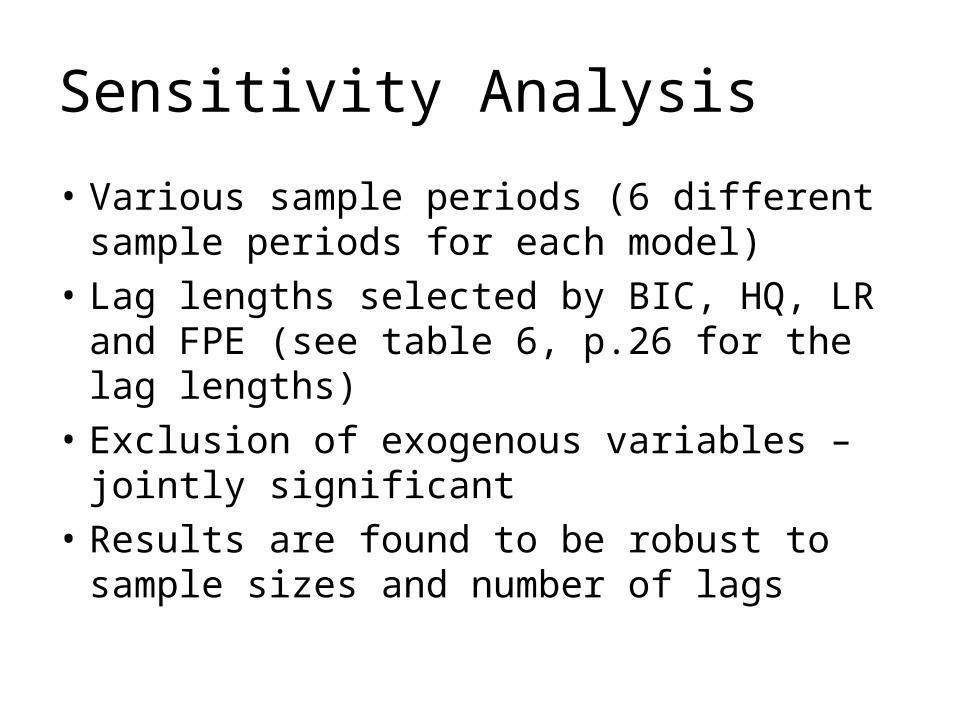
Sensitivity Analysis
• Various sample periods (6 different sample periods for each model)
• Lag lengths selected by BIC, HQ, LR and FPE (see table 6, p.26 for the lag lengths)
• Exclusion of exogenous variables – jointly significant
• Results are found to be robust to sample sizes and number of lags
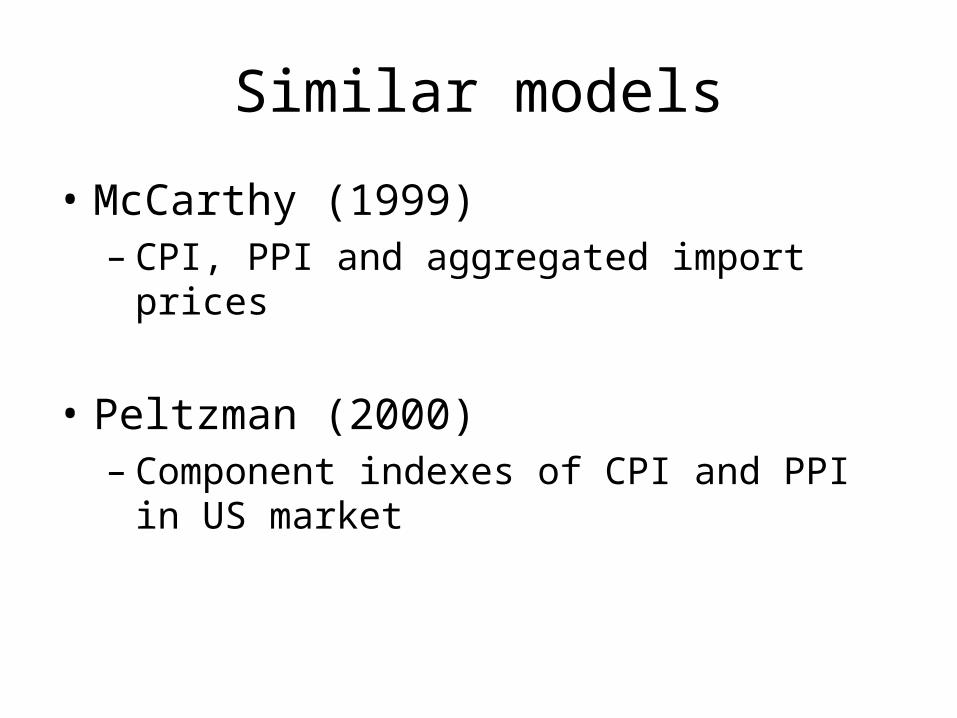
Similar models
• McCarthy (1999)– CPI, PPI and aggregated import prices
• Peltzman (2000)– Component indexes of CPI and PPI in US
market
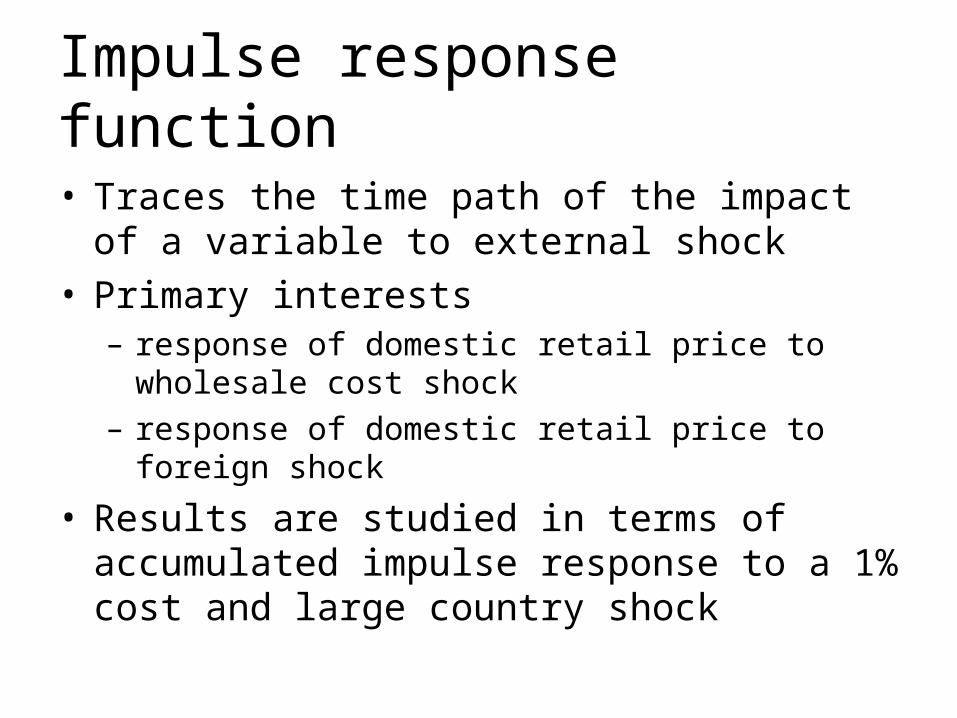
Impulse response function
• Traces the time path of the impact of a variable to external shock
• Primary interests– response of domestic retail price to wholesale cost
shock– response of domestic retail price to foreign shock
• Results are studied in terms of accumulated impulse response to a 1% cost and large country shock
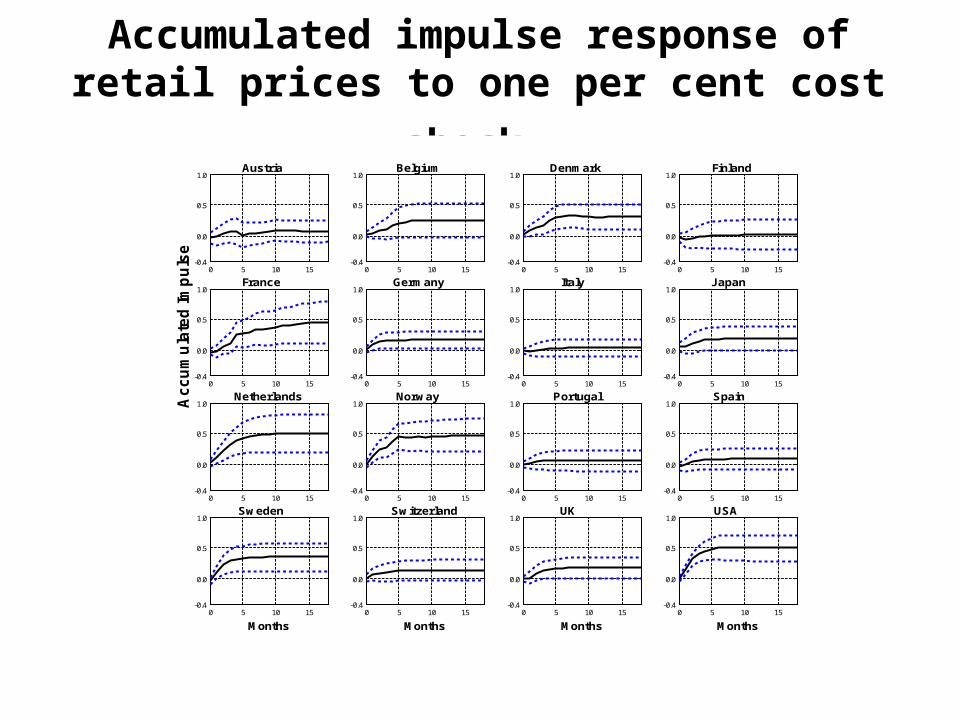
Accumulated impulse response of retail
prices to one per cent cost shock
0 5 10 15-0.4
0.0
0.5
1.0Austria
0 5 10 15-0.4
0.0
0.5
1.0Belgium
0 5 10 15-0.4
0.0
0.5
1.0Denmark
0 5 10 15-0.4
0.0
0.5
1.0Finland
0 5 10 15-0.4
0.0
0.5
1.0France
Ac
cu
mu
late
d Im
pu
lse
0 5 10 15-0.4
0.0
0.5
1.0Germany
0 5 10 15-0.4
0.0
0.5
1.0Italy
0 5 10 15-0.4
0.0
0.5
1.0Japan
0 5 10 15-0.4
0.0
0.5
1.0Netherlands
0 5 10 15-0.4
0.0
0.5
1.0Norway
0 5 10 15-0.4
0.0
0.5
1.0Portugal
0 5 10 15-0.4
0.0
0.5
1.0Spain
0 5 10 15-0.4
0.0
0.5
1.0Sweden
Months0 5 10 15
-0.4
0.0
0.5
1.0Switzerland
Months0 5 10 15
-0.4
0.0
0.5
1.0UK
Months0 5 10 15
-0.4
0.0
0.5
1.0USA
Months
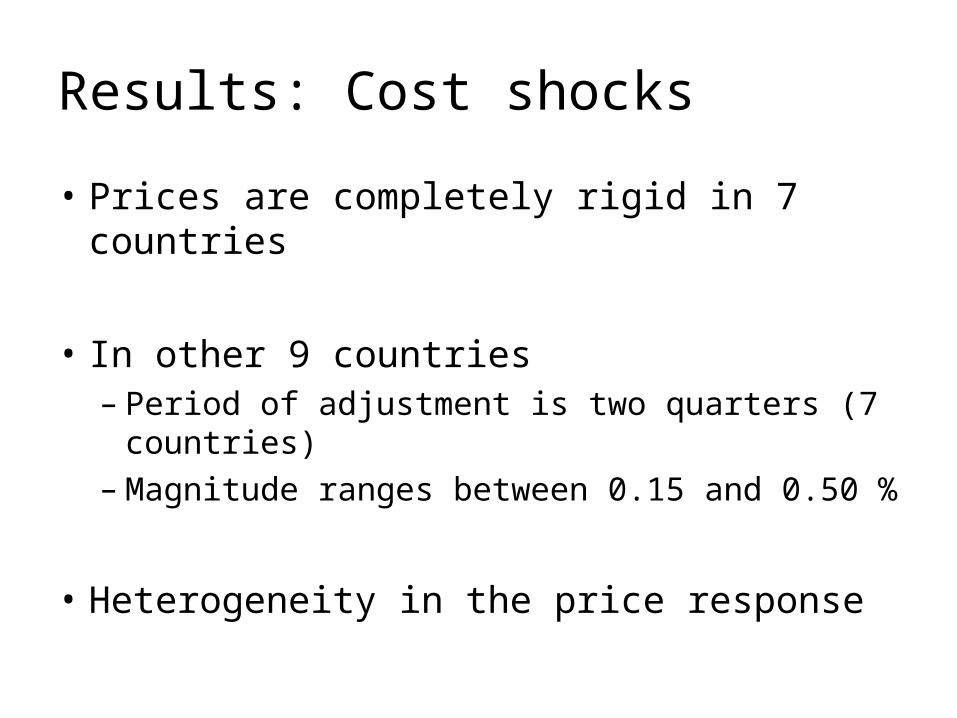
Results: Cost shocks
• Prices are completely rigid in 7 countries
• In other 9 countries– Period of adjustment is two quarters (7
countries)– Magnitude ranges between 0.15 and 0.50 %
• Heterogeneity in the price response
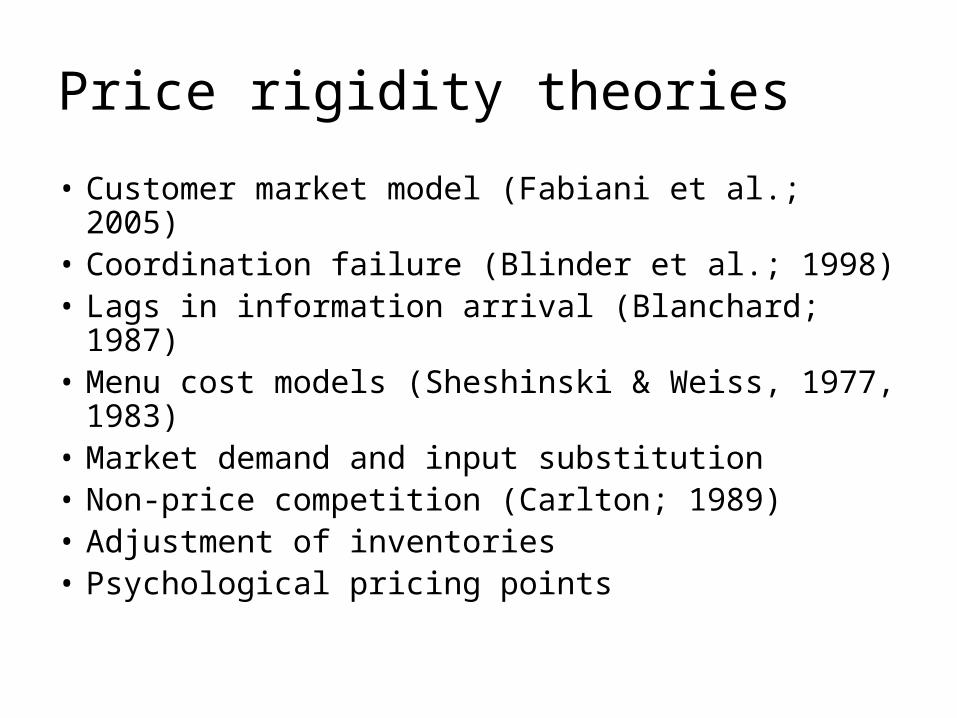
Price rigidity theories
• Customer market model (Fabiani et al.; 2005)• Coordination failure (Blinder et al.; 1998)• Lags in information arrival (Blanchard; 1987)• Menu cost models (Sheshinski & Weiss,
1977, 1983)• Market demand and input substitution• Non-price competition (Carlton; 1989)• Adjustment of inventories• Psychological pricing points

Price rigidity and market structure
Market structure– Imperfect market structure allows firms to adopt mark-
up pricing rules– The more competitive the market , the larger is the
impact of cost shocks (Dornbusch, 1987)– The more concentrated industries have lower
frequency of price adjustment (Viqueira, 1991)– The retail prices of orange juice concentrates are very
flexible because of high degree of competition (Dutta et al., 2002)
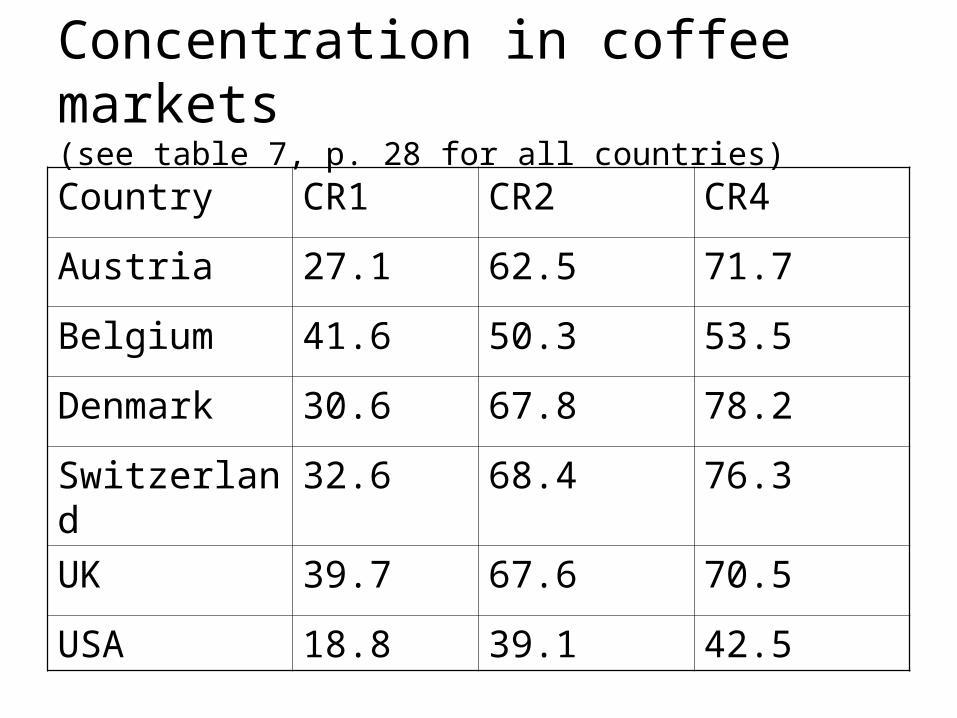
Concentration in coffee markets(see table 7, p. 28 for all countries)
Country CR1 CR2 CR4
Austria 27.1 62.5 71.7
Belgium 41.6 50.3 53.5
Denmark 30.6 67.8 78.2
Switzerland 32.6 68.4 76.3
UK 39.7 67.6 70.5
USA 18.8 39.1 42.5

Market structure in the euro area
• “Mark-up (constant and variable) pricing is the dominant price setting practice adopted by firms in euro area” (Fabiani et al., 2005, p.15).
• 54 % of the firms follow mark-up pricing rule• Variable mark-up rule dominates• “Models with monopolistic competition, like New
Keynesian models, may be a better description for most goods and service markets than those that assume perfect competition” (Fabiani et al., 2005, p.5)
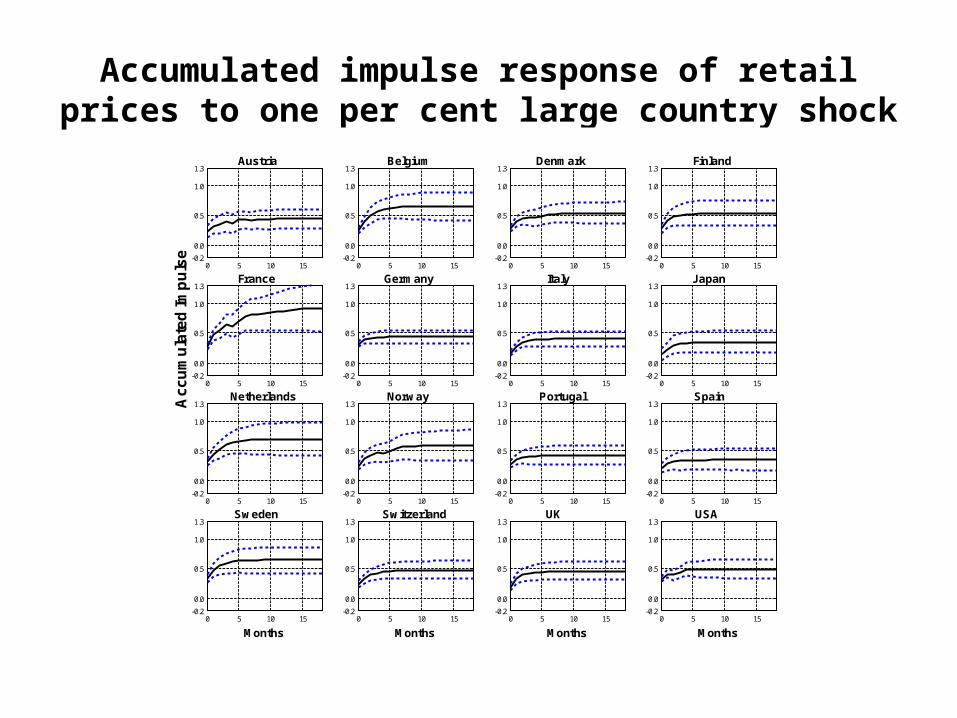
Accumulated impulse response of retail prices to one per cent large country shock
0 5 10 15-0.2
0.0
0.5
1.0
1.3Austria
0 5 10 15-0.2
0.0
0.5
1.0
1.3Belgium
0 5 10 15-0.2
0.0
0.5
1.0
1.3Denmark
0 5 10 15-0.2
0.0
0.5
1.0
1.3Finland
0 5 10 15-0.2
0.0
0.5
1.0
1.3France
Ac
cu
mu
late
d Im
pu
lse
0 5 10 15-0.2
0.0
0.5
1.0
1.3Germany
0 5 10 15-0.2
0.0
0.5
1.0
1.3Italy
0 5 10 15-0.2
0.0
0.5
1.0
1.3Japan
0 5 10 15-0.2
0.0
0.5
1.0
1.3Netherlands
0 5 10 15-0.2
0.0
0.5
1.0
1.3Norway
0 5 10 15-0.2
0.0
0.5
1.0
1.3Portugal
0 5 10 15-0.2
0.0
0.5
1.0
1.3Spain
0 5 10 15-0.2
0.0
0.5
1.0
1.3Sweden
Months0 5 10 15
-0.2
0.0
0.5
1.0
1.3Switzerland
Months0 5 10 15
-0.2
0.0
0.5
1.0
1.3UK
Months0 5 10 15
-0.2
0.0
0.5
1.0
1.3USA
Months
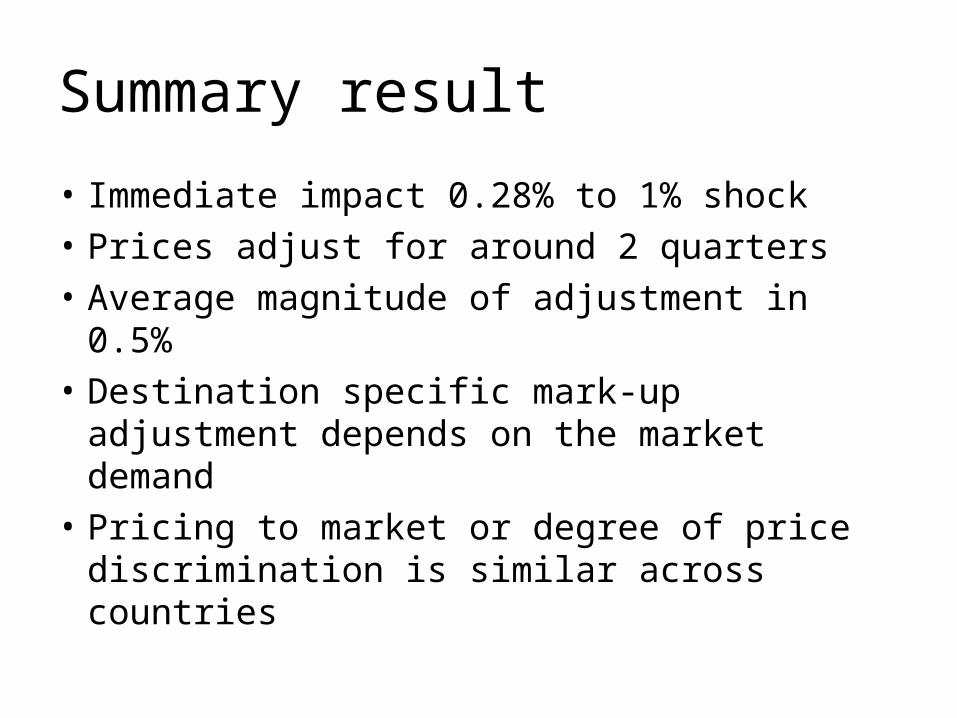
Summary result
• Immediate impact 0.28% to 1% shock
• Prices adjust for around 2 quarters
• Average magnitude of adjustment in 0.5%
• Destination specific mark-up adjustment depends on the market demand
• Pricing to market or degree of price discrimination is similar across countries
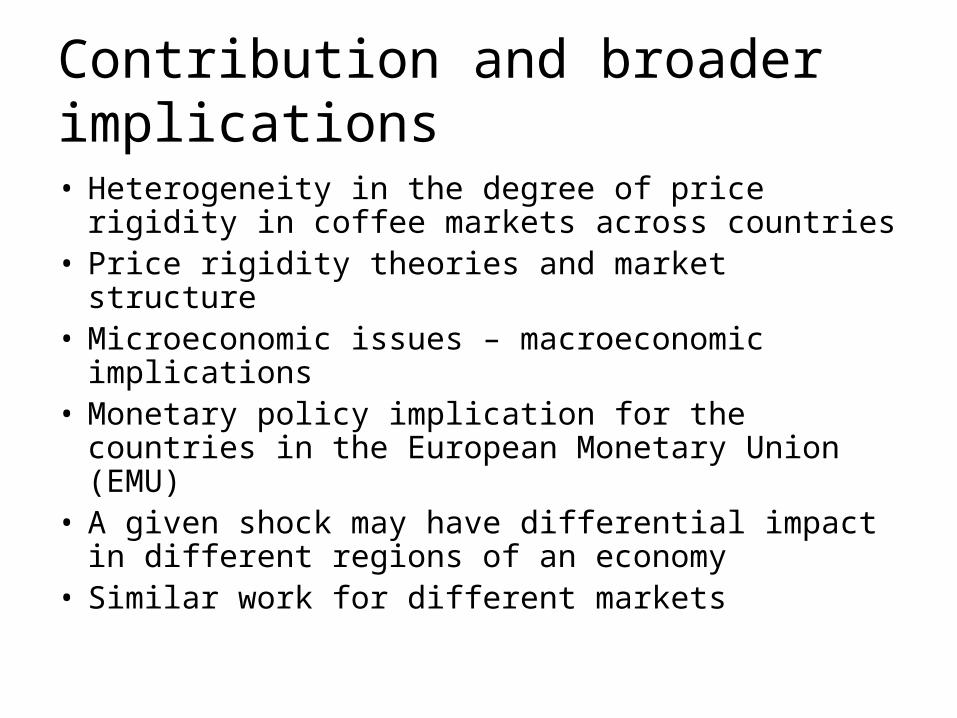
Contribution and broader implications• Heterogeneity in the degree of price rigidity in
coffee markets across countries• Price rigidity theories and market structure• Microeconomic issues – macroeconomic
implications• Monetary policy implication for the countries in
the European Monetary Union (EMU)• A given shock may have differential impact in
different regions of an economy• Similar work for different markets
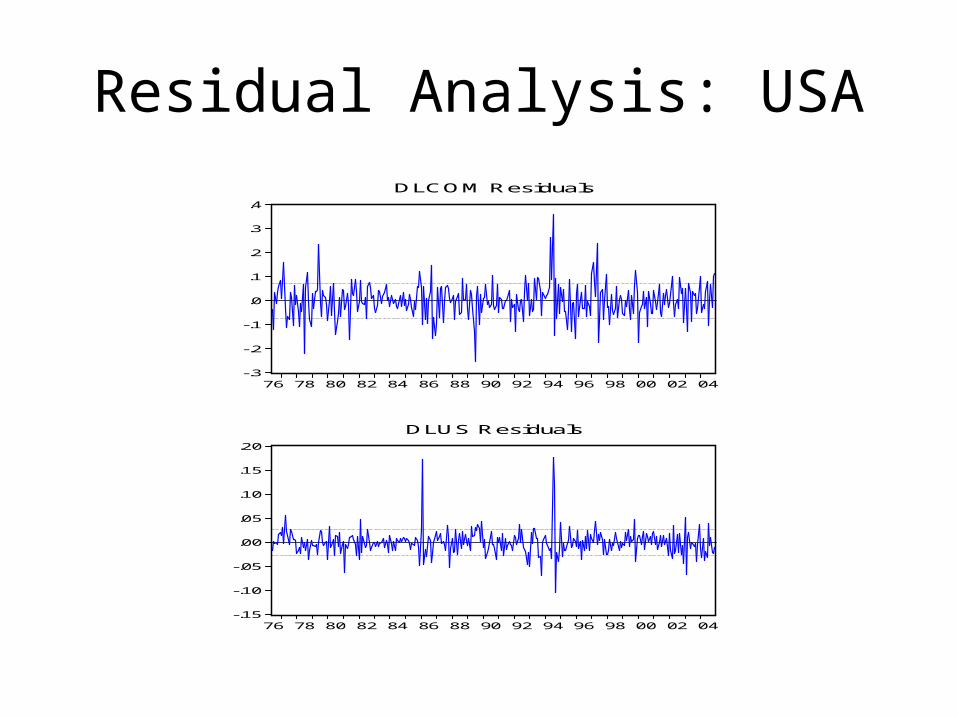
Residual Analysis: USA
-.3
-.2
-.1
.0
.1
.2
.3
.4
76 78 80 82 84 86 88 90 92 94 96 98 00 02 04
DLCOM Residuals
-.15
-.10
-.05
.00
.05
.10
.15
.20
76 78 80 82 84 86 88 90 92 94 96 98 00 02 04
DLUS Residuals
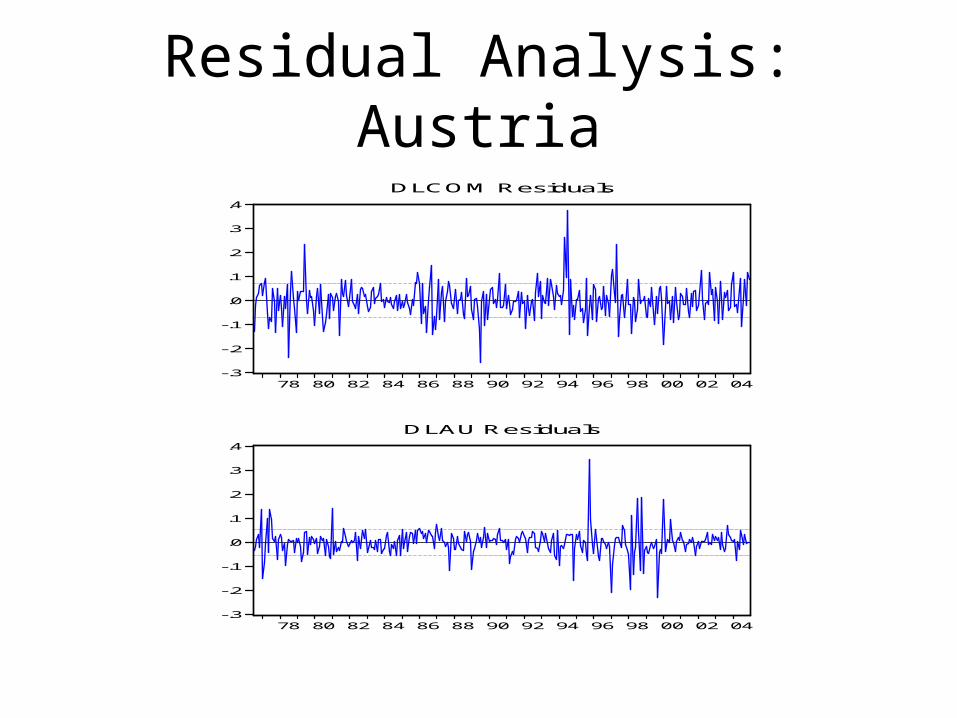
Residual Analysis: Austria
-.3
-.2
-.1
.0
.1
.2
.3
.4
78 80 82 84 86 88 90 92 94 96 98 00 02 04
DLCOM Residuals
-.3
-.2
-.1
.0
.1
.2
.3
.4
78 80 82 84 86 88 90 92 94 96 98 00 02 04
DLAU Residuals