Embed Size (px)
Citation preview
Estimating How the Level and Volatility of Food Prices Shape Social Unrest in the Developing
World, 1990-2011
Marc F. BellemareMarc F. Bellemare
Center for Global Development – Massachusetts Avenue Development Seminar
December 5, 2011
Framing the Issue
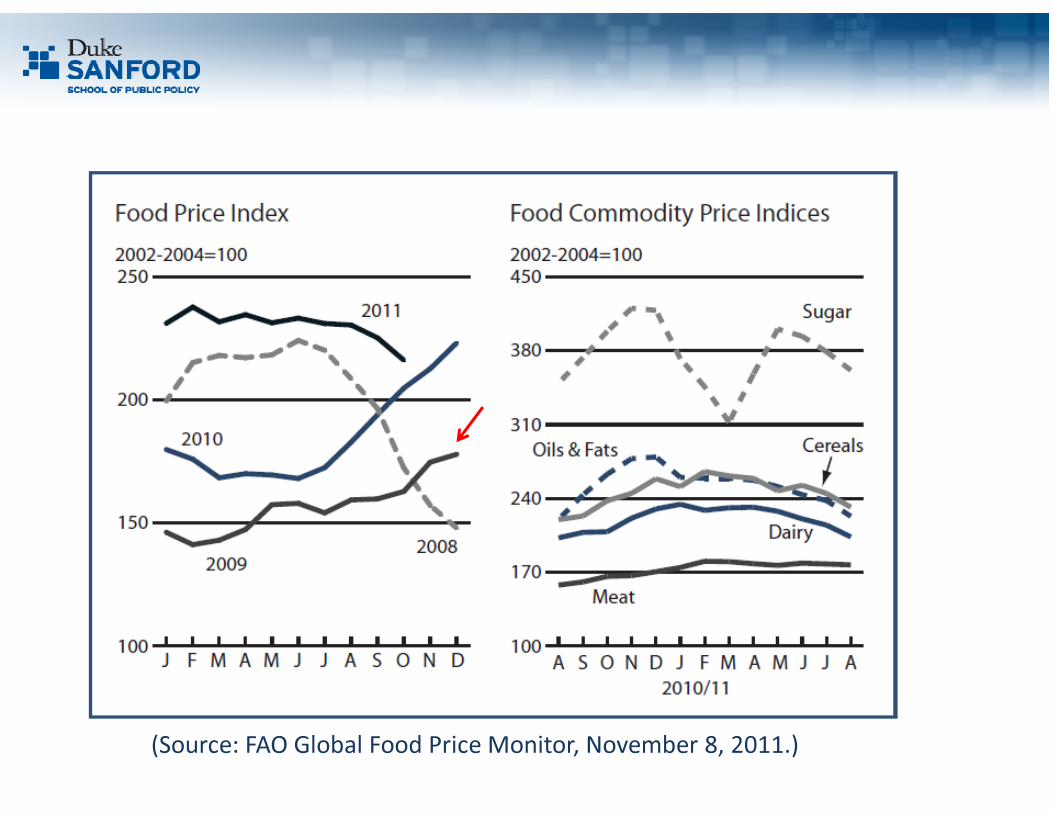
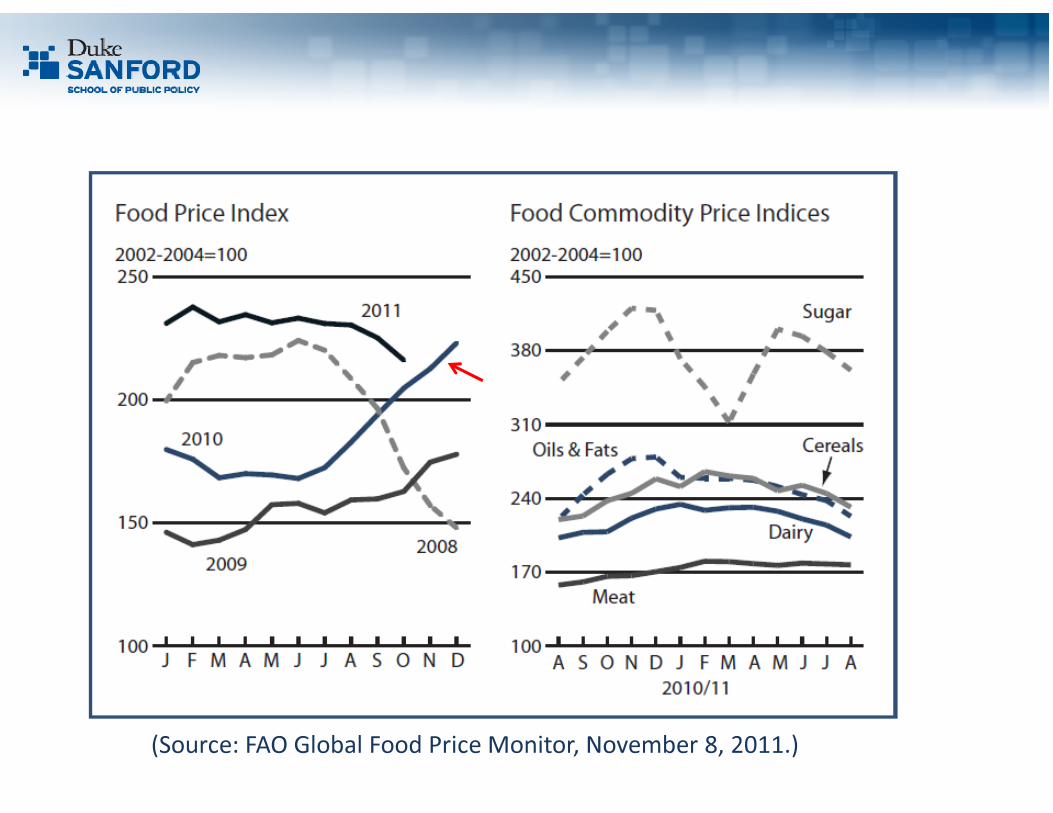
In the 20 years since the Food and Agriculture Organization (FAO) of the United Nations has been recording food prices, the food price index has never been as high as it was at the end of 2010/beginning of been as high as it was at the end of 2010/beginning of 2011 (FAO, 2011).
In 2000, the index averaged 90. In 2010, it averaged 185.
The food price index currently stands at 216, i.e., close to food price levels experienced during the food crisis of 2007-08.
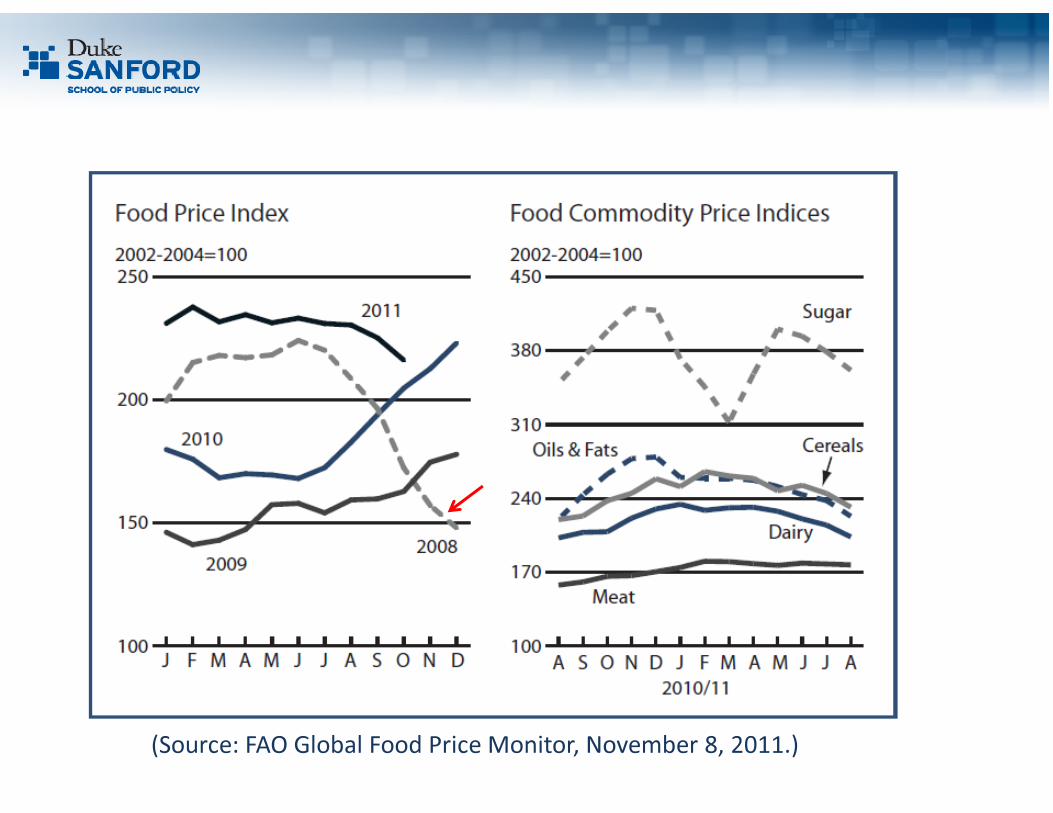
(Source: FAO Global Food Price Monitor, November 8, 2011.)
(Source: FAO Global Food Price Monitor, November 8, 2011.)
(Source: FAO Global Food Price Monitor, November 8, 2011.)

(Source: FAO Global Food Price Monitor, November 8, 2011.)
Framing the Issue
Food price volatility (i.e., unexpected departures from
the food price level, holding the price level constant; the
“noise” around the level) has also been on the rise (FAO,
2010).2010).
Episodes of extreme price volatility are rare, but there is
always a certain amount of uncertainty over future
prices.
(Note: I use the terms “price volatility,” “price uncertainty,” and “price risk”
interchangeably.)
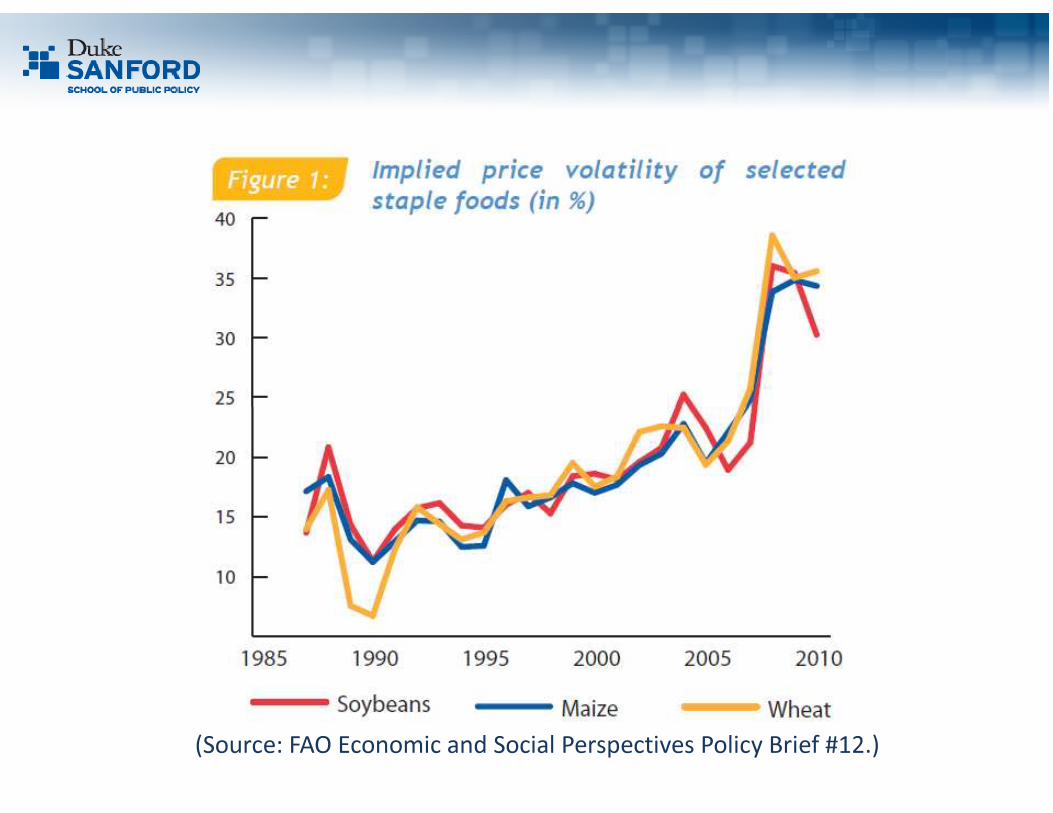
(Source: FAO Economic and Social Perspectives Policy Brief #12.)
Framing the Issue
While we’ve understood the welfare impacts of rising
food prices for a long time (Deaton, 1989), the impacts
of food price volatility on welfare are not understood all
that well.that well.
In theory, producers should be price risk-averse (i.e.,
they dislike price volatility; Sandmo, 1970) and
consumers price risk-loving (i.e., they like price volatility;
Turnovsky et al., 1980).
Framing the Issue
But policy makers don’t seem to know of this.
President Sarkozy: “If we don’t do anything [about food President Sarkozy: “If we don’t do anything [about food
price volatility], we run the risk of food riots in the
poorest countries.”
Brookings: “The crux of the food price challenge is about
price volatility rather than high prices per se. It is the
rapid and unpredictable changes in food prices that
wreak havoc on markets, politics, and social stability.”
Framing the Issue
Moreover, the unit of analysis in development policy is often the household, which can both produce and consume staples, and whose position vis-à-vis the market – net seller, autarkic, or net buyer – isn’t always market – net seller, autarkic, or net buyer – isn’t always the same. Food prices thus have heterogeneous welfare impacts.
Finally, many people appear to conflate the twin issues of rising food prices and food price volatility. But food price volatility really measures both upward and downward changes over a given time period.
Framing the Issue
An example might be helpful.
Suppose the price of rice is $5/kg today, but there is Suppose the price of rice is $5/kg today, but there is
uncertainty as to what rice will cost next month, and I
expect the price of rice to be anywhere between $4 and
$6 but on average $5/kg.
If my belief changes and I now expect the price of rice to
be anywhere between $3 and $7 but on average $5/kg,
that is an increase in rice price volatility.
Framing the Issue
Suppose instead that the price of rice is $5/kg today, but
there is uncertainty as to what rice will cost next month,
and I expect the price of rice to be anywhere between
$4 and $6 but on average $5/kg.$4 and $6 but on average $5/kg.
If my belief changes and I now expect the price of rice to
be anywhere between $4 and $6 but on average
$5.50/kg, that is an increase in the rice price level. The
goal of this paper is to investigate the different effects of
each measure (level and volatility) on social unrest.
Framing the Issue
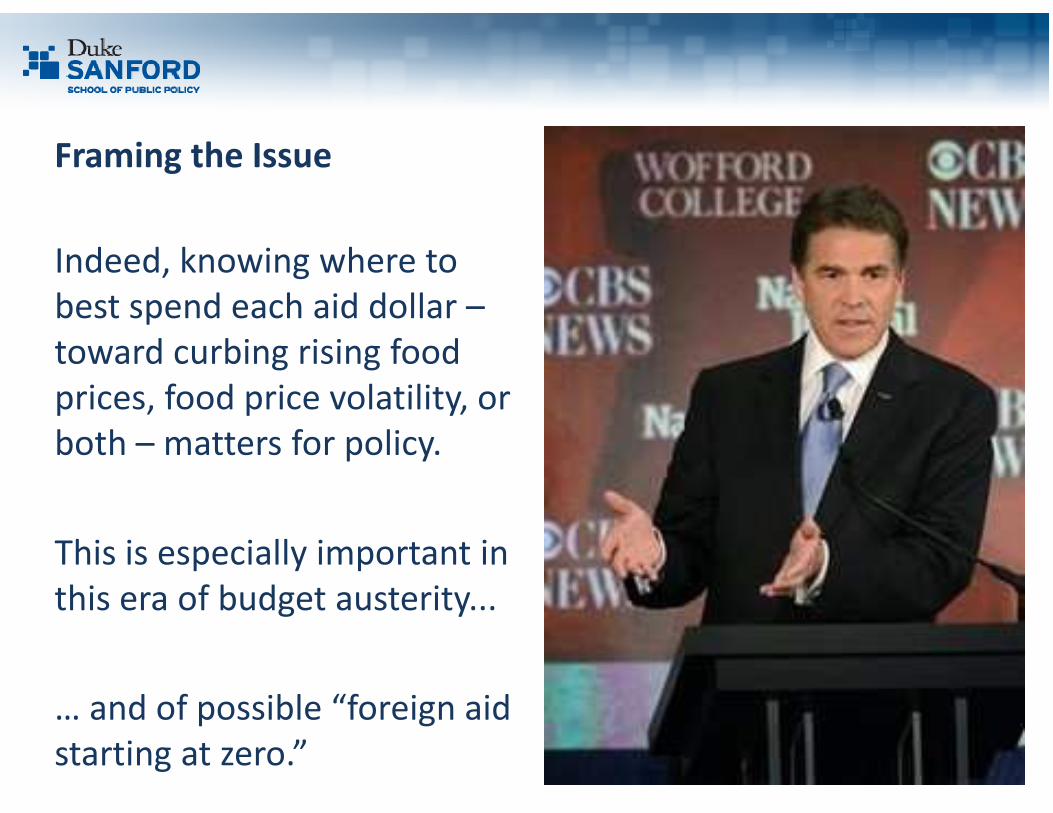
Indeed, knowing where to
best spend each aid dollar –
toward curbing rising food
prices, food price volatility, or prices, food price volatility, or
both – matters for policy.
This is especially important in
this era of budget austerity...
… and of possible “foreign aid
starting at zero.”
Outline
1. Framing the Issue
2. Historical Evidence on Food Riots
3. Methodology3. Methodology
a) Data
b) Estimation Strategy
c) Identification Strategy
3. Key Findings
4. Policy Implications
Historical Evidence on Food Riots
Food riots have been frequent throughout history and are
thought to have brought about the French Revolution (Rudé,
1964), the fall of the Confederacy (Smith, 2011), the Russian
Revolution (Wade, 2005), and the fall of the British Raj in Revolution (Wade, 2005), and the fall of the British Raj in
India (Arnold, 1979).
Rudé documents several instances of food riots in France and
England between 1730 and 1848. He also notes how food
riots usually occur after bad harvests and natural disasters.
Historical Evidence on Food Riots
In France, food riots were not political in nature until the
Revolution.
Rather, rioters targeted farmers, merchants, and traders in Rather, rioters targeted farmers, merchants, and traders in
order to decrease food prices (“taxation populaire”).
In England, Rudé notes that two thirds of the 275
disturbances between 1733 and 1800 were food riots. Food
riots tended to break out more often in the food-importing
north and west of the country.
Historical Evidence on Food Riots
Walton and Seddon (1994) document study the “IMF riots”
that took place between 1970 and the early 1990s.
There were 146 food riots across 39 countries in response to There were 146 food riots across 39 countries in response to
the IMF’s austerity policies between 1976 and 1992.
Although the “classical” food riots studied by Rudé largely
took place in the countryside, the modern food riots studied
by Walton and Seddon took place almost exclusively in cities.
Historical Evidence on Food Riots
It is still too early to tell the story of the recent spate of food riots, but Schneider (2008) provides an overview of the riots that took place in 2008.
Likewise, Bush (2010) foretells the riots in North Africa and the Middle East.
Lastly, Arezki and Brückner (2011) also look at the impact of food prices on food riots, but they adopt a different identification strategy and ignore price volatility. More on this in a minute.
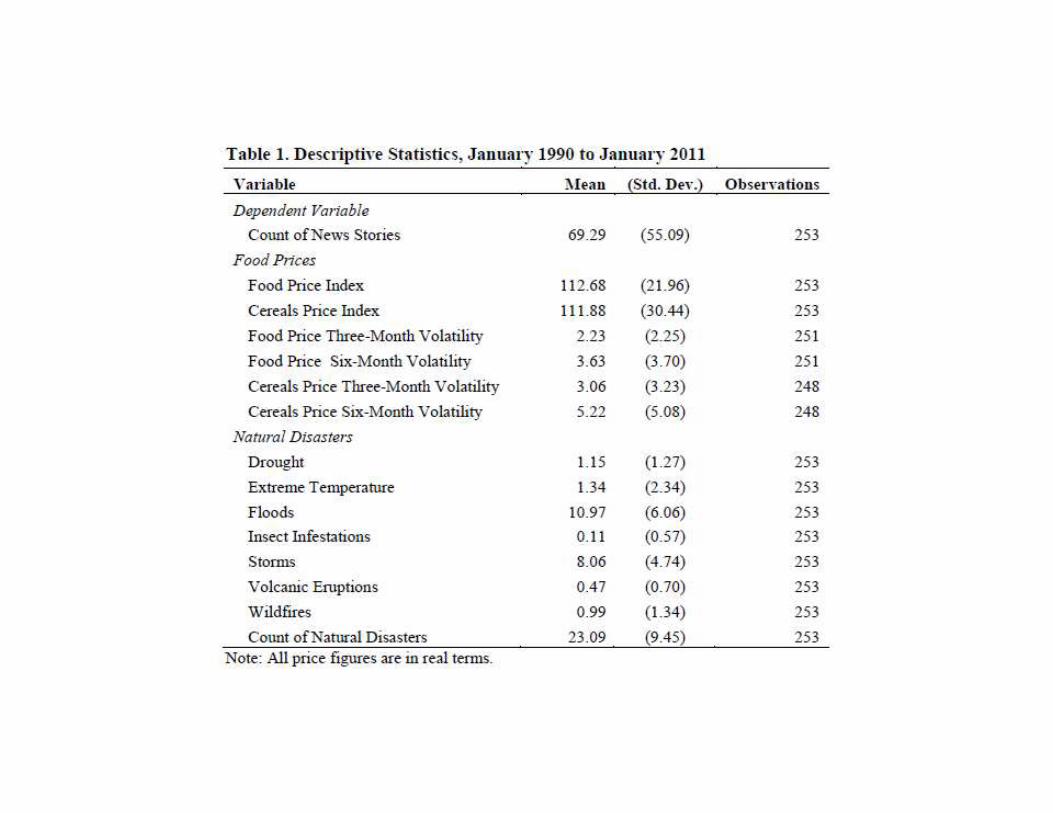
Methodology: Data
In order to study the impact of food prices – both rising food
prices and food price volatility – on social unrest, one needs
data on food prices and social unrest.
Data on food prices are readily available from the FAO, which
has recorded its monthly food price index – disaggregated in
five categories – since January 1990, in both real and
nominal terms.
Methodology: Data
It is trickier to find data on social unrest.
The PRS Group publishes its International Country Risk Guide
(ICRG) data, which measures a number of governance-(ICRG) data, which measures a number of governance-
related indicators for each country at the annual level.
Although Arezki and Brückner (2011) use these data to study
the relationship between food prices and food riots, annual
data mask too much heterogeneity – prices can fluctuate a
lot over 12 months.
Methodology: Data
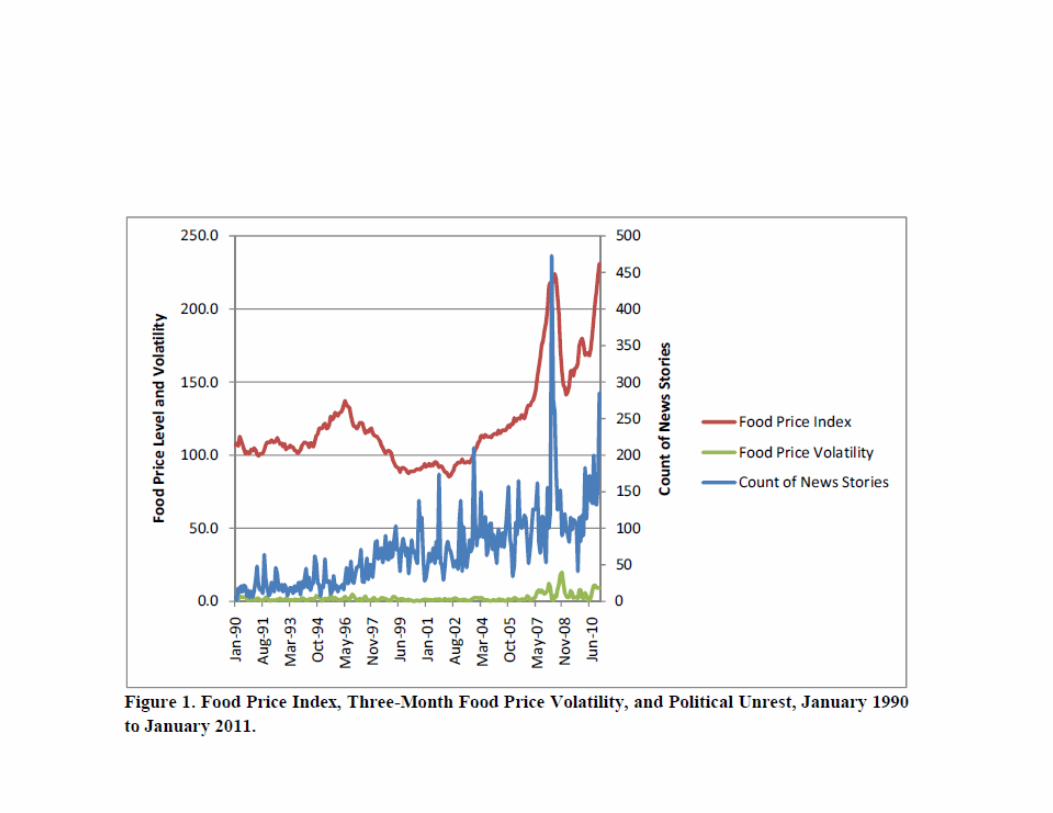
I use LexisNexis to construct a monthly count of the number
of news stories in the English media involving at least five
occurrences of the terms “cereal,” “commodity,” “food,”
“grain,” or “staple,” and their plural forms, and at least five “grain,” or “staple,” and their plural forms, and at least five
occurrences of the terms “demonstration,” “mob,” “protest,”
“riot,” “strike,” “unrest” or “violence” and their plural forms.
(Note: All empirical results are robust to a restricted dependent variable that only counts news
stories involving at least five occurrences of the terms “food” and its plural, and at least five
occurrences of the term “riot” and its plural.)
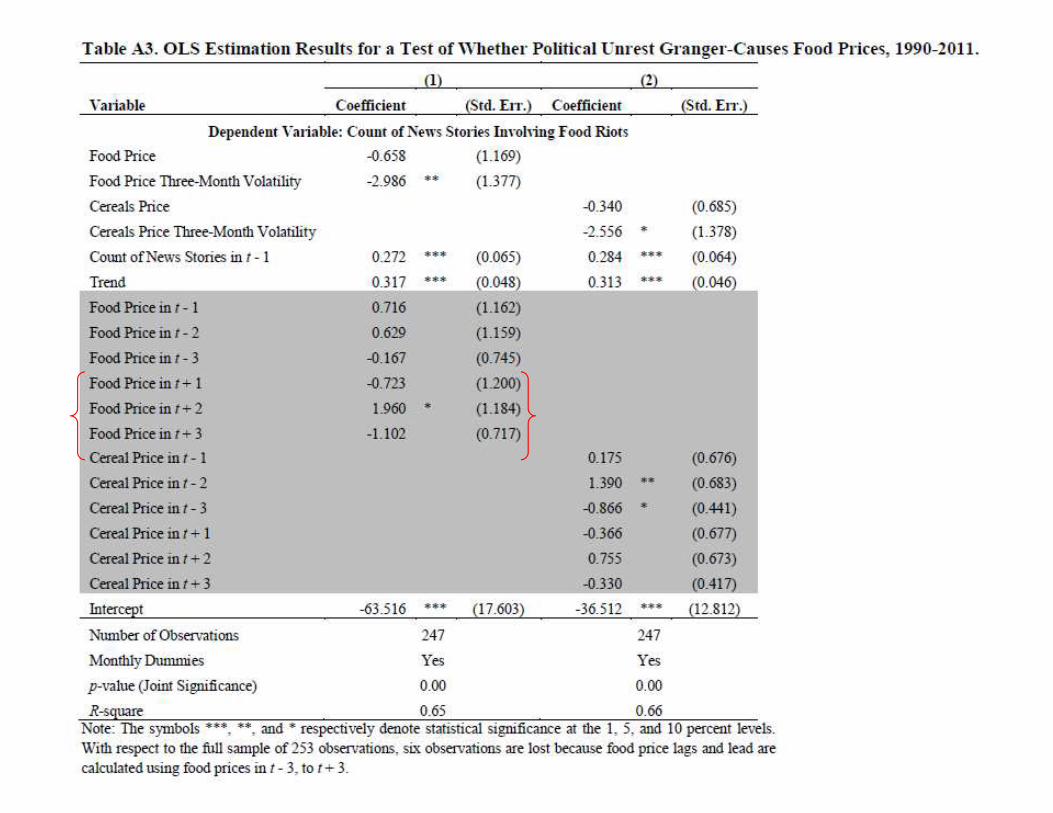
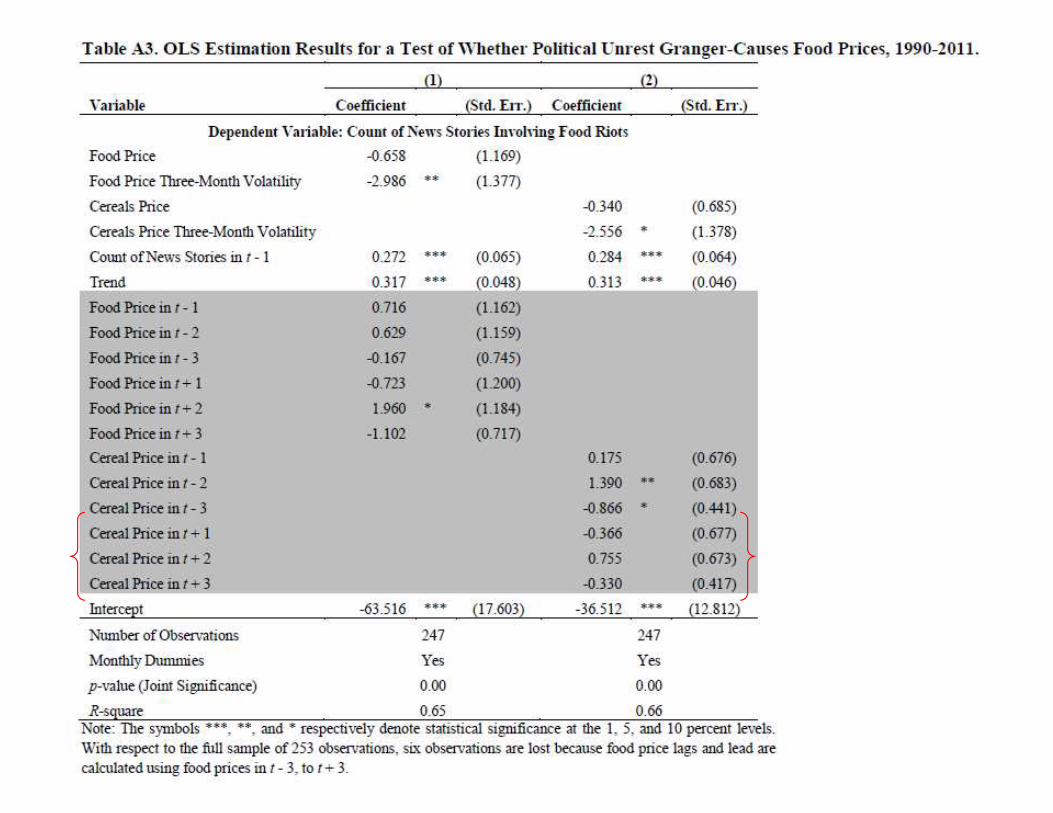
Methodology: Identification Strategy
The major methodological issue is that finding a correlation between food prices and social unrest does not mean that there is a causal relationship flowing from food prices to social unrest.
The causal relationship could also flow the other way, from social unrest to food prices. Or the dependent variable could be measured with error – the media may be on the lookout for stories about food riots when food prices rise.
In other words, correlation does not imply causation.
Methodology: Identification Strategy
One way to deal with this problem is to find a suitable instrumental variable (IV). That is, a variable that explains food prices, but which is unrelated to social unrest and only affects social unrest through food prices.
The most convincing IVs usually involve randomizing the variable of interest, but this is clearly not possible in this case.
I thus condition food prices on natural disasters (drought, extreme temperature, floods, insect infestations, storms, volcanic eruptions, and wildfires).
Methodology: Identification Strategy
It is easy to test whether natural disasters affect food prices.
It is more difficult to argue that natural disasters only affect
social unrest through food prices. social unrest through food prices.
The full argument is in the paper, but in short: within a given
month, natural disasters are unpredictable, and given the
short time scale, they should only affect social unrest
through food prices.
Methodology: Identification Strategy
The identification strategy is helped by the geographical dispersion of the data – the data used here are worldwide.
What typically happens in the data is that a natural disaster What typically happens in the data is that a natural disaster occurs in country A, which has impacts on the price of food worldwide, which affects social unrest in countries B, C, …
Thus, food prices are essentially the only channel through which natural disasters affect social unrest, since the two are highly unlikely to occur in the same country in the same month.
Methodology: Identification Strategy
The natural disasters data come from the Center for
Research on the Epidemiology of Disasters (CRED) EM-DAT
data set, which records natural disasters worldwide. An
event is classified as a disaster ifevent is classified as a disaster if
1. At least 100 people die;
2. At least 100 people require immediate assistance, are
displaced, or evacuated;
3. Public officials declare a state of emergency; or
4. Public officials call for international assistance.
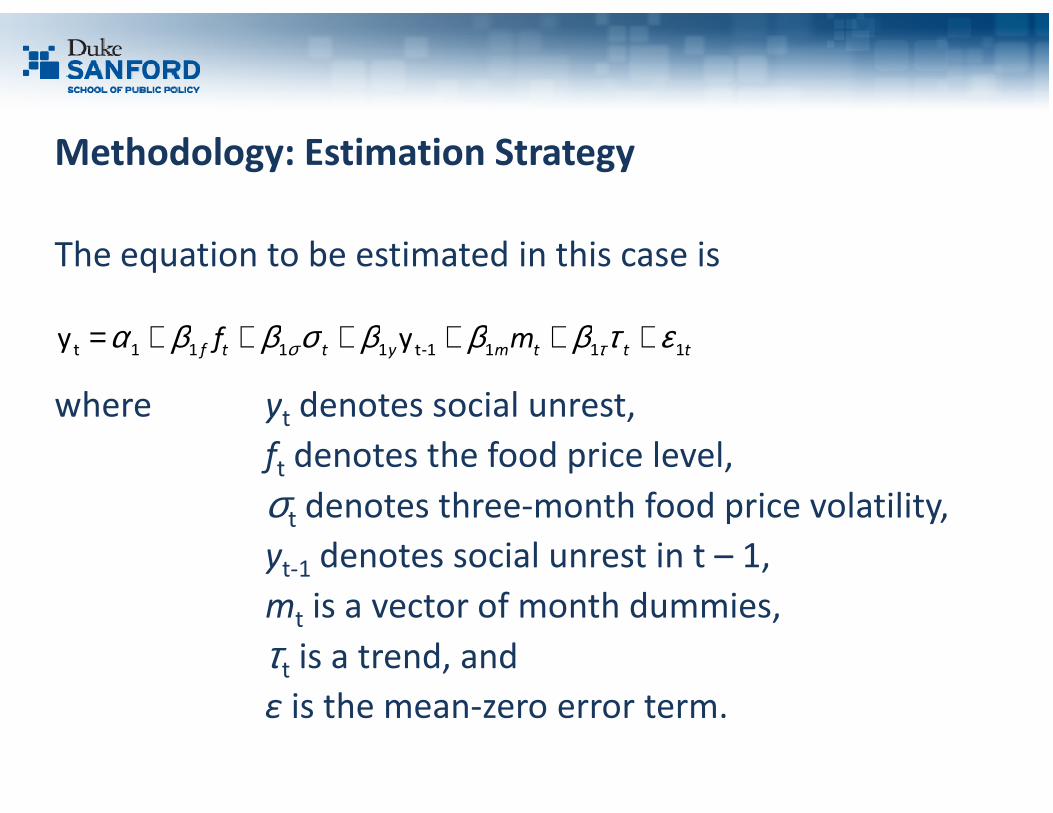
Methodology: Estimation Strategy
The equation to be estimated in this case is
where ytdenotes social unrest,
tttmyttfmf
1111-t1111tyy ετβββσββα τσ ++++++=
where ytdenotes social unrest,
ftdenotes the food price level,
σtdenotes three-month food price volatility,
yt-1
denotes social unrest in t – 1,
mtis a vector of month dummies,
τtis a trend, and
ε is the mean-zero error term.
Methodology: Estimation Strategy
Durbin-Watson tests show that the error term is not serially correlated.
Dickey-Fuller tests indicate that one can reject the presence Dickey-Fuller tests indicate that one can reject the presence of a unit root in the dependent variable and in the instrumental variable. This is not the case for the food price index, but Wang and Tomek (2007) show that food prices do not exhibit a unit root once structural breaks are accounted for.
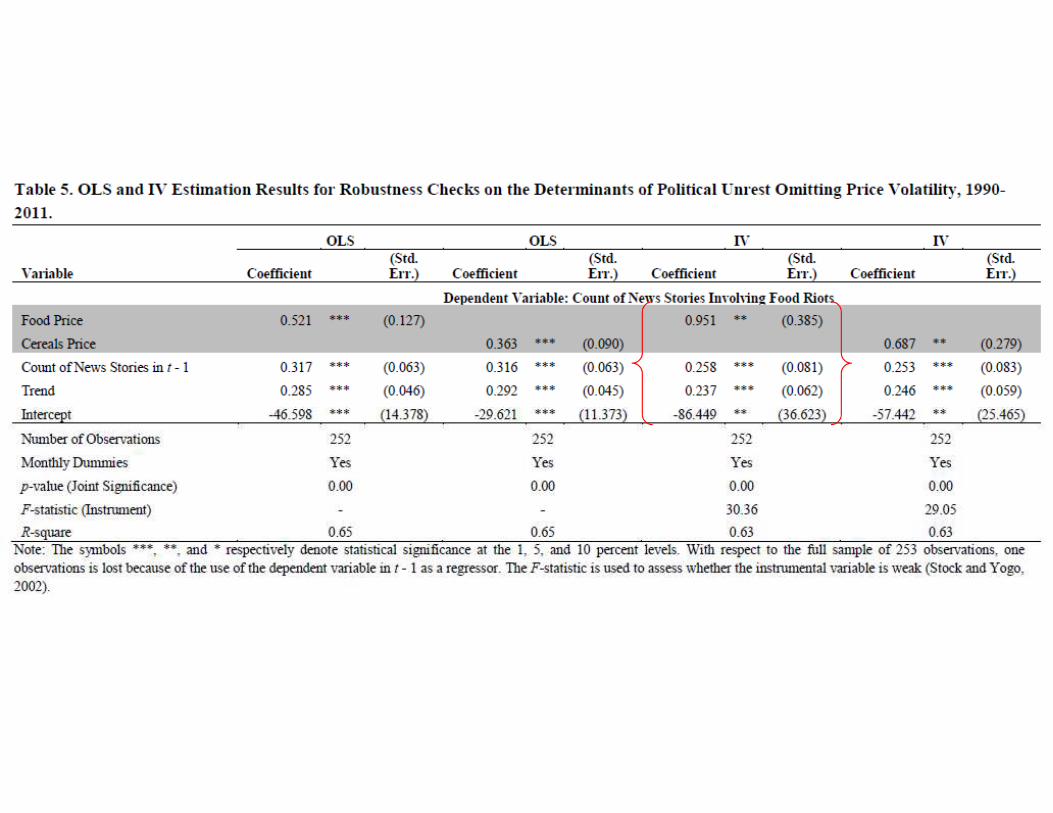
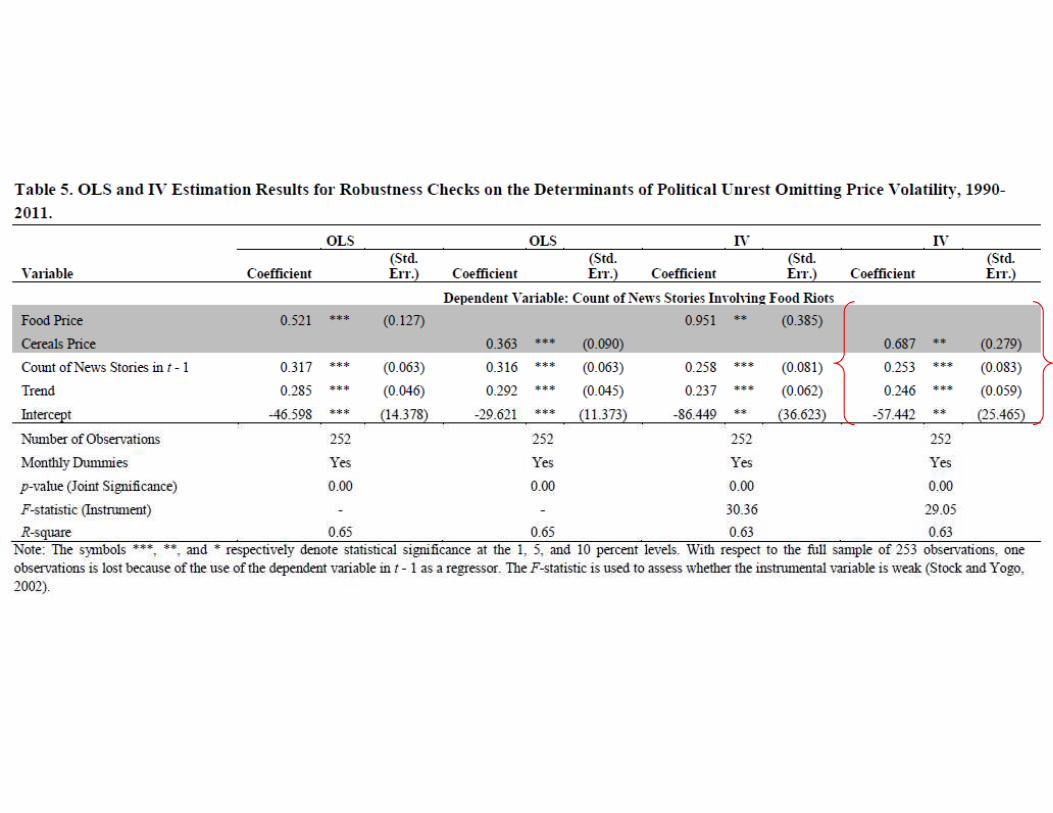
For these reasons, the core equation is estimated in levels by ordinary least squares (OLS) and two-stage least squares (IV).
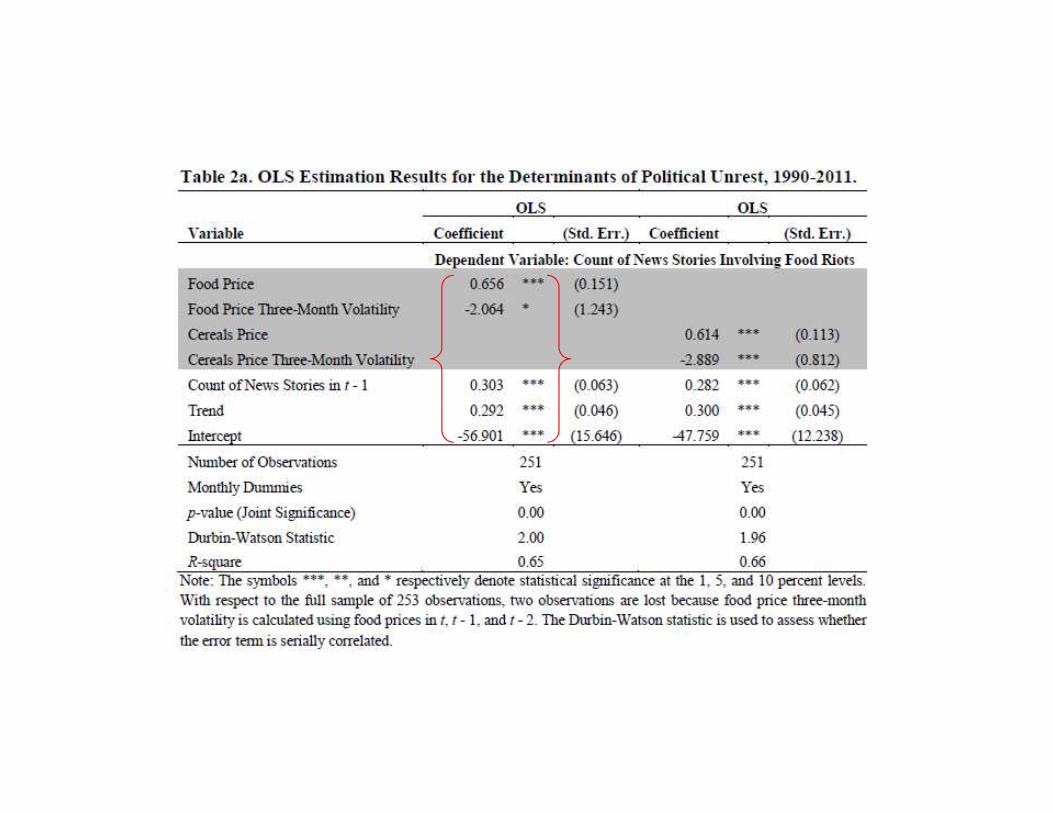
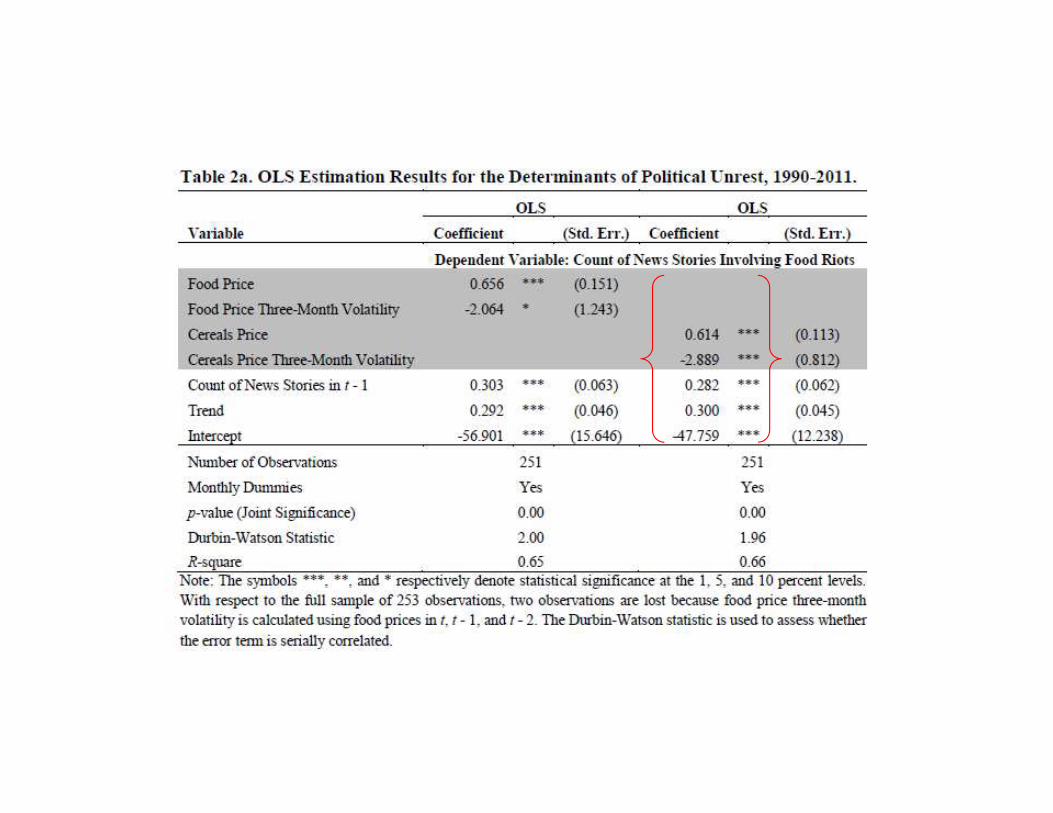
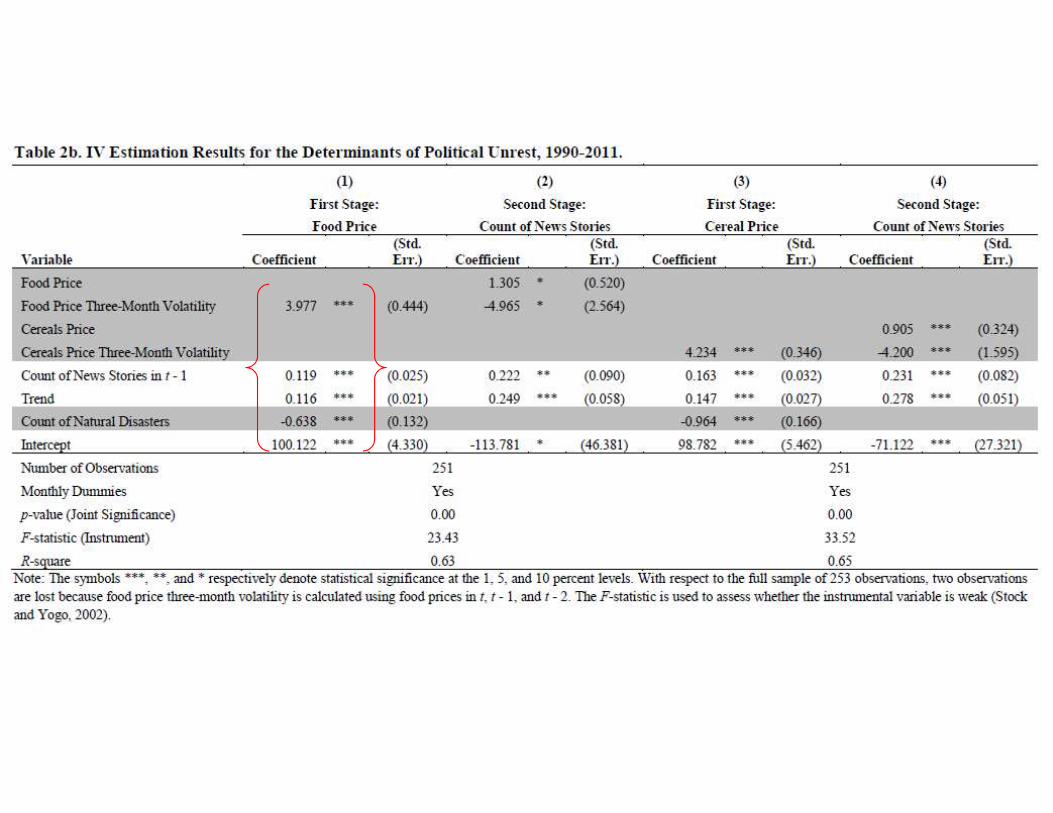
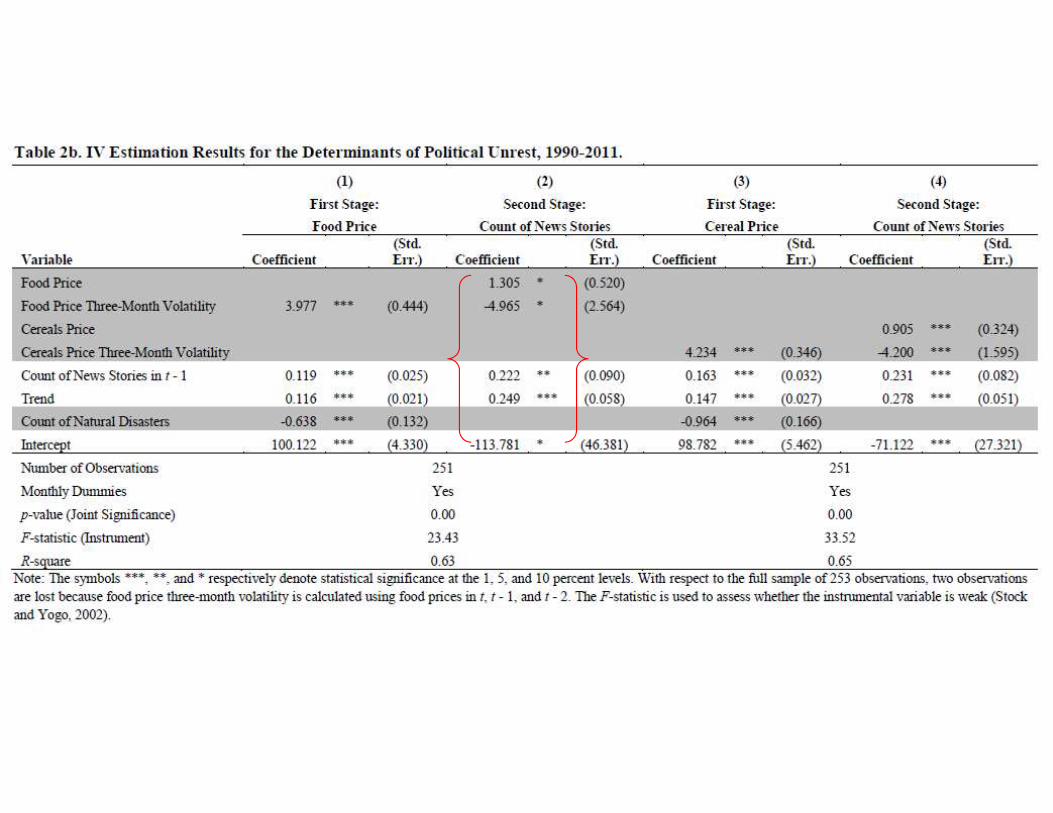
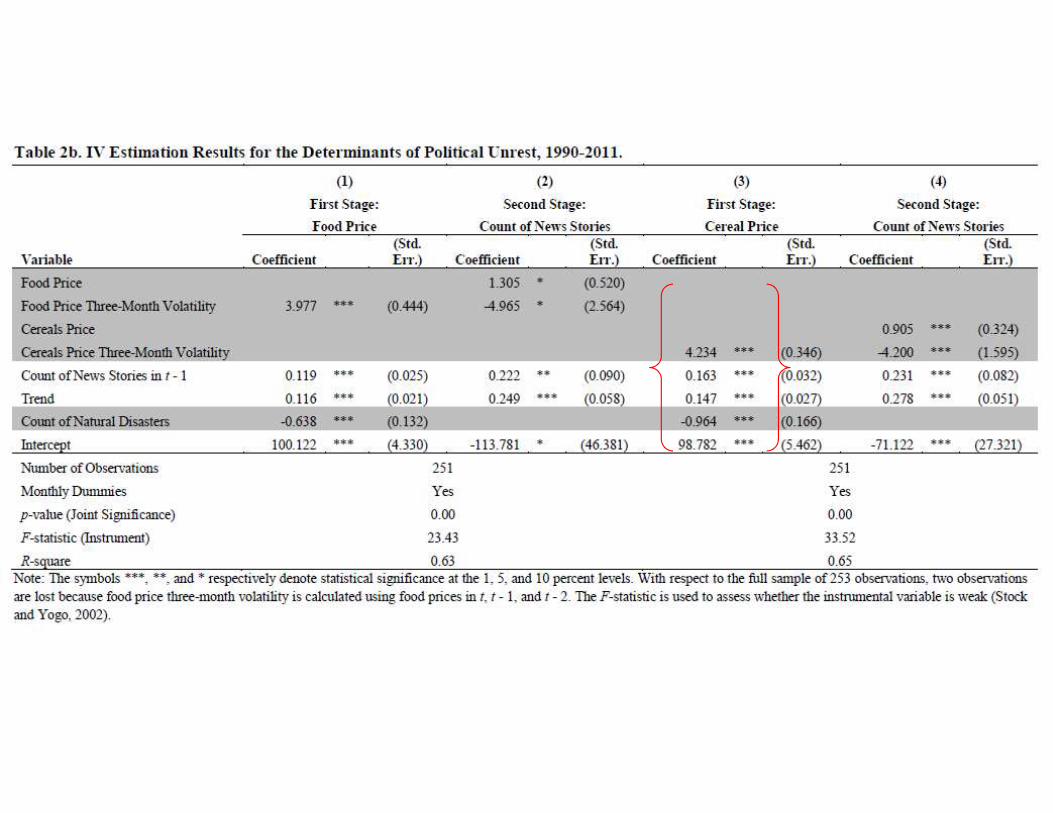
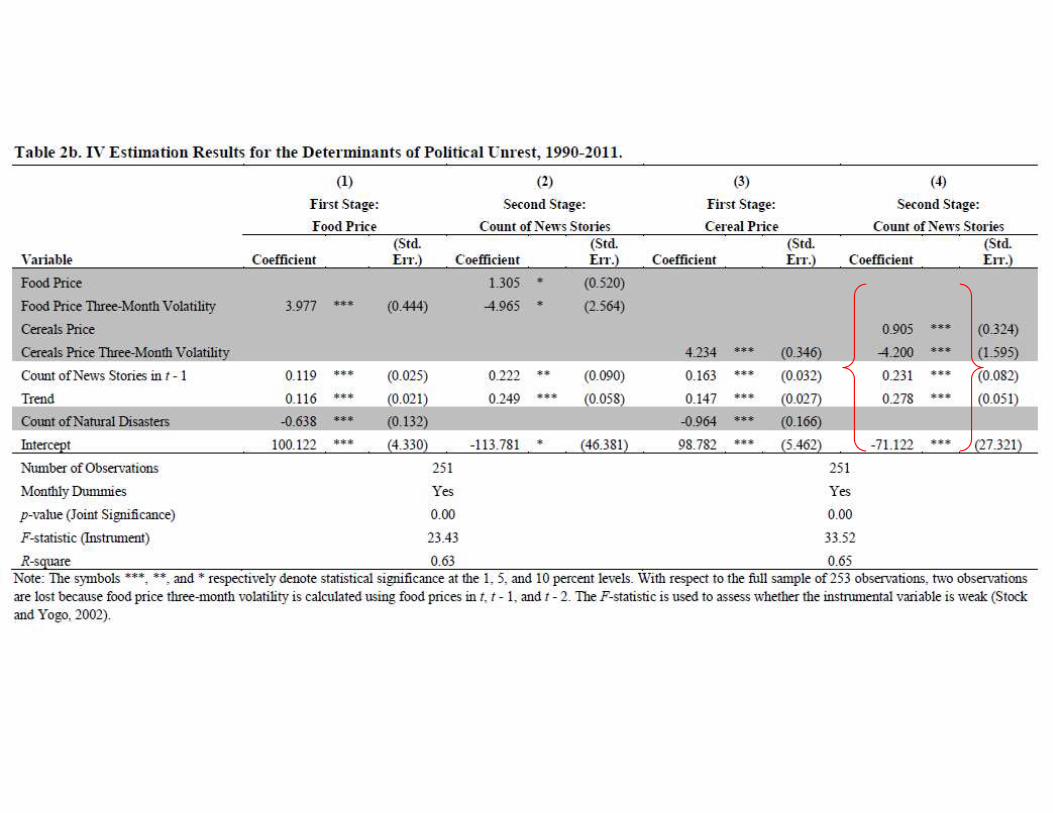
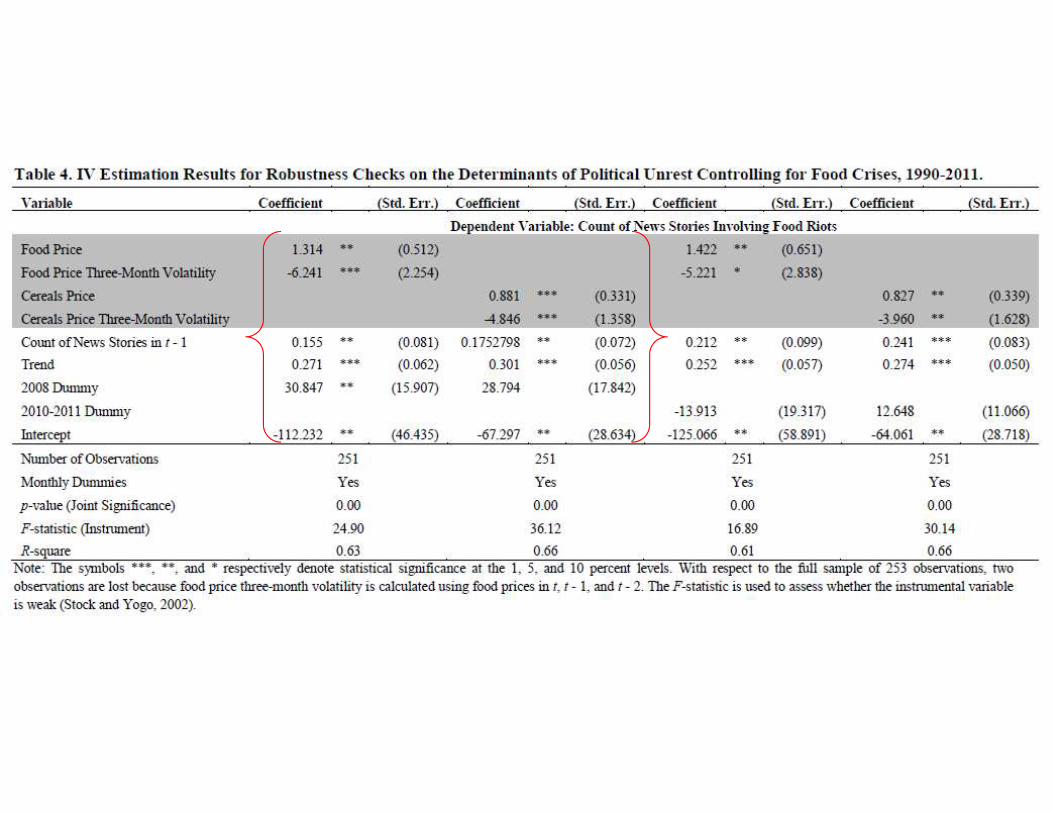
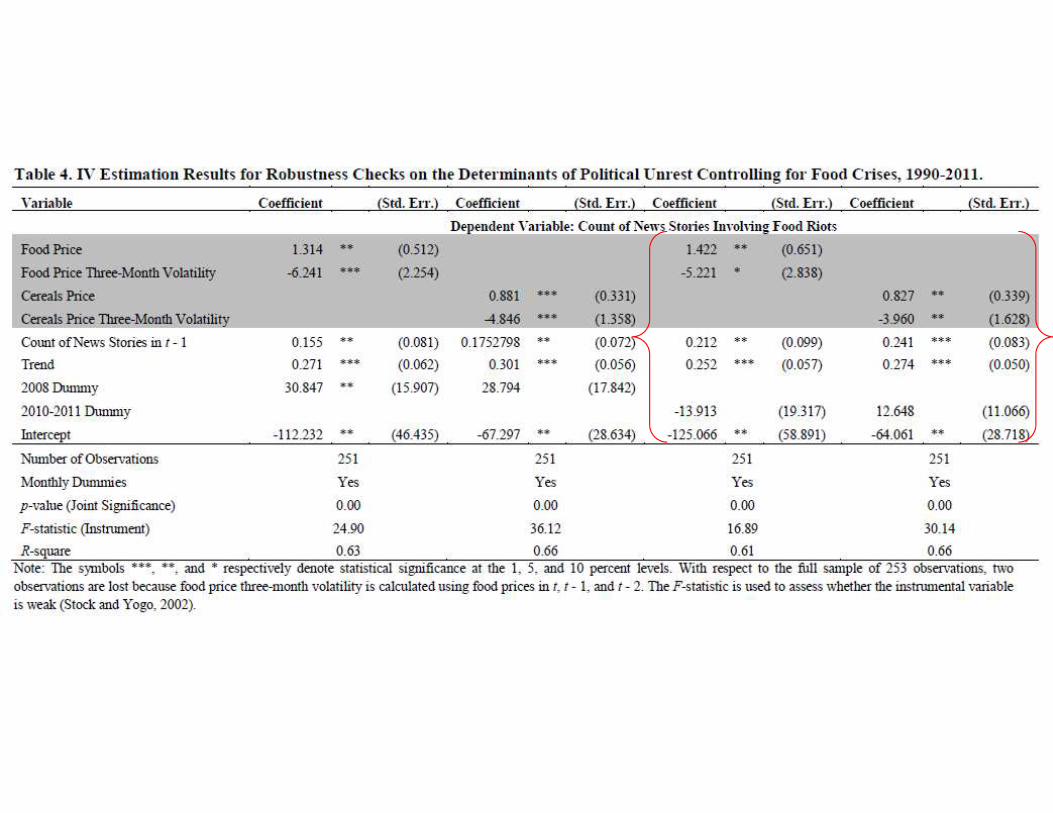
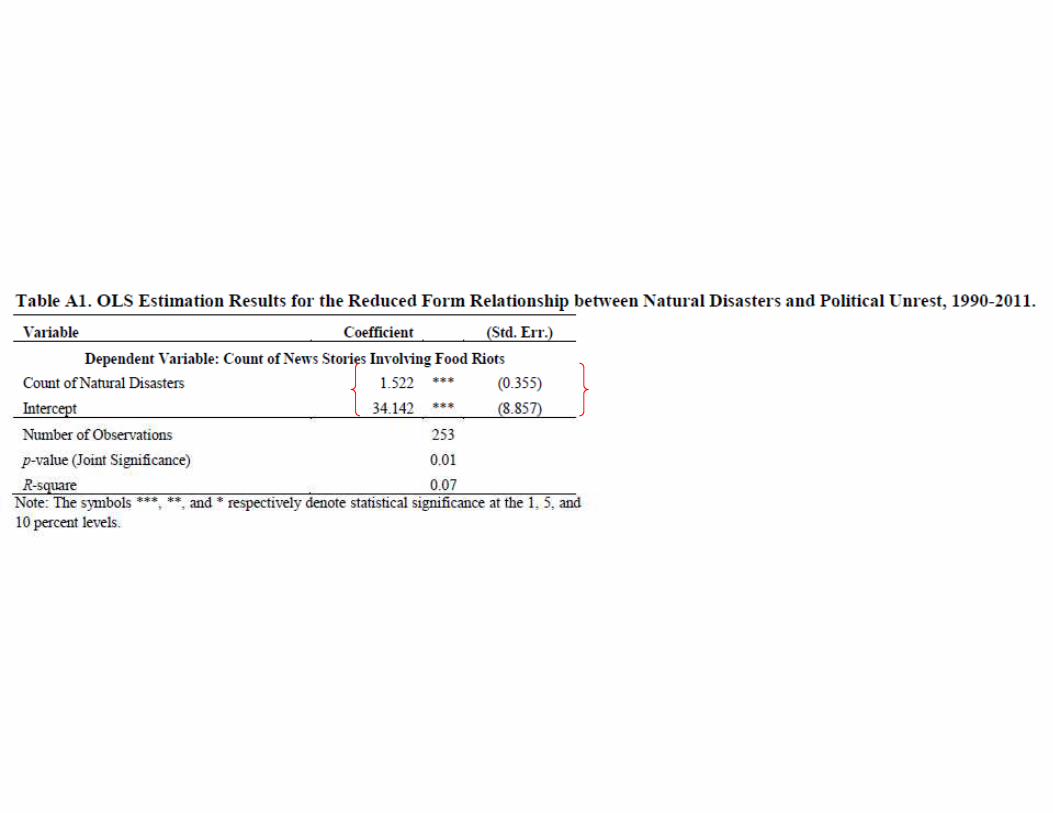
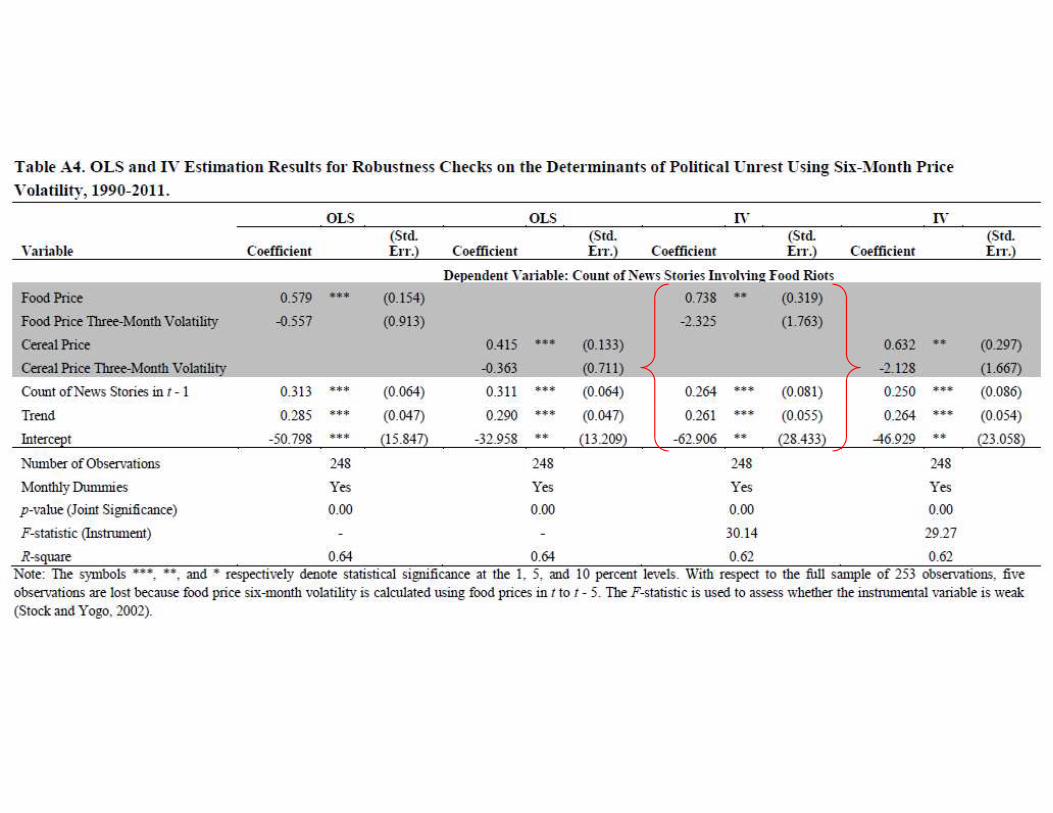
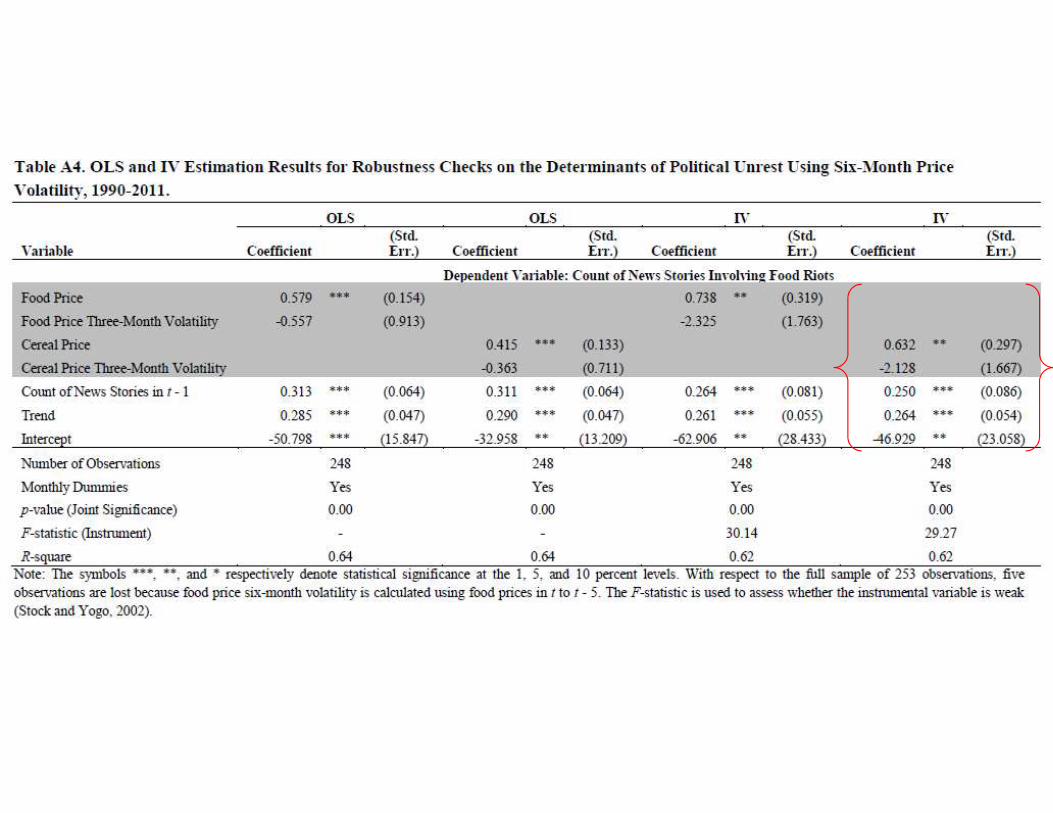
Key Findings
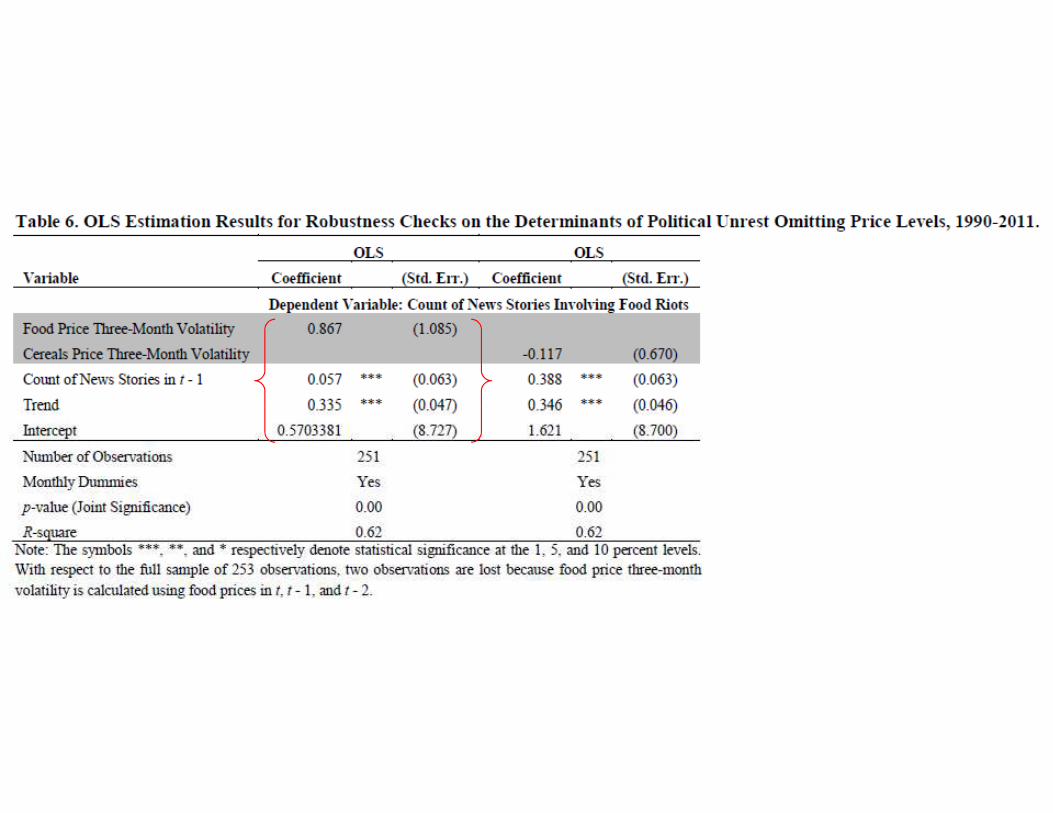
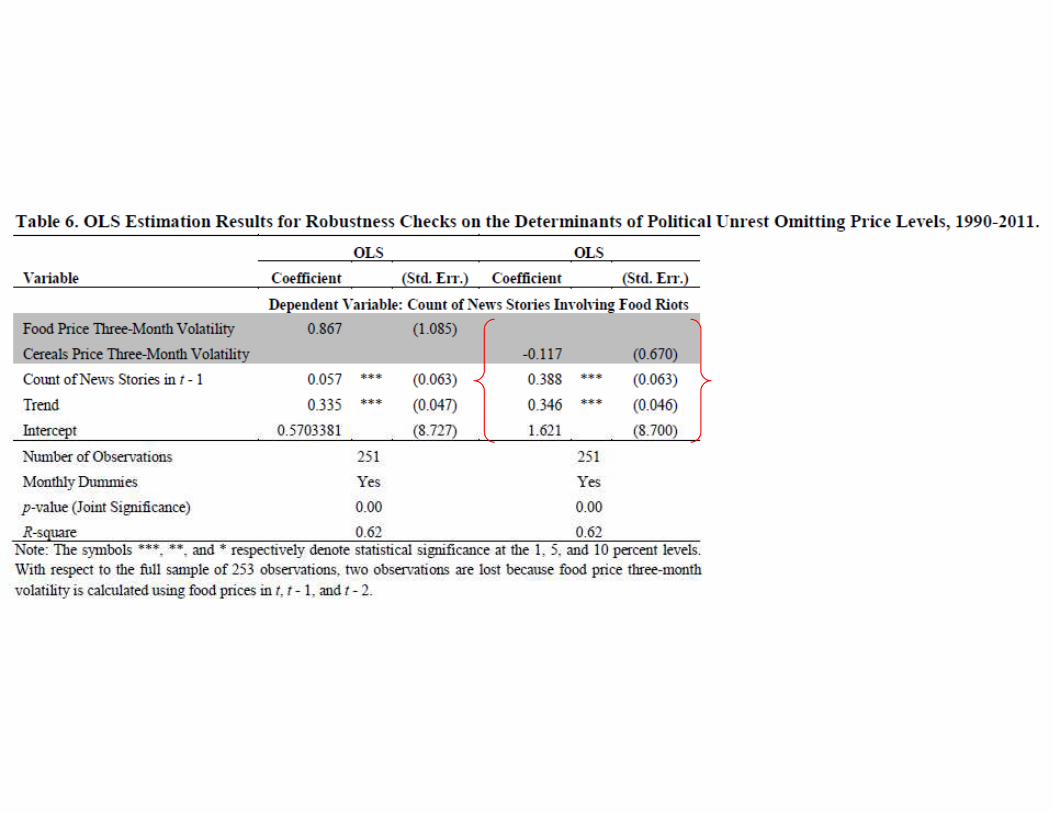
This suggests that rising food prices cause food riots.
Consistent with this, Hsiang et al. (2011) recently found a
correlation between El Niño Southern Oscillation cycles and correlation between El Niño Southern Oscillation cycles and
conflict.
Food price volatility, however, is associated with decreases in
social unrest. What does this mean?
Key Findings
First off, this cannot be argued to be causal, so it is worth
asking whether there exists other evidence on that.
The price volatility finding is consistent with evidence at the The price volatility finding is consistent with evidence at the
micro level looking at the impact of commodity price
volatility on rural households in Ethiopia (Bellemare et al.,
2011).
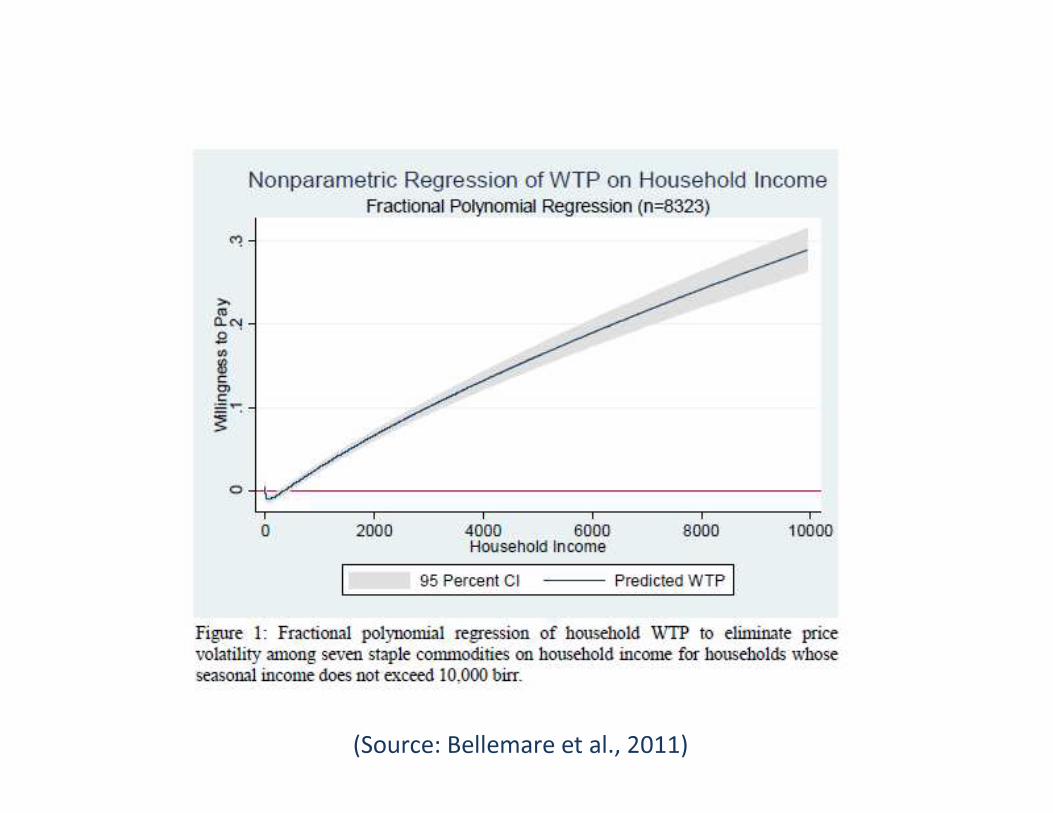
(Source: Bellemare et al., 2011)
Key Findings
The intuition behind the volatility finding is as follows.
Holding the price level constant, increases in volatility affect
producers negatively – they must sink resources into
production well ahead of realized prices (Baron, 1970; production well ahead of realized prices (Baron, 1970;
Sandmo, 1971), which leads to sub-optimal profit
maximization decisions.
Consumers, however, can change their consumption bundle
until the very last minute to enjoy relative price discounts
when showing up at market. In technical terms, this is
because of the quasiconvexity of the indirect utility function.
Key Findings
But food consumers vastly outnumber food producers –
especially in cities, where proximity between individuals
makes them more likely to organize into mobs – so it is
perhaps no surprise that increases in food price volatility are perhaps no surprise that increases in food price volatility are
associated with decreases in the level of social unrest.
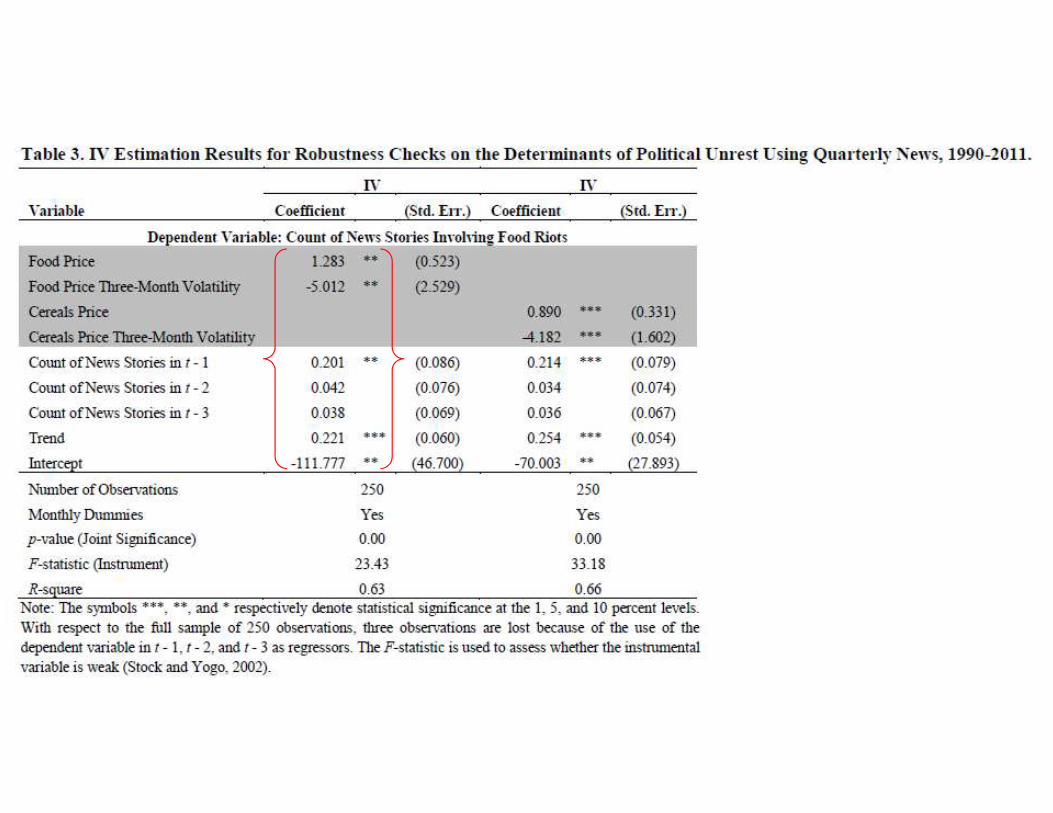
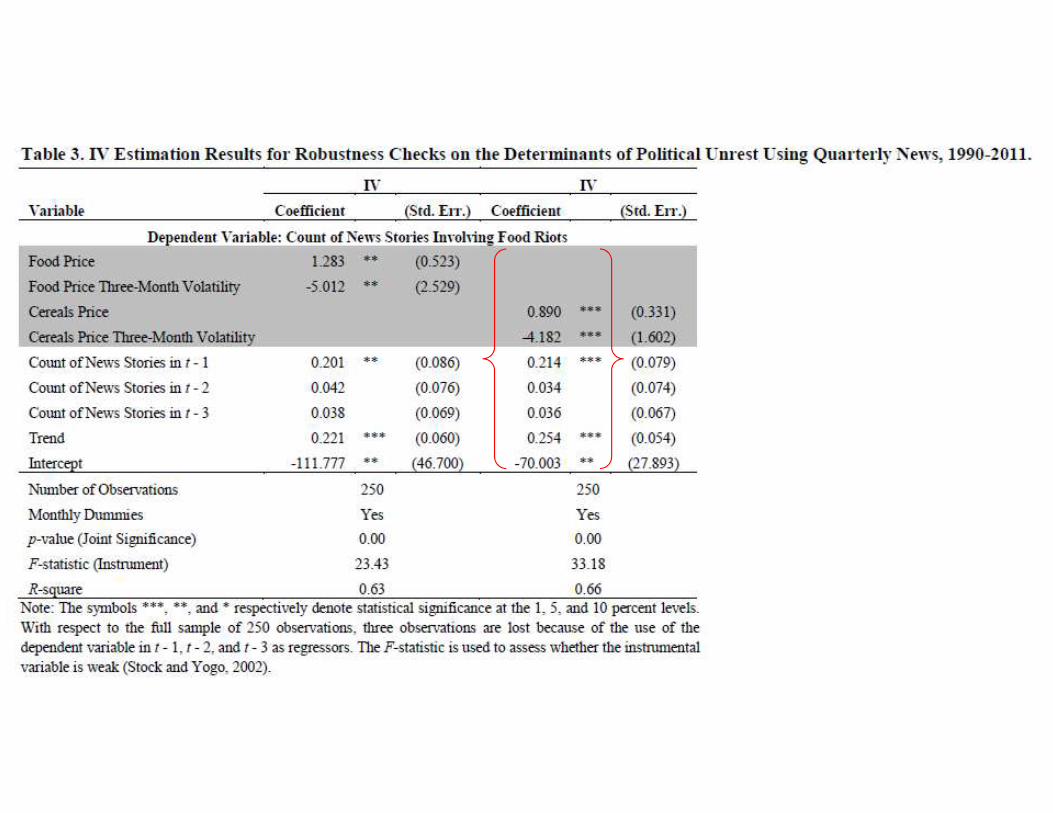
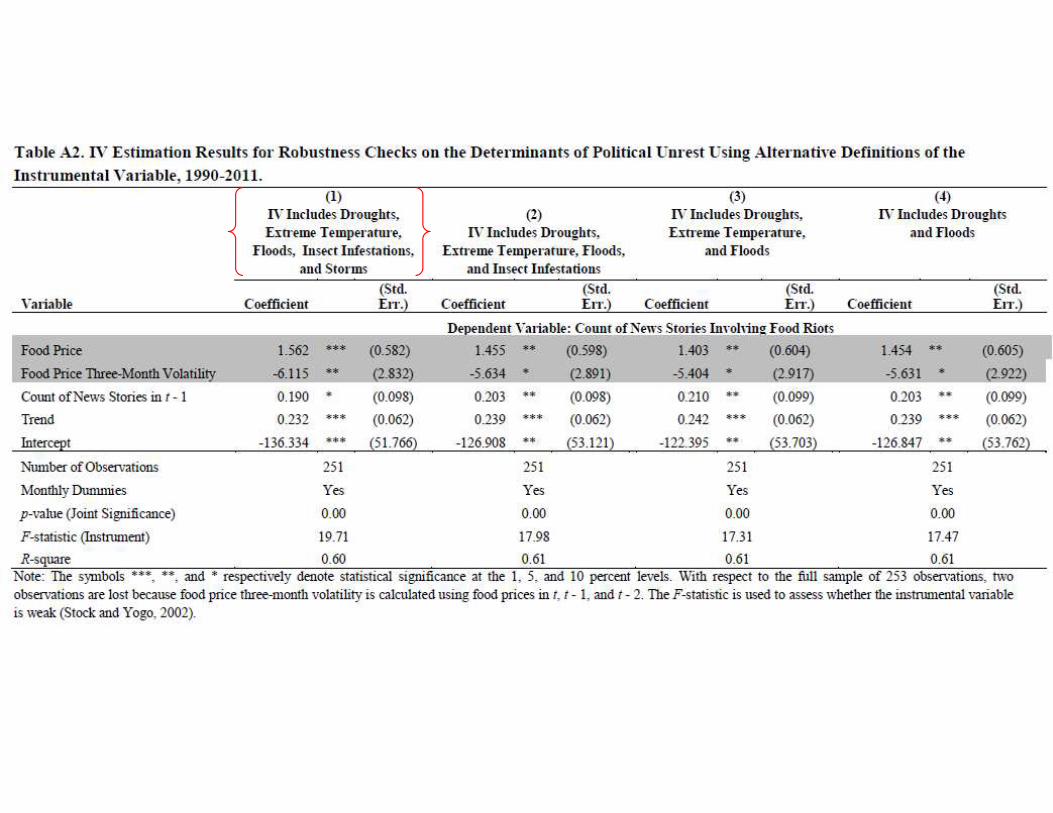
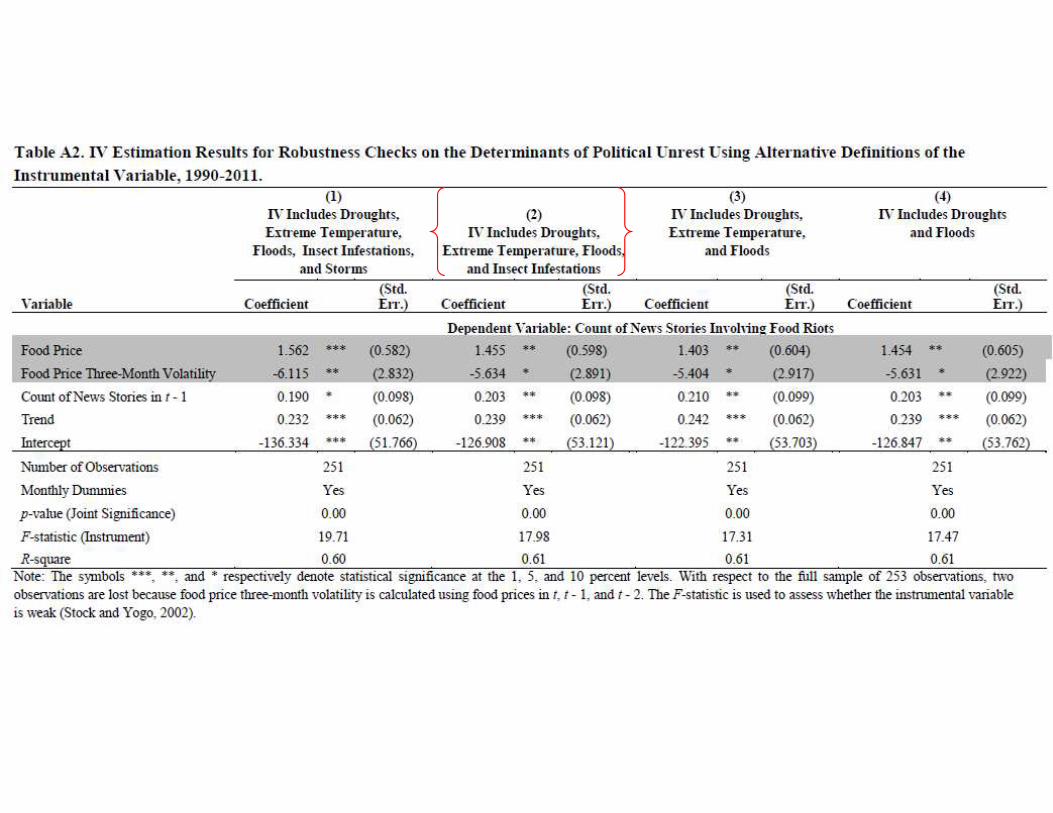
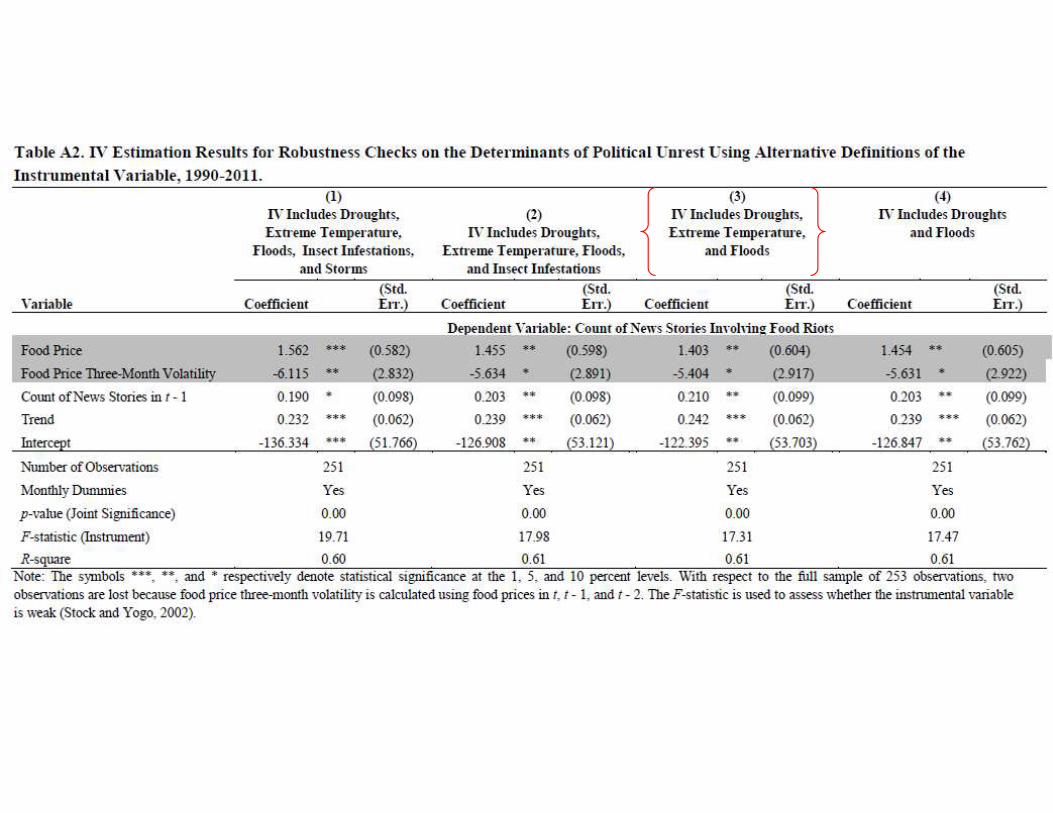
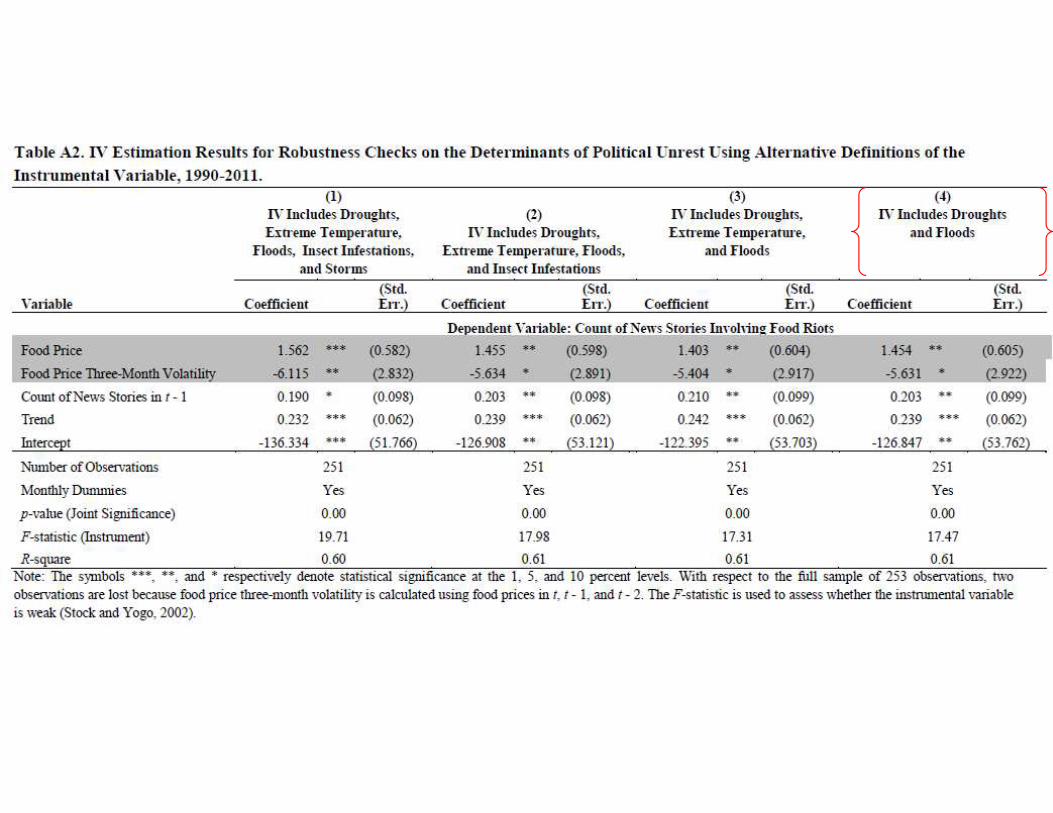
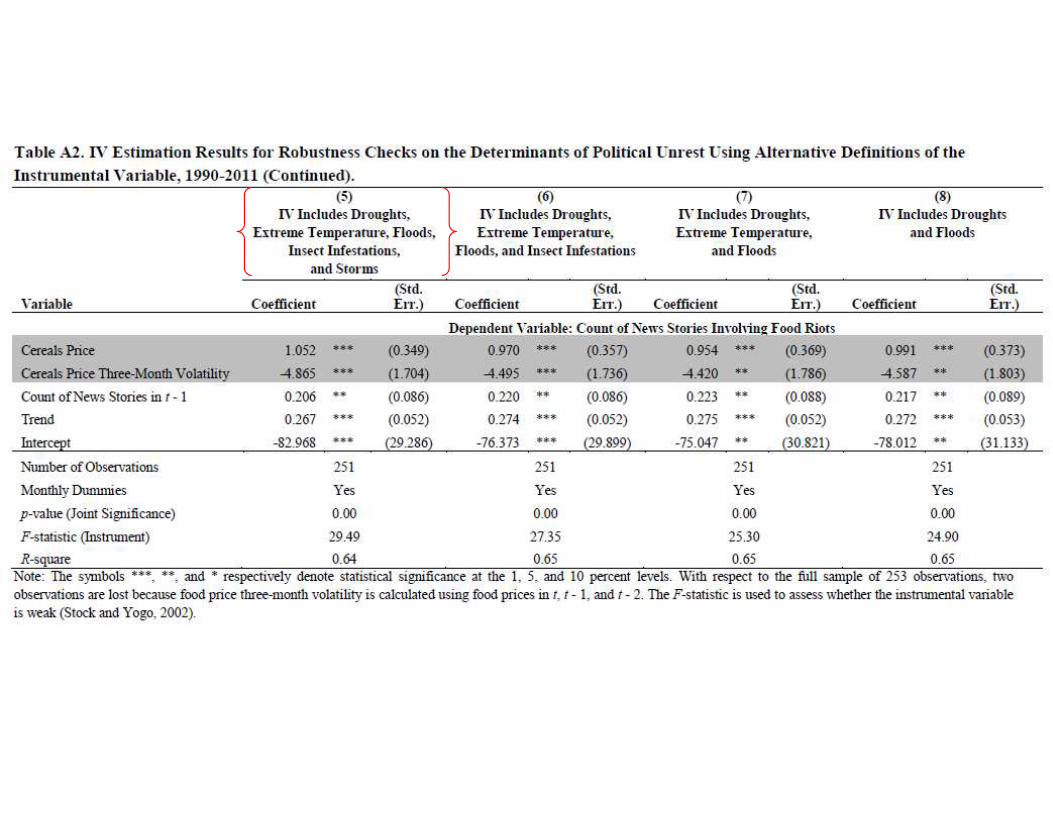
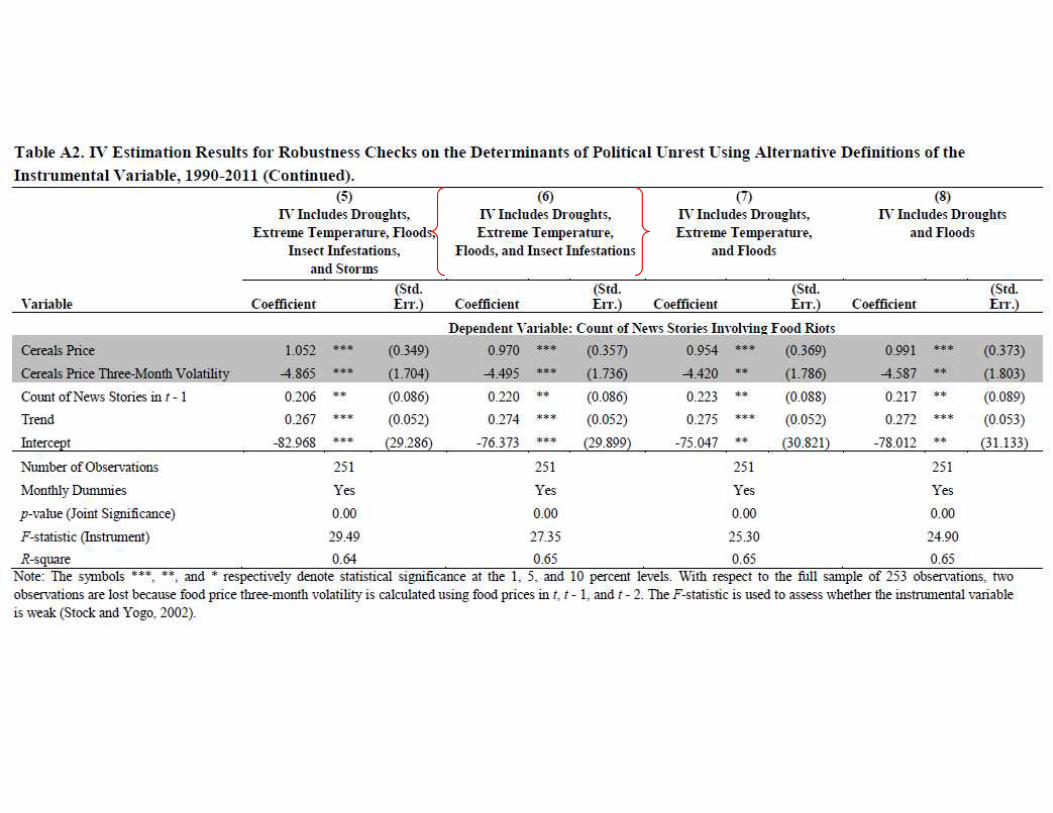
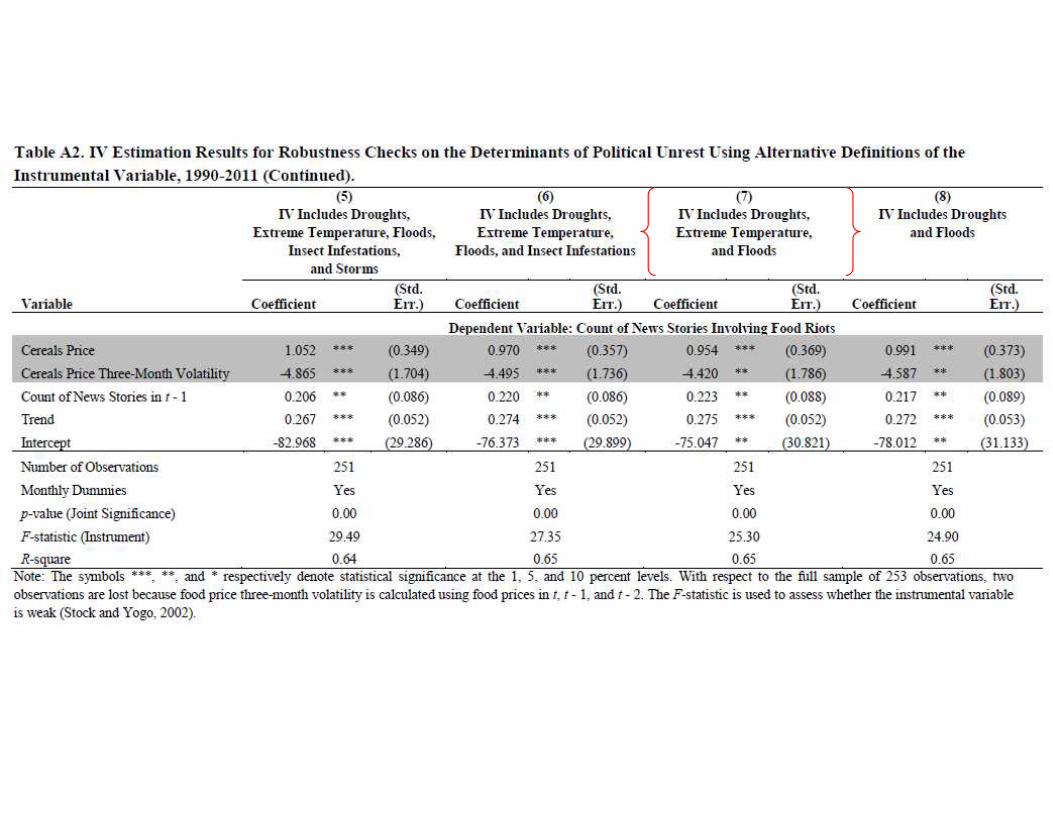
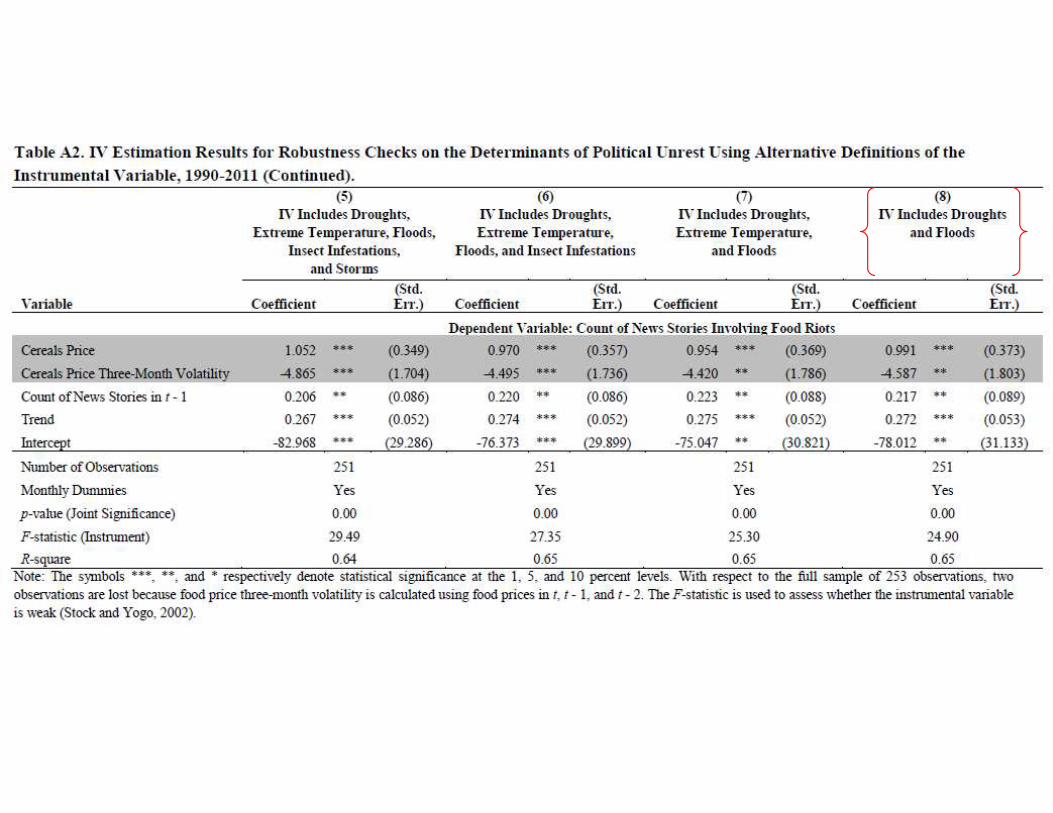
The findings are robust to controlling for quarterly news; to
controlling for food crises; to omitting food price volatility; to
alternative definitions of the IV that progressively omit some
types of natural disasters; etc.
Policy Implications
The first policy implication is that if we want to avoid food
riots, we should work toward curbing food price increases.
This is something we can be relatively confident in.
In addition, it appears that the focus on food price volatility
is misguided.
Indeed, according to my estimates, food price volatility
actually appears to reduce the incidence of food riots.
Policy Implications
On the basis of preliminary estimates, Chris Barrett and I
published the following piece in July:
You can probably guess some of the reactions to our title.
Policy Implications
Keeping food prices low and letting volatility do its thing has
negative consequences for one group, however: food
producers.
Typically, food producers have a lot more political clout than
food consumers. This is especially true in industrialized
countries, where producers are organized into lobbies and
reside in political districts that may exert too much political
power relative to their size.
Policy Implications
It looks as though two things might be happening. First,
policy makers could be really confused about the different
impacts of rising food prices and food price volatility.
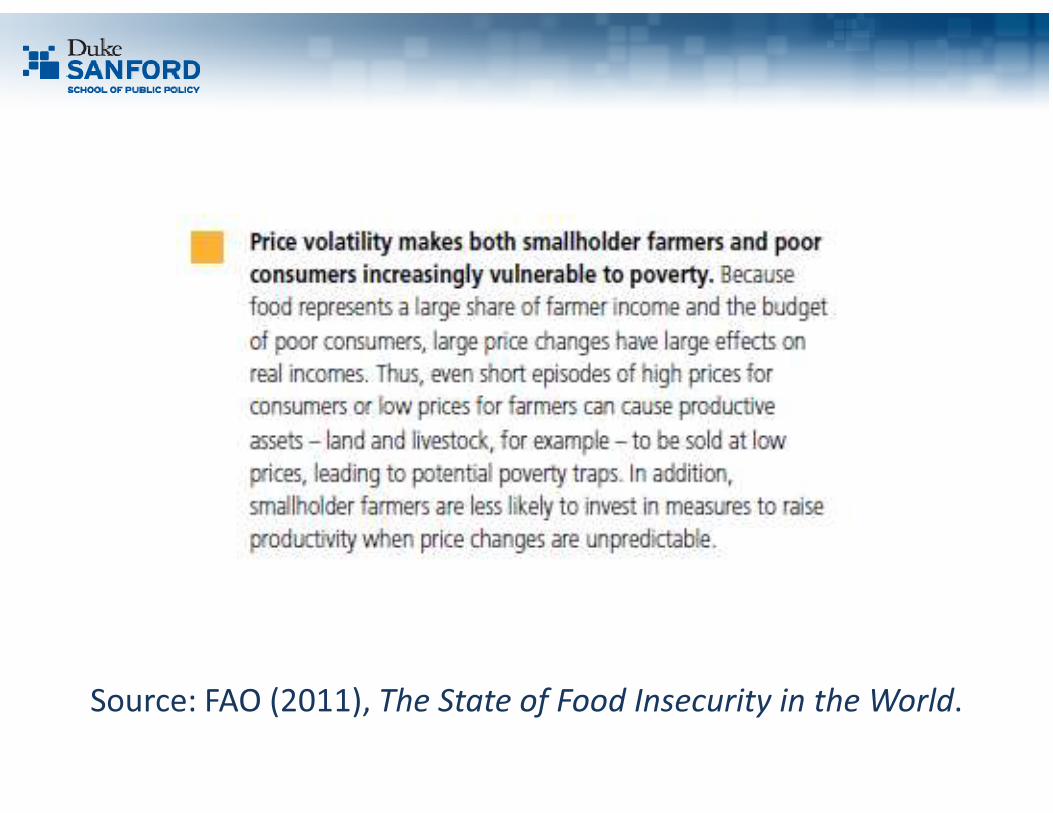
Source: FAO (2011), The State of Food Insecurity in the World.
Policy Implications
Second, policy makers may simply be responding to their constituents and to lobbies. By emphasizing the “negative” impacts of food price volatility, they may be playing right into the hands of farm lobbies.
In light of the results in this paper, this topic – the political economy of food prices – deserves further investigation, similarly to Bates (1981).
Likewise, the anatomy of food riots deserves further investigation – the relevant costs and benefits that push people into taking to the streets.

AppendixAppendix
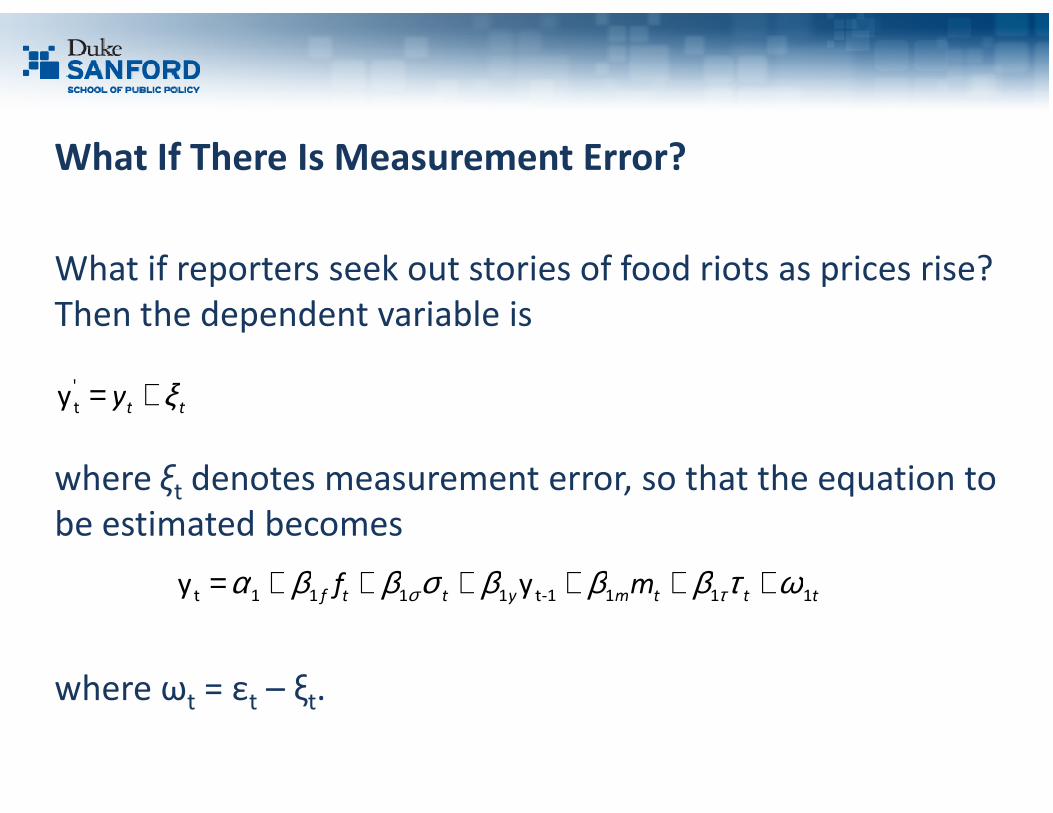
What If There Is Measurement Error?
What if reporters seek out stories of food riots as prices rise?
Then the dependent variable is
tty ξ+='
ty
where ξtdenotes measurement error, so that the equation to
be estimated becomes
where ωt= ε
t– ξ
t.
tttmyttfmf
1111-t1111tyy ϖτβββσββα τσ ++++++=
tty ξ+=
ty
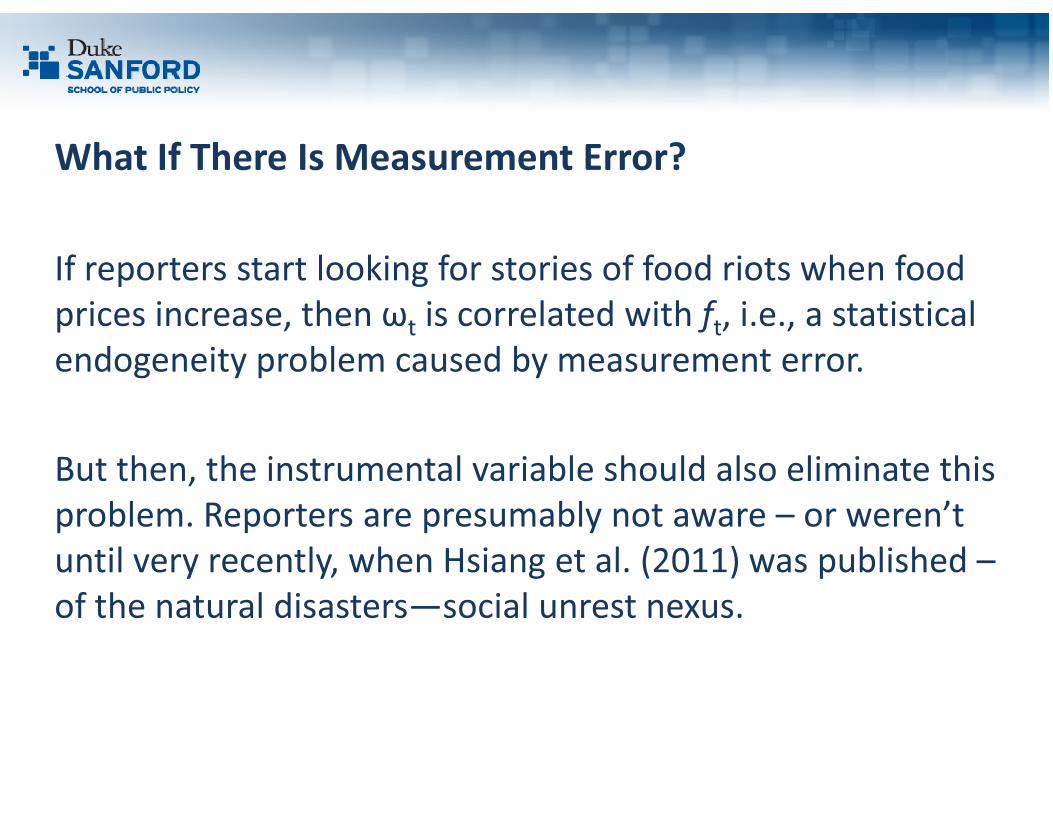
What If There Is Measurement Error?
If reporters start looking for stories of food riots when food
prices increase, then ωtis correlated with f
t, i.e., a statistical
endogeneity problem caused by measurement error.
But then, the instrumental variable should also eliminate this
problem. Reporters are presumably not aware – or weren’t
until very recently, when Hsiang et al. (2011) was published –
of the natural disasters—social unrest nexus.