Embed Size (px)
Citation preview
Estimates of Demand Relationships forApricots and Apricot Products
Ben C. French, Ali Eryilmaz, and Kathryn Blackman
Apricots are a unique commodity in that they are used in four ways: for fresh marketsand for canning, freezing, and drying. This article formulates a model of the demandsystem for this commodity and presents FIML and 2SLS estimates of thesimultaneous components of the system. The empirical findings include estimates ofprice flexibilities and elasticities and equations that predict prices and allocationsamong product forms, given the annual production.
Key words: apricots, derived demand, econometric model, processed fruit, pureflexibilities.
Apricots are canned, frozen, dried, and mar-keted fresh. The prices received by processorsand growers are determined by an interrelatedstructure of derived demands, grower alloca-tion decisions, and processor-grower bargain-ing. This article formulates a conceptual modelof the structure of this system and presentsestimates of price elasticities (or price flexi-bilities) for the four product forms at processorand farm levels. While the empirical findingsare specific to apricots, the modeling approachis applicable to other processed fruit and veg-etables.
Background Information
Over 95% of U.S. apricot production is in Cal-ifornia. The balance is grown in Washingtonand Utah (primarily Washington) with mostof the Washington-Utah crop sold for freshuse. Table 1 shows the quantities of apricotsproduced in California over the period 1956to 1989 (years grouped to save space) and theallocation of the output among the four utili-zation forms. Table 2 shows the quantities pro-
Ben C. French is a professor, Department of Agricultural Econom-ics, University of California, Davis. Ali Eryilmaz is Deputy Di-rector General, Ministry of Agriculture, Turkey. Kathryn Black-man is a graduate research assistant, University of California, Davis.
Giannini Foundation Paper No. 994.The authors are appreciative of helpful comments from three
anonymous Journal reviewers.
duced in Washington and Utah and the quan-tities of canned and dried apricots exportedand imported nationally. Some fresh marketapricots also are exported but the amounts havenot been reported separately since 1976.
Beginning in the 1970s, California apricotoutput (and acreage) declined substantially,falling to about half of the pre-1970 level by1986-89. The decrease appears to have beenprimarily in response to reduced grower re-turns associated with declining demand, es-pecially in the major canned product market.Some of the reduction in canning was offsetby increases in freezing, but the combined can-ning-freezing tonnage in 1986-89 was still lessthan halfofthe pre-1970 level. Canned exportsalso declined substantially while canned im-ports, nearly nonexistent before 1980, becamesignificant in the 1980s.
California fresh market production and salesdeclined in the 1960s and 1970s, but increasedagain in the 1980s. Washington-Utah freshproduction followed a similar pattern (table 2).Most California shipments are in May and Junewhereas Washington-Utah shipments are inJuly and August, so there is little interregionalcompetition.
Dried apricot production declined absolute-ly in the 1980s but with some increase in uti-lization share compared to pre-1975 levels. Atthe same time, imports of dried apricots(mainly from Turkey) increased sharply, sub-stantially exceeding U.S. production in the1980s.
Western Journal of Agricultural Economics, 16(2): 345-359Copyright 1991 Western Agricultural Economics Association
Western Journal ofAgricultural Economics
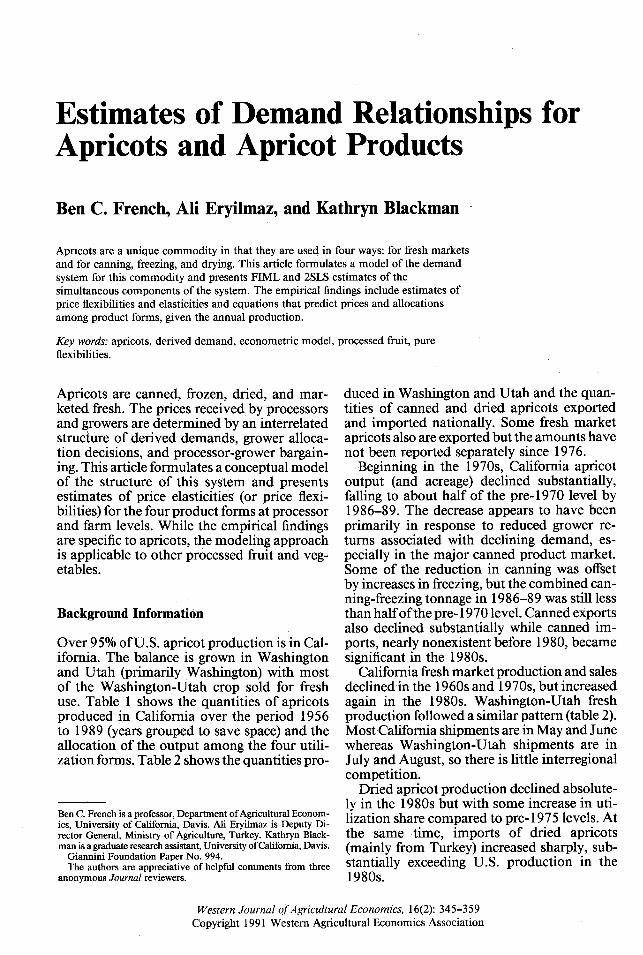
Table 1. Production and Utilization of California Apricots, 1956-89 (Average Annual Values,Fresh Weight)
_~~~~~~Produc- _UtilizationProduc-
tion Fresh Market Canned Frozen Dried
1,000 1,000 1,000 1,000 1,000Period tons tons % tons % tons % tons %
1956-60 175.7 11.6 6.6 119.2 67.8 3.5 2.0 41.4 23.61961-65 185.0 12.9 7.0 129.5 70.0 7.1 3.8 35.5 19.21966-70 173.0 9.6 5.5 122.6 70.9 8.3 4.8 32.5 18.81971-75 137.0 8.3 6.1 98.5 71.9 8.4 6.1 21.8 15.91976-80 129.8 7.9 6.1 79.5 61.2 9.4 7.2 33.0 25.51981-85 101.3 10.6 10.4 55.4 54.7 11.0 10.9 24.3 24.01986-89 87.5 11.2 12.8 47.4 54.2 11.0 12.6 17.9 20.4
Source: Annual reports of the U.S. Agricultural Statistics Board.
Table 3 shows the overall movement of theaverage annual deflated prices for apricots andapricot products from 1956 to 1988. The re-ported grower fresh market price is based ongraded fruit and does not allow for the sub-stantial quantities culled. Hence, it is higherthan the grower price for fresh apricots usedfor canning and freezing. Other things account-ing for the fresh-canning price differences arequality factors, time of harvest, and possiblysome lags in adjusting allocations to changesin market returns. The grower price for freshapricots allocated to drying is the price afterdrying, expressed per equivalent raw-productton. The higher value reflects the added costof drying and quality and varietal differences.'
The APC, a farmer cooperative, plays animportant role in determining prices receivedby growers for apricots used for processing.Organized in 1961 to provide information andservices to growers, its major function since1974 has been to bargain with private (nonco-op) processors over prices and terms of tradefor its members. The negotiated prices tend toset the industry standard. Data from APC in-dicate that in 1990 there were nine apricot
'In the 1950s and 1960s many growers dried their own apricots.The grower prices reported by the California Crop Reporting Ser-vice (CRS), although expressed in fresh equivalents, reflected theadded cost of drying. With the growth of commercial dry yardsand price bargaining by the Apricot Producers of California (APC),the CRS in 1977 shifted to direct reporting of prices received bygrowers for fresh apricots sold to dryers. However, this shift wasnot noted in the CRS reports. To maintain the consistency of theprice series over time, prices in table 3 are prices paid to dryersby packers, as reported in the annual Federal-State Market Newsreports, Marketing California Dried Fruits, expressed in equivalentfresh weight. Since 1977, grower prices for fresh apricots used fordrying have averaged about 20% higher than prices for fresh fruitused for canning, reflecting differences in product characteristics.
canning firms (two cooperatives and some firmswith more than one plant), six freezers, and 22dryers. Since 1971 the industry has supporteda state marketing order program to improvedemand through advertising, promotion, andproduct research.
Structure of Demand
Because Washington-Utah apricot productionwas primarily for fresh market sales during theyears included in this study and was mostlysold in different months than California freshapricots, the analysis that follows focuses onlyon the California industry. A demand modelfor Washington apricots was estimated by Pricefor an earlier period (1948-64 data).
The California demand model is conceivedto include the following types of relationships:
(a) derived demand functions facing proces-sors of canned, dried, and frozen apricots;
(b) derived demand functions for importedcanned and dried apricots (if U.S. and im-ported apricots are differentiated in theminds of buyers);2
(c) import supply functions for canned anddried apricots;
(d) functions which allocate available U.S.processed product supply between currentsales and carry-over to the next year;
(e) derived demand functions facing Califor-nia fresh-market apricot growers;
2 Frozen apricots are not imported or exported in significantquantities.
346 December 1991'
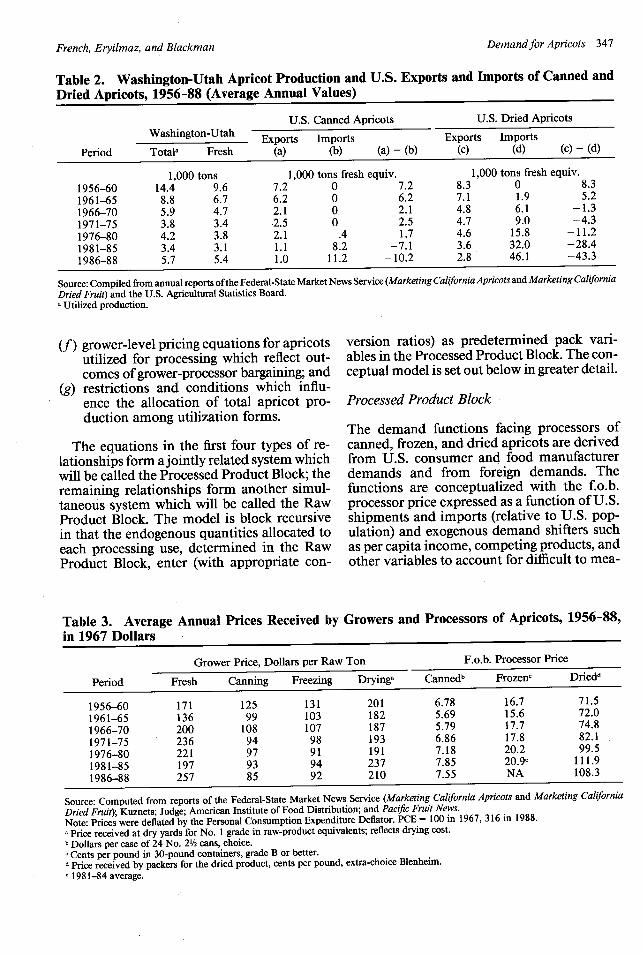
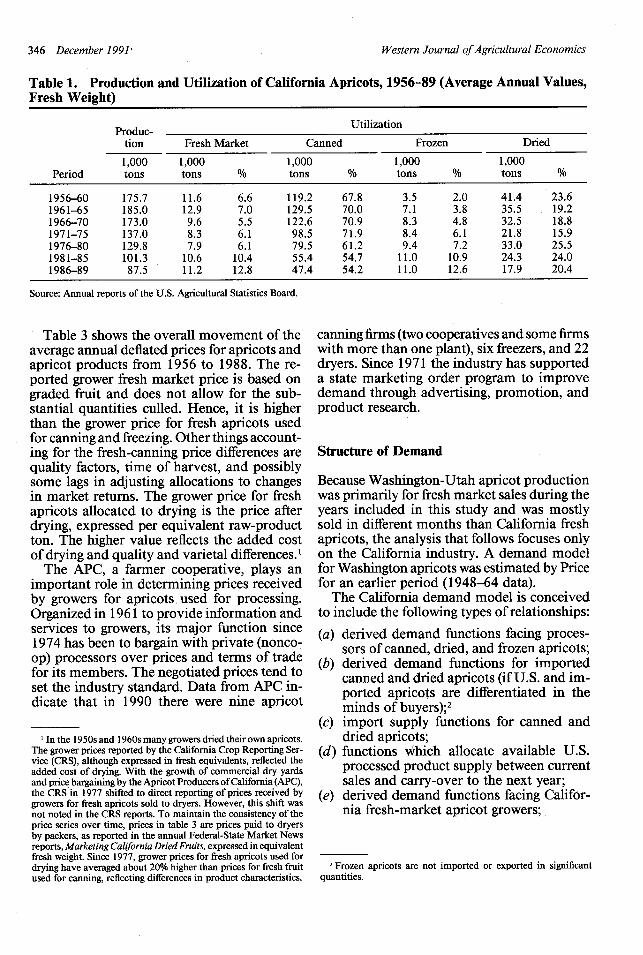
Table 2. Washington-Utah Apricot Production and U.S. Exports and Imports of Canned andDried Apricots, 1956-88 (Average Annual Values)
U.S. Canned Apricots U.S. Dried Apricots
Washington-Utah Exports Imports Exports Imports
Period Totala Fresh (a) (b) (a) - (b) (c) (d) (c) - (d)
1,000 tons 1,000 tons fresh equiv. 1,000 tons fresh equiv.
1956-60 14.4 9.6 7.2 0 7.2 8.3 0 8.3
1961-65 8.8 6.7 6.2 0 6.2 7.1 1.9 5.2
1966-70 5.9 4.7 2.1 0 2.1 4.8 6.1 -1.3
1971-75 3.8 3.4 2.5 0 2.5 4.7 9.0 -4.3
1976-80 4.2 3.8 2.1 .4 1.7 4.6 15.8 -11.2
1981-85 3.4 3.1 1.1 8.2 -7.1 3.6 32.0 -28.4
1986-88 5.7 5.4 1.0 11.2 -10.2 2.8 46.1 -43.3
Source: Compiled from annual reports of the Federal-State Market News Service (Marketing California Apricots and Marketing CaliforniaDried Fruit) and the U.S. Agricultural Statistics Board.a Utilized production.
(f) grower-level pricing equations for apricotsutilized for processing which reflect out-comes of grower-processor bargaining; and
(g) restrictions and conditions which influ-ence the allocation of total apricot pro-duction among utilization forms.
The equations in the first four types of re-lationships form a jointly related system whichwill be called the Processed Product Block; theremaining relationships form another simul-taneous system which will be called the RawProduct Block. The model is block recursivein that the endogenous quantities allocated toeach processing use, determined in the RawProduct Block, enter (with appropriate con-
version ratios) as predetermined pack vari-ables in the Processed Product Block. The con-ceptual model is set out below in greater detail.
Processed Product Block
The demand functions facing processors ofcanned, frozen, and dried apricots are derivedfrom U.S. consumer and food manufacturerdemands and from foreign demands. Thefunctions are conceptualized with the f.o.b.processor price expressed as a function of U.S.shipments and imports (relative to U.S. pop-ulation) and exogenous demand shifters suchas per capita income, competing products, andother variables to account for difficult to mea-
Table 3. Average Annual Prices Received by Growers and Processors of Apricots, 1956-88,in 1967 Dollars
Grower Price, Dollars per Raw Ton F.o.b. Processor Price
Period Fresh Canning Freezing Dryinga Cannedb Frozenc Driedd
1956-60 171 125 131 201 6.78 16.7 71.5
1961-65 136 99 103 182 5.69 15.6 72.0
1966-70 200 108 107 187 5.79 17.7 74.8
1971-75 236 94 98 193 6.86 17.8 82.1
1976-80 221 97 91 191 7.18 20.2 99.5
1981-85 197 93 94 237 7.85 20.9e 111.9
1986-88 257 85 92 210 7.55 NA 108.3
Source: Computed from reports of the Federal-State Market News Service (Marketing California Apricots and Marketing California
Dried Fruit); Kuznets; Judge; American Institute of Food Distribution; and Pacific Fruit News.Note: Prices were deflated by the Personal Consumption Expenditure Deflator. PCE = 100 in 1967, 316 in 1988.a Price received at dry yards for No. 1 grade in raw-product equivalents; reflects drying cost.b Dollars per case of 24 No. 2/2 cans, choice.c Cents per pound in 30-pound containers, grade B or better.d Price received by packers for the dried product, cents per pound, extra-choice Blenheim.e 1981-84 average.
Demandfor Apricots 347French, Eryilmaz, and Blackman
Western Journal of Agricultural Economics
sure changes in consumer preferences and shiftsin foreign demand.
Separate demand functions for imports arerequired only if the imported products arestrongly differentiated in the minds of buyers.Lacking consistent time-series data on importprices, we make the reasonable assumptionsthat imports are close substitutes for U.S.products and that prices paid for imports andU.S. prices are highly correlated. With a unitof imports assumed to have the same effect onU.S. f.o.b. processor prices as a unit of U.S.product, separate import demand functions arenot specified.
The quantities of canned and dried importssupplied to the U.S. market are determined bythe price paid for imports (replaced by the U.S.f.o.b. price under the previously explained as-sumption) and a complex set of internationalproduction and trade variables.
Apricots are harvested and processed withina relatively short period, primarily in June andJuly. The marketing year for canned, dried,and frozen apricots runs from 1 June to 31May. Quantities of processed apricots avail-able for sale consist of the current pack, plusstocks carried over from the previous year,plus imports. Because processors have the op-tion of carrying some of the seasonal supplyto the next year, the marketing-year processedproduct prices, movements, and carry-overstocks are jointly determined.
The model to predict the quantities allocat-ed to current-year sales, given the availablesupply, is adapted from a study of the demandfor canned peaches by French and King (FK).Processors are initially and primarily con-cerned with marketing their supplies (pack pluscarry-in) so as to achieve prices that will coverthe previously incurred processing and rawproducts costs, make a positive return on in-vestment, and result in an adequate but notburdensome carry-out at the end of the mar-keting season. Processors also take account ofvariations in current market conditions as re-flected by observed current (marketing-year)movement relative to the total supply. Hence,the allocation relationships involve currentmovement and f.o.b. processor price as en-dogenous variables and total supply, unit pro-cessing and raw product costs, and population(market size) as primary shifters.
In a simultaneous system the choice of anormalized variable for each equation dependson how one views the causal structure. With
relatively few peach canners and probably adominant price leader, FK's model empha-sized price setting. The current market allo-cation was determined by a "price-markupfunction" which expressed the f.o.b. processorprice as a function of unit processing and rawproduct costs and the ratio of movement tothe predetermined supply. With the assump-tion of price-setting behavior, demand wasnormalized on quantity. The model for apri-cots normalizes the demand functions on pricerather than quantity, with the allocation re-lationships normalized on movement. Whileeither normalization yields significant esti-mates of the canned product equation system,the price-dependent formulation yields moreconsistent results for dried apricots which in-clude a large import component.
With the above considerations, the pro-cessed product block consists of the followingstructural relationships (normalized variableleft of colon; exogenous and predeterminedvariables right of semicolon; variable identi-fication in table 4):
F.o.b. demand facing processors:
(1) PPC: DCN, DDN, DFN; ZC (canned prod-uct),
(2) PPD: DCN, DDN, DFN; ZD (dried product),and
(3) PPF: DCN, DDN, DFN; ZF (frozen prod-uct).
Market allocation:
(4)
(5)
(6)
DCN: PPC, ICN; TSCN, CPC, PGC (cannedproduct),DDN: PPD, IDN; TSDN, CPD, PGD (driedproduct), andDFN: PPF; TSFN, CPF, PGF (frozen prod-uct).
Import supply:
(7) ICN: PPC; AC (canned imports), and(8) IDN: PPD; AD (dried imports).
Stocks carried over (SC, SD, SF) are deter-mined by the identities SCt+ = TSC + IC -DC; SDt+1 = TSD + ID - DD; SFt+1 = TSF- DF where exclusion of N indicates totalrather than per capita values.
Raw Product Block
In the fresh apricot market, growers are facedby a competitive demand function derivedfrom consumer and market intermediary de-mands. In the processing market, however, the
348 December 1991
French, Eryilmaz, and Blackman
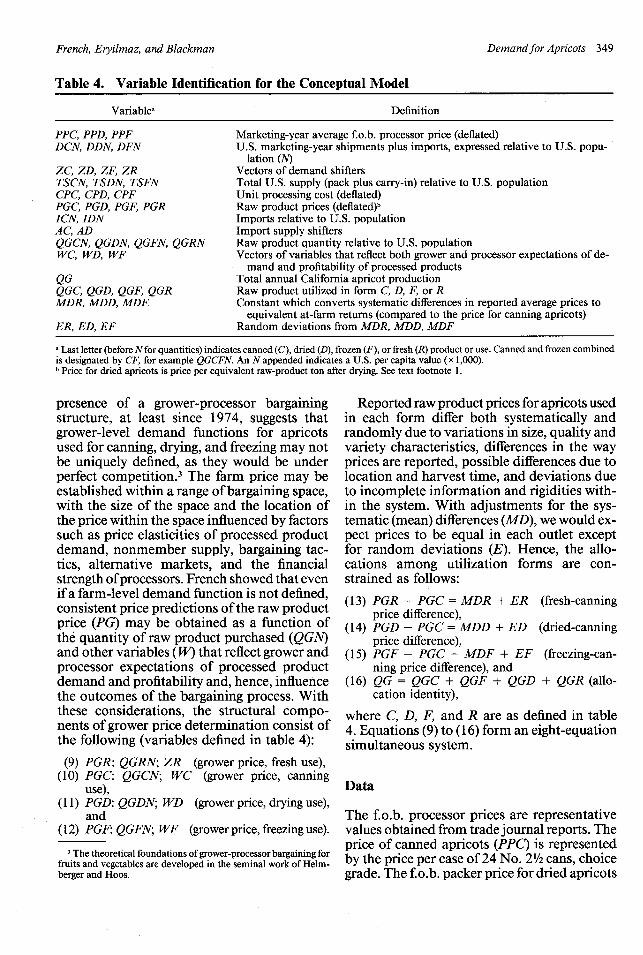
Table 4. Variable Identification for the Conceptual Model
Variable a Definition
PPC, PPD, PPFDCN, DDN, DFN
ZC, Z, Z ZF, ZRTSCN, TSDN, TSFNCPC, CPD, CPFPGC, PGD, PGF, PGRICN, IDNAC, ADQGCN, QGDN, QGFN, QGRNWC, WD, WF
QGQGC, QGD, QGF, QGRMDR, MDD, MDF
ER, ED, EF
Marketing-year average f.o.b. processor price (deflated)U.S. marketing-year shipments plus imports, expressed relative to U.S. popu-
lation (N)Vectors of demand shiftersTotal U.S. supply (pack plus carry-in) relative to U.S. populationUnit processing cost (deflated)Raw product prices (deflated)bImports relative to U.S. populationImport supply shiftersRaw product quantity relative to U.S. populationVectors of variables that reflect both grower and processor expectations of de-
mand and profitability of processed productsTotal annual California apricot productionRaw product utilized in form C, D, F, or RConstant which converts systematic differences in reported average prices to
equivalent at-farm returns (compared to the price for canning apricots)Random deviations from MDR, MDD, MDF
a Last letter (before Nfor quantities) indicates canned (C), dried (D), frozen (F), or fresh (R) product or use. Canned and frozen combinedis designated by CF, for example QGCFN. An N appended indicates a U.S. per capita value (x 1,000).b Price for dried apricots is price per equivalent raw-product ton after drying. See text footnote 1.
presence of a grower-processor bargainingstructure, at least since 1974, suggests thatgrower-level demand functions for apricotsused for canning, drying, and freezing may notbe uniquely defined, as they would be underperfect competition.3 The farm price may beestablished within a range of bargaining space,with the size of the space and the location ofthe price within the space influenced by factorssuch as price elasticities of processed productdemand, nonmember supply, bargaining tac-tics, alternative markets, and the financialstrength of processors. French showed that evenif a farm-level demand function is not defined,consistent price predictions of the raw productprice (PG) may be obtained as a function ofthe quantity of raw product purchased (QGN)and other variables (W) that reflect grower andprocessor expectations of processed productdemand and profitability and, hence, influencethe outcomes of the bargaining process. Withthese considerations, the structural compo-nents of grower price determination consist ofthe following (variables defined in table 4):
(9) PGR: QGRN; ZR (grower price, fresh use),(10) PGC: QGCN; WC (grower price, canning
use),(11) PGD: QGDN; WD (grower price, drying use),
and(12) PGF: QGFN; WF (grower price, freezing use).
3 The theoretical foundations of grower-processor bargaining forfruits and vegetables are developed in the seminal work of Helm-berger and Hoos.
Reported raw product prices for apricots usedin each form differ both systematically andrandomly due to variations in size, quality andvariety characteristics, differences in the wayprices are reported, possible differences due tolocation and harvest time, and deviations dueto incomplete information and rigidities with-in the system. With adjustments for the sys-tematic (mean) differences (MD), we would ex-pect prices to be equal in each outlet exceptfor random deviations (E). Hence, the allo-cations among utilization forms are con-strained as follows:
(13) PGR - PGC = MDR + ER (fresh-canningprice difference),
(14) PGD - PGC = MDD + ED (dried-canningprice difference),
(15) PGF - PGC = MDF + EF (freezing-can-ning price difference), and
(16) QG = QGC + QGF + QGD + QGR (allo-cation identity),
where C, D, F, and R are as defined in table4. Equations (9) to (16) form an eight-equationsimultaneous system.
Data
The f.o.b. processor prices are representativevalues obtained from trade journal reports. Theprice of canned apricots (PPC) is representedby the price per case of 24 No. 21/2 cans, choicegrade. The f.o.b. packer price for dried apricots
Demanzdfor Apricots 349
Western Journal of Agricultural Economics
(PPD) is expressed as cents per pound of extra-choice Blenheim apricots. The frozen price isin cents per pound for bulk apricots, grade Bor better. The grower prices are per ton ofequivalent raw product.
The canned pack and stocks are measuredin equivalent cases of 24 No. 21/2 cans. Frozenand dried apricots are measured in pounds.Raw product quantities are in tons. All pricesand cost data are deflated by the Personal Con-sumption Expenditure deflator, 1967 = 1.Quantity variables are expressed per 1,000 U.S.population.
Import quantities are available only for cal-endar years. The calendar year values are as-signed to the corresponding crop year. For ex-ample, imports for calendar year 1960 areassigned to crop year 1960/61. This results ina slight distortion of the marketing-year driedapricot consumption values (DDN).4
The data set used for estimation covers theperiod 1956-88. The model was initially es-timated with data for 1956-86 (one observa-tion lost in the Processed Product Block andtwo observations lost in the Raw Product Blockdue to lagged variables). Out-of-sample pre-dictions for 1987 and 1988 were all withinthree root-mean-square errors of the regres-sion equations and most (all but two) werewithin two or less. 5 Since there was no clearevidence of structural shifts in the out-of-sam-ple predictions, the model was re-estimatedwith 1956-88 data in order to use all availableinformation.
Empirical Specifications
Before undertaking empirical estimation, theconceptual model requires some modificationto accommodate data limitations and furtherelaboration to identify the variables ZC, ZF,
4 Reported carry-over stocks of dried apricots (SD) include someunknown quantity of imports. Hence, computation of movementof U.S.-produced dried apricots is subject to possible error. Totalconsumption (DD) is accurately computed by DD = QD + SD +ID - SD,+ (where QD is quantity packed), subject to discrepanciesbecause ID refers to calendar year imports whereas SD is measuredat the beginning of the crop year.
5 The prediction deviations might more appropriately be ex-amined in relation to confidence intervals based on standard fore-cast errors. However, the standard forecast error will, in general,not be less than the standard error of the regression. Since theprediction errors fell within the narrower range, standard forecasterrors, which involve complex calculations in a simultaneous equa-tion system, were not computed.
ZD, and ZR which account for shifts in thelevels of product demand over the observationperiod, variables AC and AD which accountfor shifts in the import supply functions, andvariables WC, WD, and WF which influencethe outcomes of grower-processor bargainingwith respect to raw product prices.
Modifications Due to Data Limitations
F.o.b. processor price data for frozen apricotsare available only to 1984 and the consistencyover time of both the frozen product price andquantity data appears to be questionable. Fur-ther, in initial empirical explorations using dataup to 1984, it was found that frozen per capitaquantity (DFN) was not a significant variablein the canned product demand equation [equa-tion (1)] and the estimate of the f.o.b. frozenproduct demand function [equation (3)] hadvery low explanatory power. It appears thatthe price-quantity relationships reflected by theuncertain and incomplete data in the frozenproduct market are dominated by the muchlarger and more predictable canned market.
Because of these problems, the separate fro-zen product demand equation (3) was elimi-nated from the model and the frozen andcanned quantities were aggregated into a singlecanned-frozen component, DCFN. The cannedproduct is converted from cases of 24 No. 2/2cans at 31.25 pounds per case, and frozen apri-cots are expressed as .91 equivalent poundsper pound of packaged frozen apricots (seeJudge 1990, pp. 633, 634). Hence, DCFN =31.25DCN + .91DFN. Frozen apricots, whichare mainly packed in bulk form for institu-tional use, are substitutes for or may competewith the institutional-size pack of canned apri-cots. The latter accounted for about 45% ofthe canned pack (in equivalent units) for theperiod 1980-89. The f.o.b. price for cannedapricots serves as the representative price forthis group. During the period of available data,the correlation between the reported deflatedf.o.b. processor prices for canned and frozenapricots was r = .79.6
Prices received by growers for apricots uti-lized for canning and freezing are nearly iden-
6 An alternative procedure would be to eliminate the frozencomponent entirely-treating it as exogenous. Because the quantityof frozen apricots is small relative to the canned quantity, theoverall statistical results under this specification were not greatlyaltered.
350 December 1991
French, Eryilmaz, and Blackman
tical. The two quantities are expressed as asingle variable, QGCFN = QGCN + QGFN.Conceptual equations (10) and (12) are com-bined (with PGC retained as the representativeprice) and restriction equation (15) is elimi-nated.
Because the growth in imports of cannedapricots has been recent (table 2), there areinsufficient observations to estimate an importsupply function for this component. There-fore, ICN is treated as an exogenous variableand conceptual equation (7) is eliminated.
Processed Product Block Specifications
The most difficult aspect of estimating demandfunctions for processed apricot products is toaccount for and measure shifts in the level ofdemand over the observation period (the un-specified variables ZC, ZF, and ZD in the con-ceptual model). The effects of commonly usedvariables such as per capita income and sup-plies or prices of competing products tend tobe obscured by more fundamental changes inconsumption habits.
An unpublished study of apricot product de-mand by Eryilmaz for the period 1953-74found that there was (a) a downward trend inthe per capita demand function for cannedapricots, (b) an upward trend in the demandfunction for frozen apricots (accounting forsome of the decline in demand for canned apri-cots), (c) little change in the level of per capitademand for dried apricots, and (d) a downwardmovement in per capita fresh market demand.The demand shifts were not significantly re-lated to changes in income. It is possible thatsome of the shifts noted by Eryilmaz, and be-yond, were due to relative price changes forother fruits but such substitution relationshipsas may have existed were obscured by shiftsin general levels of demand for all canned, fro-zen, dried, and fresh fruit-especially in-creased preferences for fresh and decreasedpreferences for traditional canned fruit in thelate 1970s and 1980s. Variables which mightaccount for shifts in the relatively small exportmarkets, other than these trends, were notmeasured.
To account for the possible effects of changesin the unmeasurable or difficult to measuredemand shift variables, we introduced a piece-wise linear-quadratic trend variable of the formalT + a2TC + a 3(TC)2 , where T = year (57,58, ... , 88), TC = D(T-73), and D is zero
prior to 1973, one in 1973 and after.7 Thispermits the trends indicated in the Eryilmazstudy to change at about the time of the ArabOil Embargo and double-digit inflation in1973/74 and at roughly the start of the mar-keting order program for advertising and pro-motion and the beginning of increasing levelsof demand for dried apricots. An increase indried apricot demand is suggested by the si-multaneous increases in total U.S. per capitaconsumption and deflated prices (see tables 1-3). The quadratic form of TC allows the trendslope to change as time moves forward. Al-ternative models with the dummy shifter D setat one in 1972 and 1974 (thus changing thestarting value of TC) yielded estimates withlarger variances.
With these considerations, the demandfunctions facing processors are expressed asthe following linear approximations:
(la) PPC= blo + biDCFN + b12DDN + b13T+ b14TC + bl,(TC)2 + u , and
(2a) PPD = b20 + b2,DCFN + b22DDN + b23T+ b24TC + bl5(TC)2 + u2,
where (la) combines and replaces (1) and (3)in the structural model, DCFN = 31.25DCN+ .91DFN, and the other variables are as de-fined above and in table 4. The effects of vary-ing the trend specifications are investigated inthe empirical estimation.8
A desirable property of the market alloca-tion equations is that in long-run equilibrium(constant prices and costs), the predictedmovement relative to the total supply shouldapproximate the observed multiyear averageof this ratio. For example, on average, about75% of the canned and frozen apricot supplyin year t has been marketed in t, with the bal-ance carried to t + 1. One means of imposingsuch a relationship is to express the price andcost variables as year-to-year differences. Theallocation equations then are as follows [re-placing conceptual equations (4), (5), and (6)]:
(3a) DCFN = b30 + b31TSCFIN + b32APPC
+ b33PGC + b34AIPCE + u3,
7 The computation of TC gives TC = 0 prior to and including1973, TC = 1 in 1974, 2 in 1975, and so on.
8 It is possible that the slope coefficients b,, and b22 may havechanged over the period of study as well as the levels of demand,but that is difficult to test with limited observations. Nonlinearequation forms were also explored, but estimates based on thelinear model provided generally better fits to the data than alter-native log or semilog formulations.
Demandfor Apricots 351
Western Journal of Agricultural Economics
(4a) DDN = b40 + b4lTSDIN + b42 APPD+ b43APGD + b4 4AIPCE + u4,
(5a) TSDIN = TSDN + IDN,(6a) APPC = PPC - PPCL, and(7a) APPD = PPD - PPDL,
where an L suffix indicates a one-year lag. Thevariables not previously defined in table 4 areidentified in table 5. IPCE replaces unknownvalues of unit processing costs, CPC, CPF, andCPD in conceptual equations (4), (5), and (6).The changes in processing and raw productcost indicators (AIPCE, GPGC, and APGD)are predetermined, whereas APPC and APPDare endogenous within this block.
In the dried import supply equation (8), ADis replaced by total apricot production in Tur-key and Australia (the main exporters to theUnited States), expressed relative to U.S. pop-ulation (TAPN). To account for lags in importsupply response, PPD is replaced by PPD2where PPD2 = .5(PPD + PPDL). The supplyequation then becomes
(8a) IDN = b50 + bs1PPD2 + b52TAPN + u,.
Equations (la) to (8a) form an eight-equa-tion simultaneous model of the processedproduct block. Endogenous variables are: PPC,PPD, DCFN, TSDIN, DDN, IDN, APPC, andAPPD. Exogenous and predetermined vari-ables are T, TC, (TC)2, TSCFIN, TSDN,AIPCE, PPCL, PPDL, APGC, APGD, andICN.
Raw Product Block Specifications
To allow for such shifts as may have occurredin the level of fresh market demand, we in-cluded the same time-form shifters as in theprocessed product demands. 9 Thus structuralequation (9) becomes
(9a) PGR = b60 + b6lQGRN + b62T + b63TC+ b64(TC)2 + b65D + u6,
where the variable D, which is zero prior to1973 and one thereafter, is introduced to ac-count for a possible change in price reporting
9 Price found that in the period 1948-64 the per capita con-sumption of fresh apricots was significantly related to the price ofCalifornia freestone peaches. We were unable to measure signifi-cant substitution relationships with other fresh fruits in the presentdata set. This may be due in part to the long-term trends in freshconsumption and the fact that annual observations for other freshfruit extend beyond the months when apricots are available.
beginning in the mid-1970s. 10 The other vari-ables are as defined in table 4 or table 5.
Variables thought to affect the price out-comes of grower-processor bargaining include,in addition to the quantity purchased for pro-cessing, stocks carried over from the previousyear (SCFRN, SDRN), lagged processed prod-uct per capita movement (DCFNU2L,DDNU2L), lagged processed product prices(PPCL, PPDL), and an indicator of processingcost, IPCEL (replacing variables WC, WF, andWD in the structural set). An increase in av-erage per capita movement with the f.o.b. priceconstant or an increase in price with averagemovement constant signals increases in thelevel of demand. The previous-period pricerelative to the index of processing cost (RPCIL,RPDIL) is an indicator of processor profit-ability.
With quantities canned and frozen com-bined for reasons noted previously, the growerraw-product pricing equations [(O1a) replacesstructural equations (10) and (12) and (11 a)replaces structural equation (11)] are as fol-lows:(10a) PGC= b70 + b71QGCFN + b72SCFRN
+ b73RPCIL + b74DCFNU2L + u7,
and(1 la) PGD = b8 + b8QGDN
SDRN+ bSDRN+ 83RPDIL+ b84DDNU2L + b84D + u8.
The variables are more fully defined in tables4 and 5. Imports are excluded from the laggedaverage movement values since, for pricingpurposes, processors and growers are con-cerned mainly with projecting residual de-mand for U.S.-produced apricot products. Thevariable D in (1 la) is to account for an ap-parent shift in price measurement for apricotsused for drying beginning in the 1970s, as not-ed for the fresh price. The method of measur-ing the grower price for apricots for canningappears not to have changed.
The grower price system is completed byadding the quantity and price restrictions [re-
10An examination of the reported price series for apricots showsthat differences between the deflated grower prices for dried andcanned apricots and fresh and canned apricots averaged substan-tially higher from the mid- 1970s onward compared to earlier years.This appears to be due to changes in price reporting and marketingpractices. For example, fresh market prices are reported only formarket-grade fruit, ignoring the large and variable quantities culled.In the case of dried apricots, there may have been some changein drying margin with the more extensive use of commercial dryyards.
352 December 1991
French, Eryilmaz, and Blackman
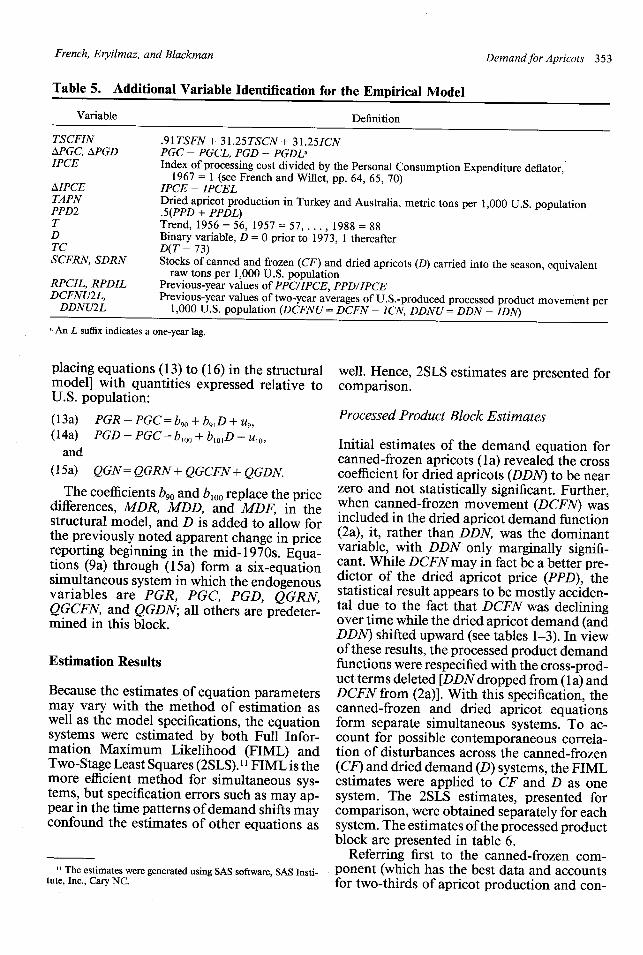
Table 5. Additional Variable Identification for the Empirical Model
Variable Definition
TSCFIN .91TSFN + 31.25TSCN + 31.25ICNAPGC, APGD PGC - PGCL, PGD - PGDLaIPCE Index of processing cost divided by the Personal Consumption Expenditure deflator,
1967 = 1 (see French and Willet, pp. 64, 65, 70)ACE IPCE I - IPCELTAPN Dried apricot production in Turkey and Australia, metric tons per 1,000 U.S. populationPPD2 .5(PPD + PPDL)T Trend, 1956 = 56, 1957 = 57, ... , 1988 = 88D Binary variable, D = 0 prior to 1973, 1 thereafterTC D(T- 73)SCFRN, SDRN Stocks of canned and frozen (CF) and dried apricots (D) carried into the season, equivalent
raw tons per 1,000 U.S. populationRPCIL, RPDIL Previous-year values of PPC/IPCE, PPD/IPCEDCFNU2L, Previous-year values of two-year averages of U.S.-produced processed product movement per
DDNU2L 1,000 U.S. population (DCFNU = DCFN- ICN, DDNU = DDN- IDN)
a An L suffix indicates a one-year lag.
placing equations (13) to (16) in the structuralmodel] with quantities expressed relative toU.S. population:
(13a) PGR - PGC== bo + b9,D + u,,(14a) PGD - PGC= boo + boD + uo0,
and(1 5a) QGN= QGRN + QGCFN + QGDN.
The coefficients b9o and bloo replace the pricedifferences, MDR, MDD, and MDF, in thestructural model, and D is added to allow forthe previously noted apparent change in pricereporting beginning in the mid-1970s. Equa-tions (9a) through (15a) form a six-equationsimultaneous system in which the endogenousvariables are PGR, PGC, PGD, QGRN,QGCFN, and QGDN; all others are predeter-mined in this block.
Estimation Results
Because the estimates of equation parametersmay vary with the method of estimation aswell as the model specifications, the equationsystems were estimated by both Full Infor-mation Maximum Likelihood (FIML) andTwo-Stage Least Squares (2SLS). 1FIML is themore efficient method for simultaneous sys-tems, but specification errors such as may ap-pear in the time patterns of demand shifts mayconfound the estimates of other equations as
" The estimates were generated using SAS software, SAS Insti-tute, Inc., Cary NC.
well. Hence, 2SLS estimates are presented forcomparison.
Processed Product Block Estimates
Initial estimates of the demand equation forcanned-frozen apricots (la) revealed the crosscoefficient for dried apricots (DDN) to be nearzero and not statistically significant. Further,when canned-frozen movement (DCFN) wasincluded in the dried apricot demand function(2a), it, rather than DDN, was the dominantvariable, with DDN only marginally signifi-cant. While DCFN may in fact be a better pre-dictor of the dried apricot price (PPD), thestatistical result appears to be mostly acciden-tal due to the fact that DCFN was decliningover time while the dried apricot demand (andDDN) shifted upward (see tables 1-3). In viewof these results, the processed product demandfunctions were respecified with the cross-prod-uct terms deleted [DDN dropped from (la) andDCFN from (2a)]. With this specification, thecanned-frozen and dried apricot equationsform separate simultaneous systems. To ac-count for possible contemporaneous correla-tion of disturbances across the canned-frozen(CF) and dried demand (D) systems, the FIMLestimates were applied to CF and D as onesystem. The 2SLS estimates, presented forcomparison, were obtained separately for eachsystem. The estimates of the processed productblock are presented in table 6.
Referring first to the canned-frozen com-ponent (which has the best data and accountsfor two-thirds of apricot production and con-
Demandfor Apricots 353
Western Journal of Agricultural Economics
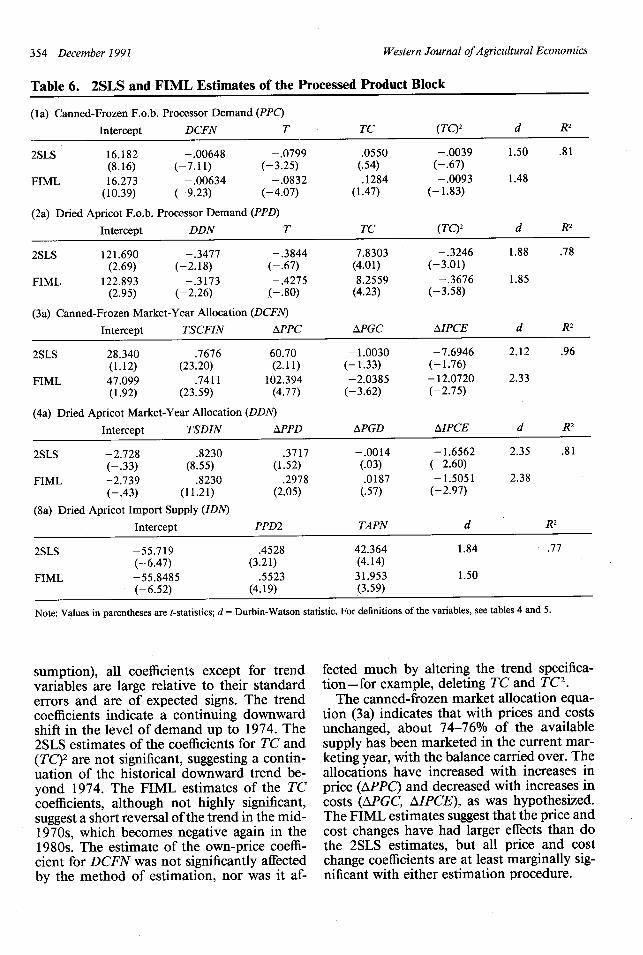
Table 6. 2SLS and FIML Estimates of the Processed Product Block
(la) Canned-Frozen F.o.b. Processor Demand (PPC)
Intercept DCFN T TC (TQ2 d R2
2SLS 16.182 -.00648 -. 0799 .0550 -. 0039 1.50 .81(8.16) (-7.11) (-3.25) (.54) (-.67)
FIML 16.273 -.00634 -.0832 .1284 -.0093 1.48(10.39) (-9.23) (-4.07) (1.47) (-1.83)
(2a) Dried Apricot F.o.b. Processor Demand (PPD)
Intercept DDN T TC (TC)2 d R2
2SLS 121.690 -. 3477 -.3844 7.8303 -.3246 1.88 .78(2.69) (-2.18) (-.67) (4.01) (-3.01)
FIML 122.893 -.3173 -. 4275 8.2559 -.3676 1.85(2.95) (-2.26) (-.80) (4.23) (-3.58)
(3a) Canned-Frozen Market-Year Allocation (DCFN)
Intercept TSCFIN APPC APGC AIPCE d R2
2SLS 28.340 .7676 60.70 -1.0030 -7.6946 2.12 .96(1.12) (23.20) (2.11) (-1.33) (-1.76)
FIML 47.099 .7411 102.394 -2.0385 -12.0720 2.33(1.92) (23.59) (4.77) (-3.62) (-2.75)
(4a) Dried Apricot Market-Year Allocation (DDN)
Intercept TSDIN APPD APGD AIPCE d R2
2SLS -2.728 .8230 .3717 -.0014 -1.6562 2.35 .81(-.33) (8.55) (1.52) (.03) (-2.60)
FIML -2.739 .8230 .2978 .0187 -1.5051 2.38(-.43) (11.21) (2.05) (.57) (-2.97)
(8a) Dried Apricot Import Supply (IDN)
Intercept PPD2 TAPN d R2
2SLS -55.719 .4528 42.364 1.84 .77(-6.47) (3.21) (4.14)
FIML -55.8485 .5523 31.953 1.50(-6.52) (4.19) (3.59)
Note: Values in parentheses are t-statistics; d = Durbin-Watson statistic. For definitions of the variables, see tables 4 and 5.
sumption), all coefficients except for trendvariables are large relative to their standarderrors and are of expected signs. The trendcoefficients indicate a continuing downwardshift in the level of demand up to 1974. The2SLS estimates of the coefficients for TC and(TC)2 are not significant, suggesting a contin-uation of the historical downward trend be-yond 1974. The FIML estimates of the TCcoefficients, although not highly significant,suggest a short reversal of the trend in the mid-1970s, which becomes negative again in the1980s. The estimate of the own-price coeffi-cient for DCFN was not significantly affectedby the method of estimation, nor was it af-
fected much by altering the trend specifica-tion-for example, deleting TC and TC2.
The canned-frozen market allocation equa-tion (3a) indicates that with prices and costsunchanged, about 74-76% of the availablesupply has been marketed in the current mar-keting year, with the balance carried over. Theallocations have increased with increases inprice (APPC) and decreased with increases incosts (APGC, AIPCE), as was hypothesized.The FIML estimates suggest that the price andcost changes have had larger effects than dothe 2SLS estimates, but all price and costchange coefficients are at least marginally sig-nificant with either estimation procedure.
354 December 1991
French, Eryilmaz, and Blackman
Most of the parameter estimates of the driedapricot component are also large relative totheir standard errors and have the expectedsigns, with the exceptions of the coefficientsfor T in (2a) and XPGD in (4a) which do notdiffer significantly from zero. The coefficientsof the trend variables suggest there was littlechange in the level of demand up to 1974, asindicated in the Eryilmaz study. Demand thenincreased rapidly, but at a decreasing rate, lev-eling off and slightly decreasing after 1984. Theestimates of the demand slope for dried apri-cots are similar under 2SLS and FIML.
Note finally that the model results indicatethat the increase in dried apricot imports hasbeen significantly associated with increases inthe U.S. price and with the growth of apricotproduction in Australia and Turkey (primarilyTurkey). The FIML and 2SLS estimates aresimilar, but with FIML giving relatively moreweight to price changes and relatively less toforeign production changes.
Raw Product Block Estimates
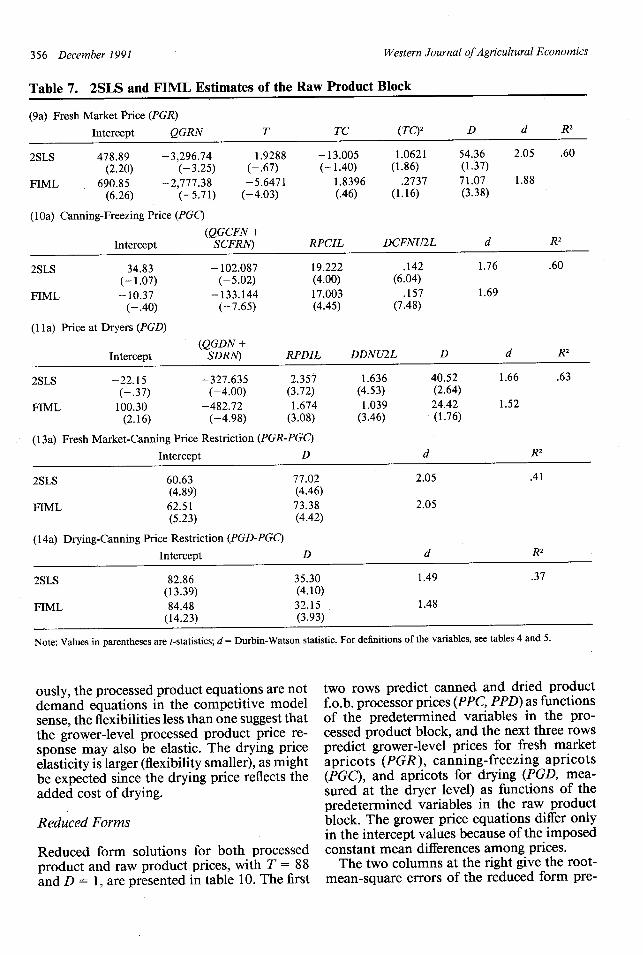
Estimates of the grower-level fresh market de-mand equation and the processed productgrower and dryer-level pricing equations aregiven in table 7. Although the equations leavesubstantial amounts of price variation unex-plained (as indicated by the R2 values), all co-efficients except for the fresh market trendvariables are large relative to their standarderrors and are of the theoretically expectedsigns.
Note that the coefficients for pack and carry-in stocks in equations (lOa) and (1 la), bothexpressed in raw-product units or raw-productequivalents, are constrained to be equal. Totest for possible differences in behavioral re-sponse to pack and carry-in stock levels, themodel was first estimated with the pack andstock coefficients unconstrained. The 2SLS es-timates of the coefficients for carry-in stocks(SCFRN, SDRN) were larger in absolute valuethan the corresponding coefficients for the packvariables (QGCFN, QGDN). However, theFIML estimates of the carry-in stock coeffi-cients were less than the pack coefficients. Inview of these inconsistencies, the hypothesisof different responses to pack and inventorylevels was rejected and pack and stocks werecombined into single seasonal supply vari-ables, as indicated in table 7. The FIML es-timates of the price-quantity coefficients, while
similar in general magnitudes to the 2SLS es-timates, are smaller in absolute value in thefresh market demand equation but larger inequations (lOa) and (1 la). The magnitude andsignificance of the time trend in the fresh mar-ket equation also vary with the estimationmethod. The FIML estimates are more effi-cient if the time shift specifications are correct.
Interpretation and Application
Potential users of the findings as presented intables 6 and 7 may encounter difficulties be-cause the specific right-side data needed forthe conditional price predictions may not bereadily available and, for more general fore-casting purposes, the price and quantity pre-dictions involve simultaneous solution of theequation systems. It is possible, however, tomake some generalizations from these rela-tionships which may be useful for planningpurposes and to grower-processor bargainingagents.
Flexibilities and Elasticities
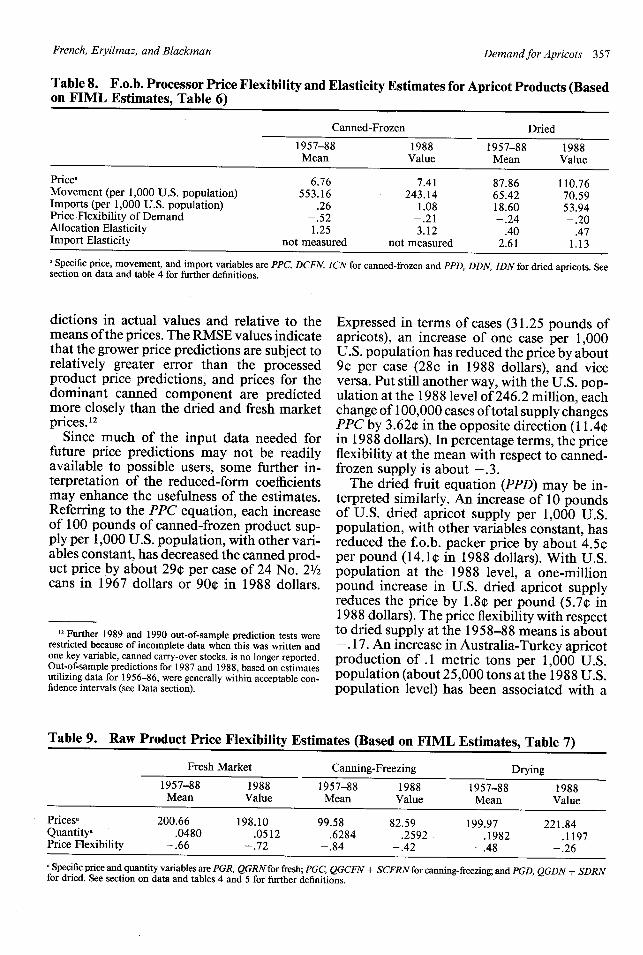
An important simplification is to express theprice-quantity relationships as approximatepercentage relationships. Table 8 presents priceflexibilities and allocation and import supplyelasticities for the Processed Product Block atmean and at 1988 values of prices and quan-tities. The price flexibilities are roughly con-sistent with the 1950-74 estimates by Eryil-maz of about -. 43 for canned and -. 24 to-. 28 for dried apricots. The flexibilities belowone suggest that processors are faced with elas-tic demands. The allocation elasticity may beinterpreted as a short-run market supply elas-ticity where the total available supply is fixed.The allocation response is limited since mar-ketings cannot exceed the seasonal supply.
Table 9 presents the price flexibilities at themeans and for 1988 values of prices and quan-tities for the fresh market demand and the pro-cessed product price predicting equations basedon the FIML estimates in table 7. The meanand 1988 fresh market flexibilities are similar.They suggest that the demand facing Californiafresh shippers is slightly elastic. This findingis consistent with findings of an early (1967)study by Price in which the fresh demandequation was estimated with quantity as thenormalized variable. While, as noted previ-
Demandfor Apricots 355
Western Journal of Agricultural Economics
Table 7. 2SLS and FIML Estimates of the Raw Product Block
(9a) Fresh Market Price (PGR)
Intercept QGRN T TC (TC)2 D d R2
2SLS 478.89 -3,296.74 -1.9288 -13.005 1.0621 54.36 2.05 .60(2.20) (-3.25) (-.67) (-1.40) (1.86) (1.37)
FIML 690.85 -2,777.38 -5.6471 1.8396 .2737 71.07 1.88(6.26) (-5.71) (-4.03) (.46) (1.16) (3.38)
(10a) Canning-Freezing Price (PGC)
(QGCFN +Intercept SCFRN) RPCIL DCFNU2L d R2
2SLS -34.83 -102.087 19.222 .142 1.76 .60(-1.07) (-5.02) (4.00) (6.04)
FIML -10.37 -133.144 17.003 .157 1.69(-.40) (-7.65) (4.45) (7.48)
(1 la) Price at Dryers (PGD)
(QGDN +Intercept SDRN) RPDIL DDNU2L D d R2
2SLS -22.15 -327.635 2.357 1.636 40.52 1.66 .63(-.37) (-4.00) (3.72) (4.53) (2.64)
FIML 100.30 -482.72 1.674 1.039 24.42 1.52(2.16) (-4.98) (3.08) (3.46) (1.76)
(13a) Fresh Market-Canning Price Restriction (PGR-PGC)
Intercept D d R2
2SLS 60.63 77.02 2.05 .41(4.89) (4.46)
FIML 62.51 73.38 2.05(5.23) (4.42)
(14a) Drying-Canning Price Restriction (PGD-PGC)
Intercept D d R2
2SLS 82.86 35.30 1.49 .37(13.39) (4.10)
FIML 84.48 32.15 1.48(14.23) (3.93)
Note: Values in parentheses are t-statistics; d = Durbin-Watson statistic. For definitions of the variables, see tables 4 and 5.
ously, the processed product equations are notdemand equations in the competitive modelsense, the flexibilities less than one suggest thatthe grower-level processed product price re-sponse may also be elastic. The drying priceelasticity is larger (flexibility smaller), as mightbe expected since the drying price reflects theadded cost of drying.
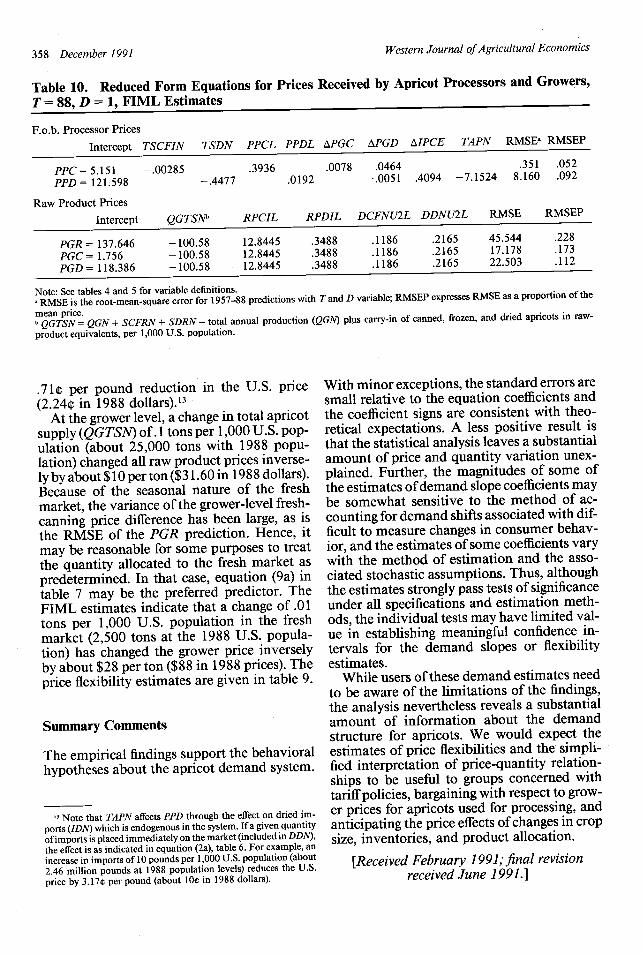
Reduced Forms
Reduced form solutions for both processedproduct and raw product prices, with T = 88and D = 1, are presented in table 10. The first
two rows predict canned and dried productf.o.b. processor prices (PPC, PPD) as functionsof the predetermined variables in the pro-cessed product block, and the next three rowspredict grower-level prices for fresh marketapricots (PGR), canning-freezing apricots(PGC), and apricots for drying (PGD, mea-sured at the dryer level) as functions of thepredetermined variables in the raw productblock. The grower price equations differ onlyin the intercept values because of the imposedconstant mean differences among prices.
The two columns at the right give the root-mean-square errors of the reduced form pre-
356 December 1991
French, Eryilmaz, and Blackman
Table 8. F.o.b. Processor Price Flexibility and Elasticity Estimates for Apricot Products (Basedon FIML Estimates, Table 6)
Canned-Frozen Dried
1957-88 1988 1957-88 1988Mean Value Mean Value
Pricea 6.76 7.41 87.86 110.76Movement (per 1,000 U.S. population) 553.16 243.14 65.42 70.59Imports (per 1,000 U.S. population) .26 1.08 18.60 53.94Price Flexibility of Demand -. 52 -. 21 -.24 -.20Allocation Elasticity 1.25 3.12 .40 .47Import Elasticity not measured not measured 2.61 1.13
a Specific price, movement, and import variables are PPC, DCFN, ICN for canned-frozen and PPD, DDN, IDN for dried apricots. Seesection on data and table 4 for further definitions.
dictions in actual values and relative to themeans of the prices. The RMSE values indicatethat the grower price predictions are subject torelatively greater error than the processedproduct price predictions, and prices for thedominant canned component are predictedmore closely than the dried and fresh marketprices. 12
Since much of the input data needed forfuture price predictions may not be readilyavailable to possible users, some further in-terpretation of the reduced-form coefficientsmay enhance the usefulness of the estimates.Referring to the PPC equation, each increaseof 100 pounds of canned-frozen product sup-ply per 1,000 U.S. population, with other vari-ables constant, has decreased the canned prod-uct price by about 29¢ per case of 24 No. 2/2cans in 1967 dollars or 90¢ in 1988 dollars.
12 Further 1989 and 1990 out-of-sample prediction tests wererestricted because of incomplete data when this was written andone key variable, canned carry-over stocks, is no longer reported.Out-of-sample predictions for 1987 and 1988, based on estimatesutilizing data for 1956-86, were generally within acceptable con-fidence intervals (see Data section).
Expressed in terms of cases (31.25 pounds ofapricots), an increase of one case per 1,000U.S. population has reduced the price by about9¢ per case (28¢ in 1988 dollars), and viceversa. Put still another way, with the U.S. pop-ulation at the 1988 level of 246.2 million, eachchange of 100,000 cases of total supply changesPPC by 3.62¢ in the opposite direction (11.4¢in 1988 dollars). In percentage terms, the priceflexibility at the mean with respect to canned-frozen supply is about -. 3.
The dried fruit equation (PPD) may be in-terpreted similarly. An increase of 10 poundsof U.S. dried apricot supply per 1,000 U.S.population, with other variables constant, hasreduced the f.o.b. packer price by about 4.5¢per pound (14.1 in 1988 dollars). With U.S.population at the 1988 level, a one-millionpound increase in U.S. dried apricot supplyreduces the price by 1.8¢ per pound (5.7¢ in1988 dollars). The price flexibility with respectto dried supply at the 1958-88 means is about-. 17. An increase in Australia-Turkey apricotproduction of .1 metric tons per 1,000 U.S.population (about 25,000 tons at the 1988 U.S.population level) has been associated with a
Table 9. Raw Product Price Flexibility Estimates (Based on FIML Estimates, Table 7)
Fresh Market Canning-Freezing Drying
1957-88 1988 1957-88 1988 1957-88 1988Mean Value Mean Value Mean Value
Pricesa 200.66 198.10 99.58 82.59 199.97 221.84Quantitya .0480 .0512 .6284 .2592 .1982 .1197Price Flexibility -. 66 -. 72 -. 84 -. 42 -. 48 -. 26a Specific price and quantity variables are PGR, QGRNfor fresh; PGC, QGCFN + SCFRN for canning-freezing; and PGD, QGDN + SDRNfor dried. See section on data and tables 4 and 5 for further definitions.
Demandfor Apricots 357
Western Journal of Agricultural Economics
Table 10. Reduced Form Equations for Prices Received by Apricot Processors and Growers,
T = 88, D = 1, FIML Estimates
F.o.b. Processor Prices
Intercept TSCFIN TSDN PPCL PPDL APGC APGD AIPCE TAPN RMSEa RMSEP
PPC = 5.151 -. 00285 .3936 .0078 .0464 .351 .052
PPD = 121598 -. 4477 .0192 -. 0051 .4094 -7.1524 8.160 .092
Raw Product Prices
Intercept QGTSNb RPCIL RPDIL DCFNU2L DDNU2L RMSE RMSEP
PGR= 137.646 -100.58 12.8445 .3488 .1186 .2165 45.544 .228
PGC= 1.756 -100.58 12.8445 .3488 .1186 .2165 17.178 .173
PGD= 118.386 -100.58 12.8445 .3488 .1186 .2165 22.503 .112
Note: See tables 4 and 5 for variable definitions.RMSE is the root-mean-square error for 1957-88 predictions with T and D variable; RMSEP expresses RMSE as a proportion of the
mean price.b QGTSN= QGN + SCFRN + SDRN = total annual production (QGN) plus carry-in of canned, frozen, and dried apricots in raw-
product equivalents, per 1,000 U.S. population.
.71¢ per pound reduction in the U.S. price(2.24¢ in 1988 dollars).13
At the grower level, a change in total apricotsupply (QGTSN) of. 1 tons per 1,000 U.S. pop-ulation (about 25,000 tons with 1988 popu-lation) changed all raw product prices inverse-ly by about $ 10 per ton ($31.60 in 1988 dollars).Because of the seasonal nature of the freshmarket, the variance of the grower-level fresh-canning price difference has been large, as isthe RMSE of the PGR prediction. Hence, itmay be reasonable for some purposes to treatthe quantity allocated to the fresh market aspredetermined. In that case, equation (9a) intable 7 may be the preferred predictor. TheFIML estimates indicate that a change of .01tons per 1,000 U.S. population in the freshmarket (2,500 tons at the 1988 U.S. popula-tion) has changed the grower price inverselyby about $28 per ton ($88 in 1988 prices). Theprice flexibility estimates are given in table 9.
Summary Comments
The empirical findings support the behavioralhypotheses about the apricot demand system.
13 Note that TAPN affects PPD through the effect on dried im-ports (IDN) which is endogenous in the system. If a given quantityof imports is placed immediately on the market (included in DDN),the effect is as indicated in equation (2a), table 6. For example, anincrease in imports of 10 pounds per 1,000 U.S. population (about2.46 million pounds at 1988 population levels) reduces the U.S.price by 3.17¢ per pound (about 10¢ in 1988 dollars).
With minor exceptions, the standard errors aresmall relative to the equation coefficients andthe coefficient signs are consistent with theo-retical expectations. A less positive result isthat the statistical analysis leaves a substantialamount of price and quantity variation unex-plained. Further, the magnitudes of some ofthe estimates of demand slope coefficients maybe somewhat sensitive to the method of ac-counting for demand shifts associated with dif-ficult to measure changes in consumer behav-ior, and the estimates of some coefficients varywith the method of estimation and the asso-ciated stochastic assumptions. Thus, althoughthe estimates strongly pass tests of significanceunder all specifications and estimation meth-ods, the individual tests may have limited val-ue in establishing meaningful confidence in-tervals for the demand slopes or flexibilityestimates.
While users of these demand estimates needto be aware of the limitations of the findings,the analysis nevertheless reveals a substantialamount of information about the demandstructure for apricots. We would expect theestimates of price flexibilities and the simpli-fied interpretation of price-quantity relation-ships to be useful to groups concerned withtariff policies, bargaining with respect to grow-er prices for apricots used for processing, andanticipating the price effects of changes in cropsize, inventories, and product allocation.
[Received February 1991; final revisionreceived June 1991.]
358 December 1991
French, Eryilmaz, and Blackman
References
American Institute of Food Distribution. The Food In-stitute Report. Fair Lawn NJ. Weekly, various issues.
Apricot Producers of California. Annual Calendar andStatistical Report. Modesto CA, 1990.
Eryilmaz, A. "An Econometric Analysis of the CaliforniaApricot Industry." Ph.D. Dissertation, Departmentof Agricultural Economics, University of California,Davis, 1978.
Federal-State Market News Service. Marketing Califor-nia Apricots. Sacramento CA: California Departmentof Food and Agriculture. Various annual issues.
. Marketing California Dried Fruit. SacramentoCA: California Department of Food and Agriculture.Various annual issues.
French, B. C. "Farm Price Estimation When There isBargaining: The Case of Processed Fruit and Vege-tables." West. J. Agr. Econ. 12(1987):17-26.
French, B. C., and G. A. King. "Demand and Price-Mark-up Functions for Canned Cling Peaches and FruitCocktail." West. J. Agr. Econ. 11(1986):8-18.
French, B. C., and L. S. Willet. An Econometric Model
of the U.S. Asparagus Industry. University of Cali-fornia, Giannini Foundation Res. Rep. No. 340, 1989.
Helmberger, P. G., and S. Hoos. Cooperative Bargainingin Agriculture: Grower-Processor Markets for Fruitsand Vegetables. Department of Agricultural and Re-source Economics, University of California, Berkeley,1965.
Judge, J., Inc. Directory of the Canning, Freezing, andPreserving Industry. Westminster MD. Various an-nual issues.
Kuznets, G. M. Pacific Coast Canned Fruits F.O.B. PriceRelationships, 1980-81. University of California,Berkeley, Giannini Foundation, 1981.
Pacific Fruit News. Copperopolis CA: Frank Crawford,editor and publisher. Weekly, various issues.
Price, D. W. The Marketing Orderfor Washington Apri-cots. Washington Agricultural Experiment Station,Tech. Bull. 56, 1967.
U.S. Agricultural Statistics Board. Noncitrus Fruits andNuts. Washington DC: U.S. Department of Agricul-ture, National Agricultural Statistics Service. Variousannual summaries.
Demand for Apricots 359